Article

Carbon Sequestration in the Urban Areas of Seoul with Climate Change: Implication for Open Innovation in Environmental Industry

Department of Environmental Sciences & Engineering, College of Engineering, Ewha Womans University, 03760 Seoul, Korea
*
Author to whom correspondence should be addressed.
J. Open Innov. Technol. Mark. Complex. 2018, 4(4), 48; https://doi.org/10.3390/joitmc4040048
Submission received: 15 June 2018 / Revised: 27 August 2018 / Accepted: 27 August 2018 / Published: 8 October 2018

Abstract

:
This study estimates the impact of potential climate change, and human interference (anthropogenic deforestation), on temperate forest carbon pool change in the capital area of South Korea, using a dynamic global vegetation model (DGVM). Additionally, the characteristics of forest carbon pool change were simulated based on a biogeochemical module. The change of atmospheric carbon dioxide (CO2) concentration is deeply related to the change of the forest carbon pool, which is estimated with the measures of Net Primary Productivity (NPP), and Soil Carbon Storage (SCS). NPP and SCS were estimated at 2.02–7.43 tC ha−1 year−1 and 34.55–84.81 tC ha−1, respectively, during the period 1971–2000. SCS showed a significant decreasing tendency under the conditions of increasing air temperature, and precipitation, in the near future (2021–2050), and far future (2071–2100), which were simulated with future-climate scenario data without any human interference. Besides, it is estimated that the temporal change in NPP indicates only a small decrease, which is little influenced by potential climate change. In the case of potential climate change plus human interference, the decrease rate of NPP and SCS were simulated at 17–33% and 21–46%, respectively, during 2000–2100. Furthermore, the effect of potential human interference contributes to 83–93% and 61–54% of the decrease rate of NPP and SCS, respectively. The decline in the forest carbon pool simulated in this study can play a positive role in increasing atmospheric carbon dioxide. Consequently, the effect of potential human interference can further accelerate the decline of the temperate forest carbon pool. For the effective reduction of carbon dioxide emissions in urbanizing areas, it would be more effective to control human interference. Consequently, this study suggests that a rate of reforestation corresponding to the deforestation rate should be at least maintained, with long term monitoring and modeling-related studies, against climate change problems.

1. Introduction

The emission rate of greenhouse gases (GHG) by human interference has been increasing since the industrial revolution. In addition, it is clear that global warming is a key environmental concern, due to the strong possibility that increasing global surface air temperatures, can be attributed to the increase in greenhouse gases in the latter half of the twentieth century. The increasing frequency, magnitude, and duration, of droughts highlight the need for rapid assessment and monitoring [1] Even though the global surface air temperature increased by 0.74 °C during the past 100 years, global warming has accelerated up to 1.3 °C per 100 years for the most recent 50 years [2].
A potential adverse effect of global warming on ecosystems, is the possibility of approximately 10–40% of animals and plants facing extinction once the global surface air temperature has increased by approximately 1.5–2.5 °C, and also due to human interference [2,3,4,5,6]. Carbon dioxide (CO2) is one of the main greenhouse gases, contributing to approximately 50% of climate change. Generally there are two kinds of strategies in the reduction of CO2; one is carbon source control, and the other is enhancement of carbon sequestration in forest areas. Most reduction methods focus on carbon source control, which occurs in energy use and industrial processes. However, there is a growing interest in the enhancement of carbon sequestration in forest areas, since forest areas served as useful model for carbon change. Carbon assimilation in forest areas plays an important role, not only in carbon sequestration, but also landscape, recreation space, and terrestrial ecosystem conservation [7]. The role of the city in environmental management is increasingly important for the sustainability of appropriate energy policies related to carbon dioxide and energy use [8].
In this research, we propose that under the conditions of potential climate change, and anthropogenic deforestation, the variation of temperate forest carbon pools should be increasing in the capital areas of South Korea, with long-term simulation of Soil Carbon Storage (SCS) and Net Primary Productivity (NPP) using a dynamic global vegetation model. Also, this research suggests a strategy for effective enhancement of carbon sequestration in forest areas where human interference is expected.

2. Materials and Methods
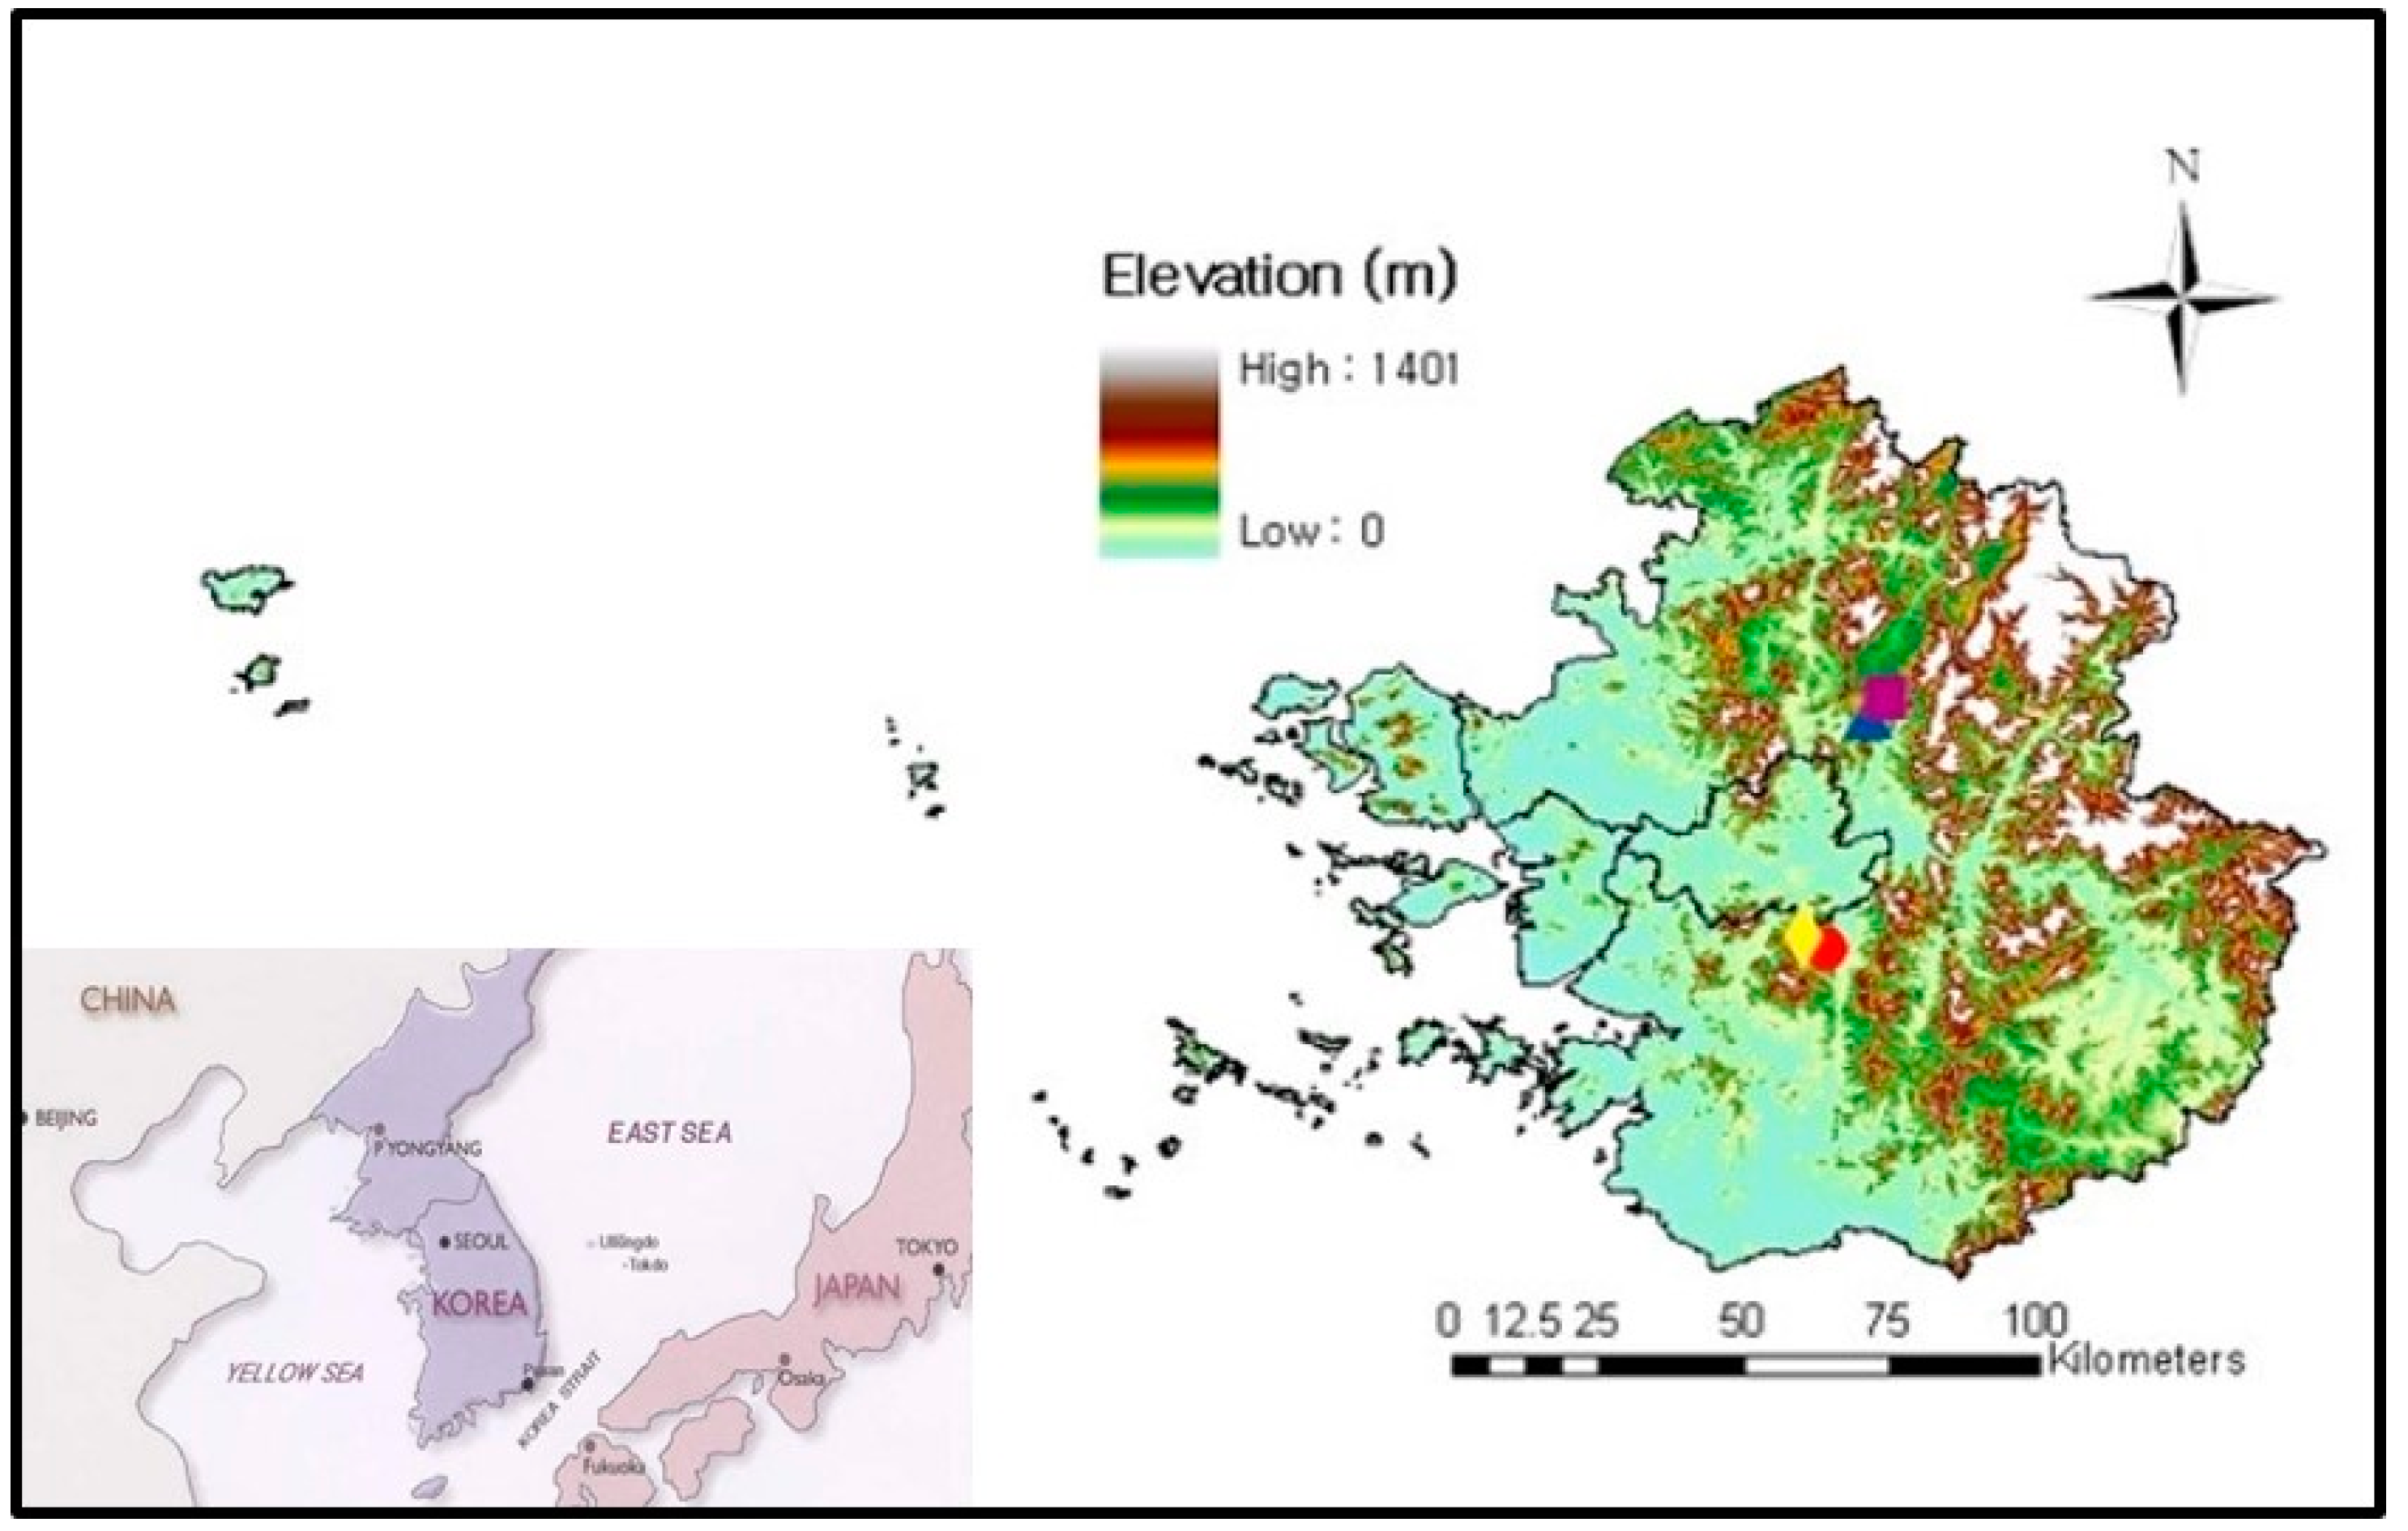
2.1. Study Site

This study was carried out in temperate forest areas in the capital area of South Korea, located in the middle of the Korean peninsula, and consists of Seoul Metropolitan City, Incheon City, and Gyeonggi Province, as seen in Figure 1. The study area is covered with 565,024 ha of forest (about 50% of the total area), which ranges within the latitudinal range of 36°89′–38°29′, and longitudinal range of 124°59′–127°85′. This area is the most urbanized area, with a population of approximately 23 million (about half of the South Korean national population), in which human interference is strongly expected. Within this study area, annual air temperature varies from 11 °C to 13 °C, and annual mean precipitation is approximately 1100 mm.
In this study, the 4 study points shown in Figure 1A–D were selected to analyze locational distinction, and to compare our simulation data to other study data due to the large process of urbanization. Point A (37°45′7″ N, 127°9′11″ E) is the KoFlux DK-site, where a permanent flux tower was installed in the Kwangneung Natural Forest [9,10] point B (37°47′1″ N, 127°10′37″ E) is adjacent to A, and is located at the Korea Practice Research Center; point C (37°23′45″ N, 127°5′1″ E) is on Kumto Mountain, inside of the recently constructed Pangyo housing development area; and point D (37°25′2″ N, 127°3′22″ E) is adjacent to point C, located on Chunggye Mountain.

2.2. Dynamic Global Vegetation Model (DGVM)

The MAPSS-CENTURY (MC1) model used in this study is a new dynamic global vegetation model, which was created to estimate the impacts of global climate change on forest ecosystem structures, and functions at a wide spatial range from landscape (50 m) to global scales. In addition, the MC1 model can simulate the cycling of carbon, nitrogen, water, and the change of vegetation, under the conditions of climate change, using a combination of the biogeological MAPSS model and the biogeochemical CENTURY model [11,12].
The main functions of the MC1 model are to: (1) predict life-forms (e.g., coniferous, deciduous, and evergreen trees; grass species) and their biomass in different vegetation classes, using a climatologic rule base; (2) simulate the carbon, nutrient, and water, dynamics in aboveground and belowground ecosystems, through plant production, soil organic matter decomposition, and nutrient cycling.

2.3. Data Handling

The spatial resolution of the simulation used in this study was 0.005° (approximately 500 m), and all the input data were raster datasets of 49,046 pixels, which were divided: the historical period (1971–2000), the near future (2021–2050), and the far future (2071–2100). Historical climate data was observed by the Korea Meteorological Administration (KMA), and the future predicted climate data originated from the Korea National Institute of Meteorological Research, with the A1B scenario presented by IPCC.
Three categories of input data were used in the MC1 model: (1) geographic data, such as elevation; (2) soil data, such as soil bulk density, soil texture, and rock fraction; and (3) climatic data, such as monthly mean air temperature, monthly mean cumulative precipitation, humidity, wind speed, and solar radiation.
The data for air temperature and precipitation were calibrated at the sea level, which considered the effect of the elevation of the measuring point, and the height of measuring equipment. The Inverse distance squared weighting (IDSW) method was applied to all the calibrated climatic data, except for air temperature [13]. The calibrated air temperature data were interpolated into a spherical semi-variogram kriging as a spatial statistical method [14]. The other data were rescaled to fit 0.005° spatial resolution. All input data were prepared by Arc/Info 9.3 (Geographic Information System by ESRI).
The regional distribution of monthly mean air temperature, and monthly mean cumulative precipitation, in the historical period (1971–2000), near future (2021–2050), and far future (2071–2100), respectively, are shown in Figure 2 and Figure 3. It was simulated that the mean air temperature and precipitation, in the study area, would increase by 1.4 °C and 10 mm in near future, and 4 °C and 24 mm in far future. This was based on the A1B scenario presented by IPCC and is shown in Figure 4.
The NPP and SCS results in this study were extracted by current forest area, after simulation with potential vegetation distribution and carbon dynamics, which were based on the climatic change and soil conditions. However, forest areas in the capital area of South Korea have been reducing by 1940 ha (average from 2003–2009) per year because of changes in forest land use, to fields, ranches, housing, factories, roads, and golf courses (Forestry Statistical Yearbook 2004–2010). Moreover, the damaged area due to forest fires was about 16.4 ha (average from 2003–2009) per year. In this study, the change in NPP and SCS due to human interference was estimated with the decrease rate of forest areas, and the simulated NPP and SCS results by the MC1 model, under the conditions of climate change.

3. Results and Discussion

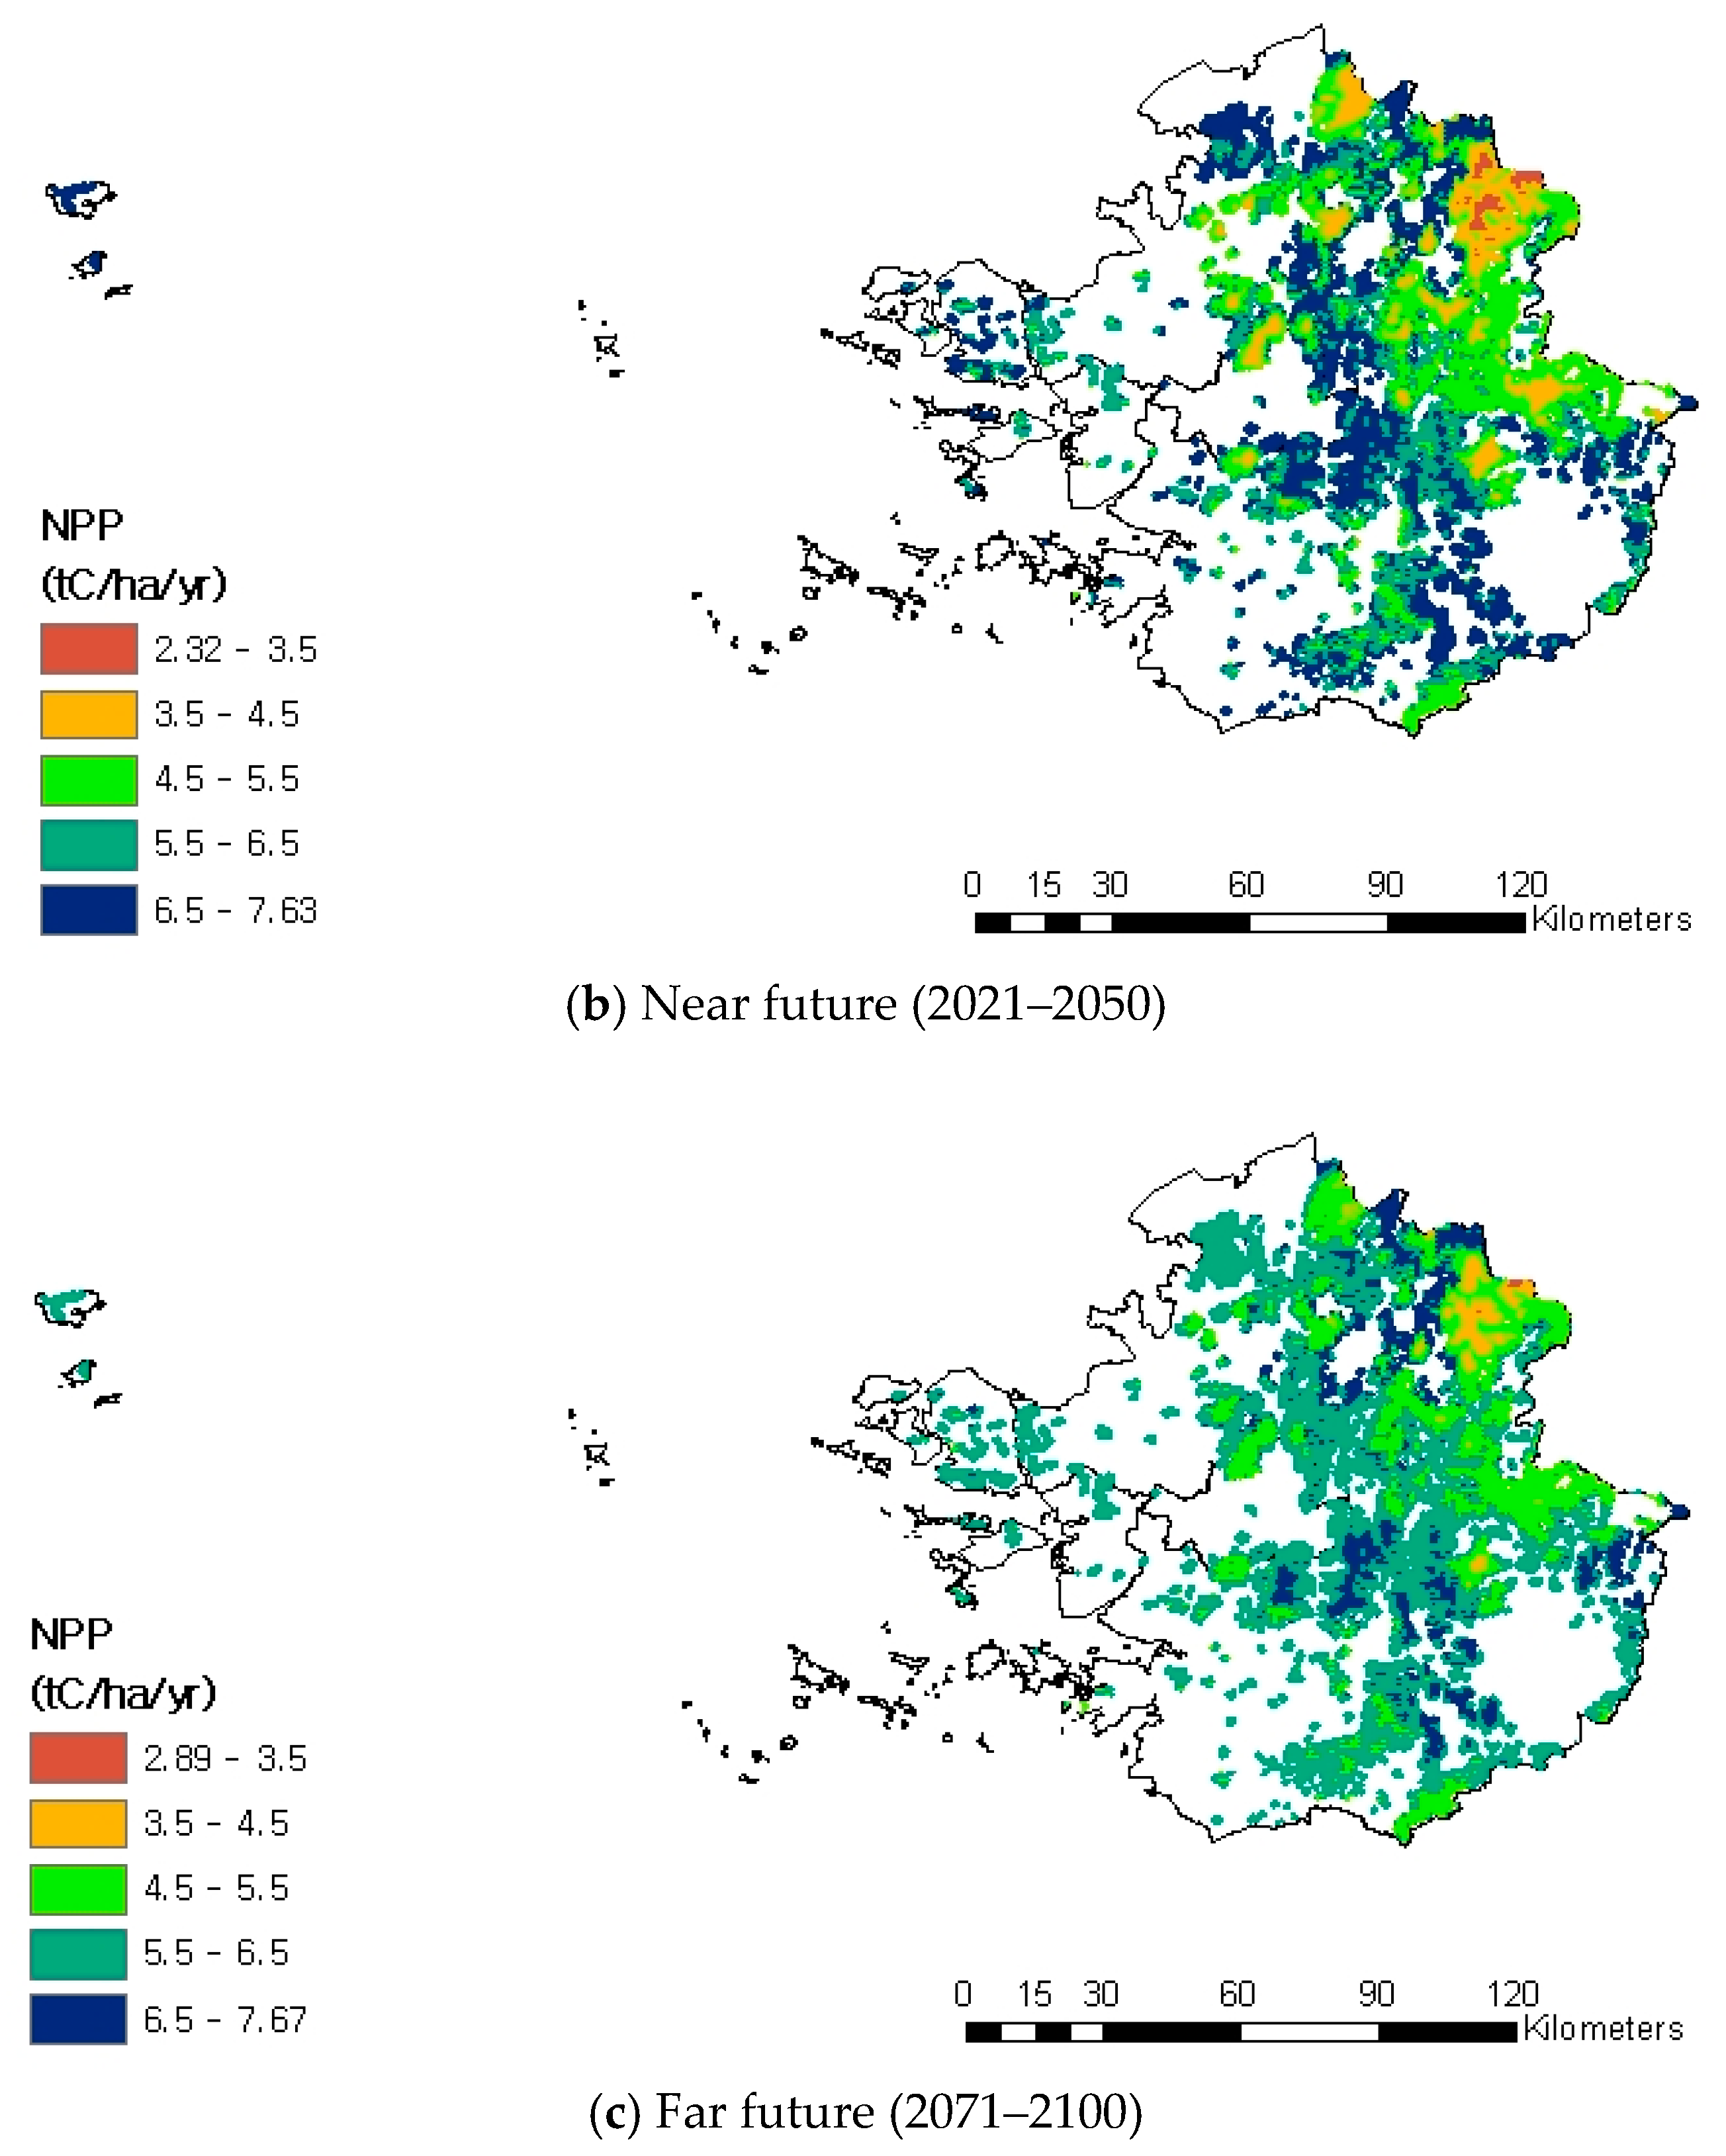
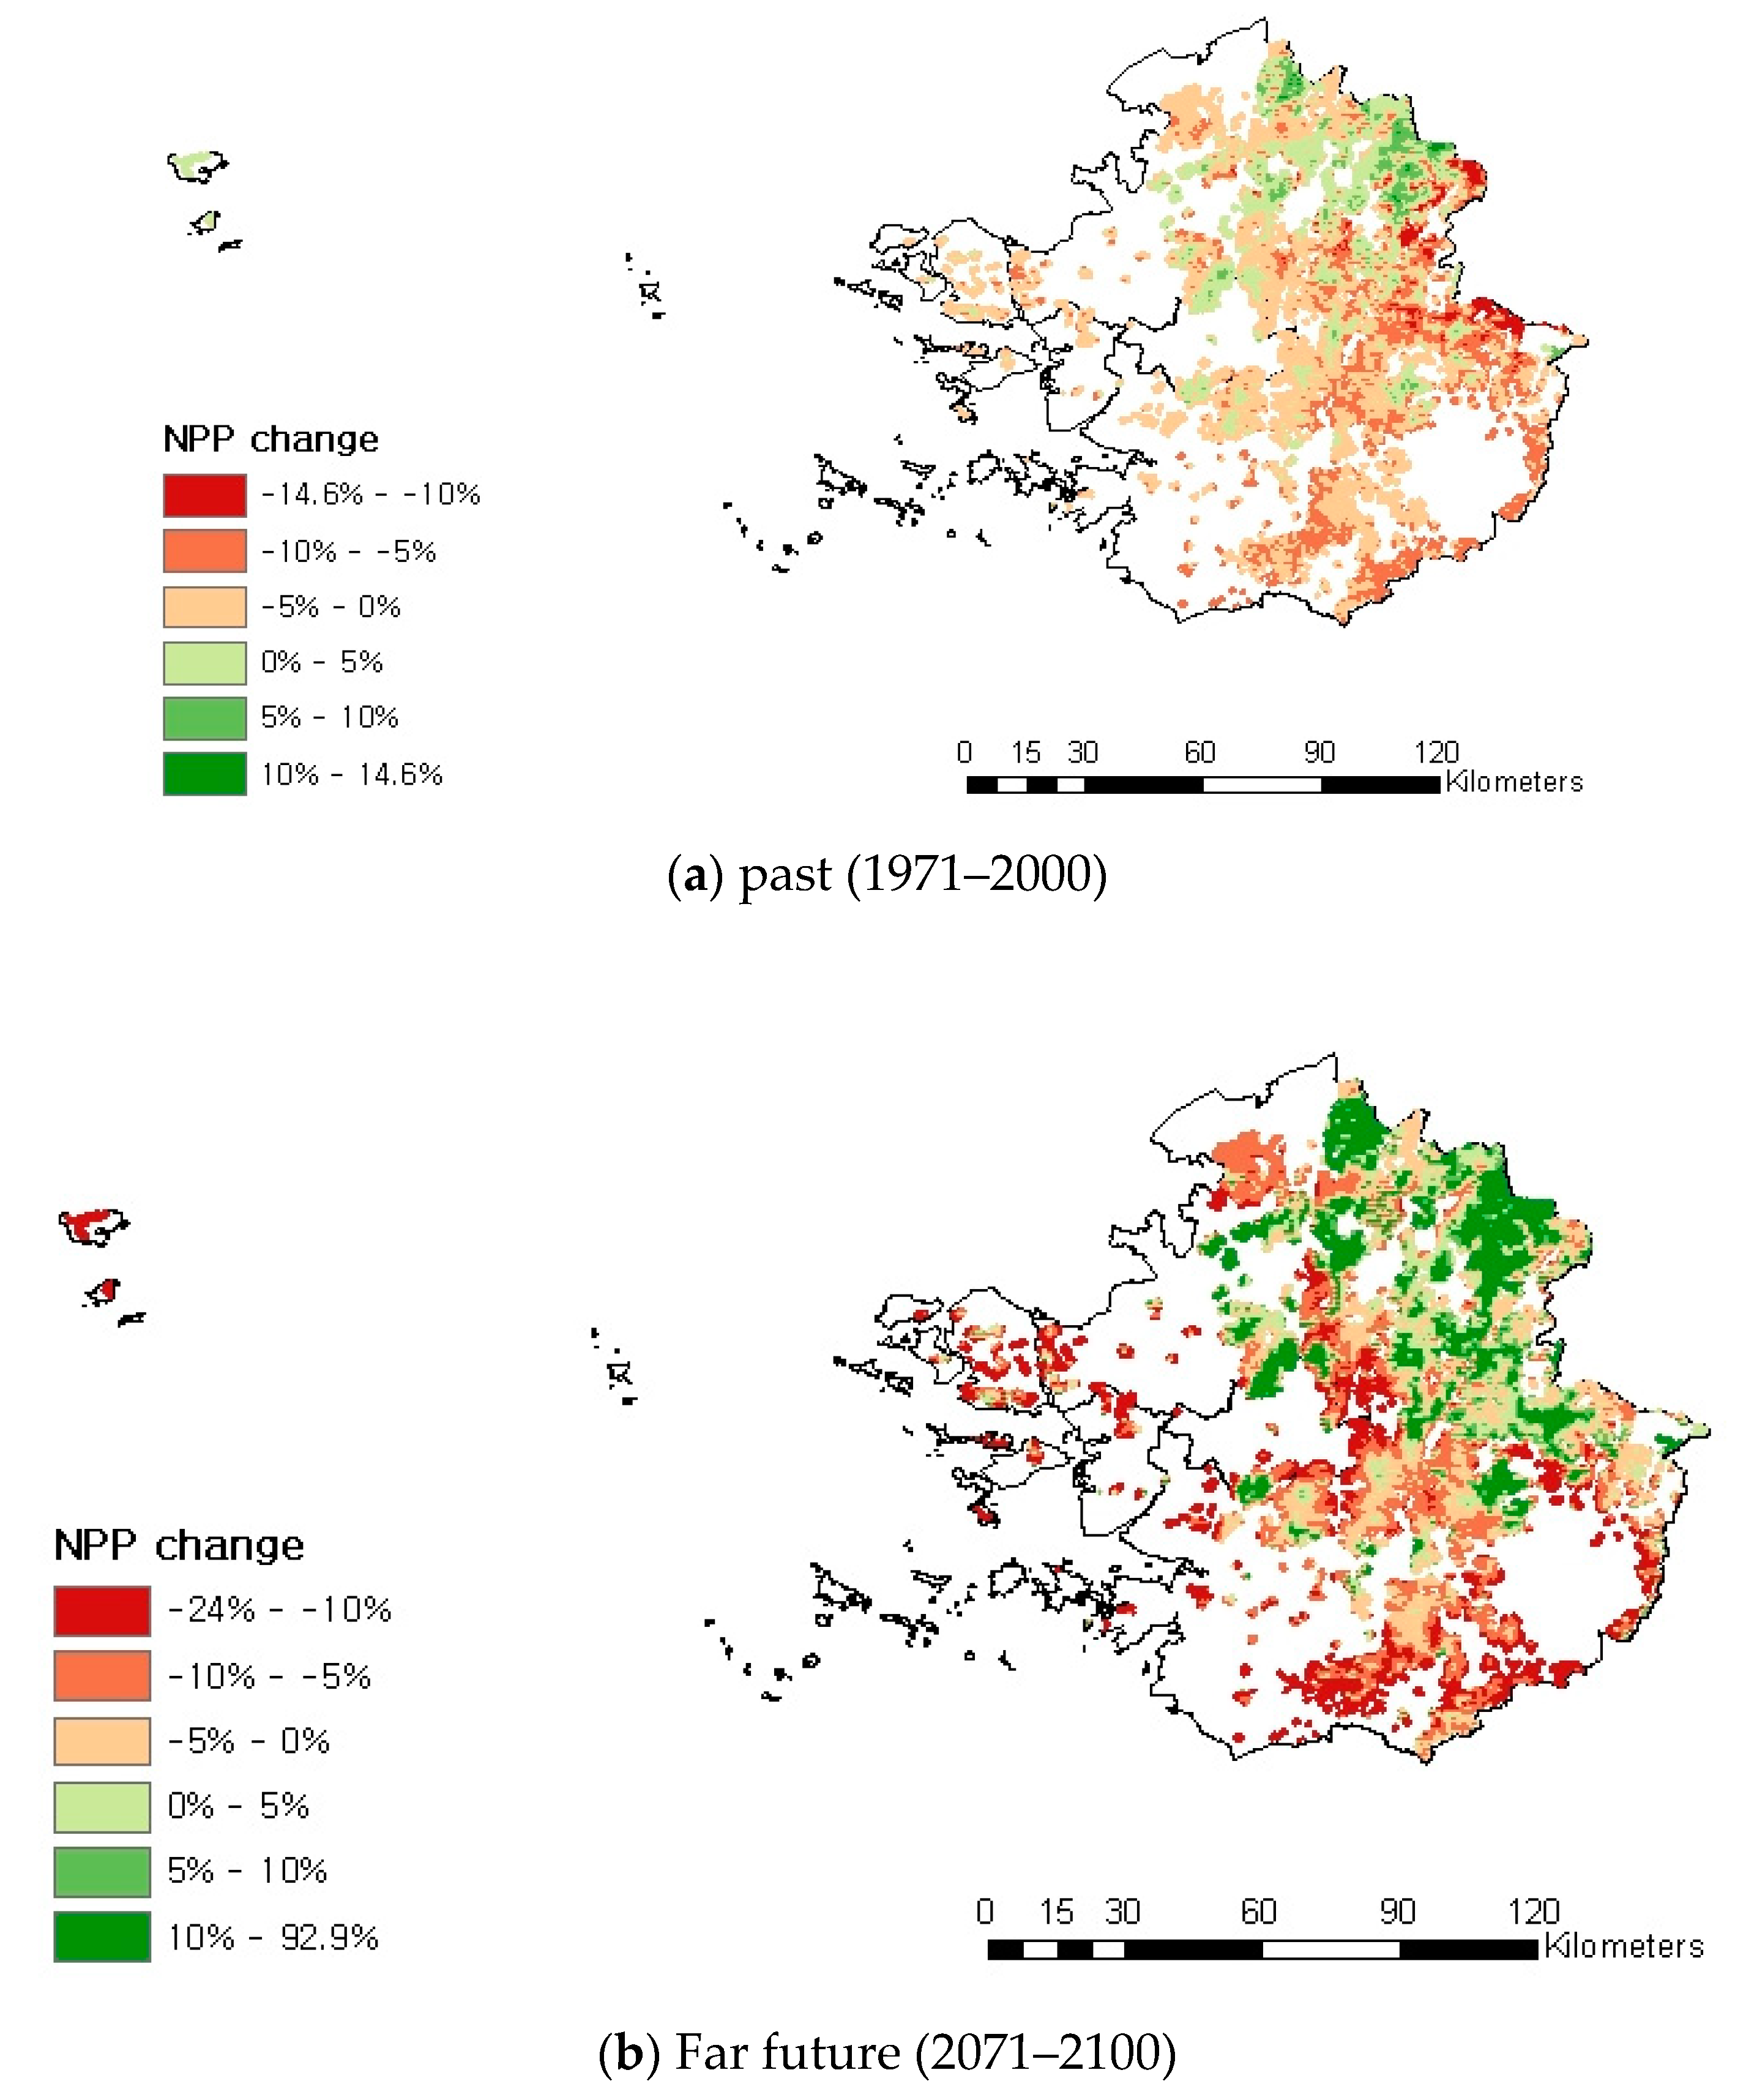
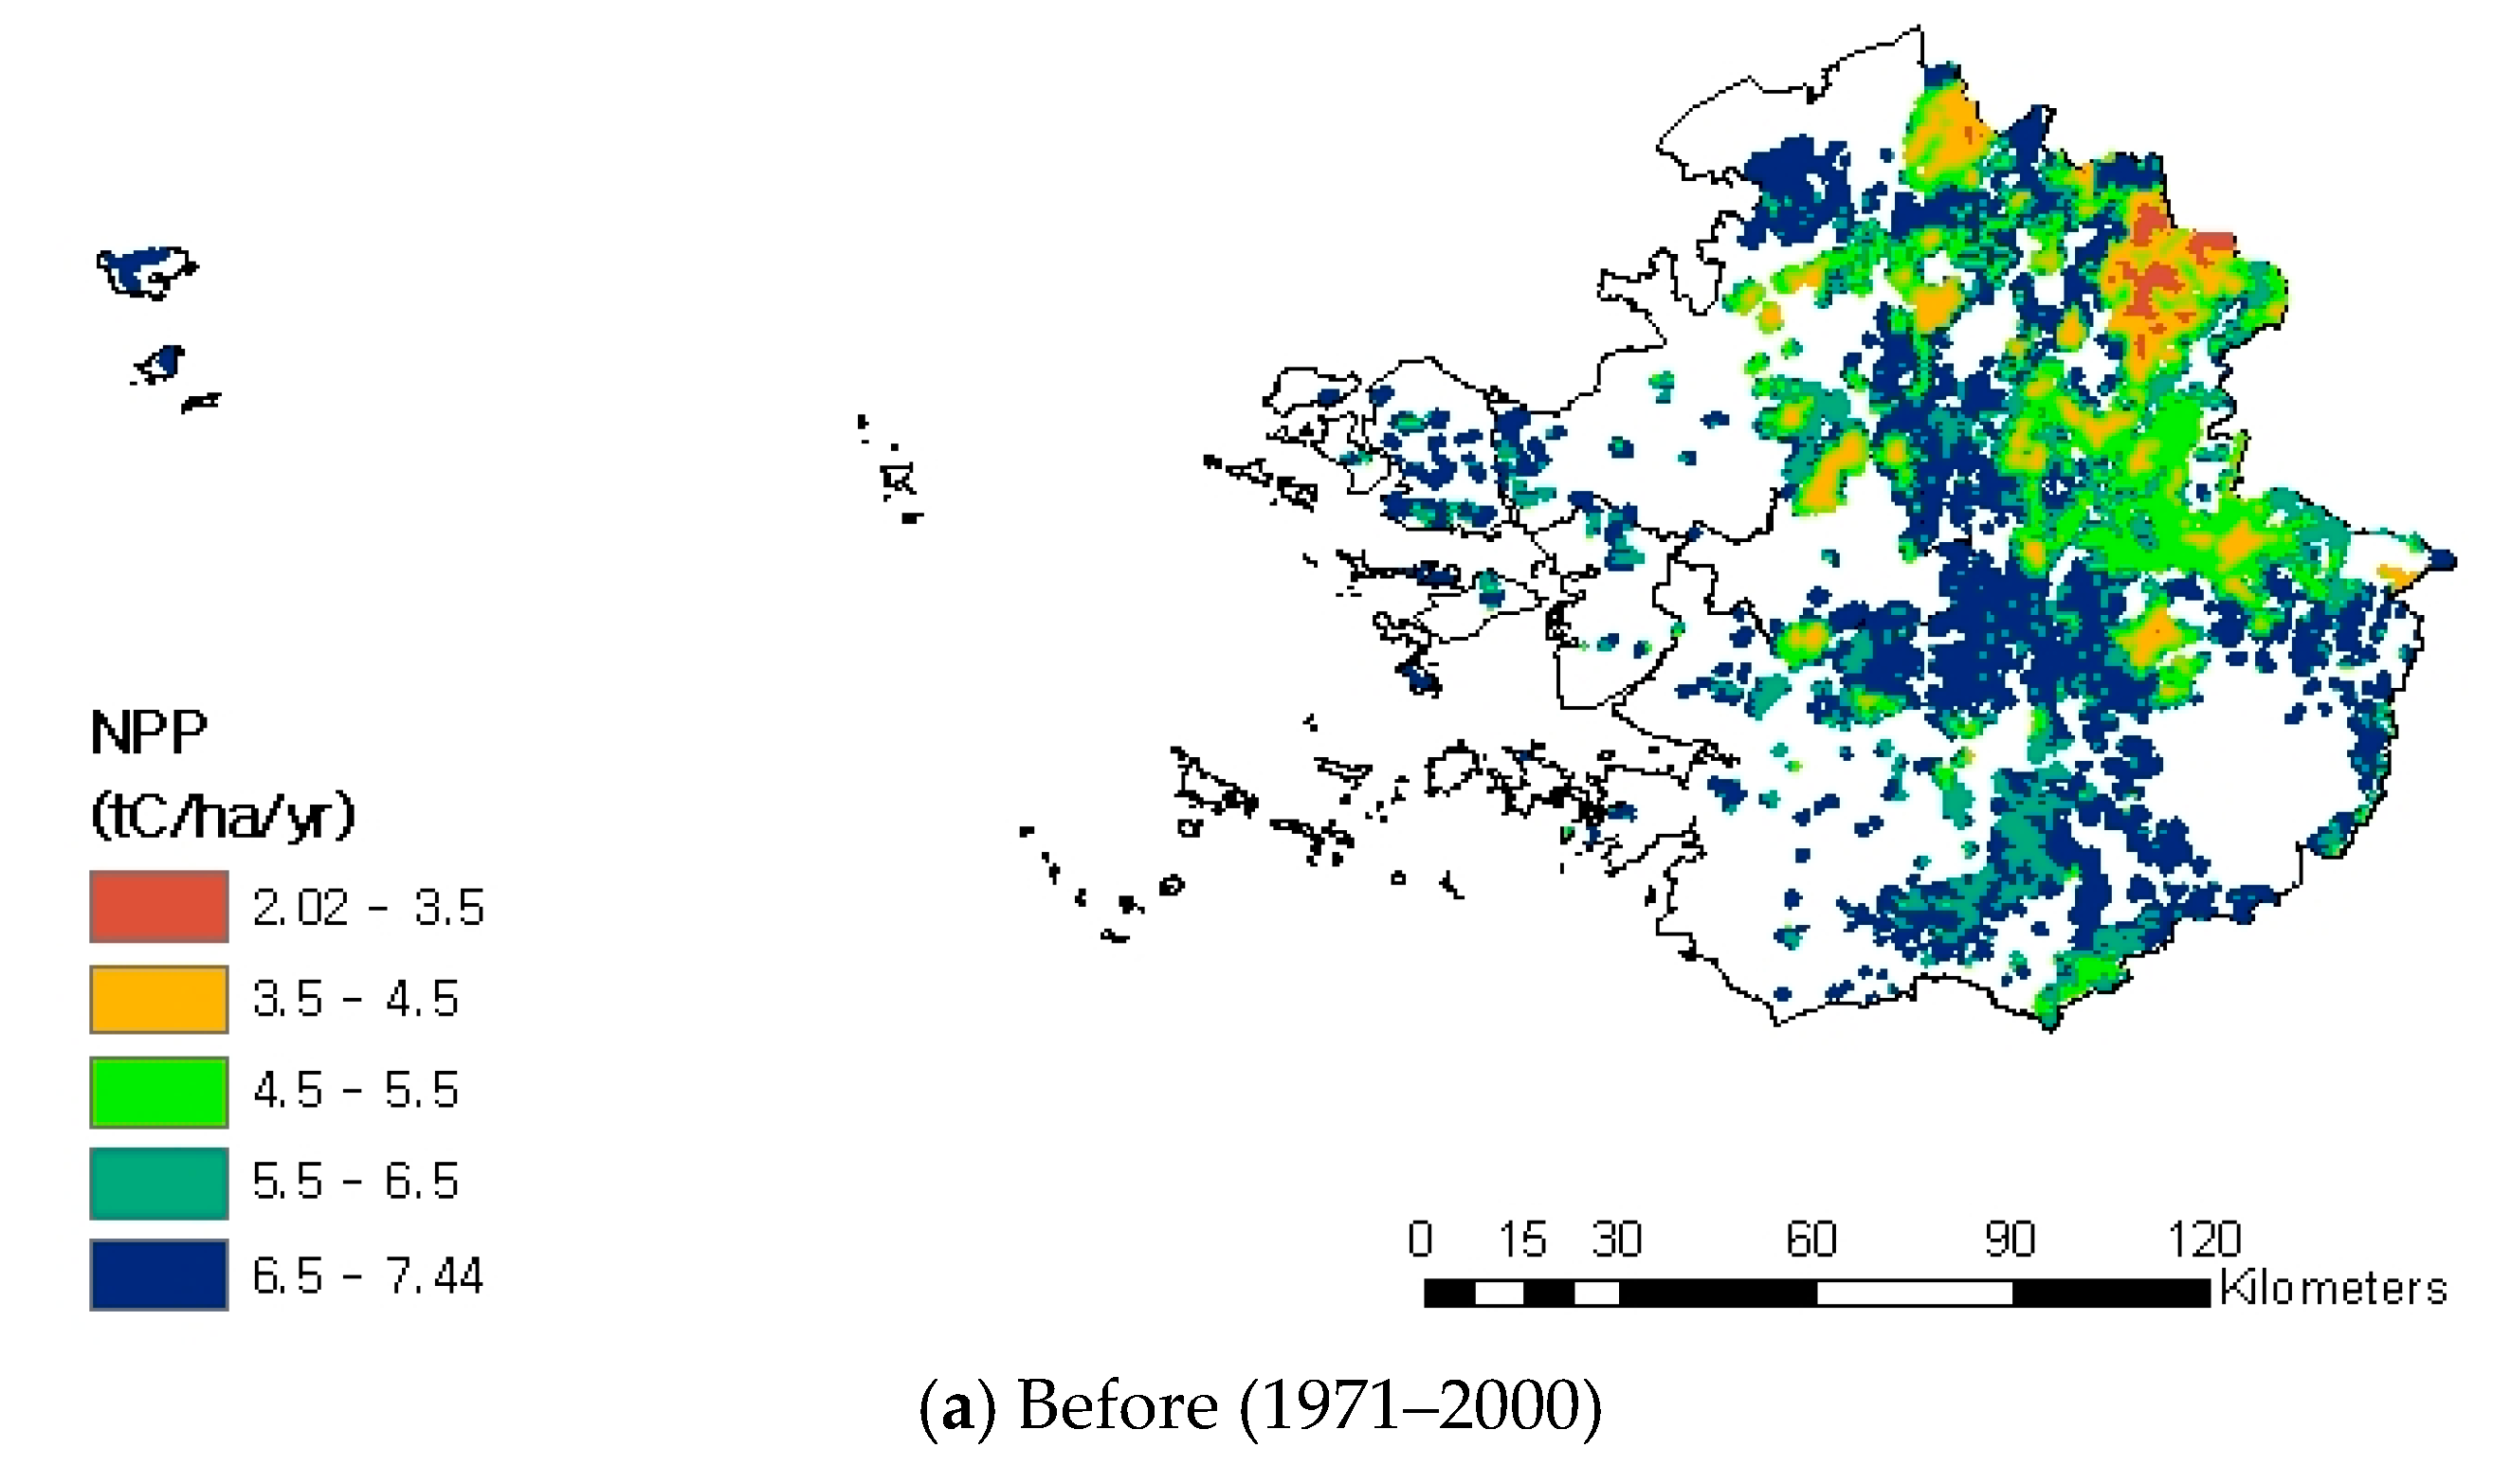
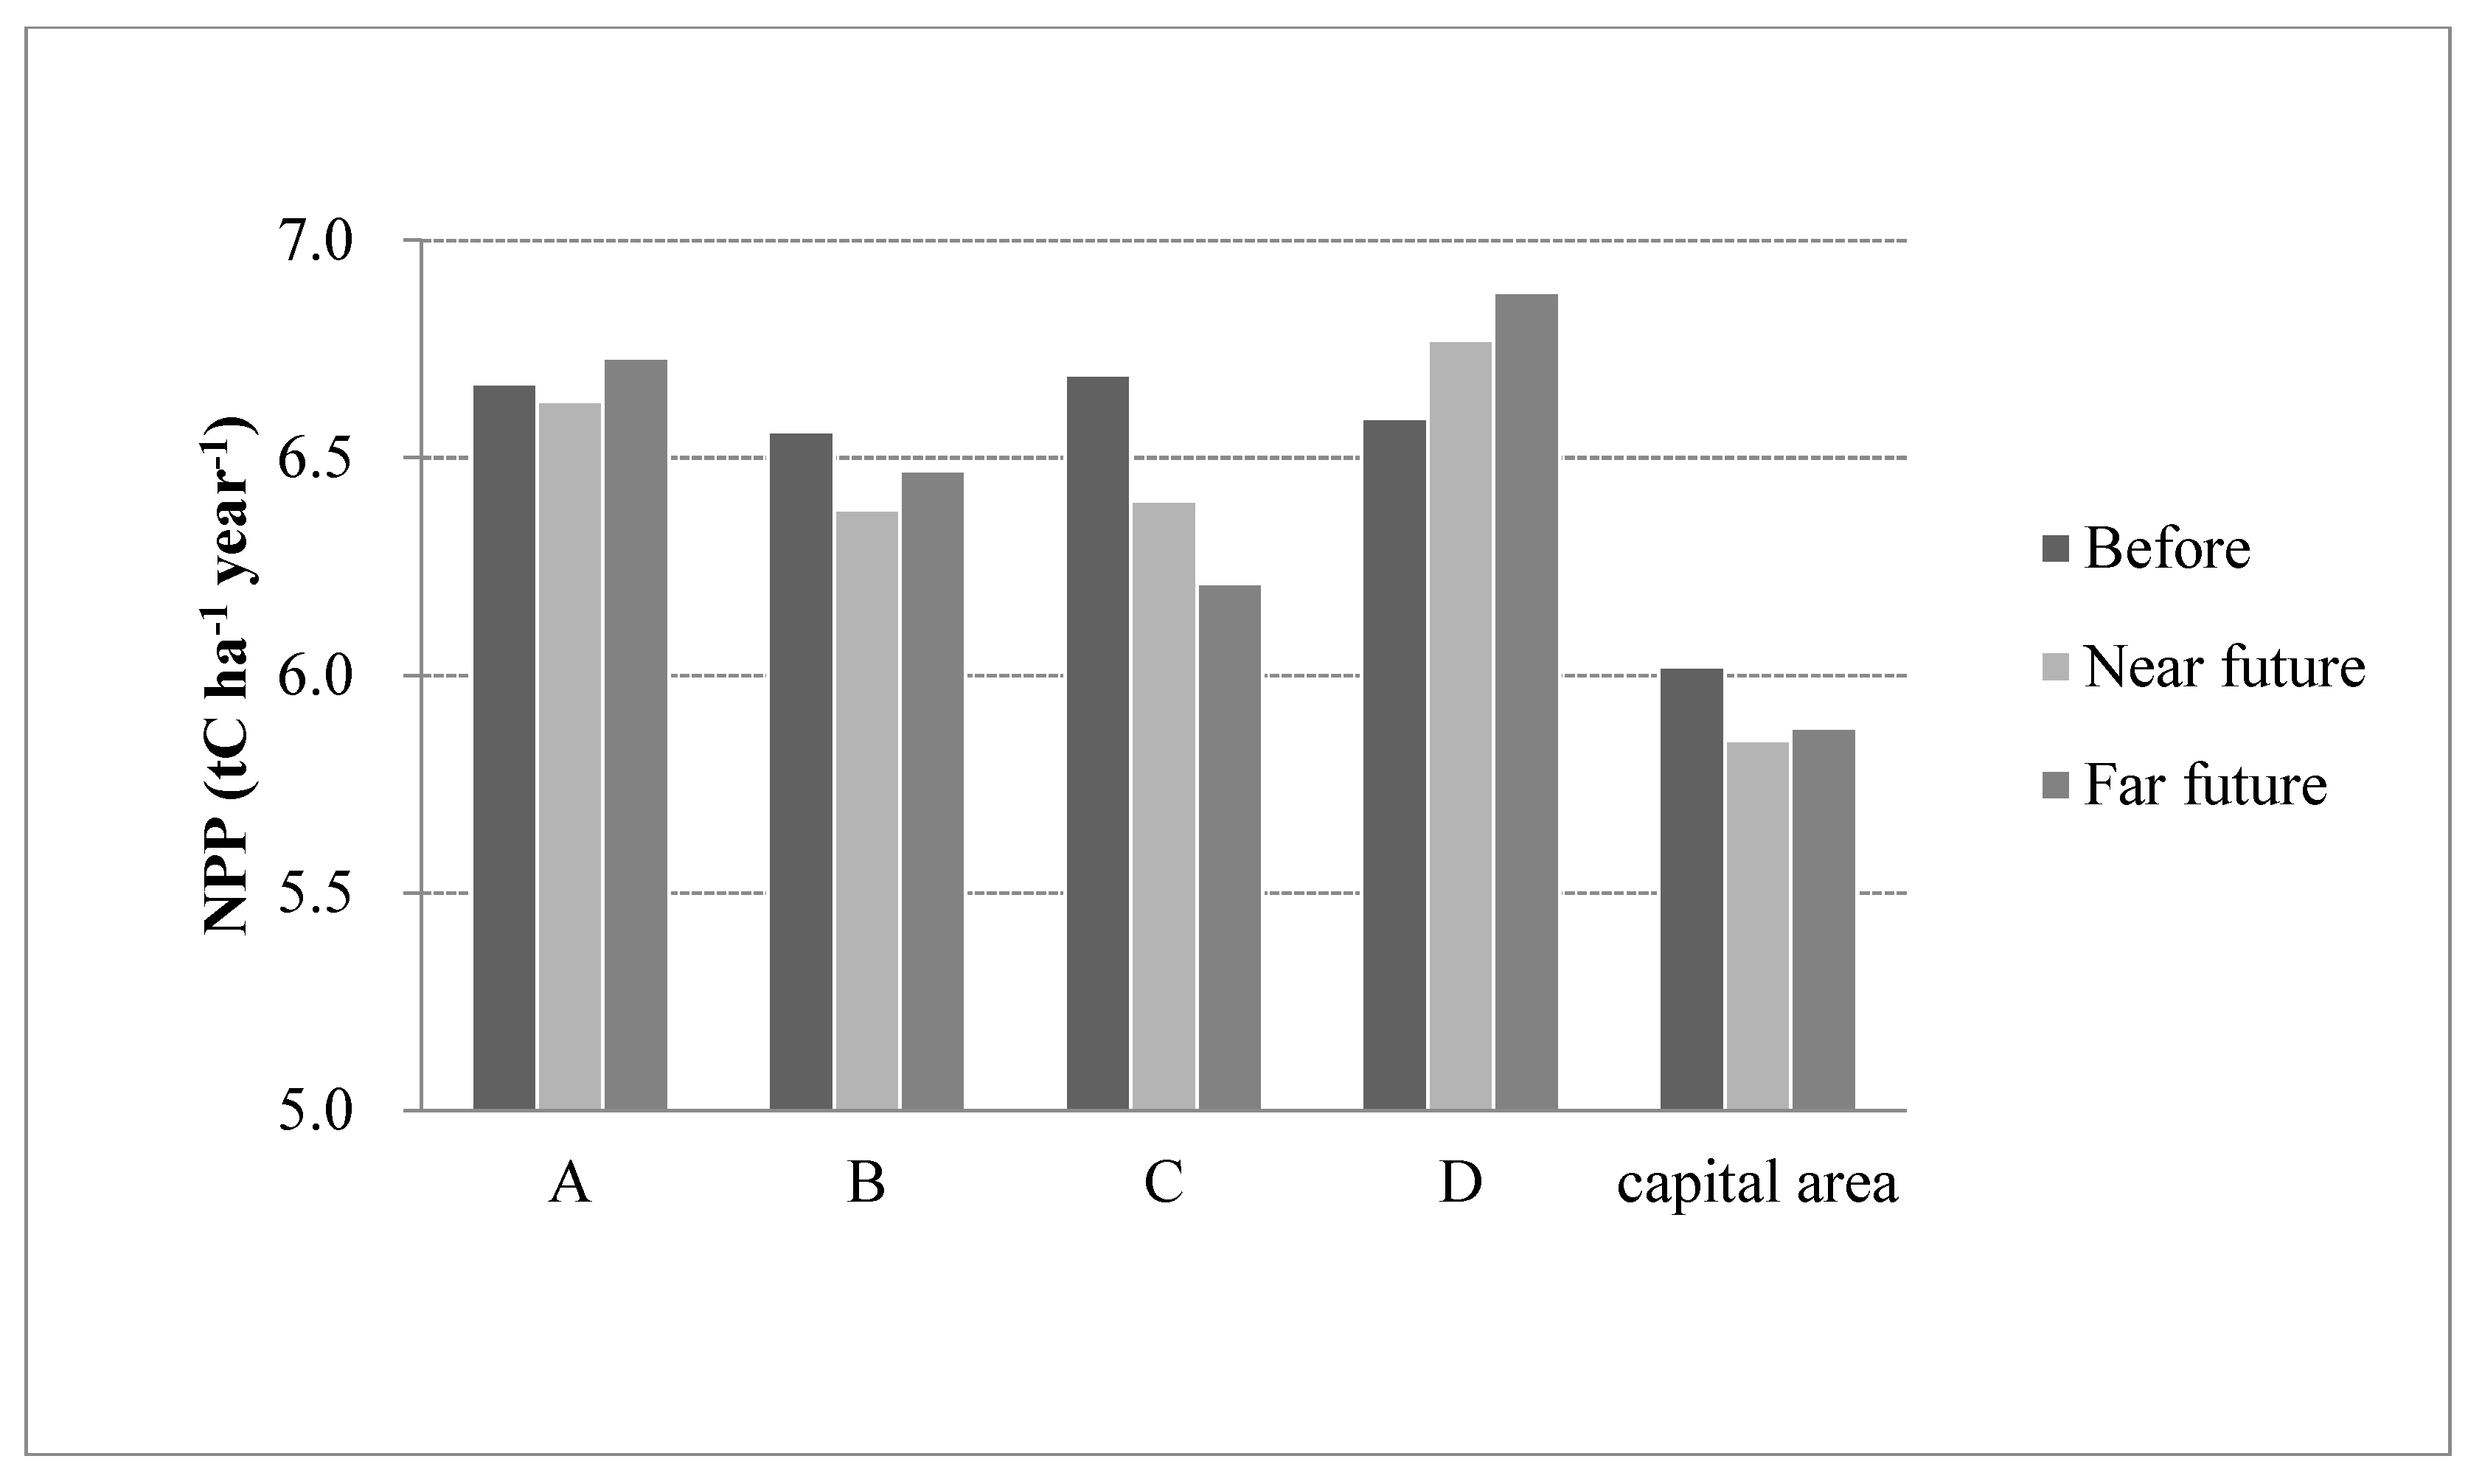
3.1. Net Primary Productivity Change by Potential Climate Change

As seen in Figure 5, the simulated NPP ranged from 2.02 to 7.43 tC ha−1 year−1 during the historical period (1971–2000); the average is 6.02 tC ha−1 year−1. In the near future (2021–2050) simulation, NPP varies from 2.32 to 7.63 tC ha−1 year−1 under the condition of potential climate change; the average is 5.85 tC ha−1 year−1, which decreases by 3% compared with that of the historical period (1971–2000). In the far future (2071–2100) simulation, NPP varies from 2.89 to 7.67 tC ha−1 year−1 under the condition of potential climate change; the average is 5.88 tC ha−1 year−1, which decreases by 2% compared with that of the historical period (1971–2000).
As seen in Figure 6, the NPP of simulation points, A, B, and C (but not D), indicate a decreasing tendency, in the near future (2021–2050). In the far future simulation, the NPP of points A and D increase, but those of B and C decrease. Although the NPP of point C decreases by 48%, that of point D near to point C, increases by 29%; these points are located in urbanizing and non-urbanizing areas, respectively. In comparison with other simulated data, the simulated NPP of the temperate forest at point A, during the historical period (1971–2000), was 6.67 tC ha−1 year−1, which is approximately 10% higher than the 6.04 tC ha−1 year−1 of NPP simulated at the same point by the Lund–Potsdam–Jena Module, of the Community Land Model 3.5-DGVM, from [11].
In this study, the rate of change of the future NPP simulated, is described with GIS. In the far future simulation, NPP fluctuates regionally, with an increase of up to 93% (especially in northern areas) and decrease of up to 24%. The forest areas where NPP decreases are mainly coastal areas, or relatively low elevation forest areas. On the other hand, the relatively high elevation forest areas above 150 m indicate a 4.62% increasing rate of NPP, when comparing far future (2071–2100) to the historical period (1971–2000). With regard to the result in high elevation forest areas above 200 m, the NPP increases by respective 1–3% and 6–14% during 1999–2030 and 1999–2090, which Peng et al. (2009) simulated with a climate scenario of temperature and precipitation increases, and a TRIPLEX model, in northeastern China (Figure 7).
Even though the long-term simulation result for NPP has only a small decrease tendency, of 2–3%, under the condition of potential climate change during the period of 2000–2100, quantitatively it would be not negligible, as NPP can be accumulated annually.

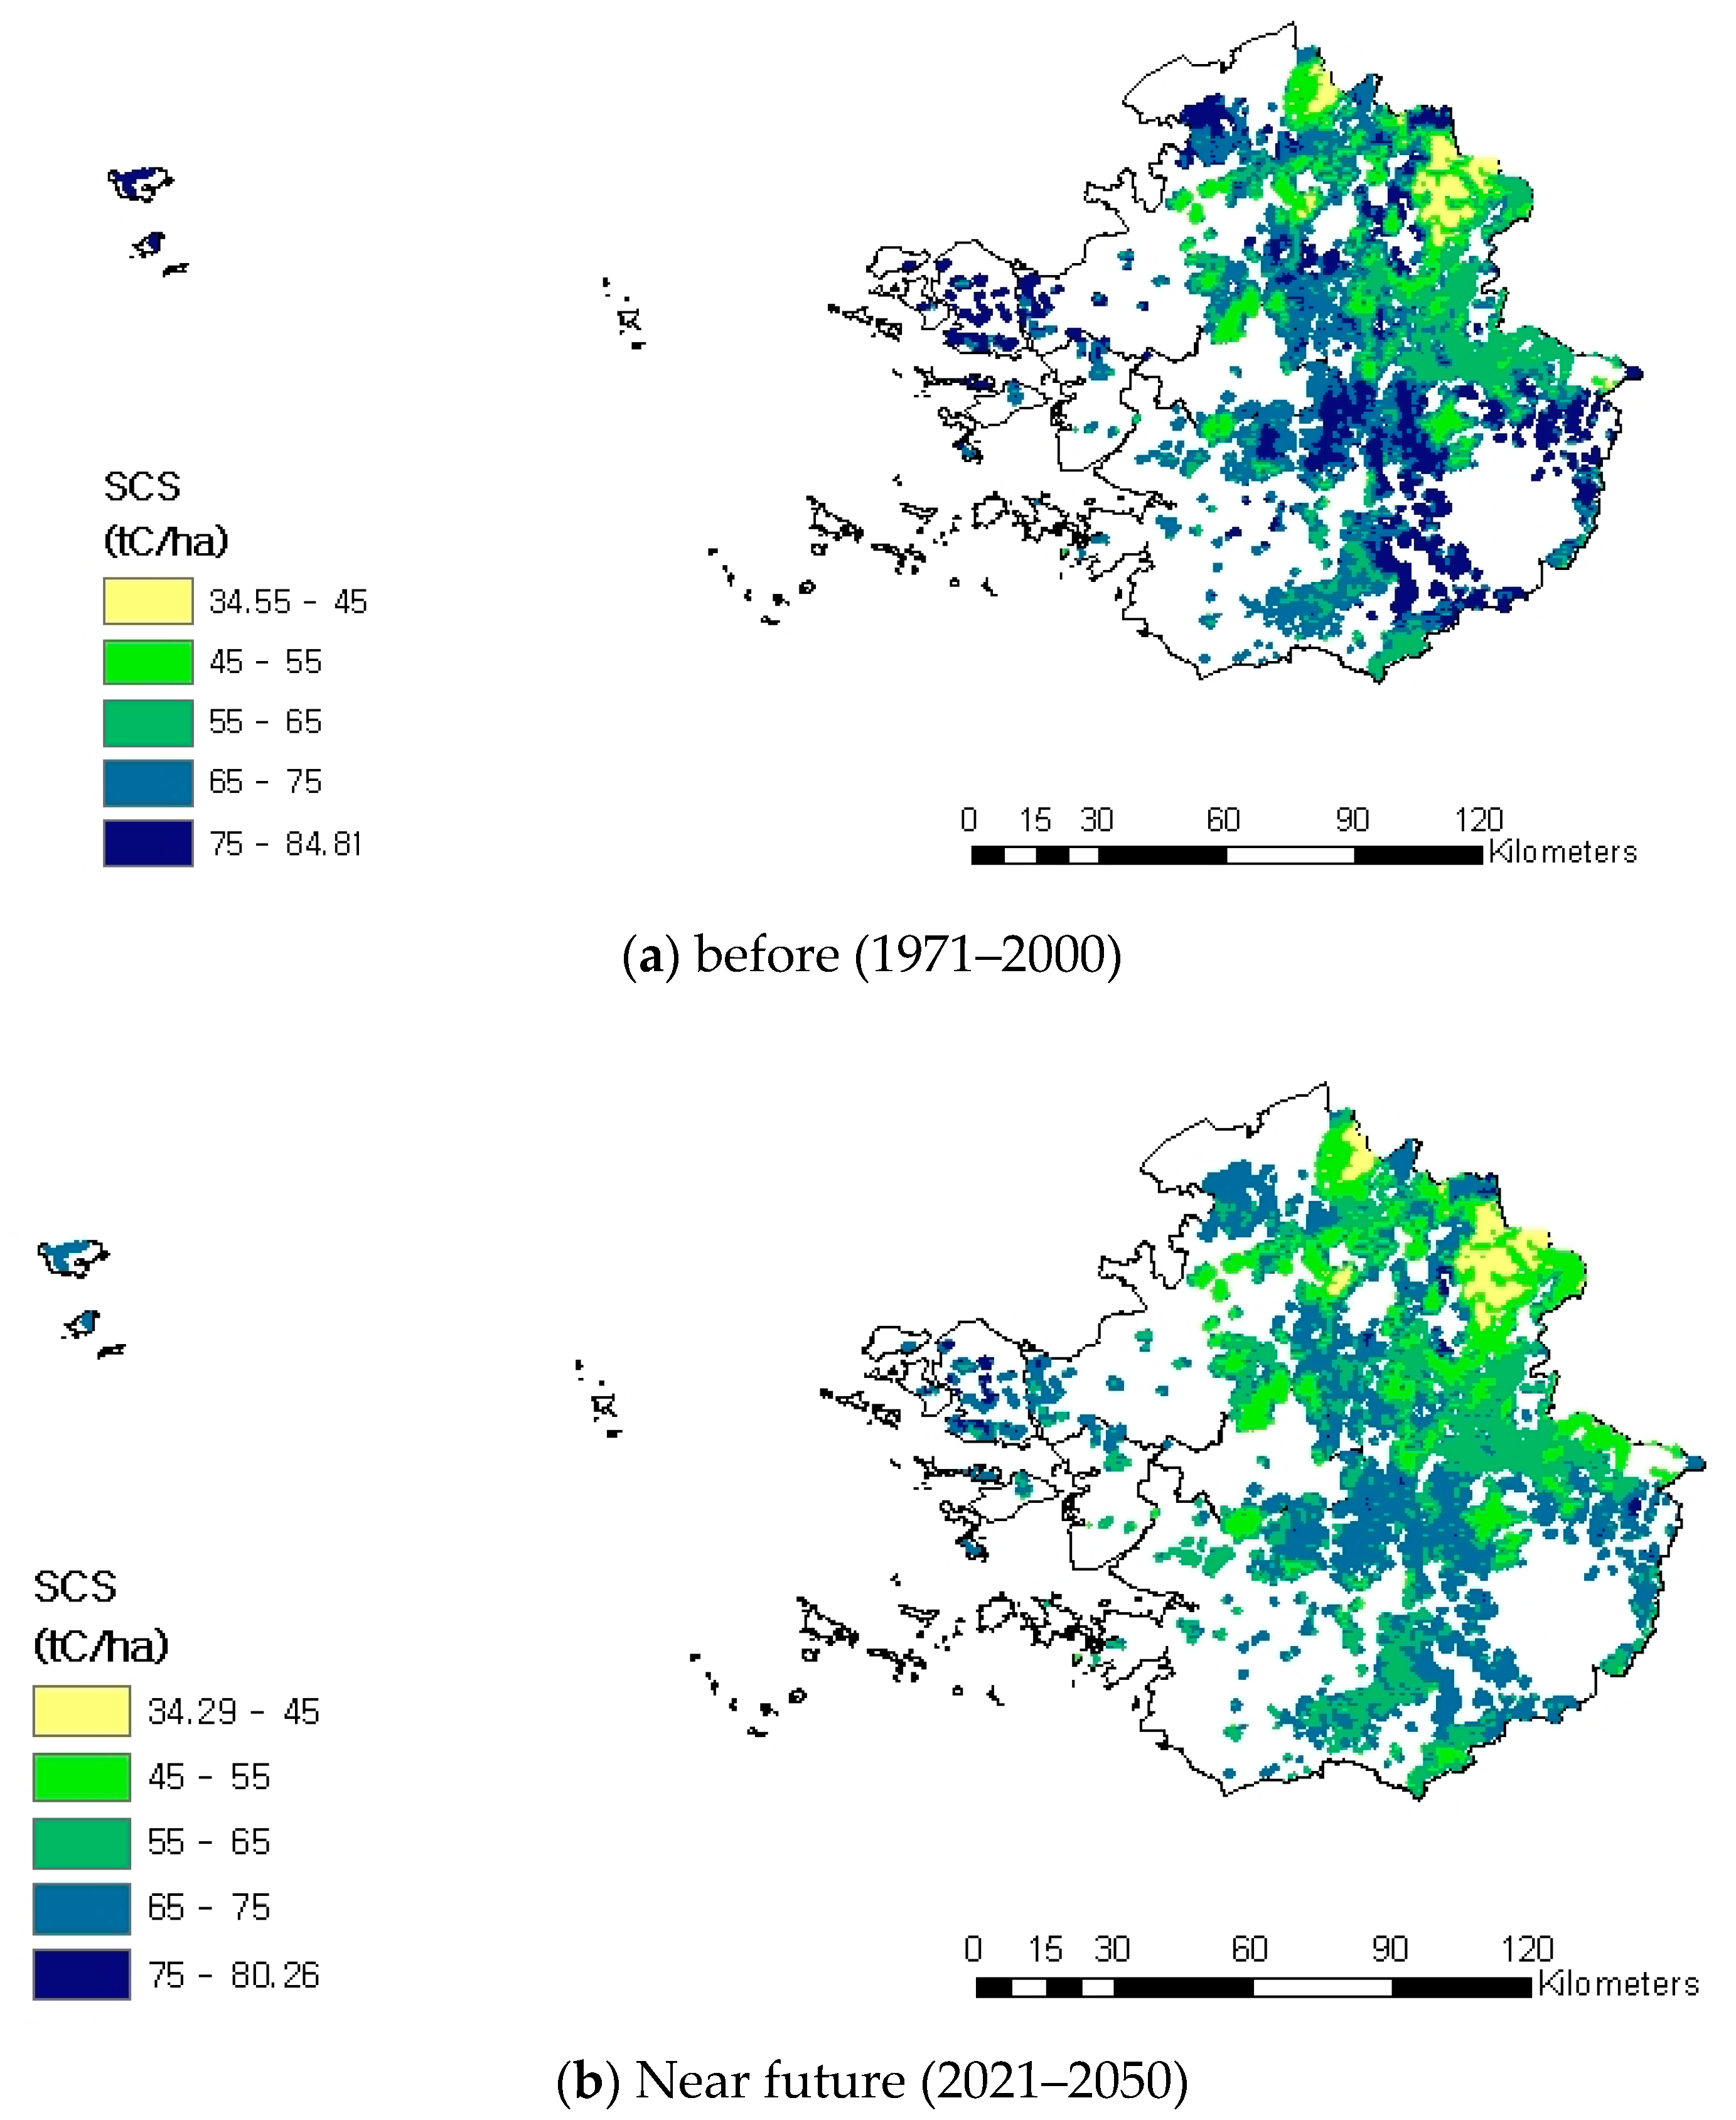
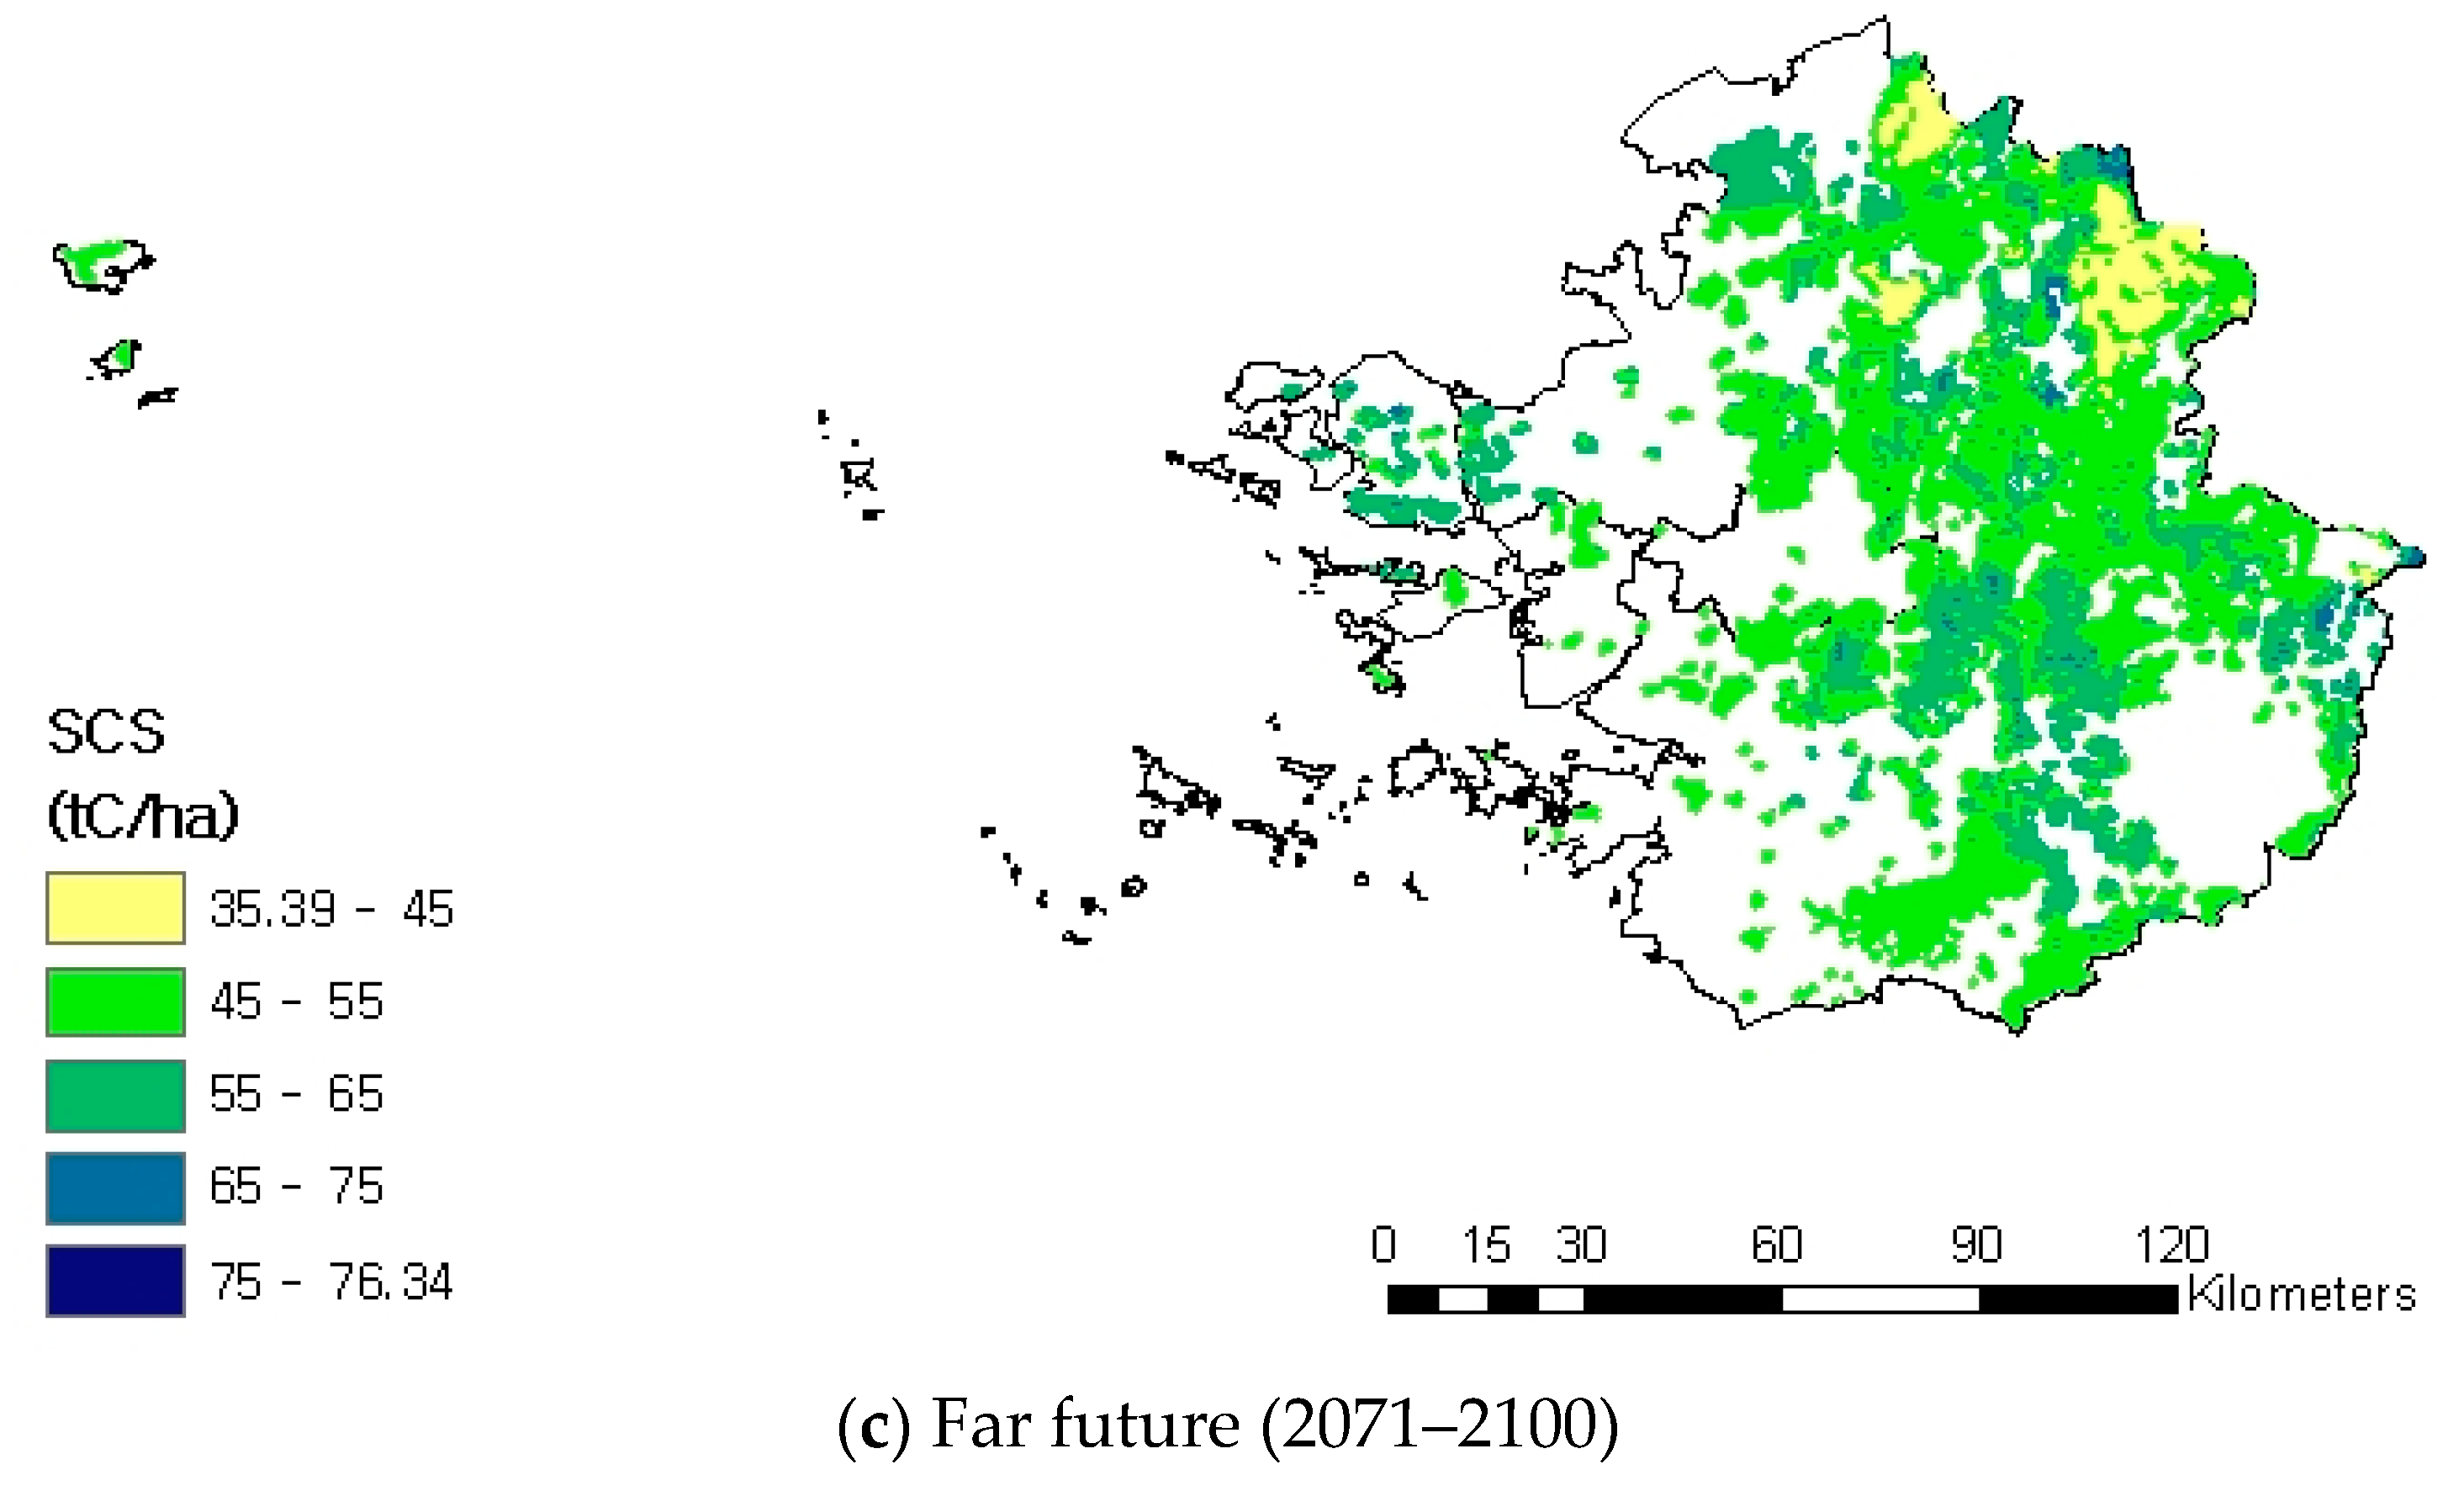
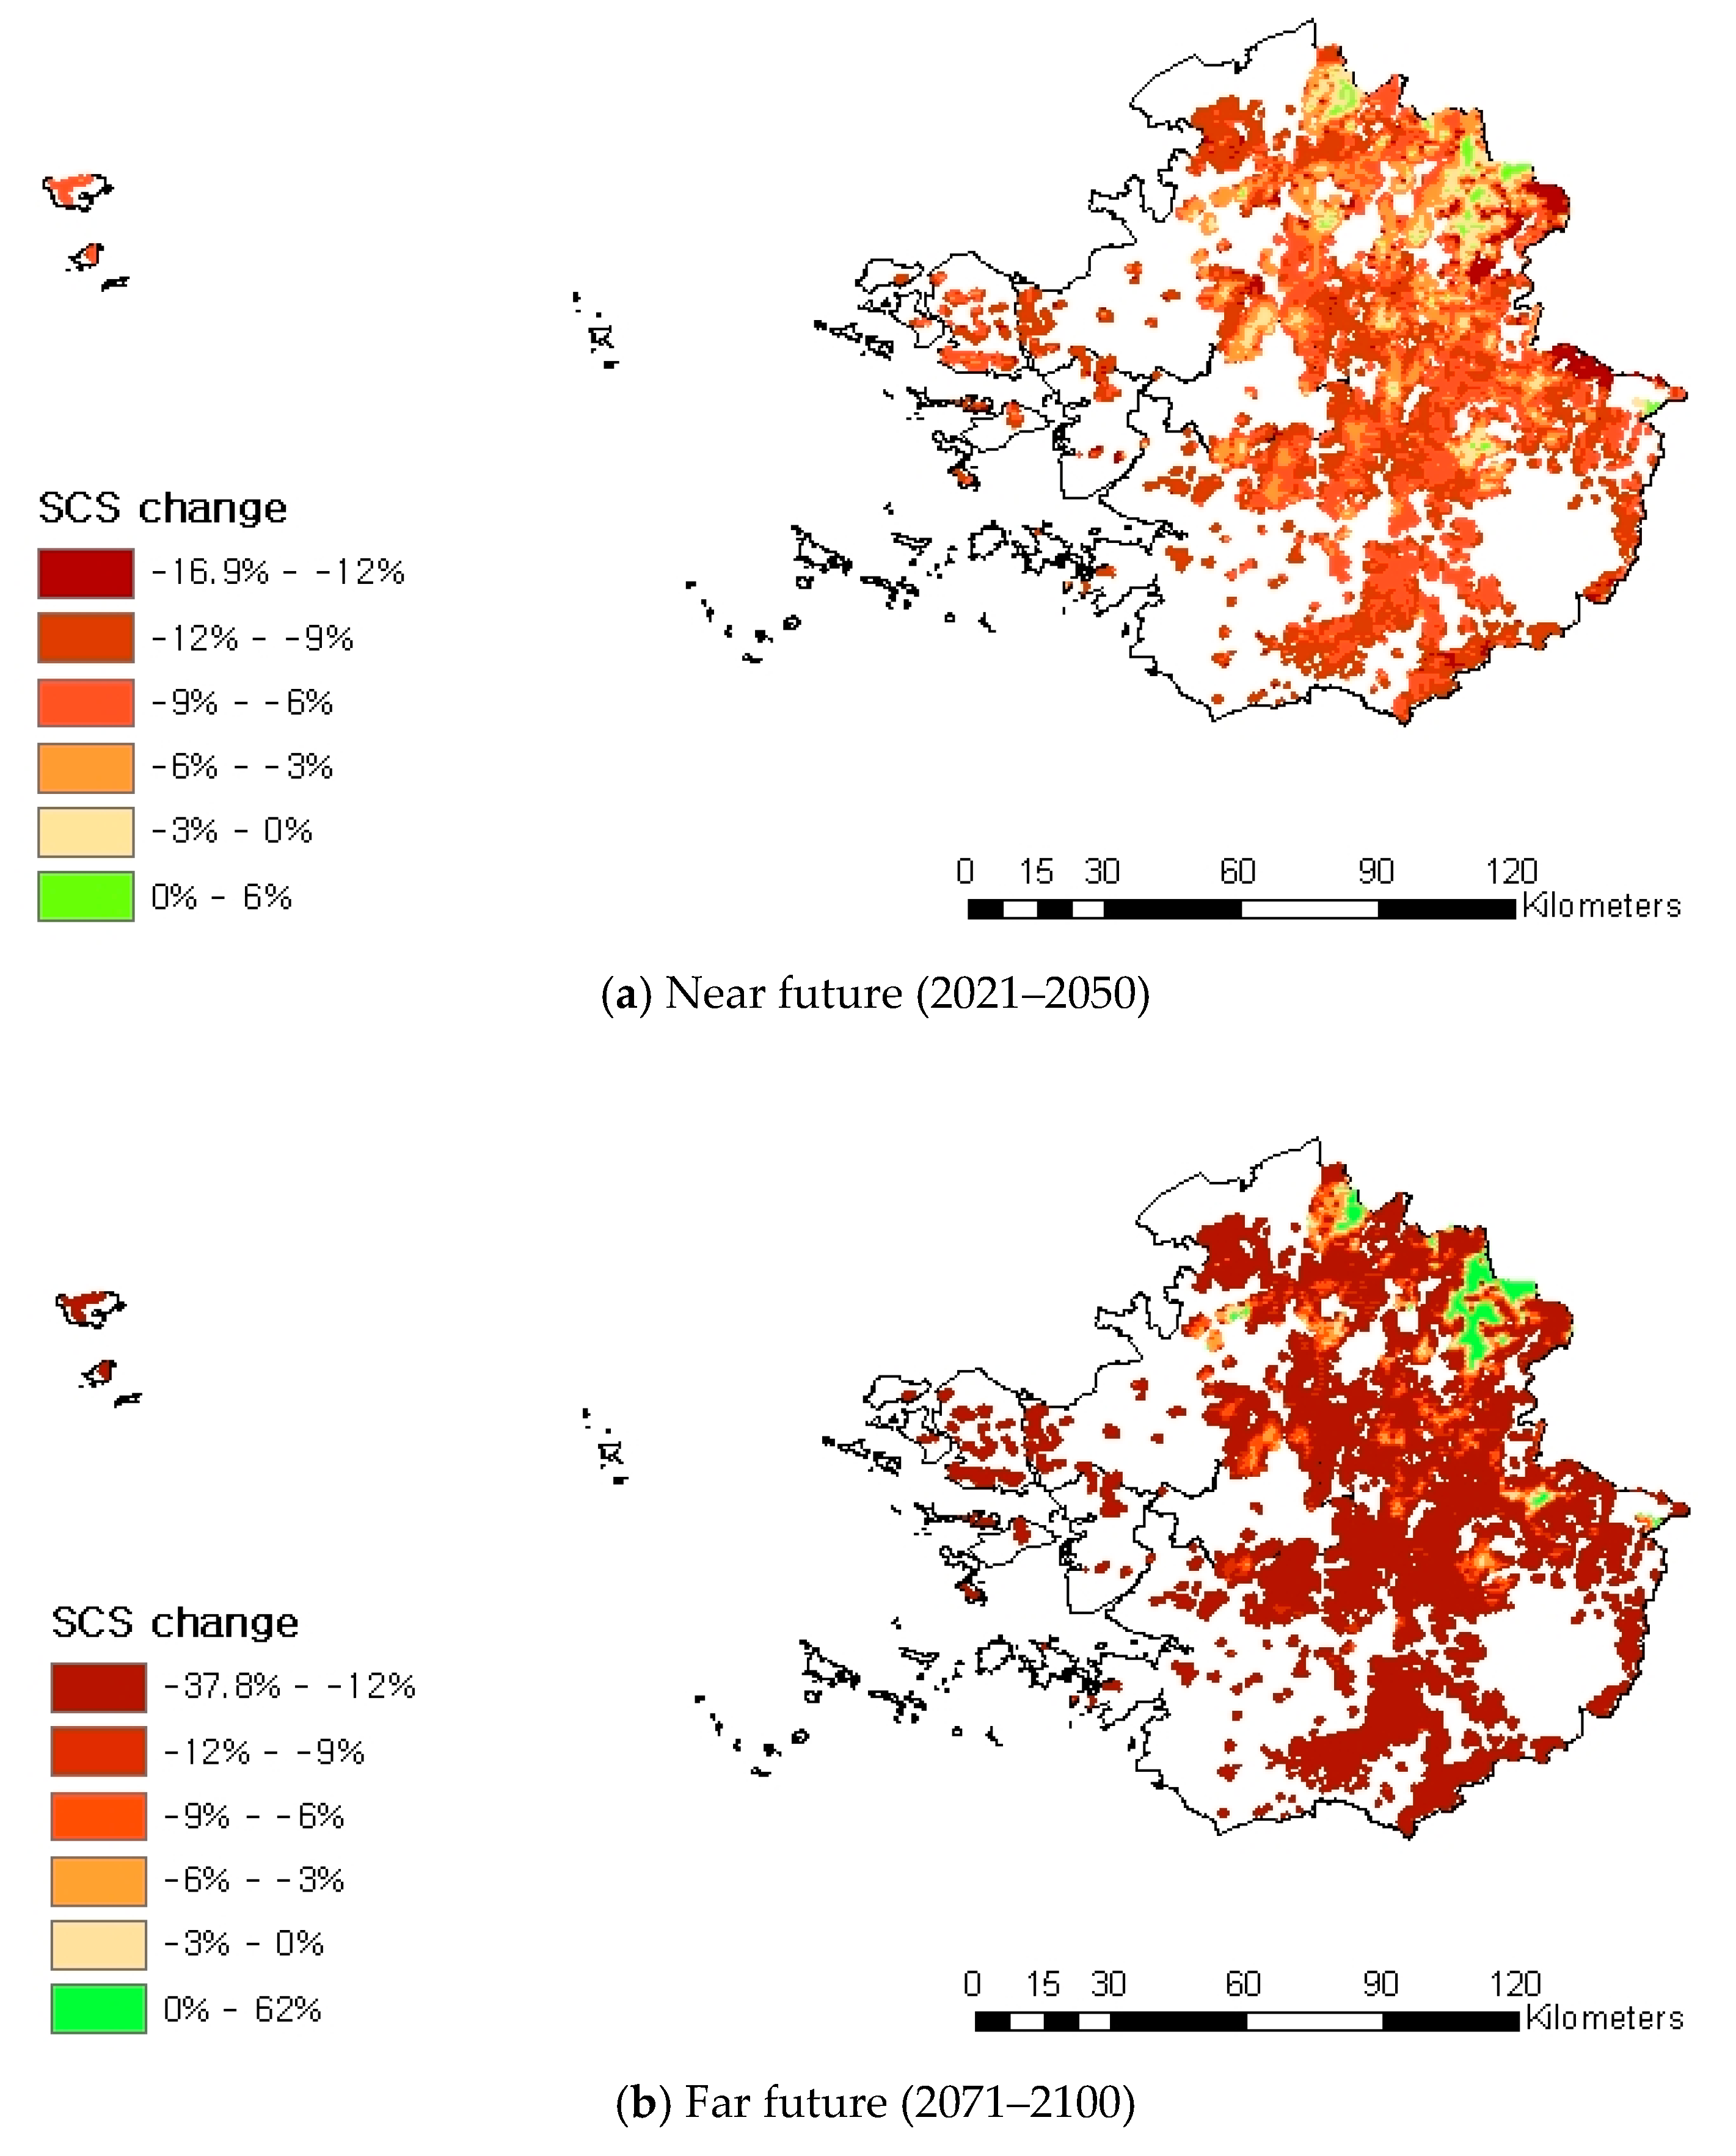
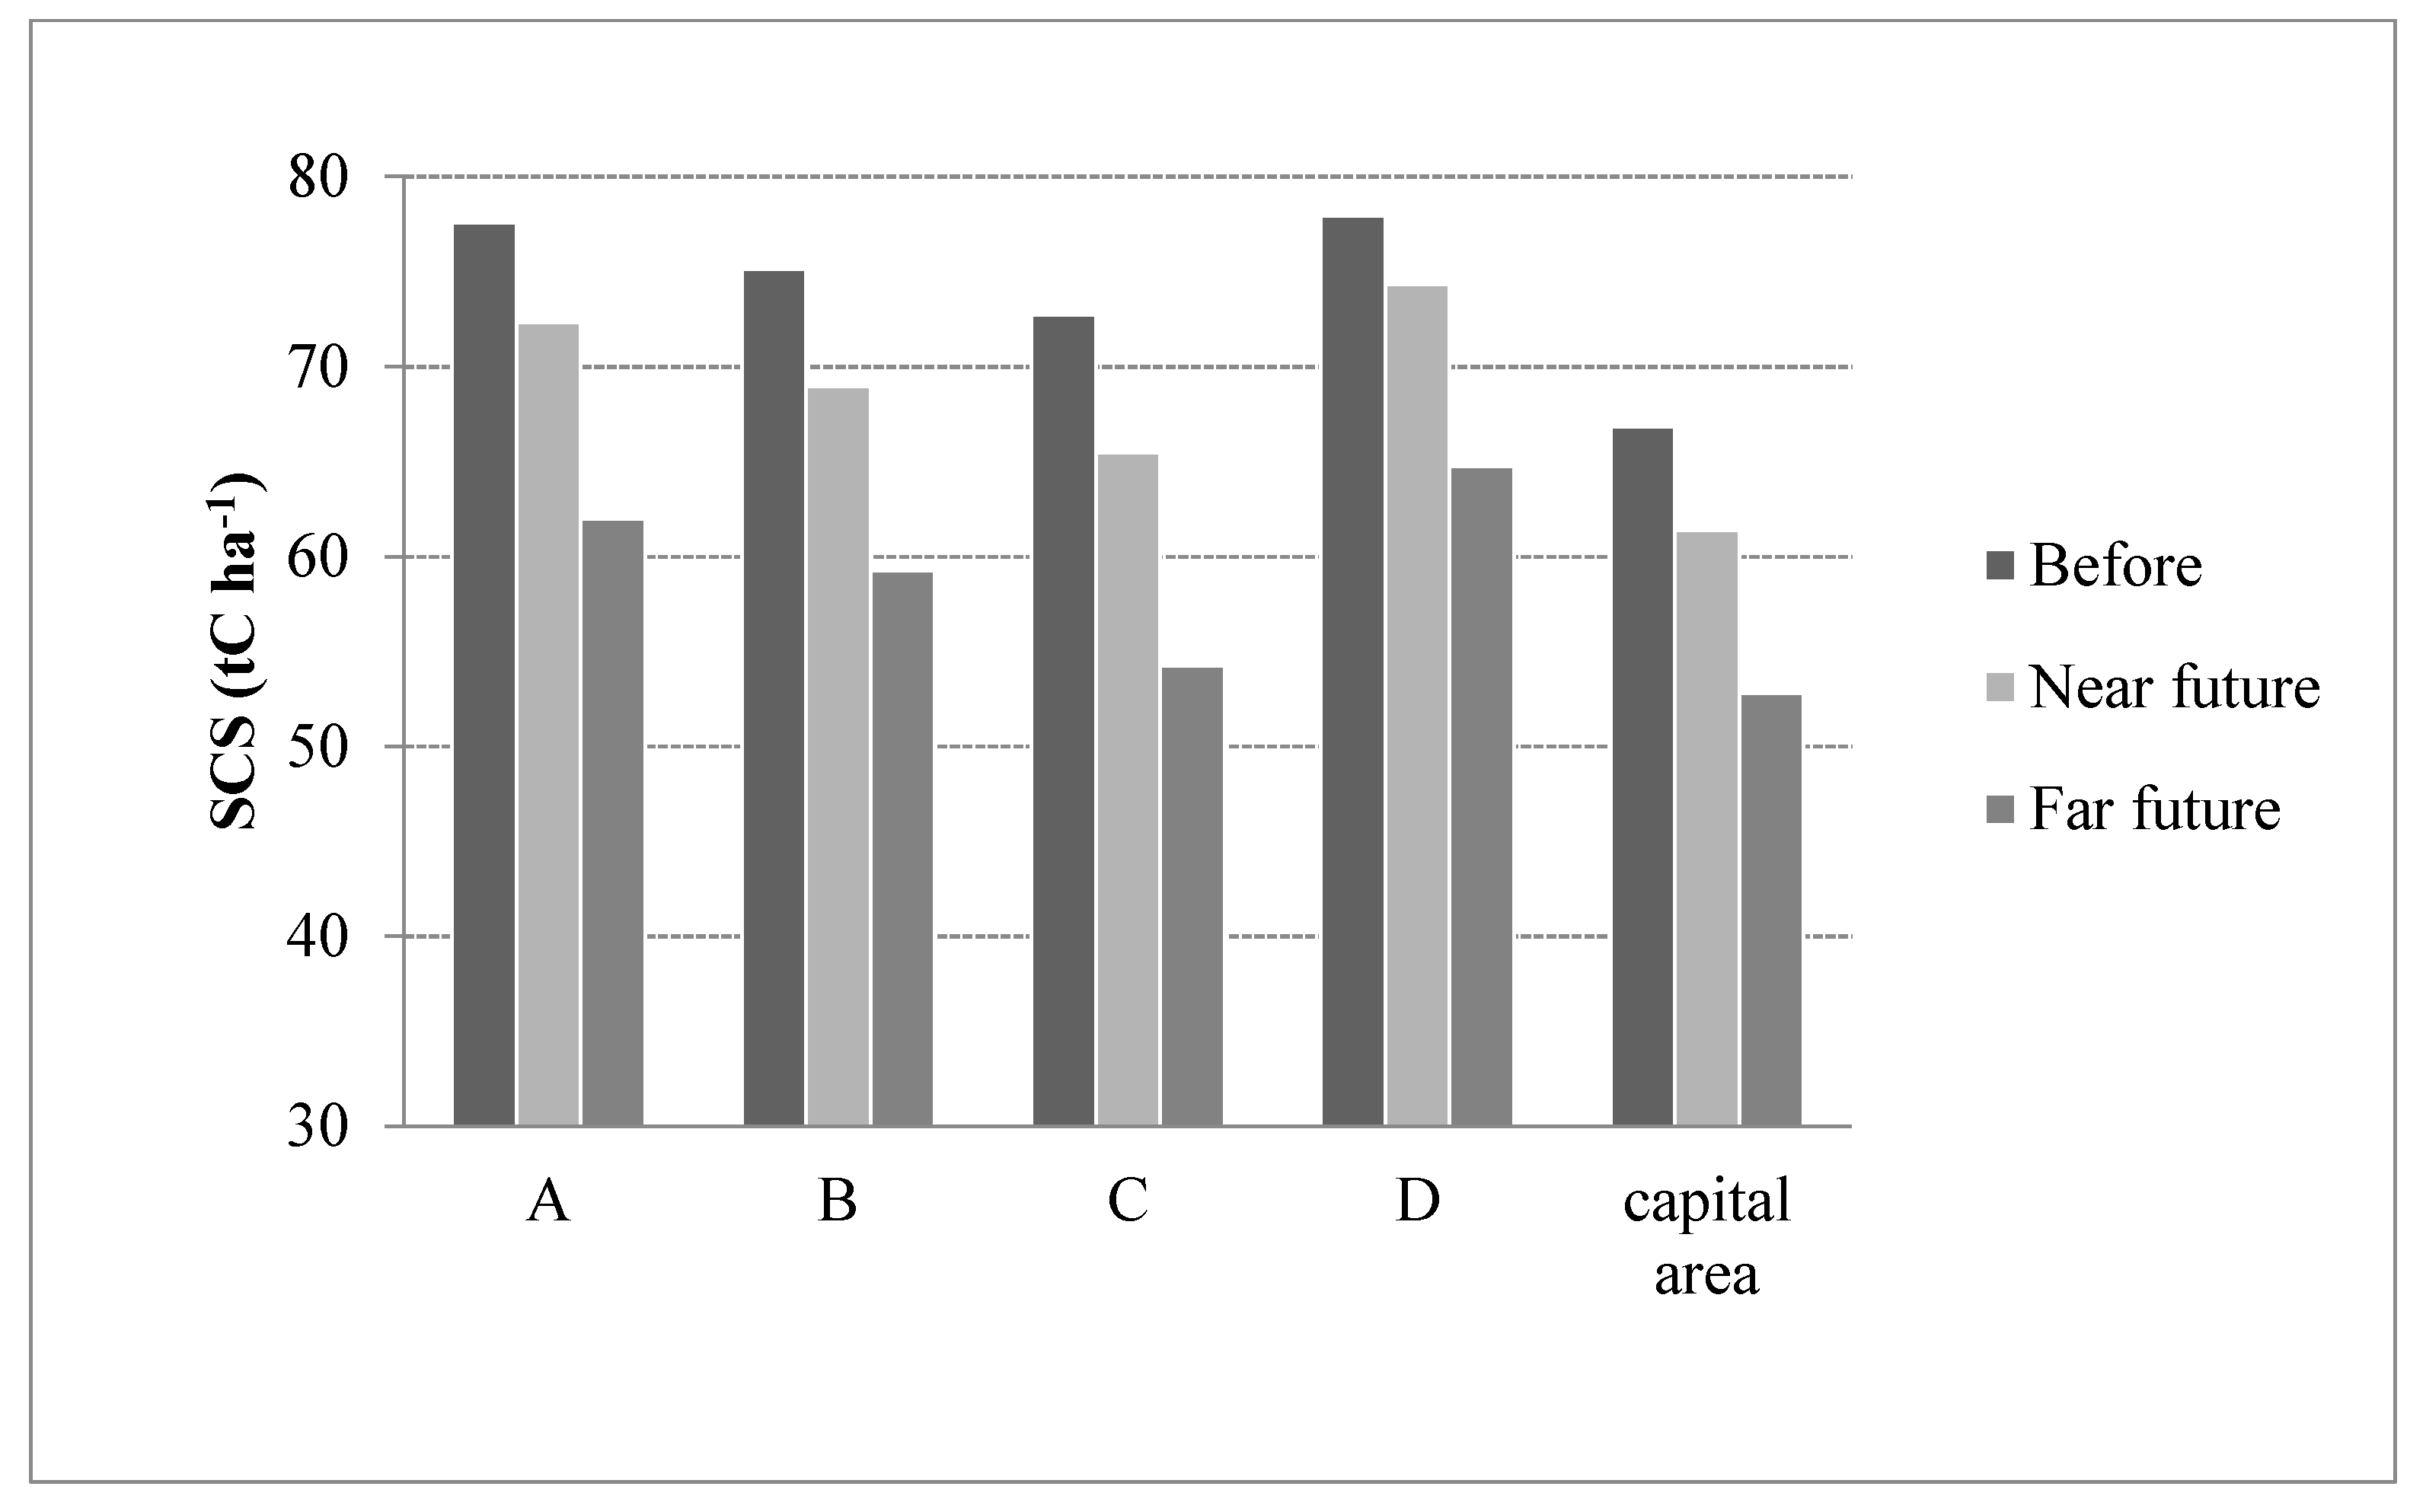
3.2. Soil Carbon Storage Change by Potential Climate Change

As seen in Figure 8, simulated SCS varied from 34.55 to 84.81 tC ha−1 during the historical period of 1971–2000; the average is 66.84 tC ha−1. In the future simulations, SCS decreases in most forest areas, and is described with GIS. In the near future (2021–2050) simulation, SCS ranges from 34.29 to 80.26 tC ha−1 under the condition of potential climate change; the average is 61.37 tC ha−1, which decreases by 8% compared with that of the historical period (1971–2000) (Figure 9). In the far future (2071–2100) simulation, SCS ranges from 35.39 to 76.34 tC ha−1 under the condition of potential climate change; the average is 52.81 tC ha−1, which decreases by 21% compared with that of the historical period (1971–2000).
As seen in Figure 10, the SCS of the four simulation points, A, B, C, and D, show a decreasing tendency during the period 2000–2100, which decreases by 3.58–7.29% and 13.17–18.52% in near future and far future simulations, respectively. The variation is presumably derived from the distinction of soil and climate. In the comparison of other simulated data, the simulated SCS of the temperate forest at point A during the historical period (1971–2000) is 77.57 tC ha−1, which is approximately 5% higher than the 73.8 tC ha−1 of the SCS simulated at the same point by the Lund–Potsdam–Jena Module, of the Community Land Model 3.5-DGVM, from [11].
Even though [15] concluded that a consensus has not yet emerged on the temperature sensitivity of soil carbon decomposition, in the decrease of SCS by the climate change, many researchers have reported that the SCS decreases with climate change [16,17,18,19,20].
Therefore, according to the long-term simulation results, SCS would be a key factor in the decline of the temperate forest carbon pool, which decreased continuously, and significantly, by 21% during the period 2000–2100 (quantitatively 14.03 tC ha−1).

3.3. Impact of Human Interference on Temperate Forest Carbon Pool

This study attempted to estimate how potential climate change, and human interference, influence change in the forest carbon pool, as the forest carbon pool is not only affected by potential climate change, it is also affected by human interference.
In the simulation results, NPP and SCS showed small, and large, decreasing tendencies, respectively. However, NPP and SCS were simulated with a significant decrease under the conditions of potential climate change and human interference, in the future simulation. Assuming that forest areas continue to decrease at the current decrease rate in the future, it is simulated that NPP and SCS decrease by 2836 TgC year−1 (17%↓)—2276 TgC year−1 (33%↓) and 29,753 TgC (21%↓)—20,437 TgC (46%↓), respectively, in temperate forest areas in the capital area of South Korea, as seen in Table 1. In addition, the effect of human interference contributes 83–93% and 61–54% to the NPP and SCS, respectively, during the period 2000–2100, as seen in Table 2.
The decrease in the forest carbon pool will result in a positive feedback to climate change, which is caused by the decrease of NPP and SCS. Consequently, if forest areas continue to decrease at the current level, due to human interference, it would further accelerate climate change. It is desirable for continuous forest management to be performed with some interest and support at both international and domestic levels, because a decline of carbon sequestration capacity in forests can be improved through forest area management, fire management, and fertilizer use and soil amendments [21]. Current scientific evidence suggests that managed, and even old growth forests (of the temperate and boreal zone), sequester carbon at rates of up to 6 ton ha, and that carbon pools are much smaller in the urban cities of Korea [22]. In addition, it is necessary to consider NPP and SCS simulation data when national and local land planning are established, as forests are an important and effective carbon sink.
For the effective reduction of carbon dioxide emissions in temperate forest areas, above all, it would be effective to control anthropogenic deforestation. It is concluded, that potential human interference (anthropogenic deforestation) has more influence on the decline of the temperate forest carbon pool than potential climate change in the capital area, where human interference is expected with national, and local, land planning.

Author Contributions

First author (S.-D.L.) contributed writing articles and analysis, and junior author (S.-S.K.) analyzed computer modeling based on IPCC scenarios and literature search.

Funding

Funding was provided by the Ministry of Science, Technology and Education (NRF-2017R1D1A1B03029300) as a Basic Science Research Program. The publishing fee of this paper was also supported by the DGIST R&D Program of the Ministry of Science, Technology and ICT (DGIST-18-IT-01).

Conflicts of Interest

The authors declare no conflicts of interest.

References

  1. Clark, J.S.; Vose, J.M.; Luce, C.H. Forest drought as an emerging research priority. Glob. Chang. Biol. 2016, 22. [Google Scholar] [CrossRef] [PubMed]
  2. Intergovernmental Panel on Climate Change. IPCC Fourth Assessment Report: Climate Change (AR4): Synthesis Report. 2007. Available online: http://www.ipcc.ch/pdf/assessment-report/ar4/syr/ar4_syr.pdf (accessed on 10 January 2011).
  3. Thomas, C.D.; Cameron, A.; Green, R.E.; Bakkenes, M.; Beaumont, L.J.; Collingham, Y.C.; Erasmus, B.F.N.; Siqueira, M.F.; Grainger, A.; Hannah, L.; et al. Extinction risk from climate change. Nature 2004, 427, 145–148. [Google Scholar] [CrossRef] [PubMed] [Green Version]
  4. Carpenter, K.E.; Abrar, M.; Aeby, G.; Aronson, R.B. One-third of reef-building corals face elevated extinction risk from climate change and local impacts. Science 2008, 321, 560–563. [Google Scholar] [CrossRef] [PubMed]
  5. Pancholi, S.; Yigitcanlar, T.; Guaralda, M. Public space design of knowledge and innovation spaces: Learnings from Kelvin grove Urban Village, Brisbane. J. Open Innov. Technol. Mark. Complex. 2015, 1, 1–17. [Google Scholar] [CrossRef] [Green Version]
  6. Lara, A.; Costa, E.; Furlani, T.; Yigitcanlar, T. Smartness that matters: Comprehensive and human-centred characterisation of smart cities. J. Open Innov. Technol. Mark. Complex. 2016, 2, 1–13. [Google Scholar] [CrossRef]
  7. Forestry Statistical Yearbook. 2004–2010. Available online: http://www.forest.go.kr/foahome/user.tdf?a=common.HtmlApp&c=1001&page=/html/kor/information/stat/stat_030_010.html&mc=WWW_INFORMATION_STAT_040 (accessed on 10 January 2011). (In Korean).
  8. Nijkamp, P.; Pepping, G. A meta-analytical evaluation of sustainable city initiatives. Urban Stud. 1998, 35, 1481–1500. [Google Scholar] [CrossRef]
  9. Kim, J.; Kang, M.S.; Kang, S.K.; Kang, H.S.; Ku, J.W.; Kim, R.H. CarboKorea: Development of Carbon Cycle Monitoring and Assessment Technology by Integrating KoFlux Footprint, MODIS/IKONOS Satellite Image and Ecohydrology Modeling, Korea Ministry of Environment; Ministry of Environment: Seoul, Korea, 2007.
  10. Lim, H.J.; Lee, Y.H.; Kwon, H. Evaluation of Community Land Model version 3.5-Dynamic Global Vegetaion Model over Deciduous Forest in Gwangneung, Korea. Korean J. Agric. For. Meteorol. 2010, 12, 95–106. [Google Scholar] [CrossRef]
  11. Parton, W.J.; Schimel, D.S.; Ojima, D.S.; Cole, C.V. A general study model for soil organic matter dynamics, sensitivity to litter chemistry, texture, and management. In Quantitative Modeling of Soil Forming Processes; Special Publication 39; Soil Science Society of America (SSSA): Madison, WI, USA, 1994; pp. 147–167. [Google Scholar]
  12. Neilson, R.P. A model for predicting continental scale vegetation distribution and water balance. Ecol. Appl. 1995, 5, 362–385. [Google Scholar] [CrossRef]
  13. Lee, M.; Lee, W.K.; Song, C.C.; Lee, J.H.; Choi, H.A.; Kim, T.M. Spatio-temporal change prediction and variability of temperature and precipitation. Korea J. GIS Assoc. 2007, 15, 267–278. [Google Scholar]
  14. Park, N.W.; Jang, D.H. Mapping of temperature and rainfall using DEM and multivariate kriging. Korean Geogr. Soc. 2008, 43, 1002–1015. [Google Scholar]
  15. Davidson, A.E.; Janssens, I.A. Temperature sensitivity of soil carbon decomposition and feedbacks to climate change. Nature 2006, 440, 165–173. [Google Scholar] [CrossRef] [PubMed] [Green Version]
  16. Trumbore, S.E.; Chadwick, O.A.; Amundson, R. Rapid exchange between soil carbon and atmospheric carbon dioxide driven by Temperature Change. Science 1996, 272, 393–396. [Google Scholar] [CrossRef]
  17. Melillo, M.J.; Steudler, P.A.; Aber, J.D.; Newkrik, K.; Lux, H.; Bowles, F.P.; Catricala, C.; Magill, A.; Ahrens, T.; Morrisseau, S. Soil warming and carbon-cycle feedbacks to the climate system. Science 2002, 298, 2173–2176. [Google Scholar] [CrossRef] [PubMed]
  18. Neff, C.J.; Hooper, D.U. Vegetation and climate controls on potential CO2, DOC and DON production in northern latitude soils. Glob. Chang. Biol. 2002, 8, 872–884. [Google Scholar] [CrossRef]
  19. Peng, C.; Zhou, X.; Zhou, S.; Wang, X.; Zhu, B. Quantifying the response of forest carbon balance to future climate change in Northeastern China: Model validation and prediction. Glob. Plan. Chang. 2009, 66, 179–184. [Google Scholar] [CrossRef]
  20. Pan, Z.; Andrade, D.; Segal, M.; Wimberley, J.; McKinney, N.; Takle, E. Uncertainty in future soil carbon trends at a central U.S. site under an ensemble of GCM scenario climates. Ecol. Model. 2010, 221, 876–881. [Google Scholar] [CrossRef]
  21. Lal, R. Forest soils and carbon sequestration. For. Ecol. Manag. 2005, 220, 242–258. [Google Scholar] [CrossRef]
  22. Yang, S.D.; Sheng, J.; Adamowski, Y.; Gong, J.; Cao, J. Effect of Land Use Change on Soil Carbon Storage over the Last 40 Years in the Shi Yang River Basin, China. Land 2018, 7. [Google Scholar] [CrossRef]
Figure 1. Study area: The capital area of Seoul in the center, and vicinities, of South Korea (⬤: selected points).
Joitmc 04 00048 g001
Figure 2. Distribution of mean air temperature in the capital area.
Joitmc 04 00048 g002
Figure 3. Distribution of monthly mean accumulative precipitation in the capital area.
Joitmc 04 00048 g003
Figure 4. Change of future air temperature and precipitation relative to historical period (1971–2000) predicted by the Korea National Institute of Meteorological Research with the A1B scenario presented by IPCC. (Near future: 2021–2050, Far future: 2071–2100).
Joitmc 04 00048 g004
Figure 5. The simulation results of Net Primary Productivity (NPP) in the capital area.
Joitmc 04 00048 g005aJoitmc 04 00048 g005b
Figure 6. The results of NPP at selected points and in the capital area. (Before: 1971–2000, Near future: 2021–2050, Far future: 2071–2100).
Joitmc 04 00048 g006
Figure 7. Distribution of NPP change in the capital area relative to the historical period (1971–2000).
Joitmc 04 00048 g007
Figure 8. Simulation results of Soil Carbon Storage (SCS) in the capital area.
Joitmc 04 00048 g008aJoitmc 04 00048 g008b
Figure 9. Distribution of Soil Carbon Storage (SCS) change in the capital area relative to the historical period (1971–2000).
Joitmc 04 00048 g009
Figure 10. Results of SCS at selected points and the capital area. (Before: 1971–2000, Near future: 2021–2050, Far future: 2071–2100).
Joitmc 04 00048 g010
Table 1. Calculations of the forest carbon pool considering human interference.
Before (2000)Near Future (2050)Far Future (2100)
Without Human interference *NPP (TgC year−1)340133053322
SCS (TgC)37,76634,67629,839
Considering Human Interference **NPP (TgC year−1)340128362276
SCS (TgC)37,76629,75320,437
* Original simulation data were multiplied by the 565,024 ha of forest region in the capital area from the 2009 Land Cover Map by the Korea Ministry of Environment. ** Forest land use change (1940 ha/year) and fire damage area (16.4 ha/year) from the Forestry Statistical Yearbook (2004–2010) by the Korea Forest Service were considered in human interference.
Table 2. Contribution of potential anthropogenic deforestation and climate change to the forest carbon pool.
Decline of NPPContribution of Climate Change (%)Contribution of Human Activity (%)
Near future (2050)1783
Far future (2100)793
Decline of SCSContribution of Climate Change (%)Contribution of Human Activity (%)
Near future (2050)3961
Far future (2100)4654

