Experimental Research on Power Transformer Vibration Distribution under Different Winding Defect Conditions


Department of Instrument Science and Engineering, Zhejiang University, Hangzhou 310027, China
*
Author to whom correspondence should be addressed.
Electronics 2019, 8(8), 842; https://doi.org/10.3390/electronics8080842
Submission received: 25 June 2019
/
Revised: 19 July 2019
/
Accepted: 26 July 2019
/
Published: 28 July 2019
(This article belongs to the Section Power Electronics)
Abstract
:Vibration analysis is one of the important tools for the transformer winding faults diagnosis. Previous researchers have proved that the vibration spatial distribution of the winding is significantly influenced by the winding defects for the open circuit condition. In order to study the effects of the loading current on the winding vibrations under different mechanical conditions, experiments were designed and operated on a three-phase transformer winding to analyze the winding vibration distribution under different winding defect cases. Further, to study to what extent the mechanical defects and the loading current influence characteristics of the vibration distribution on the tank, the tank vibration distribution under various winding defects and different loading currents were also measured and discussed. In addition, the possibility of detection of transformer winding faults based on tank vibration spatial distribution characteristics was also discussed.
1. Introduction
As crucial equipments of power transmission systems, failures of power transformers will lead to severe accidents and considerable economic losses [1,2]. Winding is one of the most important and vulnerable internal components of power transformers, and encounters with various kinds of faults and defects, such as deformation, shift and clamping force looseness. The faults and defects will lead to the sudden breakdown of power transformers [3,4]. Effective online monitoring and reliable fault detection for power transformer windings have raised attention in recent years.
The vibration analysis method is an effective tool for detecting internal faults in transformers, via analysis of changes in the vibration response of the transformer tank. Changes in the mechanical properties of the windings and core will ultimately affect the tank vibration response [5].
The key point of detecting potential transformer faults is to extract features in the signal that are related with the fault characteristics. Various signal processing techniques are applied for feature extraction. The most common method is to analyze the frequency spectrum of the vibration signal. Berler applied the Fourier Transform to the transformer vibration signals, calculated the energy of the most important harmonics, and figured out that the worse the state of fixations, the higher the energy of the harmonics will be [6]. Bartoletti noted that aged and abnormal transformers both show an increase of high-order harmonics in the vibration compared with the new transformers, and proposed parameters based on the signal distortion rate to evaluate the transformer state [7]. Their work had been improved by Hong et al., who found that the number of frequency components contained in the transformer vibration signal will increase due to the defects, resulting in a decrease in its regularity. A measure based on the information entropy was thus introduced to represent the signal irregularity [8]. Moreover, occurrence of the mechanical defect will also lead to the increase or decrease of energy of different frequency bands. As a result, time frequency analysis methods are applied to detect the transformer defects. Ji et al. introduced the wavelet package transform to calculate energy features of different frequency bands, and compare the energy features of normal transformer vibration signals with that of defective ones for fault detection [9]. Chen et al. employed the adaptive Hilbert-Huang transform (HHT) technique to obtain instantaneous frequencies and the time-frequency-energy distribution, identified the IMFs representing the changes of core clamping pressure according to the core vibration behavior, and constructed a feature vector to quantify the clamping pressure. [10]. In some other researches, features in the signal time sequence that contains information of non-stationary and nonlinear draw attention of scholars. A healthy transformer can be regarded as a deterministic system, and always produces the periodic vibration signal. When the transformer structures become anomalous, the system may become unpredictable. Hong introduced the recurrence plot (RP) as a tool to analyze the stationary of the transformer vibration, and proposed a measure of system determinism to demonstrate the degree of the stationary [11]. Lai et al. introduced the statistics of skewness and kurtosis to characterize the impulse features that related to the failure of core and winding [12].
However, most feature extraction algorithms are based on the analysis of the vibration detected from the independent measurement point. According to some previous researches, the vibration at specific measuring locations on the transformer tank shows different sensitivities. Few of the feature extraction algorithms have comprehensively considered the relationship between vibrations from measuring points of different spatial location. Garcia suggested that adequate points on the transformer tank were required for better vibration behavior representation [13,14]. Ji emphasized that in the condition assessment process of the transformer windings and core, vibration signals measured from different positions on the tank showed different characteristics. It is unreliable to jump to the diagnosis conclusion only based on an individual measurement point [15]. Ming studied the vibration transmission properties, and measured the vibration transmission functions at different locations on the transformer tank, and found that vibration transmission functions vary with different locations [16]. The above mentioned works have investigated the vibration characteristics of different measuring points on the transformer tank, and emphasized the necessity of the multiple-point measurement and study of spatial information from vibration signals at different locations. So it is necessary to further study the spatial distribution characteristics of transformer vibrations, and the relationships between vibration spatial properties and mechanical health conditions.
Our previous work studied the vibration spatial distribution characteristics of a single-phase experimental transformer winding under normal and abnormal operating conditions [17]. However, these results were collected from the winding surface and only for the open circuit condition, and it is worthwhile to discuss the effects of the loading current on the vibrations both from the winding and the tank under different mechanical health conditions.
In this paper the vibration spatial distribution characteristics both on the windings and tank under different loading currents were further studied, respectively. In order to investigate the vibration performance under abnormal operating conditions, both the winding vibration and tank vibration were measured as various artificial faults were introduced into the winding. The results were then analyzed by comparing the vibration patterns with and without faults under different loading currents. In addition, the possibility of detection of the transformer winding faults based on the tank vibration spatial distribution was also discussed.
2. Vibration Transmission Paths
For a transformer that is working under normal operation conditions, the current in the winding and its distributed leakage flux will excite an electric distribution force , and bring out the winding vibration. Additionally, the distribution function of the leakage flux will change in correspondence with any winding structural changes as well as the vibration response function of the winding. As a result, the distributed vibration on the winding strongly depends on the mechanical properties of the winding [18].
In addition, vibrations from the main parts of a transformer are transmitted to the tank through different paths, shown as Figure 1. Considering the vibration coupling paths from the main parts to the tank, the vibration at the location xT from the winding can be expressed as in Equation (1):
In the equation above, FW(xw|t) is the electric distribution force at position xw of the winding, is the impulse response function of the winding (from the winding force to the tank vibration via the index k path). Nw is the number of the transmission paths of winding vibrations [19].
It can be seen that the structural changes of windings will cause variations of the inner transfer characteristics hwk. Moreover, the vibration transmission property hwk for each observation is different from each other. Therefore, the structural changes of windings will lead to a spatial difference among vibrations at different measurement points.
As a result, it is necessary to investigate the spatial performance of winding vibrations and tank vibrations under abnormal operating conditions.
3. Experimental Measurement of Transformer Winding Vibration Spatial Distribution
Previous research has shown that winding defects have a significant influence on the winding vibration distribution under the open-circuit condition [17]. However, effects of the loading current on the winding vibration distribution were hardly considered. In such case, the performance of the vibration distribution of normal/abnormal windings under different loading currents should be investigated.
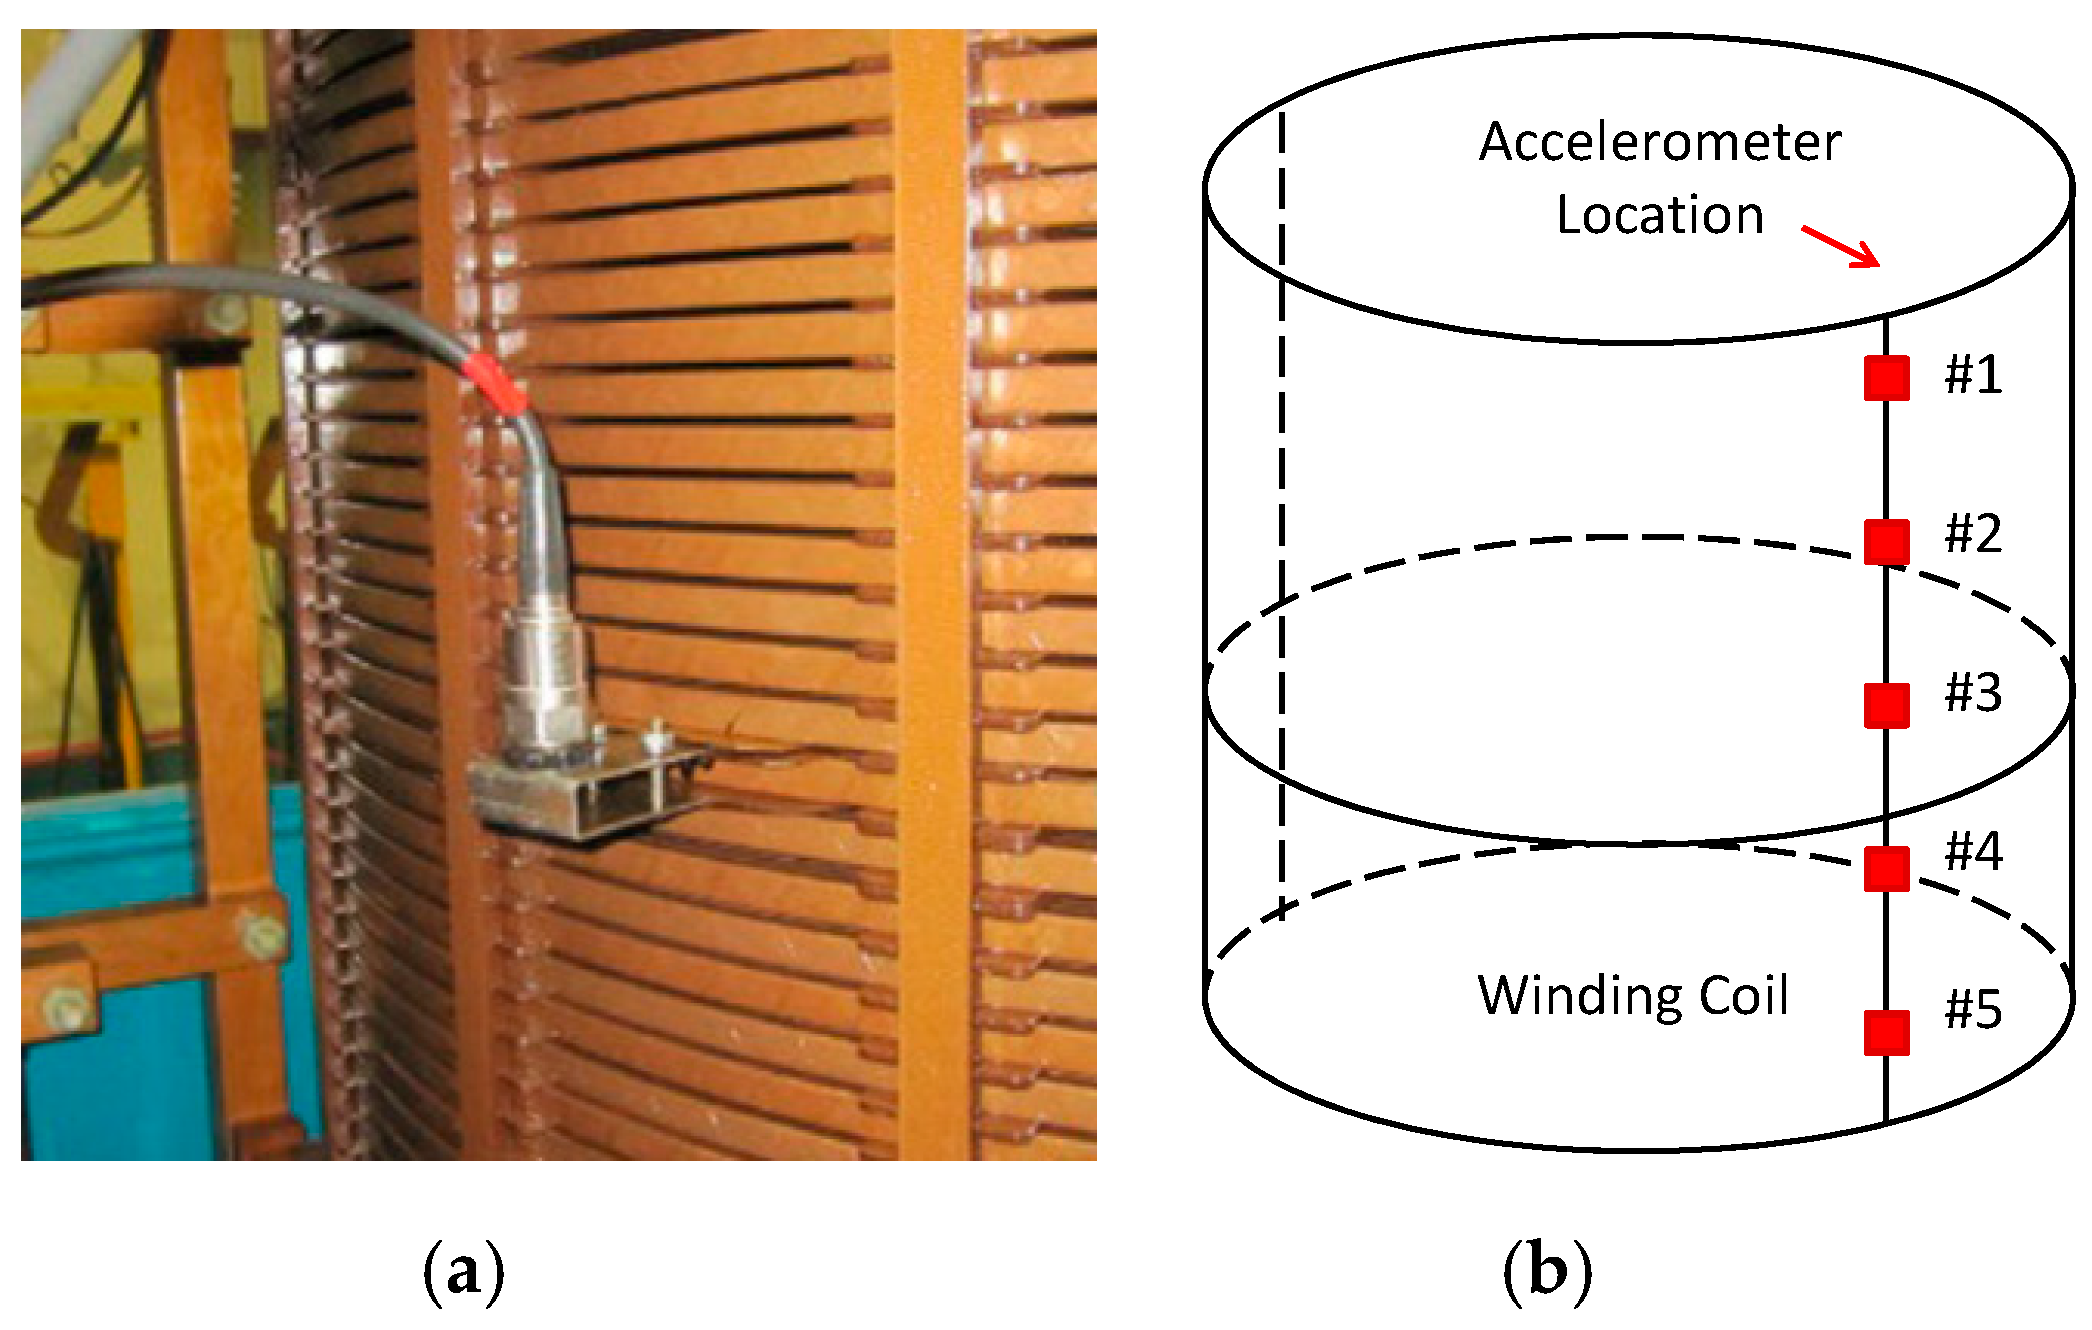
A set of experiments were carried on a winding of an 110 kV three phase transformer of type SZ9-50000/110 (manufactured by HuaPeng Cooperation, Changzhou, Jiangsu, China), in which S represents the three-phase transformer, Z represents the on-load voltage regulation, nine is the design index, 50,000 means the rated capacity is 50,000 kV·A, and 110 represents the voltage of the high voltage side is 110 kV. A single phase winding consists of a low voltage winding and a high voltage winding, for low voltage winding, the internal diameter is 656 mm, and the external diameter is 822 mm, for high voltage winding, the internal diameter is 898 mm and the external diameter is 1119 mm. Piezoelectric accelerometers of model 601A12 manufactured by the PCB® corporation (Depew, NY, USA) were used in the experiments to collect the vibration distribution information, and arranged in a row radial direction of the winding, and fixed at certain measuring points as demonstrated in Figure 2. The sensitivity of the acceleration sensor was 500 mV/g, and the sampling frequency adopted in the experiments was 10 kHz.
In order to obtain the winding vibration, the low-voltage winding was short-circuited, and a low voltage was applied on the high-voltage winding. To study the relationship of winding defects and the winding vibration distribution with the influence of loading currents, winding looseness conditions were artificially introduced on the target winding. Additionally, the applied current in the normal/abnormal conditions was changed from 20% of the rated loading current to 100% of the rated loading current, an increase by 10% of the rated loading current each time.
3.1. Case 1: Winding Vibration under Normal Conditions
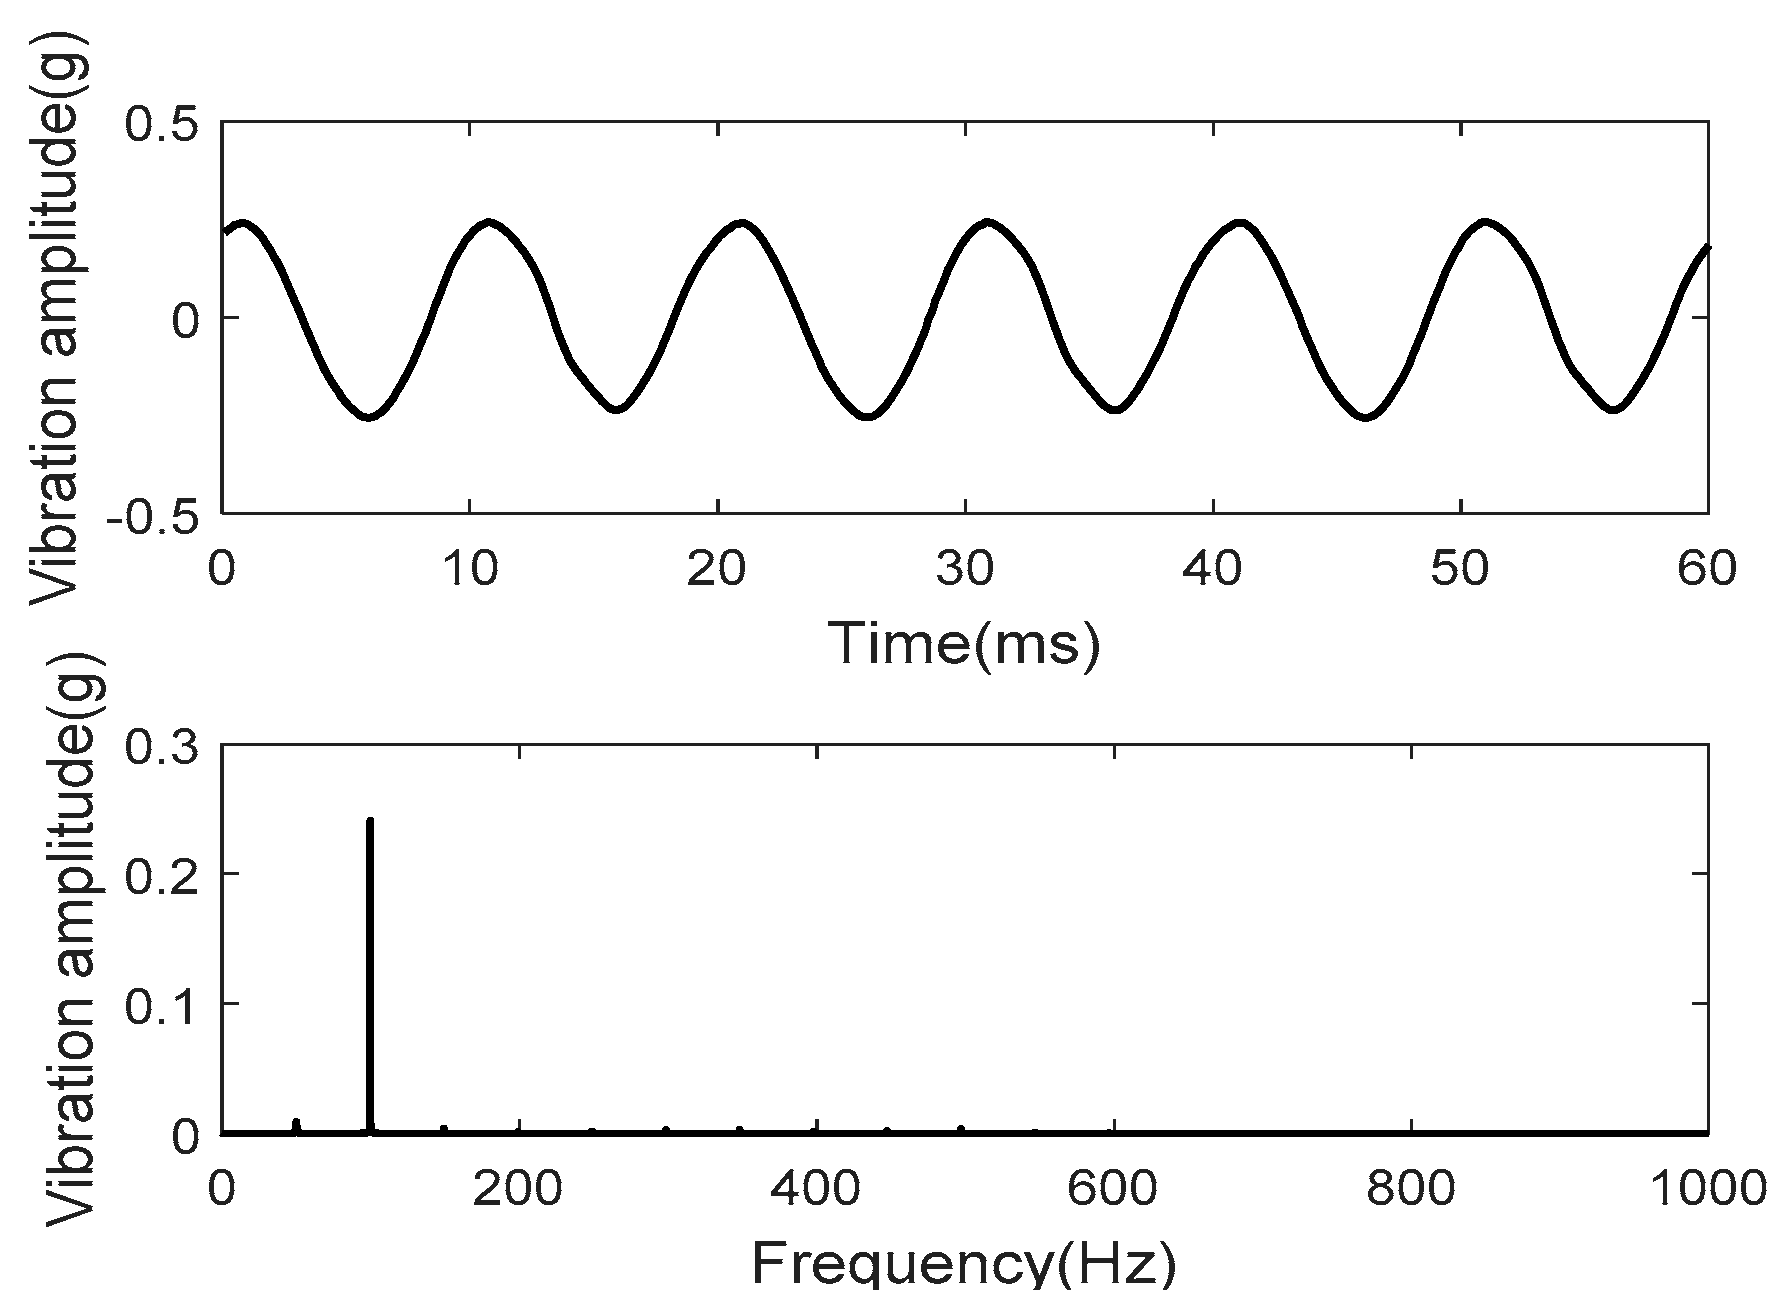
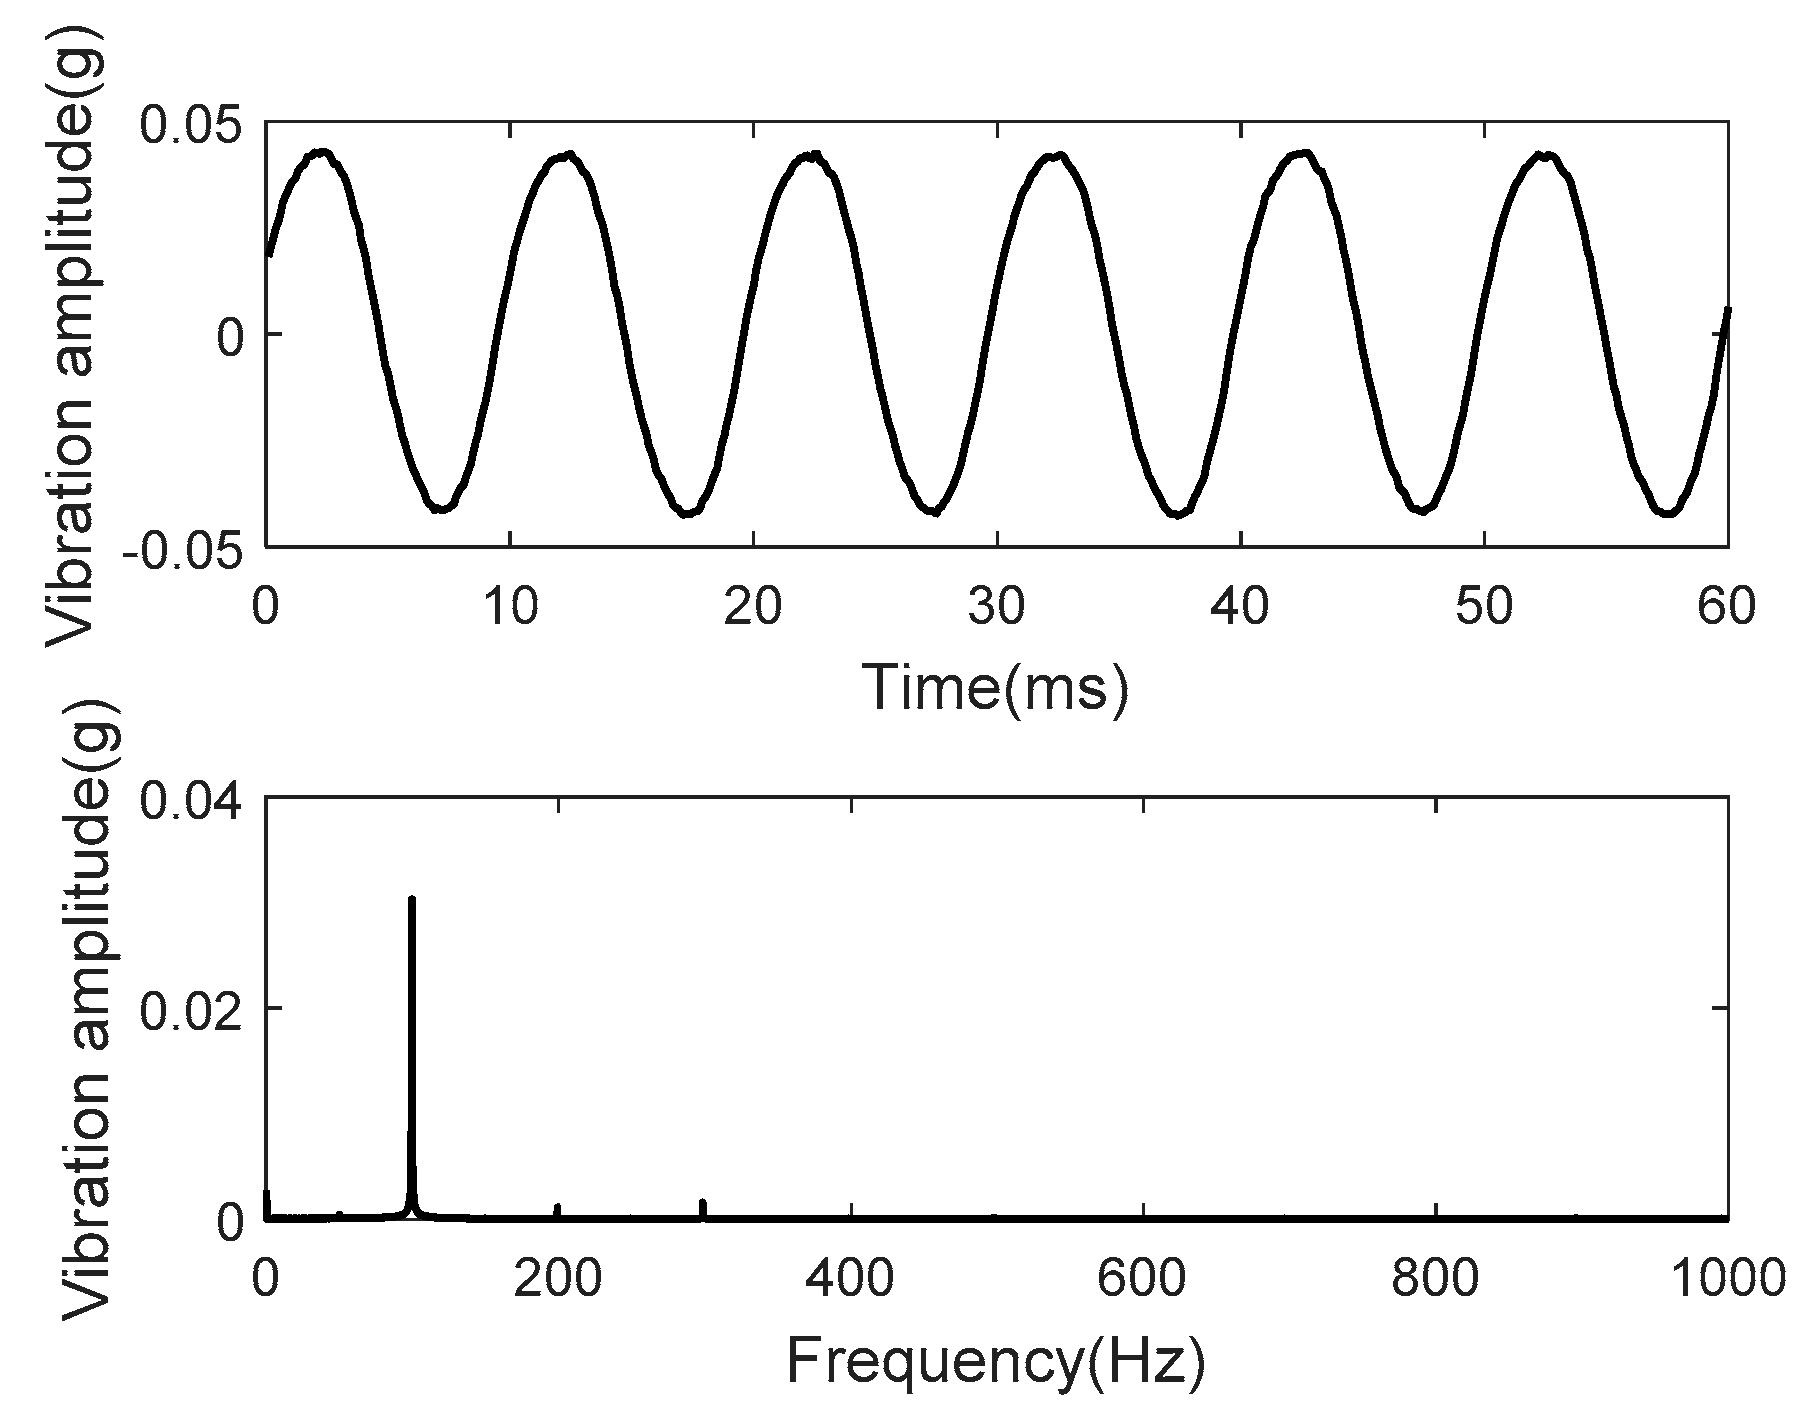
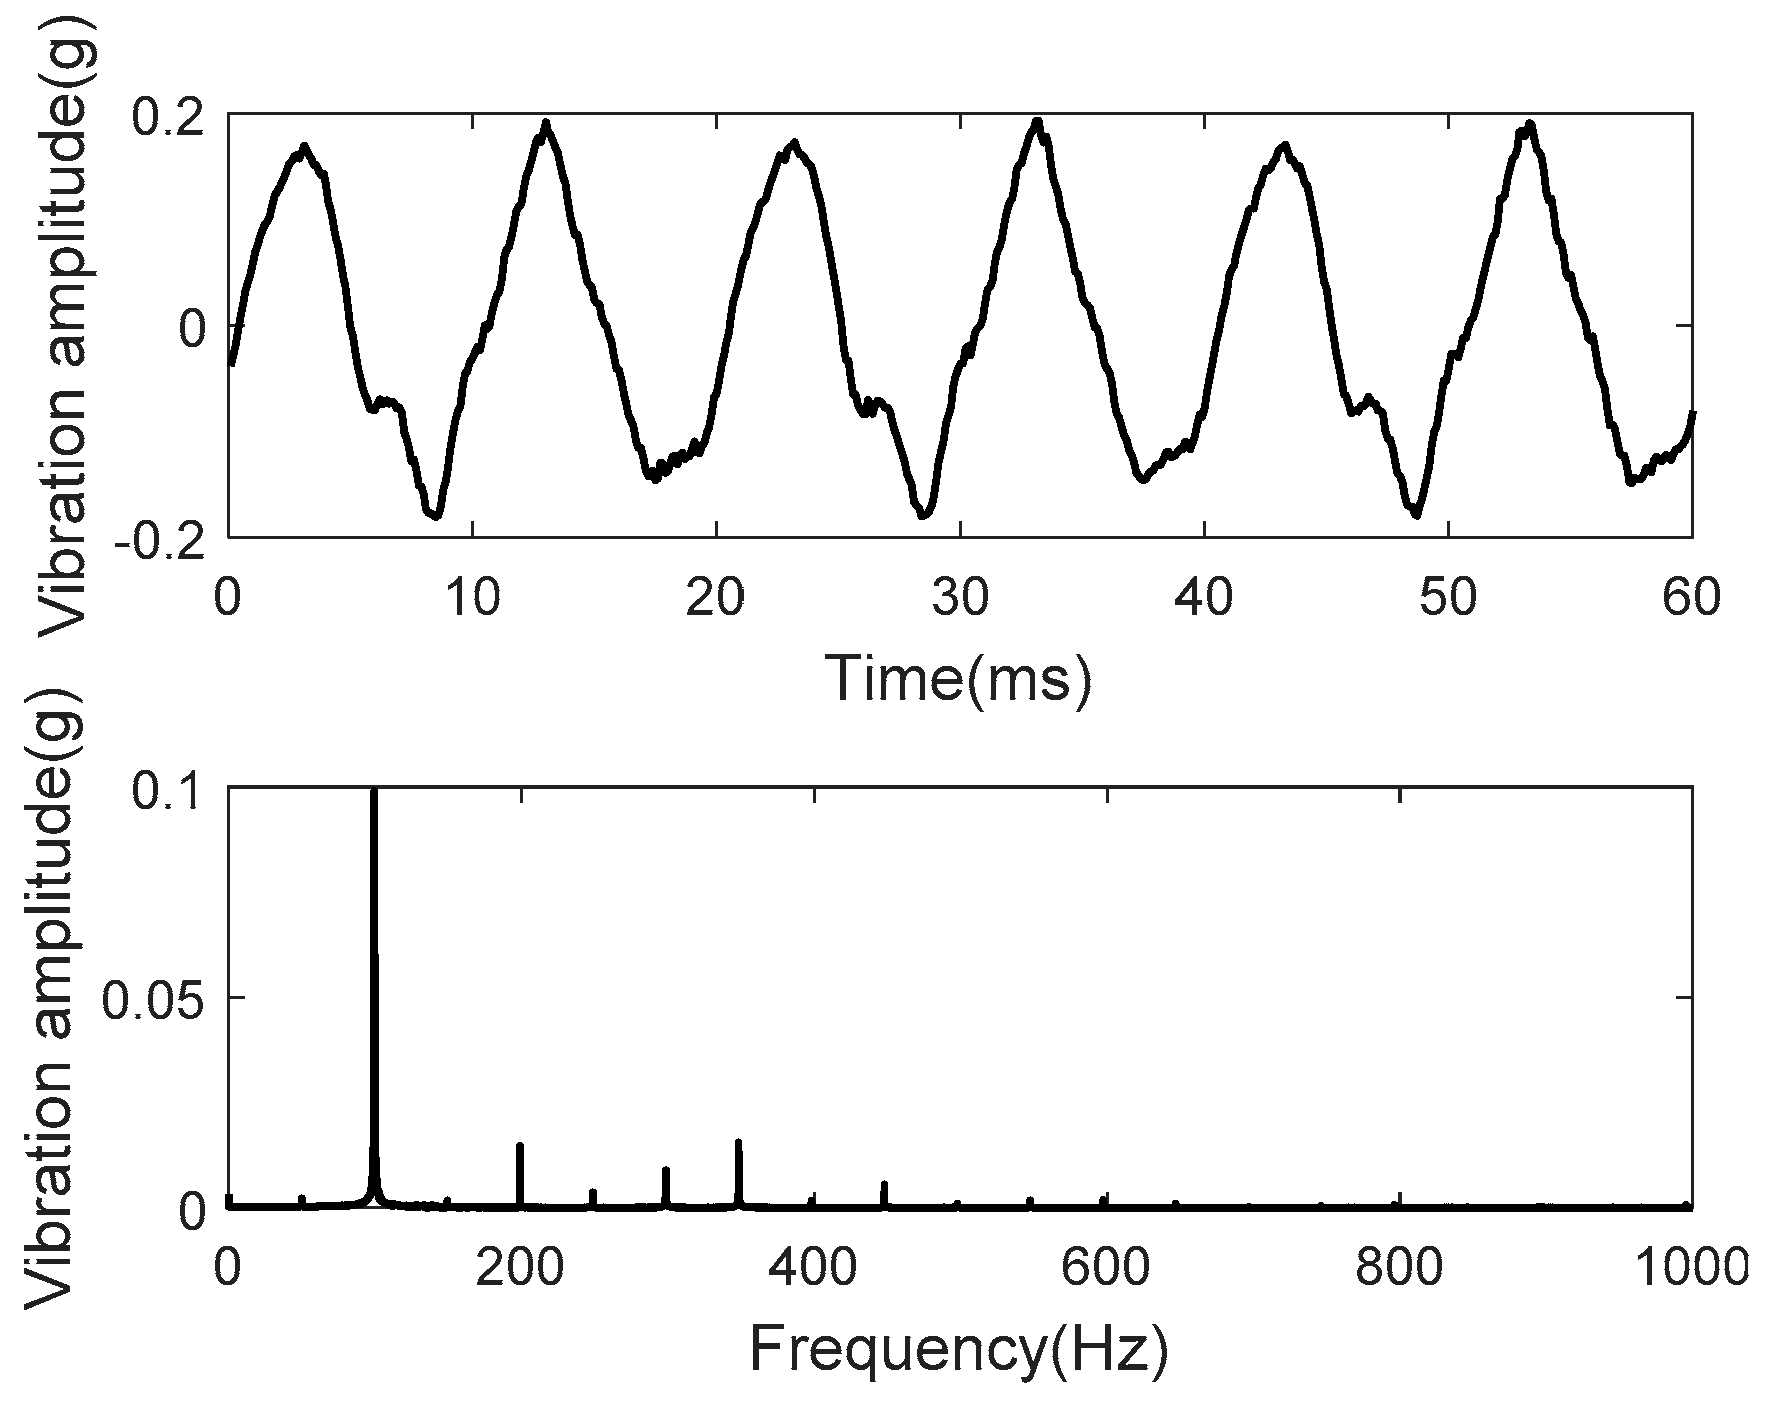
Firstly, the winding vibration under normal conditions was collected. Figure 3 shows the vibration signature and its frequency spectrum collected at measuring point #5. It can be found that, under normal conditions, the vibration signal mainly consists of 100 Hz fundamental harmonic components, since the winding vibration mainly depends on the square of the current of 50 Hz through the winding [20].
Assume that m × n sensors are arranged on a surface (m is the number of the rows of the sensors and n is the number of columns of the sensors), a spatial matrix of the winding vibration at certain frequency f is described by:
which describes the winding vibration distribution pattern at frequency f.
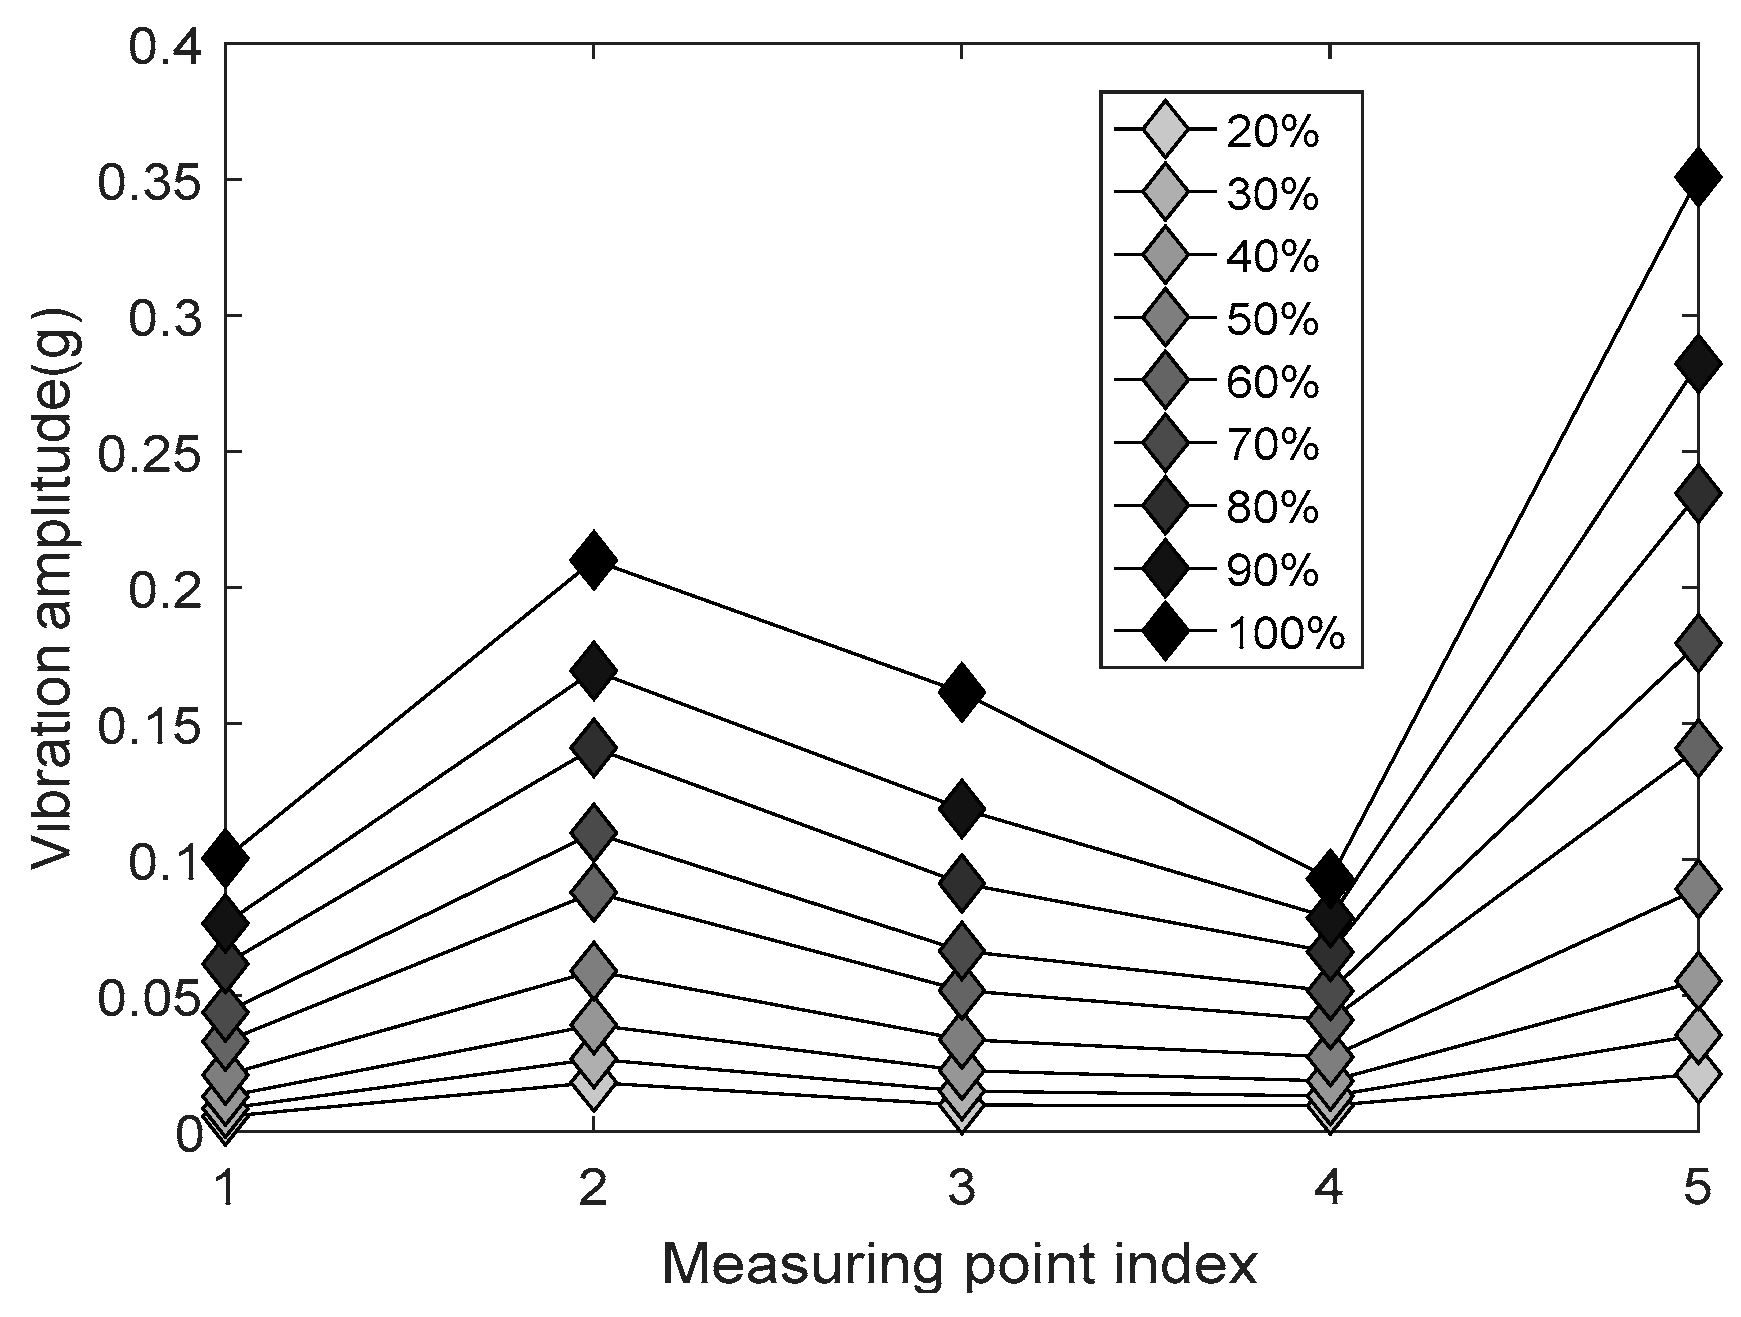
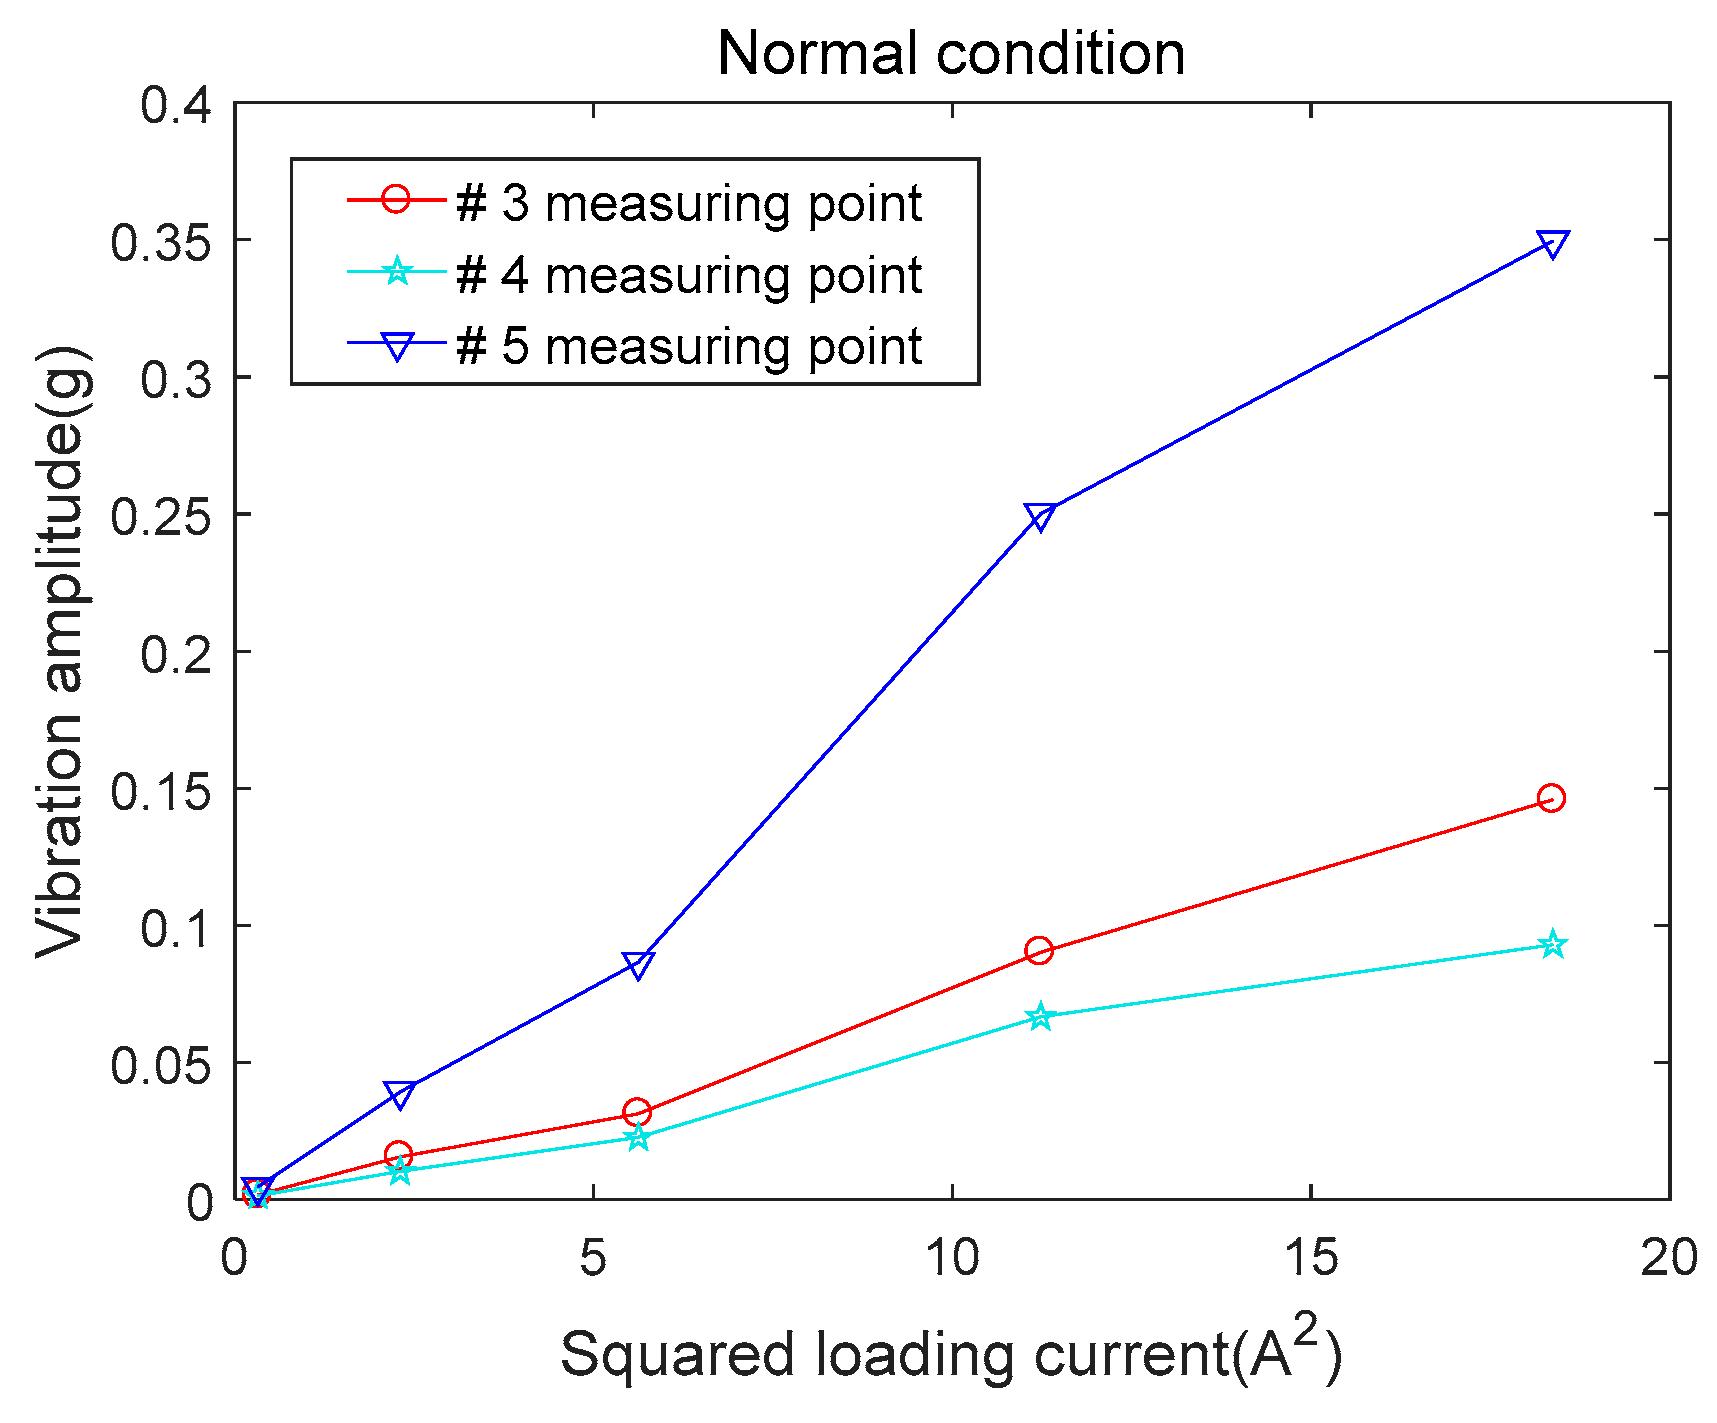
Considering that 100 Hz is regarded as the main harmonic of the winding vibration, the amplitude of the vibration at 100 Hz of all measuring points is presented as in Figure 4. It is obvious that the vibration distribution under different loading currents follows almost the same pattern, since the amplitude of the 100 Hz vibration at all points are nearly proportional to the square of the current for a healthy winding. Figure 5 shows the winding vibration trends with increasing loading currents under normal conditions of the 100 Hz vibration amplitude at different measuring points when the winding was operated under normal conditions. The amplitudes linearly increased with the square of the current.
3.2. Winding Vibration under Looseness Conditions
Winding looseness is a typical category of winding defects, two kinds of common winding looseness conditions are introduced on a winding of the experiment transformer.
3.2.1. Case 2: Clamping Force Looseness
In this case, the clamping force of the winding was loosed to 60% of the fully tightened rated value (240 kN) by applying an actuating device of winding clamping forces, as shown in Figure 6. The winding clamping force refers to the force applied at the top of the winding by the clamping structures, which ensure that windings are clamped to resist the large electromagnetic forces during a short circuit. In addition, the clamping force may directly affect the stiffness of the winding, which determines whether the winding can avoid the resonance phenomenon. Considering that the looseness of the winding clamping structure is a serious problem for a transformer working normally, this paper attempts to study the vibrations distribution characteristics under loosened conditions.
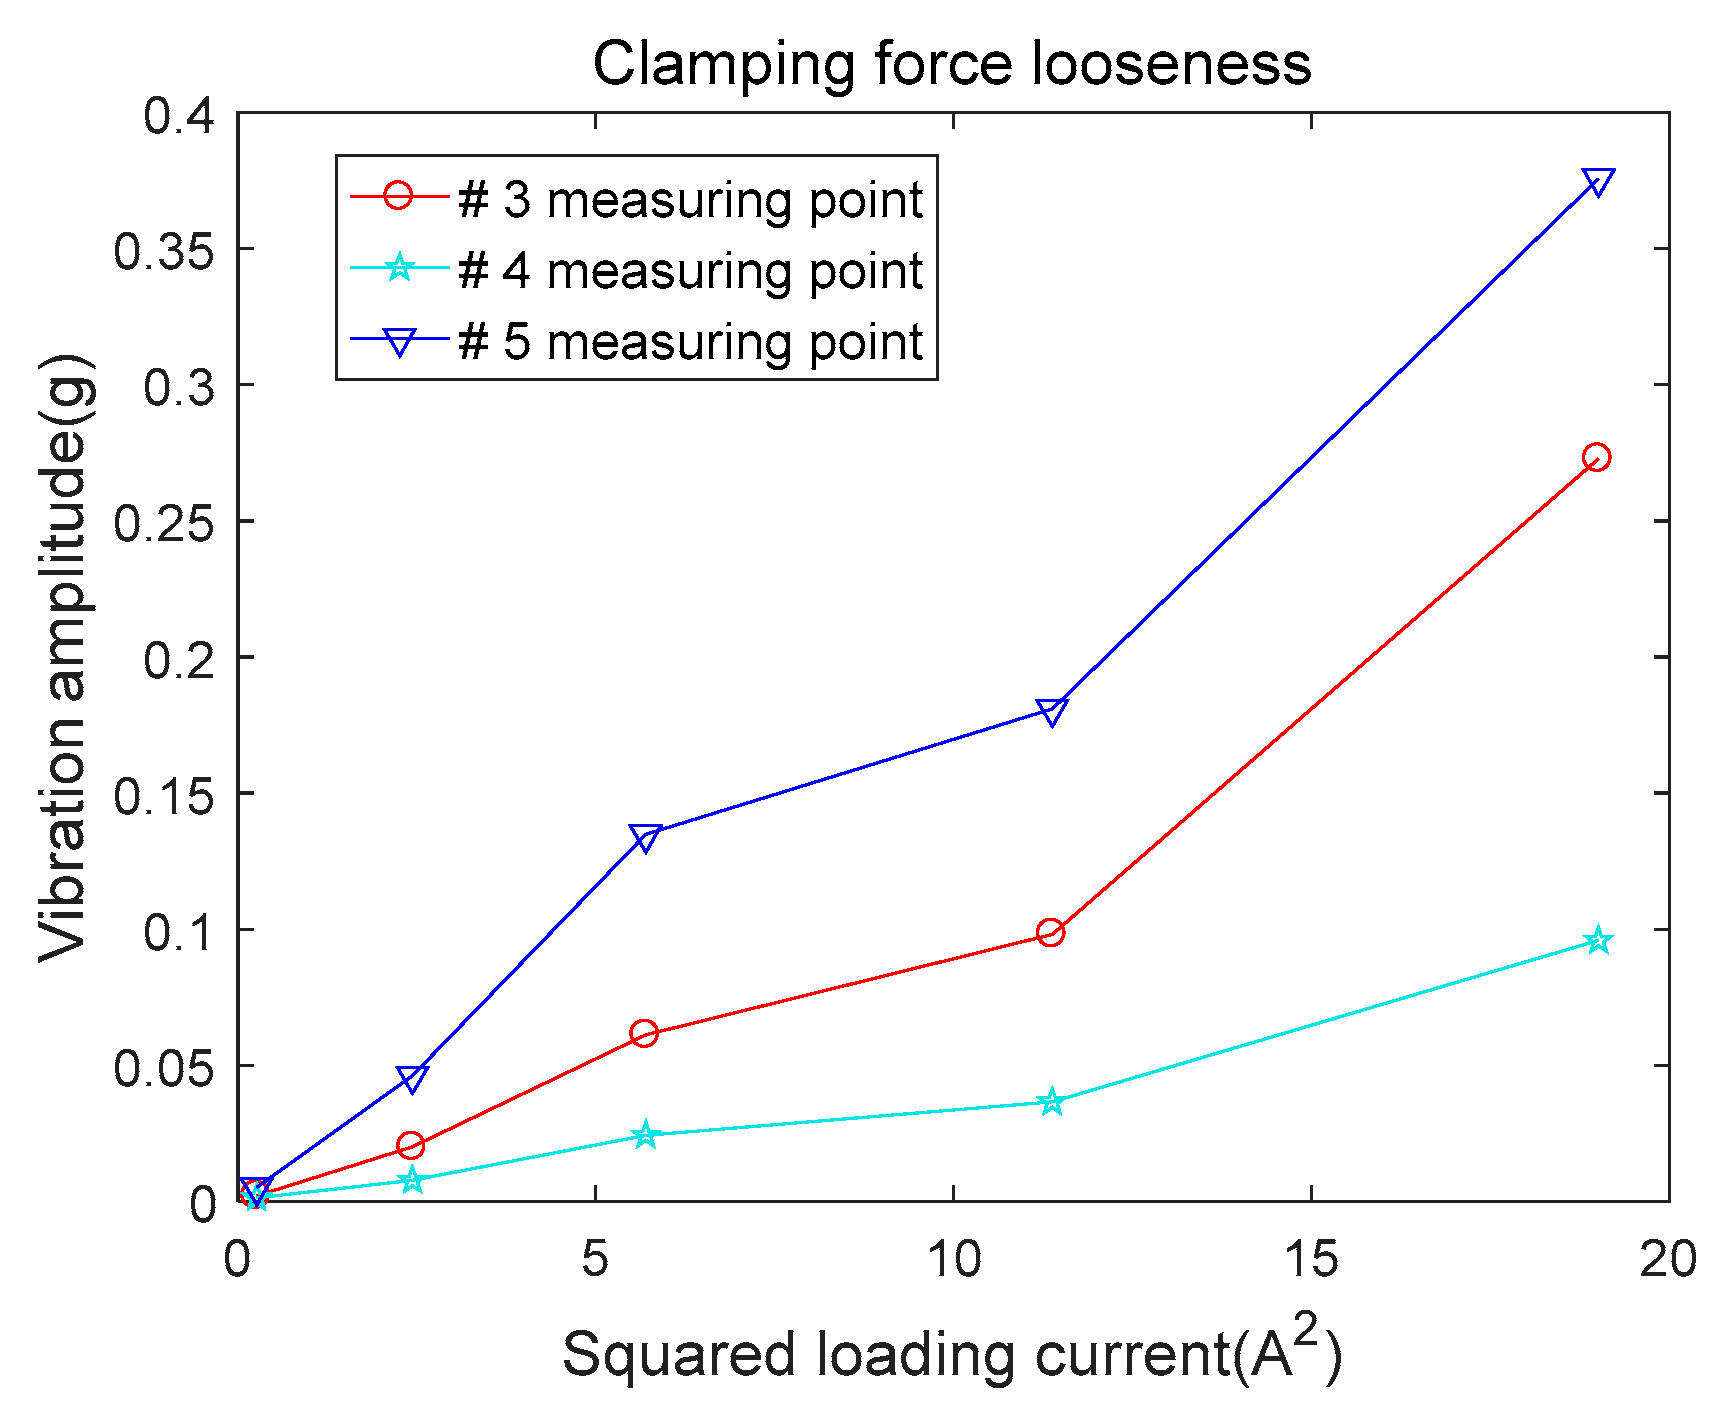
Figure 7 shows the vibration of the winding under the loosened conditions at measuring point #2. Higher order harmonics can be found in the vibration spectrum, due to the nonlinearity introduced by the mechanical defects. In Figure 8, patterns of the 100 Hz vibration amplitude distribution under clamping force looseness and different winding currents are presented. It suggests that the global vibration distribution patterns are not changed significantly compared with those in the normal case. However, the vibration amplitude, at the middle and bottom parts of the winding, varies dramatically with the increasing winding currents. Additionally Figure 9 shows the trend of the 100 Hz vibration amplitude at different measuring points. With the existence of looseness defects, the nonlinearity of the winding vibration trend at the bottom becomes more obvious, although amplitudes at some measuring points still linearly increase with the increment of the squared current.
3.2.2. Case 3: Global Looseness
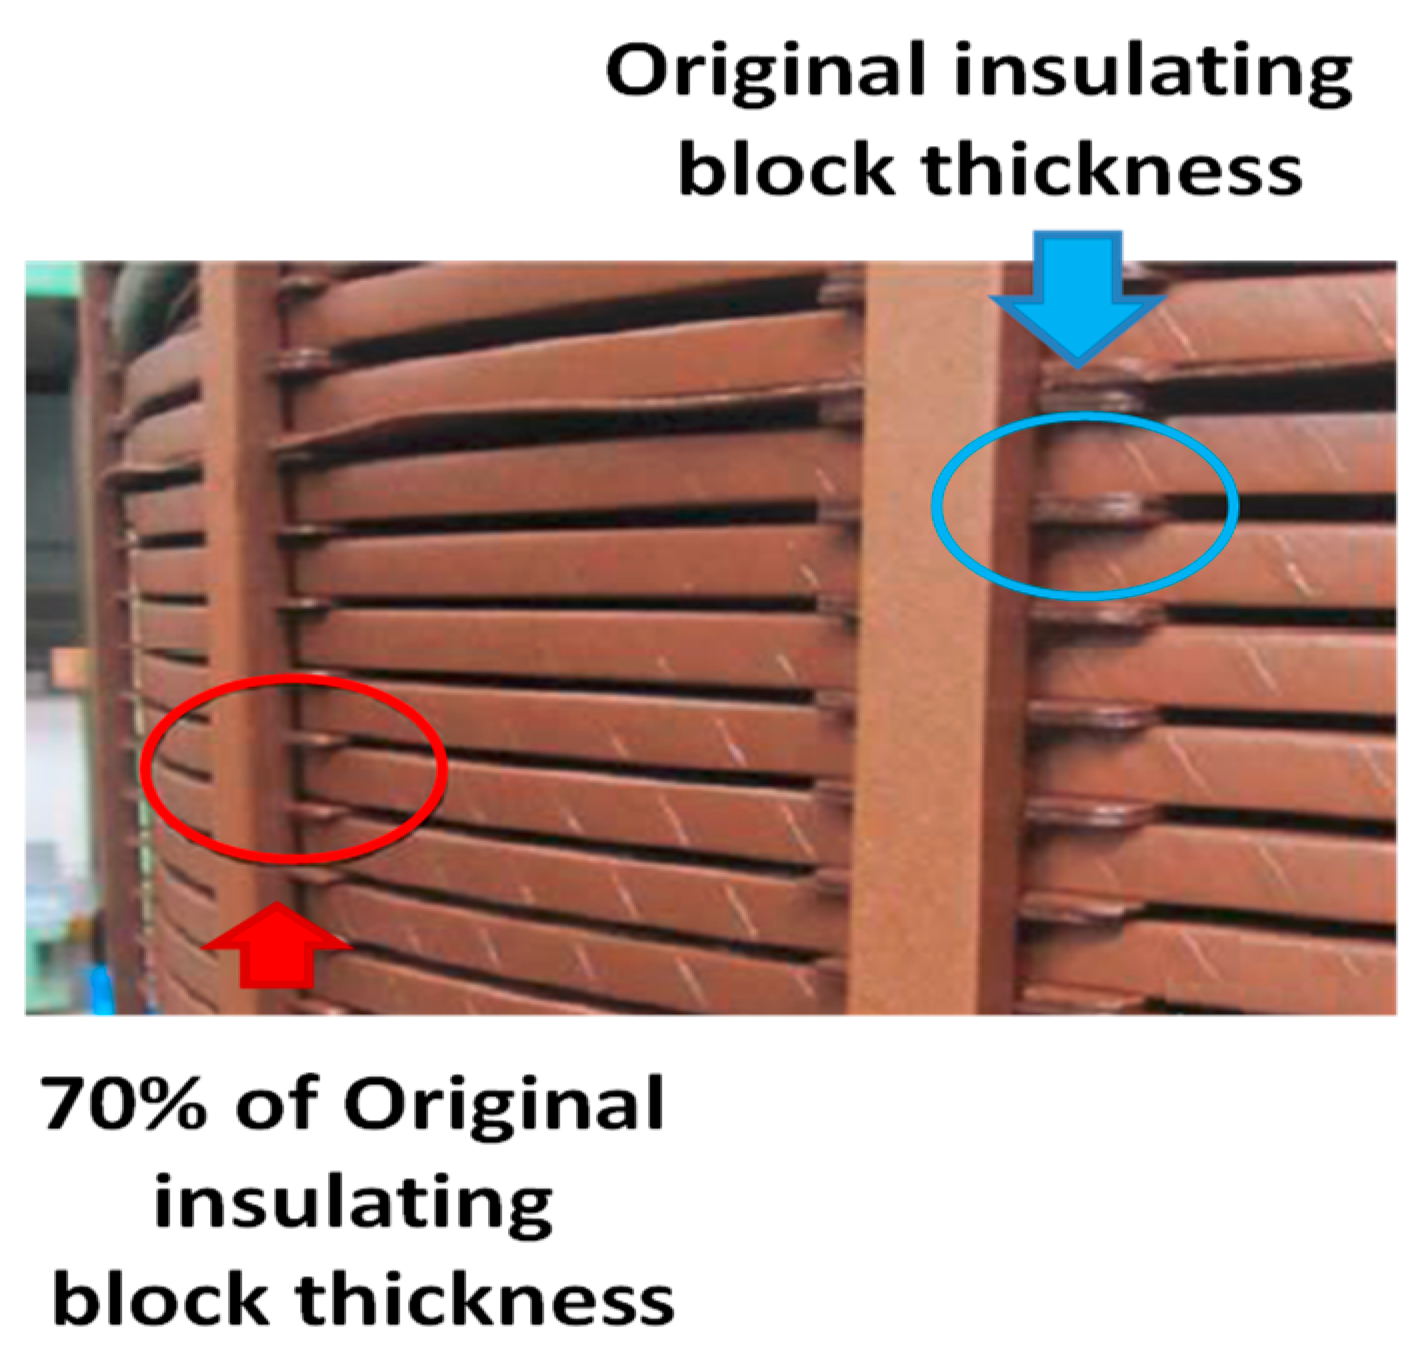
Global looseness is a severer mode of the winding looseness defect, and will diminish the winding’s capacity to withstand abrupt short circuits. In the third case, global looseness was simulated by replacing the insulating spacers with a thinner spacer (2 mm, 70% of the origin value), a total of 87 levels and 16 columns of insulating spacers exist in a winding, the insulating spacers from level 18 to level 72 in two columns are replaced with thinner ones, and the supporting bars of the two columns are also removed, as shown in Figure 10.
Additionally, it is noted that the total height of the winding remained unchanged during the global looseness simulation. The vibration at measuring point #2 under global looseness conditions is plotted in Figure 11. The significant distortion and harmonics can be observed from the vibration waveform and spectrum. It indicates that replacement of the insulation spacer has a significant impact on the mechanical properties of the winding structure, which brings about strong nonlinearity of winding vibrations.
Figure 12 demonstrates that the vibration distribution patterns under the global looseness conditions become quite different with those in normal conditions. What is most remarkable is that the vibration pattern varies dramatically with the increasing winding currents. For example, the vibration amplitude at point #5 shows an equal or smaller amplitude than that at point #3 with the loading current (less than 50% of the rated value), while the vibration amplitude at point #5 becomes extremely large, almost 1.5 times of that of point #3 for the higher loading current. Additionally, Figure 13 shows the trend of the 100 Hz vibration amplitudes at different points. A non-linear increase with the squared current can be found at each measuring point.
Obviously, the behavior of the winding vibration distribution patterns under different loading currents depended heavily on the overall health of the winding structure. When the transformer operated in a healthy condition, the vibration distribution on the winding at 100 Hz followed a certain pattern. In addition, the vibration amplitudes at most positions linearly increased with the squared current. Once a fault was introduced into the winding, such as looseness in the clamping structures or replacement of the insulation spacers, the vibration distribution patterns alters with the increasing winding currents, due to the nonlinearity of the winding vibration trends at some parts of the winding.
4. Spatial Distribution of Transformer Tank Vibration Excited by Winding
In the previous section, experiment results prove that the loading current has a significant impact on the defected winding’s vibration distribution.
However, the vibrations generated by the main parts (winding and core) propagate to the measurement locations on the transformer tank via different paths. According to previous research, the cooling oil introduces an important vibration transmission path to the tank, and also provides damping and mass loading to the vibration in the tank [16]. These two effects work on the vibration transmission in two opposing ways. As a result, the overall effect of the oil on the tank vibration is quite complicated. In such case, it is necessary to figure out whether and to what extent the changes of mechanical properties and the loading current affect the vibration distribution on the tank.
4.1. Experimental Design
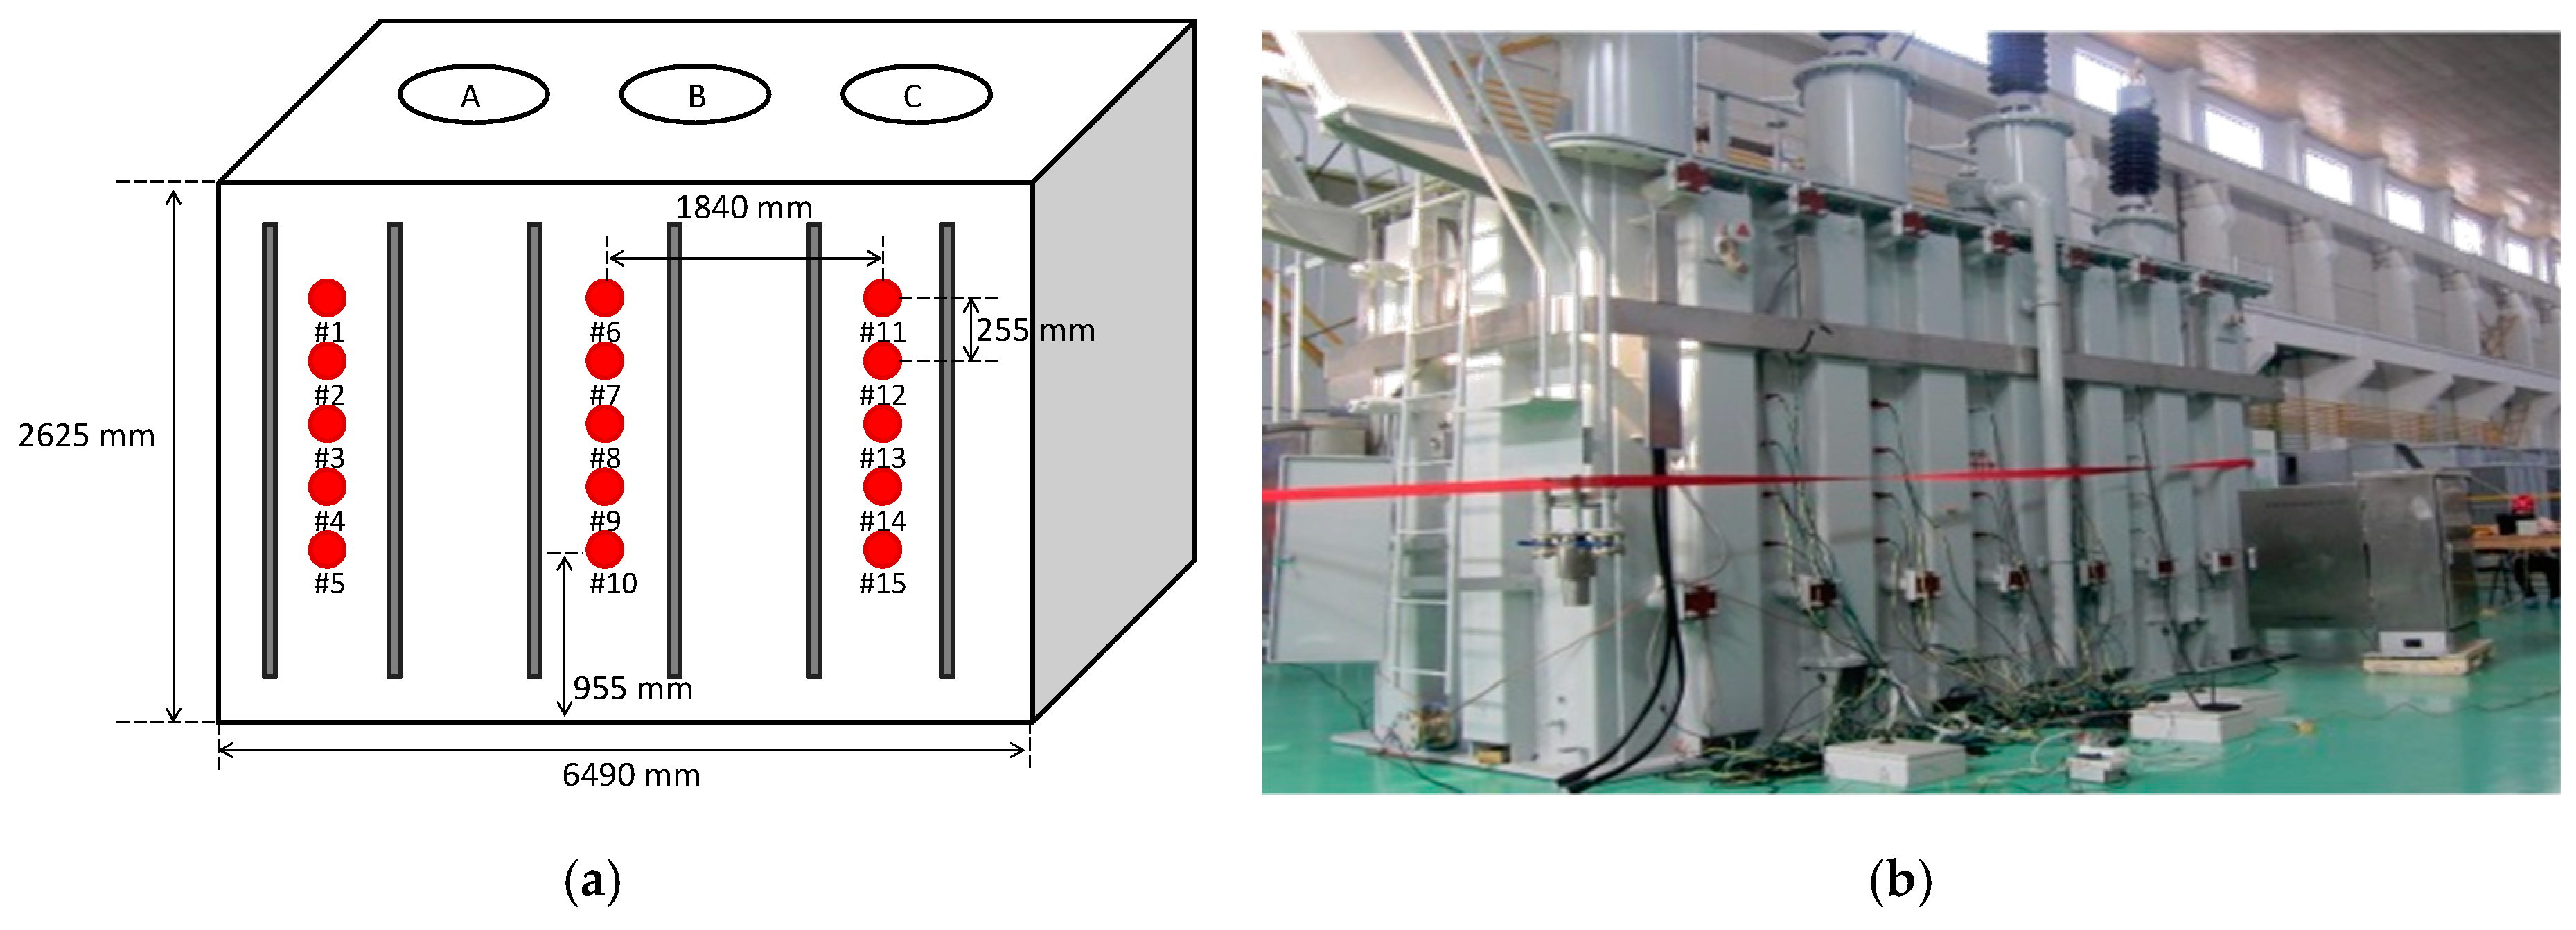
The experiments were carried on a 110 kV three phase transformer of type SZ9-50000/110, a total of 15 accelerometers were evenly arranged on the high voltage surface of the power transformer tank, defined as a measurement 5-by-3 matrix, as shown in Figure 14a. Additionally, it is noted that the three columns in this measurement matrix are right in front of the three phase windings, respectively. Detailed accelerometer locations information is presented in Figure 14b. A coordinate system based on the location of the accelerometers was established. The surface of the transformer tank is defined as a normalized square, ranging from −1 to 1 in both vertical and horizontal directions as shown in Figure 15. The coordinates of each measuring points are determined by the specific location on one tank side surface. Taking measuring point #1 as an example, its coordinate is (−0.56, 0.52).
Low voltage terminals were short-circuited, and the voltage was applied on the high voltage terminals with the small amplitude, in order to avoid the impact of the core vibration. Currents were loaded on three phases simultaneously, and gradually increased from 20% rated loading current to 100% rated loading current, an increase by 10% rated loading current each time.
Four cases of transformer vibrations were studied. The first case was for the transformer operation in a normal condition. The other three cases were for the transformer operation in various abnormal conditions. Under each case, vibration signals of every measuring point were recorded along with the current of different levels.
4.2. Vibration Distribution under Normal/Abnormal Conditions
Before artificial winding defects are operated on the experimental transformer, vibration signal data was measured under normal conditions for comparison.
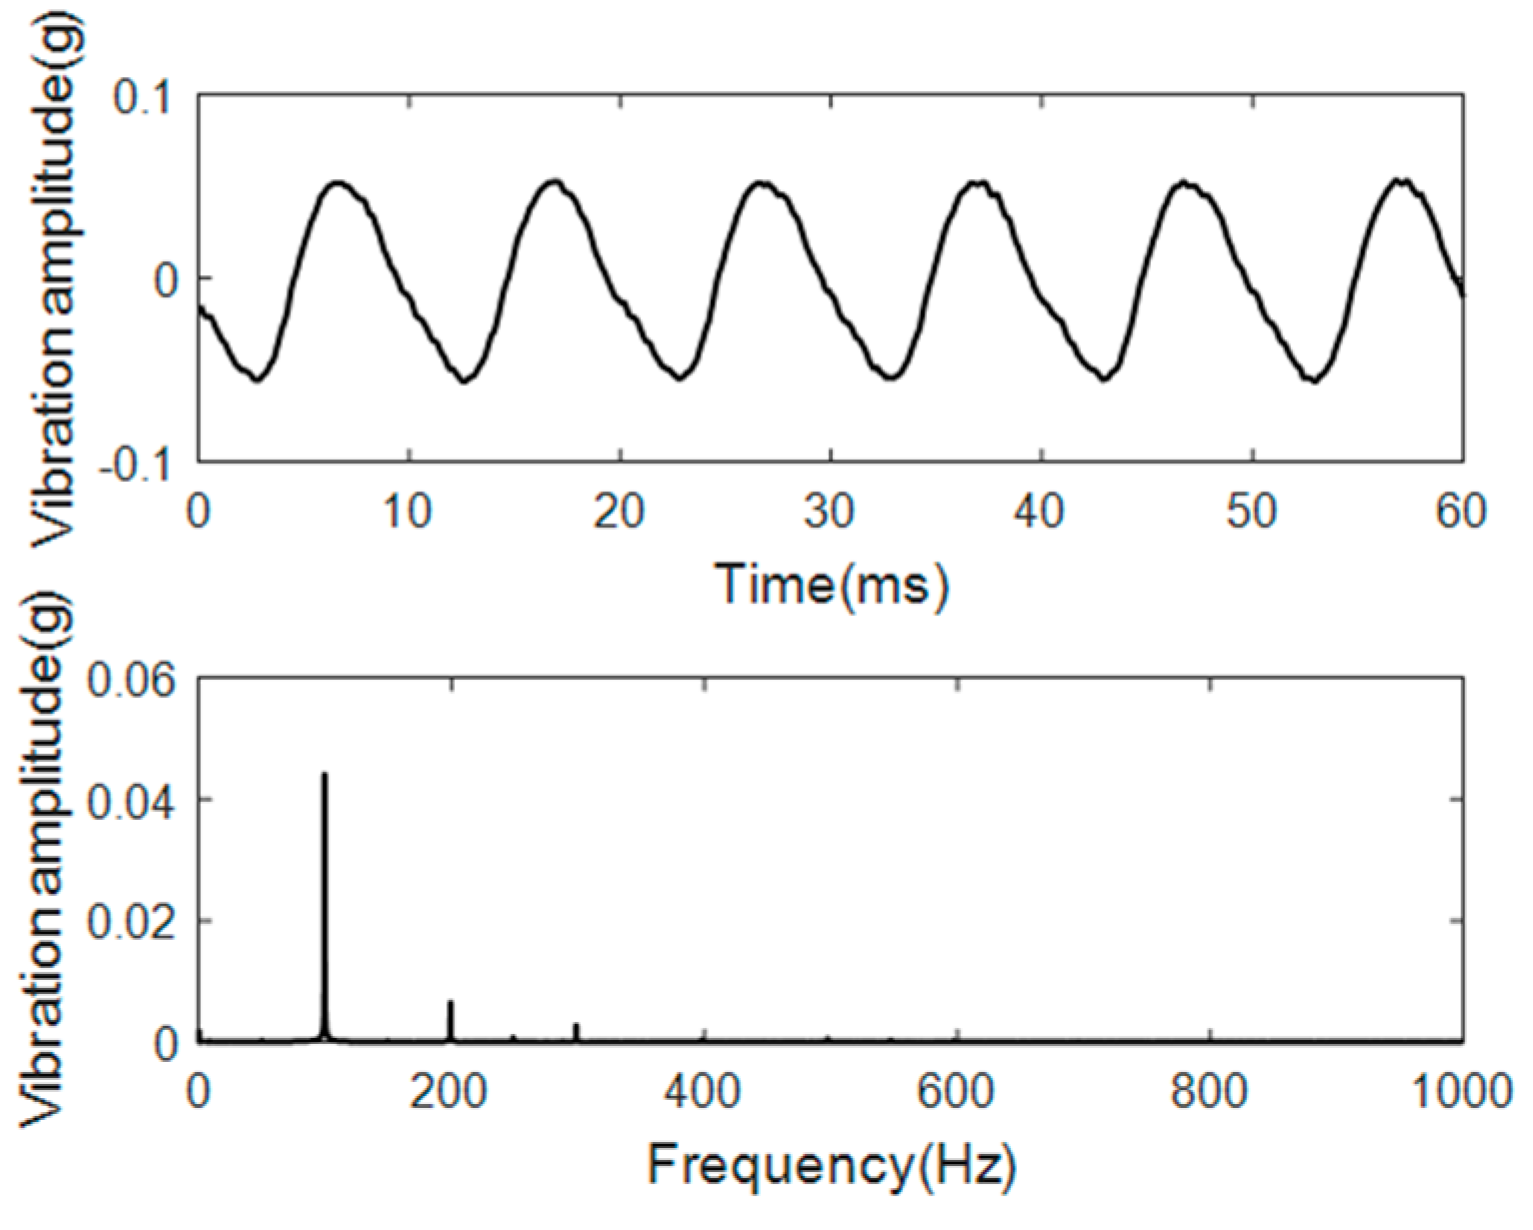
From the vibration signal and its frequency spectrum it can be seen that under normal conditions, the vibration signal at point #5 is a typical sinusoidal wave, and almost contain no harmonic components, as shown in Figure 16.
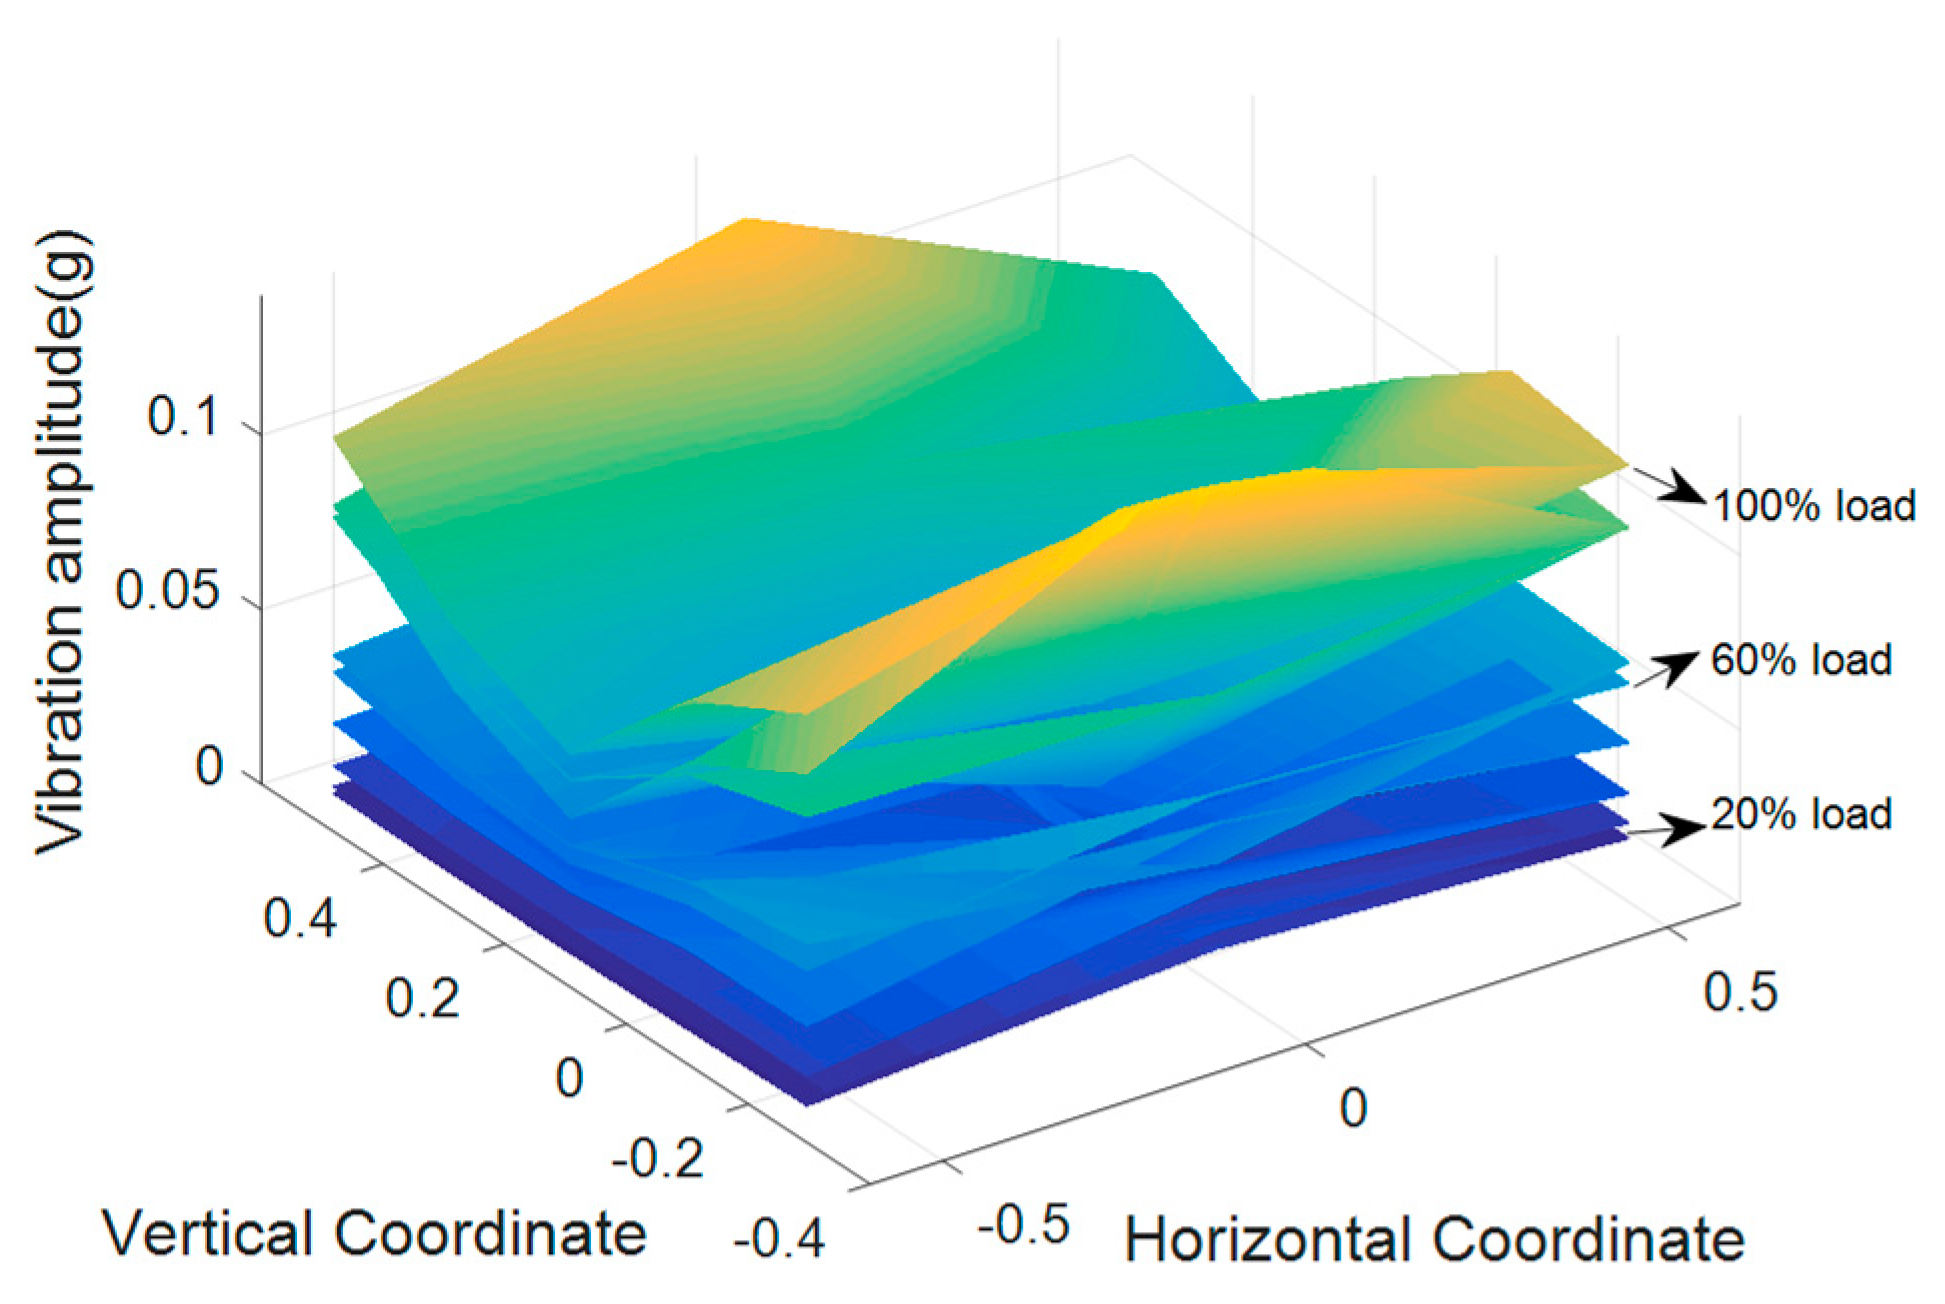
According to the definition in Equation (2), the vibration distribution pattern on the transformer tank surface can be described by a matrix V5×3(100). The 3D patterns of the 100 Hz vibration amplitude vibration distribution under different loading currents are shown in Figure 17. From the figure it can be concluded that the vibration distribution on the tank at 100 Hz followed a certain pattern under various loading currents. Additionally, it is obvious that vibration signals detected from right and left regions of the transformer tank have relatively higher amplitude, and gradually grow up with the loading current. Vibration amplitude values of the middle part (x = 0) along the vertical direction remain small even under the high loading current level. Such phenomenon can be explained by the distribution of the leakage flux density. According to the Lorentz law, the interaction of the current and leakage flux density results in electromagnetic forces acting on the windings. Previous research have simulated the leakage flux density of three phase transformers, and reveals that under normal conditions, the leakage flux density of the middle part of the transformer is smaller than that of the boundary part [21]. What’s more, the distribution at 100 Hz has approximately bilateral (left–right) symmetry across the y axis (x = 0). The spatial distribution condition on the vertical direction of the tank is quite different compared with that of the winding. Since that winding vibration transmits to the tank through the oil and the structure-borne transmission via the footpad, some points on the tank are determined by the oil-borne transmission, while others depend on the structure-borne modal characteristics of the tank [20].
4.2.1. Case 2.1: Effects of Clamping Force Looseness
In this case, the clamping structures of the winding for three phases were moderately loosened with the clamping force reduced to 60%, individually. The loading currents were applied simultaneously on three windings and gradually increased from 20% rated loading current to 100% rated loading current in the interval of 10%.
The waveform and frequency spectrum of the tank vibration at measuring point #5 under the clamping force looseness condition are plotted as shown in Figure 18. It can be observed that the vibration signal barely contains harmonic components under such minor winding defects.
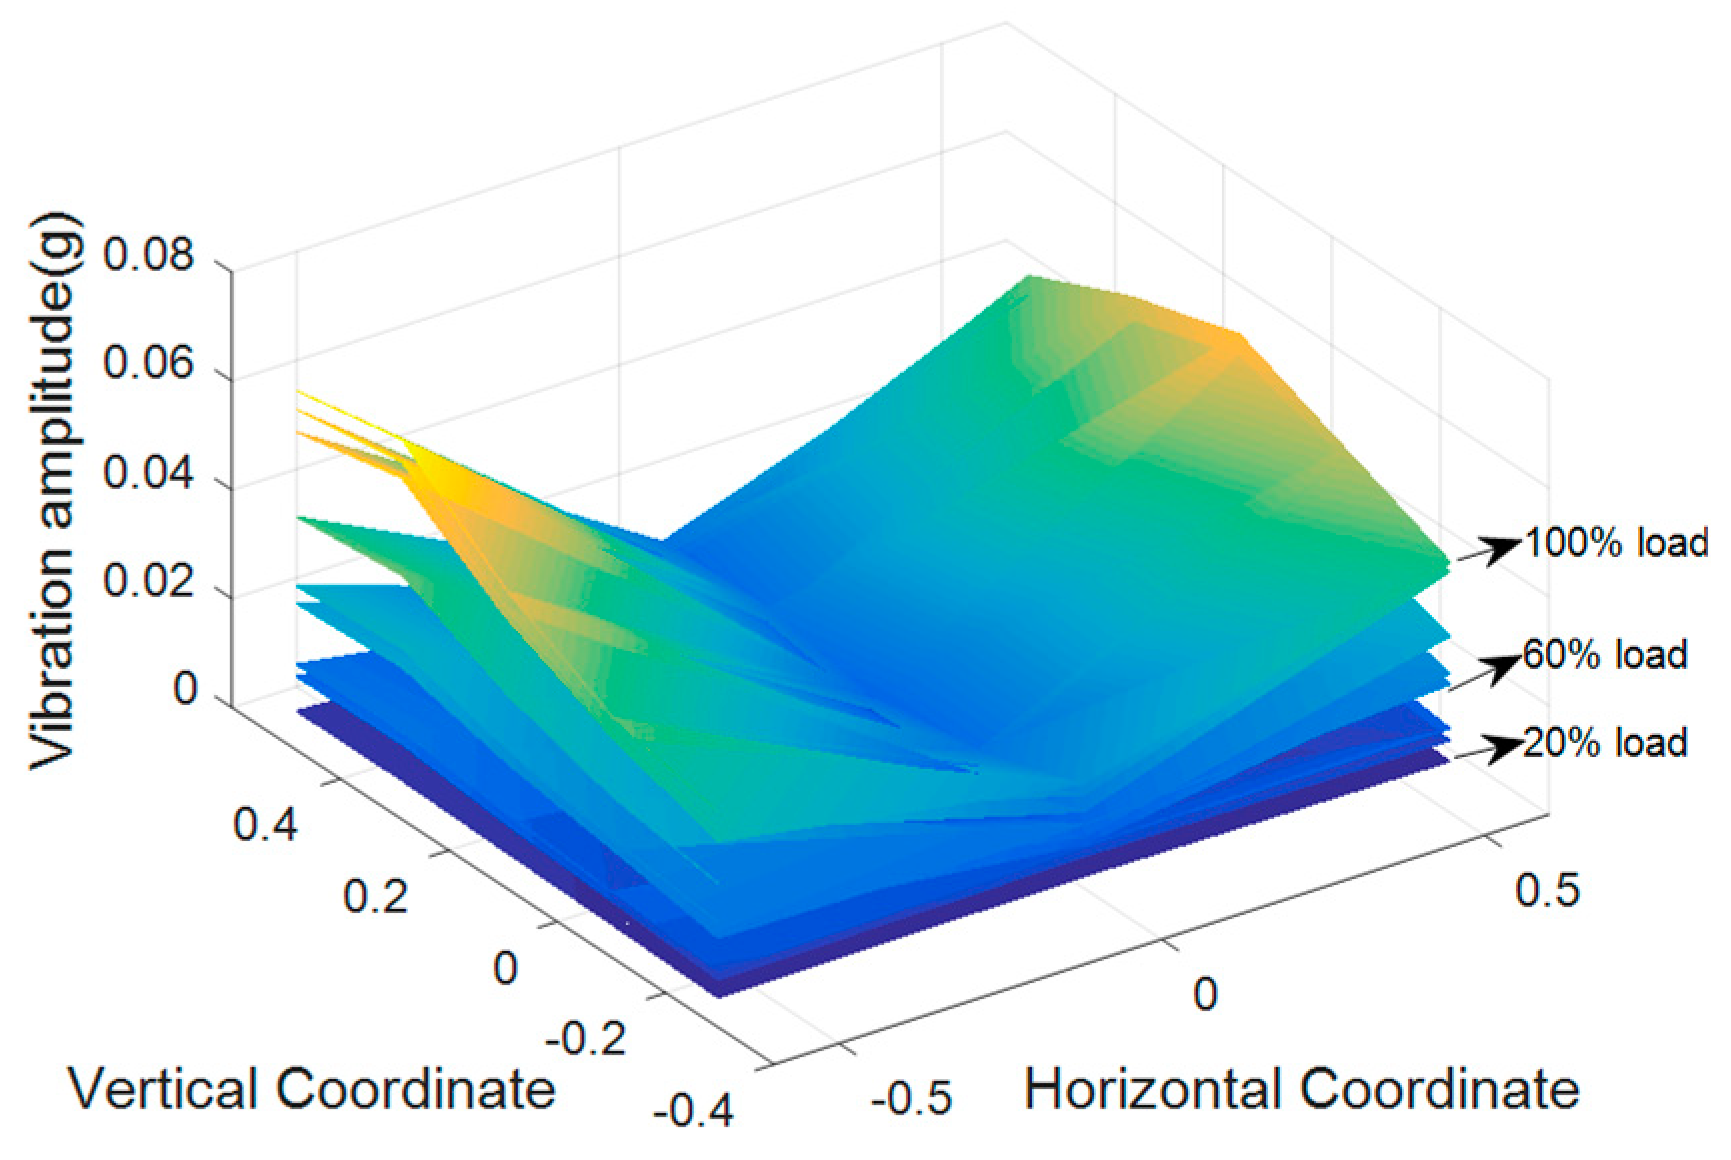
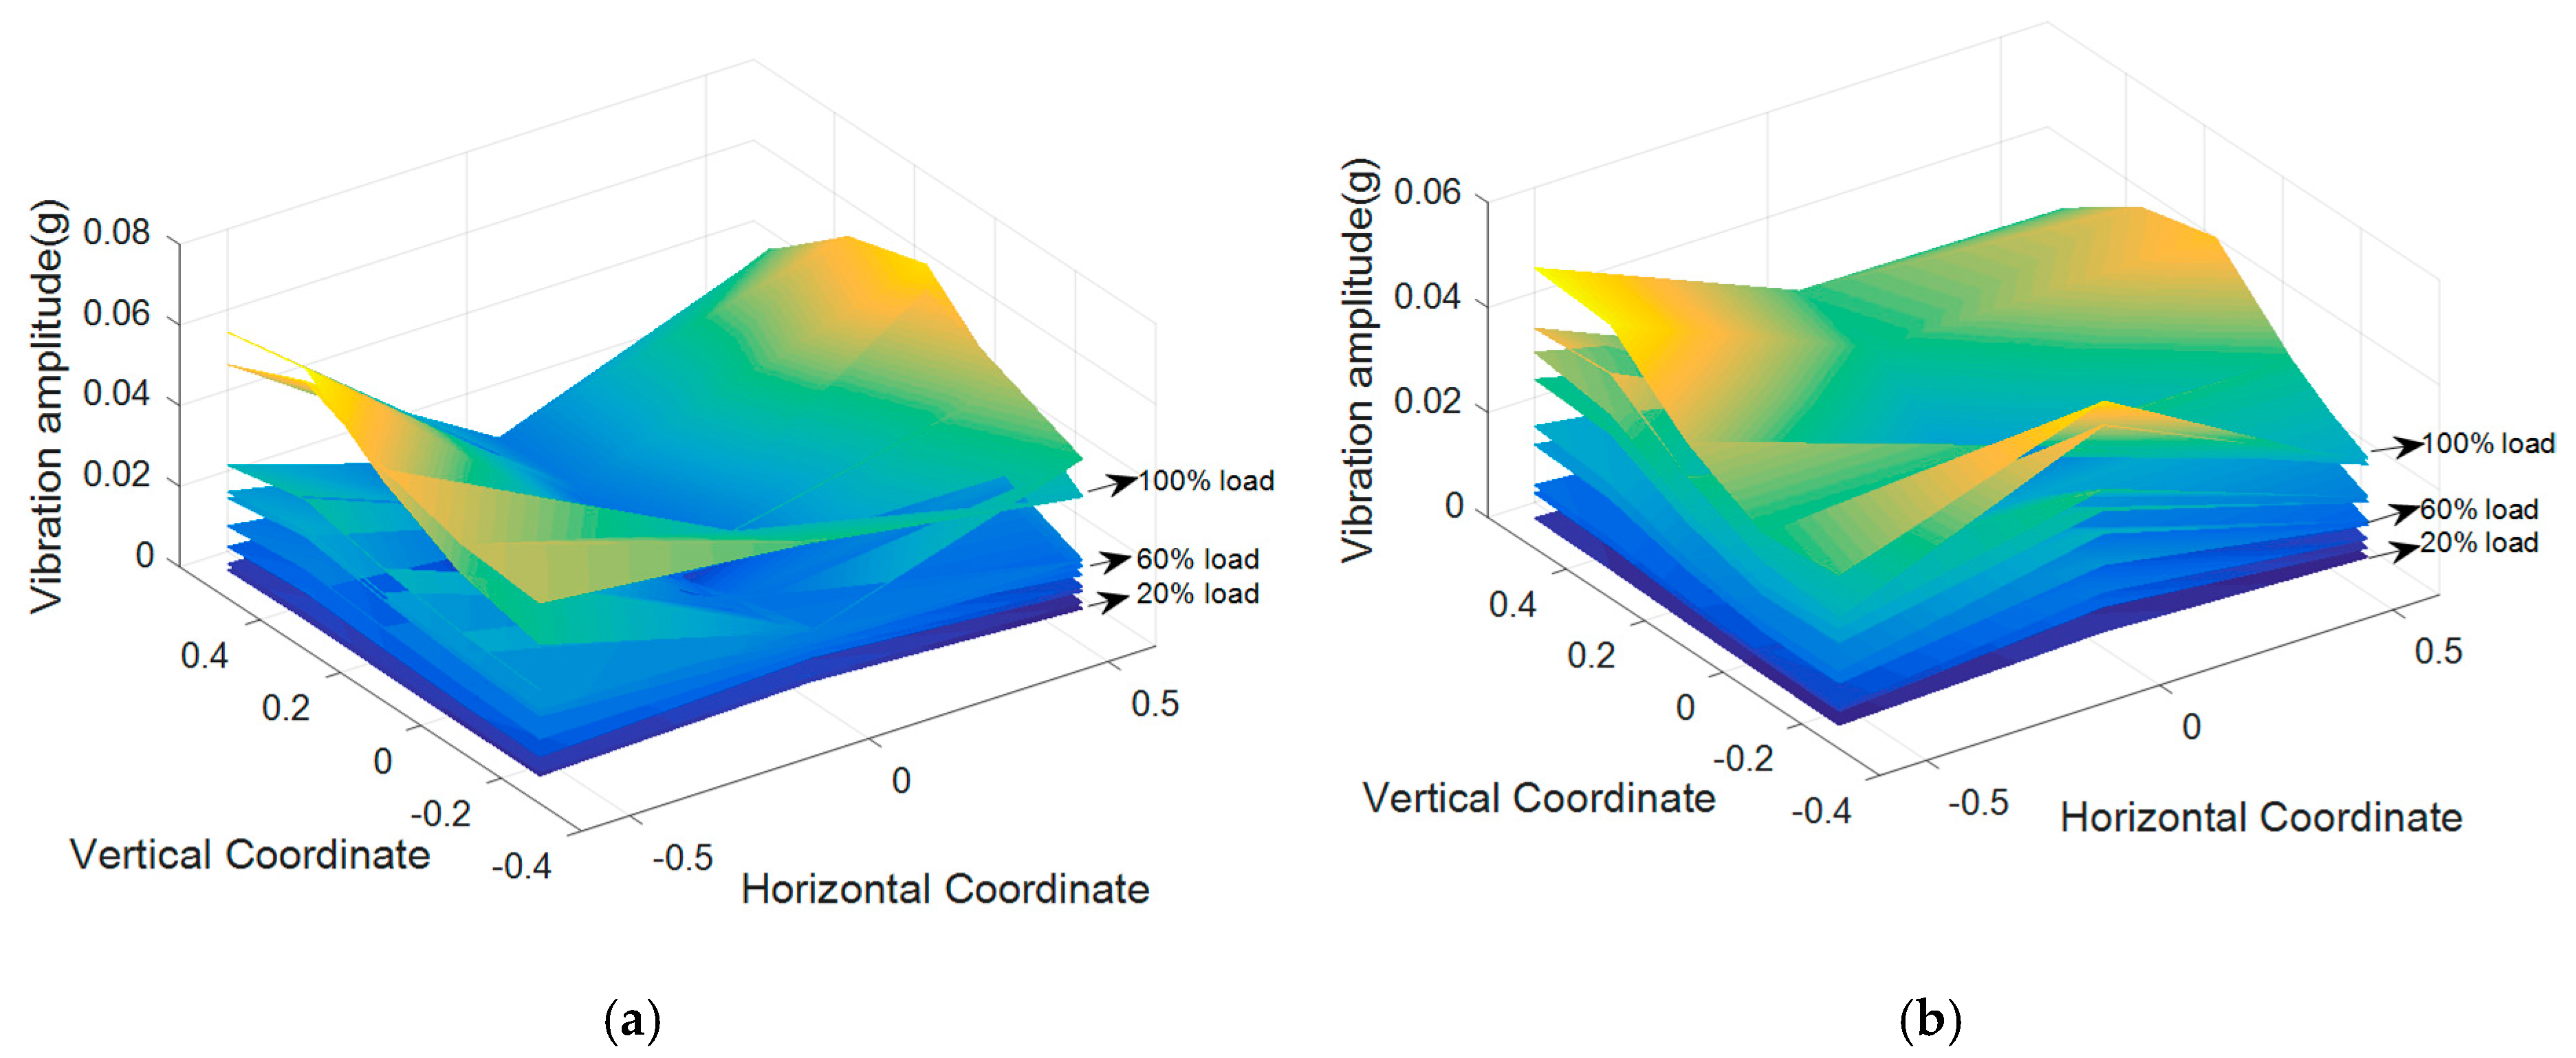
The 3D patterns of the 100 Hz vibration amplitude distribution under clamping force looseness conditions of the three phase windings with different loading current levels are shown in Figure 19. Whichever phase was loosened, significant changes could be observed at the middle part (near to phase B) of the tank. With the increase of the loading current, the vibration at the middle part became more violent.
When phase A or phase C was loosened, the vibration distribution generally follows the pattern observed in the normal condition (Case 1). However, the high load (i.e., 100% rated loading current) leads to differences of the vibration amplitudes between the left parts and the right parts, which brought about obvious left–right asymmetry in the patterns.
In contrast, the looseness of phase B showed different characteristics in the tank vibration distributions. The vibration amplitude at the middle (near to phase B) of the tank showed equal or larger amplitude than those at the left and right parts, while the vibration amplitudes at the middle part were much smaller than those at the other parts for Case 1. In addition, although phase B was moderately loosened, a bilateral (left–right) symmetry across the y axis (x = 0) in the vibration distributions can still be found in this case.
4.2.2. Case 2.2: Effects of Winding Global Looseness
In this experiment, global looseness was introduced to the phase B winding by replacing the insulating spacers with thinner spacer (2 mm, 70% of the origin value), along with removing the support bars. The winding vibrations under normal and defected conditions were collected with the applied current gradually increased from 10% rated loading current to 100% rated loading current in the interval of 10%.
The waveform and frequency spectrum of the vibration signal detected from the index #5 measuring point, are shown as in Figure 20. The vibration amplitudes become large, nearly two times that in the normal case. The waveform is slightly distorted, which was in accordance with the phenomenon observed in the winding vibration (Figure 21).
From the 3D patterns of the 100 Hz vibration amplitude distribution under global looseness condition, what is most remarkable is that the vibration pattern has been thoroughly different from that of Case 1, and dramatically varied with the loading currents. For example, the amplitude difference of the vibration was 0.024 g and 0.062 g respectively, for 50% and 100% of the loading current. When the defected transformer applied with the 100% rated loading current, the vibration amplitudes at the middle bottom part of the tank become excessively large, more than five times that of the top part. It is because of that the vibration amplitude at the bottom parts of the winding varied dramatically with the increasing loading current when the winding was globally loosened. However, with the replacement of the insulating spacers, symmetry along the vertical direction can also be found in this case.
4.2.3. Case 3: Effects of Winding Radial Deformation
Apart from the winding looseness conditions, the radial deformation (forces buckling) mode is also a typical kind of winding defect, and it will result in an increase of the winding to the ground, as well as a decrease of the winding capacitance [20]. In this experiment, the coils in the middle part of the phase A winding was forced buckled through a series of short-circuit tests, as shown in Figure 22. During the experiment, the on-load experiments were carried out again under different loading currents (20% to 100%), and the vibrations from different measurement points were synchronously collected.
The waveform and frequency spectrum of vibration signal detected from the index #5 measuring point are shown in Figure 23. The vibration amplitude is much larger than that in other cases. Additionally it can be observed that the vibration waveform is severely distorted, with various higher order harmonics when the winding was severely deformed.
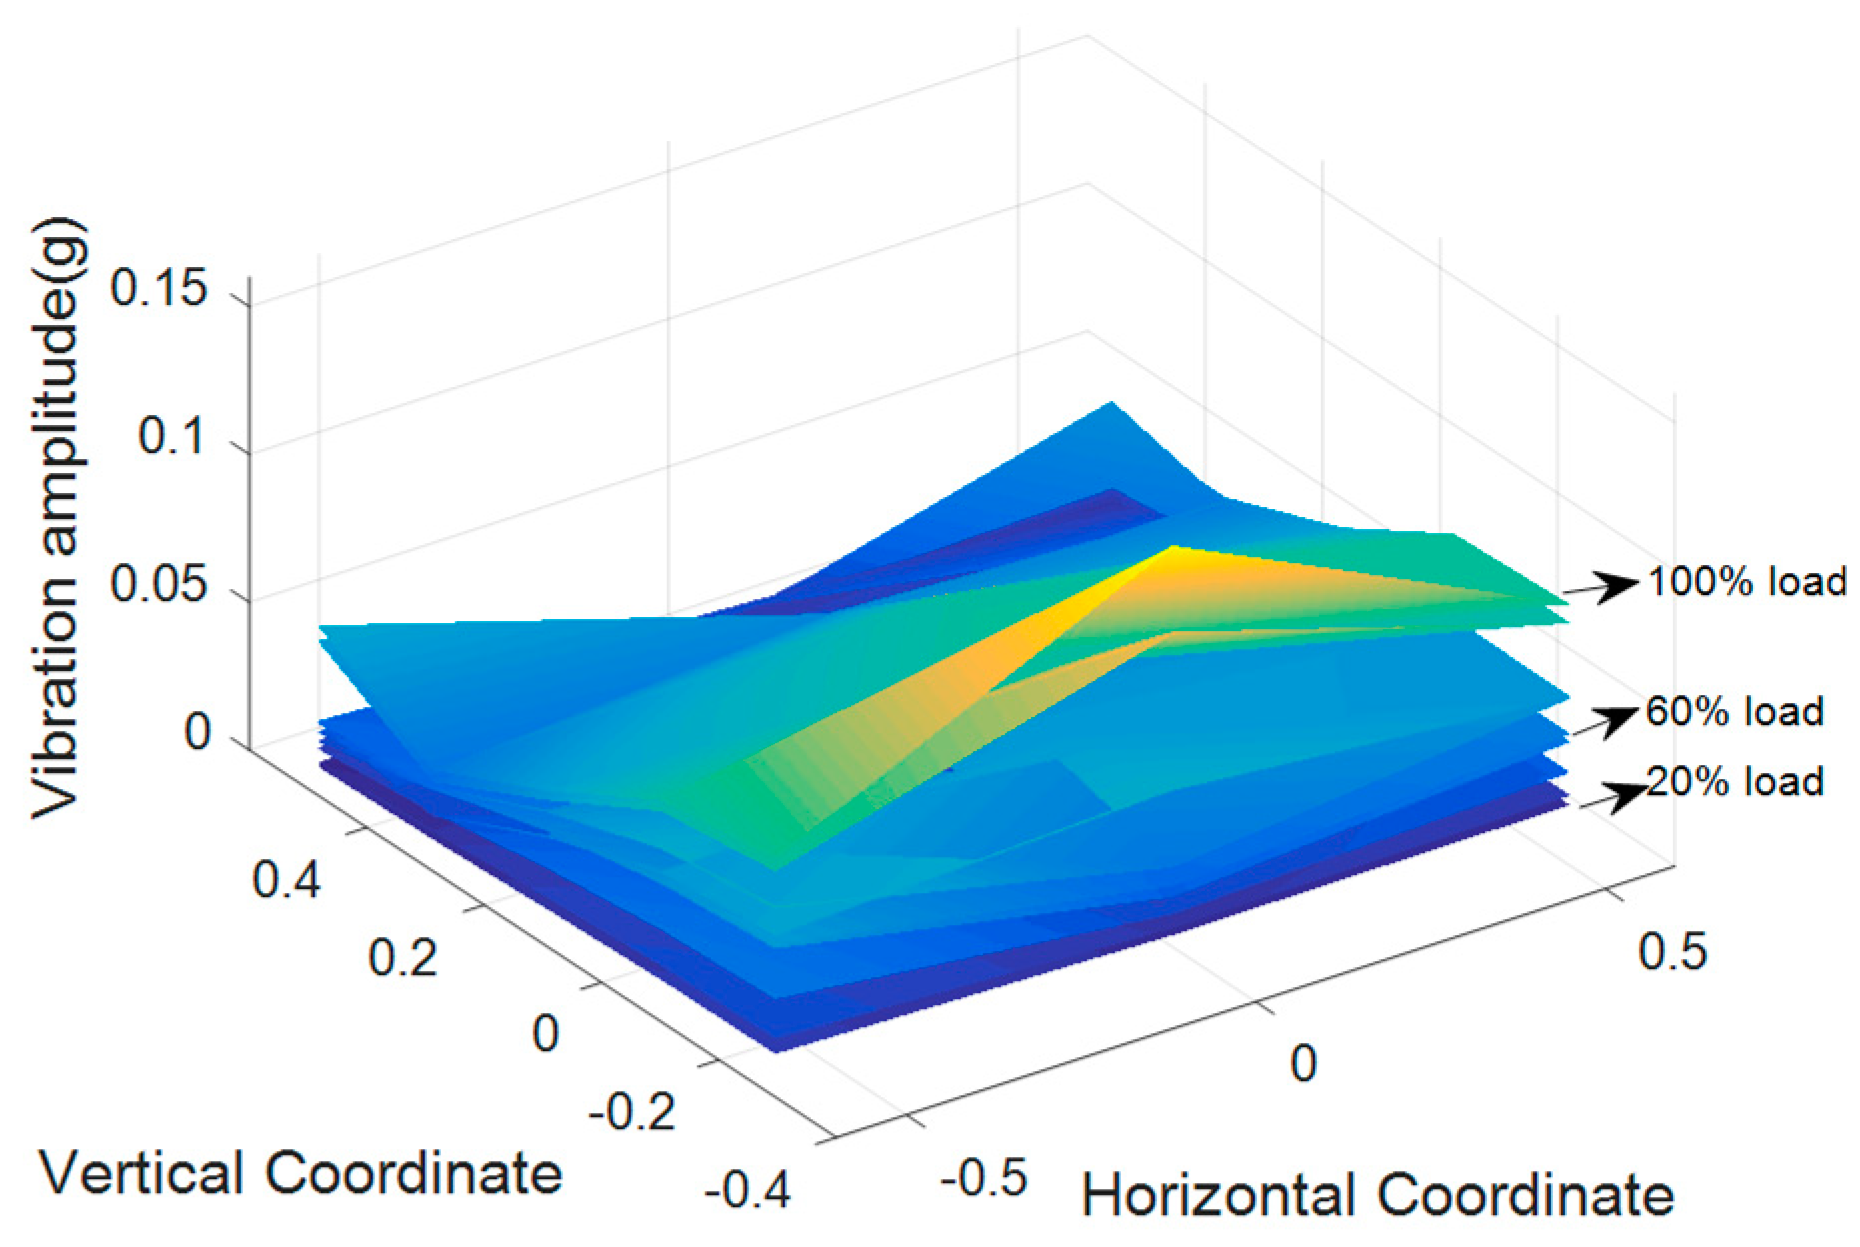
The 100 Hz vibration amplitude distributions under different loading currents are shown in Figure 24. It can be found that the deformation leads to a significant rise in vibration amplitudes on the transformer tank. What’s more, with the increase of the loading current, the vibration distributions dramatically varied. Disturbance and instability were introduced into the winding vibration system by the winding deformation. In addition, the symmetry across the y axis is totally broken in this case.
According to the results in these four cases, the tank vibration distribution is also determined by the mechanical condition of the internal parts. Similar to the observations in Section 3, when the transformer is operating in a healthy condition, the vibration distribution on the tank at 100 Hz follows a certain pattern with approximate bilateral (left–right) symmetry across the horizontal axis. Occurrence of the faults directly brings changes in the vibration pattern at certain parts, due to the sharp grow of the vibration amplitude. The clamping force looseness (for phases A and C) and deformation of the winding have a significant effect on the mechanical structure symmetry of the transformer internal part, which directly causes the asymmetry in the vibration distribution on the tank. In addition, severe fault situations will directly introduce disturbance and instability in to the vibration system, and lead to a dramatical variation of the vibration distribution with respect to the loading current.
4.3. Vibration Distribution Characteristics
The vibration distribution center is defined and used to describe the characteristics of the vibration distribution under different mechanical conditions and different loading currents. The coordinate of the vibration distribution center (VDC) at frequency f is given by:
where xi yi are the position coordinates of the index #i measurement point on the transformer tank, vi,f,L is the vibration amplitude at frequency f under the loading current L from the measurement point. The denominator is the absolute summation of the vibration amplitude from all measurement points, which is used for normalization.
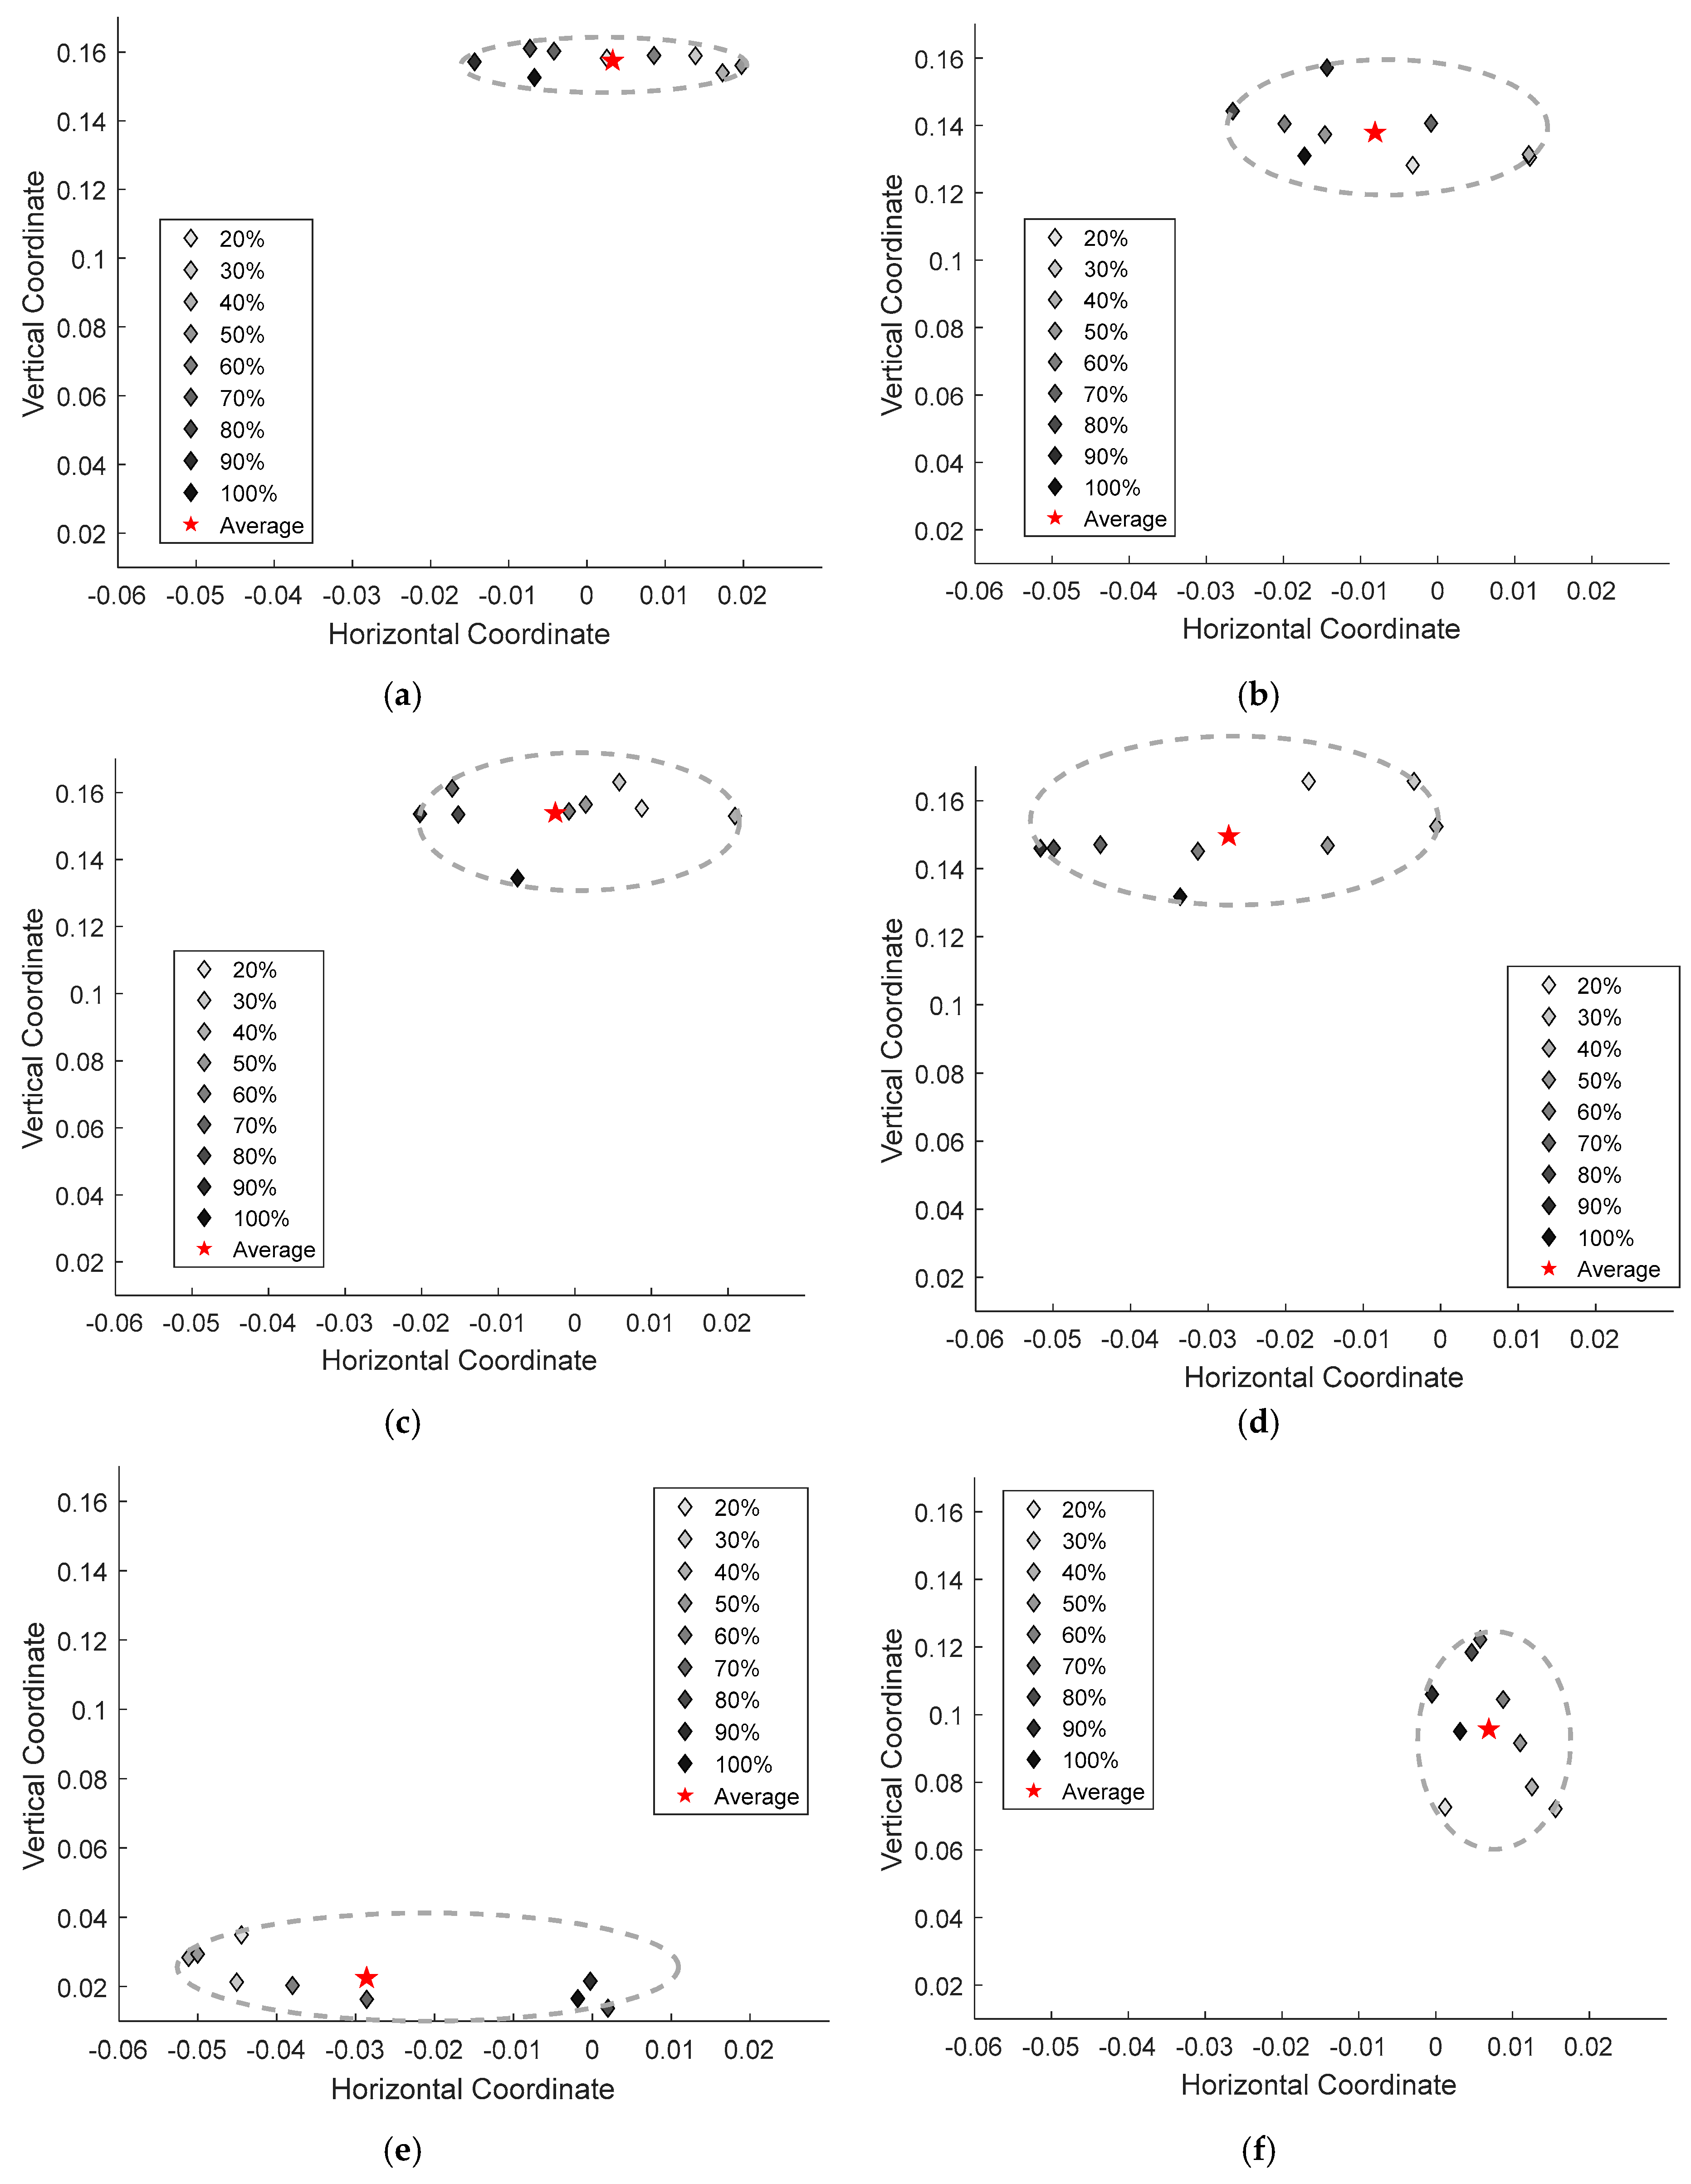
The coordinates of the vibration distribution centers under different mechanical conditions are plotted in Figure 25, where colors of the markers represent the corresponding loading currents. The red stars represent the average coordinates of the vibration distribution centers (VDCavg) under increasing loading currents, and the circles marked out the corresponding changing range.
When the transformer is under a healthy condition, the average coordinate of the vibration distribution center is at (0.003 0.1575). With the increasing winding current, the vertical coordinates of VDC keeps almost unchanged at y = 0.16. Figure 25b–d indicate that the local changes in the winding’s structure (due to the decrease of the clamping force looseness) result in a variation of the vibration distribution characteristics under different currents. It is remarkable that VDCavg moves to (−0.008, 0.138), (−0.002, 0.154), (−0.027, 0.149), due to the individual clamping force looseness of the A, B, and C phase windings, respectively. This slight shift of VDCavg reflects the minor changes of the transformer mechanical properties. In this case, the vertical coordinates of VDC vary in a relatively larger range with the increasing loading currents, compared with that of the normal case.
Figure 25e–f shows that severe defects in the winding structure do cause significant fluctuation in the vibration distribution under varying currents. Under global looseness conditions, the VDCavg moves towards the bottom parts of the tank, and locates at (−0.029, 0.022). The jump of the VDCavg indicates that the global looseness leads to significant changes of the transformer mechanical properties. The changing range of VDC with the increasing current is further enlarged in both the horizontal direction and the vertical direction, compared with those of the normal case.
Under the winding deformation condition, the VDCavg jumps to (0.007, 0.096), caused by significant changes of the transformer mechanical properties. In addition, the total chaos vibration distribution along both the vertical and horizontal conditions under different loading currents leads to the dispersion of VDC in the vertical direction and relatively concentrated range. It implies that severe winding defects significantly changes the mechanical structure dynamic characteristics, the vibration distribution center horizontal coordinate is no longer sensitive to the varying loading current compared with that under the normal case, but the vertical coordinate became more mutative with the changing loading currents.
5. Conclusions
In this paper, the spatial distributions of the transformer vibration under different winding mechanical conditions and different loading currents are studied. Experiments were firstly designed to research the vibration distribution on the winding, and showed that the vibration distribution and its changes due to the varying loading currents are related with the winding mechanical conditions. Taken the vibration transmission paths of the transformer structure into consideration, the vibration distribution of the transformer tank under different artificial winding defects cases was also measured. Results of the experiments can be summarized as follows:
(1) Under normal condition, the distribution patterns remain stable with the changing of the loading current, and show an obvious symmetry along the x direction.
(2) Partial looseness of the winding, caused by the looseness of the clamping structure, will strengthen the vibration at the middle part (near to the B phase winding) of the tank, especially under high loading currents. Therefore, the overall vibration distribution characteristics slightly change under different loading current levels.
(3) Global looseness and winding deformation will further enhance the overall vibration amplitude levels, especially to the bottom part of the tank region, and makes the vibration distribution condition more chaos and irregular under different loading current levels. Moreover, under these conditions, higher order harmonics are introduced into the winding vibration signal.
(4) The VDC was used to describe the characteristics of the vibration distributions. Additionally it turned out to be a sensitive and accurate measure of common winding faults, and have the potential to be a criterion for further online detection and classification of winding defects.
Author Contributions
Conceptualization, Y.H., H.H. and J.Z.; Data curation, Y.H. and J.Z.; Formal analysis, Y.H.; Funding acquisition, H.H. and J.Z.; Investigation, Y.H., H.H. and J.Z.; Methodology, Y.H. and J.Z.; Project administration, H.H.; Resources, H.H. and J.Z.; Software, Y.H.; Supervision, H.H. and J.Z.; Validation, Y.H.; Visualization, Y.H.; Writing—original draft, Y.H.; Writing—review and editing, Y.H., H.H. and J.Z.
Funding
This project was supported by the China National Science Foundation (Grant No. 61603335) and the Natural Science Foundation of Zhejiang Province, China (Grant No. LY19F030024).
Conflicts of Interest
The authors declare no conflict of interest.
References
- Bengtsson, C. Status and trends in transformer monitoring. IEEE Trans. Power Deliv. 1996, 11, 1379–1384. [Google Scholar] [CrossRef]
- Du, X.; Pan, J.; Guzzomi, A. Modeling the Hysteresis Characteristics of Transformer Core under Various Excitation Level via On-Line Measurements. Electronics 2018, 7, 390. [Google Scholar] [CrossRef]
- Hong, K.X.; Pan, Z.P.; Huang, H. Modeling and Analysis of Winding Axial Vibration of Power Transformer. Transformer 2010, 47, 32–37. [Google Scholar]
- Zhou, H.; Hong, K.; Huang, H.; Zhou, J. Transformer winding fault detection by vibration analysis methods. Appl. Acoust. 2016, 114, 136–146. [Google Scholar] [CrossRef]
- Mechefske, C. Correlating power transformer tank vibration characteristics to winding looseness. Insight 1995, 37, 599–604. [Google Scholar]
- Berler, Z.; Golubev, A.; Rusov, V.; Tsvetkov, V.; Patterson, C. Vibro-acoustic method of transformer clamping pressure monitoring. In Proceedings of the Conference Record of the 2000 IEEE International Symposium on Electrical Insulation (Cat. No. 00CH37075), Anaheim, CA, USA, 5 April 2000. [Google Scholar]
- Bartoletti, C.; Desiderio, M.; Carlo, D.; Fazio, G.; Muzi, F.; Sacerdoti, G.; Salvatori, F. Vibro-acoustic techniques to diagnose power transformers. IEEE Trans. Power Deliv. 2004, 19, 221–229. [Google Scholar] [CrossRef]
- Ji, S.; Liu, W.; Shan, P.; Li, Y. Application of the wavelet packet to the monitoring of the core and winding condition of transformer. Proc. CSEE 2001, 21, 24–27. [Google Scholar]
- Hong, K.; Huang, H.; Zhou, J. A method of real-time fault diagnosis for power transformers based on vibration analysis. Meas. Sci. Technol. 2015, 26, 115011. [Google Scholar] [CrossRef]
- Chen, X.; Wang, J.; Huang, H.; Guo, J.; Hong, K. HHT based method for monitoring core clamping pressure of power transformers. J. Vib. Shock 2010, 9, 9–12. [Google Scholar]
- Hong, K.; Huang, H.; Fu, Y.; Zhou, J. A vibration measurement system for health monitoring of power transformers. Measurement 2016, 93, 135–147. [Google Scholar] [CrossRef]
- Lai, W.; Wang, Y.; Li, W.; Sun, G.; Qu, G.; Wang, Y. Study on vibration monitoring and multi-feature analysis of oil-immersed power transformer in arctic area. In Proceedings of the 2nd International Conference on Power and Renewable Energy (ICPRE), Chengdu, China, 20–23 September 2017; pp. 310–314. [Google Scholar]
- García, B.; Burgos, J.C.; Alonso, Á.M. Transformer tank vibration modeling as a method of detecting winding deformations-part I: Theoretical foundation. IEEE Trans. Power Deliv. 2005, 21, 157–163. [Google Scholar] [CrossRef]
- García, B.; Burgos, J.C.; Alonso, Á.M. Transformer tank vibration modeling as a method of detecting winding deformations-part II: Experimental verification. IEEE Trans. Power Deliv. 2005, 21, 164–169. [Google Scholar] [CrossRef]
- Shengchang, J.; Lingyu, Z.; Yanming, L. Study on transformer tank vibration characteristics in the field and its application. Przegląd Elektrotech. 2011, 87, 205–211. [Google Scholar]
- Jin, M.; Pan, J. Vibration transmission from internal structures to the tank of an oil-filled power transformer. Appl. Acoust. 2016, 113, 1–6. [Google Scholar] [CrossRef]
- Zheng, J.; Pan, J.; Huang, H. An experimental study of winding vibration of a single-phase power transformer using a laser Doppler vibrometer. Appl. Acoust. 2015, 87, 30–37. [Google Scholar] [CrossRef]
- Li, L.; Du, X.; Pan, J.; Keating, A.; Matthews, D.; Huang, H.; Zheng, J. Distributed Magnetic Flux Density on the Cross-Section of a Transformer Core. Electronics 2019, 8, 297. [Google Scholar] [CrossRef]
- Jing, Z.; Hai, H.; Pan, J.; Yanni, Z. Identification of the nonlinear vibration system of power transformers. Meas. Sci. Technol. 2017, 28, 015005. [Google Scholar] [CrossRef]
- García, B.; Burgos, J.C.; Alonso, Á. Winding deformations detection in power transformers by tank vibrations monitoring. Electr. Power Syst. Res. 2005, 74, 129–138. [Google Scholar] [CrossRef]
- Turowski, J.; Turowski, M.; Kopec, M. Method of three-dimensional network solution of leakage field of three-phase transformers. IEEE Trans. Magn. 1990, 26, 2911–2919. [Google Scholar] [CrossRef]
Figure 1.
Transformer vibration transmission paths.
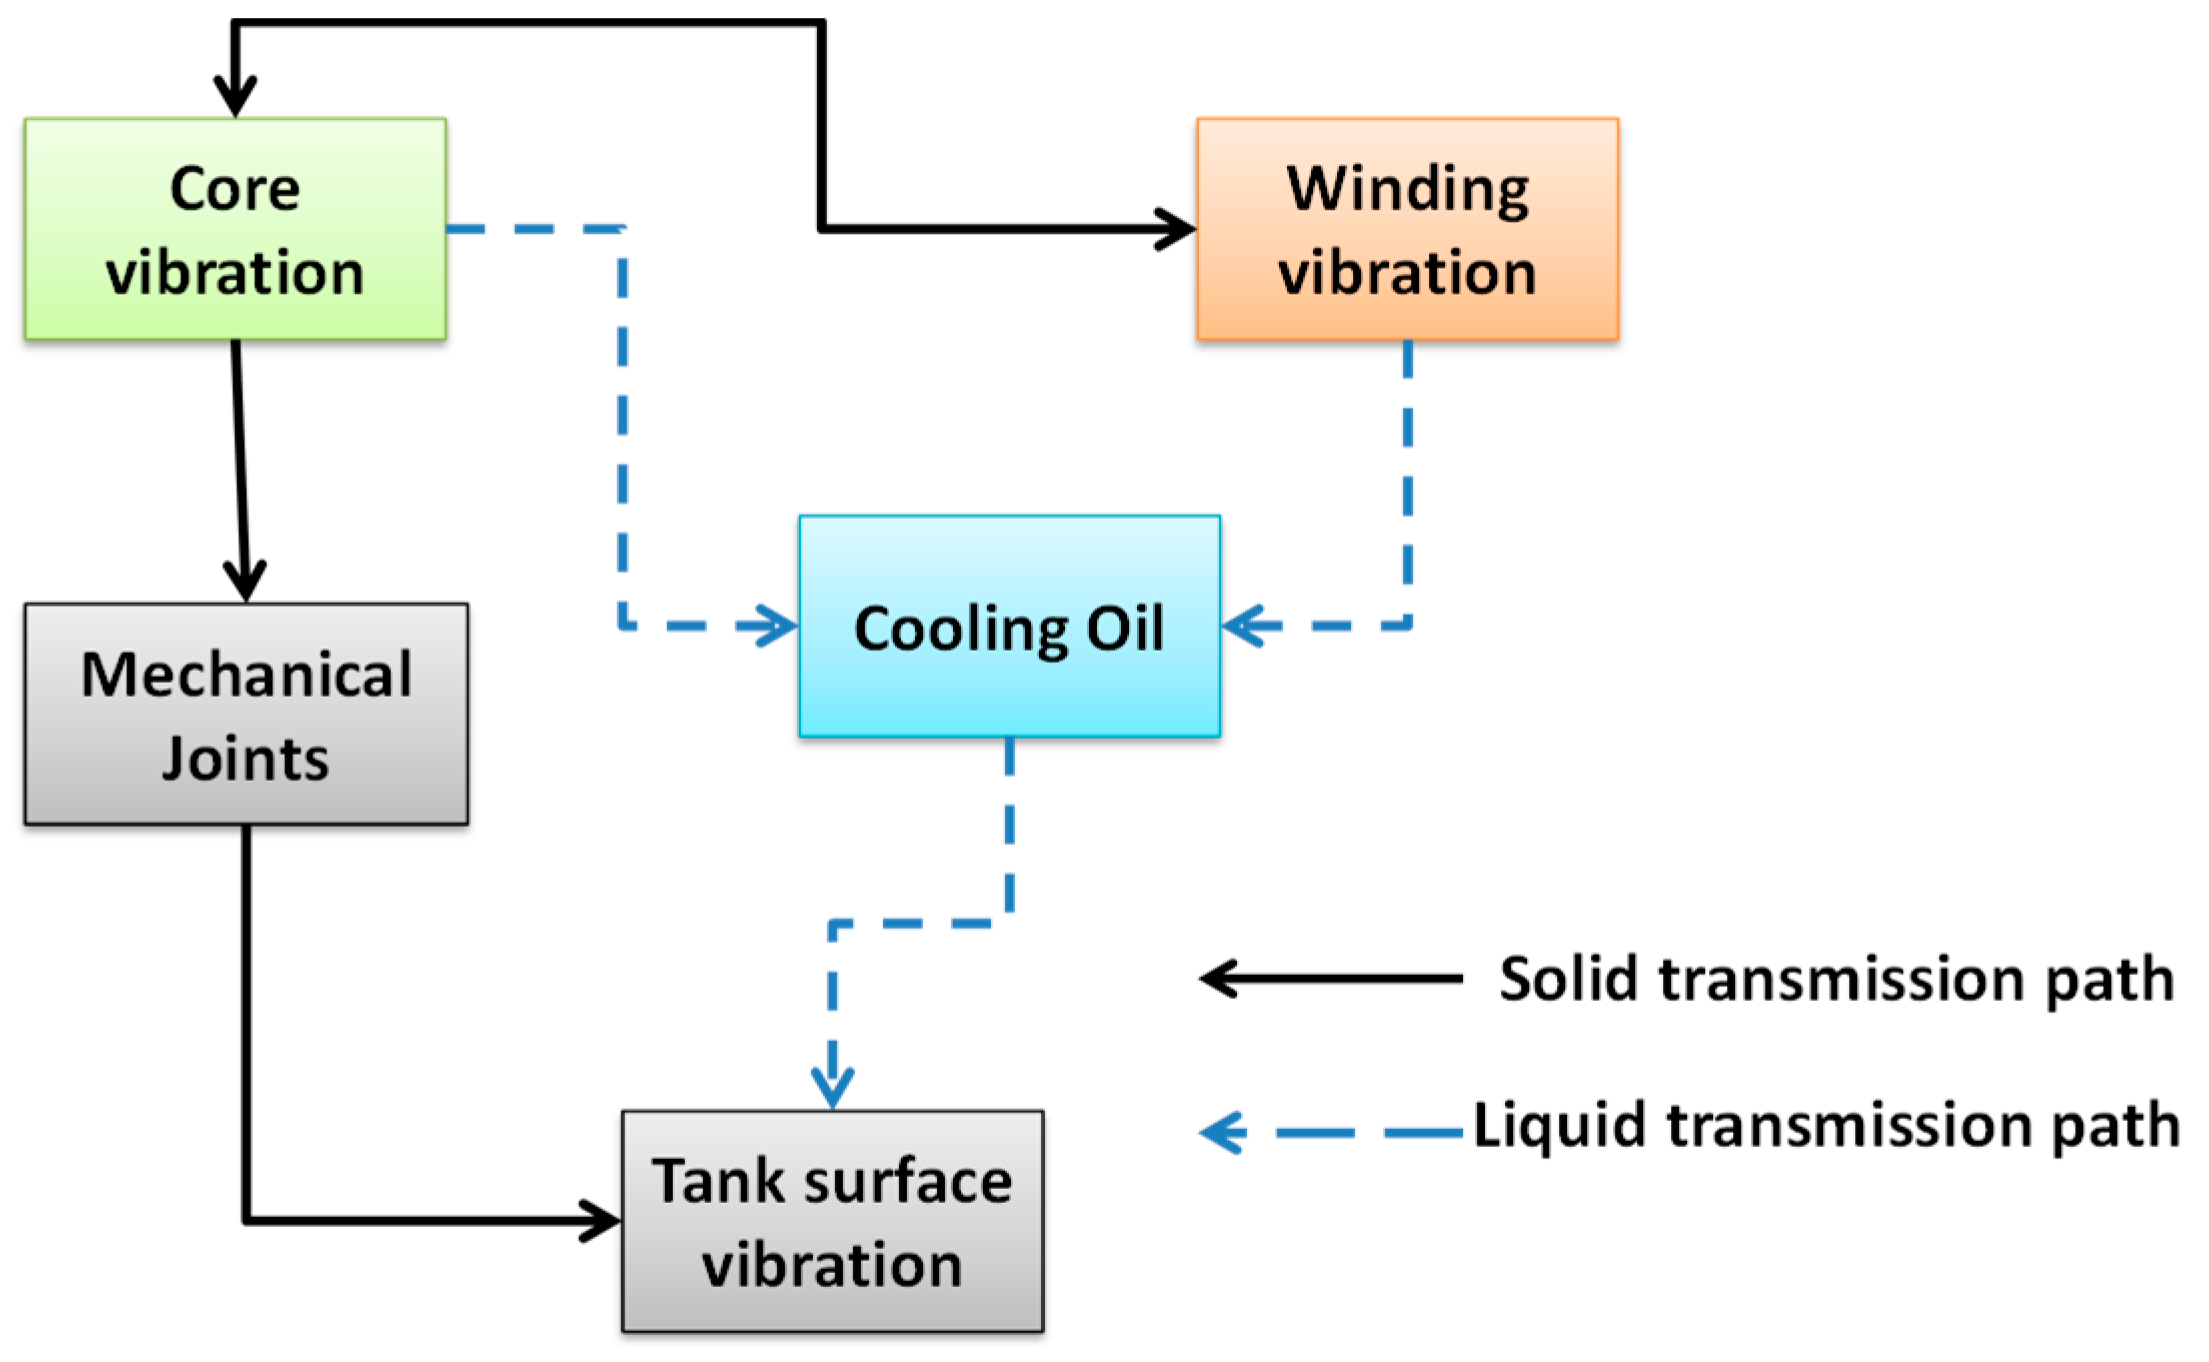
Figure 2.
(a) Accelerometers installation on the target winding; (b) location of the accelerometers.
Figure 2.
(a) Accelerometers installation on the target winding; (b) location of the accelerometers.

Figure 3.
Vibration of winding under normal conditions with rated current at measuring point #2.

Figure 4.
Vibration distribution pattern Vm×n(100) under normal conditions with different winding currents (m = 5, n = 1).
Figure 4.
Vibration distribution pattern Vm×n(100) under normal conditions with different winding currents (m = 5, n = 1).

Figure 5.
Winding vibration trends with increasing loading currents under normal conditions.

Figure 6.
Actuating device of winding clamping force.
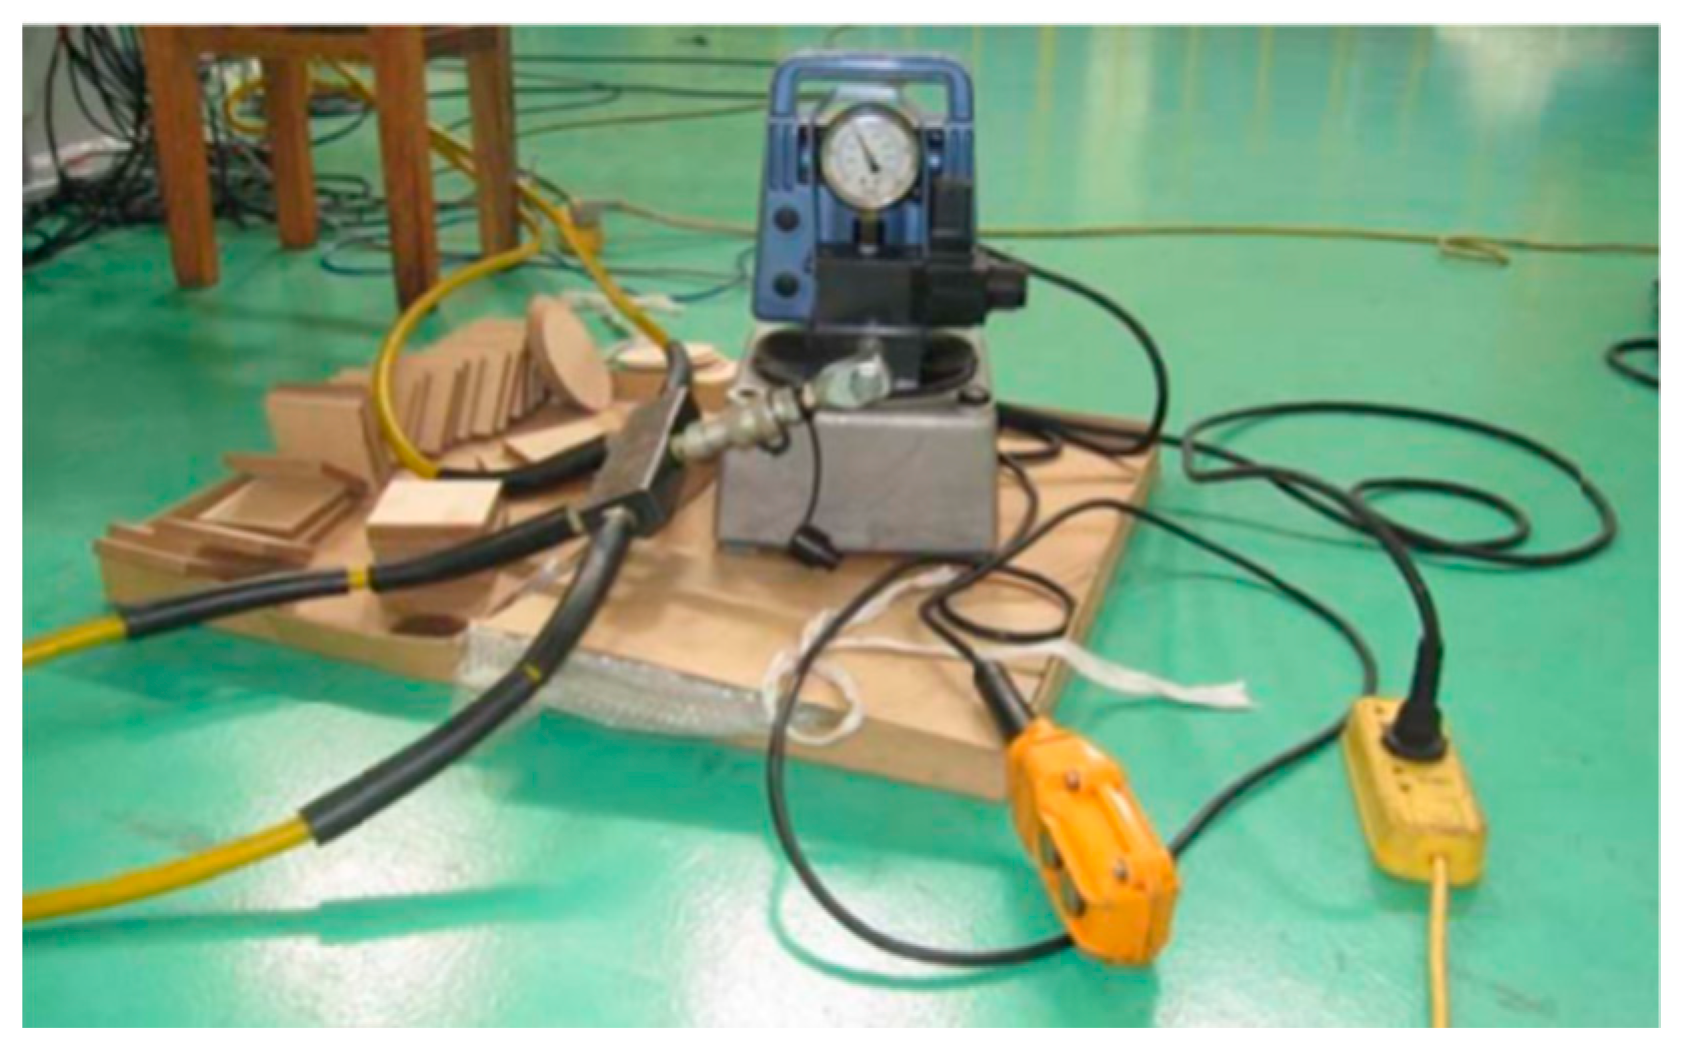
Figure 7.
Vibration of winding under clamping loosened conditions with the rated current at measuring point #2.
Figure 7.
Vibration of winding under clamping loosened conditions with the rated current at measuring point #2.
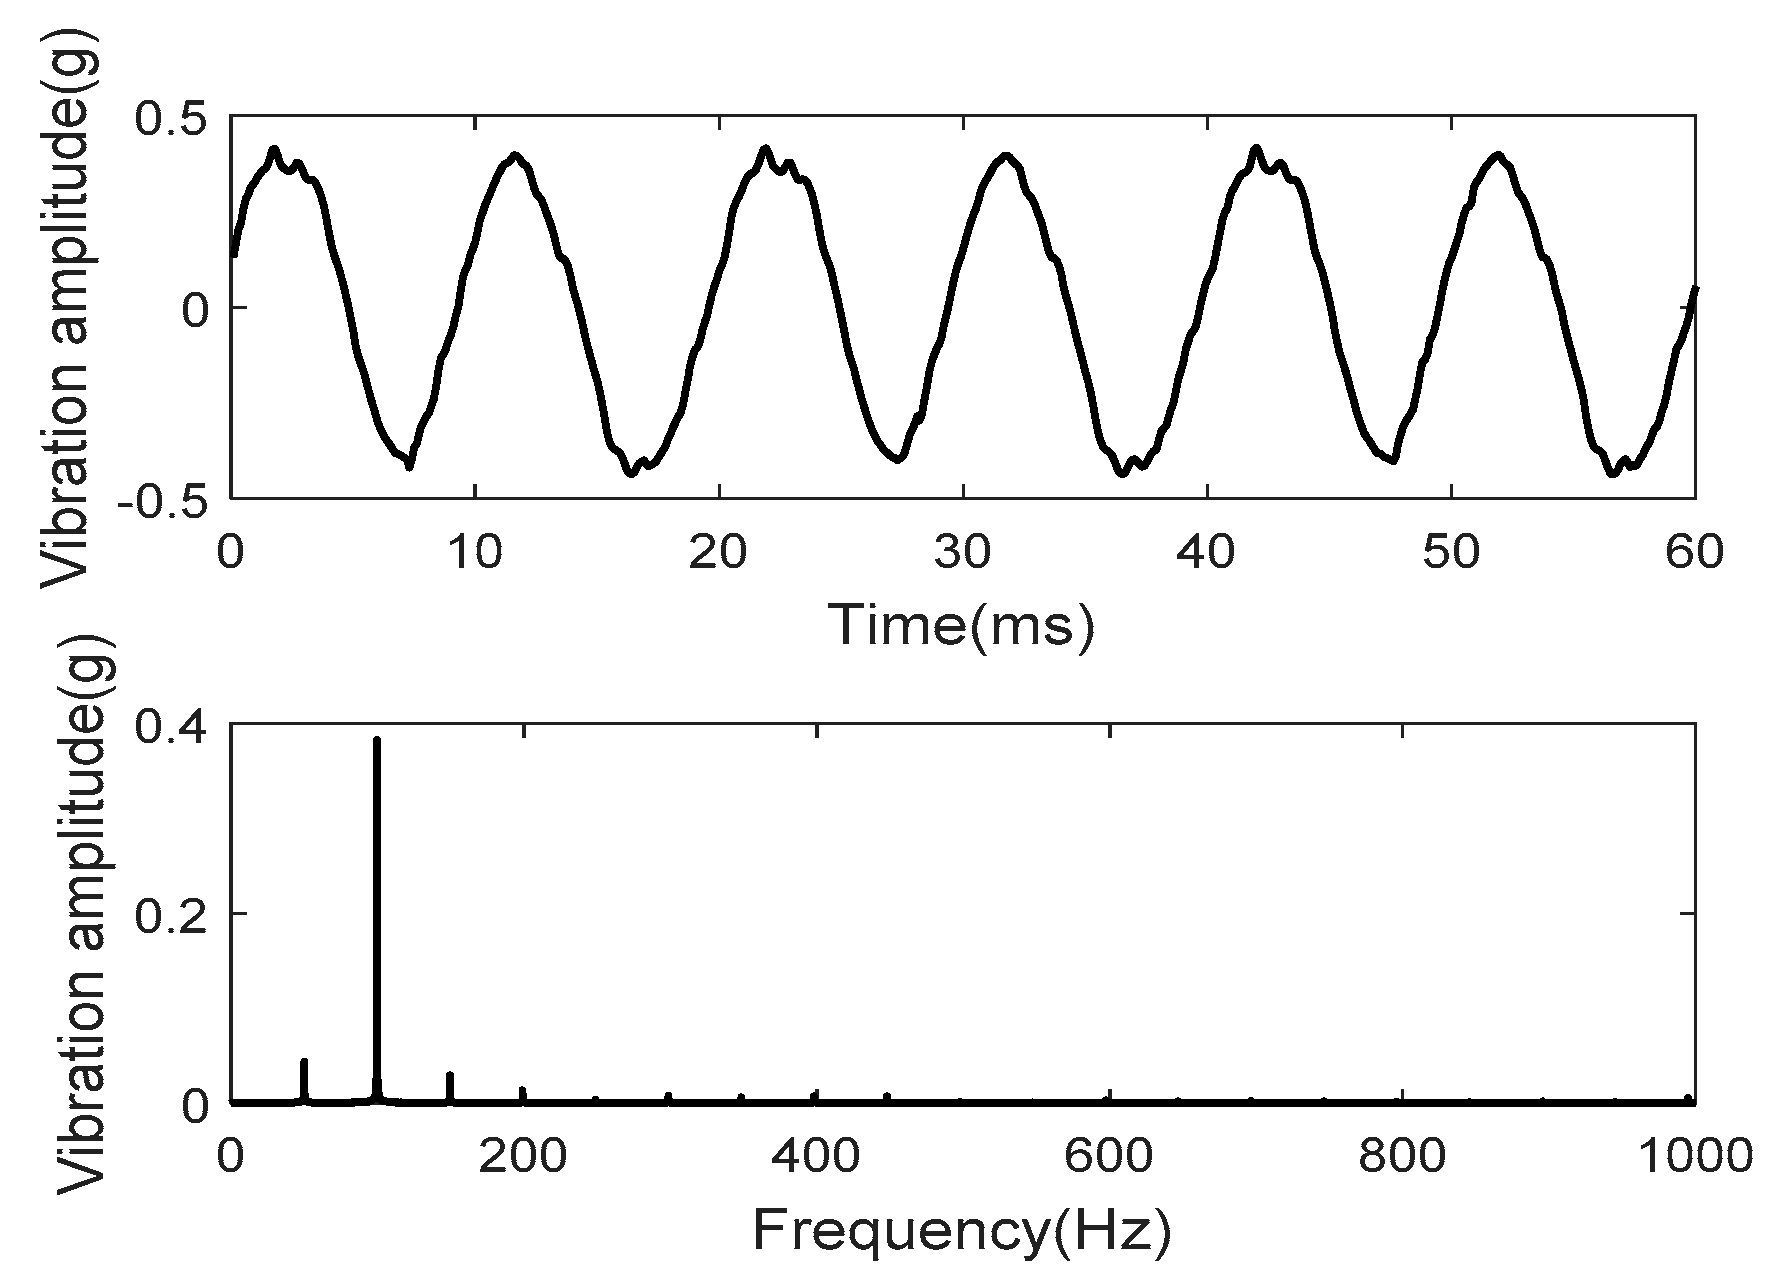
Figure 8.
Vibration distribution pattern Vm×n(100) under clamping force looseness conditions with different winding currents (m = 5, n = 1).
Figure 8.
Vibration distribution pattern Vm×n(100) under clamping force looseness conditions with different winding currents (m = 5, n = 1).
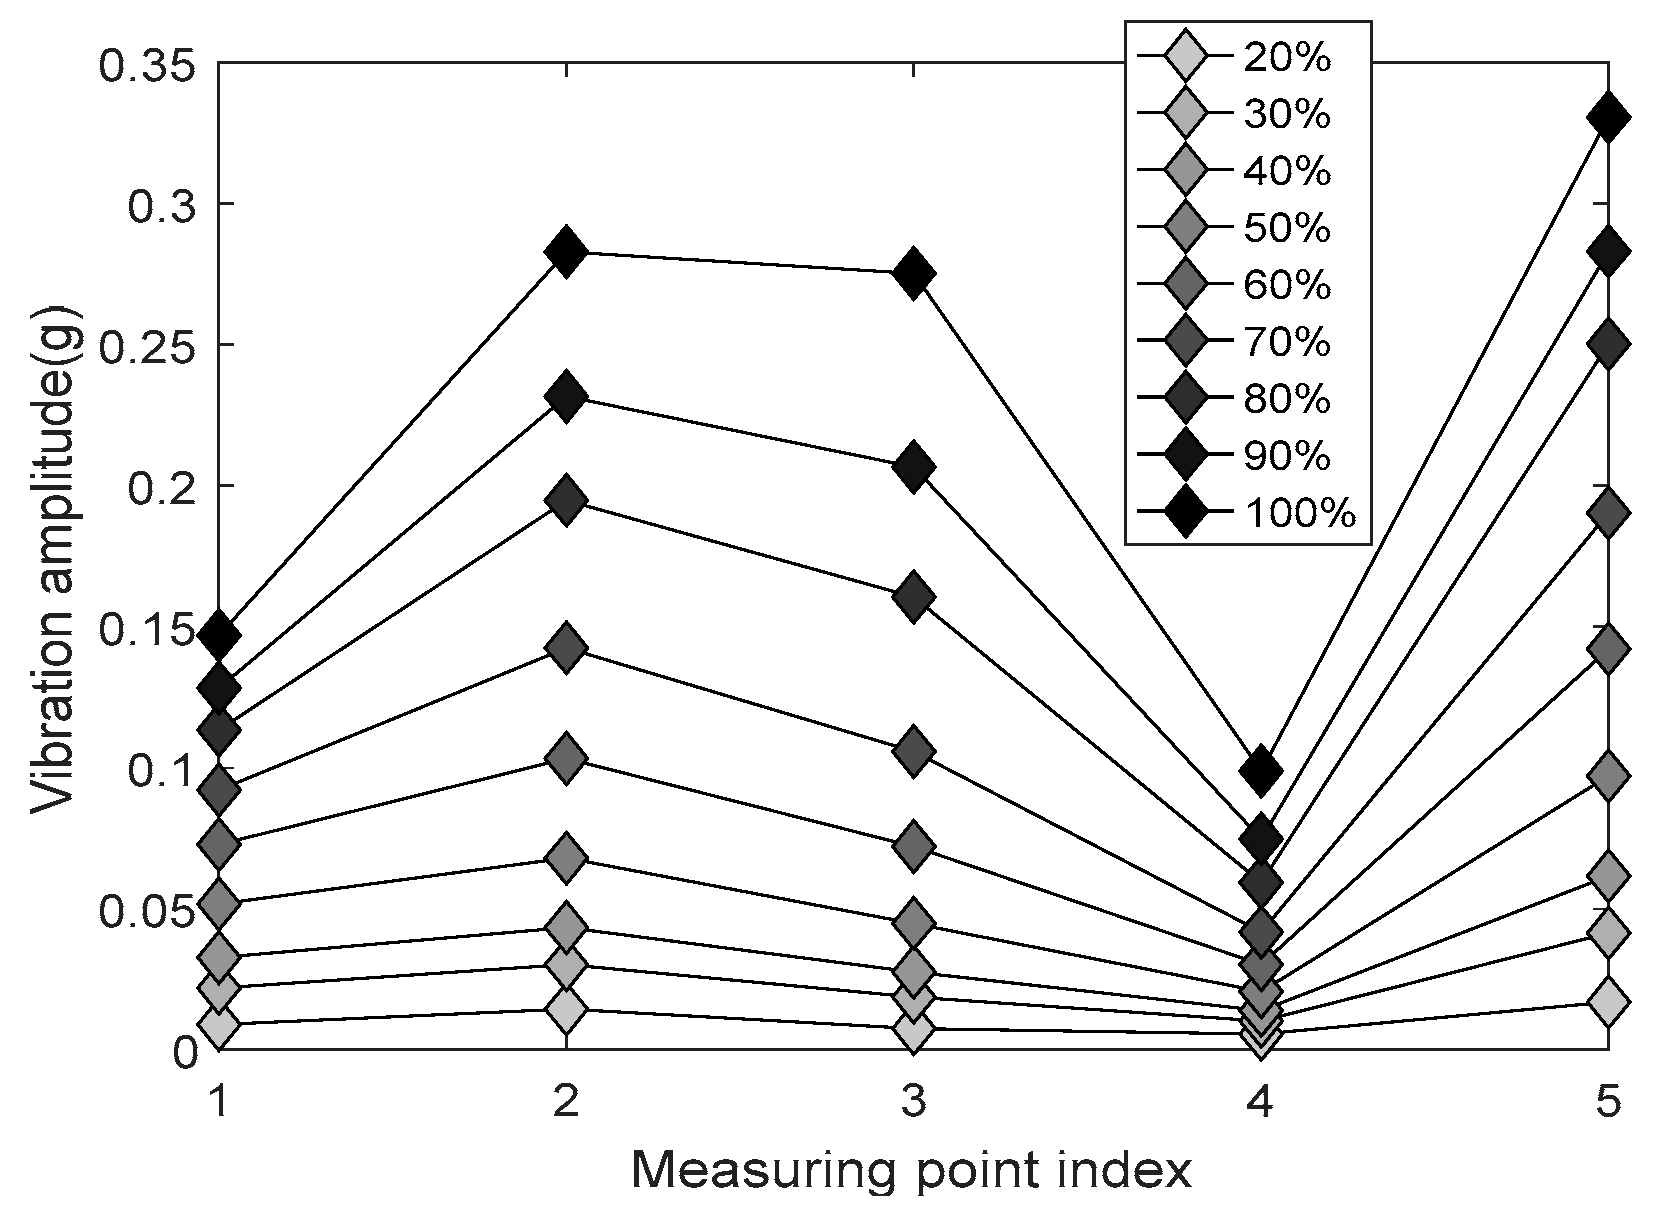
Figure 9.
Winding vibration trends with the increasing loading currents under clamping force looseness conditions.
Figure 9.
Winding vibration trends with the increasing loading currents under clamping force looseness conditions.

Figure 10.
Faulty winding with global looseness conditions.

Figure 11.
Vibration of winding under global looseness conditions with the rated current at measuring point #2.
Figure 11.
Vibration of winding under global looseness conditions with the rated current at measuring point #2.
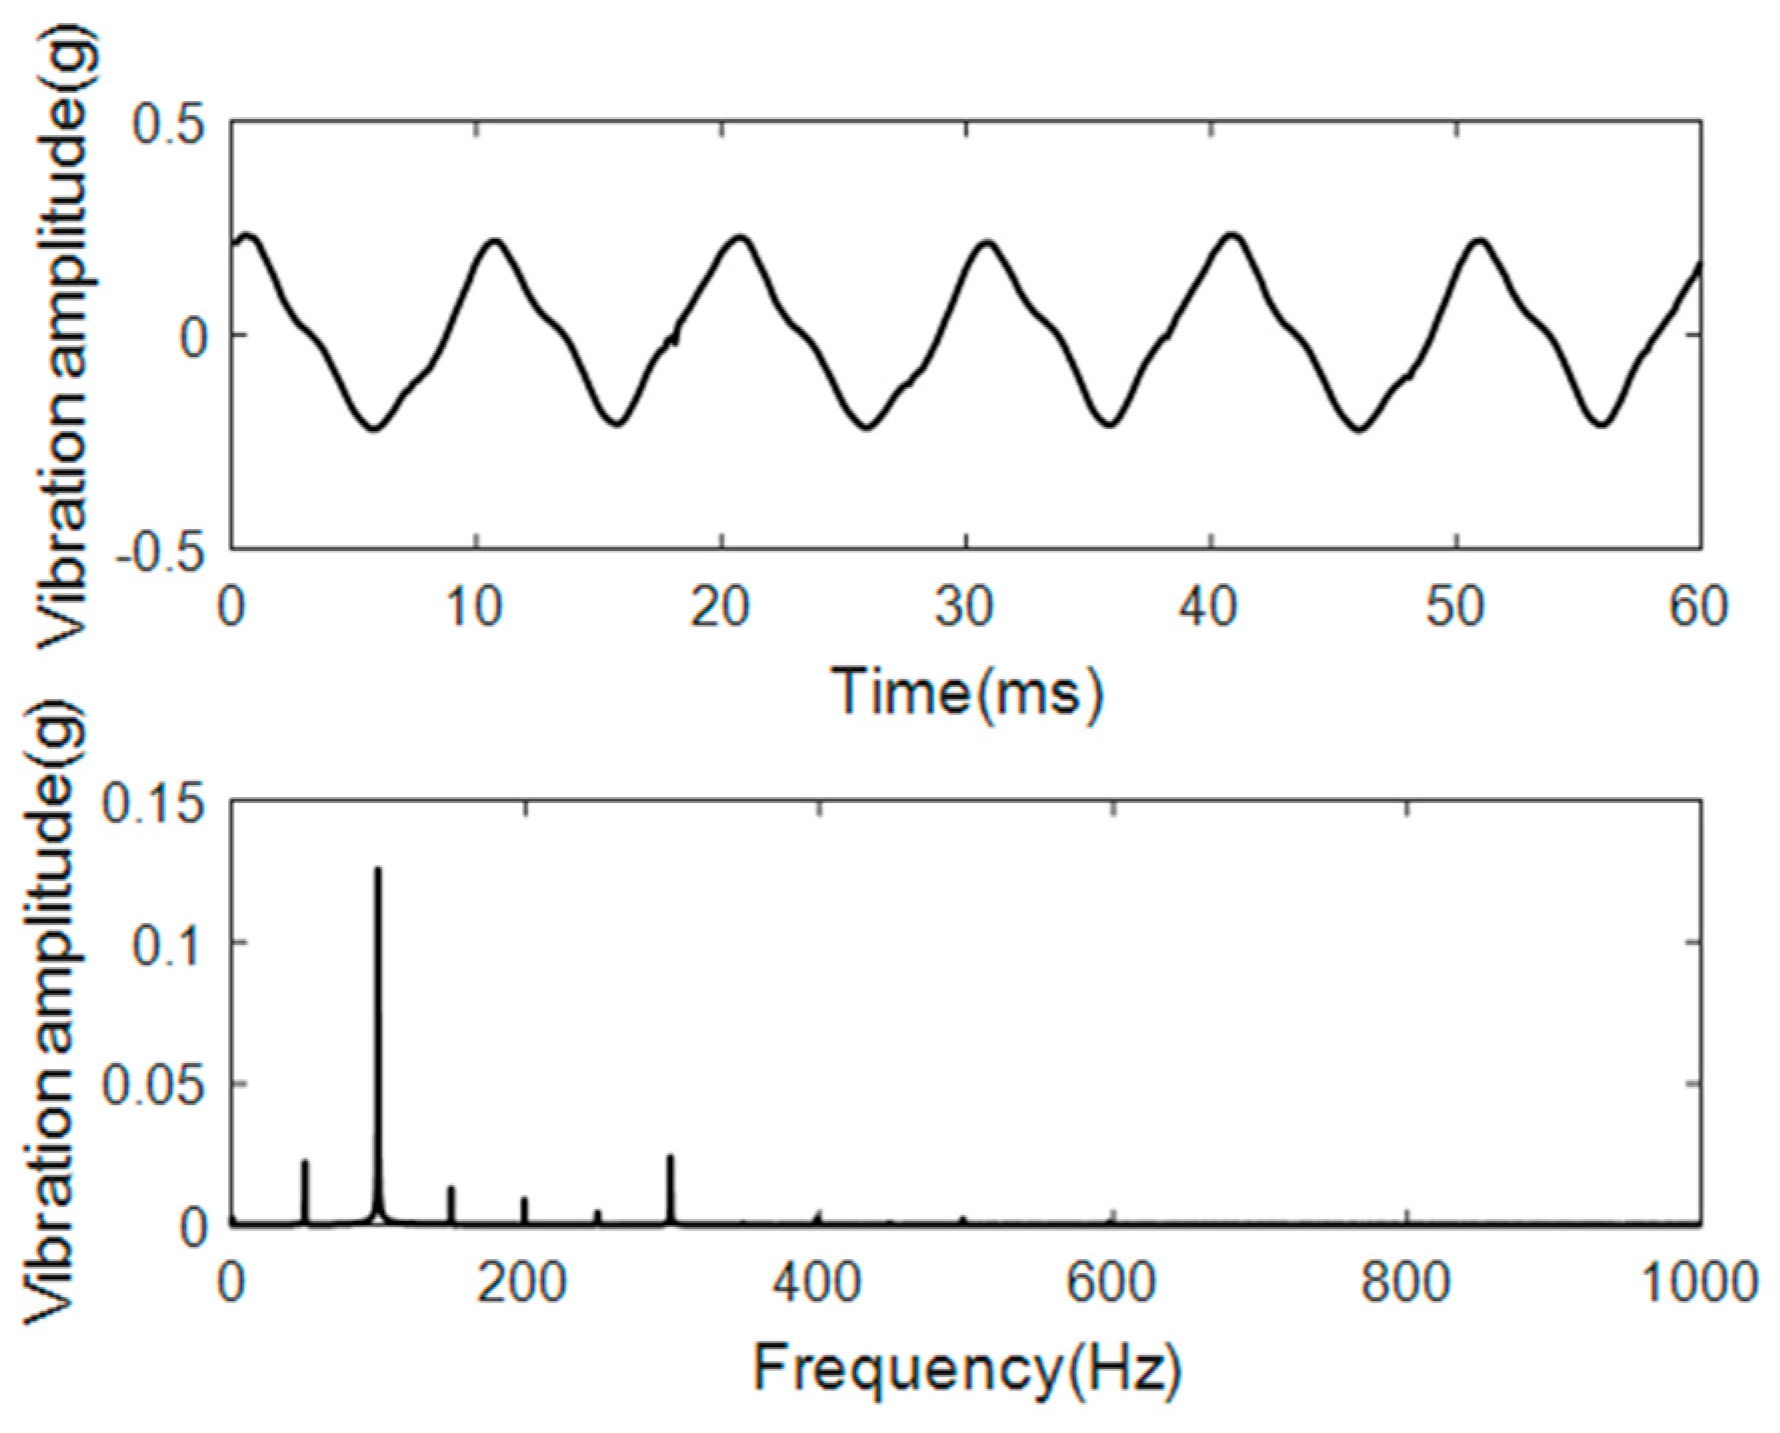
Figure 12.
Vibration distribution pattern Vm×n(100) under global looseness conditions with different winding currents (m = 5, n = 1).
Figure 12.
Vibration distribution pattern Vm×n(100) under global looseness conditions with different winding currents (m = 5, n = 1).
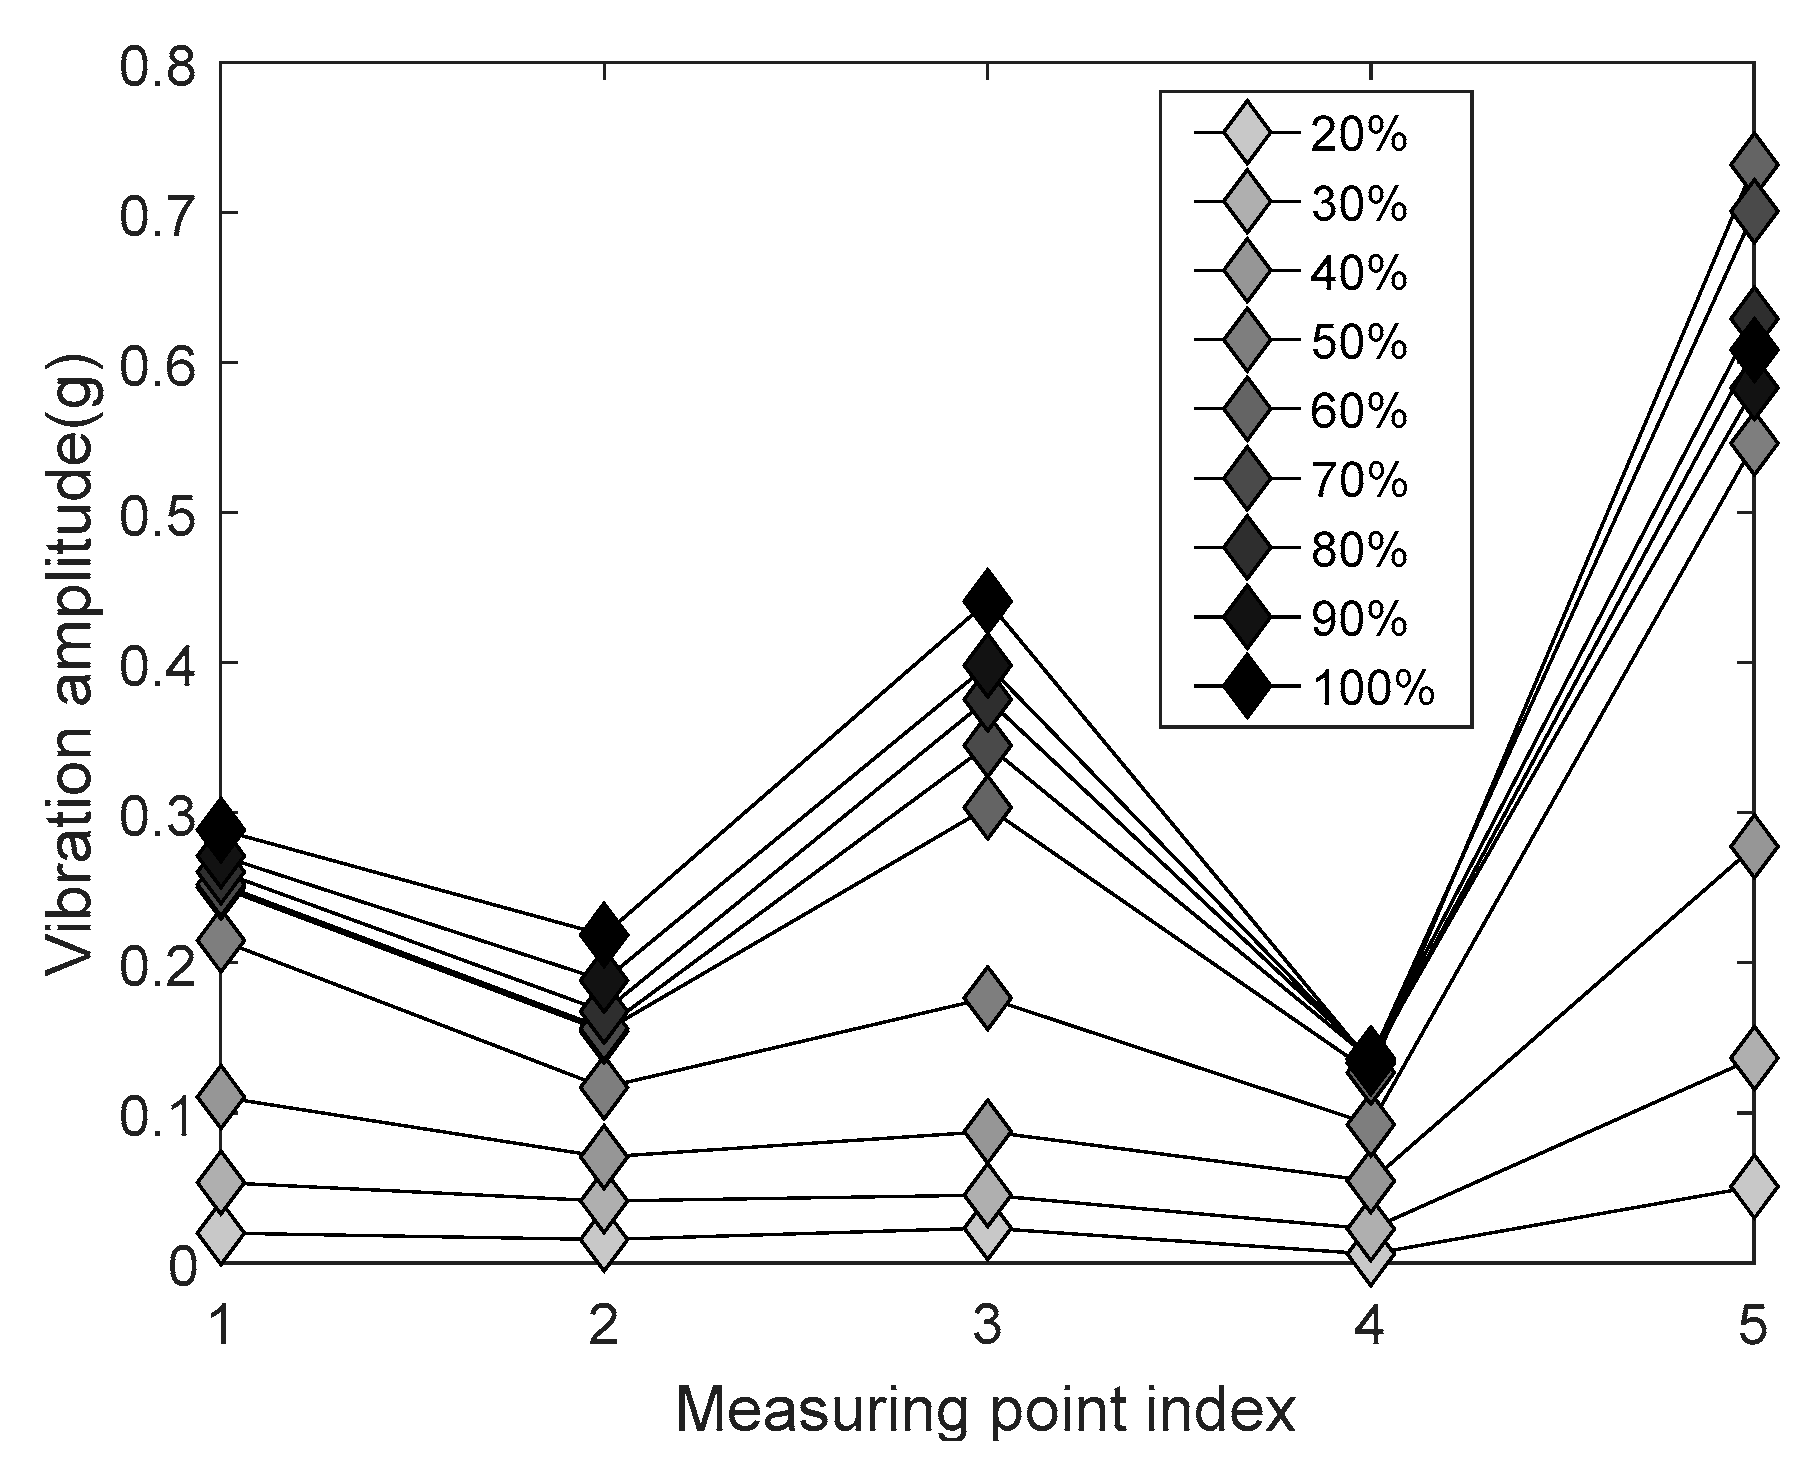
Figure 13.
Winding vibration trends with the increasing loading currents under global looseness conditions.
Figure 13.
Winding vibration trends with the increasing loading currents under global looseness conditions.
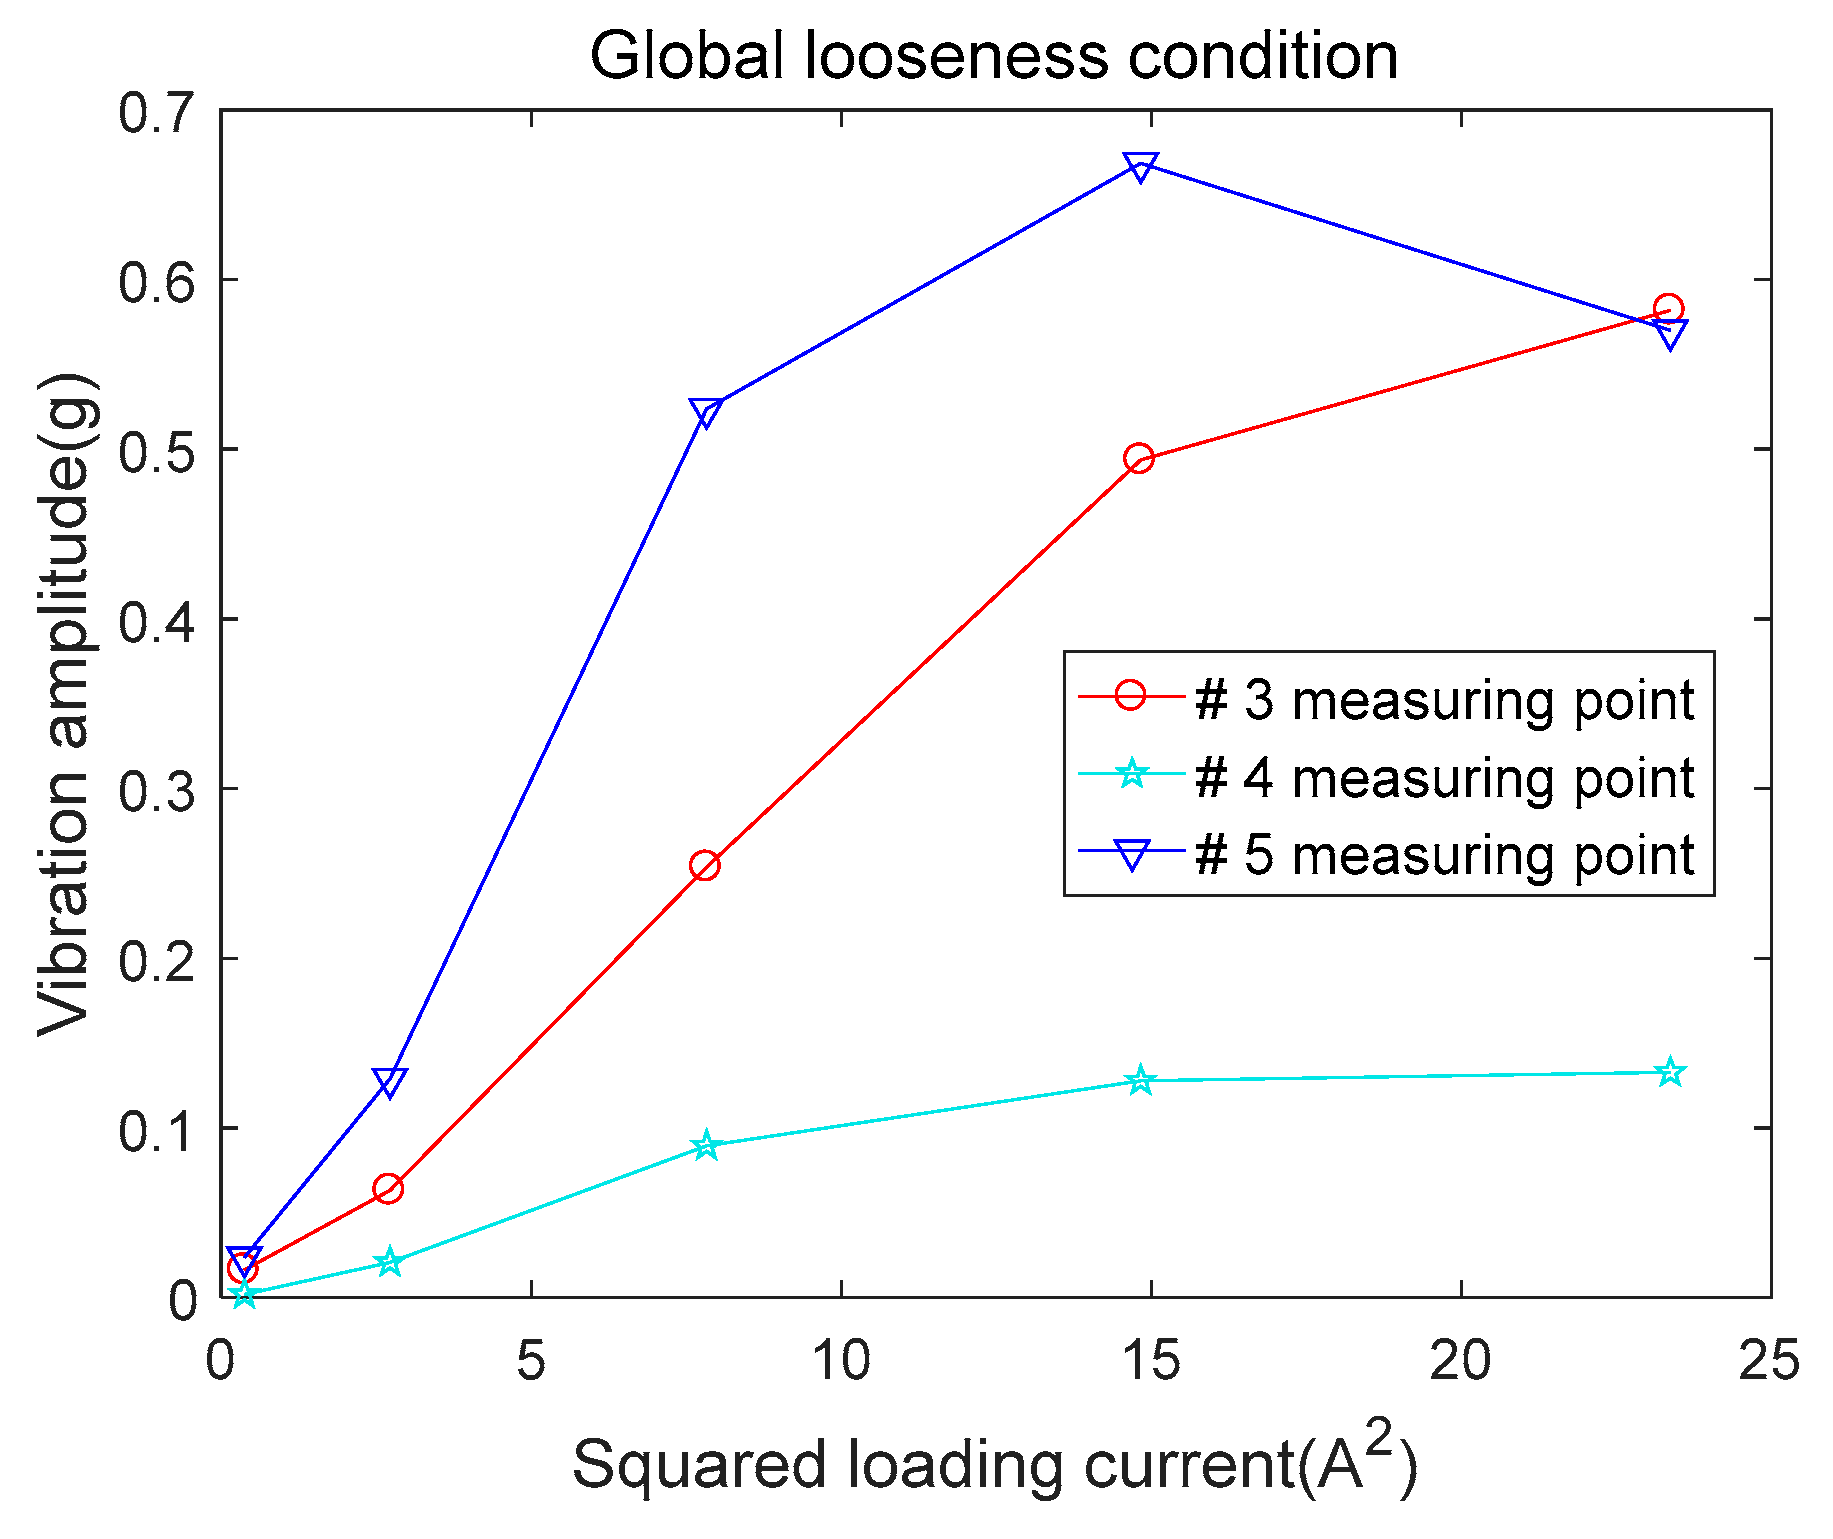
Figure 14.
(a) Accelerometer location of the transformer tank; (b) the test transformer.

Figure 15.
Measurement point distribution and establishment of coordinate system.
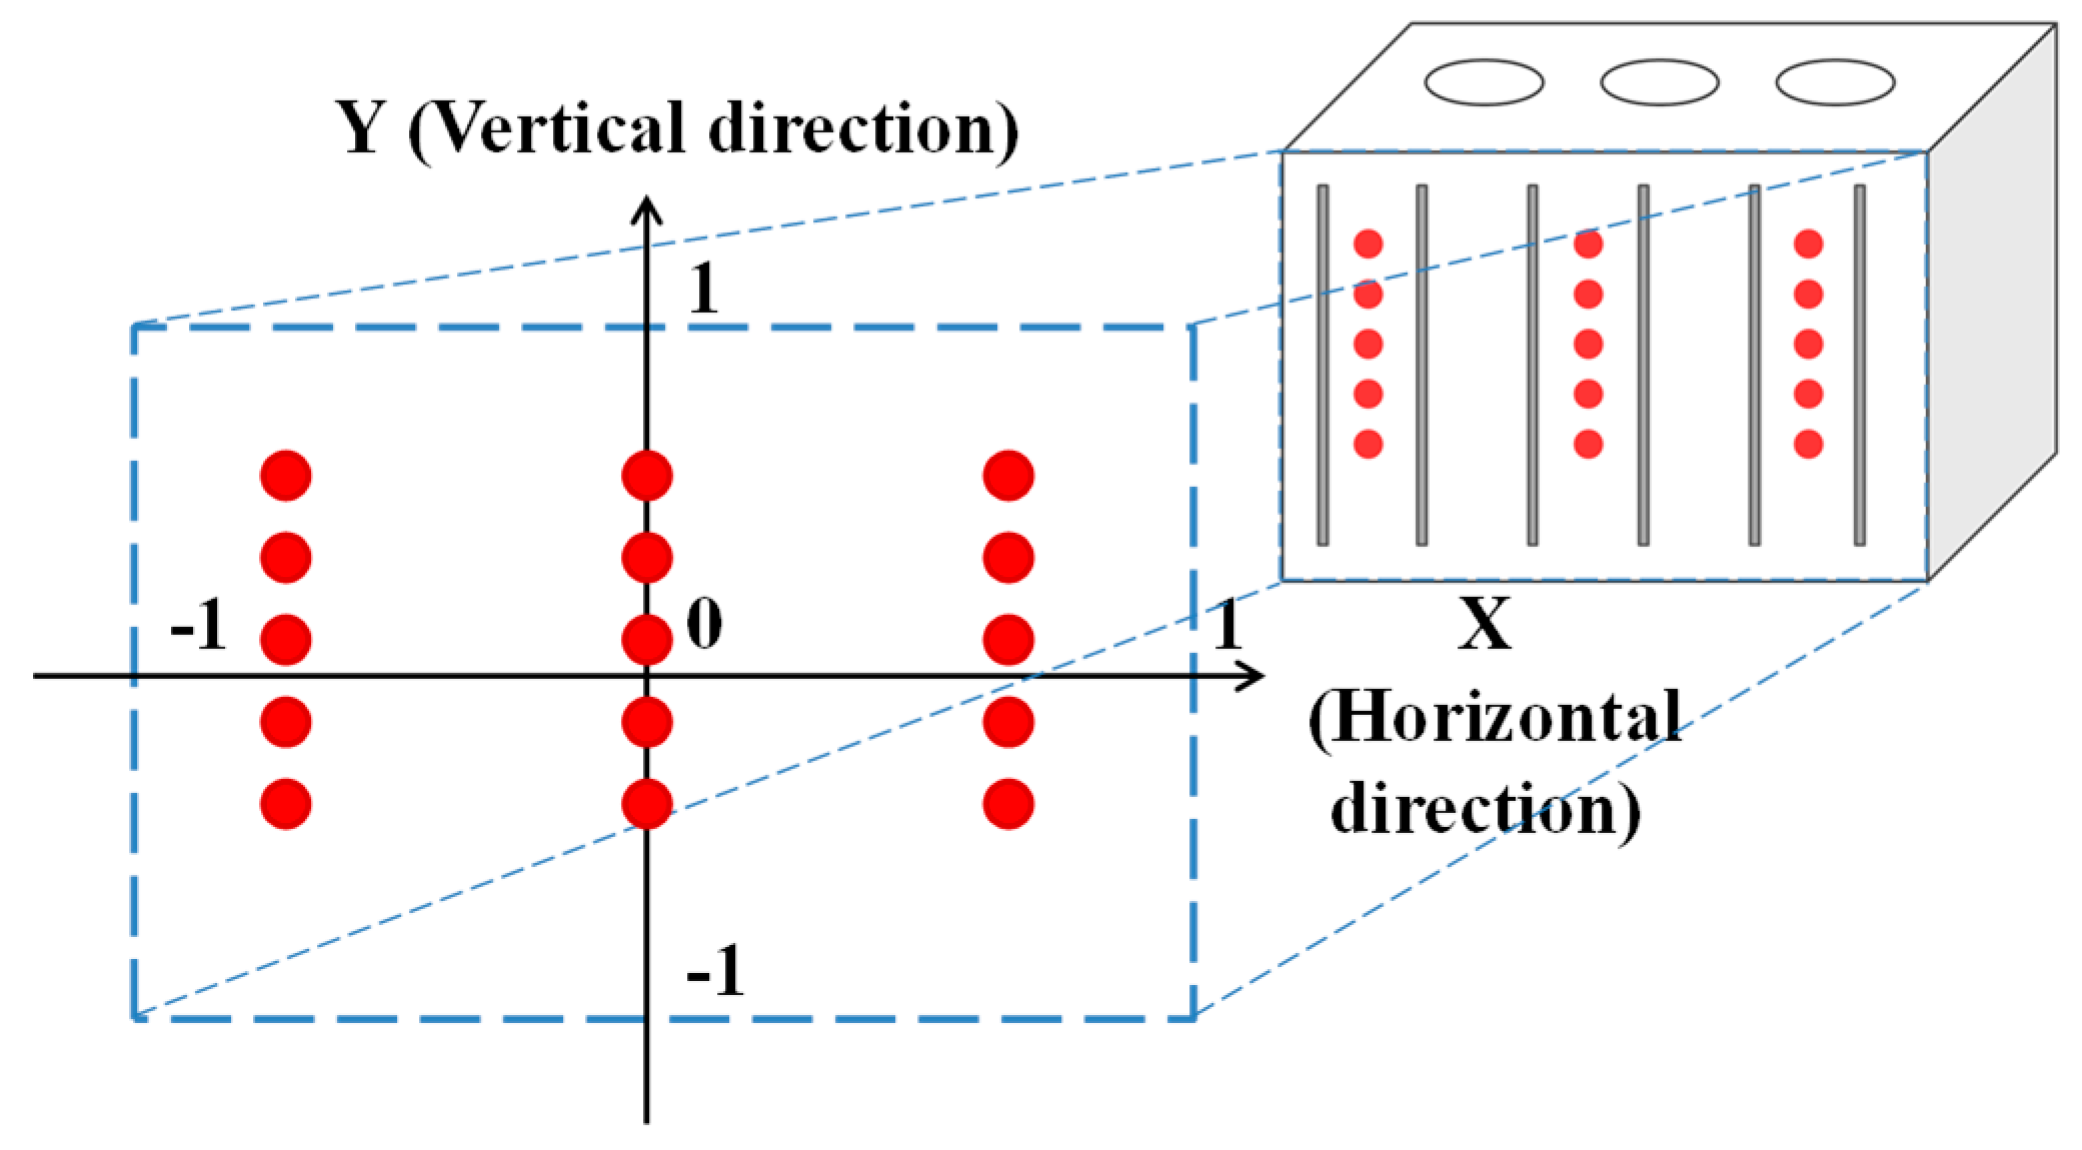
Figure 16.
Tank vibration signal under normal conditions with the rated current at measuring point #5.
Figure 16.
Tank vibration signal under normal conditions with the rated current at measuring point #5.

Figure 17.
Tank vibration distribution patterns with the increasing current under normal conditions.
Figure 17.
Tank vibration distribution patterns with the increasing current under normal conditions.

Figure 18.
Tank vibration signal under clamping force looseness conditions of each winding with the rated current at measuring point #5. (a) A phase winding looseness; (b) B phase winding looseness; (c) C phase winding looseness.
Figure 18.
Tank vibration signal under clamping force looseness conditions of each winding with the rated current at measuring point #5. (a) A phase winding looseness; (b) B phase winding looseness; (c) C phase winding looseness.
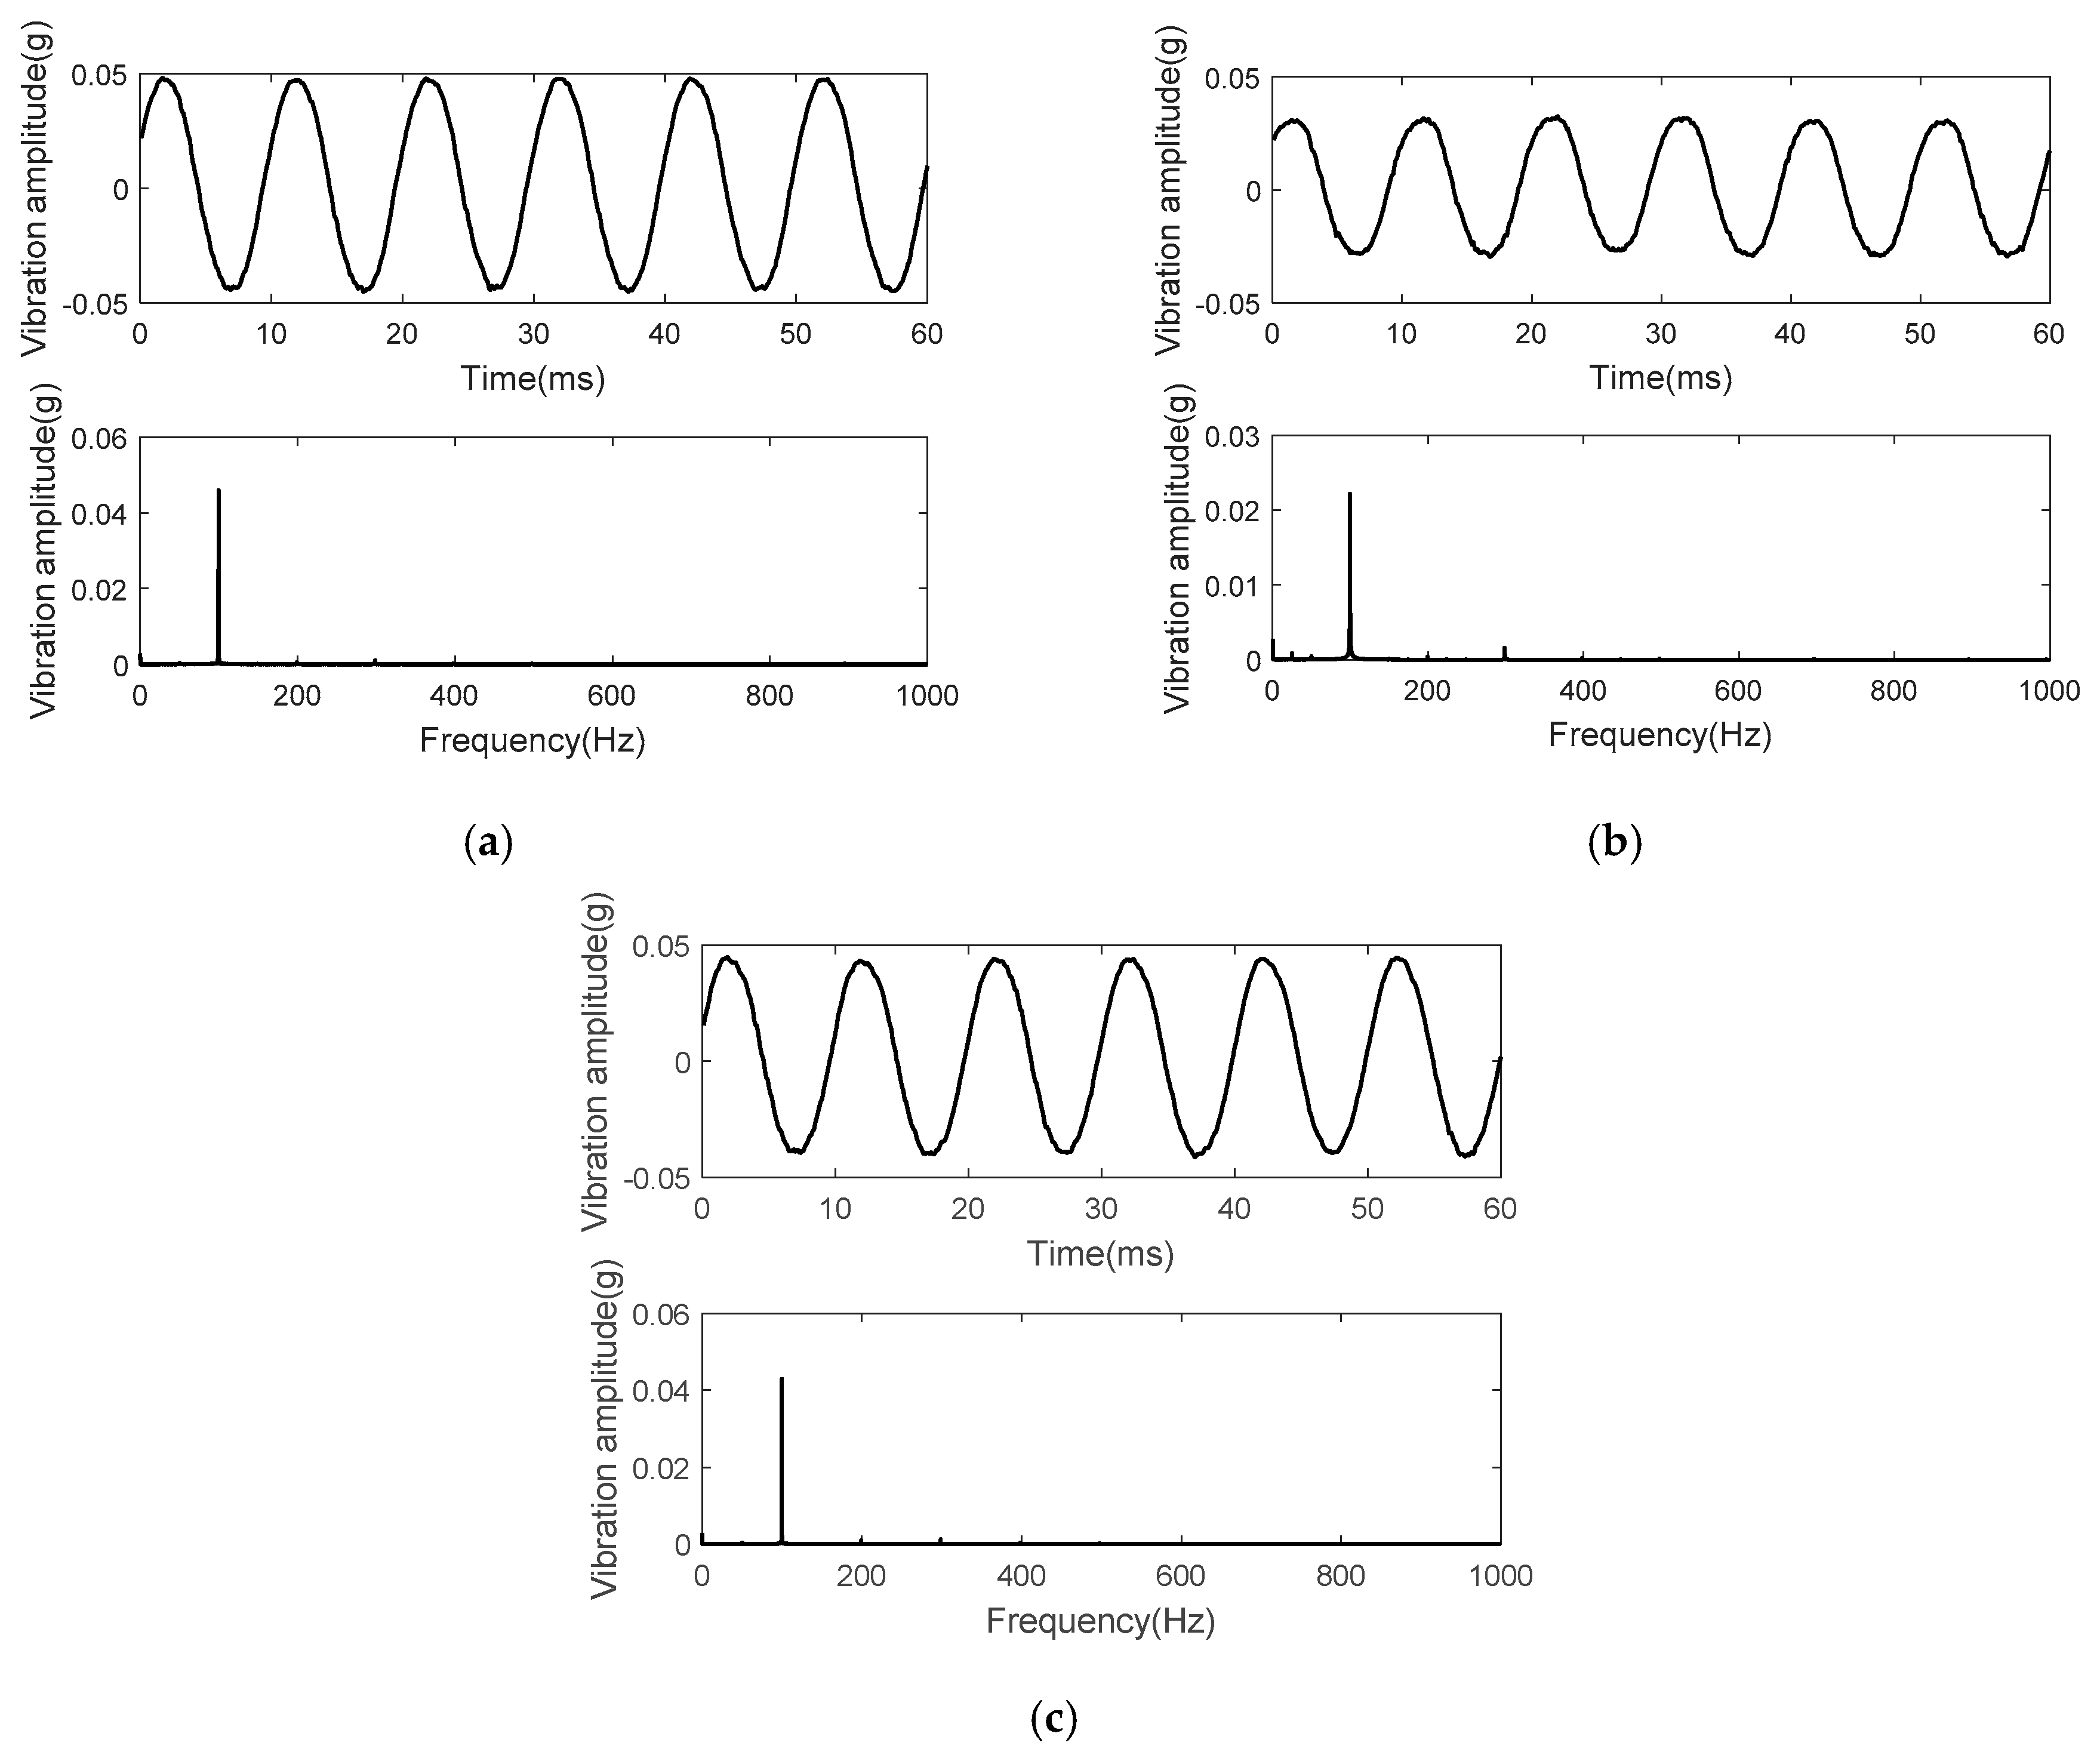
Figure 19.
Tank vibration distribution patterns with the increasing current under clamping force looseness conditions of each winding. (a) A phase winding looseness; (b) B phase winding looseness; (c) C phase winding looseness.
Figure 19.
Tank vibration distribution patterns with the increasing current under clamping force looseness conditions of each winding. (a) A phase winding looseness; (b) B phase winding looseness; (c) C phase winding looseness.

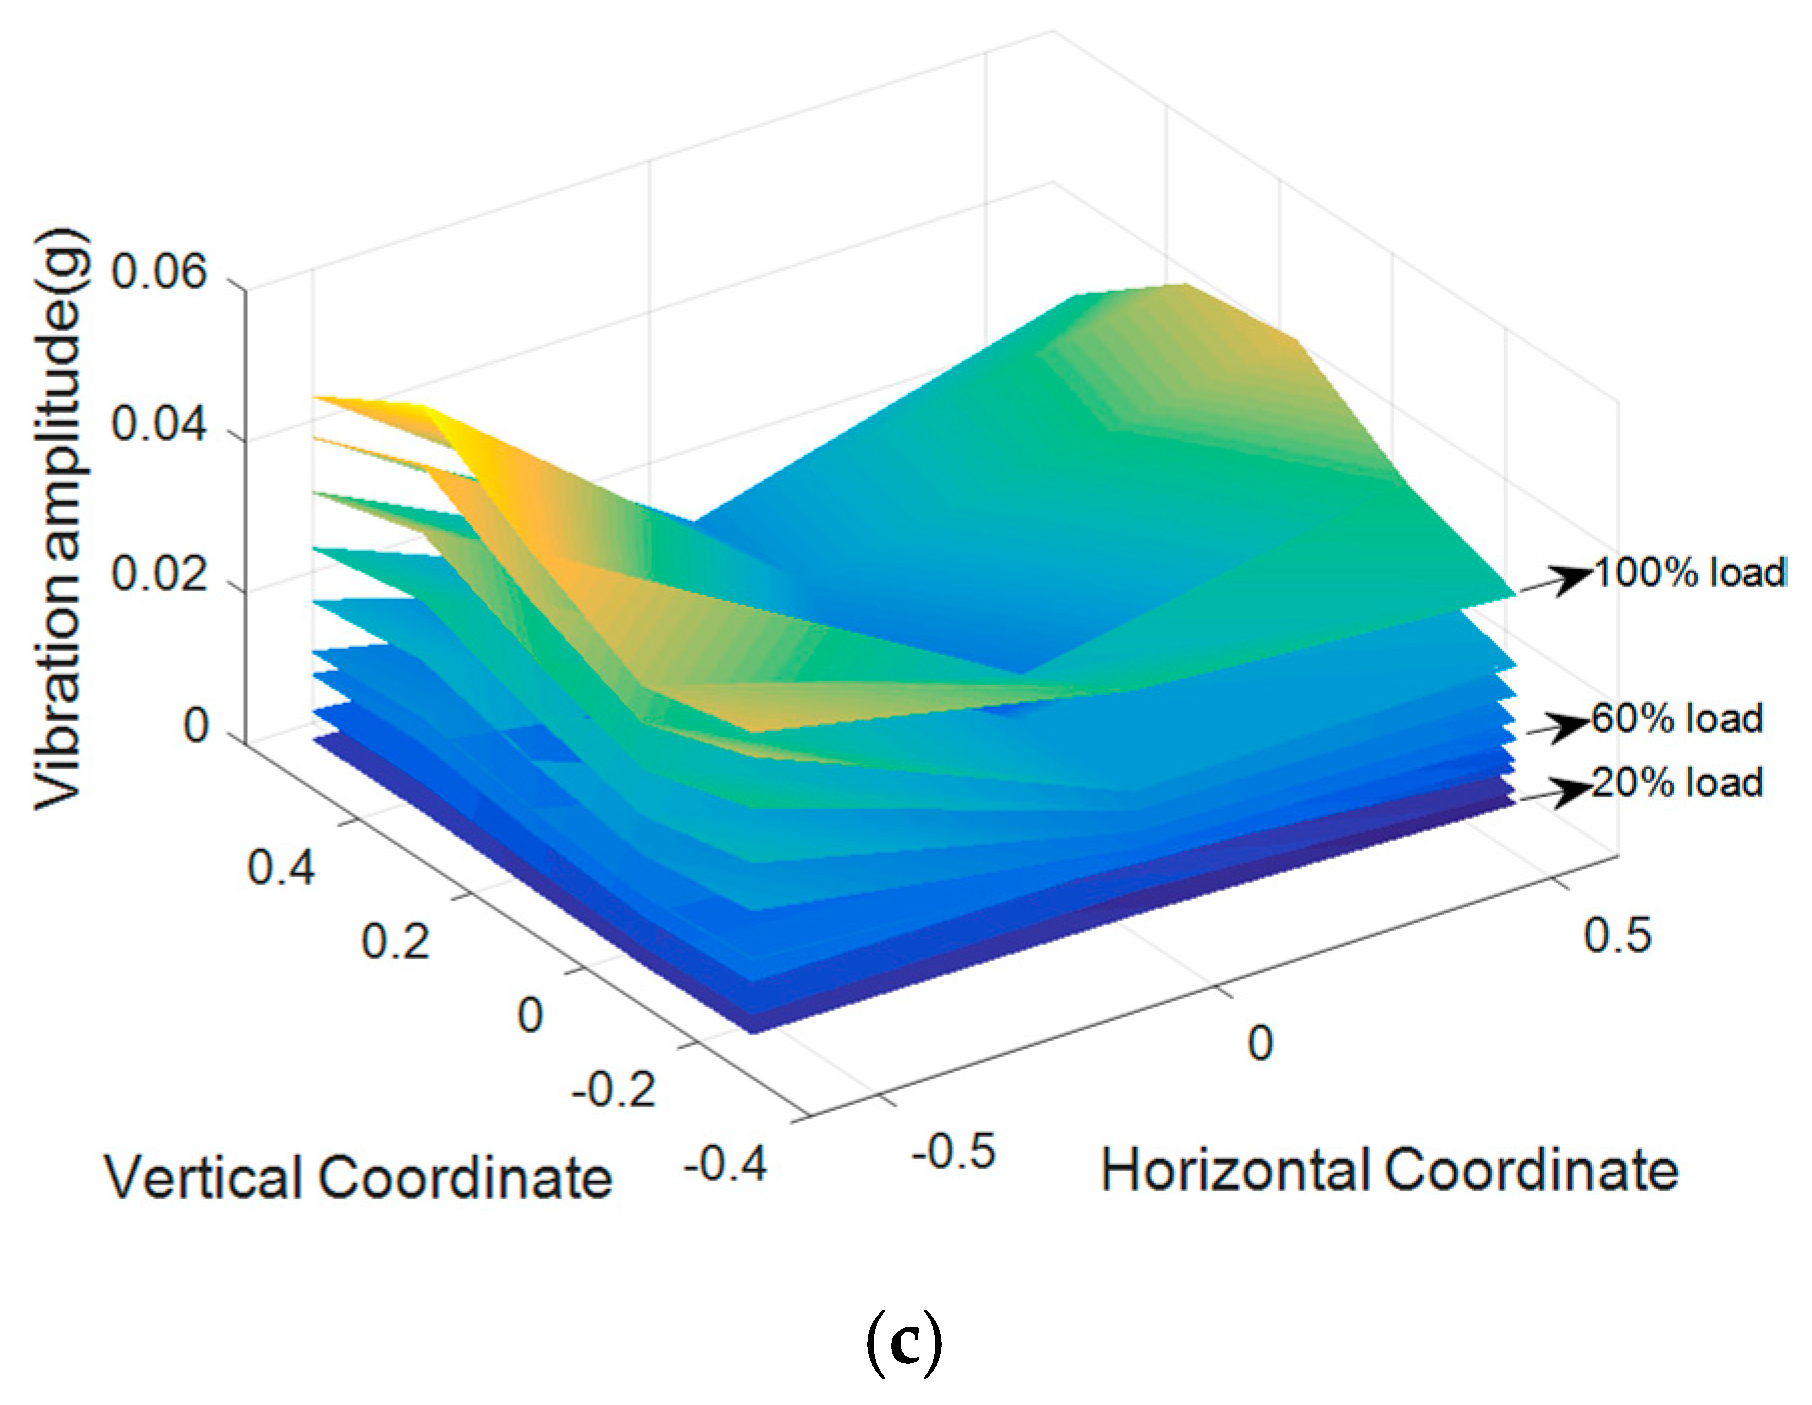
Figure 20.
Tank vibration signal under global looseness conditions with the rated current at measuring point #5.
Figure 20.
Tank vibration signal under global looseness conditions with the rated current at measuring point #5.

Figure 21.
Tank vibration distribution patterns with the increasing current under winding global looseness conditions.
Figure 21.
Tank vibration distribution patterns with the increasing current under winding global looseness conditions.

Figure 22.
Artificial winding deformation: Radial buckling of the A phase winding after short-circuit.
Figure 22.
Artificial winding deformation: Radial buckling of the A phase winding after short-circuit.
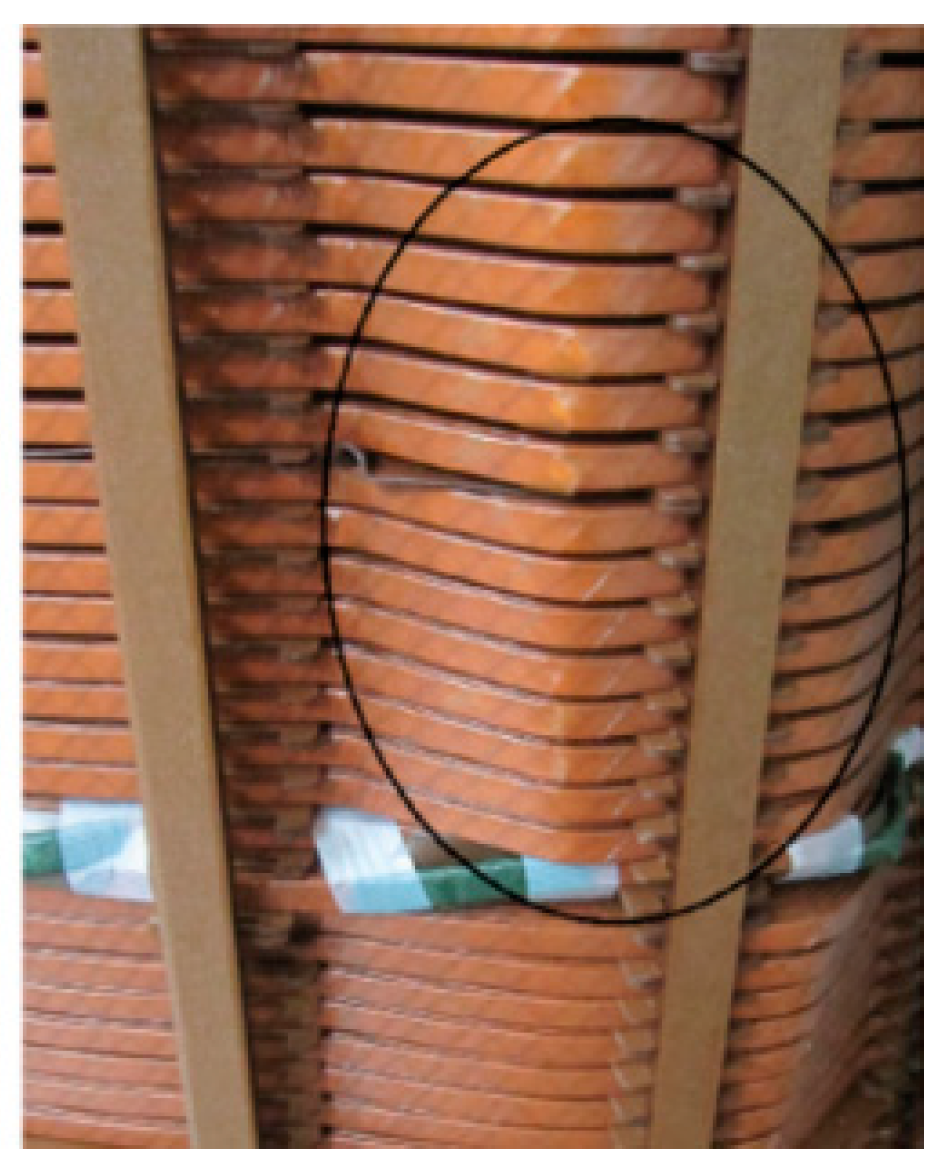
Figure 23.
Tank vibration signal under winding deformation conditions with the rated current at measuring point #5.
Figure 23.
Tank vibration signal under winding deformation conditions with the rated current at measuring point #5.

Figure 24.
Tank vibration distribution patterns with increasing currents under winding global looseness conditions.
Figure 24.
Tank vibration distribution patterns with increasing currents under winding global looseness conditions.

Figure 25.
VDCs under (a) normal condition; (b) A phase winding clamping force looseness conditions; (c) B phase winding clamping force looseness conditions; (d) C phase winding clamping force looseness conditions; (e) global looseness conditions; (f) winding deformation condition with different winding currents.

© 2019 by the authors. Licensee MDPI, Basel, Switzerland. This article is an open access article distributed under the terms and conditions of the Creative Commons Attribution (CC BY) license (http://creativecommons.org/licenses/by/4.0/).
Share and Cite
MDPI and ACS Style
Hu, Y.; Zheng, J.; Huang, H. Experimental Research on Power Transformer Vibration Distribution under Different Winding Defect Conditions. Electronics 2019, 8, 842. https://doi.org/10.3390/electronics8080842
AMA Style
Hu Y, Zheng J, Huang H. Experimental Research on Power Transformer Vibration Distribution under Different Winding Defect Conditions. Electronics. 2019; 8(8):842. https://doi.org/10.3390/electronics8080842
Chicago/Turabian StyleHu, Yiwei, Jing Zheng, and Hai Huang. 2019. "Experimental Research on Power Transformer Vibration Distribution under Different Winding Defect Conditions" Electronics 8, no. 8: 842. https://doi.org/10.3390/electronics8080842
Note that from the first issue of 2016, this journal uses article numbers instead of page numbers. See further details here.