


Abstract
Novelty detection is the identification (normal or anomalous) of test data differing from the training data (all are normal). It has gained significant attention in many fields, due to the infrequency and unpredictability of anomalies in reality. Most novelty detection methods focus on improving performance under single modal data source conditions. However, in complex realities, relying on single modal data often fails to capture the true state of the object under observation. Thus, these methods cannot always offer accurate and reliable decisions in novelty detection. Moreover, research on novelty detection under multi-modal conditions is relatively limited. Therefore, we propose MSENet, an end-to-end multi-modal semantic-enhanced network based on autoencoder for novelty detection, including the feature-extraction and semantic-mining modules, which can effectively reconstruct the multi-modal data belonging to a target class by bridging the semantic gaps between different modalities. In addition, we develop an L1* regularization method based on L1-norm to select more representative features by promoting sparser weights during the optimization process. The results of the novelty detection experiment on two multi-modal datasets demonstrate that our method outperforms state-of-the-art methods. Furthermore, an ablation study and a regularization experiment verified the effectiveness of the MSENet and L1* regularization methods.
1. Introduction
Novelty detection involves identifying test data that differs from the training data in specific ways. Compared to similar concepts, such as anomaly detection and outlier detection, which may contain some abnormal training samples, novelty detection is intended to be fully unsupervised, i.e., it assumes no anomalies in the training data. Therefore, novelty detection is often referred to as one-class classification [1,2]. Accordingly, it is typically used when there are not enough available anomalies to construct explicit models for abnormal classes. In practical applications, anomalies occur unpredictably and relatively infrequently; however, they can have significant effects on the performance of the whole system. Hence, novelty detection has attracted considerable research interest in various application domains, including health monitoring [3], industrial robots [4], and others. Although a number of studies on novelty detection exist, novelty detection is still an extremely challenging topic and deserves further investigation in the future, due to the unpredictability of anomalies and their accessibility in reality.
Recently, deep learning-based algorithms have gained popularity for novelty detection [5,6,7]. Among these algorithms, autoencoders have been proven to be effective and have been widely used as the base of many novelty detection methods because of the strong representation ability they learn by reconstructing input data. Autoencoder-based novelty detection methods operate on the assumption that a model trained on normal data will reconstruct normal test samples better than anomalies. However, most autoencoders focus solely on improving novelty detection performance under single modal source conditions. A significant limitation is that these models may capture the features that anomalies also possess, which can result in perfectly reconstructed anomalies. To select more representative features, regularization methods, e.g., L1 regularization [8] and L2 regularization [9], can be used to limit the weight coefficients of the network in the optimization process of novelty detection [10].
The real world involves huge amounts of multi-modal data, where the term multi-modal refers to information from multiple modalities, including texts, images, videos, etc.; each of these is a modality. It has been reported that learning from multi-modal sources can capture correlation between modalities and outperforms learning from a single modality, in many cases [11]. Nowadays, multi modal-based methods have become a new trend in sentiment analysis [12], retrieval [13], and so on. However, research on novelty detection under multi-modal conditions is relatively limited, mainly concentrated on a given multi-modal application [14,15,16,17], and its universality has rarely been studied. Moreover, implementing novelty detection for multi-modal data typically involves two-phase procedures, which separately handle multi-modal feature fusion and novelty detection. This separation may cause error accumulation or information loss problems and, eventually, result in poor performance for objectives. Therefore, investigating the novelty detection of multi-modal data is crucial to effectively leverage comprehensive information and enhance decision-making accuracy.
This paper primarily focuses on novelty detection in multi-modal data. The main contributions are as follows: (1) An end-to-end multi-modal semantic-enhanced network (MSENet) based on autoencoder is proposed, including feature-extraction and semantic-mining modules, which can effectively bridge the semantic gaps between different modalities and improve the reconstruction ability for multi-modal data within the target class; (2) An L1* regularization method is developed based on L1-norm to promote sparser weights in the model optimization process, thereby further selecting more representative features; and (3) Experimental results from novelty detection on two multi-modal datasets confirm that the proposed method outperforms state-of-the-art methods. Additionally, the effectiveness of the MSENet and L1* regularization methods is validated through an ablation study and a regularization comparison with popular algorithms.
The remaining part of this paper is organized as follows: Section 2 summarizes related works on novelty detection using both unimodal and multi-modal sources, as well as regularization methods for feature selection. Section 3 describes the proposed method for novelty detection in multi-modal data, including the MSENet, the L1* regularization, and the novelty detection. Section 4 shows experimental details, such as the multi-modal datasets, the comparative methods, the experimental results of the novelty detection, the ablation study, and the regularization comparison. Finally, Section 5 presents the conclusions and the directions for future study.
2. Related Works
Novelty detection mainly involves learning the pattern of normal data during training and recognizing anomalies in test data. In recent years, this topic has gained significant interest. Generally, novelty detection methods can be mainly divided into density-based, distance-based, and self representation-based methods [18].
Density-based methods construct a density estimation model to comprehend the distribution of normal data, and identify anomalies based on the fact that the likelihood of anomalies is lower than that of normal data, which include density estimation [18], frequency-based [19], and energy-based methods [20]. As a typical example, the generative probabilistic novelty detection method [18], based on adversarial autoencoders, uses an adversarial loss to impose priors on the output distribution, and the probability density is employed as the novelty score. Distance-based methods measure the length between data and their surrounding points and assume that anomalous data have a large distance from common patterns, which include k-nearest neighbors [21] and k-medoid methods [9,22]. Among these, a notable example is the deep support vector data description method (deep SVDD) [9]. This approach is grounded in kernel-based SVDD, aiming to find a hypersphere that encloses the data with the smallest possible volume, and detects anomalies based on the distance between the test data and the hypersphere’s center. Self representation-based methods attempt to learn features automatically from data to obtain a good representation and consider those data that cannot be accurately represented as anomalies, which include generative adversarial network-based [23] and autoencoder-based [24] methods. A known work in this category is the adversarially learned one-class classifier for novelty detection [25] based on a generative adversarial network and autoencoder. Overall, the autoencoder is a network of vital importance, which can be used to generate high-quality features to enhance other algorithms for novelty detection or learn data representations to directly detect anomalies. Many autoencoder-based methods have been considered for the novelty detection task [26]; most of these include improvements in novelty detection under single data source conditions. However, autoencoder-based methods confront the weakness that the models trained from normal data possibly learn, that similar representations exist in some abnormal data for unknown reasons. This may lead to well-reconstructed anomalies and cause performance degradation. For the selection of more representative features, the regularization in the optimization process of novelty detection is an effective method, which limits the weight coefficients of networks by incorporating a regularization term (penalty term) to the loss function of the model [10]—for example, L1 regularization [8] and L2 regularization [9].
Multi-modal data are a widely existing form of data in real-world application scenarios. It has been reported that the models utilizing multiple modalities deliver better performance than those using a single modality, in many cases [11]. This means that the combination of multi-modal learning and common tasks, including novelty detection, has significant practical value; thus, multi-modal data novelty detection is an important issue that should be addressed. Until now, few researchers have made efforts to explore the potential of multiple modalities in novelty detection. For example, Yoo et al. [14] presented an autoencoder-based multi-modal anomaly detection method for object slip perception of mobile manipulation robots in which sound, force-torque, RGB, and depth images were used. Wang et al. [15] proposed Multi-3D-Memory with hybrid feature fusion based on RGB images and 3D point clouds, which is a novel multi-modal industrial anomaly detection method. Liu et al. [16] developed a deep novelty detection method based on RGB images and topo color-imaging data to enhance automatic optical inspections, enabling accurate detection of anomalies in components on circuit boards. More recently, Jiang et al. [17] proposed a zero-shot industrial anomaly detection framework, in which the global semantic embeddings of a vision-language model and the multi-scale structural visual features are hierarchically aligned by a dual-modality attention mechanism. Although several studies have been conducted to investigate multi-modal data novelty detection, this research topic is far from being fully discovered, since the methods have been proposed only for certain scenarios that may not be applicable to other scenarios. Furthermore, the strategies adopted in most multi-modal data novelty detection methods are two-phase procedures: the first procedure is the fusion of multi-modal features, followed by the decision of novelty detection. However, the reconstruction errors in the two-step methods may not be able to fully represent the original features, potentially decreasing the accuracy of the final novelty detection result.
In addition to bridging the semantic gaps between modalities, the representativeness of the learned features is also important for autoencoder-based novelty detection, since the models may capture the features that anomalies also possess. Regularization is a common way to select more representative features by constraining the network weights. L1 regularization, known as the lasso [27], drives part of the parameters to zero and thus performs feature selection; it is preferred over L2 regularization when many features are irrelevant [28]. Efficient training algorithms have been developed for L1-regularized models [29] and the idea of feature sparsity has been extended to neural networks [8] and autoencoders [10]. Non-convex penalties, such as Lp (0 < p < 1) regularization, have been shown to yield sparser solutions than L1 regularization, at the cost of non-convex optimization [30,31].
Our method builds upon autoencoders and presents a universal multi-modal data novelty detection method, in which both the semantic gap between different modal data and the feature representativeness in novelty detection are considered for more precise detection.
3. The Proposed Method
We propose the multi-modal semantic-enhanced network (i.e., MSENet), which can bridge the semantic gap between different modalities for multi-modal data novelty detection. The MSENet comprises two main modules: the feature-extraction network and the semantic-mining network, both of which are jointly and unsupervisedly learned within an end-to-end framework. In addition, we introduce an L1 regularization-based method, named L1* regularization, to select more representative features, which encourages sparser weights. During the training process, the model learns potential patterns of the target class by using a designed objective function. Then, the model detects novelties during the testing process based on novelty scores consistent with the objective function of the MSENet, as shown in the detection stage of Figure 1. Details of the MSENet, the L1* regularization, the full objective, and the novelty detection are given as follows.
3.1. MSENet
The architecture of the proposed MSENet is illustrated in Figure 1. It is evident that the MSENet includes the feature-extraction network for multiple modal data and the semantic-mining network for the extracted features. They are built using the autoencoder (i.e., encoder and decoder) with fully connected layers as the basic structure.
Depending on the different types and feature dimensions of different modalities, the corresponding autoencoders are asymmetrically designed, and, thus, the feature-extraction network is composed of several autoencoders (denoted by encoders fm and decoders gm for modalities m = 1,2,…,M in Figure 1), while the semantic-mining network includes an autoencoder (denoted by encoder fS and decoder gS in Figure 1), as its essence is to extract semantic information from multiple modalities.
Figure 1.
Overview of the proposed MSENet for multi-modal data novelty detection.
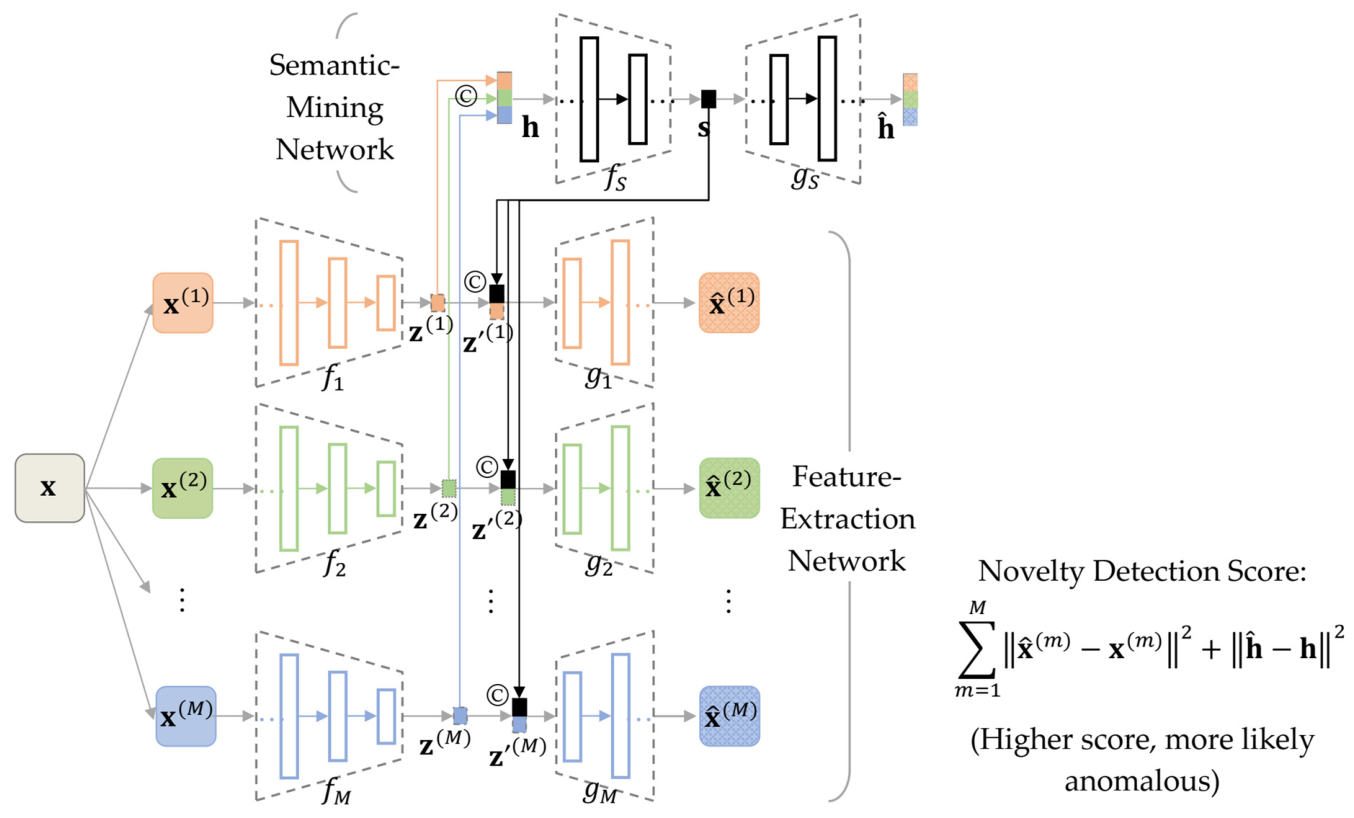
During the training process of the model, given a multi-modal dataset with M modalities for N instances, the feature-extraction network first encodes its input multi-modal data x = {x(1),x(2),…,x(M)} as features z(m) = fm(x(m)). Then, these extracted features of multiple modalities are fused by Concat operation © (i.e., concatenate tensors in a certain axis, with the prerequisite that the other axes need to maintain the same dimensions) and are input to the semantic-mining network in the h = z(1)©z(2)©…©z(M) form. The semantic-mining network learns the semantic s = fS(h) shared in the fused features to reconstruct its inputs, based on that semantic information, and outputs . Then, the mined common semantic s is fused with the extracted features z(m) from the encoders fm of the feature-extraction network using Concat operation, respectively, and generates the semantic-enhanced features: z’(m) = z(m)©s. After that, the feature-extraction network decodes the semantic-enhanced features z’(m) and outputs . Eventually, the feature-extraction network learns the semantic-enhanced feature representations within the target class to reconstruct its inputs based on those semantic-enhanced features. The above processes are the key processes shown in Figure 1.
The basic structure of the MSENet is autoencoders; the autoencoder usually exploits the mean-squared error to measure the reconstruction error for tasks related to novelty detection [32]. That is, we need the outputs of the feature-extraction and semantic-mining modules to be close to the corresponding inputs, respectively. Accordingly, the training optimization objective of the MSENet, consisting of the feature-extraction and semantic-mining modules, can be expressed as:
3.2. L1* Regularization
Regularization is essential for avoiding overfitting during model training. The two predominant forms of regularization are L1 and L2 regularizations [29]. L1 regularization imposes a penalty on the weight vector based on its L1-norm, which is the sum of the absolute values of the weights, while L2 regularization applies a penalty based on the L2-norm, calculated as the square root of the sum of the squares of the weights. Notably, L2 regularization tends to shrink the weights but does not result in any weights being exactly zero, a problem known as ridge regression [28]. In contrast, L1 regularization can effectively drive weights towards zero [27], leading to sparsity in the parameter vector. This occurs because the gradients in L1 regularization can only take on values of 1 or −1, directing the optimization towards the axis aligned with the smallest entry, resulting in all parameters shrinking by the same amount.
We show the sparsity property of the regularizers from the aspect of geometry. Let w be the incoming weight vectors to any hidden unit, then the Lp-norm of w can be defined as , where the p-values used for L1 and L2 regularizations are 1 and 2, respectively. If we denote c as an upper bound on the norm, the optimization occurs within the constraint ‖w‖p ≤ c.
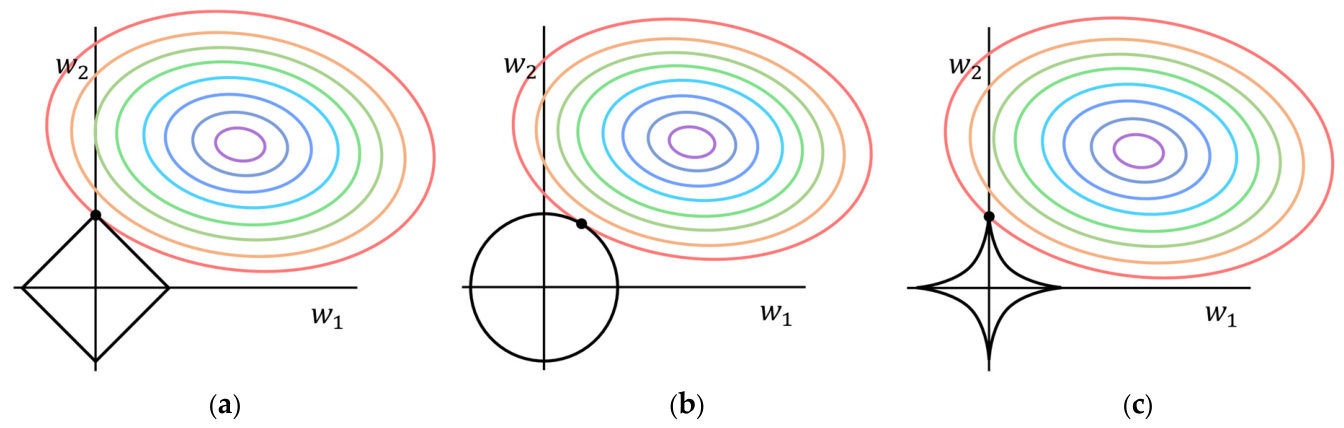
Figure 2 depicts the penalty of the L1 and L2 regularizers when there are only two parameters: w1 and w2. In Figure 2a, the constraint region |w1| + |w2| ≤ c for the L1 regularizer is a diamond shape. The optimal solution is identified at the first intersection of the contours with the box constraint, which occurs at a vertex corresponding to a zero coefficient. Conversely, the constraint region for the L2 regularizer is illustrated in Figure 2b. Due to the absence of vertices in the contour shapes, the likelihood of achieving zero coefficients is considerably lower. This observation raises the question of whether the penalty of L1 can be reshaped while retaining its sparsity-promoting property. Inspired by the quadrangular star shape (i.e., the diamond shape with concave arc edges) commonly used to depict the non-convex Lp (0 < p < 1) penalties [30,31], we propose the L1* regularizer based on L1 and denote it as:
where W includes all weights of the network and k is a hyper-parameter. Importantly, a necessary constraint for k is k ≥ 1. When k = 1, Equation (2) will degenerate into L1. We give an example of k = 2, as schematically illustrated in Figure 2c. It should be noted that Figure 2c is a conceptual illustration of the design motivation of L1*, an analogy of the quadrangular star-shaped constraint regions commonly used to depict the non-convex Lp (0 < p < 1) penalties [30,31]. Since L1* is a monotonic transformation of the global L1-norm, which is continuous at ‖W‖1 = 1 and reduces to L1 when k = 1, its effect on the optimization is realized through the reshaped penalty term in Equation (3). With this design, the L1* regularizer is expected to show a propensity for sparsity while keeping a milder shrinkage than the L1 regularizer.
Figure 2.
Estimation pictures for: (a) L1; (b) L2; and (c) L1* regularizers.
3.3. Full Objective
To effectively train the model, LMSENet is calculated as the loss of the MSENet. An additional loss L1* is also integrated into the full objective to make feature representation more representative. Therefore, the goal is to optimize the feature representation of samples using the training dataset by minimizing the full loss Loss that consists of the two loss functions:
where λ > 0 serves as a hyperparameter controlling the model complexity. Note that setting λ = ∞ in Equation (3) yields the fully constrained solution (c = 0), whereas λ = 0 results in the unconstrained solution (c = ∞). The whole training procedure of the proposed MSENet with L1* regularization is shown by Algorithm 1.
| Algorithm 1 Training procedure for the proposed method | |
| Input: Multi-modal dataset ; hyperparameters k, λ | |
| Output: The trained model | |
| 1: | for each epoch do |
| 2: | for each mini batch do |
| 3: | for each modality do |
| 4: | map |
| 5: | generate |
| 6: | end for |
| 7: | map fS:hi → si; |
| 8: | for each modality do |
| 9: | generate |
| 10: | map |
| 11: | end for |
| 12: | compute |
| 13: | back-propagate Loss and update W |
| 14: | end for |
| 15: | end for |
3.4. Novelty Detection
The output parameters of the trained model will be used for novelty detection testing. Consistent with the training function of the MSENet, the novelty score Score of the testing multi-modal data x is formulated as follows:
where x(m) and denote the input and output of the feature-extraction module in the MSENet for modality m = 1,2,…,M, respectively, while h and denote the input and output of the semantic-mining module. It should be noted that h is a fusion feature based on the different modal features z(m) extracted from the feature-extraction module through Concat operation. It should also be noted that the reconstruction error of each modality, in both the training objective and the novelty score, is computed as the mean-squared error, i.e., the squared error is averaged over the feature dimension of that modality, so that the modalities with substantially different feature dimensions contribute on a comparable scale. As discussed, the MSENet learns the semantic-enhanced feature representation primarily via the reconstructions of target class samples and their fused features. Therefore, the score for the negative (novelty) samples in the test set would be high. A higher score indicates that the test sample is more likely to be anomalous.
4. Experiments
We evaluated our method for novelty detection on two different multi-modal datasets. A detailed performance analysis was also conducted comparing our method to state-of-the-art novelty detection methods. In addition, an ablation study and a regularization experiment with popular regularization algorithms were executed to validate the significance of our schemes. The following sections provide comprehensive details regarding the datasets, comparative methods, as well as the experimental results and discussions surrounding novelty detection, the ablation study, and regularization experiments.
4.1. Datasets
We utilized the Multi-modal Sarcasm Detection dataset (MUStARD) [33] and the Universal-FUNNY dataset (UR-FUNNY) [34] for novelty detection. The two datasets were selected because they are publicly available and each of their samples contains three modalities, i.e., text, video, and audio, with the feature extraction procedures provided in the original works [33,34]. This enabled the novelty detection methods to be evaluated on multi-modal data under a unified and reproducible setting. To produce understandable inputs for models, the data from the two multi-modal datasets were processed as described below.
MUStARD is a sarcasm detection dataset with multiple modalities derived from well-known television shows. It includes 690 audiovisual utterances annotated with Sarcastic and Non-Sarcastic labels, where each utterance accompanied by its context involves three modalities, i.e., Text, Video, and Audio. Following prior research [33], we used BERT-base uncased model [35], ImageNet [36] pretrained ResNet-152 [37] image classification model, and speech processing library Librosa [38] to, respectively, extract language (768-dim), visual (2048-dim), and acoustic (283-dim) features for each utterance.
UR-FUNNY is a humor detection dataset with multiple modalities sampled from the TED talks. It includes 16,514 video segments annotated with Humor and Non-Humor labels, where each instance involves three modalities, i.e., Text, Video, and Audio. Following previous work [34], we used Glove word embeddings [39], OpenFace facial behavioral analysis tool [40], and COVAREP software (Version 1.4.2) [41] to, respectively, extract language (6000-dim), visual (7420-dim), and acoustic (1620-dim) features for each instance. Then, these features were aligned on the word level.
In our experiments, the Sarcastic class and the Humor class were used as the normal classes for the MUStARD and UR-FUNNY datasets, while the other classes were classified as anomalies. All input data were normalized to the range [0, 1]. All compared methods followed an identical experimental protocol, in which only target-class (normal) samples were used for training, whereas the test set consisted of an equal number of normal and anomalous samples. Table 1 summarizes the statistical details of the two multi-modal datasets employed.
Table 1.
Statistical details of multi-modal datasets.
4.2. Compared Methods
To evaluate the performance of our method, we compared the novelty detection results on the test sets of the above datasets against several existing novelty detection methods, including one-class support vector machine (OC-SVM) [42], kernel density estimation (KDE) [43], deep autoencoder (DAE) [44], and deep SVDD [9]. In addition, we compared the presented L1* regularization in our method with a few popular regularization methods comprising L1 regularization [27] and L2 regularization [45], combined with the MSENet. The following provides a brief introduction to, and the experimental settings of, the comparative methods.
OC-SVM/SVDD utilizes the hyperplane to segregate anomalous from normal data, calculating the novelty score as the distance between the trained hyperplane and the test instance. The inverse length scale γ ∈ {2−10,2−9,…,2−1} is optimized via grid search based on performance metrics from a holdout set consisting of 10% of randomly selected normal training data;
KDE uses a kernel function to approximate the underlying data distribution, assigning a probability to each test instance that serves as the novelty score. The Gaussian kernel bandwidth h ∈ {2−4.5,2−4,…,25} is determined using 5-fold cross-validation by utilizing log-likelihood criteria;
DAE operates through an encoder–decoder architecture to reconstruct input samples, with the reconstruction error of test instances being interpreted as the novelty score. The latent space feature dimension is set to 64. For training, the model undergoes 10 + 40 epochs on the MUStARD dataset and 60 + 40 epochs on the UR-FUNNY dataset, beginning with an initial learning rate of 10−5, which is later fine-tuned to 10−6;
Deep SVDD projects normal data into the smallest enclosing hypersphere, utilizing the distance from test points to the hypersphere’s center to compute the novelty score. The center and the network weights are initialized based on the pre-trained DAE, adhering to specific operational constraints. The latent space dimension is 64. For training, the model undergoes 20 + 10 epochs on the MUStARD dataset and 40 + 20 epochs on the UR-FUNNY dataset, beginning with an initial learning rate of 10−5, which is later fine-tuned to 10−6.
4.3. Implementation Details
In our novelty detection experiments involving the two multi-modal datasets, we set the latent space feature dimensions of the autoencoders to 8. That is, the dimensions of the extracted features from each modality and the mined common semantics from all modalities are 8, as the autoencoders are the fundamental components of our model. Thus, for each modality, the dimensions of the semantic-enhanced features fused by the extracted features and the mined common semantics in the MSENet are 16. Since multi-modal data have already been preprocessed according to previous work, as introduced in detail in Section 4.1, the dense layers are adopted in the whole network, and the leaky rectified linear unit (leaky ReLU) [46] activation layers are added to all layers except the final layers of the encoders and decoders in the MSENet. The specific configurations of our model for the MUStARD and UR-FUNNY datasets are summarized in Table 2.
Table 2.
Details of the MSENet architectures used on multi-modal datasets.
During the training process, the network weights are continuously optimized by our L1* weight regularizer, where the constraint parameter k is set as 2 for both datasets. The tuning parameters λ for the MUStARD and UR-FUNNY datasets are different, i.e., 10−6 and 10−3, respectively. Our model is trained on the MUStARD dataset for 230 epochs with a batch size of 50, and on the UR-FUNNY dataset for 40 epochs with a batch size of 100. We employ the Adam optimizer to minimize the loss function, with learning rates set to 10−5 and 5 × 10⁻⁷ for the MUStARD and UR-FUNNY datasets, respectively.
4.4. Novelty Detection Experiment
To evaluate the performance of the methods in the experiments, we utilized the area under the curve (AUC) of the receiver operating characteristic (ROC), which is a widely used evaluation metric in novelty detection [47]. We conducted 10 numerical tests with different random seeds and report the average AUC. Table 3 compares the average AUC values of our method with those of the state-of-the-art novelty detection methods on the MUStARD and UR-FUNNY datasets.
Table 3.
Average AUCs in % with StdDevs (over 10 seeds) per method on multi-modal datasets in novelty detection experiment.
Table 3 illustrates that our method achieves superior average AUC values of 69.956% and 55.123% on the MUStARD and UR-FUNNY datasets, respectively, substantiating its efficacy in novelty detection for multi-modal data. Significantly, all methods including our method have relatively higher average AUC values on the MUStARD dataset than on the UR-FUNNY dataset. The reason for this performance can be attributed to the presence of contextual information accompanying each utterance within the MUStARD dataset. In contrast, the UR-FUNNY dataset does not leverage such context, resulting in less comprehensive information for training. Compared with that from the UR-FUNNY dataset, the multi-modal samples from the MUStARD dataset have more comprehensive information about the target class; thus, the feature representations of the MUStARD dataset are more easily learned by the model than those of the UR-FUNNY dataset. On UR-FUNNY, the margin of our method over the strongest baseline is only 0.178%, and all the compared methods stay within a narrow band above the chance level. We, therefore, do not claim a clear advantage on this dataset. Section 4.6 analyzes why the performance of all the methods stays low in that instance. In summary, these findings validate that our proposed MSENet with the L1* regularization method surpasses the state-of-the-art methods on the MUStARD and UR-FUNNY datasets for novelty detection.
4.5. Ablation Study and Regularization Experiment
To emphasize the importance of individual components in the novelty detection task, i.e., the MSENet and the L1* regularization, an ablation study and a regularization experiment were conducted on the MUStARD and UR-FUNNY datasets.
In the ablation study, the following conditions were considered: (1) Compared with the proposed method, the scenario removes the L1* regularizer and only the MSENet is trained for novelty detection; (2) On the basis of (1), the scenario removes the entire semantic-mining network, as well as the final dense and leaky ReLU activation layers of encoders in the feature-extraction network. Then, the dimensions of the extracted features by the modified feature-extraction network from each modality are fixed as 16, with the aim to maintain the same dimension as that of the proposed method. This can be referred to as the baseline; (3) On the basis of (2), the scenario adds the L1* regularizer. In the regularization experiment, two popular regularization methods, i.e., (4) L1 and (5) L2, are added to the training process of MSENet, respectively. Then, we conducted a comparative analysis of the performance of our proposed method against these scenarios. The average AUC values from the ablation study and regularization experiment on the MUStARD and UR-FUNNY datasets are presented in Table 4.
Table 4.
Average AUCs in % with StdDevs (over 10 seeds) per method on multi-modal datasets in ablation study and regularization experiment.
As shown in Table 4, the average AUC values for MSENet are 69.772% and 55.119% on the MUStARD and UR-FUNNY datasets, respectively, which are still higher than that of the compared methods shown in Table 3, indicating that our proposed MSENet for novelty detection is more effective than the novelty detection methods. In addition, the baseline with L1* has a higher average AUC value than that of the baseline without L1* in most cases, and the MSENet with L1* has a higher average AUC value than that of the MSENet without L1* in all cases, indicating that our proposed L1* regularization is also effective. Therefore, it is concluded that each individual component of our proposed method is of significance to the novelty detection of multi-modal data. The proposed MSENet outperforms the compared state-of-the-art methods for novelty detection in multi-modal data.
It is also important to note that the baseline method and the baseline with L1* method yield the same AUC values on the UR-FUNNY dataset, as shown in Table 4. However, this may be because of the given number of decimal places of the parameter values; thus, their results may not be really the same. As regularization is a technique of fine-tuning learning algorithms to increase model robustness, there is usually not a considerable difference between the regularization methods for the average AUC values of the resulting model. For example, it can be seen from Table 4 that the average AUC values determined by the MSENets with L1, with L2, and with L1* methods, respectively, differ by only 0.018–0.156% on the MUStARD dataset and by 0.001–0.004% on the UR-FUNNY dataset.
Although the average AUC values of our proposed method, i.e., MSENet with L1* regularization, are slightly higher than those of the MSENets with L1 and with L2 on the two datasets, such small differences need to be checked statistically. Therefore, the Kruskal–Wallis test [48], a non-parametric test, was applied to the AUCs of the 10 seeds of the methods in Table 4 on each dataset, with a significance level of 0.05. The results are shown in Table 5. On the MUStARD dataset, the p-value is less than 0.05, which indicates statistically significant differences among the methods. The estimated mean ranks obtained by multiple comparisons are given in Table 6. Our proposed MSENet with L1* has the highest mean rank (i.e., 41.1), followed by the MSENets with L1 (i.e., 41.0) and with L2 (i.e., 40.1); all the MSENet-based methods rank much higher than the two baseline methods. On the UR-FUNNY dataset, the p-value is larger than 0.05; thus, we do not claim a significant advantage of L1* on this dataset. As analyzed in Section 4.6, all the methods stay close to the chance level on UR-FUNNY, which may be mainly due to the weak signal of the dataset itself for separating the two classes.
Table 5.
Kruskal–Wallis ANOVA table of average AUCs (over 10 seeds) per method in ablation study and regularization experiment on MUStARD dataset.
Table 6.
Estimated values of the mean ranks of average AUCs (over 10 seeds) per method in ablation study and regularization experiment on MUStARD dataset.
To directly examine the sparsity-promoting effect of the regularizers, Table 7 reports the proportion of near-zero weights, i.e., the proportion of the weights whose absolute values are below a given threshold, together with the mean absolute weight, of the MSENets without regularization and with L1, L2, and L1*. On both datasets, the MSENet with L1* has a higher proportion of near-zero weights than the MSENet without regularization and the MSENet with L2 under all the thresholds, which indicates that the L1* regularizer promotes sparser weights, whereas the MSENet with L1 presents the sparsest weights. Moreover, as the threshold decreases from 10−4 to 10−6, the proportion of near-zero weights of the MSENets without regularization and with L2 drops markedly, whereas that of the MSENet with L1* decreases much more slowly, as is the case for the MSENet with L1. This indicates that L1*, like L1, drives part of the weights towards exactly zero, rather than merely shrinking them, as L2 does. It should be noted that all the regularizers share the same λ within each dataset; thus, the comparison is not made at an equal shrinkage strength. Since ‖W‖1 of the trained network is of the order of 105 on the MUStARD dataset and 106 on the UR-FUNNY dataset, L1* always takes the branch of Equation (2), and its gradient with respect to an individual weight is more than two orders of magnitude smaller than that of L1, i.e., λ. The L1* regularizer thus reaches a higher sparsity level than the unregularized model under a much milder shrinkage, and at the same time obtains the highest AUC in Table 4, which indicates that the sparsity level alone does not determine the detection performance.
Table 7.
Proportion (%) of near-zero weights and mean absolute weight of the MSENets with different regularizers.
4.6. Analysis of the Performance on the UR-FUNNY Dataset
Table 3 shows that all the compared methods, including ours, stay close to the chance level on the UR-FUNNY dataset. To investigate this further, we split the novelty score into its four terms—the reconstruction errors of the three modalities and that of the fused semantic feature—and use each term alone as a novelty score. This shows how much of the detection signal every modality carries inside the trained model. Since the values are close to 50%, Table 8 also reports a 95% bootstrap confidence interval and the p-value of a label-permutation test against the chance level.
Table 8.
AUCs in % of the individual terms of the novelty score on the UR-FUNNY dataset.
The visual and the text terms are above the chance level, but the margin is small, while the audio term is at the chance level and the semantic term is not significant. The confidence intervals of the four terms overlap; therefore, we do not read too much into their order. No single modality separates the two classes well and the four terms have almost the same magnitude; thus, their sum gives the informative terms the same weight as the uninformative ones. These results also give a partial view of the contribution of each modality inside the trained MSENet. In this dataset, the visual term alone is even slightly higher than the full novelty score, which indicates that the multi-modal score does not always outperform the most informative single modality.
The spread of the reconstruction error over the whole test set stays within a fraction of a percent of its mean; the Non-Humor samples are reconstructed as accurately as the Humor ones. This is the weakness of the autoencoder-based methods mentioned in Section 1. The way in which UR-FUNNY is built makes it clearly visible, because the negative samples are drawn from the same videos as the positive ones, at points where the sentence is not followed by a laughter marker [34]. The two classes, therefore, share the speakers and the recording conditions. What tells them apart is whether the utterance works as a punchline, which depends on the context before it, and this context is not part of the input used here, as noted in Section 4.4.
Table 9 lists the worst false negatives and false positives. Their scores differ by less than half a percent of the mean score; thus, a very small change moves a sample from one end of the ranking to the other. The false negatives have almost the same score decomposition and the false positives have slightly higher reconstruction errors, mainly in the text and the visual terms. It can also be seen that the four terms are of almost the same magnitude, although the feature dimensions of the three modalities differ substantially, which indicates that no single modality dominates the novelty score, owing to the dimension-averaged reconstruction errors.
Table 9.
Representative failure cases on the UR-FUNNY dataset.
The low performance on UR-FUNNY, therefore, arises mainly from the properties of this dataset.
5. Conclusions
In this work, we introduced a novel method for novelty detection in multi-modal data. Specifically, we proposed an autoencoder-based semantic-enhanced network, named MSENet, with the goal of effectively bridging the semantic gaps between different modalities and enhancing the reconstruction ability of the model for the multi-modal data within the target class. Moreover, to further select more representative features, we introduced an L1* regularization method based on L1-norm by promoting sparser weights during the model optimization process. For the given MUStARD and UR-FUNNY datasets, we demonstrated that our proposed method performs well compared with some state-of-the-art novelty detection methods. Furthermore, through an ablation study and a regularization experiment compared with popular regularization algorithms, we showed that each component of the proposed method contributes to novelty detection, with statistically significant differences among the compared methods and the highest mean rank for our method on the MUStARD dataset.
Importantly, our method is a generic framework solution for the novelty detection of multi-modal data and can be easily extended to various applications. For example, it can be applied to the anomaly detection of multi-modal meteorological satellite data, thereby providing support for the quality control of satellite data and the monitoring of the on-orbit status of satellite platform and instruments. For future work, some modifications can be made to the network in order to achieve better performance in multi-modal data novelty detection, including inserting new layers, adjusting existing layers, or adding specific modules. In addition, a weighting of the novelty score that adapts to the modalities, and an evaluation on benchmarks where the novelty class is genuinely rare and distributionally distinct, are worth further investigation.
Author Contributions
Z.C.: Conceptualization, methodology, software, validation, formal analysis, investigation, resources, data curation, writing—original draft preparation, writing—review and editing, visualization. K.Z.: Software, validation, formal analysis, investigation, resources, data curation, visualization. H.M.: Validation, formal analysis, funding acquisition. R.S.: Conceptualization, resources, supervision, writing—review and editing. Y.P.: Supervision, funding acquisition. S.J.: Supervision, project administration, funding acquisition. All authors have read and agreed to the published version of the manuscript.
Funding
This research was funded by the National Natural Science Foundation of China, grant number 62306082, the National Key Technology Research and Development Program of China, grant number 2023YFB3907502, and the Youth Fund Project of Henan Provincial Natural Science Foundation, grant number 252300420954.
Data Availability Statement
The original contributions presented in this study are included in the article.
Conflicts of Interest
The authors declare no conflicts of interest.
References
- Sadooghi, M.S.; Khadem, S.E. Improving One Class Support Vector Machine Novelty Detection Scheme Using Nonlinear Features. Pattern Recognit. 2018, 83, 14–33. [Google Scholar] [CrossRef] [Scilit]
- Mujeeb, A.; Dai, W.; Erdt, M.; Sourin, A. One Class Based Feature Learning Approach for Defect Detection Using Deep Autoencoders. Adv. Eng. Inform. 2019, 42, 100933. [Google Scholar] [CrossRef] [Scilit]
- Mohammadi-Ghazi, R.; Marzouk, Y.M.; Büyüköztürk, O. Conditional Classifiers and Boosted Conditional Gaussian Mixture Model for Novelty Detection. Pattern Recognit. 2018, 81, 601–614. [Google Scholar] [CrossRef] [Scilit]
- Yang, B.; Huang, Y.; Jiao, J.; Xu, W.; Liu, L.; Xie, K.; Dong, N. Multidomain Neural Process Model Based on Source Attention for Industrial Robot Anomaly Detection. Adv. Eng. Inform. 2024, 62, 102910. [Google Scholar] [CrossRef] [Scilit]
- Chen, Z.; Zhao, K.; Sun, S.; Li, J.; Wang, S.; Sun, R. DMVSVDD: Multi-View Data Novelty Detection with Deep Autoencoding Support Vector Data Description. Expert Syst. Appl. 2024, 240, 122443. [Google Scholar] [CrossRef] [Scilit]
- Tsai, D.M.; Jen, P.H. Autoencoder-Based Anomaly Detection for Surface Defect Inspection. Adv. Eng. Inform. 2021, 48, 101272. [Google Scholar] [CrossRef] [Scilit]
- Chen, Z.; Zhao, K.; Yuan, G.; Duan, Q.; Sun, R. Multi-Modal Data Novelty Detection with Modal Diversity-Unity-Complementarity Representation. Adv. Eng. Inform. 2025, 67, 103496. [Google Scholar] [CrossRef] [Scilit]
- Lemhadri, I.; Ruan, F.; Abraham, L.; Tibshirani, R. LassoNet: A Neural Network with Feature Sparsity. J. Mach. Learn. Res. 2021, 22, 127. Available online: https://dl.acm.org/doi/10.5555/3546258.3546385 (accessed on 1 August 2026).
- Ruff, L.; Vandermeulen, R.; Goernitz, N.; Deecke, L.; Siddiqui, S.A.; Binder, A.; Müller, E.; Kloft, M. Deep One-Class Classification. In Proceedings of the International Conference on Machine Learning (ICML), Stockholm, Sweden, 10–15 July 2018; Volume 80, pp. 4393–4402. Available online: https://proceedings.mlr.press/v80/ruff18a.html (accessed on 1 August 2026).
- Ali, M.B. Use of Dropouts and Sparsity for Regularization of Autoencoders in Deep Neural Networks. Master’s Thesis, Bilkent University, Ankara, Turkey, 2015. Available online: https://repository.bilkent.edu.tr/server/api/core/bitstreams/db7781f4-980f-4a77-874c-2e6fbe72be97/content (accessed on 1 August 2026).
- Liu, J.; Cao, F.; Gao, X.Z.; Yu, L.; Liang, J. A Cluster-Weighted Kernel K-Means Method for Multi-View Clustering. In Proceedings of the AAAI Conference on Artificial Intelligence, New York, NY, USA, 7–12 February 2020; Volume 34, pp. 4860–4867. [Google Scholar] [CrossRef] [Scilit]
- Yang, C.; Liang, Z.; Liu, T.; Hu, Z.; Yan, D. MGMR-Net: Mamba-Guided Multimodal Reconstruction and Fusion Network for Sentiment Analysis with Incomplete Modalities. Electronics 2025, 14, 3088. [Google Scholar] [CrossRef] [Scilit]
- Jin, X.; Zhang, B.; Gong, W.; Xu, K.; Deng, X.; Wang, P.; Zhang, Z.; Shen, X.; Feng, J. MV-Adapter: Multimodal Video Transfer Learning for Video Text Retrieval. In Proceedings of the IEEE/CVF Conference on Computer Vision and Pattern Recognition (CVPR), Seattle, WA, USA, 16–22 June 2024; pp. 27144–27153. [Google Scholar] [CrossRef] [Scilit]
- Yoo, Y.; Lee, C.Y.; Zhang, B.T. Multimodal Anomaly Detection Based on Deep Auto-Encoder for Object Slip Perception of Mobile Manipulation Robots. In Proceedings of the IEEE International Conference on Robotics and Automation (ICRA), Xi’an, China, 30 May–5 June 2021; pp. 11443–11449. [Google Scholar] [CrossRef] [Scilit]
- Wang, Y.; Peng, J.; Zhang, J.; Yi, R.; Wang, Y.; Wang, C. Multimodal Industrial Anomaly Detection via Hybrid Fusion. In Proceedings of the IEEE/CVF Conference on Computer Vision and Pattern Recognition (CVPR), Vancouver, BC, Canada, 17–24 June 2023; pp. 8032–8041. [Google Scholar] [CrossRef] [Scilit]
- Liu, Z.; Wang, Q.; Nestler, R.; Notni, G. Investigation on Automated Visual SMD-PCB Inspection Based on Multimodal One-Class Novelty Detection. In Proceedings of the SPIE Conference on Multimodal Sensing and Artificial Intelligence: Technologies and Applications III, Munich, Germany, 27–29 June 2023; Volume 12621, pp. 246–256. [Google Scholar] [CrossRef] [Scilit]
- Jiang, J.; He, Z.; Wan, A.; AL-Bukhaiti, K.; Wang, K.; Zhu, P.; Cheng, X. Zero-Shot Industrial Anomaly Detection via CLIP-DINOv2 Multimodal Fusion and Stabilized Attention Pooling. Electronics 2025, 14, 4785. [Google Scholar] [CrossRef] [Scilit]
- Pidhorskyi, S.; Almohsen, R.; Adjeroh, D.A.; Doretto, G. Generative Probabilistic Novelty Detection with Adversarial Autoencoders. In Proceedings of the International Conference on Neural Information Processing Systems (NeurIPS), Montréal, QC, Canada, 3–8 December 2018; pp. 6823–6834. Available online: https://dl.acm.org/doi/abs/10.5555/3327757.3327787 (accessed on 1 August 2026).
- Ozdagli, A.I.; Koutsoukos, X. Machine Learning Based Novelty Detection Using Modal Analysis. Comput.-Aided Civ. Infrastruct. Eng. 2019, 34, 1119–1140. [Google Scholar] [CrossRef] [Scilit]
- Zhai, S.; Cheng, Y.; Lu, W.; Zhang, Z. Deep Structured Energy Based Models for Anomaly Detection. In Proceedings of the International Conference on Machine Learning (ICML), New York, NY, USA, 19–24 June 2016; Volume 48, pp. 1100–1109. Available online: http://proceedings.mlr.press/v48/zhai16.pdf (accessed on 1 August 2026).
- Mirzaei, H.; Salehi, M.; Shahabi, S.; Gavves, E.; Snoek, C.G.; Sabokrou, M.; Rohban, M.H. Fake It Until You Make It: Towards Accurate Near-Distribution Novelty Detection. In Proceedings of the International Conference on Learning Representations (ICLR), Kigali, Rwanda, 1–5 May 2023; Available online: https://openreview.net/forum?id=QWQM0ZwZdRS (accessed on 1 August 2026).
- Arashloo, S.R. Large-Margin Multiple Kernel ℓp-SVDD Using Frank–Wolfe Algorithm for Novelty Detection. Pattern Recognit. 2024, 148, 110189. [Google Scholar] [CrossRef] [Scilit]
- Jewell, J.T.; Khazaie, V.R.; Mohsenzadeh, Y. One-Class Learned Encoder-Decoder Network with Adversarial Context Masking for Novelty Detection. In Proceedings of the IEEE/CVF Winter Conference on Applications of Computer Vision (WACV), Waikoloa, HI, USA, 3–8 January 2022; pp. 3591–3601. [Google Scholar] [CrossRef] [Scilit]
- Wu, P.; Liu, J.; Shen, F. A Deep One-Class Neural Network for Anomalous Event Detection in Complex Scenes. IEEE Trans. Neural Netw. Learn. Syst. 2020, 31, 2609–2622. [Google Scholar] [CrossRef] [Scilit] [PubMed]
- Sabokrou, M.; Khalooei, M.; Fathy, M.; Adeli, E. Adversarially Learned One-Class Classifier for Novelty Detection. In Proceedings of the IEEE Conference on Computer Vision and Pattern Recognition (CVPR), Salt Lake City, UT, USA, 18–23 June 2018; pp. 3379–3388. [Google Scholar] [CrossRef] [Scilit]
- Cai, M.; Wang, X.; Sohel, F.; Lei, H. Unsupervised Anomaly Detection for Improving Adversarial Robustness of 3D Object Detection Models. Electronics 2025, 14, 236. [Google Scholar] [CrossRef] [Scilit]
- Tibshirani, R. Regression Shrinkage and Selection Via the Lasso. J. R. Stat. Soc. Ser. B 1996, 58, 267–288. [Google Scholar] [CrossRef] [Scilit]
- Ng, A.Y. Feature Selection, L1 vs. L2 Regularization, and Rotational Invariance. In Proceedings of the International Conference on Machine Learning (ICML), Banff, AB, Canada, 4–8 July 2004; pp. 615–622. [Google Scholar] [CrossRef] [Scilit]
- Tsuruoka, Y.; Tsujii, J.; Ananiadou, S. Stochastic Gradient Descent Training for L1-Regularized Log-Linear Models with Cumulative Penalty. In Proceedings of the Joint Conference of the Annual Meeting of the ACL and the International Joint Conference on Natural Language Processing (ACL-IJCNLP), Suntec, Singapore, 2–7 August 2009; pp. 477–485. Available online: https://aclanthology.org/P09-1054/ (accessed on 1 August 2026).
- Xu, Z.; Chang, X.; Xu, F.; Zhang, H. L1/2 Regularization: A Thresholding Representation Theory and a Fast Solver. IEEE Trans. Neural Netw. Learn. Syst. 2012, 23, 1013–1027. [Google Scholar] [CrossRef] [Scilit] [PubMed]
- Chartrand, R. Exact Reconstruction of Sparse Signals via Nonconvex Minimization. IEEE Signal Process. Lett. 2007, 14, 707–710. [Google Scholar] [CrossRef] [Scilit]
- Salehi, M.; Arya, A.; Pajoum, B.; Otoofi, M.; Shaeiri, A.; Rohban, M.H.; Rabiee, H.R. ARAE: Adversarially Robust Training of Autoencoders Improves Novelty Detection. Neural Netw. 2021, 144, 726–736. [Google Scholar] [CrossRef] [Scilit] [PubMed]
- Castro, S.; Hazarika, D.; Pérez-Rosas, V.; Zimmermann, R.; Mihalcea, R.; Poria, S. Towards Multimodal Sarcasm Detection (An _Obviously_ Perfect Paper). In Proceedings of the Annual Meeting of the Association for Computational Linguistics (ACL), Florence, Italy, 28 July–2 August 2019; pp. 4619–4629. [Google Scholar] [CrossRef] [Scilit]
- Hasan, M.K.; Rahman, W.; Zadeh, A.; Zhong, J.; Tanveer, M.I.; Morency, L.P. UR-FUNNY: A Multimodal Language Dataset for Understanding Humor. In Proceedings of the Conference on Empirical Methods in Natural Language Processing and the International Joint Conference on Natural Language Processing (EMNLP-IJCNLP), Hong Kong, China, 3–7 November 2019; pp. 2046–2056. [Google Scholar] [CrossRef] [Scilit]
- Devlin, J.; Chang, M.W.; Lee, K.; Toutanova, K. BERT: Pre-Training of Deep Bidirectional Transformers for Language Understanding. In Proceedings of the Conference of the North American Chapter of the Association for Computational Linguistics: Human Language Technologies (NAACL-HLT), Minneapolis, MN, USA, 2–7 June 2019; Volume 1, pp. 4171–4186. [Google Scholar] [CrossRef] [Scilit]
- Deng, J.; Dong, W.; Socher, R.; Li, L.J.; Li, K.; Fei-Fei, L. ImageNet: A Large-Scale Hierarchical Image Database. In Proceedings of the IEEE Conference on Computer Vision and Pattern Recognition (CVPR), Miami, FL, USA, 20–25 June 2009; pp. 248–255. [Google Scholar] [CrossRef] [Scilit]
- He, K.; Zhang, X.; Ren, S.; Sun, J. Deep Residual Learning for Image Recognition. In Proceedings of the IEEE Conference on Computer Vision and Pattern Recognition (CVPR), Las Vegas, NV, USA, 27–30 June 2016; pp. 770–778. [Google Scholar] [CrossRef] [Scilit]
- McFee, B.; McVicar, M.; Balke, S.; Thomé, C.; Lostanlen, V.; Raffel, C.; Lee, D.; Nieto, O.; Battenberg, E.; Ellis, D.; et al. librosa/librosa: 0.6.2; Zenodo: Geneva, Switzerland, 2018. [Google Scholar] [CrossRef]
- Pennington, J.; Socher, R.; Manning, C.D. GloVe: Global Vectors for Word Representation. In Proceedings of the Conference on Empirical Methods in Natural Language Processing (EMNLP), Doha, Qatar, 25–29 October 2014; pp. 1532–1543. [Google Scholar] [CrossRef] [Scilit]
- Baltrušaitis, T.; Robinson, P.; Morency, L.P. OpenFace: An Open Source Facial Behavior Analysis Toolkit. In Proceedings of the IEEE Winter Conference on Applications of Computer Vision (WACV), Lake Placid, NY, USA, 7–10 March 2016; pp. 1–10. [Google Scholar] [CrossRef] [Scilit]
- Degottex, G.; Kane, J.; Drugman, T.; Raitio, T.; Scherer, S. COVAREP—A Collaborative Voice Analysis Repository for Speech Technologies. In Proceedings of the IEEE International Conference on Acoustics, Speech and Signal Processing (ICASSP), Florence, Italy, 4–9 May 2014; pp. 960–964. [Google Scholar] [CrossRef] [Scilit]
- Schölkopf, B.; Platt, J.C.; Shawe-Taylor, J.; Smola, A.J.; Williamson, R.C. Estimating the Support of a High-Dimensional Distribution. Neural Comput. 2001, 13, 1443–1471. [Google Scholar] [CrossRef] [Scilit] [PubMed]
- Parzen, E. On Estimation of a Probability Density Function and Mode. Ann. Math. Stat. 1962, 33, 1065–1076. [Google Scholar] [CrossRef] [Scilit]
- Makhzani, A.; Frey, B.J. Winner-Take-All Autoencoders. In Proceedings of the International Conference on Neural Information Processing Systems (NIPS), Montreal, QC, Canada, 7–12 December 2015; pp. 2791–2799. Available online: https://dl.acm.org/doi/abs/10.5555/2969442.2969552 (accessed on 1 August 2026).
- Krogh, A.; Hertz, J. A Simple Weight Decay Can Improve Generalization. In Proceedings of the International Conference on Neural Information Processing Systems (NIPS), Denver, CO, USA, 2–5 December 1991; pp. 950–957. Available online: https://dl.acm.org/doi/abs/10.5555/2986916.2987033 (accessed on 1 August 2026).
- Maas, A.L.; Hannun, A.Y.; Ng, A.Y. Rectifier Nonlinearities Improve Neural Network Acoustic Models. In Proceedings of the International Conference on Machine Learning (ICML), Atlanta, GA, USA, 16–21 June 2013; Volume 28, pp. 3–8. Available online: https://www.awnihannun.com/papers/relu_hybrid_icml2013_final.pdf (accessed on 1 August 2026).
- Erfani, S.M.; Rajasegarar, S.; Karunasekera, S.; Leckie, C. High-Dimensional and Large-Scale Anomaly Detection Using a Linear One-Class SVM with Deep Learning. Pattern Recognit. 2016, 58, 121–134. [Google Scholar] [CrossRef] [Scilit]
- Vargha, A.; Delaney, H.D. The Kruskal-Wallis Test and Stochastic Homogeneity. J. Educ. Behav. Stat. 1998, 23, 170–192. [Google Scholar] [CrossRef] [Scilit]

Disclaimer/Publisher’s Note: The statements, opinions and data contained in all publications are solely those of the individual author(s) and contributor(s) and not of MDPI and/or the editor(s). MDPI and/or the editor(s) disclaim responsibility for any injury to people or property resulting from any ideas, methods, instructions or products referred to in the content. |
© 2026 by the authors. Licensee MDPI, Basel, Switzerland. This article is an open access article distributed under the terms and conditions of the Creative Commons Attribution (CC BY) license.