Article

Interference Mitigation and Power Minimization in 5G Heterogeneous Networks

1
Electronics and Communications Department, Faculty of Engineering Science and Arts, Misr International University, Cairo 11828, Egypt
2
Electronics and Communications Department, Faculty of Engineering, Ain Shams University, Cairo 11517, Egypt
*
Author to whom correspondence should be addressed.
Electronics 2021, 10(14), 1723; https://doi.org/10.3390/electronics10141723
Submission received: 31 May 2021 / Revised: 15 July 2021 / Accepted: 16 July 2021 / Published: 18 July 2021
(This article belongs to the Special Issue Spectrum and Energy Efficient 5G Wireless Communications)

Abstract

:
Macro cells’ (MCs) densification with small cells (SCs) is one of the promising solutions to cope with the increasing demand for higher data rates in 5G heterogeneous networks (HetNets). Unfortunately, the interference that arises between these densely deployed SCs and their elevated power consumption have caused huge problems facing the 5G HetNets. In this paper, a new soft frequency reuse (SFR) scheme is proposed to minimize the interference and elevate the network throughput. The proposed scheme is based on on/off switching the SCs according to their interference contribution rate (ICR) values. It solves the interference problem of the densely deployed SCs by dividing the cell region into center and edge zones. Moreover, SCs on/off switching tackles the elevated power consumption problem and enhances the power efficiency of the 5G network. Furthermore, our paper tackles the irregular nature problem of 5G HetNets and compares between two different proposed shapes for the center zone of the SC: circular, and irregular shapes. Additionally, the optimum radius of the center zone, which maximizes the total system data rate, is obtained. The results show that the proposed scheme surpasses the traffic and the random on/off switching schemes, as it decreases the outage probability and enhances the total system data rate and power efficiency. Moreover, the results demonstrate the close performance of both the irregular and circular shapes for the center zone.

1. Introduction

As the numbers of user equipment (UE) and wireless devices accessing the 5G network are increasing every day, huge challenges are facing the 5G network to increase the system capacity, enlarge the energy efficiency (EE) and boost the network data rates. It is foreseen that the number of connected 5G devices will increase in between 10 and 100 times than 4G, and the data rates will attain speeds up to 10 Gbps [1,2]. Moreover, the communication technology is expected to consume up to 51% of the global electricity by 2030 [3]. Innovative approaches are required to meet these tremendous challenges and to enhance the 5G network performance, such as millimeter wave (mm-wave) and massive multiple-input multiple-output (massive MIMO) and small cells (SCs) [4,5,6,7]. These technologies ameliorate the system capacity, boost the network data rates, enhance the Quality of Service (QoS), support additional UE and improve the spectral and energy efficiencies.
The SC is a promising technology aiming to provide 5G services in an energy-efficient manner to the users [8,9,10]. SCs include the femtocells, picocells and relay nodes. Densely deploying these SCs in the 5G HetNets can effectively improve the coverage, especially in indoor and urban areas. Additionally, the SCs can significantly elevate the network throughput. Moreover, they can handle the applications with high data rates such as online games and video-supported applications [2].
Unfortunately, despite the huge merits of the densely deployed SCs in the 5G HetNets, multiple challenges arise such as the large power consumption of the SCs [11] and the interference between them [8].
To tackle the power consumption problem and ameliorate the EE, authors in [10,11,12,13,14,15] proposed to switch SCs to sleep mode. Various SCs switch-off techniques are presented in [10] for EE improvement. These techniques include: (1) an incentive-based sleeping mechanism: in which the cells with active users might sleep if the users can be allocated to any adjacent cell. (2) a sector-based switching mechanism: in which the energy saving relies on the hardware shared between the sectors. The authors in [11] introduced several levels of sleep depths to enhance the EE. The base station (BS) states are assorted by four states: On, Stand-by, Sleep and Off, with power consumption ratios of 100%, 50%, 15% and 0%, respectively. On the other hand, a dynamic energy-efficient technique for load-based sleep mode optimization in 5G HetNets is demonstrated in [12], where the traffic load distribution of the SCs is analyzed. This technique depends on cell-to-cell communication using X2 links aiming to switch off the cells with the minimum load. Also in [13], a dynamic load adjustment technique is presented to balance the traffic load between the heavily loaded and the lightly loaded SCs and to maximize the number of sleeping SCs using Q-learning. On the other hand, an energy-aware scheme is proposed in [14] to improve the QoS of the system where the capacity-based thresholds are used for activating the BSs. A novel yet simple energy saving scheme for SCs is shown in [15]. This scheme puts the SCs into a dormant state, then wakes them up when the load of the Macro Cell (MC) becomes heavy. However, this scheme presumes that SCs are overlaid by MCs. In case of the absence of MCs, this scheme does not work.
On the other hand, in [16,17,18,19,20], authors are not only addressing the power consumption problem, but also considered the interference between SCs. In [16], an interference contribution rate (ICR)-based SC on/off switching algorithm is presented. The SCs are selected for on/off switching based on their ICR values to determine the SCs causing huge interference to the other SCs. The ICR of a SC is the ratio of the interference caused by the SC to the sum of the reference signal received power (RSRP) of every active UE in the SC. On the other hand, a new sleep mode-based resource allocation strategy was presented in [17]. This strategy forms an interference map to choose the deactivated femtocells. However, the lack of updating of this map on deactivating the femtocells causes sub-optimal solutions. Moreover in [18], a new mechanism is proposed to enhance the EE of the densely deployed femtocells in HetNets. This mechanism selects the femtocells to enter sleep mode to mitigate their interference on their neighboring femtocells. The mechanism depends on allowing the hybrid access mode in all femtocells so that the UEs in any femtocell in sleep mode can be connected to another neighboring femtocell in the cluster. A new sleeping strategy is demonstrated in [19] for precisely determining the SCs located in unwanted interference spots and deactivating them to enhance the capacity and the energy efficiency in HetNets. A heuristic energy-efficient SC resource allocation algorithm is presented in [20]. The algorithm enables both the SCs and the MC to utilize the same spectrum but with guaranteeing a minimum QoS for the MC UEs.
Soft frequency reuse (SFR) was introduced [21,22,23,24,25,26,27] as a solution to the interference problem in HetNets. A SFR–based algorithm was presented in [21] to minimize the inter-cell interference. Moreover, the EE optimization was studied. Another SFR mechanism was presented in [22] to mitigate the interference in HetNets. In [23], the authors presented a new cell deployment and resource distribution scheme where the cell is split into multiple circular regions and the power and the band are assigned to every region to mitigate the interference. Another SFR method was discussed in [24] to mitigate the inter-cell interference and to improve the performance for cell edge users, while a new multi-layer SFR scheme was presented in [25]. The authors utilized the cell sectoring to enhance the data rates in the edge zone of the cell. A resource allocation scheme utilizing SFR is presented in [26]. Moreover, the inner region radius and power ratio between outer and inner zones of the MC are studied, to enhance the throughput and the fairness among the users. A multi-level SFR scheme and a resource allocation technique are presented in [27]. To minimize the interference, the author proposed utilizing different power density upper limits for the various layers. However, the works in [21,22,23,24,25,26,27] consider only the hexagonal shape of the cell, which is not realistic nowadays because of the irregular nature of the cells in 5G HetNets.
To match real-life scenarios, the irregular nature of the 5G HetNets was modeled using Voronoi cells [28,29,30,31,32,33,34,35,36,37]. Voronoi tessellation was shown to be a prevalent approach for spatially modelling real scenarios in 5G HetNets [28]. Due to the massive deployment of small cells, Voronoi cell are considered more practical than the traditional hexagonal grid [33]. This is the reason why it is used in most of the related literature for small cells [32,33,34,35,36,37]. Given a set of centers, a Voronoi tessellation splits a certain area to various polygon areas, named Voronoi cells [29]. The Voronoi cell boundaries are specified by lines halving the distance between every two adjacent cells [30,31].
The authors tackled the interference problem in irregular-shaped cells using SFR in [38,39,40,41]. In [38], a new SFR scheme was proposed for interference mitigation, applying both load balancing and cell range expansion, and deriving the coverage probability expressions. Moreover, a SFR framework was demonstrated in [39] that investigates the optimal bandwidth and transmit power for macro Base Station (BS) in the center and edge zones. Unfortunately, this work did not consider a HetNet scenario. A Three Band Improved SFR (3B-ISFR) was presented in [40]. The bandwidth is split into three segments to be allocated differently to the center and edge zones of the neighboring MCs and the SCs. A Coordinated SFR (CoSFR) for networks utilizing OFDMA and having non-uniform user distribution was presented in [41]. The authors relaxed the condition that the adjacent cells have to use orthogonal bands in the edge zones and any overload at the edge zone was solved by extending the band after arranging with the adjacent cells. Hence, a new scheme is required to mitigate the interference problem and enhance the power efficiency in 5G HetNets.
The main objective of our paper is to present a new SFR-based scheme utilizing the ICR concept for the SC switching to mitigate the interference and to improve the power efficiency in 5G HetNets. Unlike the previous works [16,26], we utilize both the on/off switching and the SFR concepts, while considering the irregular nature of the 5G HetNets. By using SFR, each SC is divided into two zones: center and edge zones. The SC can use one of seven sub-bands in its edge zone that are not utilized by the edge zones of the neighboring SCs and can use the rest of the sub-bands in its center zone with lower transmission power to minimize the interference with the adjacent SCs. After allocating the resources to the UEs, the SC switching is initiated based on the ICR concept. The on/off switching decisions of the SCs are determined according to the ICR values of the SCs to mitigate the interference between the SCs and to minimize the traffic losses.
The main contributions of this paper are to:
  • Propose a new SFR-based scheme to mitigate interference in 5G HetNets where ICR-based on/off switching is utilized to minimize the system power consumption.
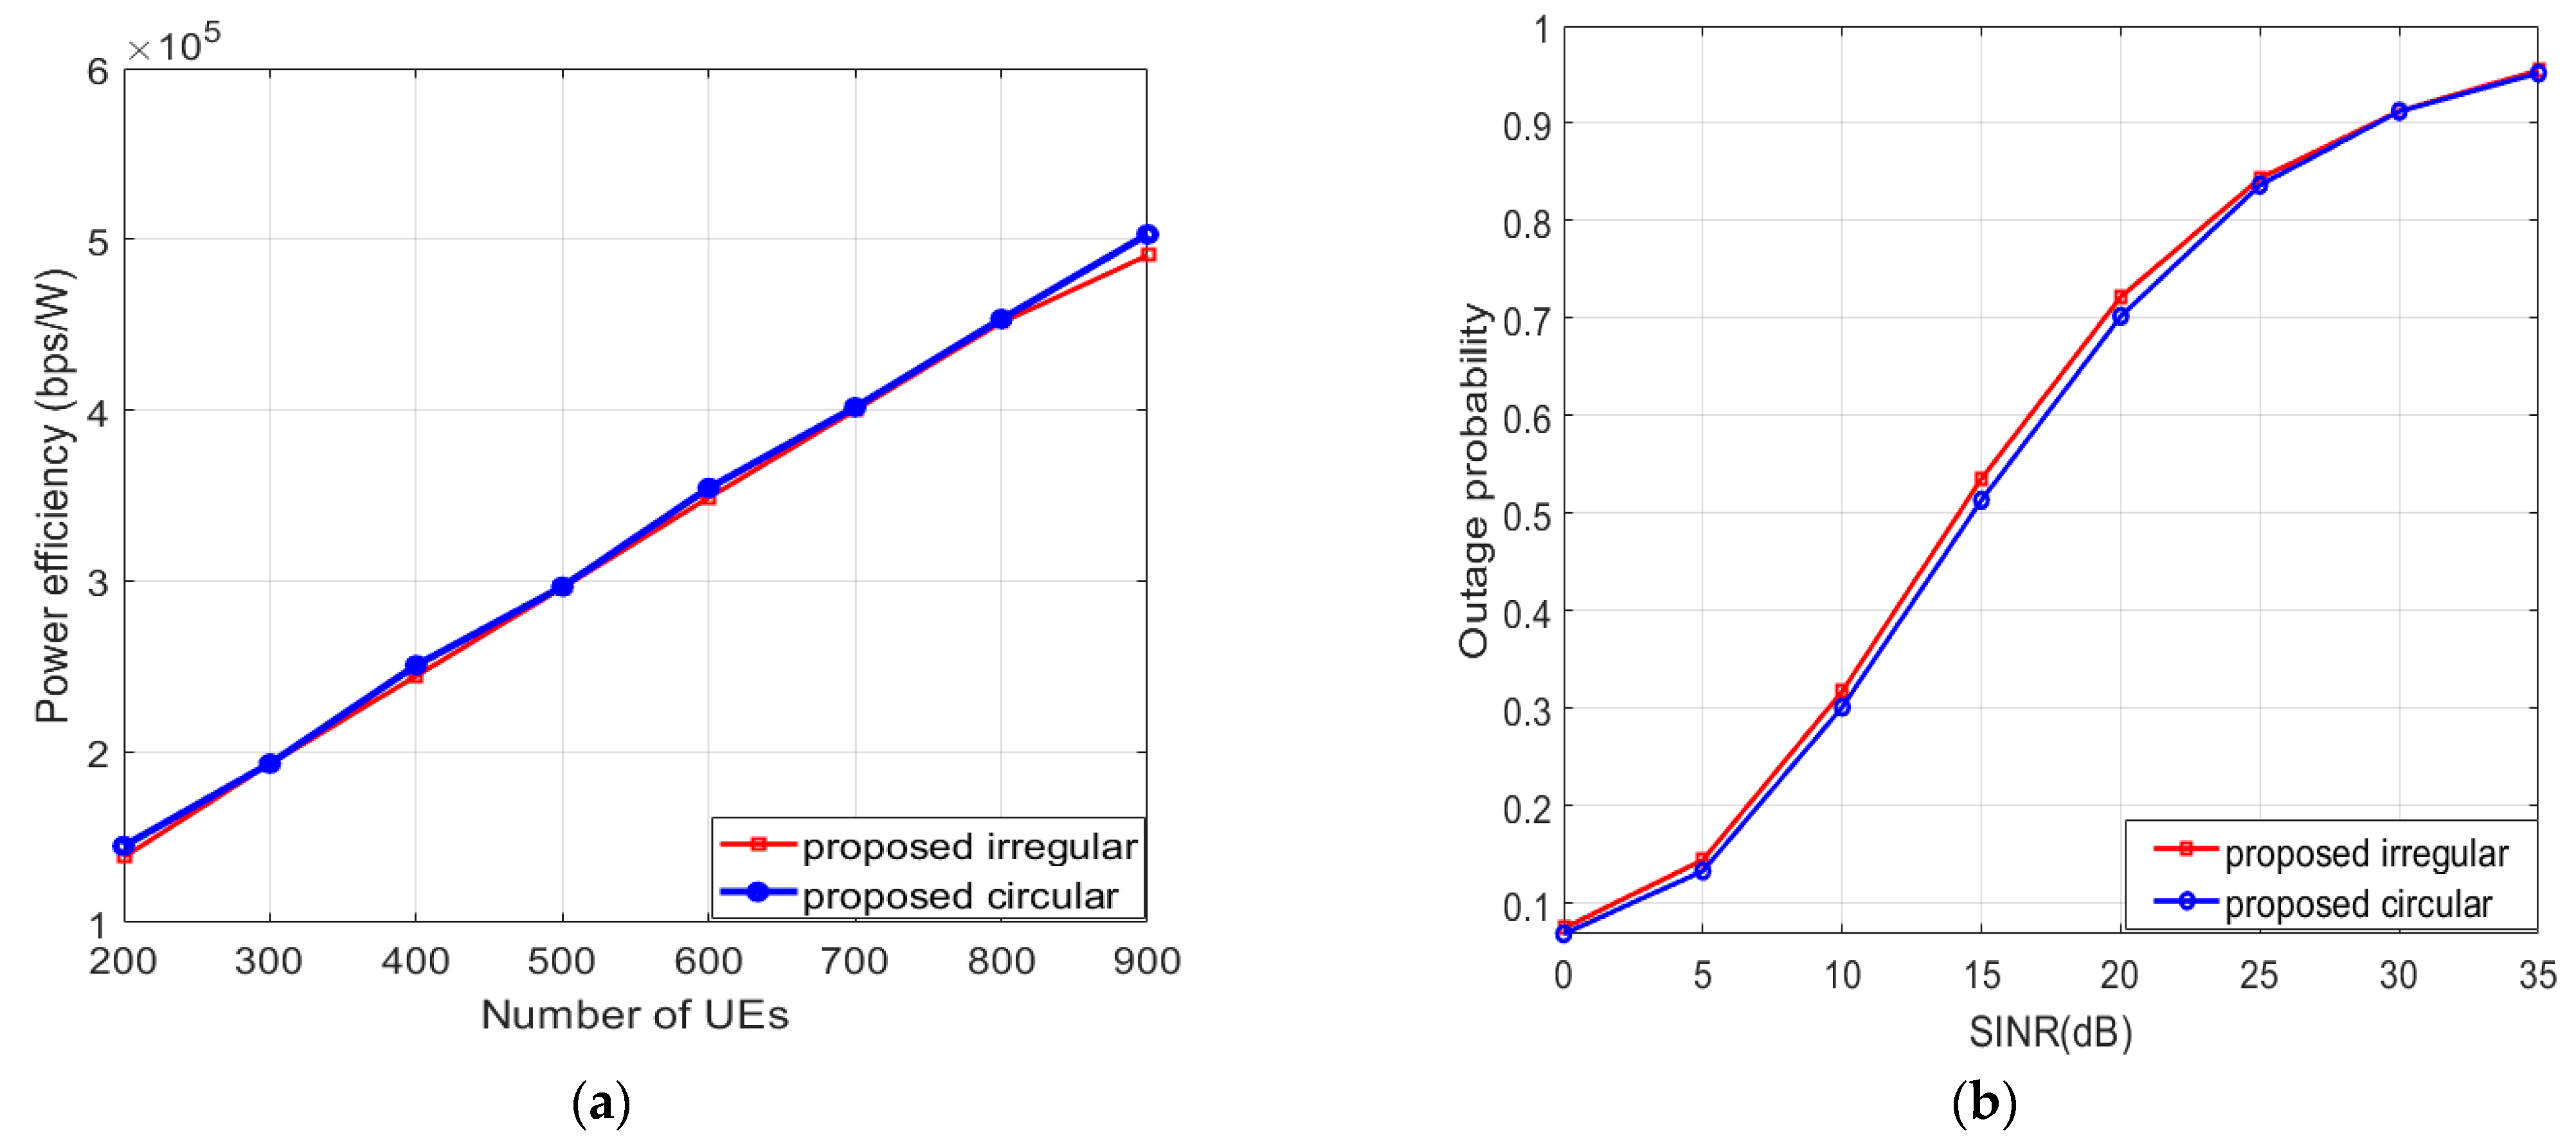
  • Propose two different shapes (circular/irregular) for the center zone for the irregular shape of the SCs (practical/real case) and compare the performance of these shapes.
  • Propose new methods to determine the center zone in both irregular and circular shapes due to the irregularity of the cell shape.
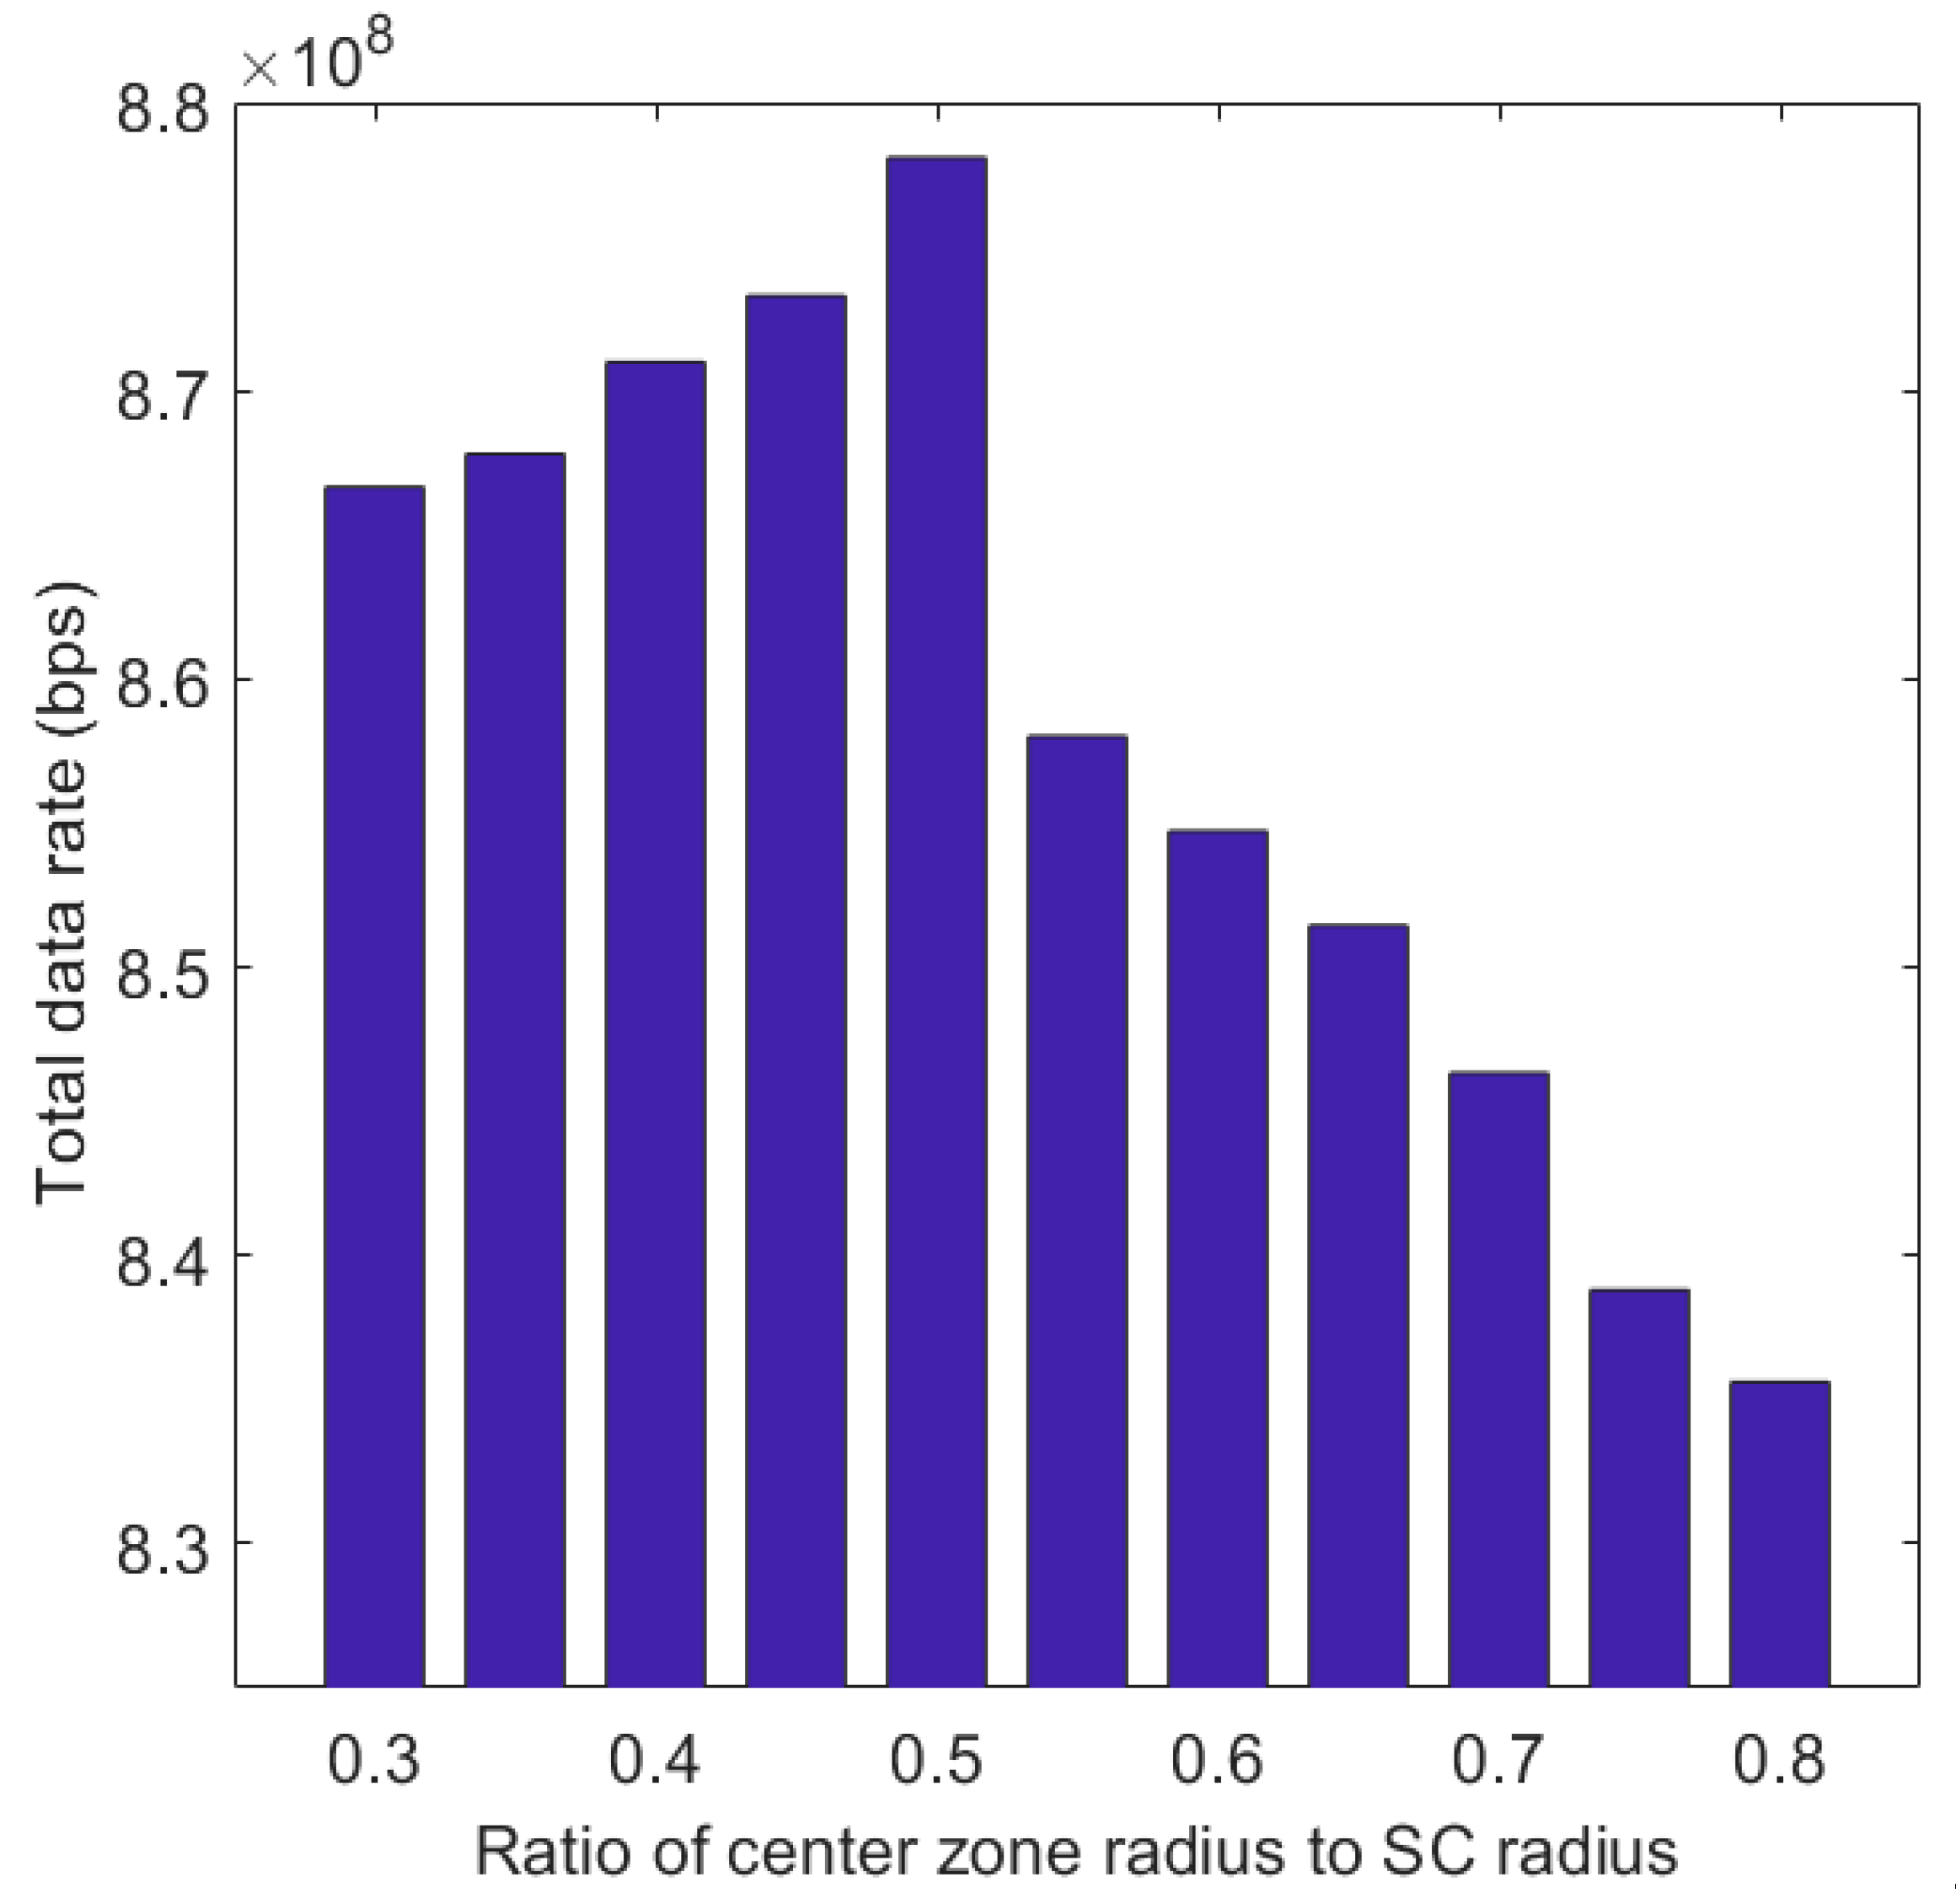
  • Obtain the optimum radius of the center zone which maximizes the total system data rate.
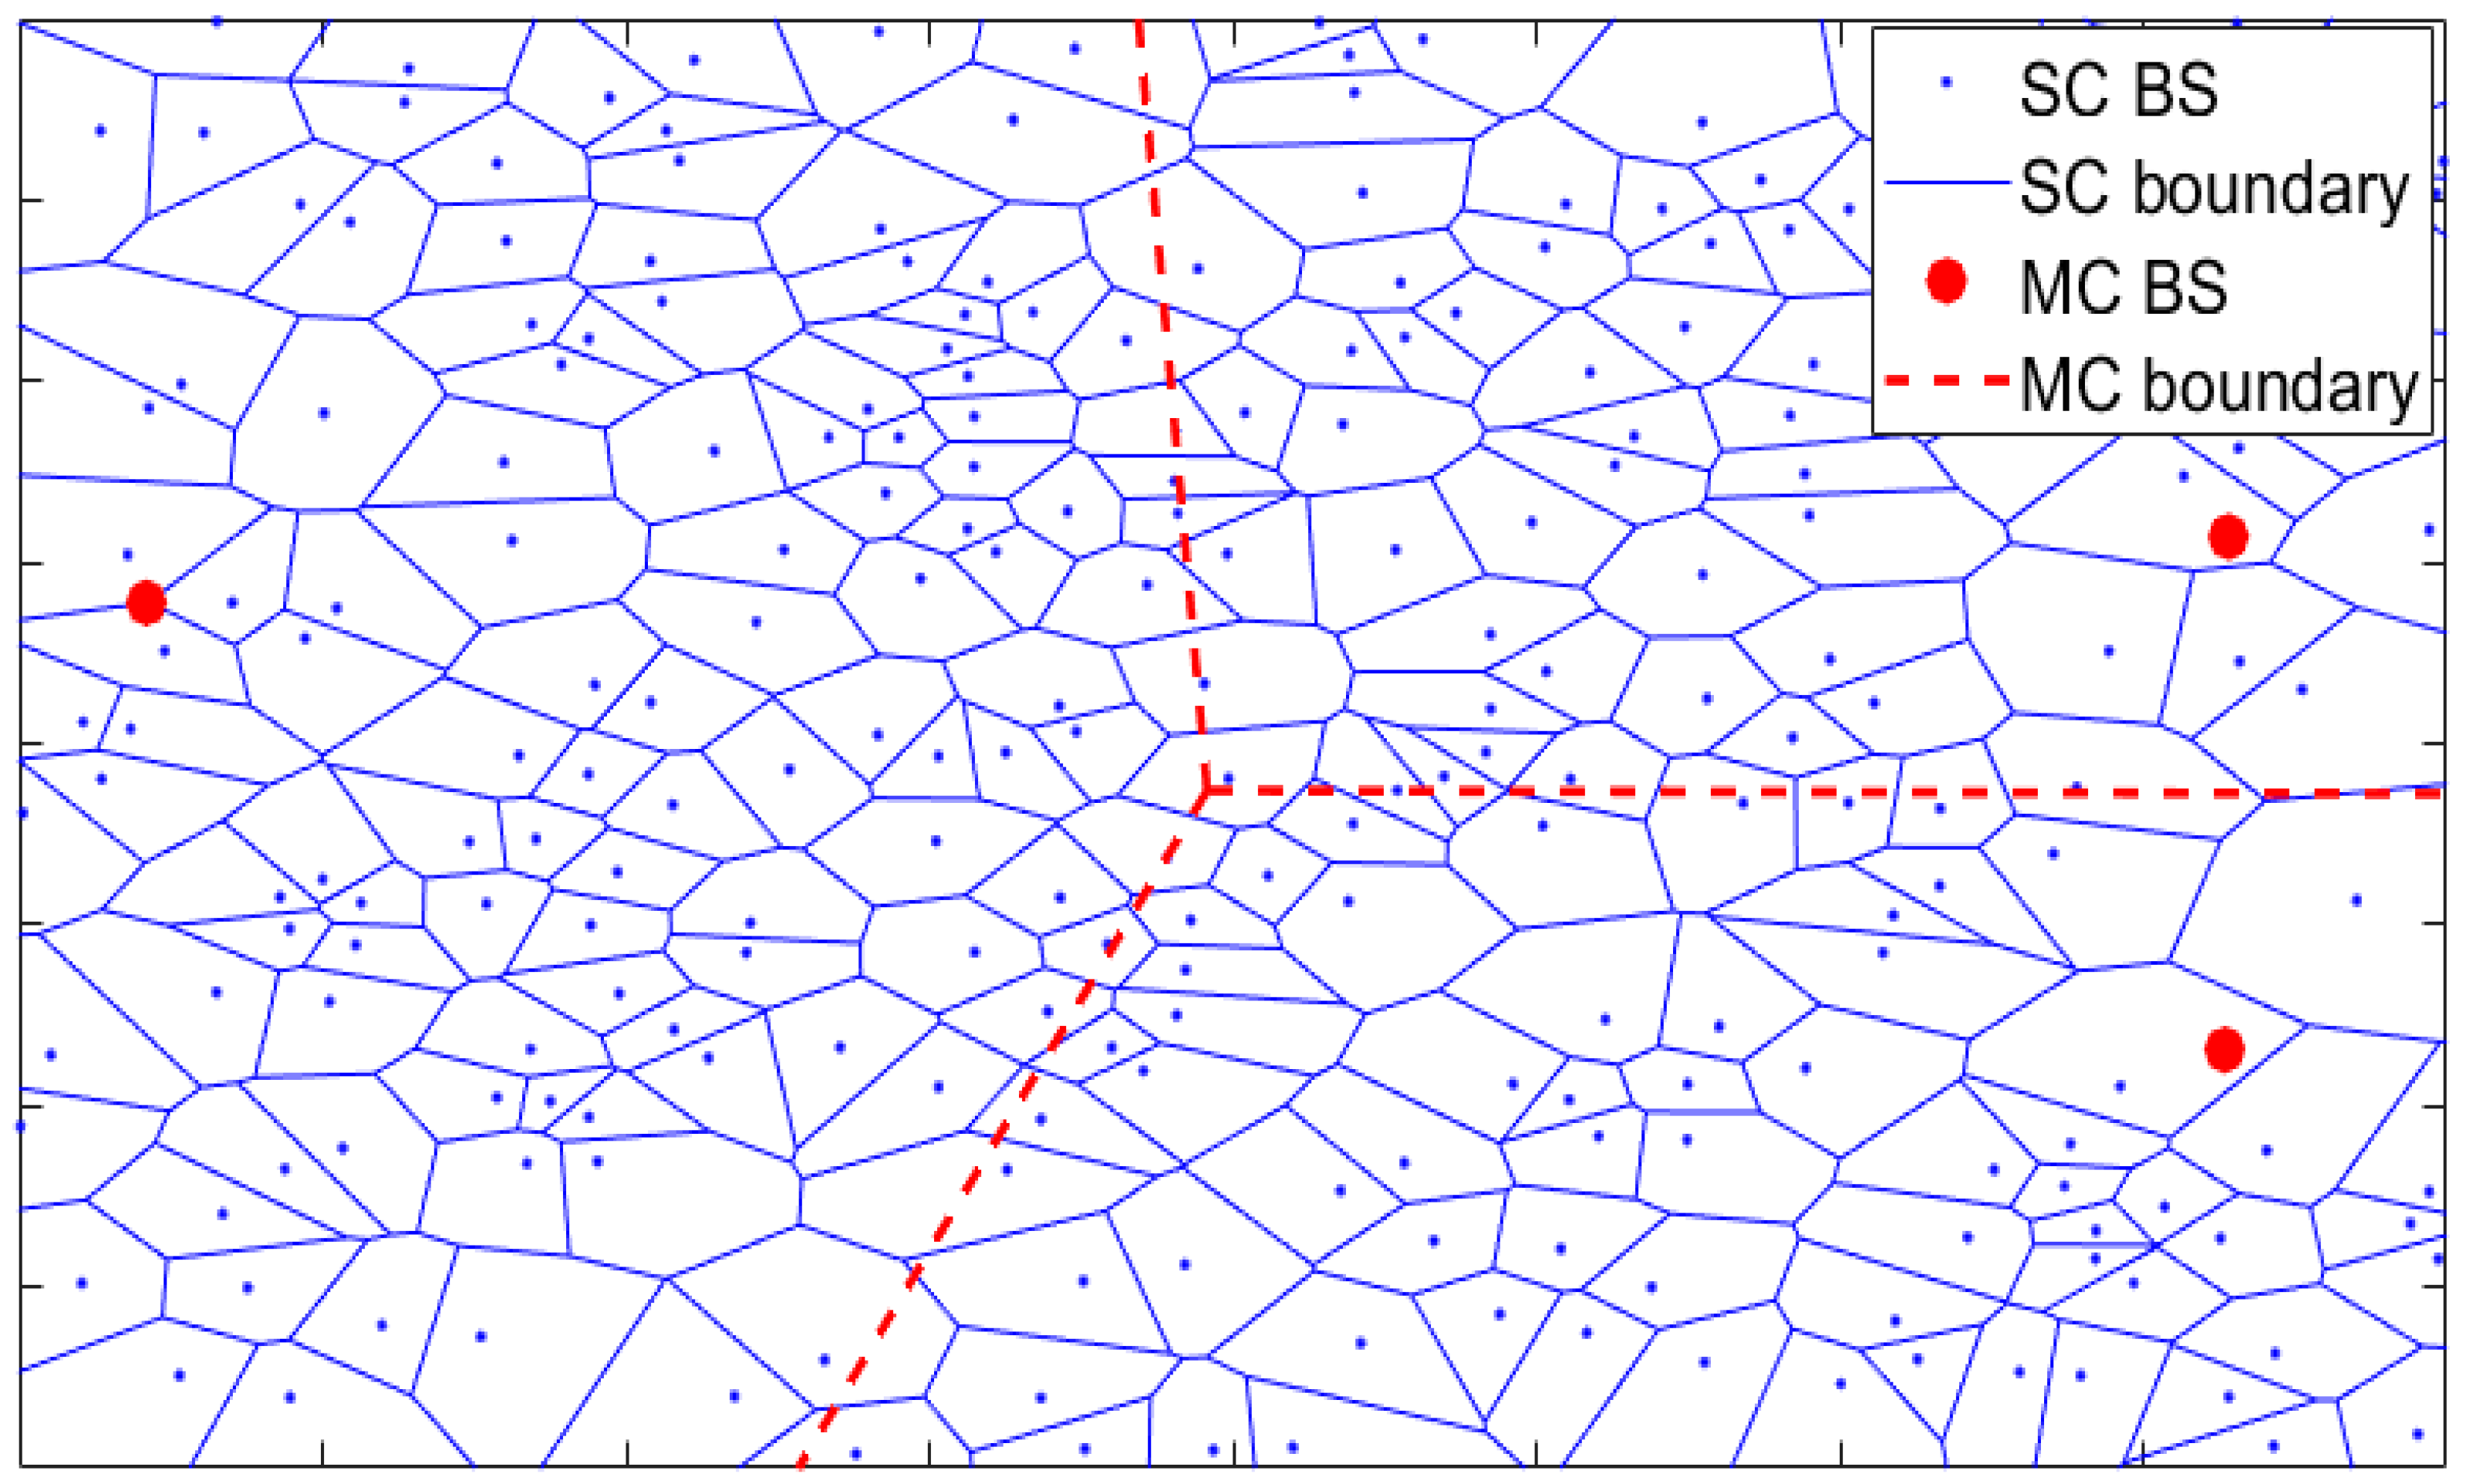
Results show that, in both cases of irregular and circular shapes, the proposed scheme outperforms all the other simulation scenarios in terms of the total system data rate, the power efficiency, the normalized traffic losses and the outage probability.
The rest of this paper is organized as follows: the system model is described in Section 2. The proposed scheme is demonstrated in Section 3. Simulation results are provided in Section 4. Finally, the paper is concluded in Section 5.

2. System Model

Consider the 5G HetNet with densely deployed Voronoi SCs, as shown in Figure 1. The SCs are deployed within the MCs coverage area. In this scenario, the MCs utilize the low frequency band (<2.5 GHz) for wide area coverage, and the SCs utilize the high frequency band (>3.5 GHz) for additional network capacity. Moreover, this mitigates the cross-tier interference between the MCs and the SCs. The MCs are kept active all the time to ensure the network coverage area does not vary while the SCs are switched on and off. Furthermore, the UEs in the switched off SCs can be handed over to the MCs if there are available channels. For the SC switching, the SC works in either active (On) or sleep (Off) modes. If the SC works in the sleep mode, the SC regularly sends discovery signals to be discovered by any possible UE. In this scheme, every SC can regularly obtain from the UEs their channel state information and their RSRP. Moreover, we assume that all the UEs in each SC are within the coverage area of the SC. If any coverage holes exist in the SCs, relay nodes can be used to cover these holes as in [29], but this is out of our paper scope. In this paper, a main controller is assumed to organize the sub-bands allocation to the SCs and to control the SC switching. In the absence of such entity, the MC can serve as the main controller by gathering the information from the SCs, regulating the sub-bands allocation to the SCs, and then determining the on/off switching decisions of the SCs. Table 1 lists the symbols used in this paper and their description.
As SC switching is applied, a SC on/off indicator denoted as β c is defined, where β c = 0 denotes the SC c is off, while β c = 1 denotes the SC c is on. Let the set of all SCs be denoted by “Z” and the set of UEs in SC c be denoted by “ U c ”. The signal-to-interference-plus-noise ratio (SINR) for UE j in SC c can be calculated as [16]:
S I N R j , c = β c P c G c , j z c , z Z β z P z G z , j + N o B j
where P c , P z are the transmission powers of the serving SC c and the interfering SC z , respectively. The channel gain between UE j and serving SC c is G c , j while the channel gain between UE j and interfering SC z is G z , j , N o is the single-sided power spectral density of the noise, and B j is the bandwidth dedicated to UE j.
In order to ensure the QoS of UEs at a specific instant, a certain number of time-frequency resources have to be assigned to the UE based on the data rate needed by this user. Thus, the data rate of UE j in SC c on one Resource Block (RB), denoted by R j , c R B , is calculated by Shannon’s formula as in [42]:
R j , c R B = B R B   log 2 ( 1 + S I N R j , c )
where B R B is the RB bandwidth. The number of RBs required by UE j to achieve its minimum data rate L j , c is expressed by [16]:
L j , c = R j m i n R j , c R B
where R j m i n denotes the minimum data rate required by UE j [16] and . represents the ceil operator. The data rate of SC c ( R c ) is the sum of the data rates of the UEs in this SC. By using Shannon’s formula, the data rate R j , c of UE j in SC can be calculated as [42]:
R j , c = B j   log 2 ( 1 + S I N R j , c )
where B j = B R B L j , c . If the interference power of UE j in SC c decreases, the S I N R j , c increases and consequently the data rate increases.
The power consumption of the SCs only is studied in this paper as the MCs are kept active all the time. While SC c is in active mode, the SC is fully operated, and the SC total power consumption P c t o t is calculated as [43]:
P c t o t = P c o n + α c P c t x
where α c is the portion of power consumption because of the feeder losses and power amplifier for SC c [44], P c o n and P c t x are the baseline, and the transmission power consumption, respectively. When the SC c is in the sleep mode, the transmission power can be neglected, but a certain amount of power is still consumed for the SC to be discovered, and the SC power consumption is P c o f f  =  ϕ   P c o n , where ϕ denotes the inactive level of the SC. Hence, the total power consumption of SC c can be calculated as [43]:
P c t o t = ϕ P c o n + ( 1 ϕ ) P c o n β c + α c P c t x β c
The transmission power is calculated by [16]:
P c t x = j     U c L j , c   σ   P m a x Y c η
where σ is the slope of the load-dependent power consumption of the SC, and P m a x is the maximum transmission power of the SC. While the maximum number of RBs for SC c is Y c , and η is the efficiency of the power amplifier of the BS.
The SC switching is utilized in this paper to minimize the power consumption of the system based on the ICR values of the SCs. The ICR of SC c ( χ c ) can be defined as the ratio of the interference power caused by the SC c to the sum of RSRP of every active UE in SC c. The ICR of SC c  χ c is calculated as [16]:
χ c = t     U c P c G c , t j     U c P c G c , j
A correction factor ( θ ) is added to prohibit huge number of handoffs because of the SC on/off switching, thus Equations (8) can be modified to [16]:
χ c = t     U c P c G c , t θ ( j     U c P c G c , j )
where θ = 0.5   ln (   N c ) [16] and N c is the number of UEs in SC c. So as the number of UEs in SC c enlarges, θ is enlarged, χ c is reduced, and the probability that SC c is switched off decreases.

3. Proposed SFR-Based Scheme

To mitigate the interference in 5G HetNets and to enhance the power efficiency of the system, a new SFR-based scheme is proposed in this paper. In this scheme, the SCs are allocated the sub-bands according to an SFR- based algorithm. Then, the SCs on/off switching algorithm is initiated, where the SCs are switched on/off based on their ICR.

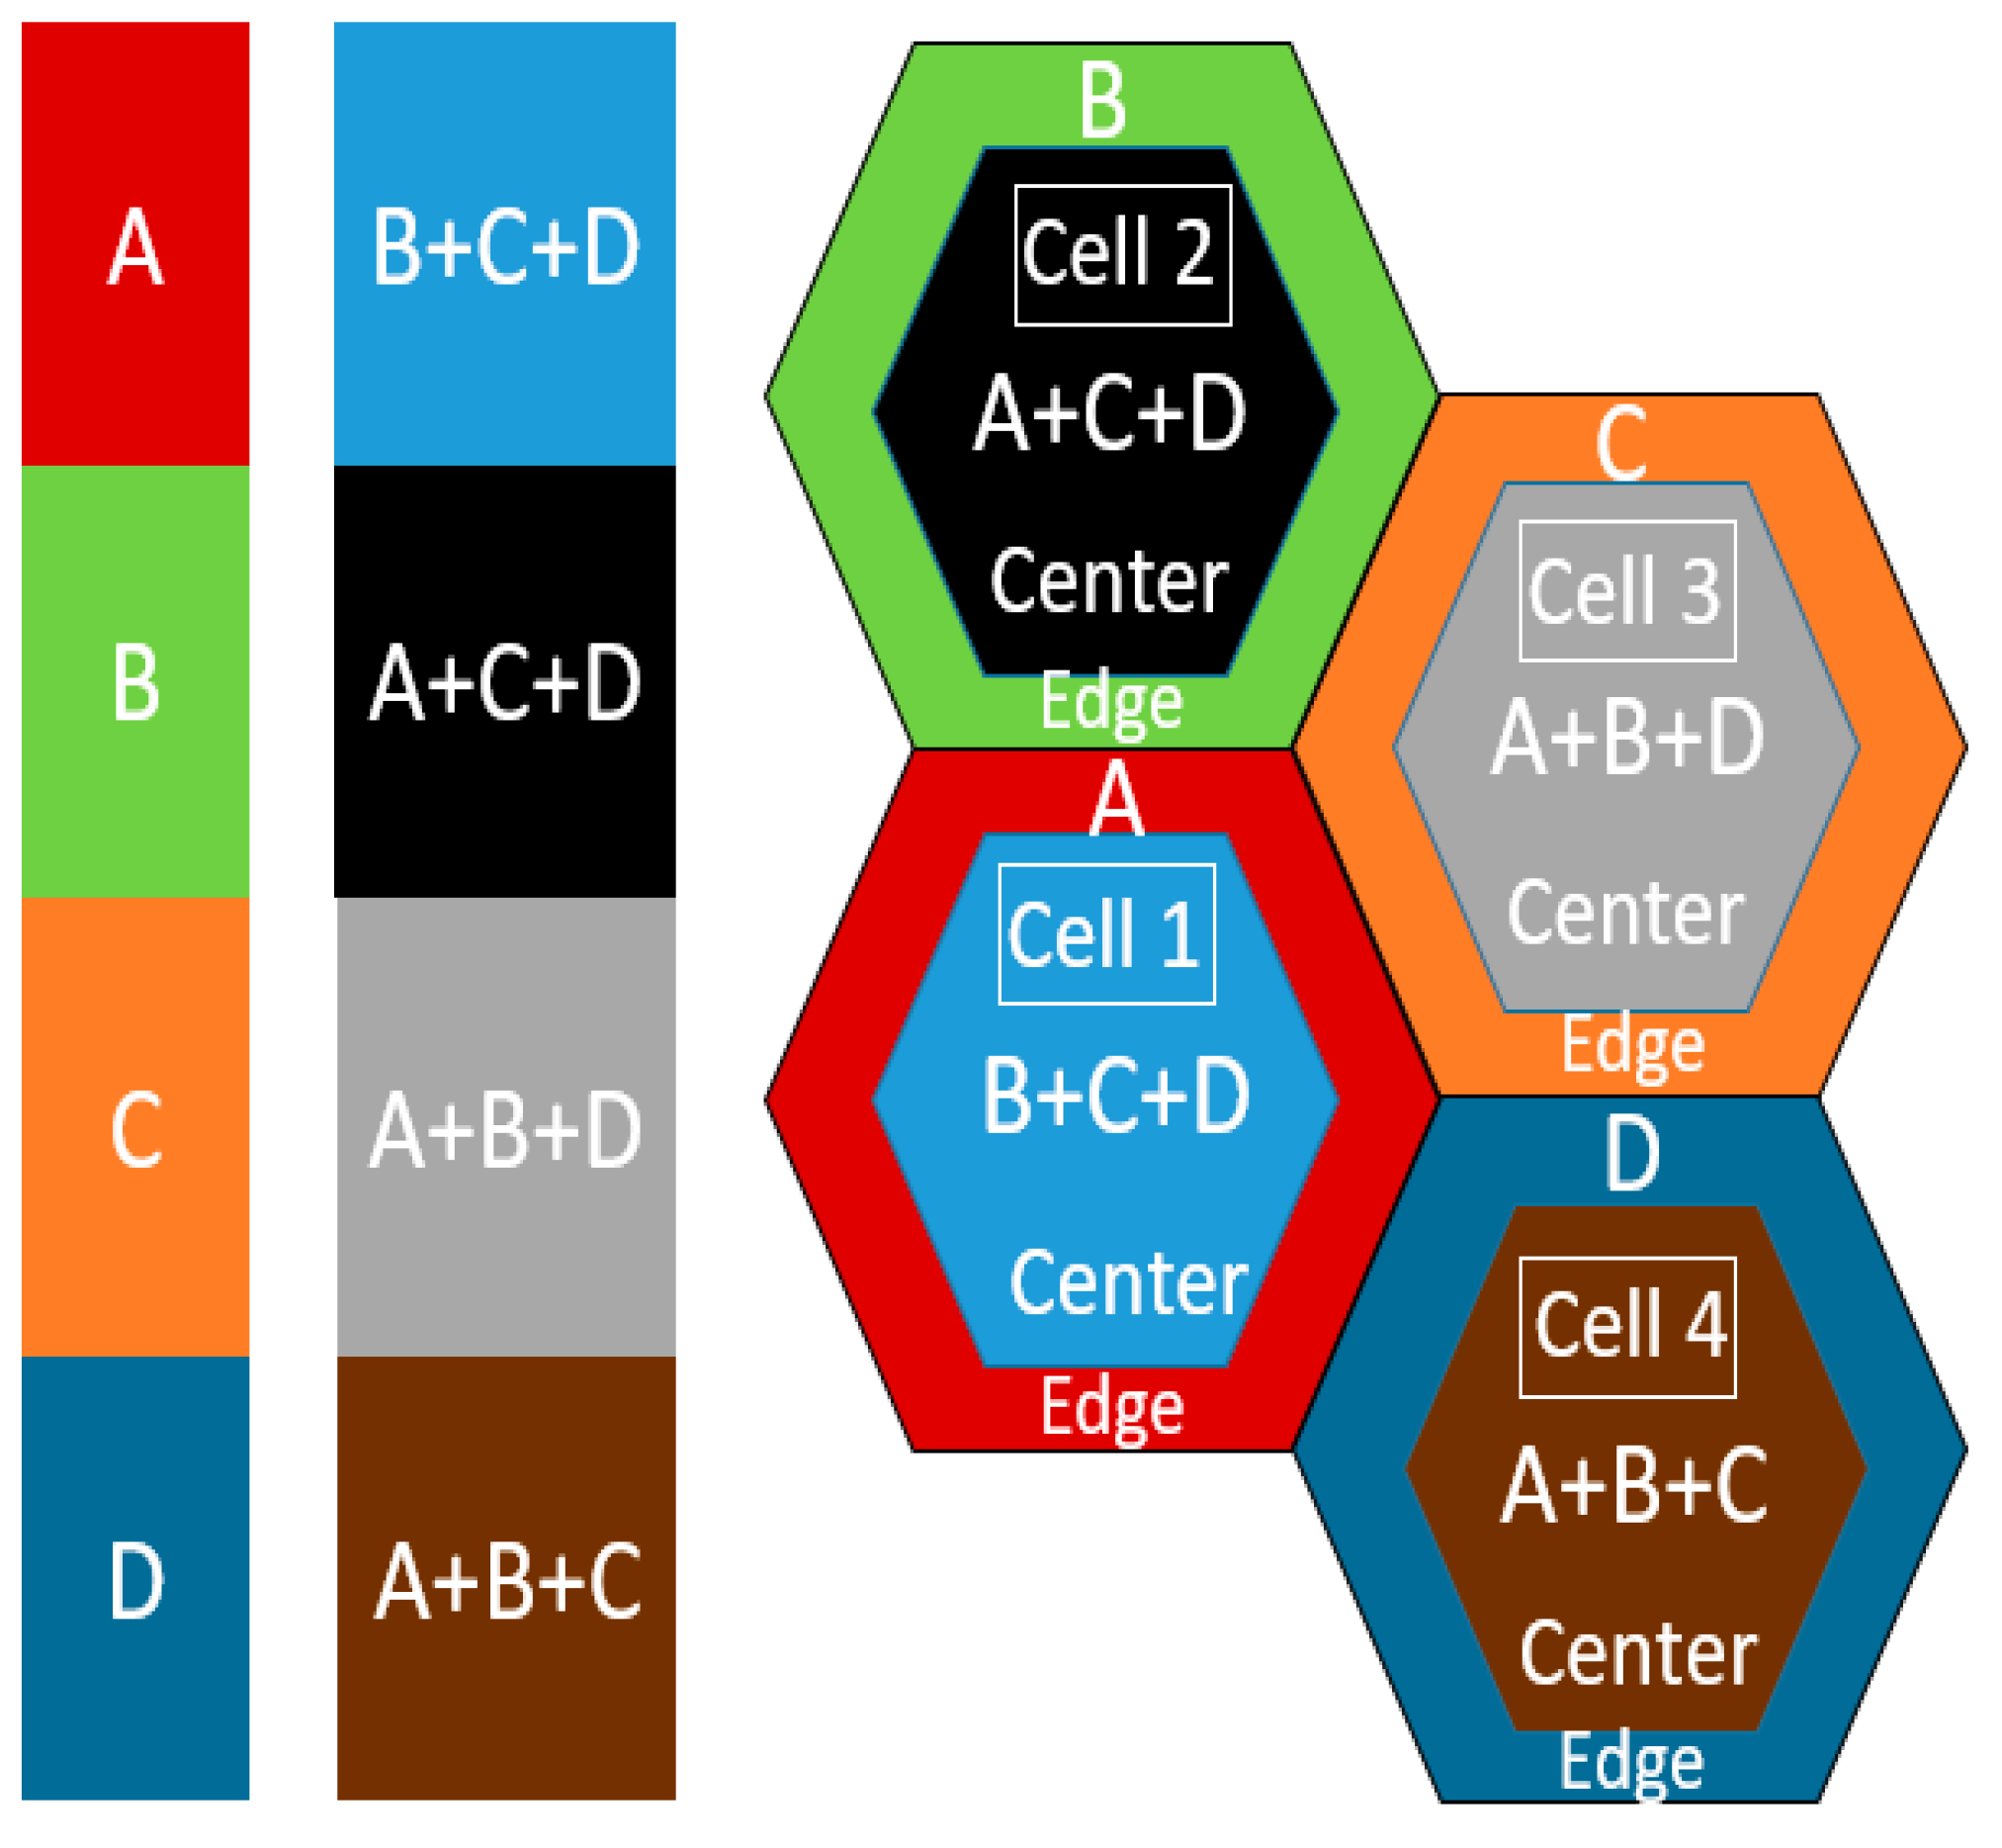
3.1. Proposed SFR-Based Sub-Band Allocation

In this section, the proposed SFR-based sub-band allocation of the SCs is explained. In the proposed SFR scheme, each cell is split into center zone and edge zone. Each SC can utilize one of seven sub-bands in its edge zone that are not utilized by the edge zones of the neighboring SCs, while its center zone is allowed to utilize the rest of the sub-bands with lower transmission power minimizing the interference to the adjacent SCs and reducing the power consumption of the system. If all the sub-bands are utilized by the edge zones of the adjacent SCs, one of the utilized sub-bands will be assigned to the edge zone of the SC. As an example, Figure 2 shows a SFR example for 4 regular-shape cells, where the frequency band is split into 4 sub-bands A, B, C and D. The edge zone of cell 1 utilize sub-band A, while the edge zones of cells 2, 3 and 4 utilize sub-bands B, C and D, respectively. Accordingly, cell 1 can utilize sub-bands B, C and D in the center zone. Moreover, cell 2 which utilizes sub-band B for the edge zone, can use the rest of the sub-bands (A, C and D) in its center zone. The same is applied in cells 3 and 4.
The SCs and the MCs set up the connections and interchange the measurements and UEs data. Then, they share them with the main controller, which accordingly decides the on/off switching of the SCs. Algorithm 1 demonstrates the sub-bands allocation for the SCs. Let S be the set of all the sub-bands. For cluster modulus 7, S = {1, 2, 3, 4, 5, 6, 7}. The algorithm is divided into two stages. In the first stage, the utilized sub-bands in the edge zone of the neighboring SCs to the SC c, are determined. When a SC c is switched on, it starts sensing the adjacent SC signals and identifies the sub-bands used in the adjacent SCs edge zone for not being utilized in its edge zone. The set of the utilized sub-bands in the edge zone of the neighboring SCs to the SC c is denoted by E c . The set of the remaining sub-bands for the edge zone of the SC c is denoted by H c .
Algorithm 1: Proposed SCs Sub-Bands Allocation
Inputs: Set of all the sub-bands (S), Set of all SCs (Z)
Output: Sub-band allocated to SC c ( S c )
1: For each SC c in Z
2:    Find set of the utilized sub- bands in the edge zone of the neighboring
        SCs   to   the   SC   c   ( E c )
3:     H c = S     E c
4:    if length ( H c ) = 1
5:      S c H c
6:    else if length ( H c ) > 1
7:        For each sub-band h in H c
8:        Find distance between the SC c and the nearest SC utilizing
           sub-band h in its edge zone ( d m i n h )
9:         Find h m a x which is the sub-band h with the largest
             distance d m i n h
10:             S c h m a x
11:       end For
12:    else
13:        For each sub-band i in E c
14:        Find distance between the SC c and the neighbouring SC utilizing
           sub-band i in its edge zone ( d i )
15:          Find i m a x which is the sub-band i with the largest distance d i
16:             S c i m a x
17:       end For
18:   end if
19: end For
In the second stage, we determine the sub-band allocated to SC c. For each remaining sub-band h in H c , the distance between the SC c and the nearest SC utilizing this sub-band h in its edge zone is measured and denoted by d m i n h . The sub-band h m a x with the greatest distance ( d m i n h ) is chosen to be allocated to the edge zone of SC c, and is denoted by S c . If all the seven sub-bands are allocated to the edge zone of the neighboring SCs, the sub-band i utilized in the farthest neighboring SC is chosen to minimize the interference. On the other hand, the center zone of SC c is allowed to utilize the rest of the sub-bands in S except S c . A real example is shown in Figure 3a, demonstrating a SC (with the yellow edge zone) with its neighboring SCs, where the center zone of this SC (the white zone) is allowed to utilize the remaining six sub-bands. Figure 3b shows the seven sub-bands.

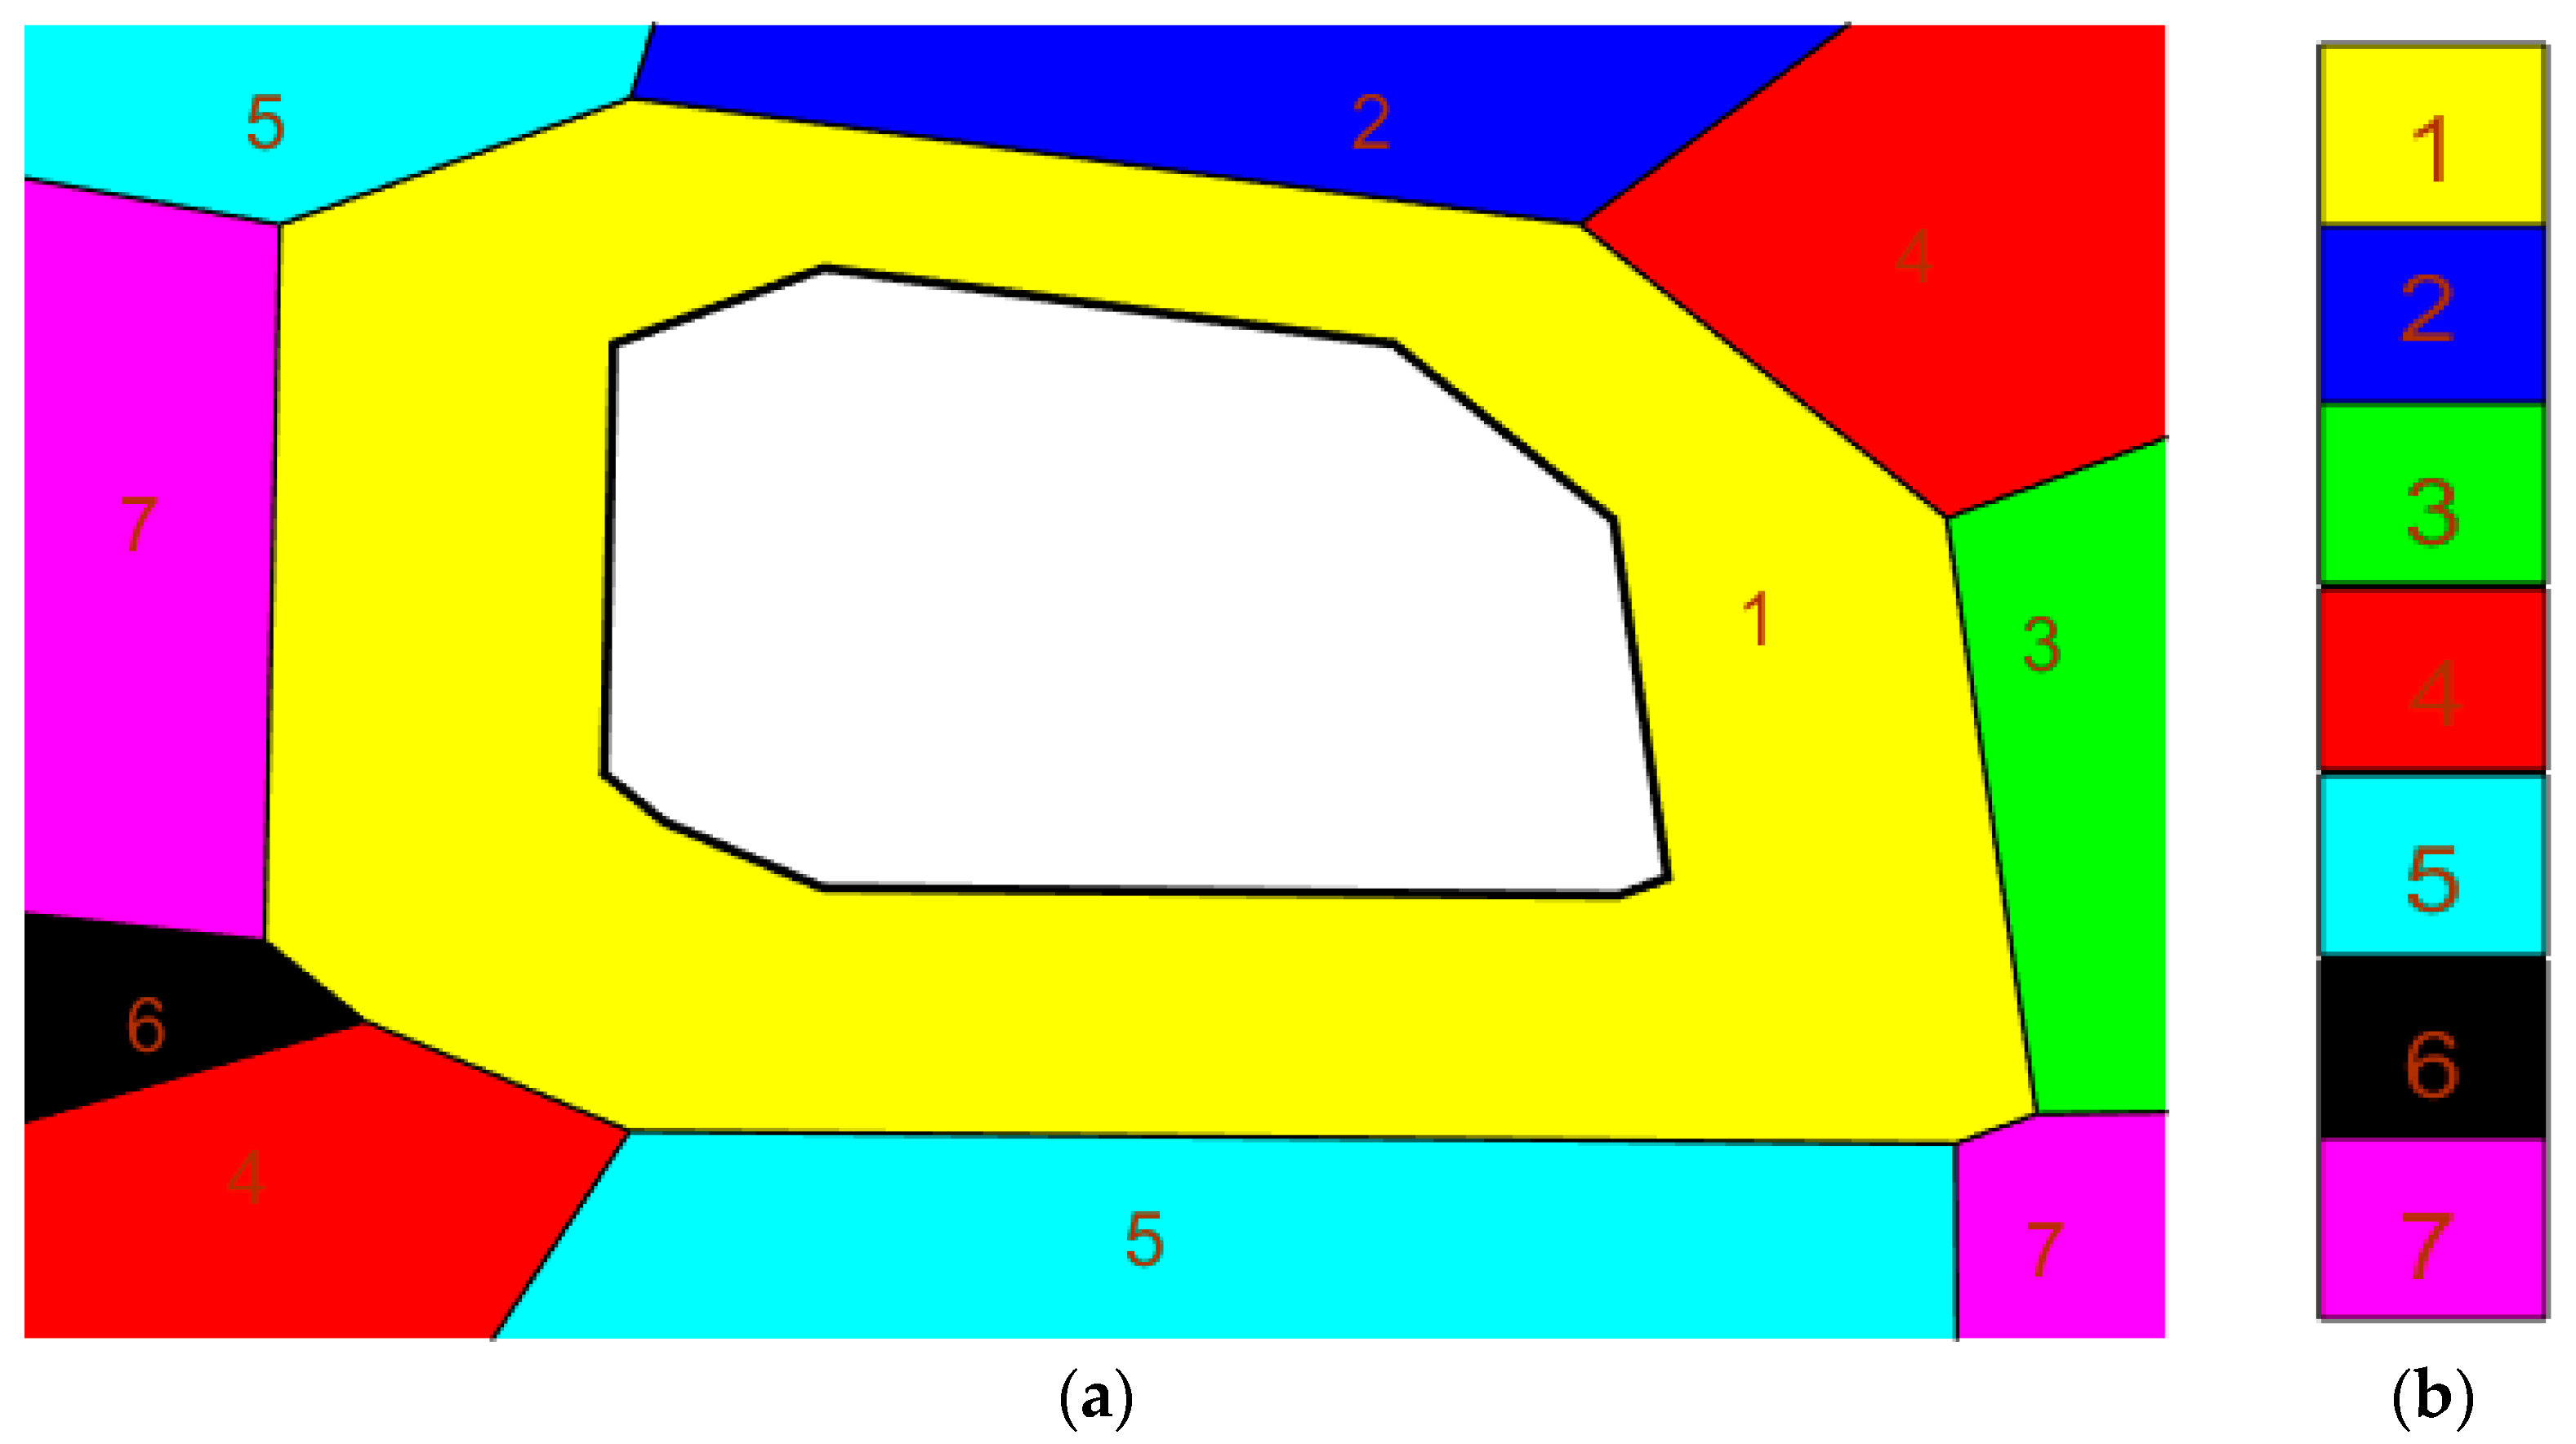
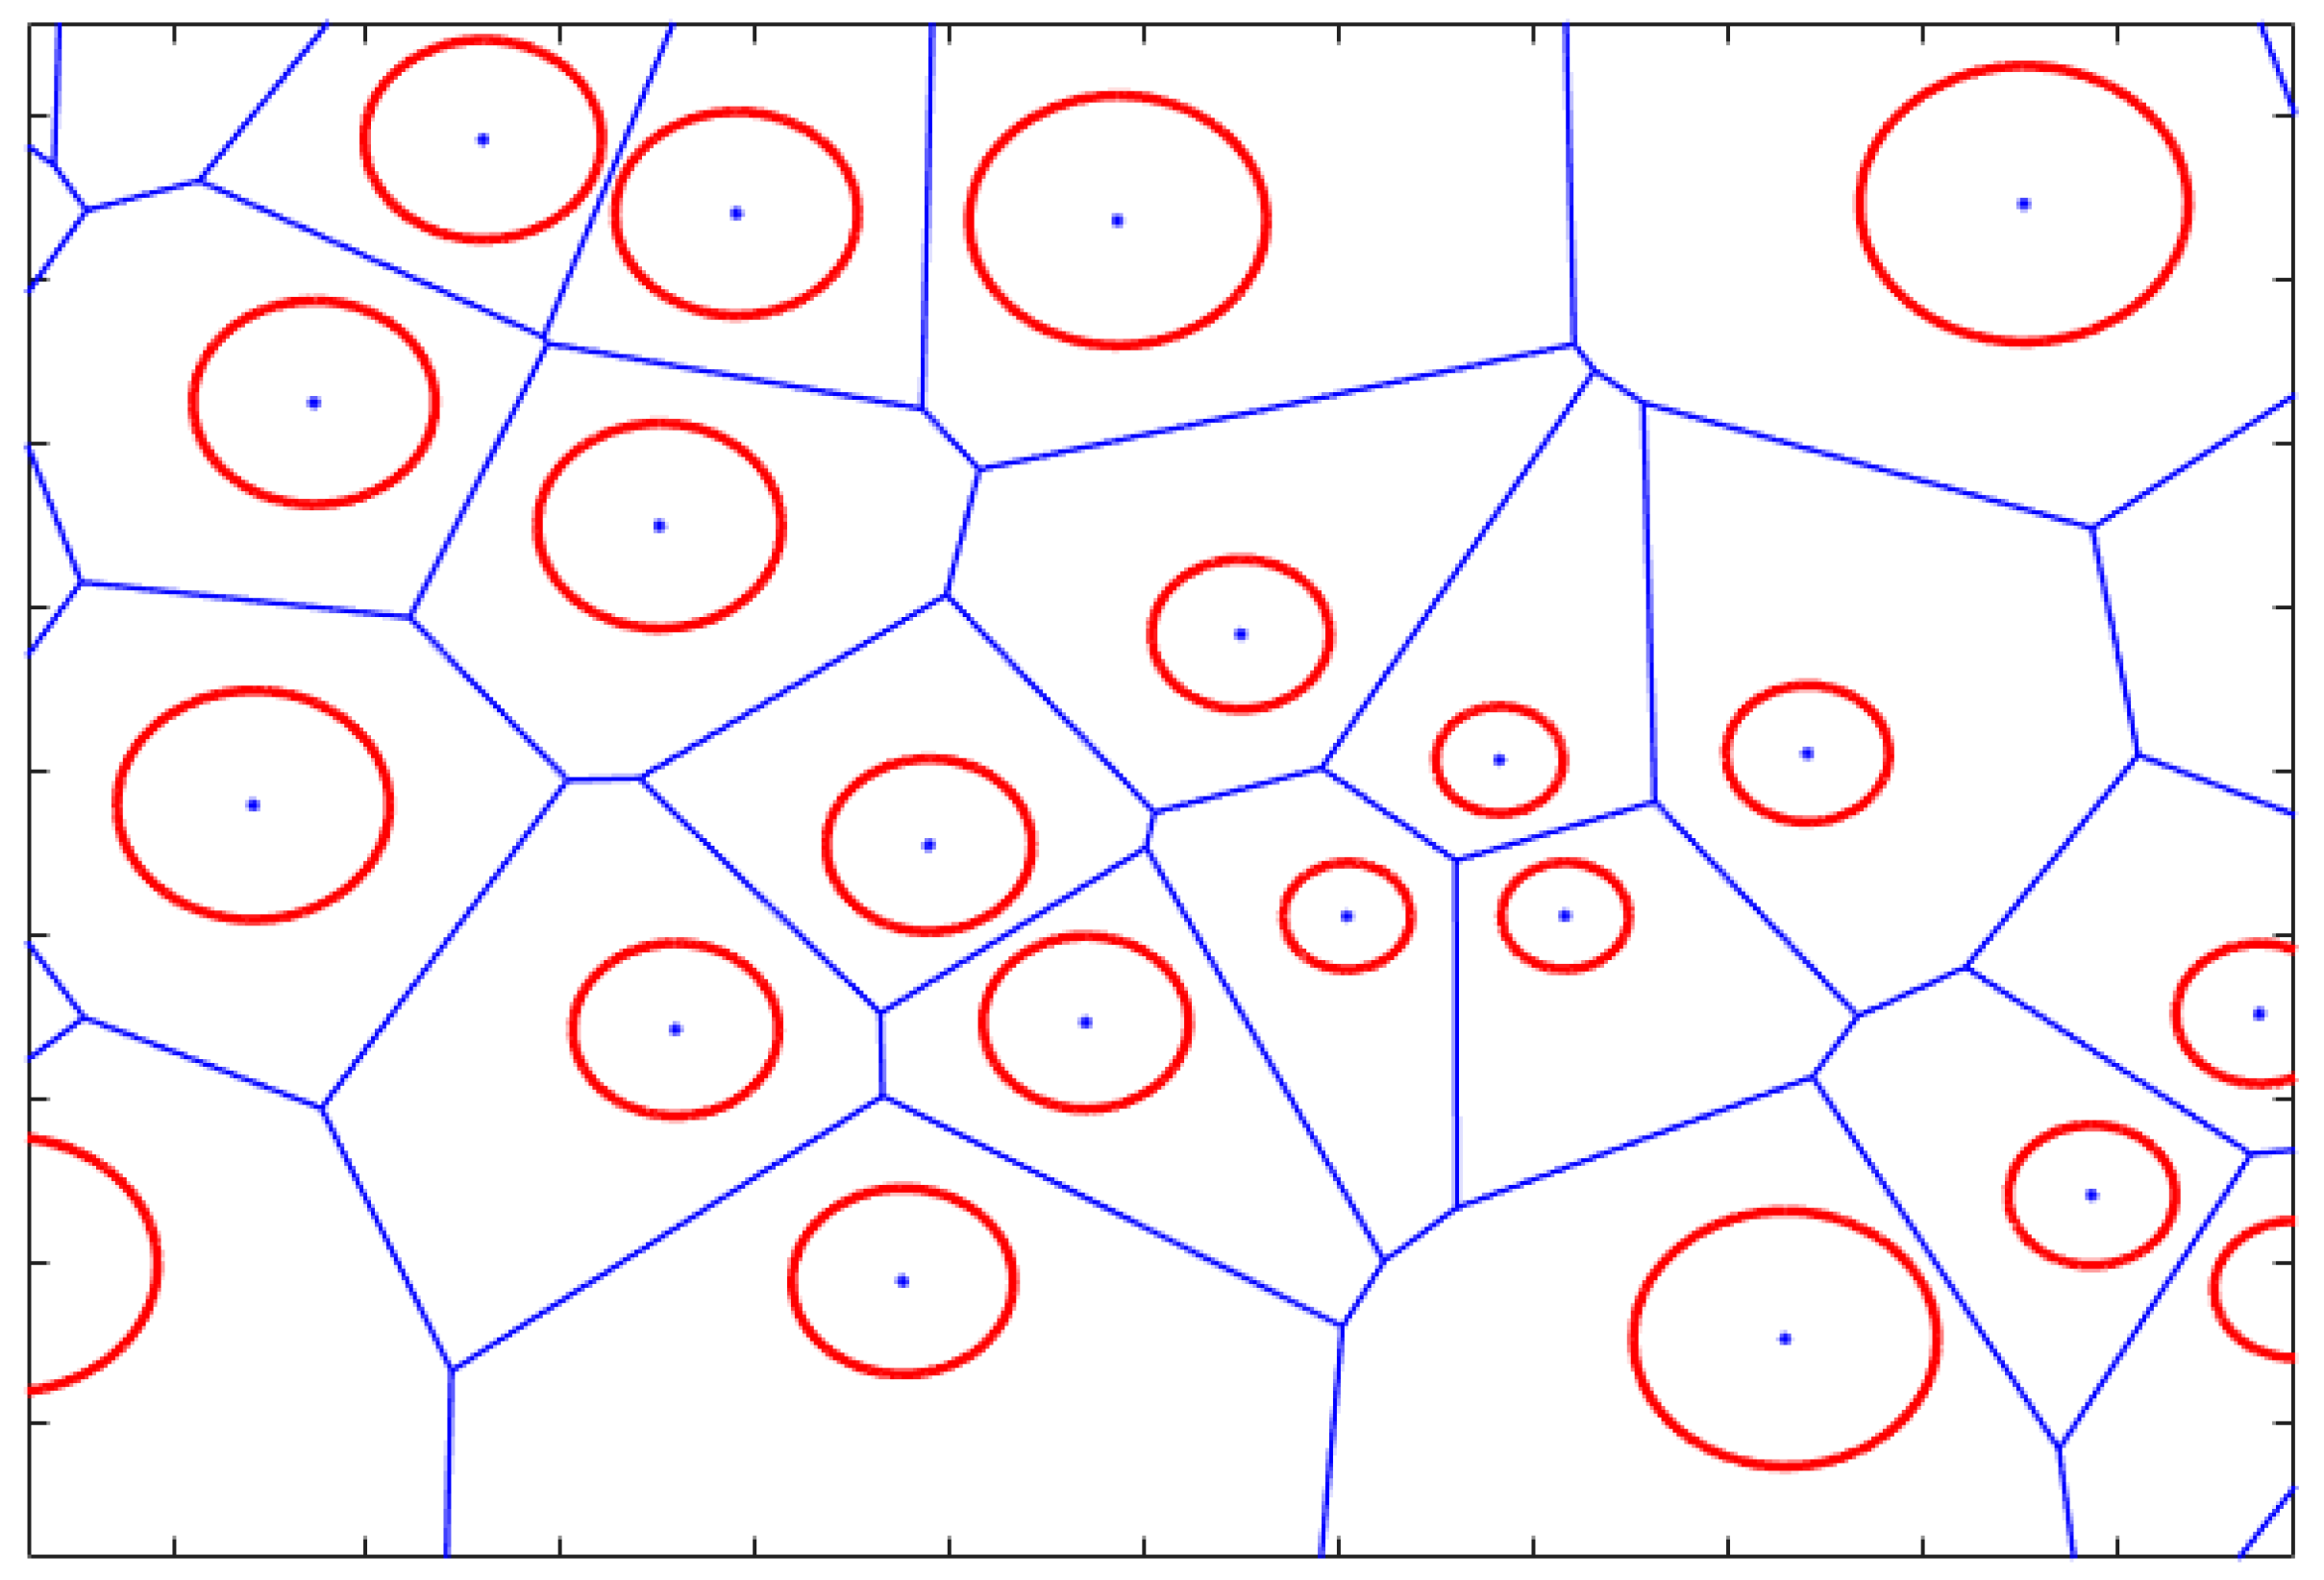
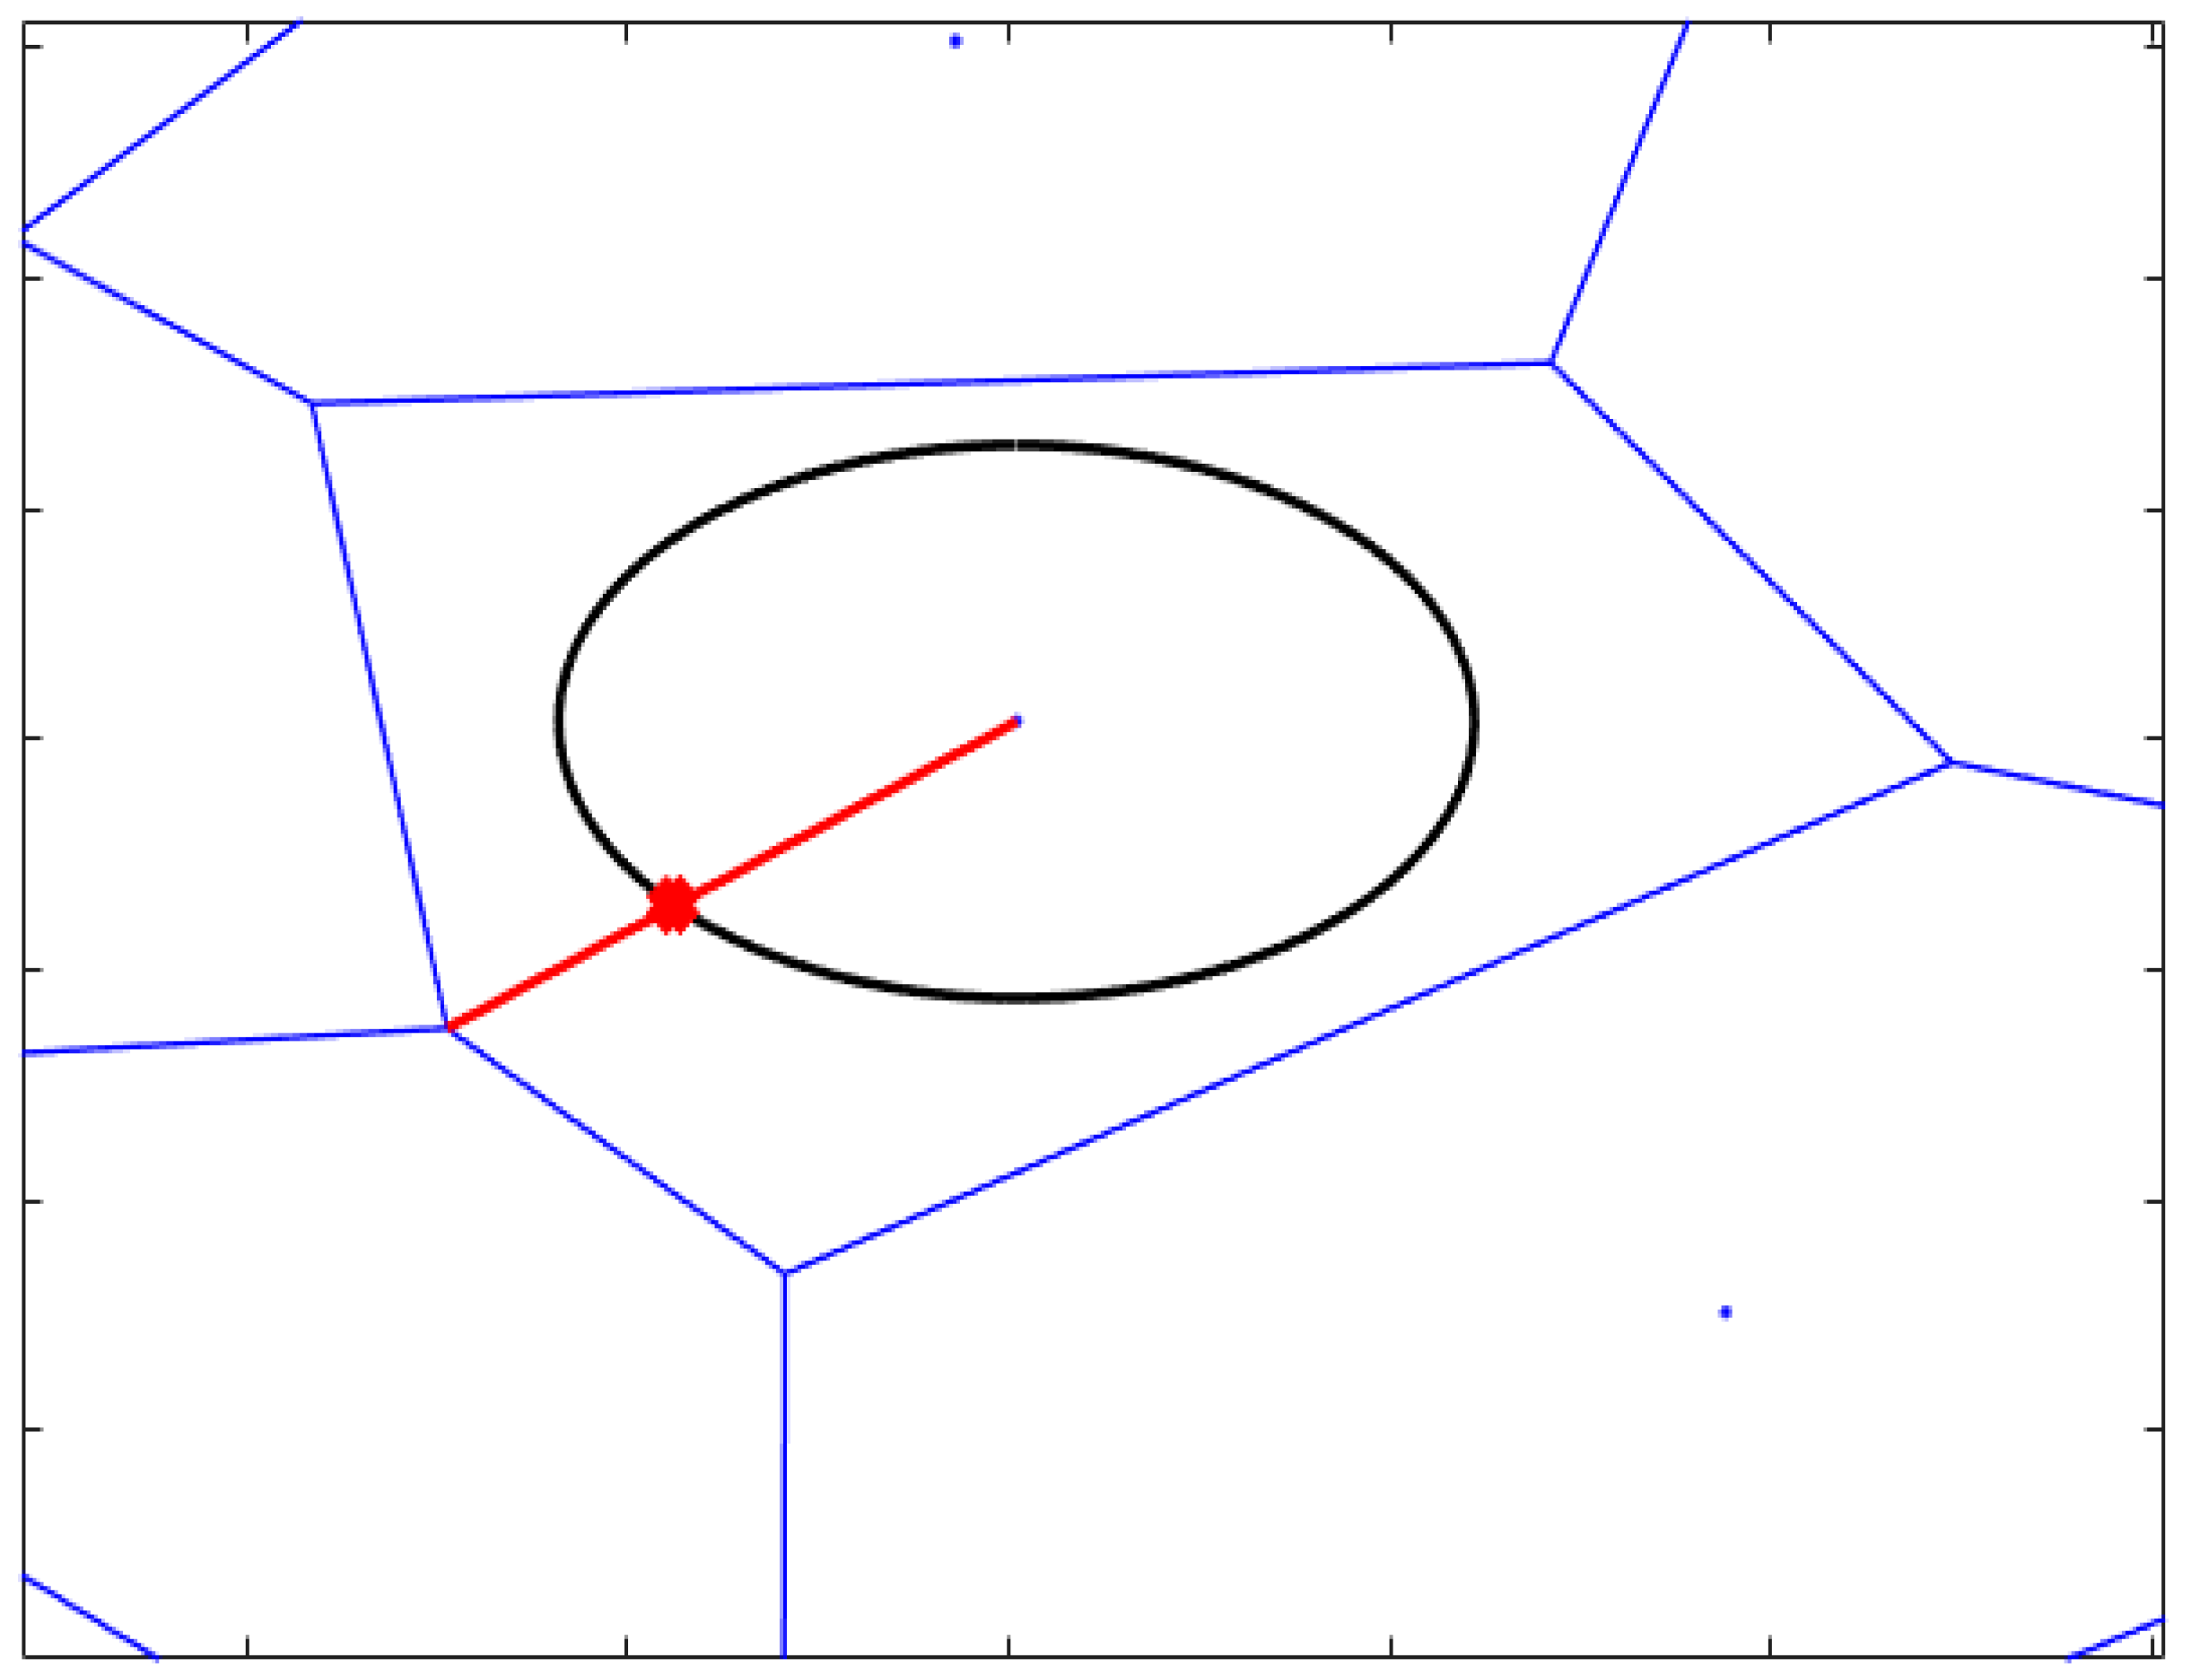
3.2. Proposed Circular versus Irregular Center Zone

The shape of the center zone can either be the same exact irregular shape as the cell as shown in Figure 4, or the circular center zone as shown in Figure 5. In both cases, the vertices of the center zone are determined according to the radius of the center zone. In the case of the center zone having the same irregular shape as the SC, the radius of the center zone is a certain ratio of the distance between each vertex and the center of the SC. To construct the irregular shape of the center zone, the vertices of the shape have to be determined as shown in Figure 6. For each vertex of the SC, it is required to find the intersection between the line connecting this vertex with the center of the SC (red line), and the circle whose center is center of the SC with radius equal to the center zone radius (black circle). This intersection is the vertex of the center zone. This process is repeated for all the vertices of the SC to get all the vertices of the center zone. Figure 7 demonstrates how the circular center zone is determined. The distance between the center of the SC and each vertex of the SC is calculated, and the minimum distance is found (the green line), which is the distance between the center of the SC and the nearest SC vertex to the center of the SC. Therefore, in case of the circular center zone, the radius of the center zone is a ratio of the minimum distance found ( r r a d ) which is considered the SC radius. The circular center zone is then drawn having the center of the SC as its center, and a radius equal to the radius of the center zone. Algorithm 2 illustrates how the center zone is determined in both irregular and circular center zone shapes.
Algorithm 2: Proposed Circular and Irregular Center Zone Determination
Inputs: Set of all SCs (Z), Co-ordinates of the center of SC c (xc, yc), Co-ordinates of all the vertices of SC c (xvc, yvc), Ratio of the SC radius (rrad)
Output: Co-ordinates of the center zone of SC c  ( x c e n c ,   y c e n c )
1: For each SC c in Z
2:  if irregular center zone
3:    For each vertex v c of SC c
4:     Calculate distance between each vertex and the center of the SC c
      ( d v c ) as in Figure 6
5:     Calculate radius of the center zone of   SC   c   ( r c e n ) = r r a d * d v c
6:     Draw the line connecting this vertex v c to the center of the SC c
7:     Draw the circle whose center is the center of the SC c with radius r c e n
8:     Find ( x c e n c ,   y c e n c ) = the intersection between the line in step 6 and the
      circle in step 7
9:     end For
10:  else if circular center zone
11:     For each vertex v c of SC c
12:    Calculate distance between each vertex and the center of the SC c ( d v c )
      as in Figure 7
13:    end For
14:    Find minimum d v c
15:    Calculate radius of the center zone of SC c ( r c e n ) = r r a d * minimum d v c
16:    Draw the circle whose center is the center of the SC c with radius r c e n
17:    Find ( x c e n c ,   y c e n c ) = all the points on the circle in step 16
18:  end if
19: end For

3.3. On/Off Switching Algorithm

In order to reduce the power consumption of the system, SC on/off switching technology is utilized based on the ICR values of the SCs. The ICR concept is chosen as it does not switch off the SC based on the traffic of the SC only, but it also considers the interference caused by the SC to the other SCs. Thus, the ICR concept helps to mitigate the interference between the SCs. Moreover, it minimizes the traffic losses, as the ICR value of the SC decreases when the number of UEs in the SC increases.
Algorithm 3 demonstrates the on/off switching of the SCs. The algorithm is divided into two stages. In the first stage, the cell is determined:
  • Off: if the number of UEs in SC c which is N c = 0, and SC c is then added to Z o f f (which is the set of SCs that should be switched off).
  • On: SC c is added to Z o n (which is the set of SCs that should be switched on) in 2 cases:
    • If the load of the SC ( L c ) (which is the total number of required RBs by the UEs in SC c) exceeds a certain threshold ( L t h r ), and L t h r is set to half the maximum number of RBs for SC c ( Y c ) .
    • If the maximum RSRP of SC c ( R S R P c ) exceeds a certain threshold ( R S R P t h r ). The maximum R S R P c = maximum [ P c G c , j ] and j    U c . While R S R P t h r =   5   ( P c G c ) , and G c is the channel gain of SC c to the UE at the cell edge. The threshold R S R P t h r can be modified based on the network conditions.
  • Undetermined: If none of the previous conditions are present, SC c is added to Z U D (which is the set of undetermined SCs to be turned on/off).
In the second stage, the undetermined cells are categorized into on or off cells according to their ICR values:
  • Off: If the ICR of SC w ( χ w ) exceeds χ ¯ (where χ ¯ is the average of the ICR values of the SCs in Z o n ), and SC w is then added to Z o f f .
  • On: If χ w is less than χ ¯ , SC w is then added to Z o n .
Therefore, the outputs of algorithm 2 will be Z o n and Z o f f .
Algorithm 3: Proposed SCs On/Off Switching Algorithm
Inputs: Total load of SC c ( L c ), Max R S R P c , Number of UEs in SC c ( N c ), SCs load threshold ( L t h r ), SCs RSRP threshold R S R P t h r and Set of all SCs (Z)
Outputs: the set of SCs that should be switched on ( Z o n ), the set of SCs that should be switched off ( Z o f f )
1: For each SC c in Z
2:     if N c = 0
3:       Z o f f SC c
4:     else if L c > L t h r or Max R S R P c > R S R P t h r
5:       Z o n SC c
6:    else
7:       Z U D SC c
8:    end if
9:     Find ICR of SC c ( χ c )
10: end For
11: Find average ICR values of the switched on SCs ( χ ¯ )
12: For each SC w in Z U D
13:     if   χ w > χ ¯
14:      Z o f f SC w
15:    else
16:       Z o n SC w
17:      Update χ ¯
18:    end if
19: end For

4. Numerical Results

The performance of various schemes has been evaluated:
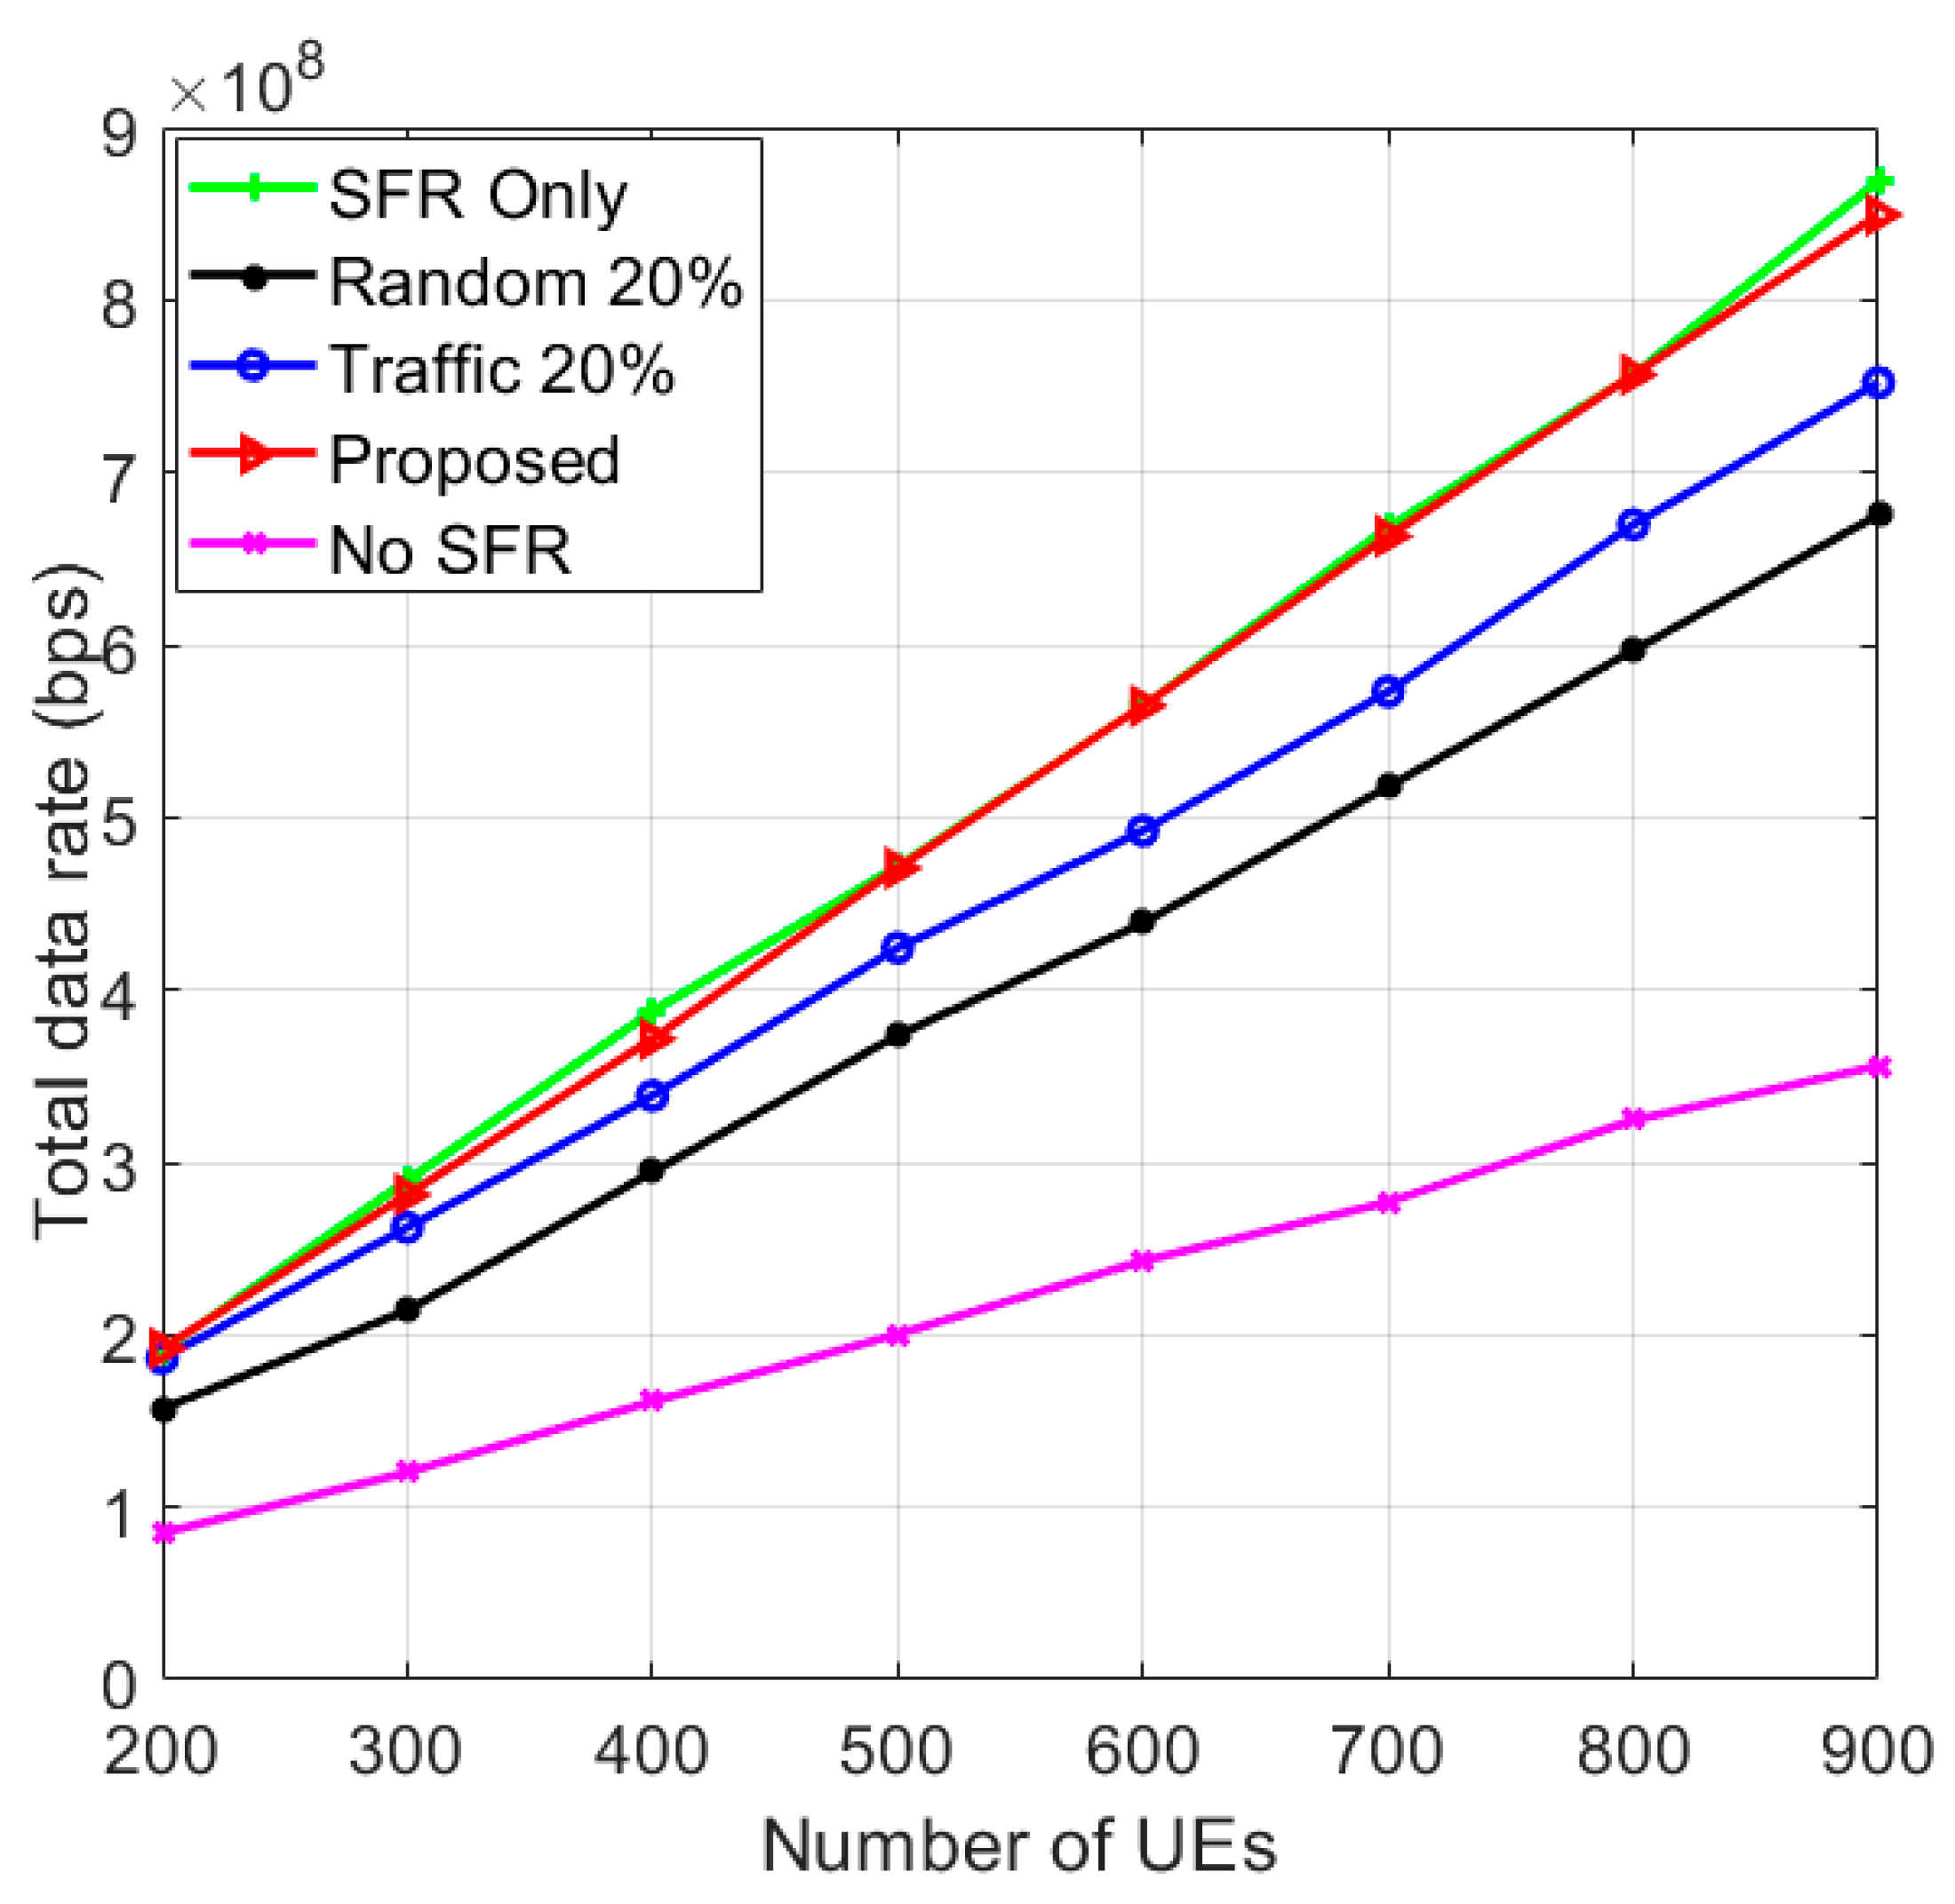
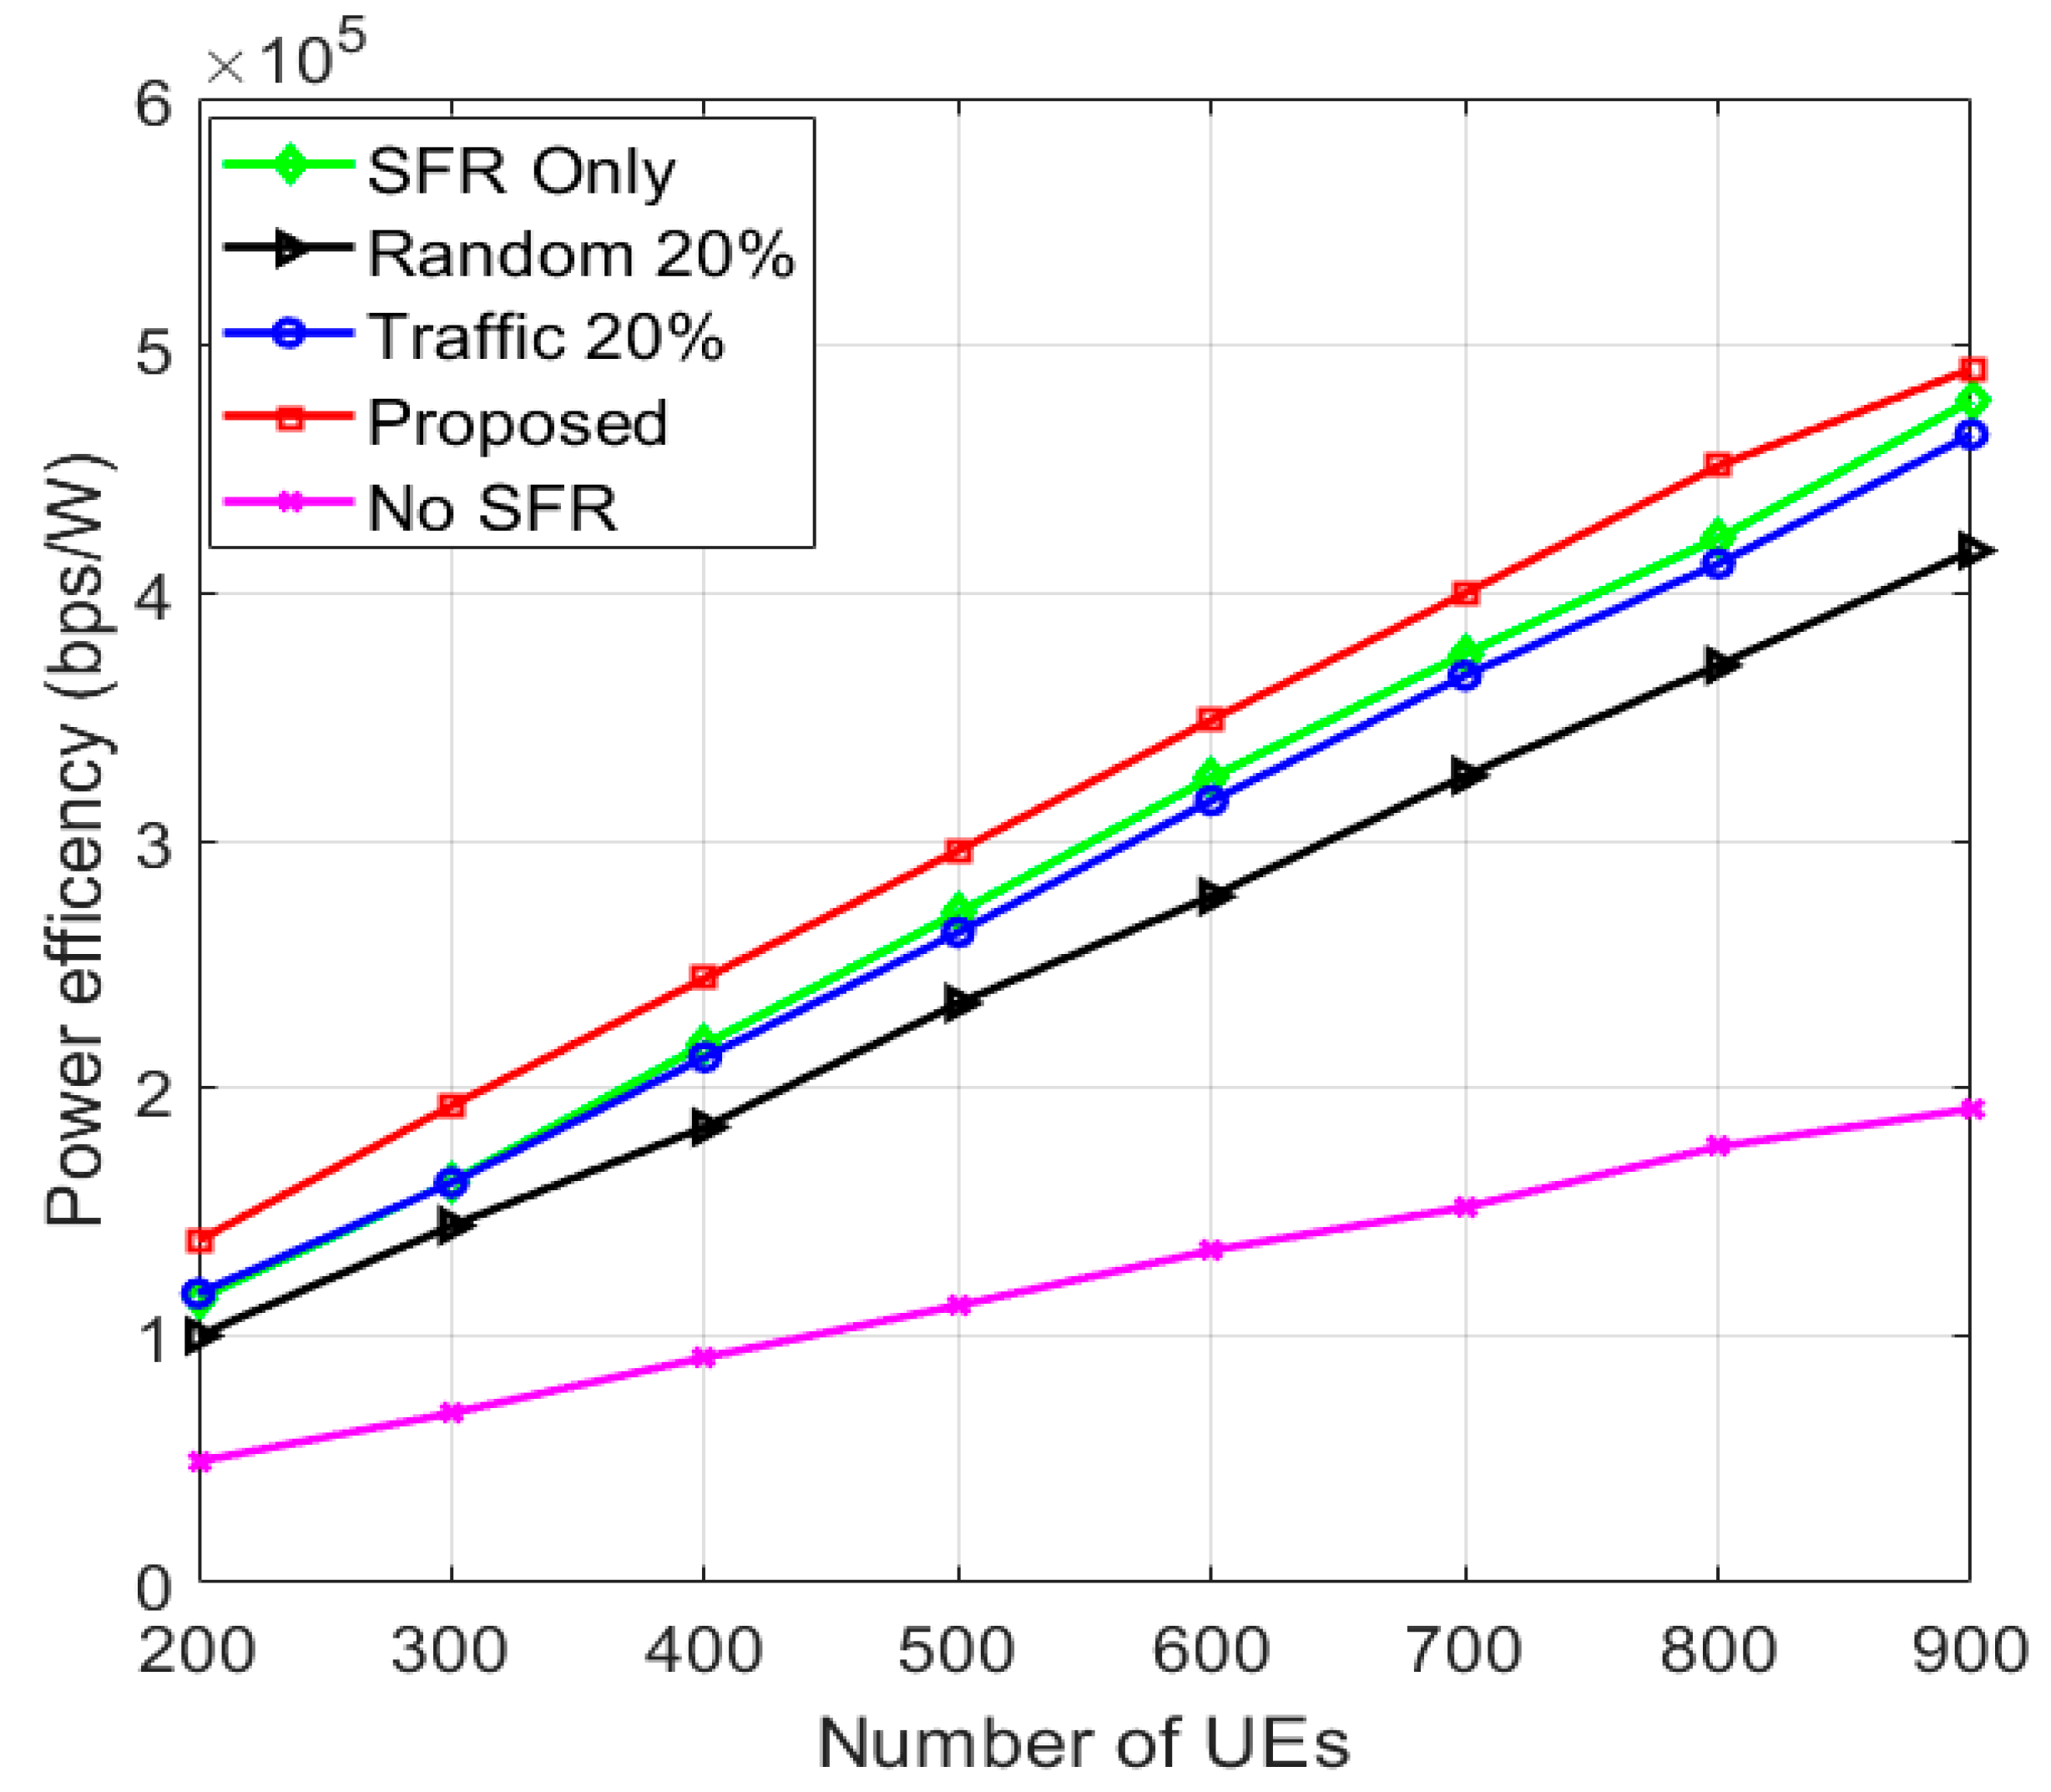
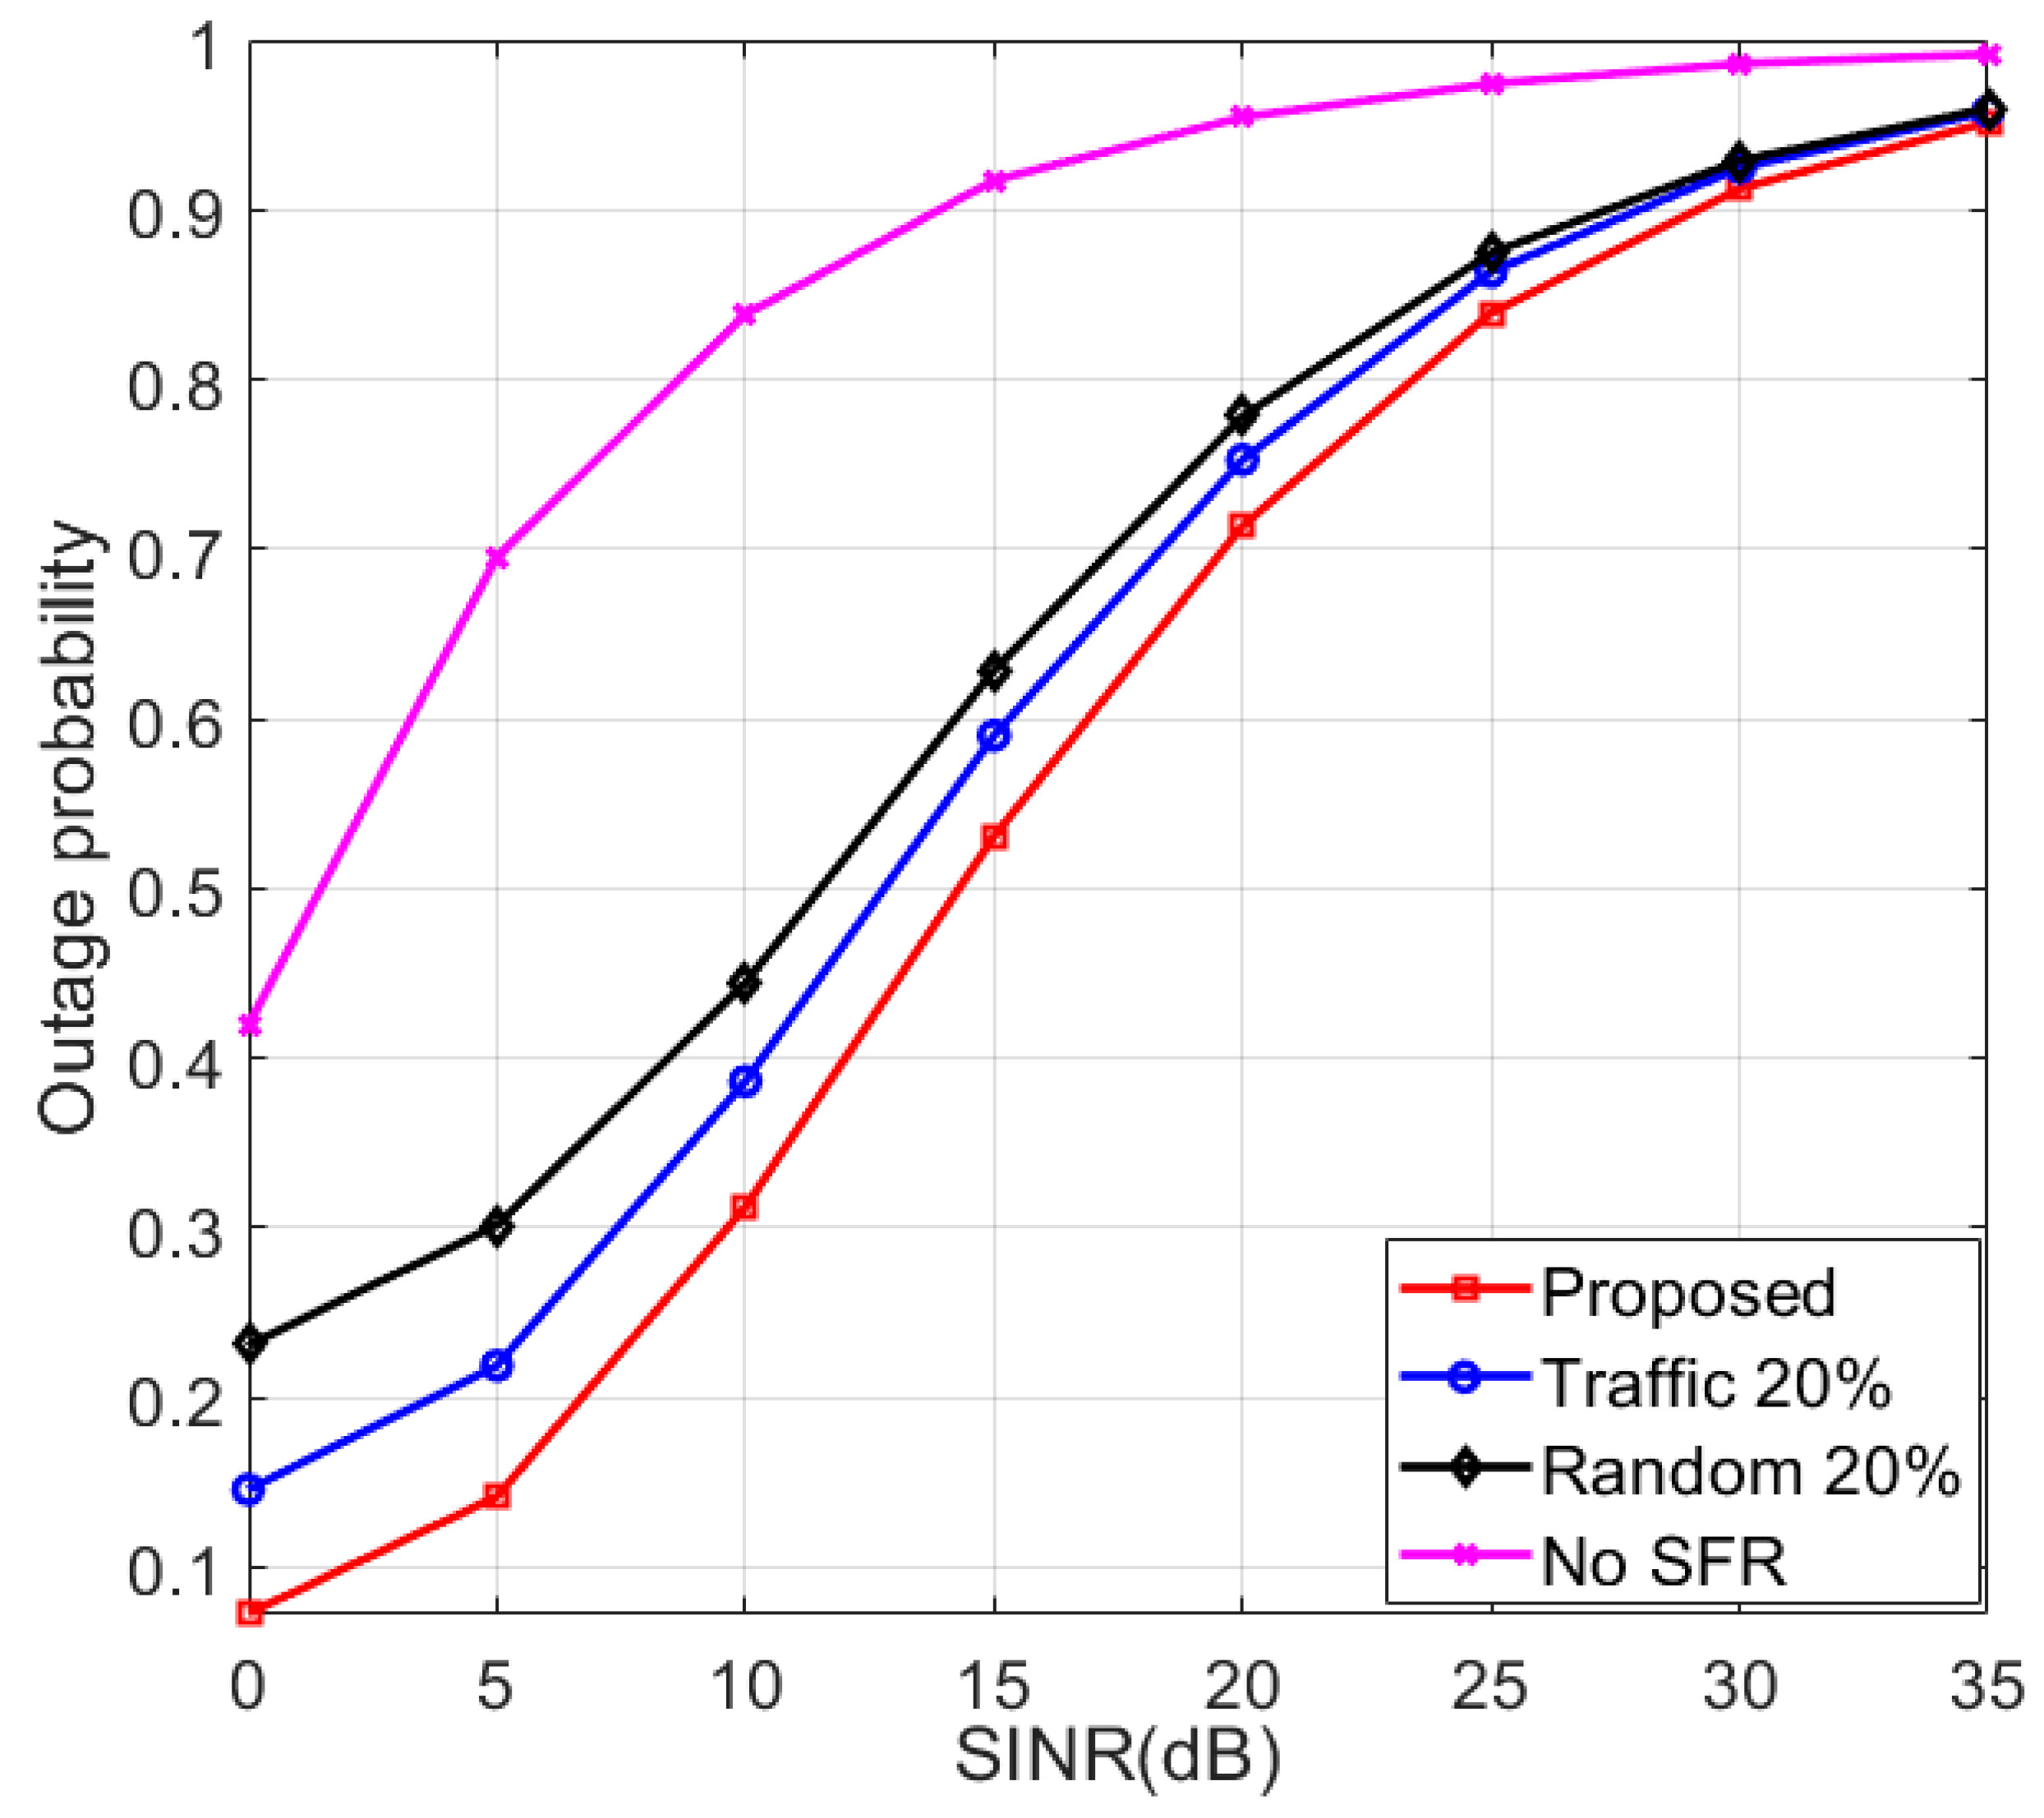
  • No SFR: It does not utilize SFR and without applying any turning-off techniques (all SCs are active).
  • SFR Only: It utilizes SFR without applying any turning-off technique (all SCs are active).
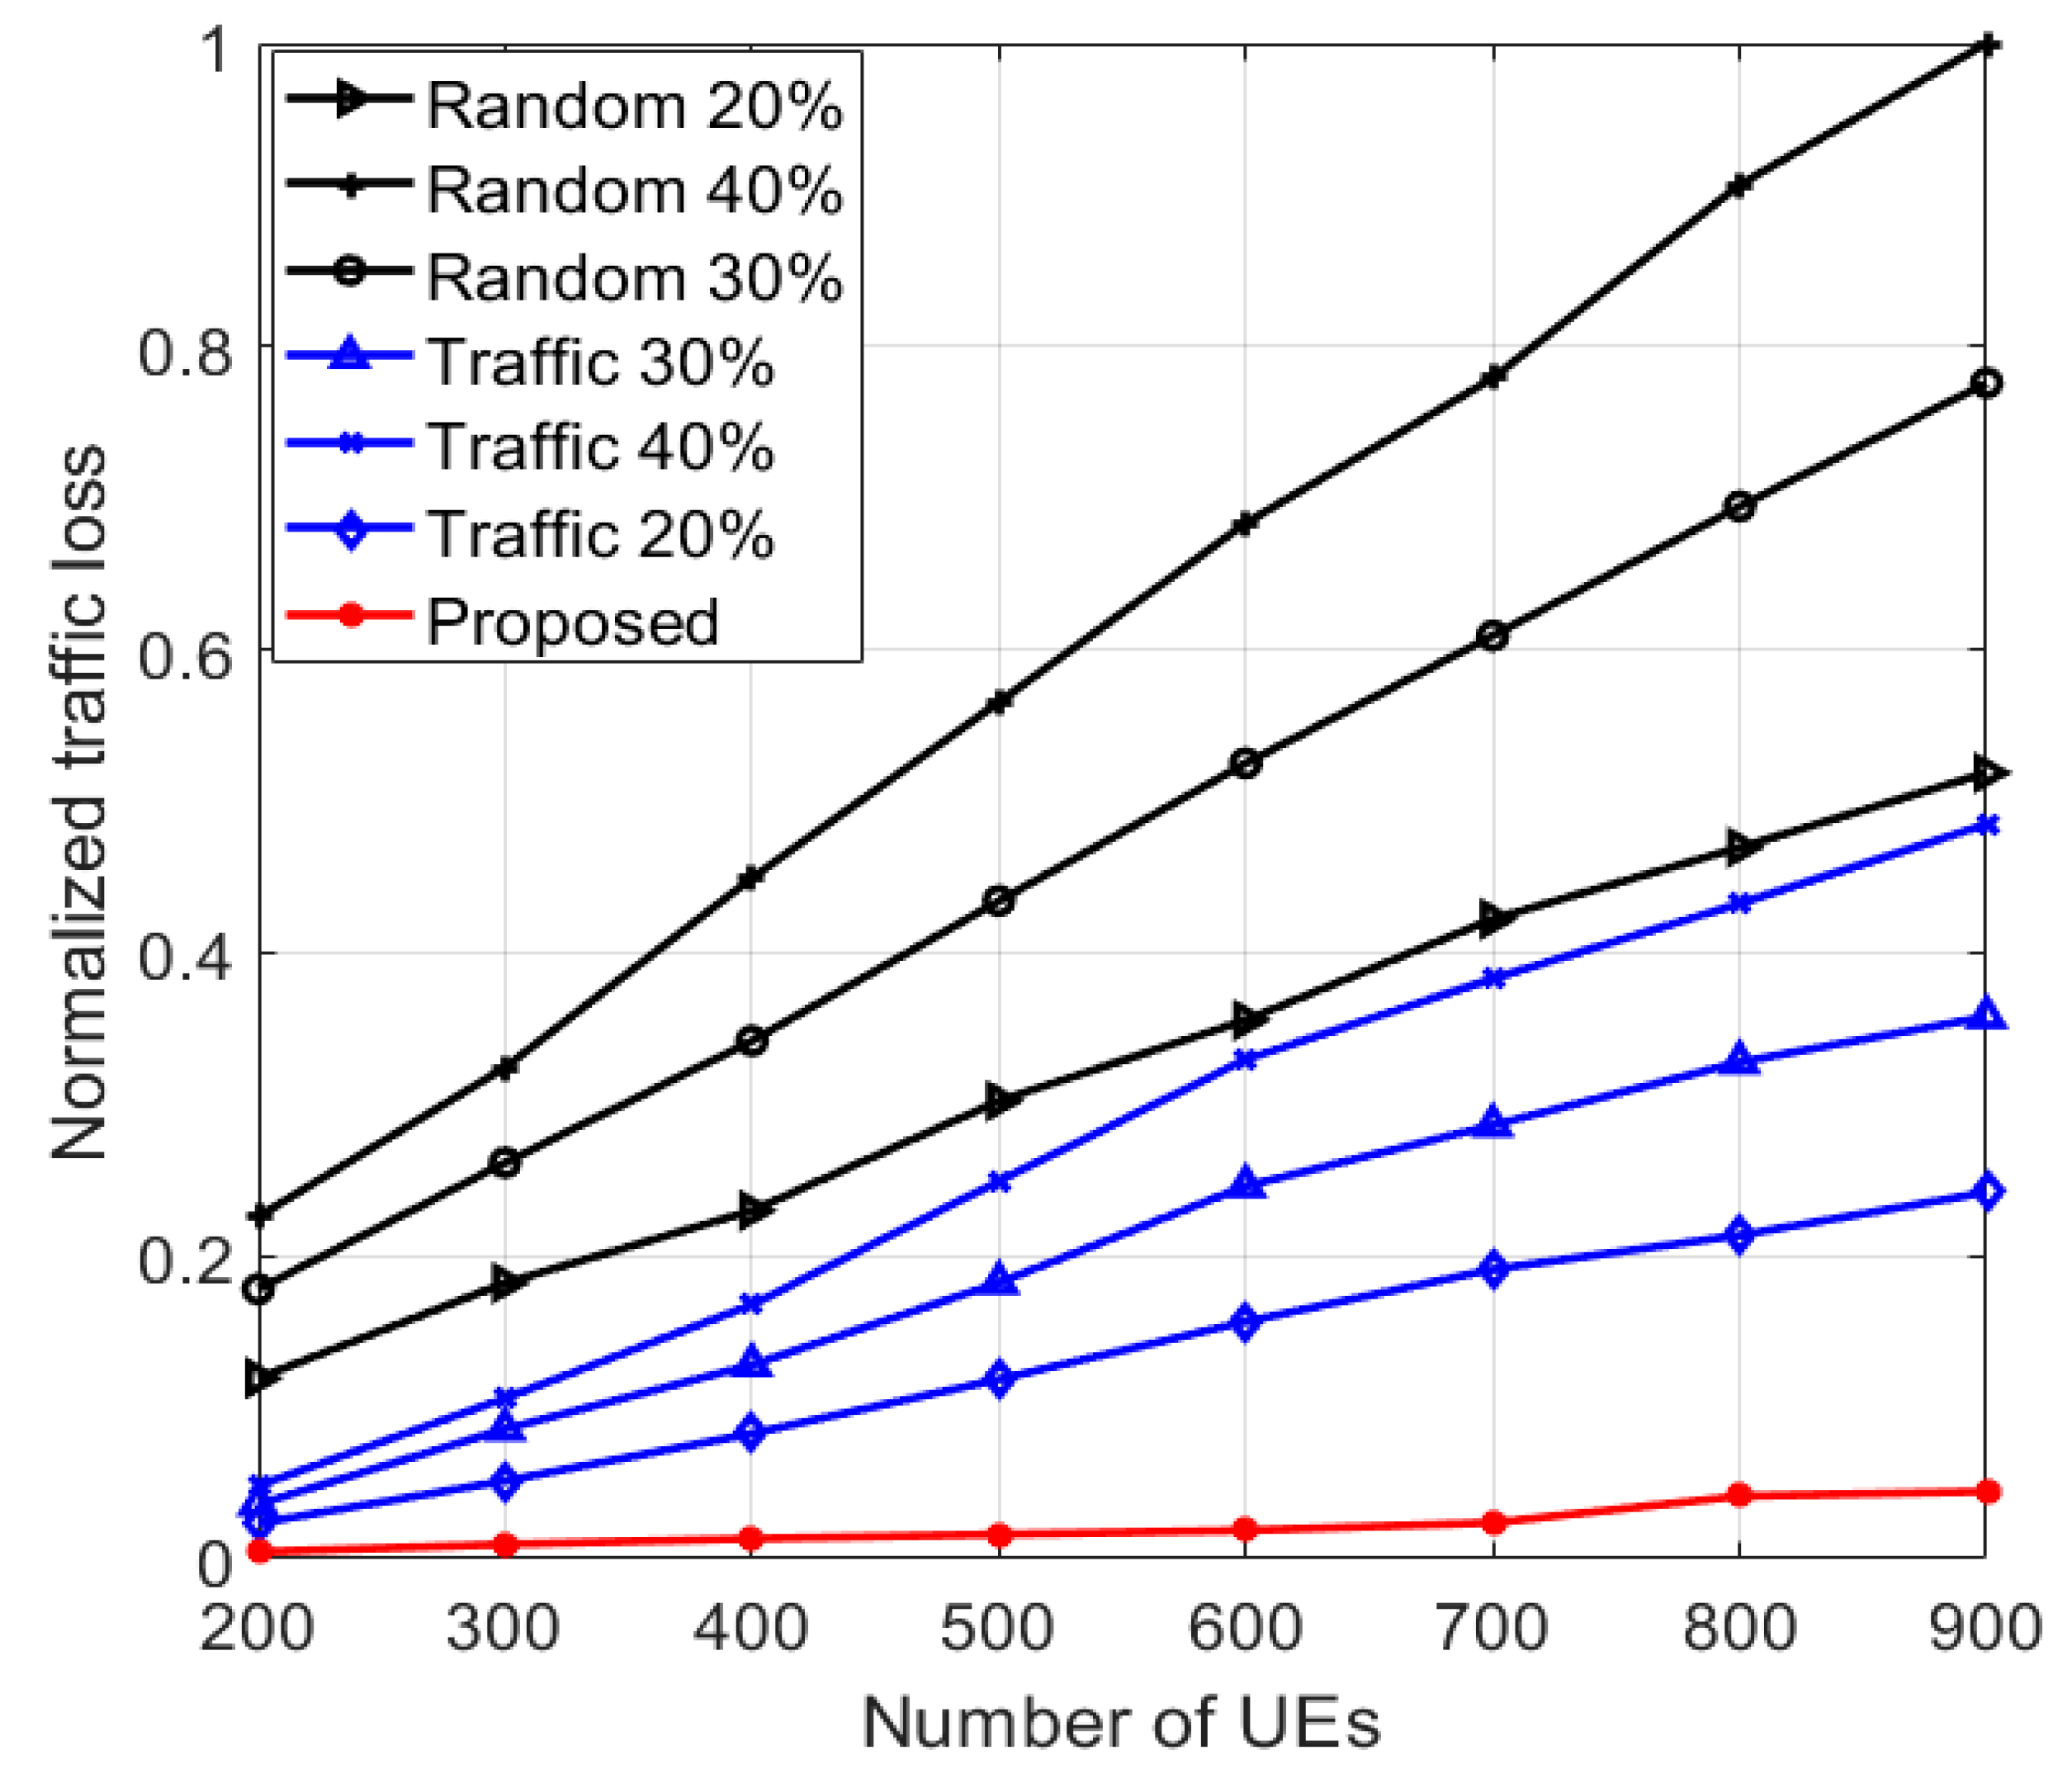
  • Random on/off: It utilizes SFR and a certain percentage of chosen SCs are randomly selected to be turned off. The rest of the SCs stay active. As an example, for “Random 20%”, 20% of randomly chosen SCs are selected to be turned off.
  • Traffic on/off: It utilizes SFR and a certain percentage of the SCs having the smallest traffic load are selected to be turned off. The rest of the SCs stay active. As an example, for “Traffic 20%”, 20% of the SCs having the smallest traffic load are selected to be turned off.
  • Proposed: It utilizes SFR and the SCs are turned on/off according to their ICR values and their traffic load. the ICR of each SC is calculated then an on/off switching decision is taken.
The simulation parameters are retailed in Table 2. Multiple SCs are deployed within the coverage area of the MCs. The UEs are randomly deployed over the whole network. The simulations are carried out using MATLAB R2017a. The maximum iteration count for attaining 95% confidence level based on Monte Carlo Sampling [45] is found to be 34. As a result, all our next simulations are averaged over 100 iterations.

4.1. Performance Evaluation of Circular and Irregular Center Zone

Figure 8 and Figure 9 show the different performance evaluations: Figure 8a shows the total data rate; Figure 8b shows the total power consumption; Figure 9a shows the power efficiency for different numbers of UEs; and Figure 9b shows the outage probability for different SINR thresholds at number of UEs = 900, for the case of the circular center zone and the case of the center zone having the same irregular shape as the SC. The outage probability is defined as the percentage of UEs which fail to achieve a certain SINR threshold. Thus, P o u t a g e =   c j δ j , c   S I N R j , c c j S I N R j , c , where δ j , c   = 1 if S I N R j , c is below a certain SINR threshold, otherwise δ j , c = 0 . All the results show that the case of the circular center zone, which is more practical to implement, has almost the same performance as the case of the center zone having the same irregular shape as the SC, which is the theoretical case. Thus, the case of the circular center zone can be easily implemented by using omni-directional antennas without any performance degradation. Therefore, the circular center zone will be used in the proposed scheme in the rest of the simulations in this paper.

4.2. Optimum Center Zone Radius

Figure 10 shows the total system data rate for different fractions of a center zone radius. The total data rate increases as the radius of the center zone increases. The total system data rate is maximized when the radius of the center zone is 50% of the SC radius. The total data rate then starts to degrade because of the increased interference levels on the UEs in the edge zones of the neighboring SCs utilizing the same sub-bands. Therefore, the optimum radius of the center zone will be used in the proposed scheme in the rest of the simulations in this paper.

4.3. Performance Evaluation of Different SFR-Based Schemes

Figure 11 shows the system’s total power consumption of all the various schemes for different numbers of UEs. The power consumption increases as the number of UEs increases, due to the increase in the transmission power. The “No SFR” scheme has the highest power consumption as it does not apply the SFR concept and all the SCs are active, greatly increasing its power consumption. The “SFR Only” scheme has less power consumption than the “No SFR” scheme, due to the decrease in the transmission power for the users in the center zone, but all the SCs are still active, so this scheme has a higher power consumption than all the other turning-off schemes. The “random” and the “traffic on/off” schemes have a lower power consumption (20% then 30% then 40%) than the “SFR Only” scheme because of the power saved from the turned-off SCs. The proposed scheme has a lower consumption than the “SFR Only” due to the switching off of the SCs, although the power consumption increases as the number of UEs increases, since the number of SCs that can be turned off decreases. This is because in the proposed scheme, as the number of UEs increases, the ICR value of SC c decreases. The proposed scheme has the least power consumption in the case of a small number of UEs, because of the large number of SCs that can be turned off.
Figure 12 shows the total system data rate of the various schemes for different numbers of UEs. Both the proposed and the “SFR only” schemes have the highest data rates, as the proposed scheme considers the number of UEs in the SCs and the QoS of the users in the network. The proposed scheme achieves a higher total system data rate than both the “traffic” and the “random on/off” schemes. Thus, our scheme is able to decrease the interference levels due to utilizing the SFR concept and switching the SCs on/off based on the ICR concept. The “traffic on/off” scheme has higher data rates than the “random on/off” scheme, as it considers the amount of traffic in the SCs, unlike the “random on/off” scheme that has high traffic losses because of the random selection of the turned off SCs. The “No SFR” scheme has the least data rates, as it has the highest interference levels since all the SCs are constantly active and it does not apply the SFR concept.
Figure 13 shows the power efficiency of the various schemes for different numbers of UEs. The power efficiency is the ratio between the total data rate and the total power consumption of the SCs. The proposed scheme has the highest power efficiency, as it has low power consumption and high data rates, due to the decreased interference levels and the low traffic losses. The “SFR Only” scheme has a lower power efficiency than the proposed scheme, as it has a higher power consumption since all the SCs are constantly kept active. The “traffic on/off” scheme has a lower power efficiency than the “SFR Only” scheme, as it has lower data rates, as a certain percentage of the SCs has to be turned off, causing higher traffic losses. The “random on/off” has a lower power efficiency than the “traffic on/off” scheme as it has lower data rates, as a certain percentage of randomly chosen SCs has to be turned off, causing large traffic losses and minimizing the total network data rates. The “No SFR” scheme has the least power efficiency, as it has the least data rates and the highest power consumption.
Figure 14 shows the normalized traffic loss of the various schemes for different numbers of UEs. The normalized traffic loss of a scheme is the ratio between the traffic loss of this scheme and the traffic loss of the “random on/off” (40%) scheme, as it has the highest traffic loss. The traffic losses of the “traffic on/off” scheme is lower than that of the “random on/off” scheme, since the “traffic on/off” scheme considers the amount of traffic in the SCs, unlike the “random on/off” scheme which randomly selects the SCs to be turned off, resulting in higher traffic losses. Moreover, the traffic losses in both the “traffic” and the “random on/off” schemes increase as the percentage of turned off SCs increases (20% then 30% then 40%). The proposed scheme has very low traffic losses, even at a large number of users, since the SCs are turned off according to their traffic loads and their ICR values to make sure the users can still establish connections with their SCs. Furthermore, as the number of UEs in the SC increases, its ICR value decreases, so the proposed scheme only turns off a small number of SCs, leading to the least amount of traffic losses.
Figure 15 shows the number of switched off SCs of the various schemes for different numbers of UEs. In the proposed scheme, the number of SCs that are turned off decreases as the number of UEs increases, as the SCs are turned off according to their ICR values which decrease as the number of users in the SC increases. In the “traffic” and the “random on/off” schemes, a certain percentage of the SCs are switched off (20%, 30% and 40%), so the number of SCs that are switched off does not vary with the number of UEs.
Figure 16 shows the outage probability of the various schemes for different SINR thresholds at number of UEs = 900. The proposed scheme has the least outage probability, because of the improved SINR of the users, due to the decreased interference levels and the low traffic losses. This shows that the proposed scheme greatly considers the QoS of the users in the network. The “traffic on/ off” scheme has a higher outage probability than the proposed scheme, as it does not consider the interference caused by the SC, but only its traffic load, which increases the interference levels. The “random on/off” scheme has a higher outage probability than the “traffic on/off” scheme, due to the high traffic losses of this scheme and the random selection of the turned off SCs, which deteriorates the system performance. The “No SFR” scheme has the highest outage probability, due to the large interference levels, since it does not apply the SFR concept and it does not utilize any on/off switching techniques, degrading the overall performance of the system greatly.

5. Conclusions

In this paper, SFR with SC on/off switching is addressed where it is a promising approach for interference mitigation and power minimization for 5G HetNets. Thus, we propose a new SFR scheme that utilizes the ICR concept to switch off the SC. This scheme can be applied for circular and irregular center zone shapes. It is shown that the same performance is obtained by using either irregular or circular shape for the center zone. As a result, the circular center zone is proposed to be used due to its easy implementation. Furthermore, the optimum radius of the center zone which maximizes the total system data rate is attained, and it is found that the best percentage relative to the SC radius is 50%. Moreover, we demonstrate various SFR switching on/off schemes (proposed, random, traffic) for the circular cell shape. It is proven that the proposed scheme is able to reduce the interference levels, minimize the power consumption and diminish traffic losses. The results show that the proposed scheme outperforms the other switching on/off schemes in terms of the total system data rate, the normalized traffic losses, the power efficiency and the outage probability. More work can be carried out in the future to define the zones according to the spatial distribution of the UEs and power strength measurements, and to address the coverage holes problem in Voronoi cells.

Author Contributions

Conceptualization, M.O., B.A. and S.E.R.; methodology, M.O., B.A. and S.E.R.; software, M.O.; writing—original draft preparation, M.O.; writing—review and editing, B.A. and S.E.R.; All authors have read and agreed to the published version of the manuscript.

Funding

This research received no external funding.

Conflicts of Interest

The authors declare no conflict of interest.

References

  1. Fourati, H.; Maaloul, R.; Chaari, L. A survey of 5G network systems: Challenges and machine learning approaches. Int. J. Mach. Learn. Cybern 2021, 12, 385–431. [Google Scholar] [CrossRef]
  2. Ree, M.; Mantas, G.; Radwan, A.; Mumtaz, S.; Rodriguez, J.; Otung, I. Key management for beyond 5G mobile small cells: A survey. IEEE Access 2019, 7, 59200–59236. [Google Scholar] [CrossRef]
  3. Andrae, A.S.G.; Edler, T. On global electricity usage of communication technology: Trends to 2030. Challenges 2015, 6, 117–157. [Google Scholar] [CrossRef] [Green Version]
  4. Sheikhzadeh, S.; Javan, M.R. Key Technologies in 5G: Air Interface. Modares J. Elect. Eng. 2016, 16, 50–61. [Google Scholar]
  5. Wong, V.W.S.; Schober, R.; Ng, D.W.K.; Wang, L.C. Key Technologies for 5G Wireless Systems, 1st ed.; Cambridge University Press: Cambridge, UK, 2017. [Google Scholar]
  6. Bega, D.; Gramaglia, M.; Bernardos Cano, C.J.; Banchs, A.; CostaPerez, X. Toward the network of the future: From enabling technologies to 5G concepts. Trans. Emerging. Tel. Tech. 2017, 28, 3205–3216. [Google Scholar] [CrossRef] [Green Version]
  7. Al-Falahy, N.; Alani, O.Y. Technologies for 5G networks: Challenges and opportunities. IT Prof. 2017, 19, 12–20. [Google Scholar] [CrossRef] [Green Version]
  8. Kamel, M.; Hamouda, W.; Youssef, A. Ultra-dense networks: A survey. IEEE Commun. Surv. Tutor. 2016, 18, 2522–2545. [Google Scholar] [CrossRef]
  9. Yu, W.; Xu, H.; Zhang, H.; Griffith, D.; Golmie, N. Ultradense networks: Survey of state of the art and future directions. In Proceedings of the 25th International Conference on Computer Communication and Networks (ICCCN), Waikoloa, HI, USA, 1–4 August 2016; pp. 1–10. [Google Scholar]
  10. Usama, M.; Erol-Kantarci, M. A survey on recent trends and open issues in energy efficiency of 5G. Sensors 2019, 19, 3126. [Google Scholar] [CrossRef] [Green Version]
  11. Liu, C.; Natarajan, B.; Xia, H. Small cell base station sleep strategies for energy efficiency. IEEE Trans. Veh. Technol. 2016, 65, 1652–1661. [Google Scholar] [CrossRef]
  12. Celebi, H.; Güvenç, İ. Load analysis and sleep mode optimization for energy-efficient 5G small cell networks. In Proceedings of the IEEE International Conference on Communications Workshops (ICC Workshops), Paris, France, 21–25 May 2017; pp. 1–6. [Google Scholar]
  13. Zhang, Q.; Xu, X.; Zhang, J.; Tao, X.; Liu, C. Dynamic Load Adjustments for Small Cells in Heterogeneous Ultra-dense Networks. In Proceedings of the IEEE Wireless Communications and Networking Conference (WCNC), Seoul, Korea, 25–28 May 2020; pp. 1–6. [Google Scholar]
  14. Rehan, S.; Grace, D. Efficient Joint Operation of Advanced Radio Resource and Topology Management in Energy-Aware 5G Networks. In Proceedings of the 82nd IEEE Vehicular Technology Conference (VTC), Boston, MA, USA, 6–9 September 2015; pp. 1–2. [Google Scholar]
  15. Lin, Y.B.; Wang, L.C.; Lin, P. SES: A novel yet simple energy saving scheme for small cells. IEEE Trans. Veh. Technol. 2017, 66, 8347–8356. [Google Scholar] [CrossRef]
  16. Shen, B.; Lei, Z.; Huang, X.; Chen, Q. An interference contribution rate based small cells on/off switching algorithm for 5G dense heterogeneous networks. IEEE Access 2018, 6, 29757–29769. [Google Scholar] [CrossRef]
  17. Ebrahim, A.; Alsusa, E. Interference minimization through sleep mode based resource allocation for future femtocell networks. In Proceedings of the IEEE International Conference on Communications (ICC), London, UK, 8–12 June 2015; pp. 1679–1684. [Google Scholar]
  18. Bouras, C.; Diles, G. Energy efficiency in sleep mode for 5G femtocells. In Proceedings of the Wireless Days, Porto, Portugal, 29–31 March 2017; pp. 143–145. [Google Scholar]
  19. Ebrahim, A.; Alsusa, E. Interference and resource management through sleep mode selection in heterogeneous networks. IEEE Trans. Commun. 2017, 65, 257–269. [Google Scholar] [CrossRef]
  20. Saeed, A.; Katranaras, E.; Zoha, A.; Imran, A.; Imran, M.A.; Dianati, M. Energy efficient resource allocation for 5G heterogeneous networks. In Proceedings of the 20th IEEE International Workshop on Computer Aided Modelling and Design of Communication Links and Networks (CAMAD), Guildford, UK, 7–9 September 2015; pp. 119–123. [Google Scholar]
  21. Huo, L.; Jiang, D.; Lv, Z. Soft frequency reuse-based optimization algorithm for energy efficiency of multi-cell networks. Comput. Elect. Eng. 2018, 66, 316–331. [Google Scholar] [CrossRef]
  22. Malini, B.; Babu, K.V. Soft frequency reuse based interference minimization technique for long term evolution-advanced heterogeneous networks. In Proceedings of the International Conference on Communication and Signal Processing (ICCSP), Chennai, India, 6–8 April 2017; pp. 630–634. [Google Scholar]
  23. Hossain, M.S.; Tariq, F.; Safdar, G.A.; Mahmood, N.H.; Khandaker, M.R. Multi-layer soft frequency reuse scheme for 5G heterogeneous cellular networks. In Proceedings of the IEEE Globecom Workshops (GC Wkshps), Singapore, Singapore, 4–8 December 2017; pp. 1–6. [Google Scholar]
  24. Iskandar; Nuraini, H. Intercell interference coordination with soft frequency reuse method for LTE network. In Proceedings of the International Conference on Wireless and Telematics (ICWT), Yogyakarta, Indonesia, 1–2 August 2016; pp. 57–61. [Google Scholar]
  25. Hossain, M.S.; Tariq, F.; Safdar, G.A. Enhancing cell-edge performance using multi-layer soft frequency reuse scheme. Electron. Lett. 2015, 51, 1826–1828. [Google Scholar] [CrossRef]
  26. Attia, E.S.; El-Dolil, S.A.; Abd-Elnaby, M. Performance enhancement based resource allocation scheme using soft frequency reuse for LTE femtocell networks. In Proceedings of the 34th National Radio Science Conference (NRSC), Alexandria, Egypt, 13–16 March 2017; pp. 246–255. [Google Scholar]
  27. Yang, X. A multi-level soft frequency reuse technique for wireless communiation systems. IEEE Commun. Lett. 2014, 18, 1983–1986. [Google Scholar] [CrossRef]
  28. Syamkumar, M.; Barford, P.; Durairajan, R. Deployment characteristics of “The Edge” in mobile edge computing. In Proceedings of the Workshop on Mobile Edge Communications (MECOMM), Budapest, Hungary, 20 August 2018; pp. 43–49. [Google Scholar]
  29. Mendis, H.V.K.; Balapuwaduge, I.A.M.; Li, F.Y. Dependability-based reliability analysis in URC networks: Availability in the space domain. IEEE ACM Trans. Netw. 2019, 27, 1915–1930. [Google Scholar] [CrossRef]
  30. Mendis, H.V.K.; Li, F.Y. Achieving ultra reliable communication in 5G networks: A dependability perspective availability analysis in the space domain. IEEE Commun. Lett. 2017, 21, 2057–2060. [Google Scholar] [CrossRef]
  31. Maksymyuk, T.; Brych, M.; Pelishok, V. Stochastic geometry models for 5G heterogeneous mobile networks. Smart Comput. Rev. 2015, 18, 89–101. [Google Scholar] [CrossRef]
  32. Galinina, O.; Pyattaev, A.; Andreev, S.; Dohler, M.; Koucheryavy, Y. 5G Multi-RAT LTE-WiFi Ultra-Dense Small Cells: Performance Dynamics, Architecture, and Trends. IEEE J. Sel. Areas Commun. 2015, 33, 1224–1240. [Google Scholar] [CrossRef]
  33. Huang, X.; Zhang, D.; Tang, S.; Chen, Q.; Zhang, J. Fairness-based distributed resource allocation in two-tier heterogeneous networks. IEEE Access 2019, 7, 40000–40012. [Google Scholar] [CrossRef]
  34. NIU, C.; Li, Y.; Hu, R.Q.; Ye, F. Fast and Efficient Radio Resource Allocation in Dynamic Ultra-Dense Heterogeneous Networks. IEEE Access 2017, 5, 1911–1924. [Google Scholar] [CrossRef]
  35. ElSawy, H.; Hossain, E. On cognitive small cells in two-tier heterogeneous networks. In Proceedings of the 11th Intl. Symposium on Modeling and Optimization in Mobile, Ad Hoc, and Wireless Networks (WiOpt), Tsukuba, Japan, 13–17 May 2013; pp. 75–82. [Google Scholar]
  36. Shabbir, A.; Khan, H.R.; Ali, S.A. Traffic Load Aware Approach for Optimum Throughput in 5G Heterogeneous Cellular Networks. In Proceedings of the 4th International Conference on Computer and Information Sciences (ICCOINS), Kuala Lumpur, Malaysia, 13–14 August 2018; pp. 1–6. [Google Scholar]
  37. Su, G.; Chen, B.; Lin, X.; Wang, H.; Li, L. User Association and Base Station Sleep Management in Dense Heterogeneous Cellular Networks. KSII Trans. Int. Inf. Sys. 2017, 11, 2058–2074. [Google Scholar]
  38. Haroon, M.S.; Abbas, Z.H.; Abbas, G.; Muhammad, F. Analysis of interference mitigation in heterogeneous cellular networks using soft frequency reuse and load balancing. In Proceedings of the 28th International Telecommunation Networks Applications Conference (ITNAC), Sydney, Australia, 21–23 November 2018; pp. 1–6. [Google Scholar]
  39. Adejo, A.; Hussein, J.; Boussakta, S. Optimal transmit power configuration for soft frequency reuse in irregular cellular networks. In Proceedings of the Ninth International Conference on Ubiquitous and Future Networks (ICUFN), Milan, Italy, 4–7 July 2017; pp. 711–713. [Google Scholar]
  40. Giambene, G.; Le, V.A.; Bourgeau, T.; Chaouchi, H. Soft frequency reuse schemes for heterogeneous LTE systems. In Proceedings of the IEEE International Conference on Communications (ICC), London, UK, 8–12 June 2015; pp. 3161–3166. [Google Scholar]
  41. Huang, J.; Li, J.; Zhao, L.; Huang, S. CoSFR: Coordinated soft frequency reuse for OFDMA-based multi-cell networks with non-uniform user distribution. Wirel. Netw. 2017, 23, 2037–2050. [Google Scholar] [CrossRef]
  42. Ni, Y.; Liang, J.; Shi, X.; Ban, D. Research on Key Technology in 5G Mobile Communication Network. In Proceedings of the International Conference on Intelligent Transportation, Big Data & Smart City (ICITBS), Changsha, China, 12–13 January 2019; pp. 199–201. [Google Scholar]
  43. Huang, X.; Tang, S.; Zheng, Q.; Zhang, D.; Chen, Q. Dynamic femtocell gNB on/off strategies and seamless dual connectivity in 5G heterogeneous cellular networks. IEEE Access 2018, 6, 21359–21368. [Google Scholar] [CrossRef]
  44. Ghazzai, A.H.; Farooq, M.J.; Alsharoa, A.; Yaacoub, E.; Kadri, A.; Alouini, M.S. Green networking in cellular HetNets: A unified radio resource management framework with base station ON/OFF switching. IEEE Trans. Veh. Technol. 2016, 66, 5879–5893. [Google Scholar] [CrossRef] [Green Version]
  45. Winston, W.L. Simulation Modeling Using @ RISK, 4th ed.; Duxbury Press: Pacific Grove, CA, USA, 2000. [Google Scholar]
  46. Phaiwitthayaphorn, P.; Mori, K.; Kobayashi, H.; Boonsrimuang, P. Cell Throughput based Sleep Control Scheme for Heterogeneous Cellular Networks. ECTI Trans. Comp. Info. Tech. 2018, 12, 26–33. [Google Scholar]
Figure 1. HetNet system model showing the densely deployed SCs.
Electronics 10 01723 g001
Figure 2. A Soft Frequency Reuse (SFR) example for 4 regular-shape cells.
Electronics 10 01723 g002
Figure 3. (a) A real example showing a SC (the yellow cell) with its neighboring SCs and the center zone (the white zone) is allowed to use the bands utilized by the neighbors; (b) the 7 utilized sub-bands.
Electronics 10 01723 g003
Figure 4. Small Cells with irregular shape center zone similar to cell boundary.
Electronics 10 01723 g004
Figure 5. Small Cells with circular shape center zone.
Electronics 10 01723 g005
Figure 6. Irregular shape center zone vertex of the small cells.
Electronics 10 01723 g006
Figure 7. Circular shape center zone of the small cells.
Electronics 10 01723 g007
Figure 8. For the case of the circular center zone and the case of the center zone having the same irregular shape as the SC: (a) total data rate; (b) total power consumption.
Electronics 10 01723 g008
Figure 9. For the case of the circular center zone and the case of the center zone having the same irregular shape as the SC: (a) power efficiency; (b) outage probability.
Electronics 10 01723 g009
Figure 10. Total system data rate for different fractions of a center zone radius.
Electronics 10 01723 g010
Figure 11. Total system power consumption for different numbers of UEs.
Electronics 10 01723 g011
Figure 12. Total system data rate for different numbers of UEs.
Electronics 10 01723 g012
Figure 13. Power efficiency for different numbers of UEs.
Electronics 10 01723 g013
Figure 14. Normalized traffic loss for different numbers of UEs.
Electronics 10 01723 g014
Figure 15. Number of switched off SCs for different numbers of UEs.
Electronics 10 01723 g015
Figure 16. Outage probability for different SINR thresholds at number of UEs = 900.
Electronics 10 01723 g016
Table 1. List of symbols list with description.
SymbolDescription
B j Bandwidth dedicated to UE j
B R B Resource Block (RB) bandwidth
d m i n h Distance between the SC c and the nearest SC utilizing the sub-band h in its edge zone
E c Set of the utilized sub-bands in the edge zone of the neighboring SCs to the SC c
G c , j Channel gain between UE j and SC c
H c Set of the remaining sub-bands for the edge zone of the SC c
L c Total number of required RBs by the UEs in SC c
L j , c Number of RBs required by UE j to achieve its minimum data rate
L t h r Threshold load of the SCs
N c Number of UEs in SC c
N o Single-sided power spectral density of the noise
P c Transmission power of SC c
P c o f f Sleep mode power consumption of SC c
P c o n Baseline power consumption of SC c
P c t o t SC total power consumption
P c t x Transmission power consumption of SC c
P m a x Maximum transmission power of the SC
R c Data rate of SC c
R j , c Data rate of UE j in SC c
R j , c R B Data rate of UE j in SC c on one resource block
R j m i n Minimum data rate required by UE j
r r a d Ratio of the SC radius
R S R P c Maximum RSRP of SC c
R S R P t h r RSRP threshold of the SC
SSet of all the sub-bands
S c Sub-band chosen to be allocated to the edge zone of SC c
S I N R j , c Signal-to-interference noise ratio for UE j in SC c
U c Set of UEs in SC c
Y c Maximum number of RBs for SC c
ZSet of all SCs
Z o f f Set of SCs that should be switched off
Z o n Set of SCs that should be switched on
Z U D Set of undetermined SCs to be turned on/off
η BS power amplifier efficiency
χ c Interference Contribution Rate for SC c
α c Portion of power consumption due to the feeder losses and power amplifier for SC c
Table 2. Simulation Parameters.
ParametersValue
SC transmission powerSFR: 20 dBm (center),
22 dBm (edge)
No SFR: 22 dBm
Total bandwidth20 MHz
RB bandwidth180 KHz
Maximum number of RBs106
Number of SCs250
Number of UEs200–900
SC baseline power6.8 W
Noise power spectral density−174 dBm/Hz
SC inactive level (ϕ)0.63
BS power amplifier efficiency (η)0.2
Slope of load-dependent power consumption (σ)4
Path loss (dB) from SC to UE [46] P L = 140.7 + 36.7 log 10 ( d ) ,
where d is the distance in Km
Publisher’s Note: MDPI stays neutral with regard to jurisdictional claims in published maps and institutional affiliations.

