Castanea sativa Bur: An Undervalued By-Product but a Promising Cosmetic Ingredient


LAQV/REQUIMTE (Rede de Química e Tecnologia), Department of Chemical Sciences, Faculty of Pharmacy, University of Porto, Rua de Jorge Viterbo Ferreira, 228, 4050-313 Porto, Portugal
*
Author to whom correspondence should be addressed.
Cosmetics 2017, 4(4), 50; https://doi.org/10.3390/cosmetics4040050
Submission received: 25 October 2017
/
Revised: 17 November 2017
/
Accepted: 20 November 2017
/
Published: 24 November 2017
(This article belongs to the Special Issue Plant Extracts in Skin Care Products)
Abstract
:Castanea sativa fruit processing generates high amounts of by-products, mostly bur. Currently, the cosmetic industry has a great interest in natural extracts as antioxidant sources. In the present study, C. sativa bur extract was used as the active ingredient, in different amounts, in topical hydrogels. The formulations were characterized regarding total phenolic and flavonoid contents (TPC and TFC, respectively), antioxidant activity (DPPH radical scavenging capacity and ferric reducing antioxidant power (FRAP)) and technological and microbiological properties. The same parameters were evaluated after 30 days of storage at 4 °C (T30/4 °C) and 20 °C (T30/20 °C). At time 0 (T0), the TPC ranged between 0.79 and 9.65 mg of gallic acid equivalents (GAE)/g gel, while TFC varied from 0.05 to 1.23 mg of catechin equivalents (CAE)/g gel. Antioxidant activity was high for both assays, with values at T0 ranging between 98.41 and 1013.43 µmol of ferrous sulphate equivalents (FSE)/g gel and varying between 431.96 and 990.84 µg of Trolox equivalents (TE)/g gel for FRAP and DPPH assays, respectively. No formulation exceeded the defined criteria in microbiological counts. All formulations showed similar technological profiles but particular attention should be given to pH. The gel with 50% of extract (F3) was selected as the best one for potential cosmetic applications.
1. Introduction
Castanea sativa Mill., also known as “sweet chestnut”, is a species of the Fagaceae family common to south Europe and Asia (mainly in China). Chestnut is comprised of fruit, integument (inner shell), pericarp (outer shell) and bur. The high economic value of chestnut is due to their nutritional composition being largely appreciated in Mediterranean countries [1,2]. High amounts of by-products are generated by chestnut processing chains, mainly shell and bur. The waste residues obtained from food, forest or agricultural industries are nowadays considered attractive, since they are inexpensive and their re-use provides huge environmental benefits.
Recently, some studies have reported the potentialities of C. sativa by-products, such as leaf, shell and bur, disclosing its richness in antioxidant constituents. The content of phenolic compounds and the antioxidant activity are associated with beneficial health effects such as anticarcinogenic, anti-inflammatory, cardioprotective and neuroprotective activities [1,3,4,5,6,7,8,9]. Phenolic acids (ellagic and gallic acid), flavonoids (rutin, quercetin and apigenin) and tannins were the main phenolic compounds reported [5,10]. Nevertheless, C. sativa bur had no described application and usually remains in the woodland after fruit harvesting, promoting the insect larvae proliferation [5]. The valorisation of this waste represents a new challenge for the chestnut chain in order to encourage the research of novel applications, focusing on sustainable approaches and obtaining new valuable products [2,11]. Taking into consideration the potentialities shown by the bur, it is expected that this by-product, after specific pre-treatments, could be a source of added value natural compounds with high interest to pharmaceutical, food and cosmetic industries [3,5,12].
Regarding the studies about the applicability of these by-products, chestnut leaf has been used for the prevention of diabetes and DNA injuries [13], antibacterial activity [14] and protection from skin-oxidative stress [9,15]. The shell could be used as a heavy metal adsorbent [16] and phenol substitute in adhesive formulations [17]. However, to the best of our knowledge, no reports on the use of this by-product for cosmetic formulations are available.
One of the major targets for oxidative stress is skin, since this organ is permanently exposed to external aggressions such as ultraviolet radiation (UV) and atmospheric pollution. Indeed, skin diseases, such as psoriasis, atopic dermatitis and cancer have been related with cutaneous oxidative stress, photoaging and photocarcinogenesis [18,19,20]. Direct evidences that UV radiation contributes to the production of reactive species in skin have been reported [21], justifying the use of antioxidants in skin-care products. Besides that, in recent years, consumers have shown a clear preference for natural products, particularly natural antioxidants. Thus, agro-industrial by-products, described as good sources of phenolic compounds, have been exploited to find new natural antioxidants with the purpose to replace synthetics one, which have been associated with more toxic side effects [4,22]. The abundance of phenolic compounds is generally related to a high antioxidant activity, providing in vivo protection against free radical damage and decreasing the risk of oxidative stress-related diseases such as degenerative diseases [23]. Oxidative stress occurs when there is an overproduction of reactive oxygen species (ROS), reactive nitrogen species (RNS) and reactive sulphur species (RSS) that interact and injure the structure and function of proteins, DNA and RNA molecules, lipids and sugars [24,25]. In particular, phenolic acids are mostly responsible for the prevention of oxidative processes [26], while flavonoids are able to activate antioxidant enzymes [27]. Likewise, C. sativa kernels have high amounts of phenols in their composition, particularly gallic acid and ellagic acid [28].
The aim of this study was to formulate hydrogels with C. sativa hydroalcoholic extracts in different concentrations (F2, F3 and F4) and to compare their behaviour with a formulation without extract (F1). The bioactive compounds were quantified by the determination of total phenolic content (TPC) and total flavonoids content (TFC) while the antioxidant activity was evaluated by DPPH radical-scavenging ability and ferric reducing antioxidant power (FRAP) assays. Also, all formulations were characterized regarding microbiological quality and technological properties (namely, colour, pH, moisture, rheology and texture).
2. Materials and Methods
2.1. Chemicals and Reagents
1,1-diphenyl-2-picrylhydrazyl free radical, catechin, Folin–Ciocalteu’s reagent, gallic acid, 6-hydroxy-2,5,7,8-tetramethylchroman-2-carboxylic acid (Trolox, a water-soluble derivative of vitamin E), 2,4,6-Tris(2-pyridyl)-s-triazine (TPTZ), ferrous sulphate heptahydrate and ferric chloride hexahydrate were all purchased from Sigma-Aldrich (Steinheim, Germany). Absolute ethanol, dimethylsulfoxide, sodium acetate, sodium carbonate decahydrate, sodium nitrite, aluminium chloride and sodium hydroxide were purchased from Merck (Darmstadt, Germany). All chemicals and solvents were of analytical grade. Aqueous solutions were prepared with deionized water from a Mili-Q water purification system (TGI Pure Water Systems, St Lincoln, NE, USA). Glycerine was obtained from Fluka (Steinheim, Germany). Carbopol® 940, polysorbate 80 and triethanolamine were purchased from Vaz Pereira (Lisbon, Portugal). Buffered peptone water, Tryptic Soy Agar medium, Nutrient Agar medium and Sabouraud Dextrose Agar medium were obtained from Oxoid Ltd. (Hampshire, UK).
2.2. Plant Materials
C. sativa burs were randomly collected in Trás-os-Montes, a north region of Portugal, after harvesting the chestnut. Bur was milled to a particle size of about 0.1 mm using an A11 basic analysis mill (IKAWearke, Staufen, Germany) and the fine powdered bur was stored in plastic tubes at 4 °C until the preparation of the extracts.
2.3. Preparation of C. sativa Bur Hydro-Alcoholic Extracts
One gram of powdered samples was submitted to solvent extraction by maceration at 40 °C for 30 min with 20 mL of ethanol: water (1:1 v/v). Hydro-alcoholic extracts were filtered through Whatman No. 1 filter paper and collected. Extracts were stored under refrigeration (4 °C) until use [3].
2.4. Preparation of Hydrogels Containing C. sativa Bur Hydro-Alcoholic Extracts
The first step was to dissolve glycerine and preservative in water, at room temperature. Glycerine provides emollient and moisturizing properties to the gel. Afterwards, C. sativa bur hydro-alcoholic extract was also dissolved in the previous mixture. Then, Carbopol® 940, acting as thickening and gelling agent, was slowly dispersed under magnetic stirring (750 rpm) at 40 °C during 1 h. After the formulation had cooled down, the mixture was homogenised and the triethanolamine added dropwise to complete the gelation process. The composition of hydrogel is detailed in Table 1.
The homogeneous appearance is conferred by slow shaking, avoiding air incorporation. The gels were packed in polyethylene jars and rested 24 h before any measurement. Three formulations with different concentrations of bur hydro-alcoholic extract (F2, F3 and F4) were prepared. Simultaneously, a hydrogel without extract (F1) was also prepared. This procedure was done twice to prepare two sets of formulations: one set was kept at 4 °C and the other at 20 °C. Each formulation was prepared in triplicate.
2.5. Technological Characterization of Hydrogels
2.5.1. Colour Evaluation
Colour was evaluated using a colorimeter (Chroma Meter CR-410, Konica Minolta, Tokyo, Japan) previously calibrated with a white reference background. An aliquot of each gel was placed on a Petri plate with 5.5 cm diameter and a sample thickness of 5 mm. The results were expressed according to the colour space CIE 1976 L* a* b*, defined by the Comission Internationale de l’Éclairage (CIE). The three coordinates represent the lightness of the colour (L*), its position between red and green (a*) and its position between yellow and blue (b*). For each sample, the results were expressed as the average of the three measurements of all parameters evaluated.
2.5.2. Determination of pH
pH was determined using a pHmeter (Basic 20+, Crison, Barcelona, Spain) equipped with a glass electrode previously calibrated. The measurements were performed in triplicate for each sample.
2.5.3. Determination of Moisture
The moisture content was determined using a moisture analyser (Scaltec model SMO01, Scaltec Instruments, Göttinge, Germany). About 1 g of gel was subjected to a drying process at 100 ± 2 °C for 5 min. This procedure was performed in triplicate and expressed as percentage.
2.5.4. Texture Analysis
Texture analysis was carried out under compression in a texturometer (Stable Micro Systems TA-XT2i, Godalming, UK) by performing a spreadability test at 20 °C using a penetration test probe of 23 mm. The probe applied a force of 0.049 N with a penetration depth of 3 mm and speed of 3 mm/s. The female cone loaded the gels samples, while the corresponding male cone came down towards the sample, forcing it upwards and outwards at 45°. Data were collected using the Exponent Stable Micro Systems software® (Stable Micro Systems Ltd, Godalming, UK).
2.5.5. Rheological Behaviour Analysis
Rheological analysis was carried out on a rotary viscometer (Brookfield Digital Model DV-E, Cologne, Germany). This procedure consists in the determination of the force exerted on a body fixed in rotation on a liquid at a constant speed of rotation. Flow measurements were performed at 20 ± 0.5 °C in the shear rate range from 0.1 to 500 s−1, with 60 s delay period between measurements, and the speeds range evaluated was fixed between 5 and 50 rpm. Until performing the determinations, gels were kept resting for 30 min. The results were represented in a graph which relates the apparent viscosity, expressed as mPa·s, and the shear rate, expressed as rpm, for each gel analysed at different times and temperatures.
2.6. Determination of Hydrogels Bioactive Compounds
2.6.1. Total Phenolic Content
Total phenolic content (TPC) was spectrophotometrically determined according to the Folin–Ciocalteu procedure [29] with minor modifications. This methodology was directly performed in a 96 wells microplate based on a complex redox reaction between the phenolic compounds and the phosphotungstic and phosphomolybdic acids present in the Folin–Ciocalteu’s reagent. All gel samples (100 mg) were previously diluted in 1 mL of dimethylsulfoxide (DMSO): ethanol (1:1 v/v). Briefly, the reaction mixture in each well consisted of 30 µL of diluted gel sample (100 mg/mL), 150 µL of Folin–Ciocalteu’s reagent (10× dilution) and 120 µL of Na2CO3 7.5% (w/v) solution. The microplate was incubated at 45 °C for 15 min in a Synergy HT Microplate Reader (BioTek Instruments, Inc., Winooski, VT, USA) and after left to stand in the dark for 30 min, at room temperature. The absorbance was read at 765 nm using the microplate reader described above. A calibration curve with gallic acid was used as reference (linearity range = 20–1000 µg/mL, R2 > 0.993) to obtain a correlation between absorbance and standard concentration. The results were expressed as mg of gallic acid equivalents (GAE) per gram of gel (mg GAE/g gel). The assay was carried out in triplicate.
2.6.2. Total Flavonoid Content
Total flavonoid content (TFC) was performed by a colorimetric method based on the formation of flavonoid–aluminium compounds, according to the method described by Costa et al. [30], with minor modifications. This assay was directly carried out in a 96-well microplate. Gel samples (100 mg) were previously diluted in 1 mL of DMSO: ethanol (1:1 v/v). Briefly, in each well, 30 µL of diluted gel sample (100 mg/mL) was mixed with 75 µL of ultrapure water and 45 µL of NaNO2 1% (w/v) solution. After 5 min, 45 µL of AlCl3 5% (w/v) solution was added. Then, 1 min later, 60 µL of NaOH 1 mol/L and 45 µL of ultrapure water were also added. The absorbance was read at 510 nm using a Synergy HT Microplate Reader (BioTek Instruments, Inc., Winooski, VT, USA). In order to obtain a correlation between standard concentration and absorbance, a calibration curve was prepared with catechin (linearity range = 2.5–500 µg/mL, R2 > 0.996). The results were expressed as mg of catechin equivalents (CAE) per gram of gel (mg CAE/g gel). This parameter was evaluated in triplicate.
2.7. In Vitro Antioxidant Activity of Hydrogels
Regarding the antioxidant activity, gels were evaluated by DPPH radical scavenging activity and ferric reducing antioxidant power (FRAP), as described in the following points.
2.7.1. DPPH Free Radical Scavenging Assay
The methodology principle is based on the evaluation of the antiradical activity of extracts by reduction of DPPH● to hydrazine. DPPH is a stable free radical with a maximum absorption between 515 and 517 nm. All gel samples (100 mg) were previously diluted in 1 mL of DMSO:ethanol (1:1 v/v). The reaction mixture was directly made in a 96-well microplate. 30 µL of diluted gel sample (100 mg/mL) and 270 µL of ethanol solution containing DPPH radicals in a final concentration of 6 × 10⁵ M were put in each well. The microplate was left to stand at room temperature for 40 min, in the dark. Afterwards, the absorbance was measured at 517 nm using a Synergy HT Microplate Reader (BioTek Instruments, Inc., Winooski, VT, USA) to determine the DPPH radical reduction [31] in which the low absorbance values correspond to high free radical scavenging activity. A standard curve was plot with Trolox, used as reference (linearity range: 2.5–125 µg/mL, R2 > 0.970). The antioxidant potential based on the DPPH free radical scavenging ability of gels samples was expressed as µg of Trolox equivalents (TE) per gram of gel (µg TE/g gel) of at least three determinations.
2.7.2. Ferric Reducing Antioxidant Power Assay
According to the procedure described by Benzie et al. [32] with minor modifications, the ferric reducing antioxidant power (FRAP) assay measures the reduction of a ferric 2,4,6-tripyridyl-s-triazine complex (Fe3+-TPTZ) to the ferrous form (Fe2+-TPTZ) in the presence of antioxidants. The chemical reaction involves a single electron reaction between Fe(TPTZ)2 (III) and an electron donor ArOH (chemical structure presents in phenolic compounds). FRAP was directly performed in a 96-well microplate. About 100 mg of each gel sample was diluted in 1 mL of DMSO:ethanol (1:1 v/v). Briefly, the reaction mixture in each well consisted of 35 µL of diluted gel sample (100 mg/mL) and 265 µL of FRAP reagent (composed by 10 parts of 300 mM sodium acetate buffer at pH 3.6, 1 part of 10 mM TPTZ solution and 1 part of 20 mM FeCl3·6H2O solution). The microplate was incubated at 37 °C for 30 min. Then, the increase of absorbance was measured at 595 nm using a Synergy HT Microplate Reader (BioTek Instruments, Inc., Winooski, VT, USA). A calibration curve was prepared with ferrous sulphate (FeSO4·7H2O) as standard (linearity range: 25–500 µM, R2 > 0.985). The results were expressed as µmol of ferrous sulphate equivalents (FSE) per gram of gel (µmol FSE/g gel). This methodology was performed in triplicate.
2.8. Microbiological Properties
All formulations were evaluated regarding their total aerobic bacteria, mesophilic aerobic bacteria, and yeast and mould contents. Firstly, dilutions of each gel sample with buffered peptone sterile solution were prepared. 3% w/v of polysorbate 80 was added to neutralize the preservative function. After that, the mixture was homogenised and spread on the suitable medium. Total aerobic bacteria count was carried out after 5 days of incubation at 30–35 °C using tryptic soy agar medium, while mesophilic aerobic bacteria used nutrient agar medium, after incubation at 32.5 °C. For the yeast and molds count, Sabouraud dextrose agar medium was used and the plates incubated at 22.5 °C for 5 days. The results were expressed as number of colony-forming units per mL of gel dilution (CFU/mL). Each assay was performed in triplicate.
2.9. Stability Study
All formulations were evaluated at different storage times (T0 and after 30 days (T30)) and different temperatures (4 and 20 °C), according to the protocols described previously.
2.10. Statistical Analysis
Data were reported as mean ± standard deviation of at least triplicate experiments. Statistical analysis of the results was performed with SPSS 22.0 (SPSS Inc., Chicago, IL, USA). One-way ANOVA was used to investigate the differences between samples for all assays. Post hoc comparisons of the means were performed according to Tukey’s HSD test. In all cases, p < 0.05 was accepted as denoting significance.
3. Results and Discussion
3.1. Technological Characterization of Hydrogels
3.1.1. Colour Evaluation
Colour evaluation is a complementary methodology used to assess the acceptance of the product by consumers. The results of colour evaluation are summarized in Table 2.
Regarding L*, all gels had a considerable high lightness at T0 (10.69–11.25). In what concerns a*, gels with 25% (F2) and 50% of extract (F3) exhibited positive values at T0 (2.70 and 0.43, respectively) associated to the redness, while the gels without extract (F1) and with the highest extract amount (F4) showed a prevalence of greenness associated to the negative results (−0.64 and −0.28, respectively). Relatively to b*, at T0, all formulations presented positive values associated to the prevalence of yellowness, being the highest results obtained in F2 and the lowest in F4 (6.39 and 1.69, respectively). F4 showed the highest lightness and the lowest prevalence of yellowness, being in agreement with the dark colour detected by the eye.
3.1.2. Determination of pH
Skin-care formulations must present a pH compatible with skin (between 5 and 6) [33]. The results at T0 are present in Table 2. The highest pH values were obtained for gels with the highest extract percentage. Therefore, the addition of bur hydro-alcoholic extract gives a basic pH to the formulations. F4 revealed the highest pH, with values greater than 8, which is incompatible with skin application. On the contrary, F1 had the lowest pH with a value minor than 5, which is also unsuitable to scattering on the skin. Due to the skin compatibility issue, F2 and F3 were selected as the best ones, with pH values of 5.27 and 5.67, respectively, which are more suitable for cutaneous application.
3.1.3. Determination of Moisture
Some constituents of cosmetic preparations, such as water, usually provide an appropriate medium for microbial growth and could stimulate physical and chemical changes in skin-care products. The moisture results (Table 2) show that at T0, F1 has the highest moisture content (30.69%) while F3 and F4 displayed the lowest values (15.43% and 14.04%, respectively). The increase of the concentration of C. sativa bur extract could decrease the possibility of microbial growth and physical and chemical modifications due to the reduction of moisture content.
3.1.4. Texture Analysis
An appropriate texture is one of the principal properties that cosmetics should present to improve consumer acceptance. This methodology evaluates firmness and adhesiveness (Table 2). According to the results, it is possible to conclude that adhesiveness increases with the presence of bur extract. At T0, F1 showed the lowest adhesiveness with −1.480 N·mm, while the highest result was obtained for F4 (−0.707 N·mm). In opposite to adhesiveness, the increase of extract concentration in gels affords the decrease of firmness. At T0, F1 presented the highest firmness (0.554 N), while F4 had the lowest (0.288 N).
3.1.5. Rheological Behaviour Analysis
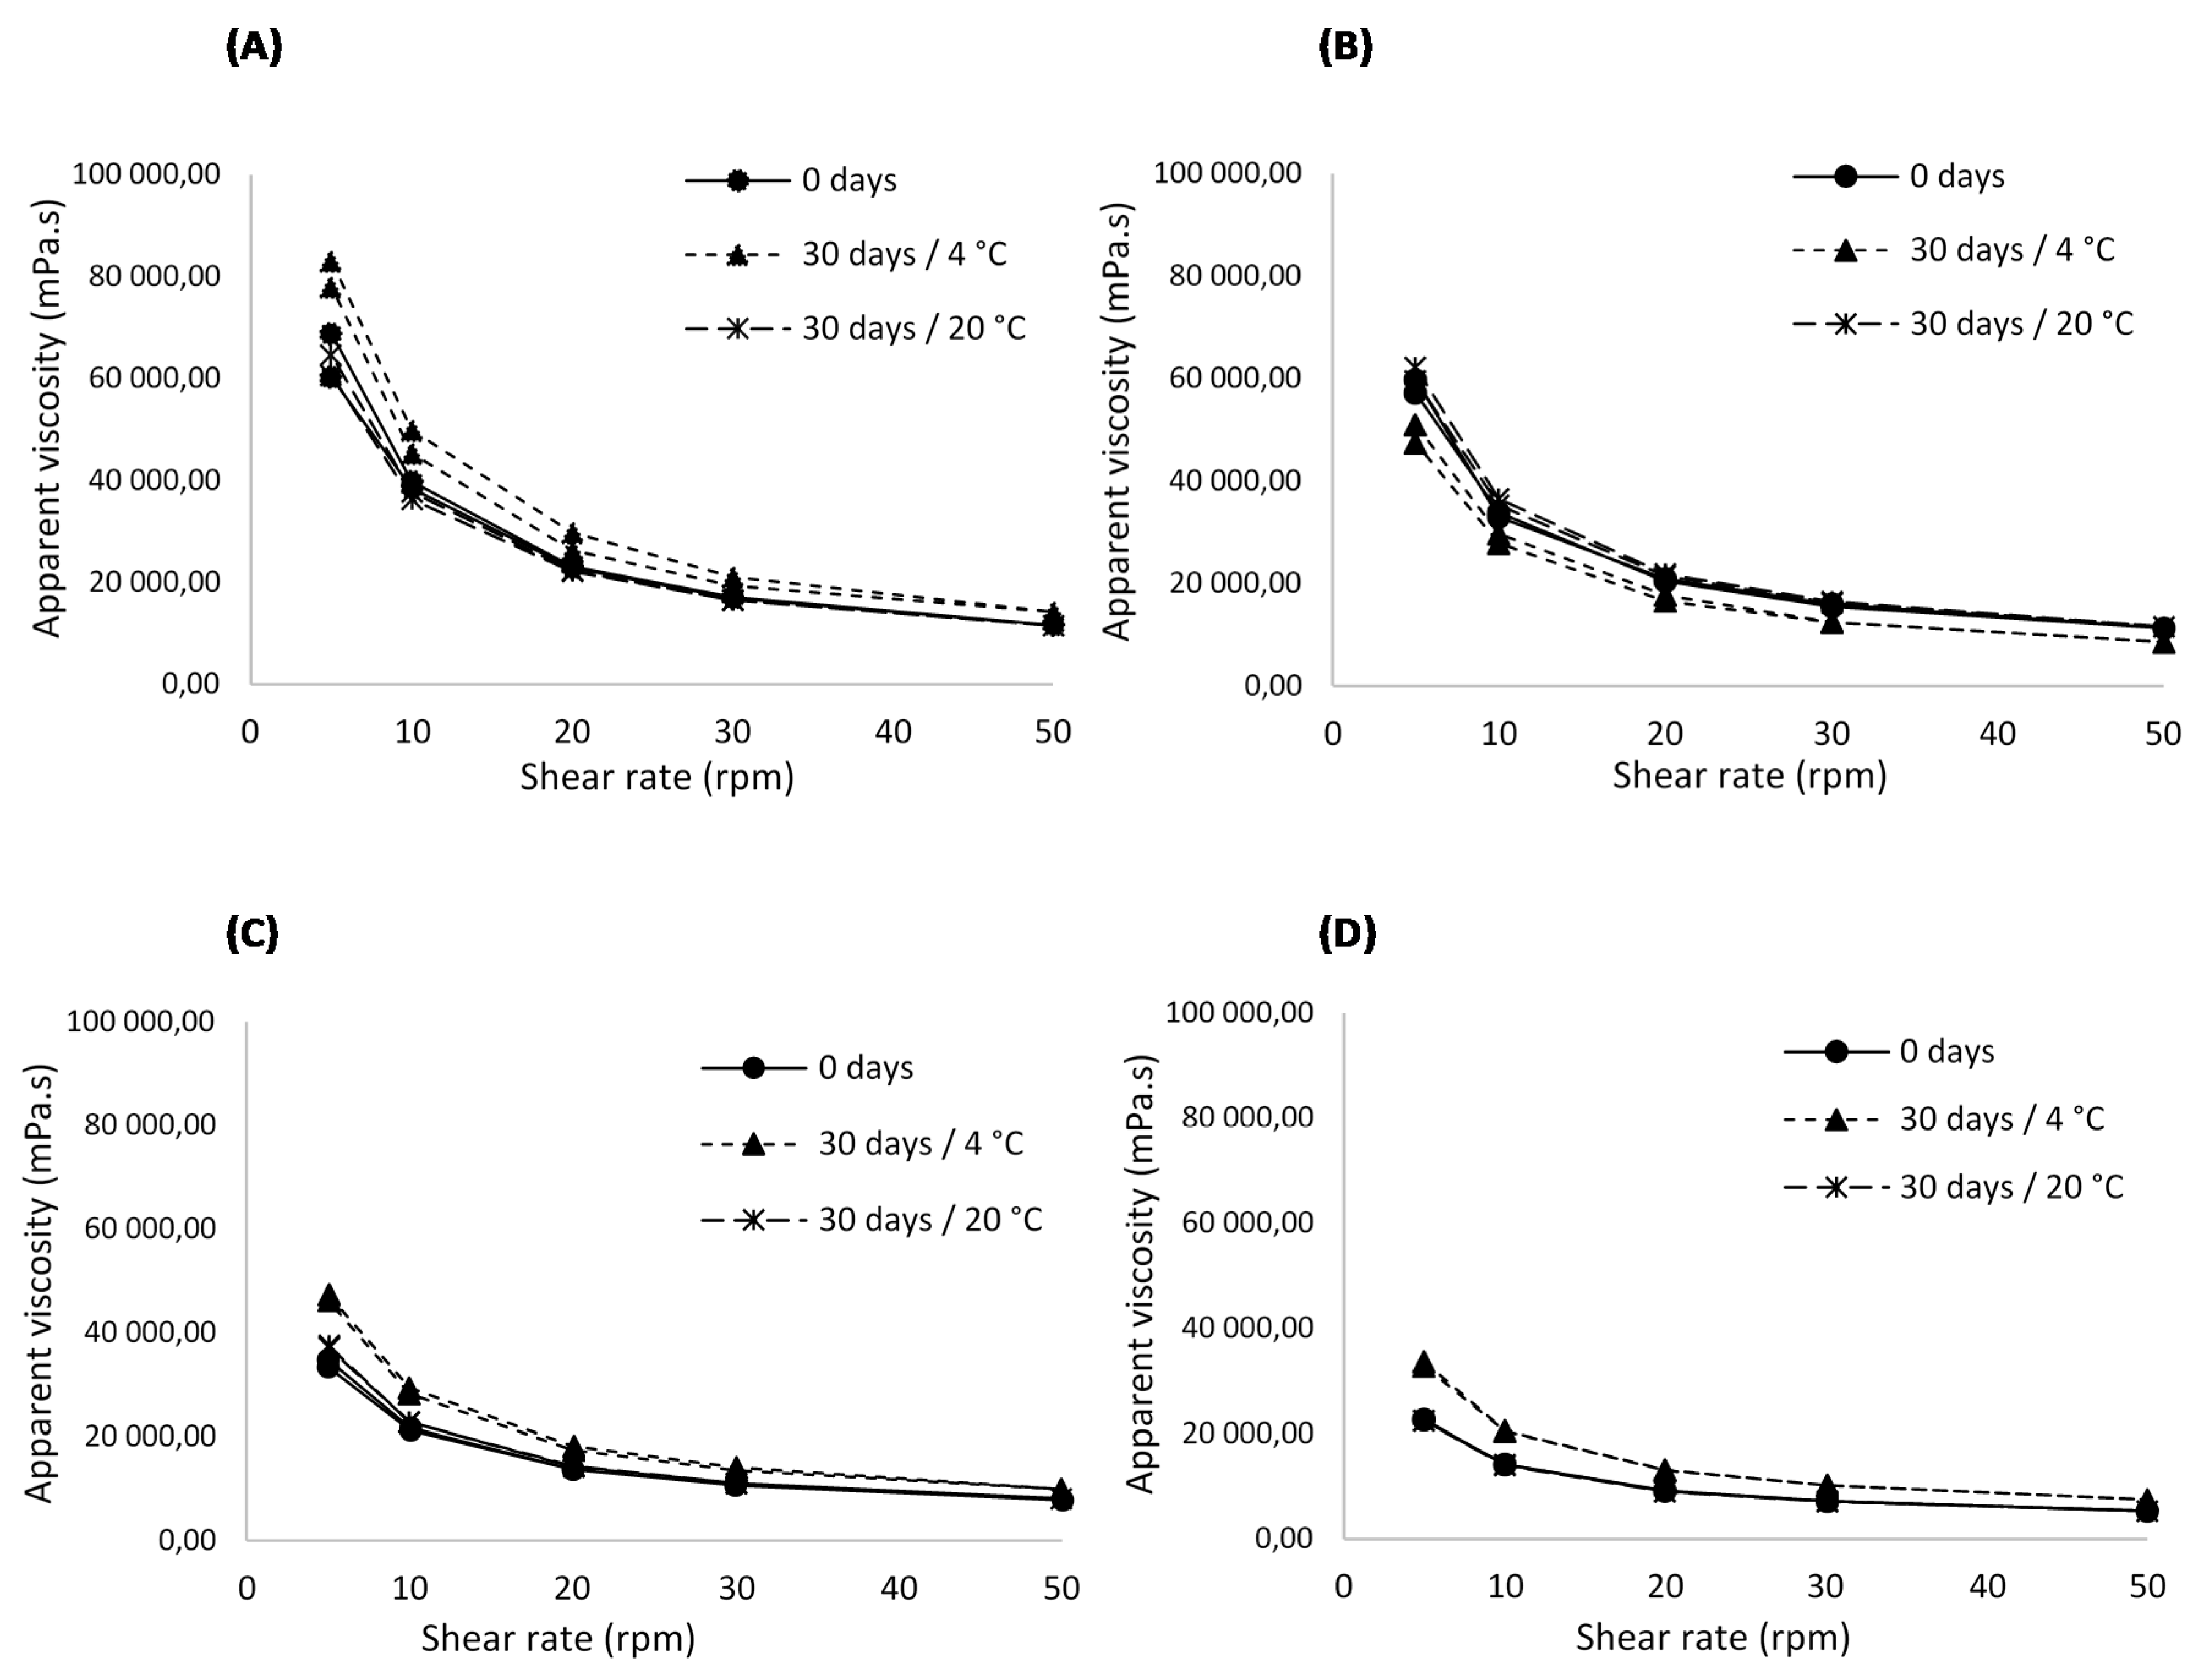
Figure 1 represents the apparent viscosity with the shear rate in formulations at described conditions.
In what concerns the apparent viscosity, F1 showed the highest viscosity values while F4 showed the lowest ones. Therefore, apparent viscosity decreases with increasing bur extract percentages in hydrogels. All formulations presented a rheofluidificant behaviour since apparent viscosity decreased with the increasing of shear rate (Figure 1). This rheological behaviour is characteristic of water in oil emulsions, and is similar to gels prepared with acrylic polymers [34]. A high viscosity of the semisolid formulation could have a positive influence on the stability of extract once it decreases the diffusion rate of oxygen [35].
3.2. Bioactive Compounds in Hydrogels
3.2.1. Total Phenolic Content
The Folin–Ciocalteu’s phenol reagent is frequently used to estimate the amount of phenolic compounds in herbal extracts. This is a non-specific assay once the phenol reagent could react not only with phenolic compounds but also with other substances (interfering substances) such as ascorbic acid, aromatic amines, sugars and sulphur dioxide [4]. Results of this parameter are displayed in Table 3.
The gels TPC at T0 ranged from 0.79 (F1) to 9.65 mg (F4) of GAE/g of gel. As expected, the amount of phenolic compounds strongly increases with the concentration of chestnut bur extract. For this reason, gels with higher percentages of bur extract that showed greater TPC values should also present higher antioxidant activity. The incorporation of chestnut bur in a dermatological basis still presents high TPC, in the same range of some plant by-products, highlighting its potential source of polyphenols [7,8,23].
3.2.2. Total Flavonoid Content
Flavonoids represent a group from phenolic compounds broadly spread in a wide variety of plants. As a group belonging to phenolic compounds, flavonoids are also described as contributors to the antioxidant activity (Table 3). Gels at T0 showed a TFC ranging from 0.05 to 1.23 mg CAE/g of gel. Similar to TPC, F4 presented the highest TFC while F1 has the lowest value.
3.3. In Vitro Antioxidant Activity of Hydrogels
3.3.1. DPPH Free Radical Scavenging Assay
DPPH scavenging capacity is a method widely used to determine antioxidant activity in plant and fruit extracts [36]. The methodology principle is based on the reduction of DPPH radicals in ethanol providing a decrease in absorbance at 517 nm. It was decided to express the results as µg of TE per g of gel as it is more meaningful and provides a better interpretation than the results expressed as inhibition percentages, since the decrease in absorbance is not enough to achieve 50% of inhibition. The results (Table 3) show that, at T0, the antioxidant capacity values range from 431.96 to 990.84 µg of TE/g of gel. The increasing order of antioxidant power for gels was: F1 < F2 < F3 < F4. As expected, the antioxidant activity based on DPPH radical scavenging ability increases with the extract concentration added to the formulation. According to Pinto et al., a concentration range between 38.67 and 76.86 µg/mL of C. sativa bur extract is responsible for at least 50% of inhibition, since the results were expressed as EC50. Besides the bur extract, the formulation contains other compounds that could explain the lower antioxidant activity when compared with C. sativa bur extract [3].
3.3.2. Ferric Reducing Antioxidant Power Assay
Antioxidant activity evaluated through FRAP assays determines the ability of plant extracts to reduce ferric ions. Table 3 shows the antioxidant capacity averages obtained for each formulation. Similar to DPPH assays, the increasing order of antioxidant activity was: F1 < F2 < F3 < F4. As expected, at T0, F4 showed the highest antioxidant activity by ferric reduction (1013.43 µmol of FSE/g gel), while F1 had the lowest reduction power (98.41 µmol of FSE/g gel). Compared to the C. sativa bur, the antioxidant power of hydrogels was slightly lower [3].
3.4. Correlation between Total Phenolic Content and Antioxidant Activity
As referred antioxidant activity has been evaluated based on DPPH and FRAP assays. The possible correlation between these results and the TPC was evaluated through Pearson correlation. This correlation coefficient measures the degree of linear correlation between two quantitative variables. When a correlation analysis was performed between TPC and FRAP or DPPH assays, a strong positive correlation was observed for FRAP (R2 = 0.9360) and DPPH (R2 = 0.9233), inferring a possible responsibility of TPC for the antioxidant activity observed. Nevertheless, these results could be influenced by synergic effects of the gels constituents or other chemical classes.
3.5. Correlation between Total Flavonoid Content and Antioxidant Activity
When a correlation analysis by Pearson coefficient was performed between TFC and FRAP or DPPH assays, an extremely positive correlation was also observed for both methods with values of R2 = 0.9572 and R2 = 0.9320, respectively. Further studies, such as HPLC-MS, would be helpful to identify the flavonoid compounds that contribute to this correlation.
3.6. Correlation between Total Phenolic and Total Flavonoid Contents
Analysing the correlation through the Pearson coefficient, an extremely positive correlation (R2 = 0.9848) was established between TPC and TFC.
3.7. Microbiological Properties
The microbiological results are summarized in Table 4, being expressed as colony forming units per mL of gel (CFU/mL). Concerning the three groups of microorganisms analysed, all formulations presented values lower than the limits defined by ISO standard 11930:2012 (the number of colony building units (CFU) on solid culture media should be inferior to 1000 CFU/mL), demonstrating the preservative efficacy at the storage conditions used [37].
3.8. Stability Study
As previously mentioned, all technological parameters were evaluated after 30 days of storage at 4 °C and 20 °C. In what concerns to L* (lightness), the results for each formulation were statistically different (p < 0.05) at T0, T30/4 °C and T30/20 °C, except in F3. All gels presented high lightness values. Regarding a* coordinates, F2 and F3 at T30/4 °C and T30/20 °C maintained the prevalence of redness, while F1 and F4 still presented greenness as prevalent. This parameter did not seem to be related to the storage time and temperatures since there are no significant differences (p > 0.05), except for F4 that displayed a significant decrease in gels at T30/20 °C (p < 0.05). Relative to b* parameter, similar to T0, all gels at T30/4 °C and T30/20 °C also presented a prevalence of yellowness. The b* results for each formulation at different storage conditions were significantly different (p < 0.05).
The pH analysis after 30 days of storage at both conditions revealed similar results to the gels at T0. The pH of F4 and F1 were also not compatible with skin application. The pH values of F1 were not statistically different (p > 0.05) at T0 and after 30 days.
Considering the moisture content, gels analysed at different times and temperatures showed a decrease of moisture with the increase of bur extract concentration in hydrogels. All formulations at T0 and after 30 days did not show significant differences (p > 0.05) in moisture percentages. For this reason, storage time and temperatures did not affect the moisture contents, emphasizing the gel stability.
Similar to T0, at T30/4 °C and T30/20 °C, adhesiveness increases and firmness decreases with the extract concentration in hydrogels. Until F3, the adhesiveness was lower at T30/4 °C and higher at T30/20 °C, except for F4 which had a higher adhesiveness at T30/4 °C and lower at T0. In what concerns adhesiveness, the results for each formulation were not statistically different (p > 0.05) at T0, T30/4 °C and T30/20 °C, except for F3 at T30/4 °C (p < 0.05). In general, the adhesiveness of C. sativa bur hydrogels is not dependent on temperature and time. On the other hand, gel firmness also decreases with the extract after 30 days of storage at 4 °C and 20 °C. Nevertheless, gels up to 50% of extract at T30/4 °C had the highest firmness, while the results at T30/20 °C were the lowest ones.
A decrease in apparent viscosity in gels with higher bur extract concentrations was also found after 30 days of storage at different temperatures. At T30/4 °C, F2 presented a viscosity lower than at T0 and T30/20 °C. However, for the other formulations, a higher viscosity was found at T30/4 °C while the results at T0 and T30/20 °C were similar.
In what concerns TPC of gels, at T30/4 °C and T30/20 °C the highest contents were also displayed for F4. These formulations experienced significant changes in TPC with the highest contents obtained for gels at T0. Indeed, the TPC of gels with extract declined after 30 days of storage, with the highest decrease at 20 °C. The results for F1 at T0 and T30/4 °C were not significantly different (p > 0.05), while all other formulations containing bur extract presented statistically different results (p < 0.05). Therefore, gel TPC was affected by storage time and temperature.
Relative to TFC, after storage time at different temperatures, F4 revealed the highest contents. Particularly, all gels with extract analysed at T0 contained the highest amounts of flavonoids. After 30 days of storage, the TFC decreased in all formulations, with the highest decline determined in gels at T30/20 °C. Results relating to F1 were not statistically different (p > 0.05). Besides the formulations with bur extract added had results significantly different (p < 0.05) at distinctive storage conditions. Thus, the time and temperature contributed to the TFC reduction on chestnut bur hydrogels.
Regarding the DPPH assay, all gels at T0 showed the highest antioxidant activity, while the lowest was displayed at T30/20 °C. Similar to the previous assays, gels with higher extract concentrations also presented the highest antioxidant activity based on DPPH radical scavenging capacity. The highest DPPH scavenging ability obtained at T0 displayed significant differences (p < 0.05) for F1 and F4, whose antioxidant activity also presented a significant decrease (p < 0.05) at T30/4 °C and T30/20 °C. F2 and F3 showed a statistically significant decrease (p < 0.05) at T30/20 °C.
Antioxidant activity evaluated through FRAP assays in gels analysed at T30/4 °C and T30/20 °C showed the highest ferric reduction power for F4, while F1 had the lowest results. At T30/20 °C, the ferric reducing ability underwent the highest reduction in all formulations, presenting significant differences (p < 0.05) for F1, F2 and F4. In this case, time and temperature provided a decrease of antioxidant capacity. Significant differences (p < 0.05) for F3 were observed between T0 and T30/4 °C.
Microbiological analysis revealed similar results in all formulations along the storage time, evidencing microbiological stability. All gels after 30 days of storage presented results within the permissible limits and similar to gels at T0. Furthermore, the storage temperatures did not seem to influence microbial growth since the counts at 4 and 20 °C are similar.
The incorporation of antioxidants extracted from plants in hydrogels represents a huge challenge since these compounds have been described as unstable in aqueous phases. There are many studies in this field reporting the physical instability of formulations with antioxidants added or the loss of extracts activity after incorporation in a cosmetic base [38,39]. In fact, the physical stability of semisolid formulations could be influenced by the chemical instability of some added constituents [40]. The high TPC, TFC and antioxidant activity of gels at T0 means that C. sativa bur extract retained its functionality after being incorporated in the hydrogels. After 30 days, in formulations stored at 20 °C, there was a higher decrease in antioxidant activity compared with gels stored at 4 °C. The same is observed in TPC and TFC which could be related to the degradation of these compounds mediated by various factors such as storage aging, oxygen, aqueous phase of gel and temperature. Indeed, gels stored at 4 °C showed results similar or slightly lower than gels at T0. Thus, it is possible to conclude that the lower temperature is better to prevent antioxidant degradation.
Besides the minor changes, taken together all the results it is possible to confirm a good physical, technological and microbiological stability of the formulations when stored during 30 days at 4 °C. However, the antioxidant properties showed changes more extensive after 30 days of storage. To prevent the decrease of antioxidant potential on gels provided by C. sativa bur extracts, the possible interferences with other constituents of gels should be studied and its composition should be optimized.
4. Conclusions and Future Perspectives
Nowadays, the cosmetic industry is a field on the rise, increasing the demand for novel ingredients, preferably from natural sources. For this reason, the use of C. sativa bur as a source of phytochemicals with beneficial health effects in skin-care formulations contributes to the advance of this industry and consequently to the environmental and economic sustainability. The valorisation impact of this by-product could be huge, taking into account the broad geographic distribution of this crop. Also, this study gives, for the first time, a comprehensive evaluation of the applicability of chestnut bur extract in skin-care formulations.
In this work, different percentages of bur hydro-alcoholic extracts were incorporated in a hydrogel base. There is a proportional ratio between the concentration of extract in the hydrogel and its TPC, TFC and antioxidant activity; thereafter F4 presented the highest values. However, its pH is basic and not compatible with skin pH. Considering all the results, F3 was selected as the best one for cosmetic purposes based on the high values of TPC, TFC and antioxidant activity, and the technological properties which are suitable for skin application and, consequently, enhance the consumer acceptance. Regarding gel composition, the preservative proved to be efficient in preventing the growth of microorganisms. However, the composition of hydrogels could be improved to increase consumer compliance. For example, the appearance might be upgraded by addition of an opacifier such as titanium dioxide. Also, triethanolamine could be replaced by citric acid which is a natural ingredient used in the adjustment of acid/base balance.
Further investigations are needed to assess the safety of gels including in vitro studies, such as cell viability and cytotoxicity in different skin cell lines, as well as skin and ocular irritability tests. Likewise, in vivo studies, such as patch tests and sensitization studies, must be carried out.
Acknowledgments
Francisca Rodrigues is thankful for her post-doc research grant from the project Operação NORTE-01-0145-FEDER-000011. Diana Pinto is thankful for the research grant from project UID/QUI/50006. This work received financial support from the European Union (FEDER funds through COMPETE), under the Partnership Agreement PT2020, and National Funds (FCT, Foundation for Science and Technology) through project LAQV/UID/QUI/50006/2013.
Author Contributions
Francisca Rodrigues conceived and designed the experiments; Diana Pinto performed the experiments; Francisca Rodrigues and Diana Pinto analysed the data; Beatriz Oliveira contributed reagents, materials and analysis tools; Diana Pinto and Beatriz Oliveira wrote the paper.
Conflicts of Interest
The authors declare no conflict of interest.
References
- Rodrigues, F.; Santos, J.; Pimentel, F.B.; Braga, N.; Palmeira-de-Oliveira, A.; Oliveira, M.B.P.P. Promising new applications of Castanea sativa shell: Nutritional composition, antioxidant activity, amino acids and vitamin E profile. Food Funct. 2015, 6, 2854–2860. [Google Scholar] [CrossRef] [PubMed]
- Braga, N.; Rodrigues, F.; Oliveira, M.B.P.P. Castanea sativa by-products: A review on added value and sustainable application. Nat. Prod. Res. 2015, 29, 1–18. [Google Scholar] [CrossRef] [PubMed]
- Pinto, D.; Rodrigues, F.; Braga, N.; Santos, J.; Pimentel, F.B.; Palmeira-de-Oliveira, A.; Oliveira, M.B.P.P. The Castanea sativa bur as a new potential ingredient for nutraceutical and cosmetic outcomes: Preliminary studies. Food Funct. 2017, 8, 201–208. [Google Scholar] [CrossRef] [PubMed]
- Balasundram, N.; Sundram, K.; Samman, S. Phenolic compounds in plants and agri-industrial by-products: Antioxidant activity, occurrence, and potential uses. Food Chem. 2006, 99, 191–203. [Google Scholar] [CrossRef]
- Vázquez, G.; Fernández-Agulló, A.; Gómez-Castro, C.; Freire, M.S.; Antorrena, G.; González-Álvarez, J. Response surface optimization of antioxidants extraction from chestnut (Castanea sativa) bur. Ind. Crops Prod. 2012, 35, 126–134. [Google Scholar] [CrossRef]
- Almeida, I.F.; Valentão, P.; Andrade, P.B.; Seabra, R.M.; Pereira, T.M.; Amaral, M.H.; Costa, P.C.; Bahia, M.F. In vivo skin irritation potential of a Castanea sativa (Chestnut) leaf extract, a putative natural antioxidant for topical application. Basic Clin. Pharmacol. Toxicol. 2008, 103, 461–467. [Google Scholar] [CrossRef] [PubMed]
- Barreira, J.C.M.; Ferreira, I.C.F.R.; Oliveira, M.B.P.P.; Pereira, J.A. Antioxidant activities of the extracts from chestnut flower, leaf, skins and fruit. Food Chem. 2008, 107, 1106–1113. [Google Scholar] [CrossRef]
- Barreira, J.C.M.; Ferreira, I.C.F.R.; Oliveira, M.B.P.P.; Pereira, J.A. Antioxidant Potential of Chestnut (Castanea sativa L.) and Almond (Prunus dulcis L.) By-products. Food Sci. Technol. Int. 2010, 16, 209–216. [Google Scholar] [CrossRef] [PubMed]
- Almeida, I.F.; Maleckova, J.; Saffi, R.; Monteiro, H.; Góios, F.; Amaral, M.H.; Costa, P.C.; Garrido, J.; Silva, P.; Pestana, N.; et al. Characterization of an antioxidant surfactant-free topical formulation containing Castanea sativa leaf extract. Drug Dev. Ind. Pharm. 2015, 41, 148–155. [Google Scholar] [CrossRef] [PubMed]
- Vasconcelos, M.C.B.M.; Bennett, R.N.; Quideau, S.; Jacquet, R.; Rosa, E.A.S.; Ferreira-Cardoso, J.V. Evaluating the potential of chestnut (Castanea sativa Mill.) fruit pericarp and integument as a source of tocopherols, pigments and polyphenols. Ind. Crops Prod. 2010, 31, 301–311. [Google Scholar] [CrossRef]
- Federici, F.; Fava, F.; Kalogerakis, N.; Mantzavinos, D. Valorisation of agro-industrial by-products, effluents and waste: Concept, opportunities and the case of olive mill wastewaters. J. Chem. Technol. Biotechnol. 2009, 84, 895–900. [Google Scholar] [CrossRef]
- Vázquez, G.; González-Alvarez, J.; Freire, M.S.; Fernández-Agulló, A.; Santos, J.; Antorrena, G. Chestnut Burs as a Source of Natural Antioxidants. In Chemical Engineering Transactions; United States Environmental Protection Agency (EPA): Washington, DC, USA, 2009; pp. 855–860. [Google Scholar]
- Mujić, A.; Grdović, N.; Mujić, I.; Mihailović, M.; Živković, J.; Poznanović, G.; Vidaković, M. Antioxidative effects of phenolic extracts from chestnut leaves, catkins and spiny burs in streptozotocin-treated rat pancreatic β-cells. Food Chem. 2011, 125, 841–849. [Google Scholar] [CrossRef]
- Basile, A.; Sorbo, S.; Giordano, S.; Ricciardi, L.; Ferrara, S.; Montesano, D.; Castaldo, R.C.; Vuotto, M.L.; Ferrara, L. Antibacterial and allelopathic activity of extract from Castanea sativa leaves. Fitoterapia 2000, 71 (Suppl. 1), S110–S116. [Google Scholar] [CrossRef]
- Almeida, I.F.; Costa, P.C.; Bahia, M.F. Evaluation of Functional Stability and Batch-to-Batch Reproducibility of a Castanea sativa Leaf Extract with Antioxidant Activity. AAPS PharmSciTech 2010, 11, 120–125. [Google Scholar] [CrossRef] [PubMed]
- Vázquez, G.; Calvo, M.; Freire, M.S.; González-Álvarez, J.; Antorrena, G. Chestnut shell as heavy metal adsorbent: Optimization study of lead, copper and zinc cations removal. J. Hazard. Mater. 2009, 172, 1402–1414. [Google Scholar] [CrossRef] [PubMed]
- Vázquez, G.; González-Alvarez, J.; Santos, J.; Freire, M.S.; Antorrena, G. Evaluation of potential applications for chestnut (Castanea sativa) shell and eucalyptus (Eucalyptus globulus) bark extracts. Ind. Crops Prod. 2009, 29, 364–370. [Google Scholar] [CrossRef]
- Okayama, Y. Oxidative stress in allergic and inflammatory skin diseases. Curr. Drug Targets Inflamm. Allergy 2005, 4, 517–519. [Google Scholar] [CrossRef] [PubMed]
- Sander, C.S.; Chang, H.; Hamm, F.; Elsner, P.; Thiele, J.J. Role of oxidative stress and the antioxidant network in cutaneous carcinogenesis. Int. J. Dermatol. 2004, 43, 326–335. [Google Scholar] [CrossRef] [PubMed]
- Nishigori, C.; Hattori, Y.; Toyokuni, S. Role of reactive oxygen species in skin carcinogenesis. Antioxid. Redox Signal. 2004, 6, 561–570. [Google Scholar] [CrossRef] [PubMed]
- Ou-Yang, H.; Stamatas, G.; Saliou, C.; Kollias, N. A chemiluminescence study of UVA-induced oxidative stress in human skin in vivo. J. Investig. Dermatol. 2004, 122, 1020–1029. [Google Scholar] [CrossRef] [PubMed]
- Rechner, A.R.; Kuhnle, G.; Bremner, P.; Hubbard, G.P.; Moore, K.P.; Rice-Evans, C.A. The metabolic fate of dietary polyphenols in humans. Free Radic. Biol. Med. 2002, 33, 220–235. [Google Scholar] [CrossRef]
- Rodrigues, F.; Palmeira-de-Oliveira, A.; Neves, J.; Sarmento, B.; Amaral, M.H.; Oliveira, M.B.P.P. Coffee silverskin: A possible valuable cosmetic ingredient. Pharm. Biol. 2015, 53, 386–394. [Google Scholar] [CrossRef] [PubMed]
- Lu, J.M.; Lin, P.H.; Yao, Q.; Chen, C. Chemical and molecular mechanisms of antioxidants: Experimental approaches and model systems. J. Cell Mol. Med. 2010, 14, 840–860. [Google Scholar] [CrossRef] [PubMed]
- Craft, B.D.; Kerrihard, A.L.; Amarowicz, R.; Pegg, R.B. Phenol-Based Antioxidants and the in vitro Methods Used for Their Assessment. Compr. Rev. Food Sci. Food Saf. 2012, 11, 148–173. [Google Scholar] [CrossRef]
- Roleira, F.M.; Siquet, C.; Orru, E.; Garrido, E.M.; Garrido, J.; Milhazes, N.; Podda, G.; Paiva-Martins, F.; Reis, S.; Carvalho, R.A.; et al. Lipophilic phenolic antioxidants: Correlation between antioxidant profile, partition coefficients and redox properties. Biorgan. Med. Chem. 2010, 18, 5816–5825. [Google Scholar] [CrossRef] [PubMed]
- Prochazkova, D.; Bousova, I.; Wilhelmova, N. Antioxidant and prooxidant properties of flavonoids. Fitoterapia 2011, 82, 513–523. [Google Scholar] [CrossRef] [PubMed]
- Vasconcelos, M.C.B.M.; Bennett, R.N.; Rosa, E.A.S.; Ferreira-Cardoso, J.V. Primary and Secondary Metabolite Composition of Kernels from Three Cultivars of Portuguese Chestnut (Castanea sativa Mill.) at Different Stages of Industrial Transformation. J. Agric. Food Chem. 2007, 55, 3508–3516. [Google Scholar] [CrossRef] [PubMed]
- Alves, R.C.; Costa, A.S.G.; Jerez, M.; Casal, S.; Sineiro, J.; Nunez, M.J.; Oliveira, M.B.P.P. Antiradical activity, phenolics profile, and hydroxymethylfurfural in espresso coffee: Influence of technological factors. J. Agric. Food Chem. 2010, 58, 12221–12229. [Google Scholar] [CrossRef] [PubMed]
- Costa, A.S.G.; Alves, R.C.; Vinha, A.F.; Barreira, S.V.P.; Nunes, M.A.; Cunha, L.M.; Oliveira, M.B.P.P. Optimization of antioxidants extraction from coffee silverskin, a roasting by-product, having in view a sustainable process. Ind. Crops Prod. 2014, 53, 350–357. [Google Scholar] [CrossRef]
- Barros, L.; Baptista, P.; Ferreira, I.C.F.R. Effect of Lactarius piperatus fruiting body maturity stage on antioxidant activity measured by several biochemical assays. Food Chem. Toxicol. 2007, 45, 1731–1737. [Google Scholar] [CrossRef] [PubMed]
- Benzie, I.F.; Strain, J.J. The ferric reducing ability of plasma (FRAP) as a measure of “antioxidant power”: The FRAP assay. Anal. Biochem. 1996, 239, 70–76. [Google Scholar] [CrossRef] [PubMed]
- Akhtar, N.; Shoaib Khan, H.M.; Iqbal, A.; Khan, B.A.; Bashir, S. Glycyrrhiza glabra extract cream: Effects on skin pigment “melanin”. In Proceedings of the International Conference on Bioscience, Biochemistry and Bioinformatics, Singapore, 26–28 February 2011; Volume 5, pp. 434–439. [Google Scholar]
- Jones, D.S.; Muldoon, B.C.; Woolfson, A.D.; Sanderson, F.D. An examination of the rheological and mucoadhesive properties of poly(acrylic acid) organogels designed as platforms for local drug delivery to the oral cavity. J. Pharm. Sci. 2007, 96, 2632–2646. [Google Scholar] [CrossRef] [PubMed]
- Rozman, B.; Gasperlin, M. Stability of vitamins C and E in topical microemulsions for combined antioxidant therapy. Drug Deliv. 2007, 14, 235–245. [Google Scholar] [CrossRef] [PubMed]
- Wong, S.P.; Leong, L.P.; William Koh, J.H. Antioxidant activities of aqueous extracts of selected plants. Food Chem. 2006, 99, 775–783. [Google Scholar] [CrossRef]
- ISO Standard 11930:2012. Cosmetics—Microbiology—Evaluation of the Antimicrobial Protection of a Cosmetic Product; International Organization for Standardization (ISO): Geneva, Switzerland, 2012.
- Anchisi, C.; Maccioni, A.M.; Sinico, C.; Valenti, D. Stability studies of new cosmetic formulations with vegetable extracts as functional agents. Farmaco 2001, 56, 427–431. [Google Scholar] [CrossRef]
- Bouftira, I.; Abdelly, C.; Sfar, S. Characterization of cosmetic cream with Mesembryanthemum crystallinum plant extract: Influence of formulation composition on physical stability and anti-oxidant activity. Int. J. Cosmet. Sci. 2008, 30, 443–452. [Google Scholar] [CrossRef] [PubMed]
- Guaratini, T.; Gianeti, M.D.; Campos, P.M. Stability of cosmetic formulations containing esters of vitamins E and A: Chemical and physical aspects. Int. J. Pharm. 2006, 327, 12–16. [Google Scholar] [CrossRef] [PubMed]
Figure 1.
Comparison of the rheograms of hydrogels containing chestnut bur extracts in different percentages, evaluated at T0, T30/4 °C and T30/20 °C. Values are an average of three individual experiments (n = 3) expressed as mean ± standard deviation. (A) Formulation without extract (F1); (B) Formulation with 25% of extract (F2); (C) Formulation with 50% of extract (F3); (D) Formulation with the highest extract amount (F4).


Table 1.
Composition of the hydrogels.
| Composition of Hydrogels | ||||
|---|---|---|---|---|
| Compounds | Total Weight (%) | |||
| F1 | F2 | F3 | F4 | |
| Glycerine | 10 | 10 | 10 | 10 |
| Carbopol® 940 | 0.5 | 0.5 | 0.5 | 0.5 |
| Preservative | 0.5 | 0.5 | 0.5 | 0.5 |
| C. sativa bur hydro-alcoholic extract | - | 25 | 50 | 89 |
| Triethanolamine | q.s. | q.s. | q.s | q.s. |
| Deionized water | 89 | 64 | 39 | - |
q.s.—quantum satis.
Table 2.
Colour variation (L*, a* and b*), pH, moisture and texture (adhesiveness and firmness) of hydrogels containing chestnut bur extracts in different percentages, evaluated at different times and temperatures (mean ± standard deviation, n = 3). T0, time 0. T30/4 °C, after 30 days at 4 °C. T30/20 °C, after 30 days at 20 °C.
| Formulations | Technological Properties | |||||||
|---|---|---|---|---|---|---|---|---|
| L* (Lightness) | a* (Redness) | b* (Yellowness) | pH | Moisture (%) | Adhesiveness (N.mm) | Firmness (N) | ||
| F1 | T0 | 10.69 ± 0.01 a | −0.64 ± 0.04 a | 3.37 ± 0.02 c | 4.46 ± 0.04 a | 30.69 ± 1.64 a | −1.480 ± 0.237 a | 0.554 ± 0.013 b |
| T30/4 °C | 10.01 ± 0.05 c | −0.72 ± 0.06 a | 4.01 ± 0.04 a | 4.48 ± 0.01 a | 30.28 ± 0.70 a | −1.943 ± 0.232 a | 0.749 ± 0.023 a | |
| T30/20 °C | 10.11 ± 0.01 b | −0.73 ± 0.04 a | 3.57 ± 0.02 b | 4.52 ± 0.01 a | 29.35 ± 0.55 a | −1.413 ± 0.220 a | 0.531 ± 0.031 b | |
| F2 | T0 | 10.74 ± 0.02 c | 2.70 ± 0.08 a | 6.39 ± 0.06 b | 5.27 ± 0.03 a | 20.27 ± 0.39 a | −1.158 ± 0.148 a | 0.461 ± 0.020 a |
| T30/4 °C | 10.93 ± 0.01 a | 2.65 ± 0.04 a | 6.71 ± 0.06 a | 5.00 ± 0.02 b | 20.01 ± 0.66 a | −1.193 ± 0.013 a | 0.471 ± 0.019 a | |
| T30/20 °C | 10.83 ± 0.02 b | 2.74 ± 0.08 a | 6.51 ± 0.06 b | 4.99 ± 0.01 b | 20.12 ± 0.49 a | −1.029 ± 0.077 a | 0.429 ± 0.004 b | |
| F3 | T0 | 10.31 ± 0.02 b | 0.43 ± 0.03 a | 3.03 ± 0.01 a | 5.67 ± 0.01 b | 15.43 ± 3.13 a | −0.932 ± 0.122 a | 0.367 ± 0.012 b |
| T30/4 °C | 10.96 ± 0.02 a | 0.42 ± 0.02 a | 2.89 ± 0.02 c | 5.65 ± 0.01 b | 14.15 ± 0.53 a | −1.125 ± 0.033 b | 0.439 ± 0.011 a | |
| T30/20 °C | 10.27 ± 0.02 b | 0.49 ± 0.03 a | 2.98 ± 0.01 b | 5.72 ± 0.01 a | 13.89 ± 0.73 a | −0.857 ± 0.035 a | 0.381 ± 0.005 b | |
| F4 | T0 | 11.25 ± 0.02 c | −0.28 ± 0.09 a | 1.69 ± 0.01 c | 8.28 ± 0.01 b | 14.04 ± 0.63 a | −0.707 ± 0.082 a | 0.288 ± 0.008 a |
| T30/4 °C | 12.44 ± 0.03 a | −0.15 ± 0.09 a | 1.96 ± 0.05 a | 8.69 ± 0.01 a | 14.03 ± 0.13 a | −0.659 ± 0.029 a | 0.259 ± 0.007 b | |
| T30/20 °C | 11.32 ± 0.02 b | −0.35 ± 0.09 c | 1.78 ± 0.01 b | 8.21 ± 0.02 c | 13.99 ± 0.23 a | −0.679 ± 0.060 a | 0.261 ± 0.007 b | |
Different letters (a, b, c) in the same line of the same column indicate significant differences (p < 0.05) between the results obtained during gels storage.
Table 3.
Total phenolic content (TPC), total flavonoid content (TFC), ferric reducing antioxidant power (FRAP) and 2,2-diphenyl-1-picrylhydrazyl (DPPH●) scavenging assay of hydrogels containing chestnut bur extracts in different percentages, evaluated at different times and temperatures (mean ± standard deviation, n = 3). T0, time 0. T30/4 °C, after 30 days at 4 °C. T30/20 °C, after 30 days at 20 °C. GAE, gallic acid equivalents. CAE, catechin equivalents. FSE, ferrous sulphate equivalents. TE, Trolox equivalents.
| Formulations | Bioactive Compounds | ||||
|---|---|---|---|---|---|
| TPC (mg GAE/g gel) | TFC (mg CAE/g gel) | FRAP (µmol FSE/g gel) | DPPH (µg TE/g gel) | ||
| F1 | T0 | 0.79 ± 0.01 a | 0.05 ± 0.01 a | 98.41 ± 7.65 a | 431.96 ± 7.71 a |
| T30/4 °C | 0.82 ± 0.01 a | 0.06 ± 0.01 a | 85.05 ± 5.01 a | 395.01 ± 3.86 b | |
| T30/20 °C | 0.69 ± 0.01 b | 0.06 ± 0.01 a | 76.71 ± 5.78 b | 280.46 ± 8.12 c | |
| F2 | T0 | 2.48 ± 0.02 b | 0.31 ± 0.01 a | 509.17 ± 16.10 a | 658.37 ± 5.26 a |
| T30/4 °C | 2.81 ± 0.01 a | 0.27 ± 0.01 b | 510.84 ± 13.25 a | 656.07 ± 10.11 a | |
| T30/20 °C | 1.96 ± 0.01 c | 0.23 ± 0.01 c | 412.32 ± 16.10 b | 611.24 ± 10.21 b | |
| F3 | T0 | 5.30 ± 0.01 a | 0.73 ± 0.01 a | 774.66 ± 10.43 a | 803.15 ± 12.71 a |
| T30/4 °C | 4.41 ± 0.02 b | 0.69 ± 0.01 b | 727.91 ± 15.30 b | 795.03 ± 7.58 a | |
| T30/20 °C | 3.48 ± 0.01 c | 0.63 ± 0.01 c | 714.55 ± 10.43 b | 745.91 ± 13.36 b | |
| F4 | T0 | 9.65 ± 0.04 a | 1.23 ± 0.02 a | 1013.43 ± 12.61 a | 990.84 ± 14.06 a |
| T30/4 °C | 8.00 ± 0.01 b | 1.16 ± 0.01 b | 1030.13 ± 18.97 a | 933.98 ± 11.58 b | |
| T30/20 °C | 7.55 ± 0.04 c | 1.08 ± 0.02 c | 888.20 ± 12.61 b | 867.11 ± 11.57 c | |
Different letters (a, b, c) in the same line of the same column indicate significant differences (p < 0.05) between the results obtained during gels storage.
Table 4.
Total aerobic, total mesophilic aerobic bacteria and total yeast and mould counts of hydrogels containing chestnut bur extracts in different percentages, evaluated at T0, T30/4 °C and T30/20 °C. T0, time 0. T30/4 °C, after 30 days at 4 °C. T30/20 °C, after 30 days at 20 °C. Values are expressed as mean of the replicates (n = 3) in colony forming units per mL of gel (CFU/mL gel).
| Formulations | Microbiological Properties | |||
|---|---|---|---|---|
| Total Aerobic Count (UFC/mL gel) | Total Mesophilic Aerobic Bacteria Count (UFC/mL gel) | Total Yeast and Mold Count (UFC/mL gel) | ||
| F1 | T0 | ≤10 | ≤10 | ≤10 |
| T30/4 °C | ≤10 | ≤10 | ≤10 | |
| T30/20 °C | ≤10 | ≤10 | ≤10 | |
| F2 | T0 | ≤10 | ≤10 | ≤10 |
| T30/4 °C | ≤10 | ≤10 | ≤10 | |
| T30/20 °C | ≤10 | ≤10 | ≤10 | |
| F3 | T0 | ≤10 | ≤10 | 195 |
| T30/4 °C | ≤10 | ≤10 | ≤10 | |
| T30/20 °C | ≤10 | ≤10 | ≤10 | |
| F4 | T0 | ≤10 | 15 | 15 |
| T30/4 °C | ≤10 | 25 | 30 | |
| T30/20 °C | ≤10 | ≤10 | ≤10 | |
© 2017 by the authors. Licensee MDPI, Basel, Switzerland. This article is an open access article distributed under the terms and conditions of the Creative Commons Attribution (CC BY) license (http://creativecommons.org/licenses/by/4.0/).
Share and Cite
MDPI and ACS Style
Pinto, D.; Braga, N.; Rodrigues, F.; Oliveira, M.B.P.P. Castanea sativa Bur: An Undervalued By-Product but a Promising Cosmetic Ingredient. Cosmetics 2017, 4, 50. https://doi.org/10.3390/cosmetics4040050
AMA Style
Pinto D, Braga N, Rodrigues F, Oliveira MBPP. Castanea sativa Bur: An Undervalued By-Product but a Promising Cosmetic Ingredient. Cosmetics. 2017; 4(4):50. https://doi.org/10.3390/cosmetics4040050
Chicago/Turabian StylePinto, Diana, Nair Braga, Francisca Rodrigues, and M. Beatriz P. P. Oliveira. 2017. "Castanea sativa Bur: An Undervalued By-Product but a Promising Cosmetic Ingredient" Cosmetics 4, no. 4: 50. https://doi.org/10.3390/cosmetics4040050
Note that from the first issue of 2016, this journal uses article numbers instead of page numbers. See further details here.