Article

Environmental and Energy Performance of Ethanol Production from the Integration of Sugarcane, Corn, and Grain Sorghum in a Multipurpose Plant

1
Institute of Energy and Environment, University of Sao Paulo, Av. Prof Luciano Gualberto, 1289, 05508-900 Sao Paulo, Brazil
2
Chemical Engineering Department, Polytechnic School of the University of Sao Paulo, Av. Prof. Lineu Prestes, 580, Bloco 18—Conjunto das Quimicas, 05424-970 Sao Paulo, Brazil
*
Author to whom correspondence should be addressed.
Resources 2017, 6(1), 1; https://doi.org/10.3390/resources6010001
Submission received: 31 October 2016 / Revised: 12 December 2016 / Accepted: 20 December 2016 / Published: 27 December 2016
(This article belongs to the Special Issue Advanced Analysis of Energy Systems under Sustainability Aspects)

Abstract

:
Although in the last 40 years only sugarcane has been harnessed for the production of ethanol in Brazil, corn production has grown strongly in certain areas, and may serve as a supplementary feedstock for ethanol production in integrated plants during the sugarcane off-season. The aim of this study is to evaluate the environmental and energy performance of ethanol production from sugarcane, corn, and grain sorghum in a Flex Mill in the state of Mato Grosso, Brazil. A life cycle assessment was carried out to survey the production of ethanol from each individual feedstock, and the integration of two of these to increase production during a one-year period. Results indicate that the environmental and energy performance are greatly influenced by agricultural activities, highlighting the importance of sugarcane cultivation. Still, there was an increasing trend of Climate Change impacts, Human Toxicity (carcinogenic) and Ecotoxicity, as well as reduced impact of Photochemical Oxidant Formation and Energy Return on Investment (EROI) as the proportion of ethanol from starchy sources in integration scenarios increases.

1. Introduction

Ethanol is consolidated as fuel for light-duty vehicles in Brazil and has been widely available in the Brazilian market since the 1980s. Currently, Brazil is the world’s second largest ethanol producer and the largest exporter. In 2015, the country produced 29.9 Mm3 of ethanol, 1.90 Mm3 of which was for export [1]. Twenty-one percent of the energy consumption matrix of the transport sector in Brazil comes from renewable sources [2]. The Brazilian ethanol market is still booming, with a growth of 5.8% in production and 19% in consumption compared to 2014 [2,3].
In recent decades, ethanol production has been sourced solely from sugarcane and concentrated in the state of Sao Paulo, in southeastern Brazil, which accounts for approximately 58% of the national production [1]. Nevertheless, the need for diversifying feedstocks for the production of ethanol is already a cause for concern. Cultivation of multiple sources of feedstocks for energy use in appropriate ecological regions provides greater security against pests, which could jeopardize the use of this energy source [4]. Currently, the risks of monocultures are even larger, considering the scenario of increasingly atypical climates, in addition to fluctuations in the commodities market linked to factors beyond the control of producers.
Brazilian distilleries traditionally operate only during the sugarcane harvest (6–7 months), which implies infrastructure underuse. Producing mixed feedstocks in an integrated ethanol process is a way to maximize the industrial capital, especially if this occurred continuously with sugarcane, or even simultaneously with it, throughout the agricultural year [3,5,6]. This alternative is viable in the Midwest region of Brazil, a zone where agriculture has been growing continually and already supplies feedstock such as corn and grain sorghum at low prices. These starchy grains are options for composing rotation systems with soybean, which has a greater economic interest and predominates in the area [5,7].
Moreover, there are only a few studies on the energetic and environmental consequences of producing ethanol from corn or grain sorghum in Brazil or on the integration of ethanol production from varying ratios of two feedstocks in the same plant [8,9].
In order to verify the suitability of multipurpose plants operating in the Brazilian Midwest within existing sustainability criteria, a comprehensive assessment should be conducted. To this end, the Life Cycle Assessment (LCA) is a standard technique that evaluates environmental aspects and potential impacts associated with a product system, and has proven to be a useful tool for evaluating energy systems [10,11,12,13,14,15,16,17,18,19,20,21,22,23,24,25].
The aim of this study is to evaluate the environmental and energy performances of ethanol production from three different feedstocks (sugarcane, corn, and grain sorghum) in a multipurpose plant in the state of Mato Grosso, Brazil. The study also examines and discusses the effects on these same dimensions provided by the potential integration of two feedstocks to be carried out in order to increase the volume of ethanol produced during an agricultural year. The diagnoses were obtained from the application of the LCA technique taking into account the conceptual framework established by the International Organization for Standardization (ISO) 14044 standard [26].

2. Contextualization and Methodological Aspects

2.1. Socioeconomic Context of Rural Production in Mato Grosso

The state of Mato Grosso is economically strong in agricultural and mining activities. The region is notable for the production of corn and cotton, and for cattle. However, its most profitable agribusiness is the cultivation of soybean, the leading 2015/16 crop with a production of 26 Mt grains [27], or 27% of the domestic total.
The sociodemographic aspects of the rural population of Mato Grosso are, however, in sharp contrast with these performances. The 2010 Demographic Census indicated that 86% of the rural population inhabited small municipalities (≤50,000 inhabitants). Their households showed semi-adequate (86%) or inadequate (13%) sanitation conditions, and 9.0% of the population did not have access to electricity. In economic terms, 84% of the state’s agrarian collectivity accrued per capita household income of up to US$3070/year, and 48% of which lived in poverty (<US$1535/year) and 13% in extreme poverty (up to US$768/year) [28]. Despite these performances, the Gini Coefficient and the Human Development Index (HDI) for the state reached levels of 0.45 and 0.725, respectively, in the period [29], which indicates significant inequality between rural and urban areas.
As far as soybean is concerned, this divergence is ascribed, at least in part, to the concentration of crops in large estates. Labor to work in soybean cultivation is largely supplied by itinerant workers from other parts of the country, with limited salary expectations, and a low level of training to operate in a highly mechanized production model [30]. Similarly, agrochemicals are another instance of how agriculture has been modernized in Mato Grosso, with its use increasing 159% between 2009 and 2012 [31]. It should be highlighted that the use of these kinds of resources invariably results in an increase in agricultural production. On the other hand, they also provide more adverse effects on the environment than those required by small and medium-scale farming practices.
Grain sorghum and especially second crop corn are common options to compose rotation systems with soybean, recovering the soil between crops [5,8]. The Mato Grosso corn and grain sorghum production reached, respectively, 15 Mt and 94 kt in the 2015/2016 crop [27]. Average prices are still low in the domestic market (US$9.49 and 7.37 (60 kg·bag−1)). Exporting is hindered by the long distances between the production areas and outlets. The use of starches as feedstock in the production of ethanol during the sugarcane off-season becomes an economically and technically viable option, especially in multi-purpose production units.

2.2. Materials and Methods

The methodology adopted in this study followed four steps: (i) construction of models that consider the operational and procedural aspects of ethanol production from sugarcane, corn, and grain sorghum and their integrations from representative primary data for the state of Mato Grosso, in midwestern Brazil; (ii) definitions of the conceptual basis for determining environmental and energy performance of each case; (iii) comparison of individual performances of processing; and (iv) analysis of the effects of the integration of processes as energy and environmental performance.
The analysis was carried out on two levels. The first assessed the consumption of energy resources in terms of Primary Energy Demand [32,33]. Determining this indicator enables us to calculate the Energy Return on Investment (EROI) (Equations (1)–(3)). This is the relationship between energy provided by a fuel and non-renewable fossil primary energy (NRF) consumed [34]. In order to define the evaluated systems’ EROIs, we considered the average Lower Heating Value (LHV) of hydrate ethanol in Brazil, which corresponds to 21,350 MJ·m−3 [1].
E R O I = E o u t f u e l E i n
E o u t f u e l =   L H V f u e l × p f u e l
E i n = N R F =   r i × E C i
where: EROI: Energy Return on Investment; E o u t f u e l : energy provided by the fuel (kJ); E i n : non-renewable energy demanded for fuel production (kJ); L H V f u e l : Lower Heating Value of the fuel (kJ·kg−1); p f u e l : amount of fuel (kg); N R F : non-renewable fossil primary energy demanded by the product life cycle (kJ); r i : amount of raw material i, demanded by the product throughout its life cycle (kg); E C i : energy content of raw material i (kJ·kg−1).
The second level assesses the environmental effects of emissions and changes in the physical environment caused by the life cycle of the products evaluated. Two specific impact assessment methods were used to estimate these environmental effects according to different impact categories.
A discussion of the indicators for each impact category is presented in Section 6. In addition to the individual analyses, the trends noticeable in the integration scenarios were also evaluated. They consider different proportions of feedstocks for ethanol production in a multipurpose plant.

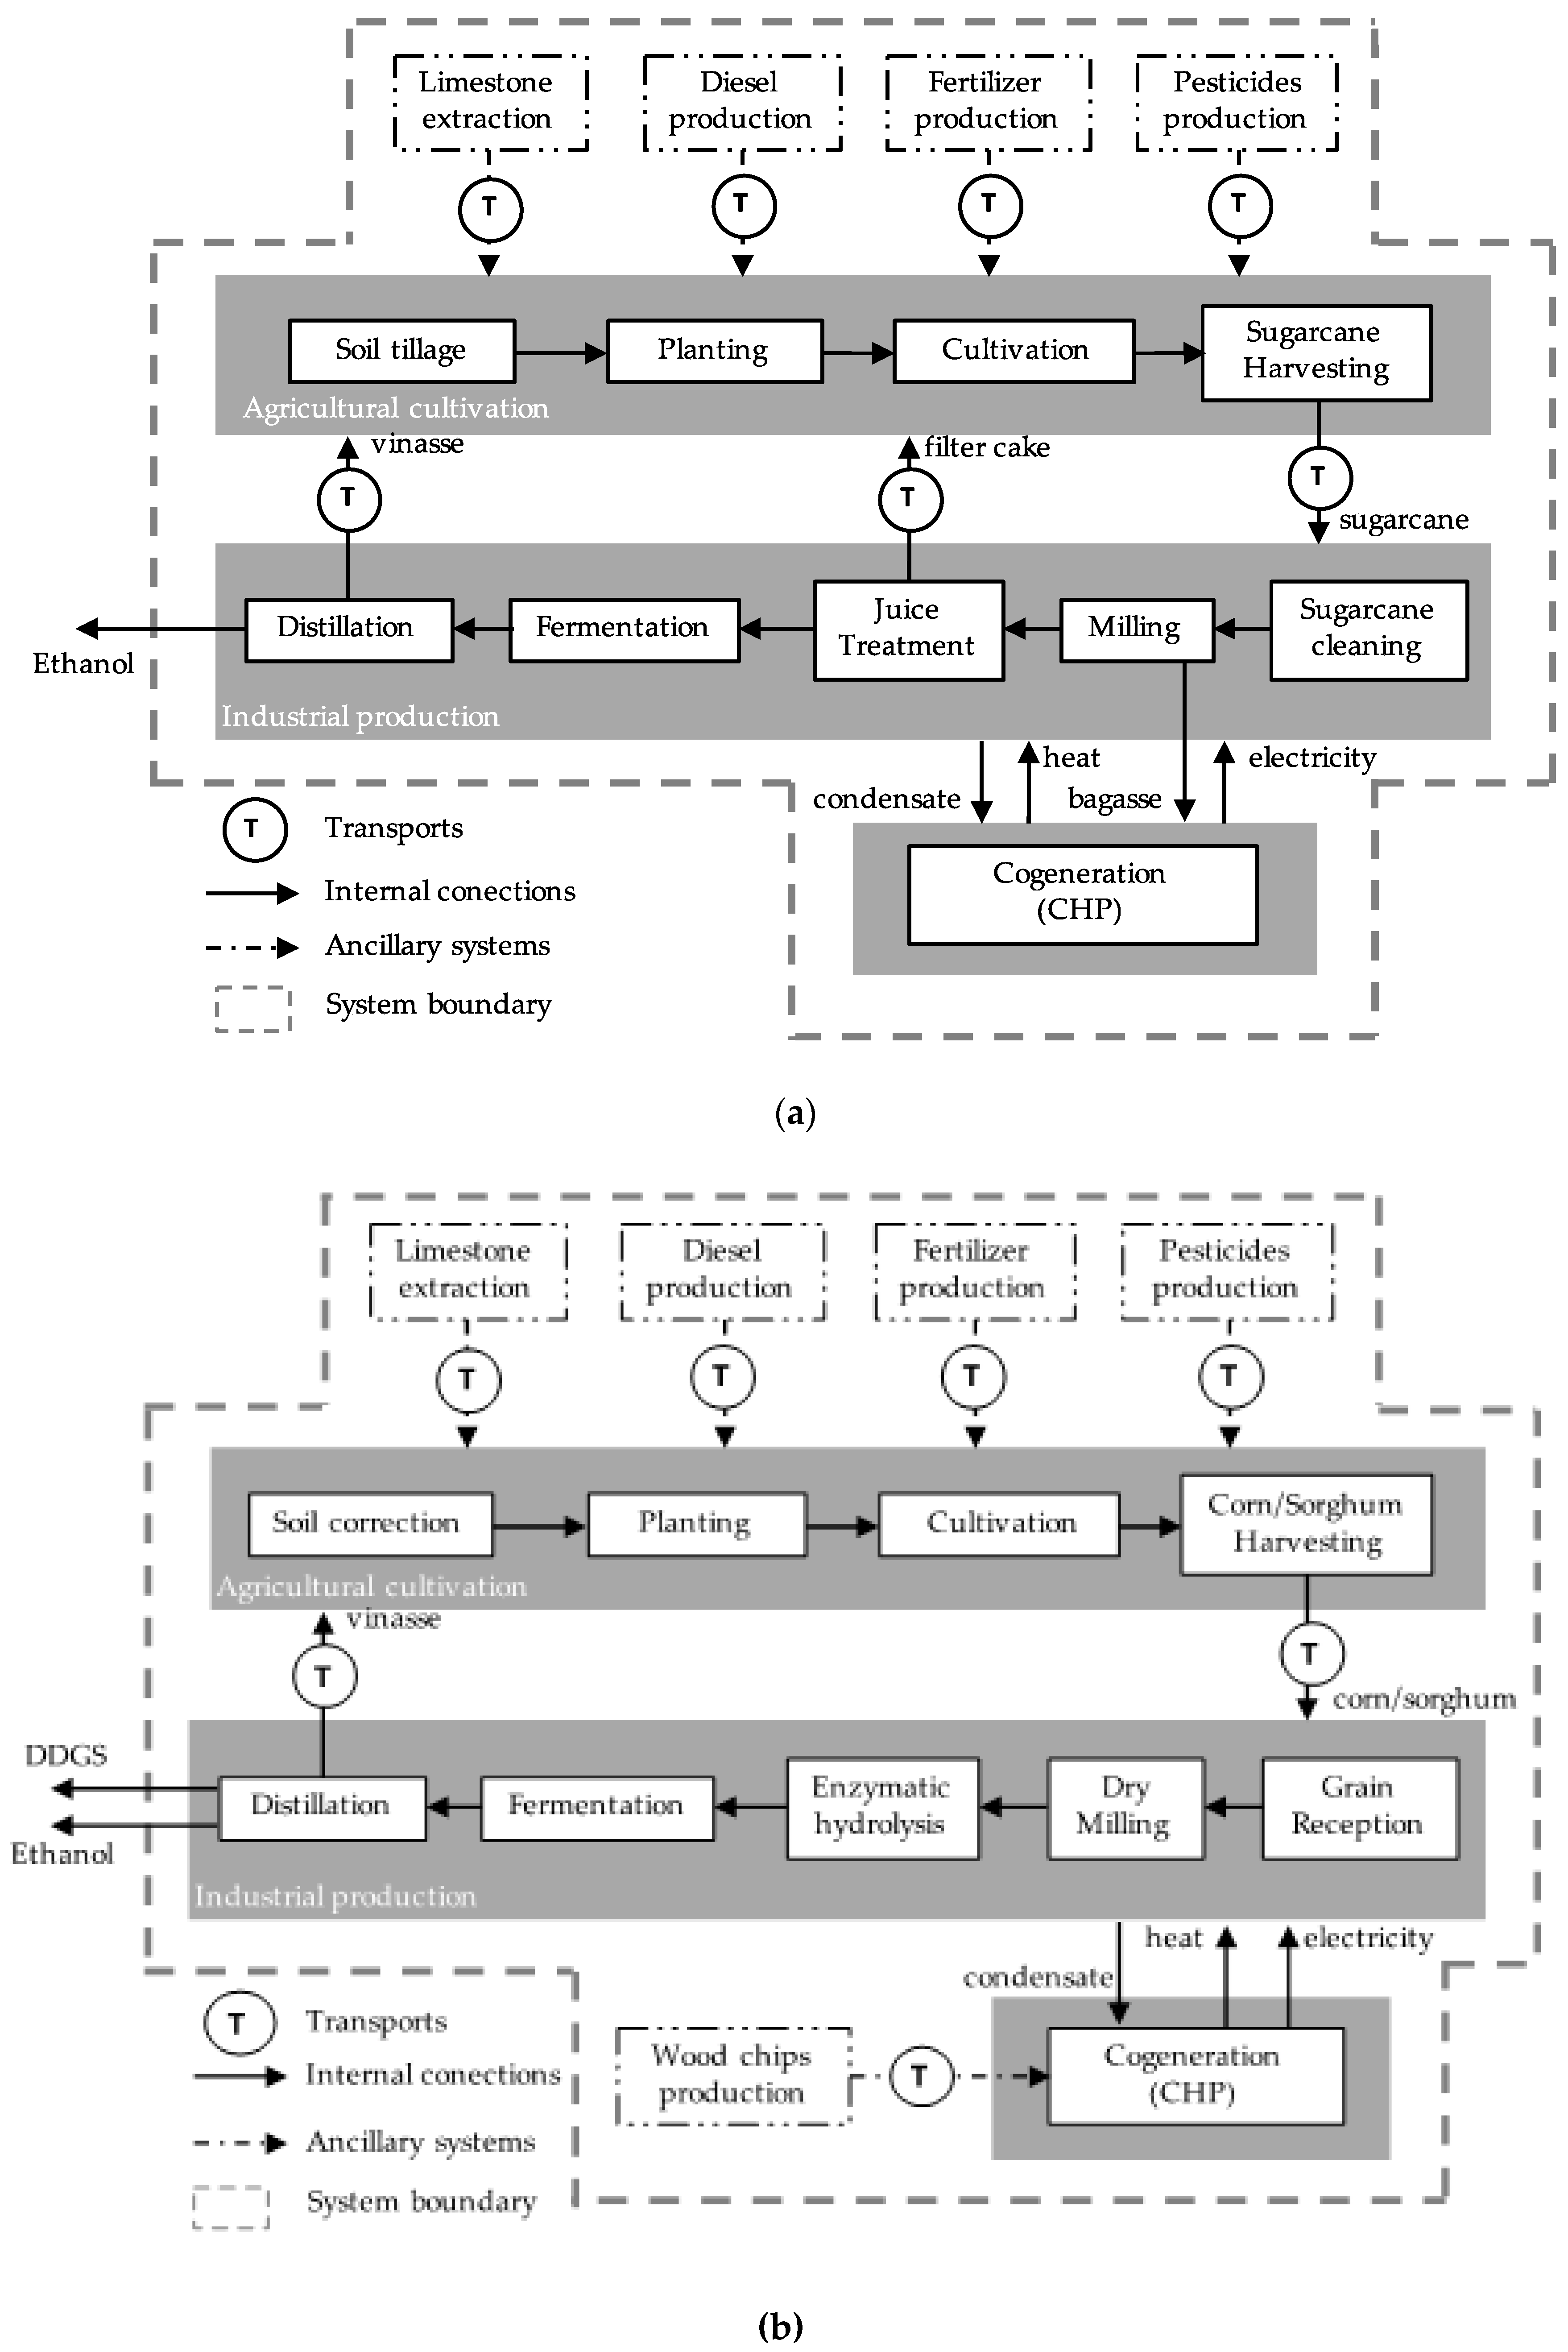
3. Description of the Models for Producing Ethanol from Sugarcane, Corn and Grain Sorghum in the State of Mato Grosso

In Mato Grosso, sugarcane cultivation technology can be divided between the sub-processes of (i) soil tillage; (ii) planting; (iii) cultivation; and (iv) harvest. Tillage comprises the use of limestone to correct the soil pH as well as soil decompression. During planting, seedlings are placed in the grooves and nitrogen and phosphate fertilizers are applied, along with insecticides, herbicides, and fungicides for plague control. In cultivation, vinasse and filter cake generated in the industrial stage are applied in addition to cover fertilizers (N and K), as well as growth regulators and more herbicides and insecticides.
Sugarcane is a semi-perennial crop and soil preparation and planting stages take place every six years, while cultivation and harvesting are repeated annually. The harvesting should preferably occur in the dry season to allow mechanized operations. Agricultural productivity of sugarcane varies depending on local climate, the cultivars and some technical practices [12]. The performance presented in Table 1 is considered high for Mato Grosso, whose average is 70 t·ha−1 for the 2012/2013 harvest [35]. The high yield can be explained by the first harvested crops, which usually have the highest productivity rates. The main inputs used in the process (fertilizers, soil correctives, pesticides, diesel, vinasse, filter cake, and even the sugarcane) were road-transported.
Sugarcane ethanol is produced in a small plant, as depicted in Table 1. Since raw saccharine cannot be stored, ethanol production follows the sugarcane harvest period (6–7 months) from April to November. The process can be divided into the following steps: (i) receiving and cleaning; (ii) milling; (iii) juice treatment; (iv) fermentation; and (v) distillation of hydrate ethanol (95%w/w). Sugarcane is first weighed and the cane stalks are washed.
The cane is sent to the mills for juice extraction. Bagasse is generated during the milling stage, which is sent to the boiler to be used in the fuel cogeneration system to supply the plant’s energy demands. Sugar juice treatment involves removing impurities and increasing concentration, from which both the clarified juice and filter cake are produced. The juice then goes to the fermentation tanks to be mixed with diluted yeast to produce a fermented solution containing ethanol and carbon dioxide (CO2), which is released into the atmosphere. At the end of this process, yeast is recovered by centrifugation and reused. Filter cake returns to the field to be used as fertilizer in the crop.
The fermented solution is distilled into ethanol, vinasse, and fusel oil. Vinasse is diluted and then transferred to the soil by fertigation. All the energy required in the process is supplied by the cogeneration system that produces steam at 21 bar and 300 °C to feed the plant and the turbogenerator, which, in turn, produces electricity as well as the exhaust steam (1.5 bar and 150–180 °C) used in the previous steps requiring thermal energy, such as sugar juice treatment and distillation. In the unit under analysis, electricity is not exported to the national grid.
The processes of agricultural production of corn and grain sorghum are quite similar, even though they may differ in terms of productivity and resource requirements. Sorghum is more resistant to droughts and to low nutrient availability [36]. The main process specifications of these product systems are summarized in Table 1. Corn and sorghum are planted according to the no-tillage system, which considers the cultivation of two rotated crops in the same crop year (planting the first crop in the rainy season and the second crop in the dry season) and maintenance of straw in the field. For this model, both corn and grain sorghum were second crops. The agricultural production of these cultivars can also be divided into four sub-processes: (i) soil correction; (ii) planting; (iii) cultivation; and (iv) collection and processing.
Soil acidity correction occurs every five years using limestone. Mechanical planting is used together with spraying of herbicides and insecticides. For corn planting, nitrogen, phosphate, and potassium fertilizers are applied, as well as fungicides. N-fertilizer is also used during cultivation. Finally, the grains are dried in order to improve the storage conditions after being mechanically harvested. We considered that fertilizers, soil correctives, pesticides, and diesel have all been road-transported.
The production of ethanol from starchy sources is carried out in a Dry Milling plant, according to the parameters presented in Table 1. Starchy ethanol can be produced throughout the year, since corn and grain sorghum keep their characteristics if the grains are properly stored. The process steps are repeated for both grains and comprise (i) receiving the grain; (ii) milling; (iii) liquefaction, cooking, and enzymatic hydrolysis; (iv) propagation of yeast and fermentation; and (v) distillation.
In the receiving stage, the feedstocks are stored in silos. In the liquefaction stage, water, steam, and the enzyme α-amylase are added. Cooking leads to starch gelatinization and fragmentation, generating a wide range of dextrins. The next step is the addition of mash and nutrients for the propagation of yeast. After this, the glucoamylase enzyme is added to the mixture of dextrins and propagated yeast, in order to processes the dextrin molecules into simple glucose molecules that can be metabolized by the yeast. Finally, a distillation is carried out to separate the hydrate ethanol (95%w/w) from the vinasse.
Because yeasts are not recovered, the vinasse and the soluble solids are recovered and used as a protein component in animal feed. All the energy required for the process is supplied by the same cogeneration system described previously, although the fuel is different. The processes for obtaining ethanol from corn and sorghum differ slightly in yield since sorghum has less starch. In practical terms, the production from this raw material consumes about 2.0% more energy.

4. Life Cycle Assessment: Flex Mill in Mato Grosso

4.1. Scope Definition

This study uses a cradle-to-gate attributional life cycle approach, in accordance with ISO 14044 guidelines [26] and the Reference Flow (RF) was defined as “producing 1.0 m3 of hydrate ethanol (95%w/w).” Ethanol production can be divided into two macro processes: (i) production of agricultural raw material; and (ii) industrial ethanol production. These processes have specific characteristics, which were described in Section 4. The product system for sugarcane ethanol is shown in Figure 1a and the product systems for ethanol corn and grain sorghum are both described in Figure 1b.
Primary data were used for modeling the stages of production of the agricultural raw material, ethanol production, and cogeneration stages in most cases. Secondary data have only been applied for the ancillary systems such as production inputs and wood chips [37,38]. Background data regarding industrial and agricultural inputs were obtained from the Ecoinvent Database [33,39,40]. Moreover, some adjustments have been made to the Brazilian energy matrix and thermal power generation.
Geographical coverage considers the state of Mato Grosso, in midwestern Brazil and Temporal coverage refers to the period 2012–2013. Changes in geographical or temporal scopes are attributable to scopes of auxiliary processes used in the inventory database. Technology coverage considers the specifications described before in Section 4.
Environmental aspects associated with capital goods were not considered. Moreover, if the cumulative mass participation of a certain amount was less than 1.0% of the total for each unit process, then that input has been excluded. The exception occurred for pesticides because of their environmental relevance.
Cases of multifunctionality have been addressed through allocation procedures. The assignment of environmental loads among the distillery coproducts—ethanol, fusel oil and vinasse in the case of sugarcane, and all these as well as Dried Distillers Grains with Solubles (DDGS) for starchy sources—was based on the (C/H) ratio of those flows, which have been established from typical compositions [41,42,43]. The decision was made due to the energy nature of the systems under analysis and their co-products, which can be quantified from that relation. The allocation factors applied for each situation are depicted in Table 2.
For the cases involving starch ethanol, the allocation procedures have also been applied at the agricultural stage to distribute the environmental loads between the first and second crops in the rotation system. Thus, the emissions generated by the direct Land Use Change (dLUC) and soil acidity correction were equally divided, considering the time of land occupation for each crop during the agricultural year [44].

4.2. Life Cycle Inventory (LCI)

Data collection followed the assumptions above mentioned and referenced to 1.0 m3 hydrate ethanol. The LCIs used in this study are available as supplementary material (Tables S1–S6). The application of vinasse generated from the corn/grain sorghum ethanol production was considered as an alternative of N, P, and K supplementing in the agricultural stage of their respective feedstocks, as occurs in the production of sugarcane ethanol, due to the benefits provided by this practice in terms of agricultural productivity [38]. Models regularly accepted by the scientific community have been used for emission estimates [39,40,45,46,47].
The dLUC emissions were calculated for the state of Mato Grosso for the 20-year period (1993–2013) [40,48,49,50]. To determine dLUC, five types of land use have been considered as possible reference systems: (i) annual and (ii) perennial crops; (iii) pasture; (iv) forest plantations and (v) primary forests [50]. The areas corresponding to the types of land use were obtained from official statistics [51,52]. Sugarcane, corn, and grain sorghum, as well as the eucalyptus used for cogeneration, showed growth in planted areas in the zone. The data collection process concluded that the expansion of the crops may have occurred in perennial crop areas (the only type of land use which decreased in the period), or in primary forests, according to the reduction ratio of such land uses in the state.

4.3. Life Cycle Impact Assessment

Non-renewable energy demand (NRF) used as the basis for calculating the EROI was estimated according to the Cumulative Energy Demand method (CED)—v.1.08 [33]. Effects related to emissions and changes in the physical environment were estimated by ReCiPe Midpoint (H)—v.1.10 [53] for impact categories: Climate Change, Terrestrial Acidification, Photochemical Oxidant Formation, and Agricultural Land Occupation. Finally, the USEtox (default) method—v.1.03 [54] was selected for quantifying impacts in terms of Ecotoxicity and Human Toxicity (carcinogenic).

5. Results and Discussion

In order to comply with the objectives established for the study, the results have been separated into two sections. The first depicts the results related to the energy and environmental assessments for the production of hydrate ethanol from each feedstock individually. The second section reports the discussion of the results obtained for the integration scenarios in a multipurpose plant.

5.1. Individual Assessment of Ethanol Production from Sugarcane, Corn and Grain Sorghum

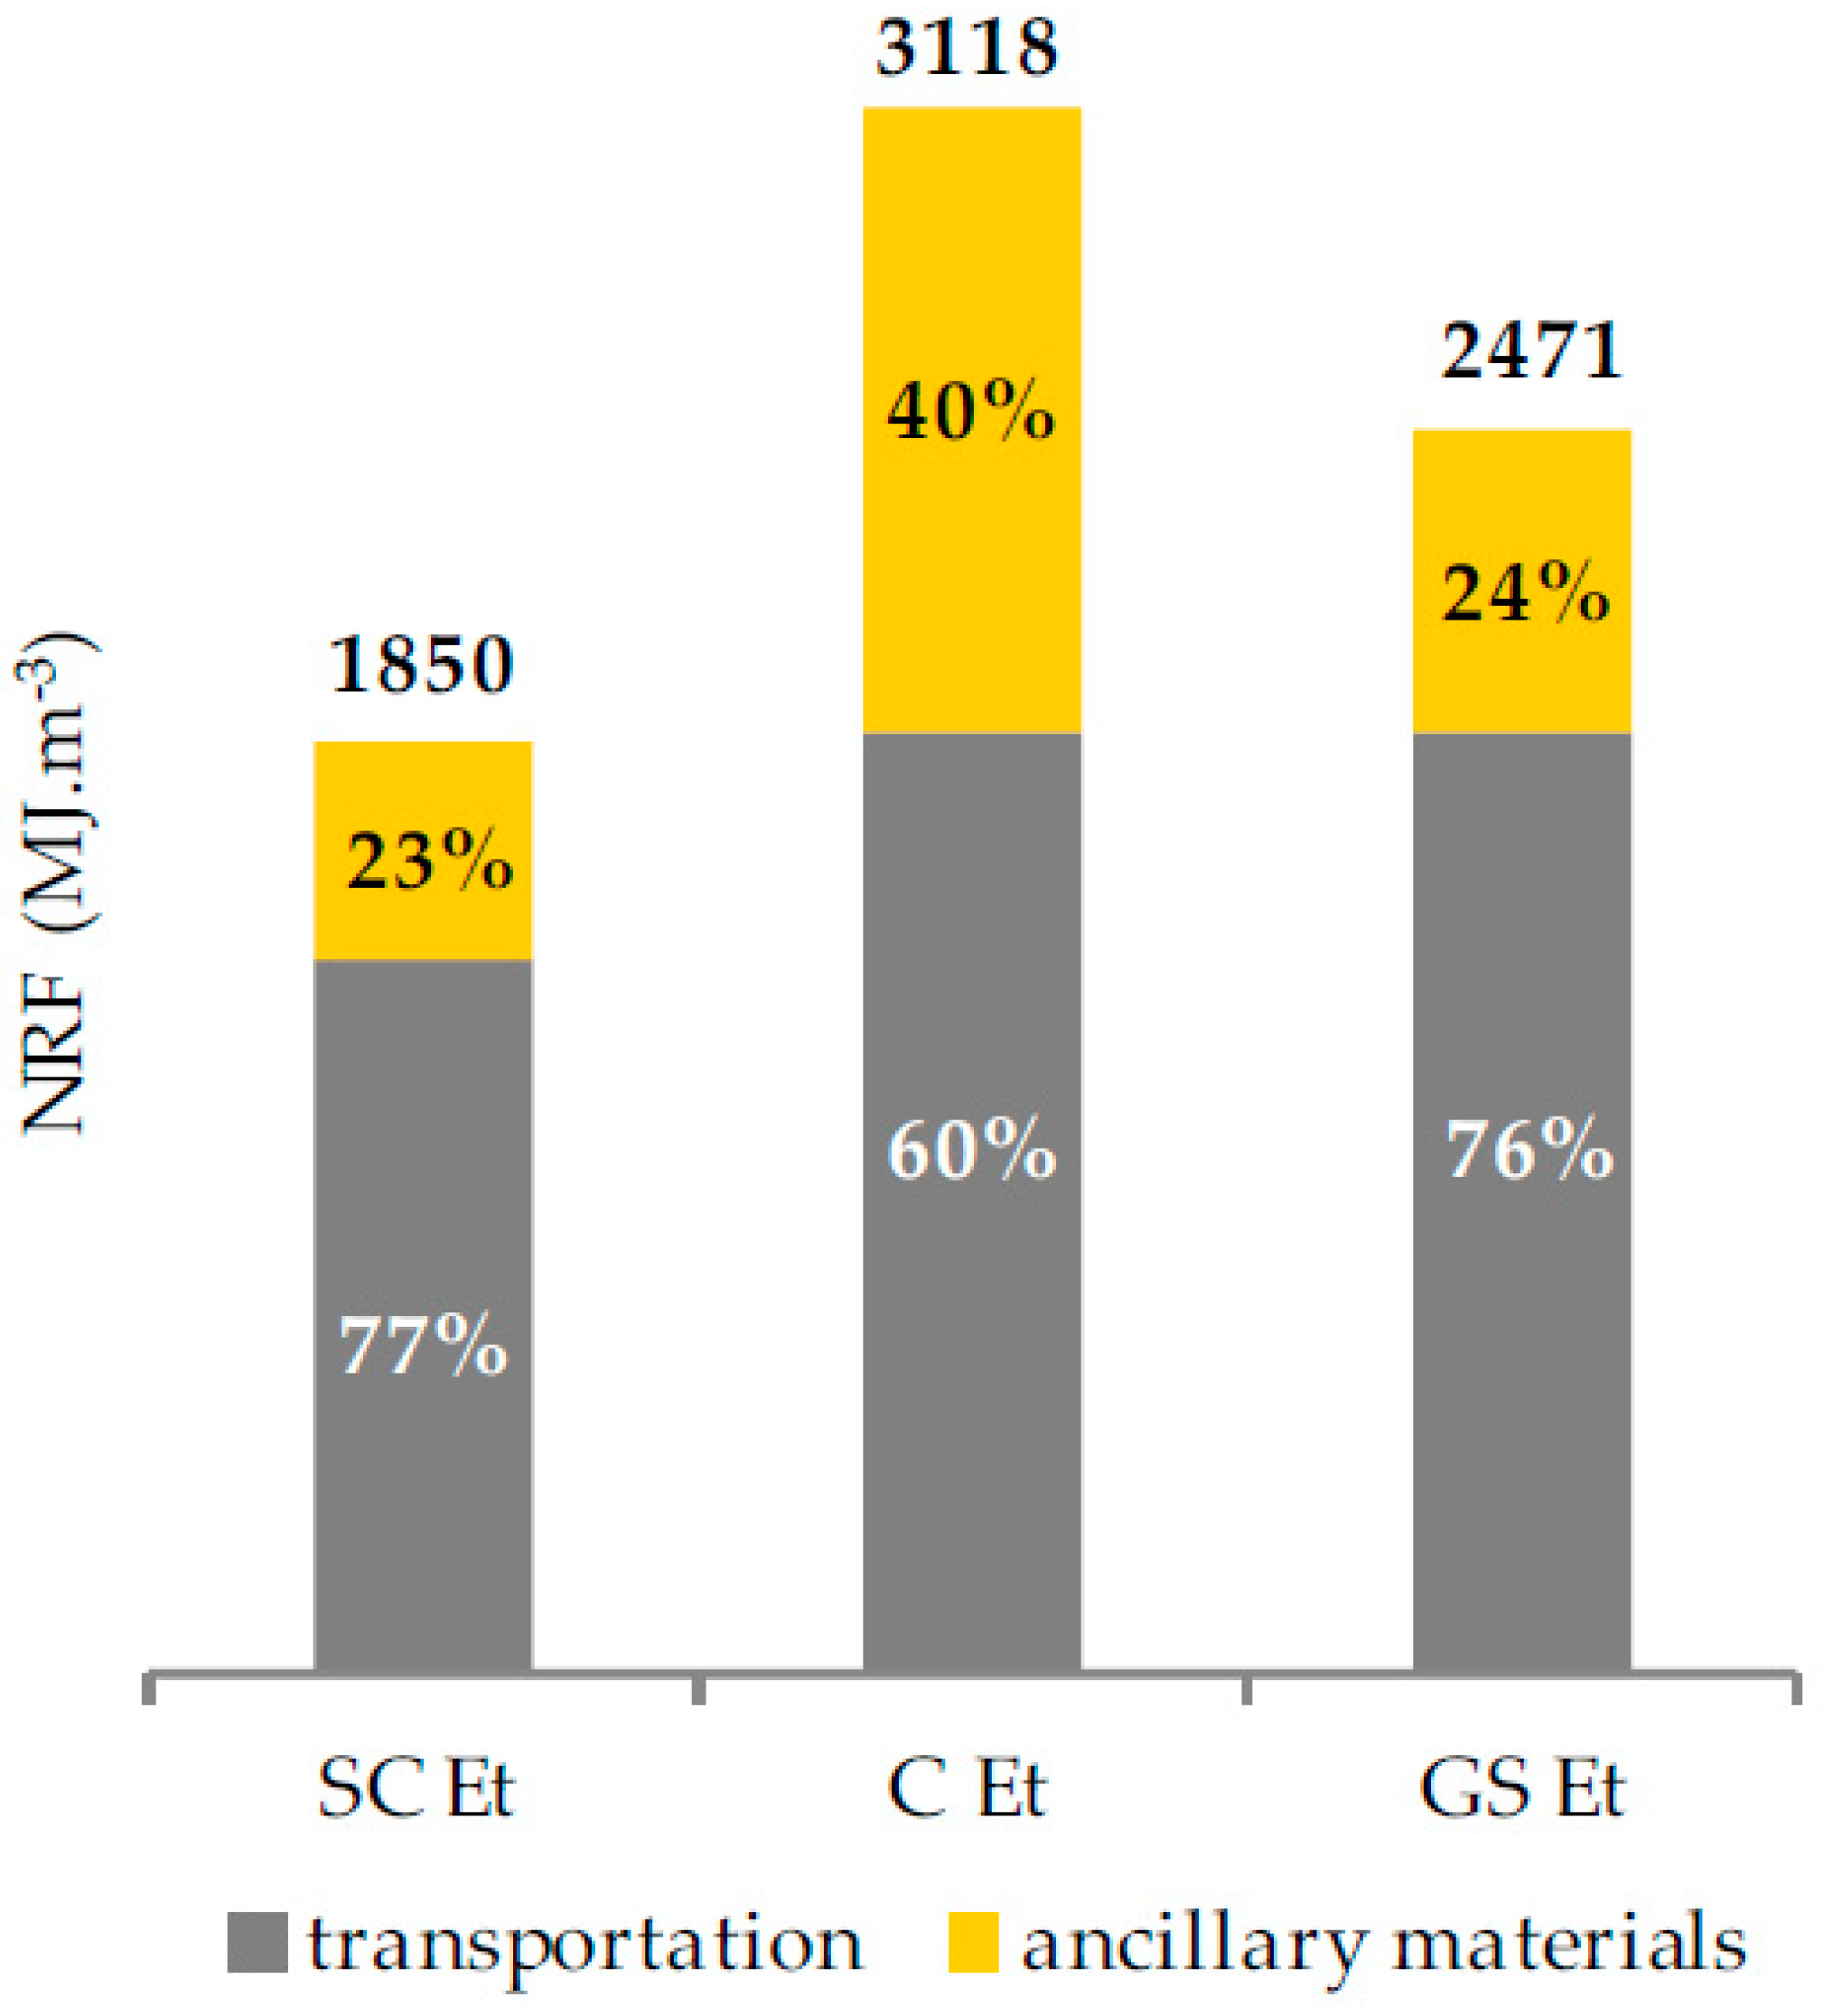
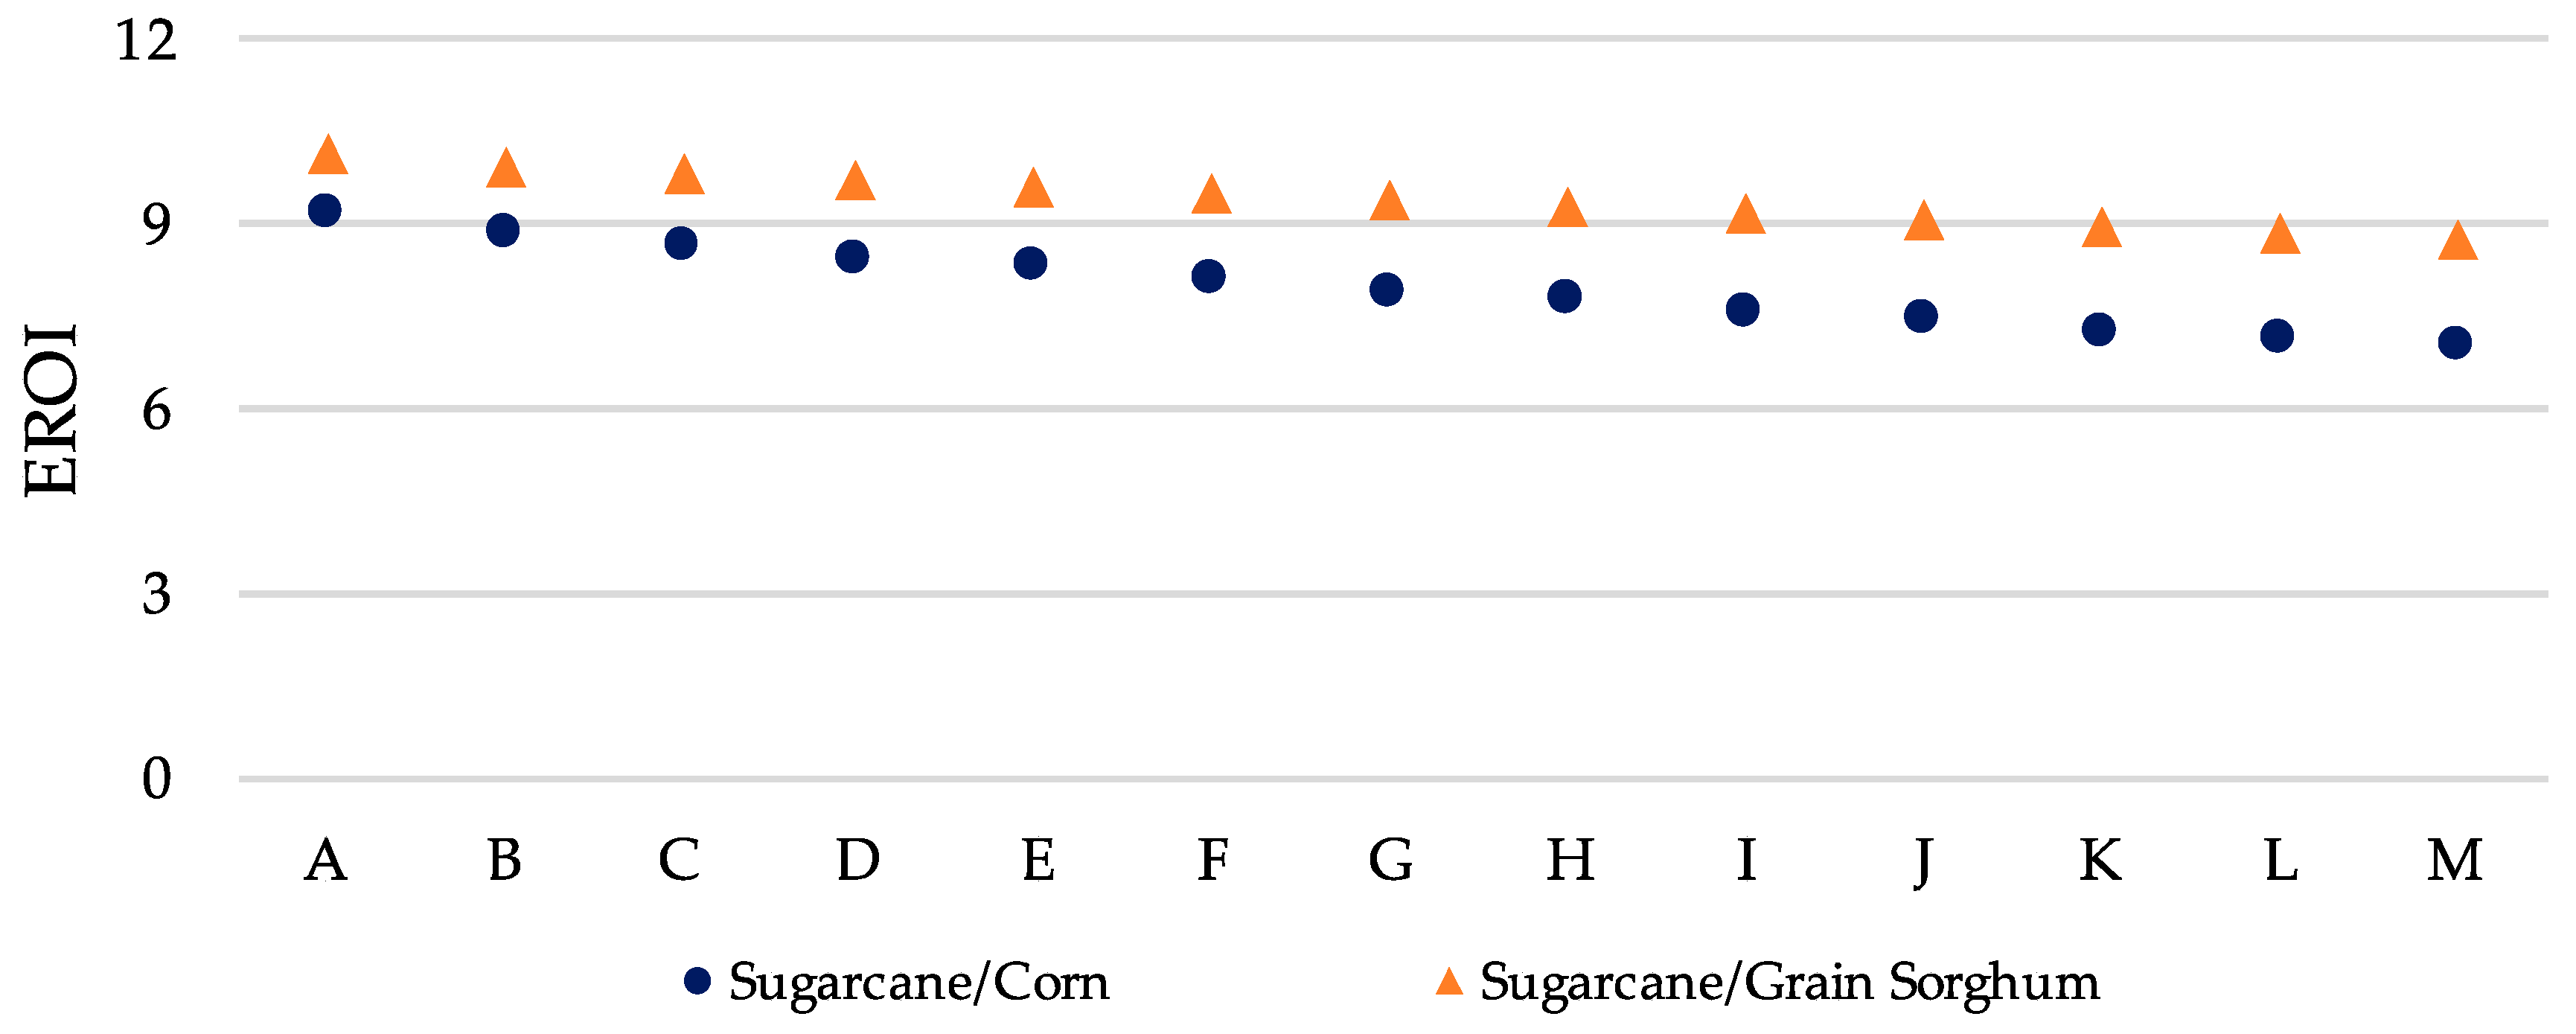
5.1.1. Energy Assessment: EROI

According to Figure 2, the production of 1.0 m3 hydrate demands of 1850, 3118 and 2471 MJ of NRF if produced from sugarcane, corn, and grain sorghum respectively. For all productive systems, the highest consumption stages were transport (especially of feedstocks and vinasse between the plantation and processing plant), with contributions of 77%, 60%, and 76% for sugarcane, corn, and grain sorghum, respectively. The manufacture of inputs were also significant. The production of fertilizers and lime accounted for 21% of the total NRF for sugarcane ethanol. For corn ethanol, apart from fertilizers, the most relevant inputs were glyphosate and atrazine, both herbicides, with 36% of the total fossil energy demand. Grain sorghum ethanol showed a similar profile with 19% of NRF being attributed to the production of urea, glyphosate, and atrazine.
Since ethanol has the same physical characteristics regardless of the agricultural feedstock, its energy content is strictly the same. Therefore, variations among EROIs obtained by each system (Table 3) are justified by the NFR demands, which are 40% and 25% lower for sugarcane ethanol in comparison to corn and grain sorghum (Figure 2).
The EROI of sugarcane ethanol produced in Brazil was estimated in different studies following the life cycle approach [11,12,13,14]. Some of the values described in the literature that were obtained from assumptions similar to ours were 7.52 [12], 8.84 [13], and 2.63 [14], albeit with a large energy input for infrastructure construction. The production process of this study’s multipurpose plant may have performed better because it ignores infrastructural aspects and occurs considering newer technology. Moreover, this case study has been conducted in a region where sugarcane production is only now expanding, which may result in above-average performance.
Similar studies have been performed to survey corn ethanol EROI produced by dry milling technology, especially in the United States [15,16,17,34]. The results, of 1.38 [15], 1.62 [16], and 0.844 [17] indicate no renewable energy return on fossil energy used in the process. Once again, the EROI obtained for these situations takes into account the energy consumed for the construction of capital goods and as field labor. Compared to corn ethanol obtained in the multipurpose plant, the energy returns from ethanol processes in the US are lower because those studies admitted the use of natural gas to supply the energy requirements in the industrial stage and power from the US grid.
The same behavior was observed for grain sorghum ethanol produced in the US. The authors considered two energy supply scenarios for the industrial stage [18]: (i) natural gas from fossil fuels as a source of thermal energy, as well as electricity from the grid; and (ii) renewable-origin natural gas (from anaerobic digestion of animal waste) to feed a cogeneration system, and produce heat and electricity. Thus, the system using fossil natural gas had EROI = 2.00 and the alternative adopting cogeneration from biogas achieved EROI = 4.90. Nevertheless, the results are much lower that of the Mato Grosso Flex Mill.
The renewable energy incorporated into biomass during cultivation was also estimated. For the production of 1.0 m3 ethanol, the sugarcane absorbed 57,908 MJ, whereas for corn and sorghum the rates are 37,432 MJ and 37,909 MJ, respectively. Sugarcane is one of the most efficient energy crops because of its potential for photosynthetic conversion. Moreover, this biomass is widely reused, so the amount consumed in the manufacturing stage is higher compared to corn and grain sorghum [8].

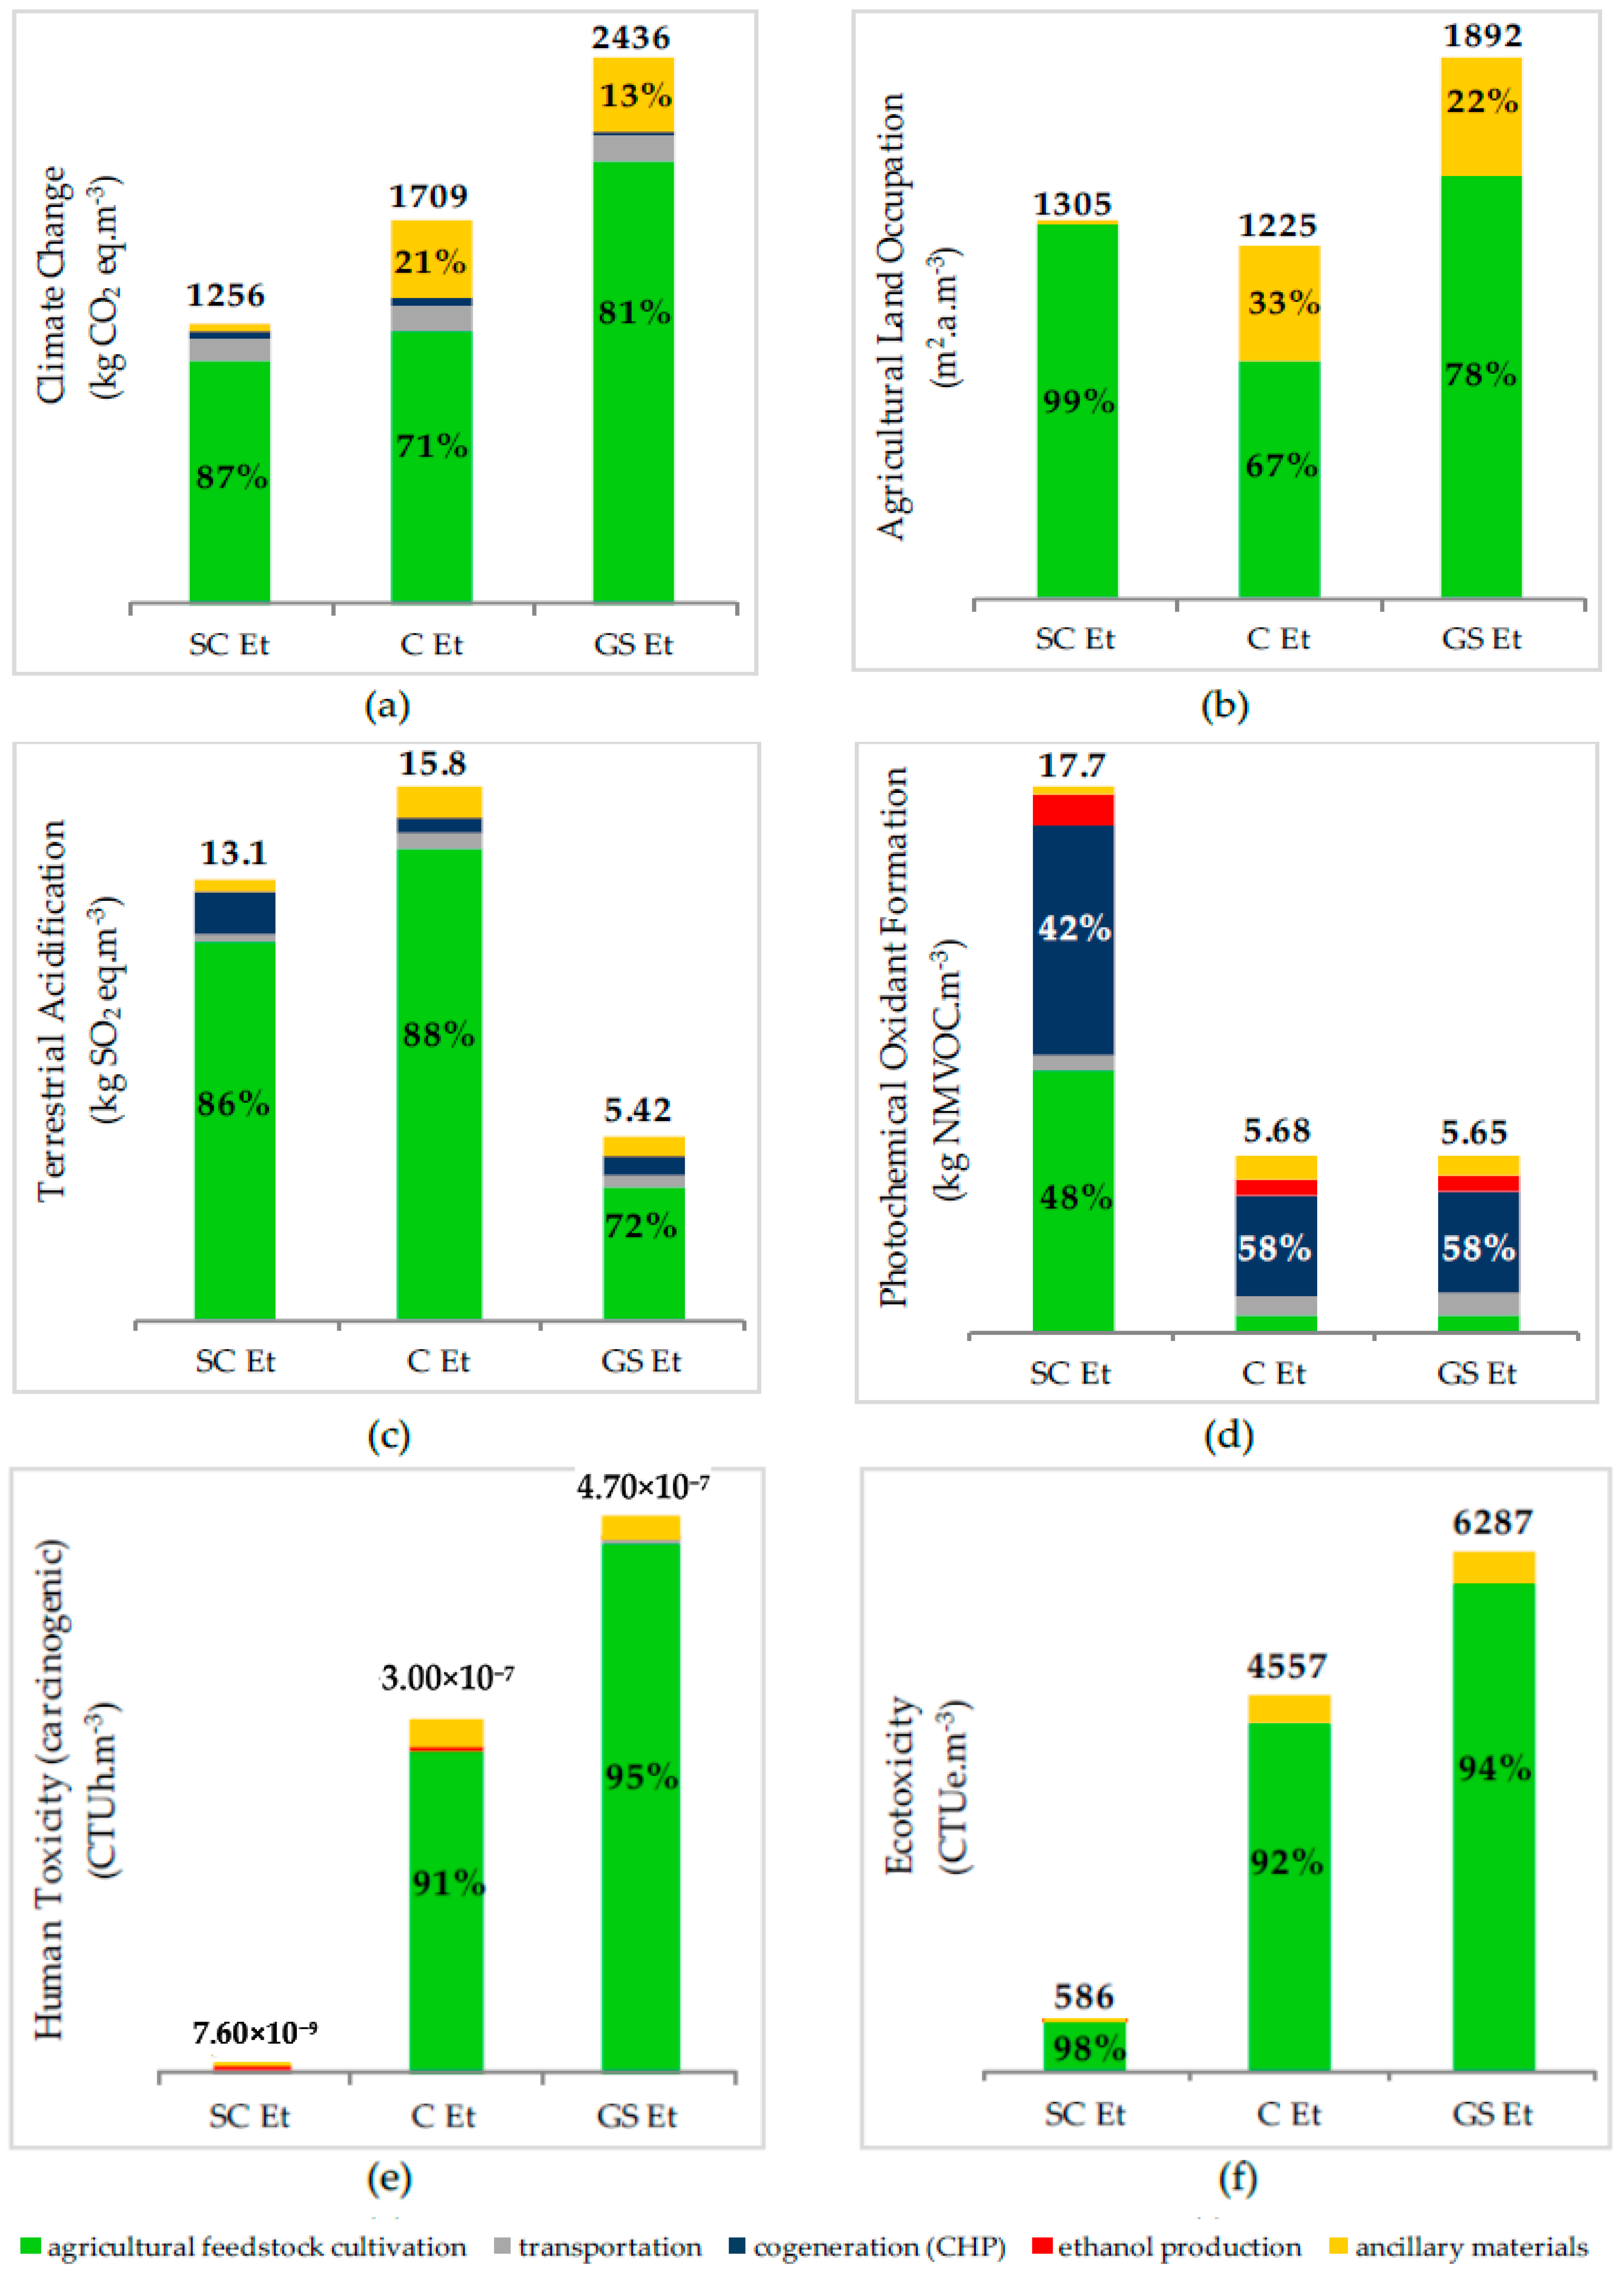
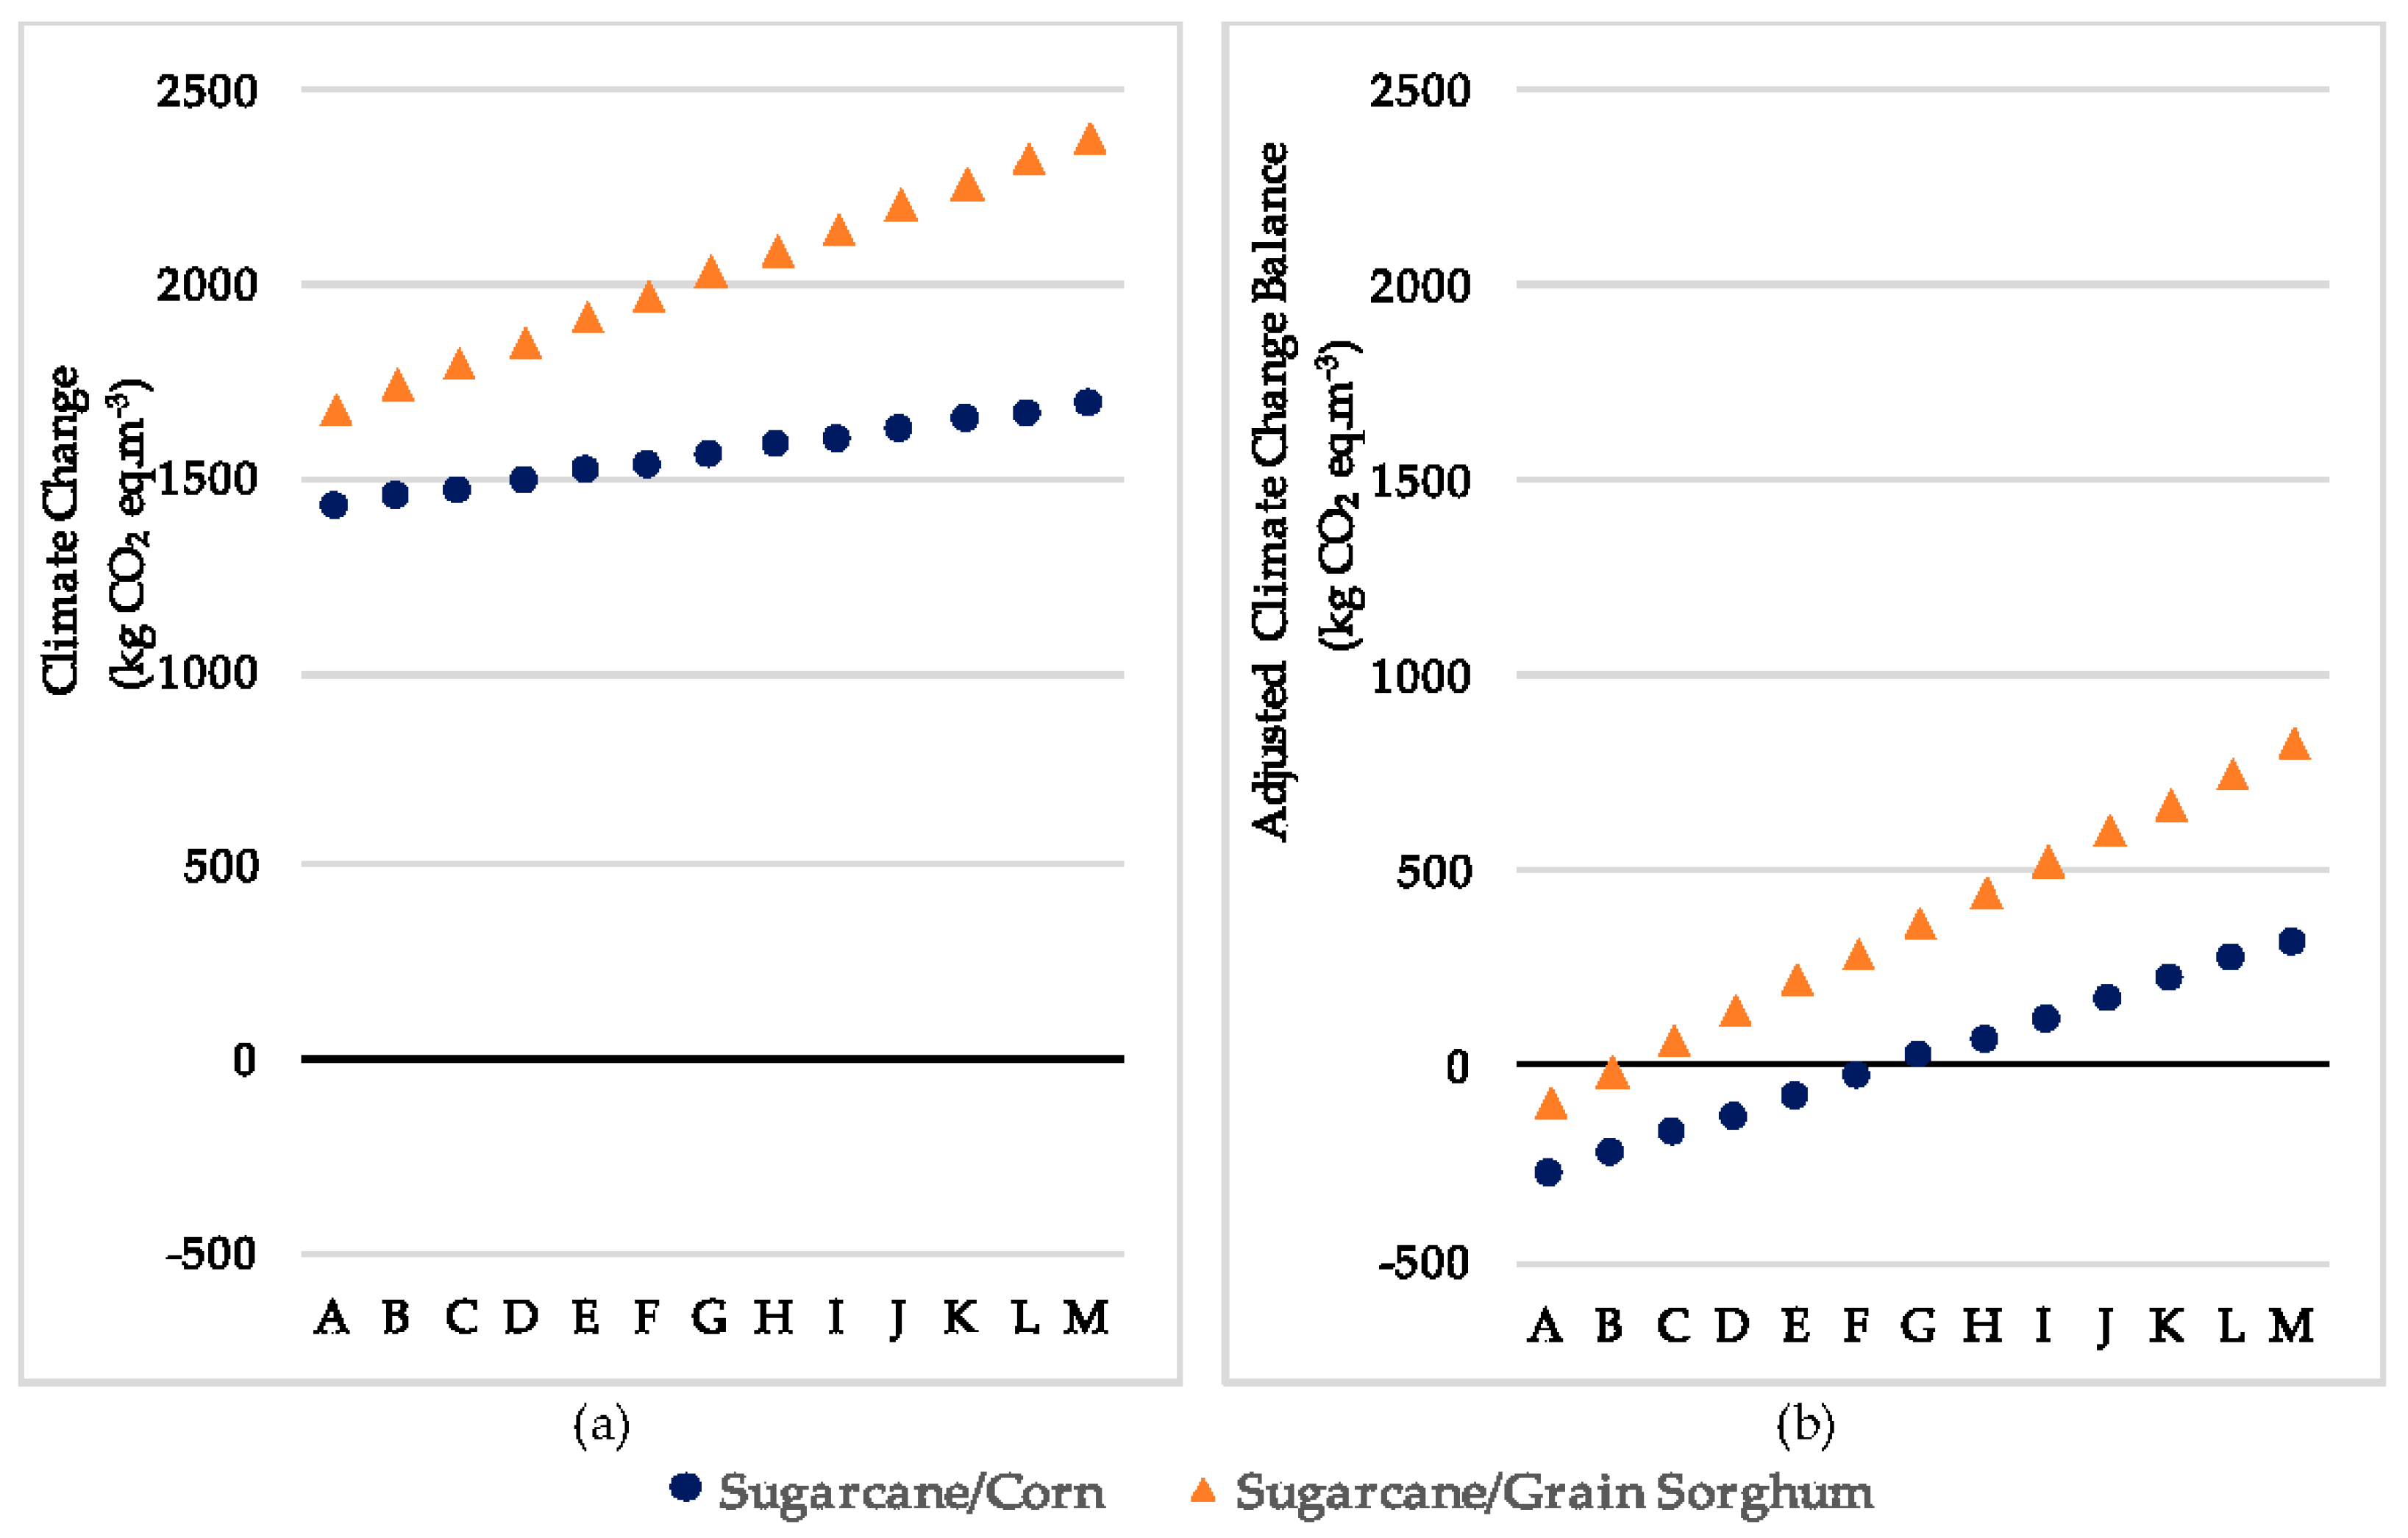
5.1.2. Climate Change

Concerning Climate Change (CC), the sugarcane ethanol had the best performance, followed by corn and sorghum ethanol. For all raw-material alternatives, the agricultural stage was responsible for most emissions (Figure 3a). Figure 4 indicates that CO2 emissions caused by dLUC had great influence on the results. About 910 kg CO2 eq·m−3 (72% of the total impact) are caused by culture expansion in the state in the last 20 years. Sugarcane ethanol production emitted 350 kg CO2 eq·m−3, mainly due to fossil CO2 (transport activities necessary in the use of fertilizers and other agricultural operations), N2O (N-fertilizer emissions) and biogenic CH4 (biomass burning).
For the production of corn ethanol, 1.26 t CO2 eq·m−3 (74% of impact) are due to dLUC (Figure 4), either because of corn or eucalyptus used for cogeneration. Moreover, emissions of fossil CO2 (transport and mechanized activities in the agricultural stage), and N2O (production and use of N-fertilizer) also contribute to CC. Grain sorghum had the worst performance for this category. As in other cases, the emissions from dLUC were prominent (84% of the total) caused by the cultivation of both sorghum and eucalyptus. The remaining emissions (360 kg CO2 eq·m−3) took place mainly in the form of fossil CO2 and N2O in the same process used for corn ethanol.
The choice of the dLUC estimation method has a marked effect on CC results [19]. Other studies evaluating the production of ethanol used the same models to calculate dLUC emissions, but with different geographic coverage [19,20]. CC emissions for the production of sugarcane ethanol in Brazil and corn in the US considering dLUC at the national level were estimated at 825 kg CO2 eq·m−3 for both feedstocks. Expansion of forest culture was identified for sugarcane, and no dLUC was verified for corn [19]. In the state of Sao Paulo, dLUC are responsible for 1.40 t CO2 eq·m−3 sugarcane ethanol [20]. CC was also influenced by the use of specific local data to determine dLUC, even if those came from statistical databases.

Considerations about the Carbon Balance

The results for CC are directly related to the methodology. The method ReCiPe follows the approach provided by the Intergovernmental Panel on Climate Change (IPCC) and does not consider carbon emissions from biogenic sources, or even the carbon fixed by biomass throughout the product life cycle. To verify the effects of these neglected portions, CC emissions were adjusted as presented in Table 4.
When considering emission biogenic carbon dioxide (CO2,b) and carbon dioxide fixation (CO2,fix), fuel produced from sugarcane has a favorable balance in terms of greenhouse gases (GHG) (−725 kg CO2 eq·m−3). This occurs because the rate of CO2,fix is greater than all the GHG emissions, even including CO2,b. For corn and grain sorghum, the opposite is the case. The fixations of CO2 in the agricultural stage were not enough to offset the effects of both non-biogenic (accumulated value) and biogenic emissions.
It should be noted that, in the case of the co-products where ethanol is produced from starchy sources (ethanol, fusel oil, DDGS and vinasse), the GHG emissions and the fixation of CO2 associated with the system are shared, and therefore their effect is attenuated. It should also be said that these results are related to the scope of the study. Because it is a cradle-to-gate approach, biogenic emissions from ethanol use are not quantified.

5.1.3. Agricultural Land Occupation

The Agricultural Land Occupation is influenced by the productivity of crops and by duration of occupation and therefore their agricultural cycle. Analyzing the performance of each alternative, the results indicate the occupation of 1305 m2·a of agricultural area for each 1.0 m3 sugarcane ethanol produced, 1220 m2·a·m−3 corn ethanol and 1892 m2·a·m−3 grain sorghum ethanol. As to be expected, the agricultural stage accounted for most of these results (Figure 3b). For sugarcane, it is responsible by almost the entire occupation, whereas for corn and grain sorghum the contributions were of 33% and 22%, respectively, due to the use of eucalyptus as a power source. Corn ethanol showed the best performance in this category, with a good balance between agricultural and industrial productivity. In contrast, the low agricultural productivity of grain sorghum ethanol (3.83 t·ha−1) was crucial for the result obtained in the category.

5.1.4. Terrestrial Acidification

This category aims to evaluate the potential negative effects resulting from the reduction of pH in ecosystems, which may occur by increased atmospheric concentrations of, i.e., sulfur and nitrogen oxides (SOx, SO2, and NOX) and ammonia (NH3). As shown in Figure 3c, grain sorghum had the best performance for this impact, followed by sugarcane and corn. For all three, the agricultural stage had the greatest influence on performance, contributing 86%, 88%, and 72% respectively for sugarcane, corn, and grain sorghum. The main contributions come from emissions NH3 and NOx from the use of N-fertilizers in the field. The cogeneration also had some influence on sugarcane and grain sorghum ethanol (10% of the total impacts) due to its losses of SOx and NOx from burning of biomass.

5.1.5. Photochemical Oxidants Formation

This category evaluates the potential for oxidation of volatile organic compounds and other substances under the influence of sunlight, resulting mainly in the formation of tropospheric ozone (O3) which may compromise animal and vegetable organic compounds or materials exposed to air.
Sugarcane ethanol had the worst performance in terms of Photochemical Oxidants Formation (Figure 3d). Its major contributions are attributed to the agricultural stage (48%) and the cogeneration (42%). The main precursors in this case are CO and NOX, especially from burning straw—which occurs in 75% of the cultivation area—and the burning of bagasse in cogeneration. Between corn and grain sorghum, performances were similar, and very much influenced by cogeneration (58% for both cases). The transportation activities also stood out in this case.

5.1.6. Human Toxicity (Carcinogenic) and Ecotoxicity

The method used in this case evaluates the interactions between the various emitted substances that are potentially toxic to ecosystems or human health. Human toxicity considers the exposures to toxic agents in terms of inhalation and ingestion of water and food. Results are expressed in terms of Comparative Toxic Units (CTUh), a standard unit for comparison of different kinds of emissions [54].
The performances shown in Figure 3e,f, show that grain sorghum had the worst results, followed by corn and sugarcane. For Human Toxicity, atrazine accounted for 91% of impacts for corn and 95% for sorghum. In the sugarcane ethanol system, about 51% of impacts of toxic substances are due to agricultural inputs such as agrochemicals (mainly glyphosate) and fertilizer (especially urea).
For Ecotoxicity, the agricultural stages had the highest effect on the results for the three processes—with 98% contributions for sugarcane, 92% for corn and 94% for sorghum—because of pesticide use. In the production of sugarcane, application of substances such as fipronil, sulfentrazone and hexazinone had an impact on the results. In contrast, atrazine accounted for 72% and 83% of the result in this category in the production of corn and grain sorghum, respectively.

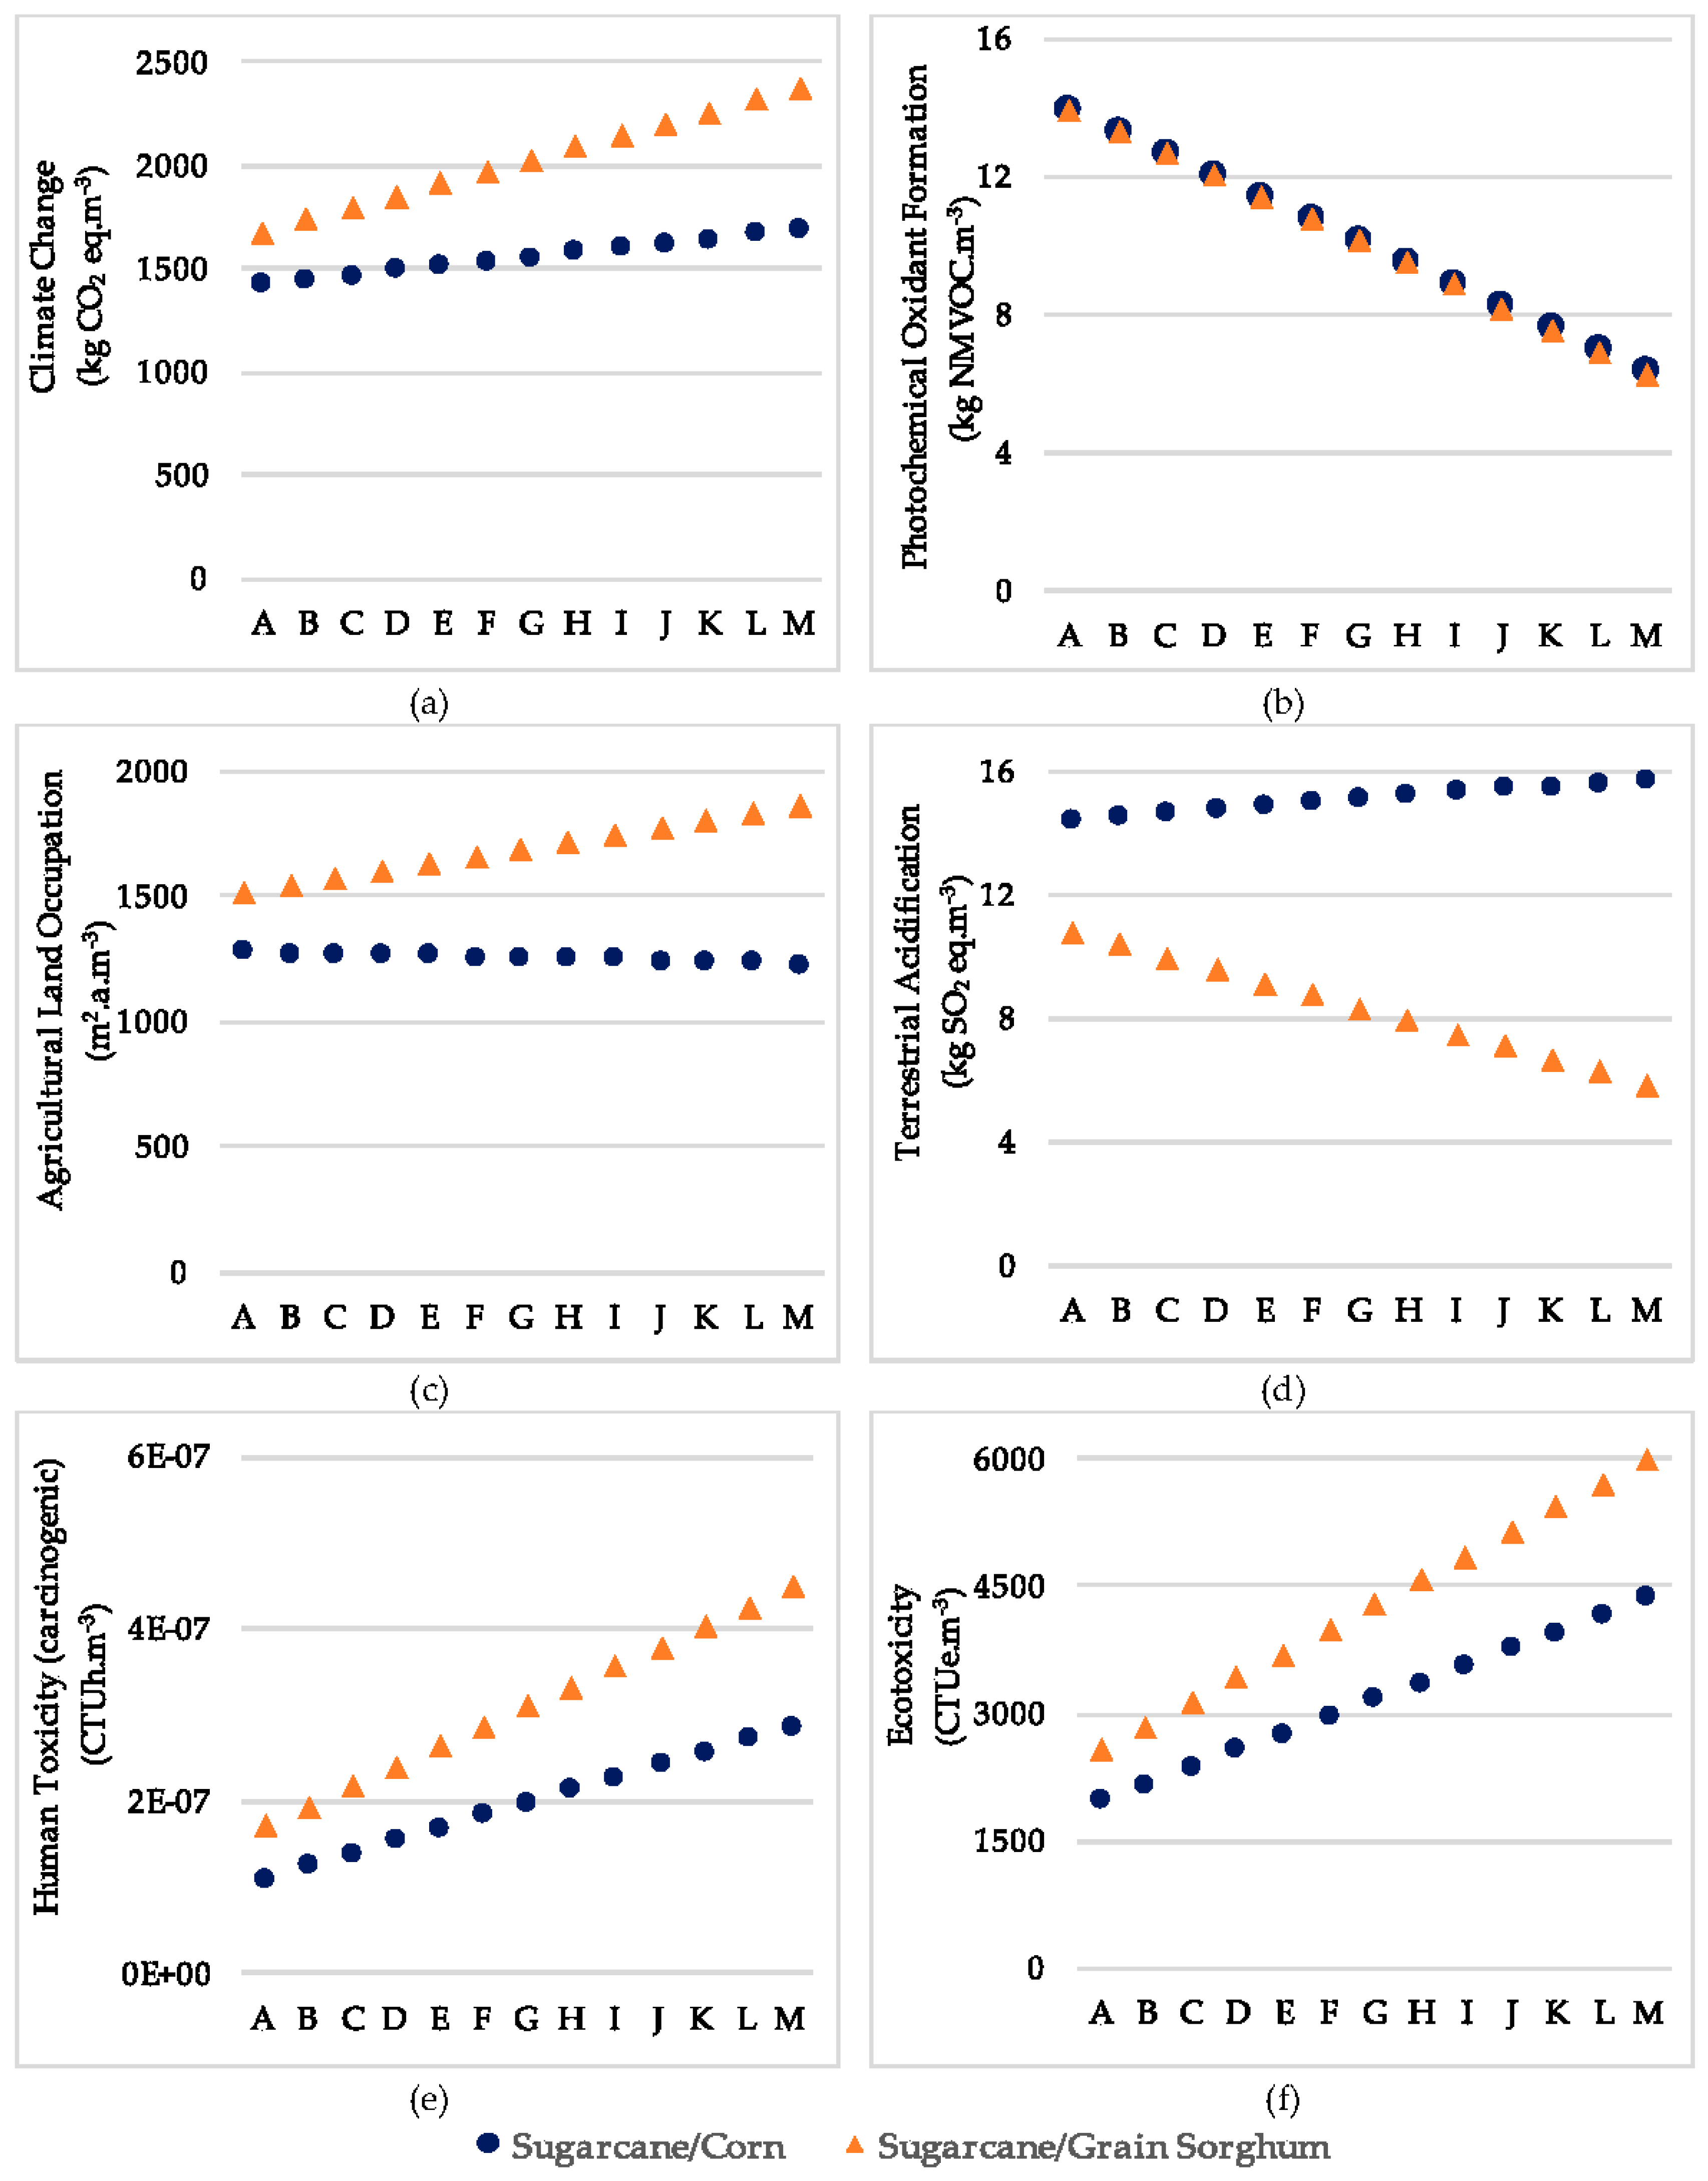
5.2. Evaluation of Process Integration Scenarios in the Multipurpose Plant

The main characteristic of the multipurpose plant is to reuse part of the sugarcane processing plant to produce a supplementary amount of ethanol from starchy sources during the same season. In this study, the integration scenarios consider that starchy ethanol must start being obtained as soon as the processing of sugarcane ethanol is completed in order to prolong the annual fuel production. Thus, process integration occurs at two points: (i) the supplementation of raw materials for the process; and (ii) the use of surplus sugarcane bagasse as fuel for cogeneration in the starchy ethanol production. Although only surplus bagasse is insufficient to meet this demand, the consumption of external fuel sources (wood chips) is reduced.
Once the agricultural production of grain sorghum was considered marginal compared to the corn [36], the possibility of integrating all the feedstocks was discarded. Therefore, only two situations have been evaluated: (i) sugarcane + corn; and (ii) sugarcane + sorghum. Each situation was stratified in scenarios according to specific feedstock addition ratios. Scenario A—comprising the maximum participation of sugarcane ethanol—has already been implemented in the region [5,7]. Alternative scenarios (from B to M), with increasing participation of starch-based ethanol over a year, were assessed in order to support future decision-making. Table 5 depicts the scenarios for the integrated production of ethanol in terms of feedstocks contribution and the consumption of biomass for energy generation. To establish these arrangements, we assumed: (i) an annual ethanol production of 70,660 m3; (ii) only 218 days of operation with sugarcane, due to harvesting restrictions; (iii) operation with corn or sorghum occurring for up to 330 days as they can be stored for long periods; and (iv) the maintenance activities shut down the unit for 30 days a year.
Based on the individual results of the production of ethanol from different feedstocks and considering the feasibility for integration provided by the multipurpose plants, this study sought to determine the energy and environmental performance of the production of hydrate ethanol in a unit in continuous production, using two different raw materials. Each scenario indicated in Table 5 and Figure 5 was evaluated in terms of energy through EROI.
Completion of production from grain sorghum has better EROI results than corn. Moreover, the figures show worsening of performance as the percentage of ethanol from starchy sources goes up. This is mainly caused by the distances traveled by feedstocks to the mill and vinasse to the field (202 km for corn versus 22 km for sugarcane) and the fossil fuel to produce N-fertilizers. The production of larger amounts of starchy ethanol results in greater NRF and, thus, the EROI values are reduced gradually.
Integrations have also been evaluated in terms of environmental impacts caused by emissions and changes in the physical environment. These results are depicted in Figure 6. For Climate Change (Figure 6a), the precursors are GHG emissions from fossil fuels and CO2 from direct LUC. The performance of the integration scenarios worsens as the ethanol production from starchy sources increases. This tendency can be explained by the expansion of the sorghum and corn crops in recent years, coupled with their low agricultural productivities.
Additionally, increasing GHG emissions related to the long distance transport of feedstocks and vinasse. Integration between corn and sugarcane has been previously studied in terms of GHG emissions in a condition similar to this study, and the results indicated worse performance because of the increased participation of corn as raw material. The scenarios, which consider only sugarcane, had the lowest GHG emissions [8].
The opposite was true for Photochemical Oxidant Formation (Figure 6b). As the proportion of starchy ethanol increases, so does the performance of integration scenarios. Still, the results showed no significant differences between corn and grain sorghum. This behavior suggests a strong influence of carbon monoxide (CO) and NOx emissions associated with the burning of straw during harvesting (9.30 and 6.10 kg NMVOC eq·m−3, kilograms of Non-methane volatile organic compounds equivalent per cubic meter) since the performance of industrial activities (cogeneration) is similar for all the materials in this case.
For Agricultural Land Occupation (Figure 6c), sugarcane and corn integration scenarios are virtually independent of their ratio. This is because low agricultural productivity is compensated by a high industrial productivity (362 L·t−1 corn), unlike sugarcane ethanol. In the case of grain sorghum, agricultural productivity is lower.
Results from Figure 6d indicated that the integration scenarios present opposite trends in the Terrestrial Acidification indicator according to the starchy source. Although there is a reduction in emissions from burning as the proportion of sugarcane ethanol decreases, corn cultivation leads to increasingly higher NH3 emissions (4.50 kg·t−1) because of the fertilization with urea. On the other hand, NH3 losses in the cultivation of grain sorghum (1.20 kg·t−1) are comparatively less significant, so that Terrestrial Acidification decreases as more ethanol is produced from this feedstock.
Figure 6e,f shows similar trends for Human Toxicity (carcinogenic) and Ecotoxicity. Although less agrochemicals are consumed in the cultivation of corn and grain sorghum than with sugarcane, the quantities are much higher. Moreover, the impact caused by the herbicide atrazine (290 g·t−1 corn and 350 g·t−1 sorghum) must be taken into account. Consequently, integration scenarios with the highest percentage of ethanol from starchy sources showed worse performance. Still, the biggest consumer of agrochemicals combined with a worse agricultural productivity caused the scenarios involving grain sorghum to yield worse results compared to corn.
As with the individual analysis of each feedstock, integration scenarios were also evaluated through Adjusted Climate Change Balance, incorporating the influence of biogenic emissions of CO2 and its fixation by biomass (Figure 7). Although the CO2,fix is high in the cultivation of corn and grain sorghum, the conversion efficiency of these starchy sources in ethanol requires less feedstock to produce the same amount of fuel, thus reducing the impact of the agricultural stage on the results. Moreover, the effects of burning wood chips can be disregarded, since it is a grown feedstock used for energy purposes, and the CO2,fix of the agricultural stage is emitted later, when it is burned in the boiler.

6. Conclusions

The Life Cycle Assessment technique proved to be appropriate to evaluate the environmental effects of the integrated production of ethanol from sugarcane, corn, and grain sorghum in a systemic and comprehensive way.
The environmental performance of the analyzed scenario is dependent on emissions of the industrial stage of ethanol production, and, above all, in the agricultural cultivation of the feedstocks. Results also indicate that the environmental and energy performance of ethanol production from sugarcane has a strong bearing on the behavior of integration scenarios for most of the impact categories considered. The low agricultural productivity of corn and grain sorghum was relevant for the categories of Agricultural Land Occupation, Human Toxicity (carcinogenic) and Ecotoxicity.
The integration scenarios showed increasing impacts for Climate Change, Human Toxicity (carcinogenic) and Ecotoxicity due to the successive additions of starchy raw materials to replace sugarcane. Taking into account the most relevant contributions for each category and seeking to reverse these incremental trends, we suggest that the following actions be explored in detail: (i) to install corn and sorghum crops in nearby areas (starting at 50 km); (ii) to carry out these crops in long (over 20 years) deforested areas; and (iii) to replace the agrochemicals used in the corn or sorghum crops (particularly atrazine) with less impacting substitutes. Reductions in Photochemical Oxidant Formation and in the EROI have been observed as the proportion of ethanol from starchy sources increases. Regarding Agricultural Land Occupation, the sugarcane-corn scenarios are independent of their ratio. Conversely, the integration scenarios present opposite trends for Terrestrial Acidification according to the starchy source.
The results obtained—particularly with regard to the performances of the different integration scenarios—support an expansion of the scope of this academic research. As an immediate (and even natural) consequence of these findings, the investigation proceeds to verify the environmental and energy effects of the supply of ethanol for a longer period. Such an analysis must take place under the consequential approach of LCA to be conclusive, and the definition of market reorganization scenarios for this case should be based on sound criteria.
Finally, in order for the processing of bioethanol to develop under conditions of sustainable equilibrium in the state of Mato Grosso, other issues as significant as those of an environmental nature must still be considered. These occur in the economic and, especially, in the social domains, particularly with regard to the labor conditions provided to professionals working in the region.

Supplementary Materials

The following are available online at www.mdpi.com/2079-9276/6/1/1/s1, Table S1: Sugarcane production inventory (1.0 m3 hydrate ethanol), Table S2: Sugarcane ethanol production inventory (1.0 m3 hydrate ethanol), Table S3: Corn production inventory (1.0 m3 hydrate ethanol), Table S4: Corn ethanol production inventory (1.0 m3 hydrate ethanol), Table S5: Grain sorghum production inventory (1.0 m3 hydrate ethanol), Table S6: Grain sorghum ethanol production inventory (1.0 m3 hydrate ethanol).

Acknowledgments

Alex Nogueira would like to thank the Coordination for the Improvement of Higher Education Personnel (CAPES) for a doctoral scholarship. Luiz Kulay also would like to thank CAPES for the financial support granted to conduct this study, provided through the project CAPES/FCT 2012—n. 350/13.

Author Contributions

L.K. conceived and designed the experiments; A.D. and A.N. performed the calculations; A.D., A.N., P.M. and L.K. analyzed the data; A.D. and A.N. wrote the paper with contributions from P.M. and L.K.

Conflicts of Interest

The authors declare no conflict of interest.

References

  1. ANP—Agencia Nacional de Petroleo, Gas Natural e Biocombustiveis. Anuario Estatistico Brasileiro do Petroleo, Gas Natural e Biocombustiveis 2016. Available online: http://www.anp.gov.br/?pg=82260 (accessed on 9 August 2016).
  2. EPE—Empresa Brasileira de Pesquisa Energetica. Balanco Energetico Nacional 2016: Relatorio Sintese ano Base 2015. Available online: https://ben.epe.gov.br/default.aspx?anoColeta=2016 (accessed on 9 August 2016).
  3. Iglesias, C.; Sesmero, J.P. Economic Analysis of Supplementing Sugarcane with Corn for Ethanol Production in Brazil: A Case Study in Uberaba. Bioenergy Res. 2015, 8, 627–643. [Google Scholar] [CrossRef]
  4. Menezes, T.J.D.B. Etanol, O Combustível do Brasil; Editora Agronômica Ceres: São Paulo, Brasil, 1980. [Google Scholar]
  5. Souza, W.A.R.; Goldsmith, P.; Martines Filho, J.G.; Rasmussen, R.L. Bioenergy Efficiency and a Flex-Mill Simulation in Mato Grosso. In Proceedings of the 48° Congresso SOBER Sociedade Brasileira de Economia Administracao e Sociologia Rural, Campo Grande, Brasil, 25–28 July 2010.
  6. Wang, D.; Bean, S.; McLaren, J.; Seib, P.; Madl, R.; Tuinstra, M.; Shi, Y.; Lenz, M.; Wu, X.; Zhao, R. Grain sorghum is a viable feedstock for ethanol production. J. Ind. Microbiol. Biotechnol. 2008, 35, 313–320. [Google Scholar] [CrossRef] [PubMed]
  7. Goldsmith, P.D.; Rasmussen, R.; Signorini, G.; Martines, J.; Guimaraes, C. The Capital Efficiency Challenge of Bioenergy Models: The Case of Flex Mills in Brazil. In Handbook of Bioenergy Economics and Policy; Khanna, M., Scheffran, J., Zilberman, D., Eds.; Springer: New York, NY, USA, 2010; pp. 175–192. [Google Scholar]
  8. Milanez, A.Y.; Nyko, D.; Valente, M.S.; Xavier, C.E.O.; Kulay, L.A.; Donke, A.C.G.; Matsuura, M.I.S.F.; Ramos, N.P.; Morandi, M.A.B.; Bonomi, A.M.F.L.J.; et al. A produção de etanol pela integracao do milho-safrinha as usinas de cana-de-acucar: Avaliacao ambiental, economica e sugestoes de politica. Rev. BNDES 2014, 41, 147–207. [Google Scholar]
  9. Nogueira, A.R.; Donke, A.C.G.; Matsuura, M.I.S.F.; Matai, P.H.S.; Kulay, L. Use of Environmental and Thermodynamic Indicators to Assess the Performance of an Integrated Process for Ethanol Production. Environ. Nat. Resour. Res. 2014, 4, 59–74. [Google Scholar] [CrossRef]
  10. Susmozas, A.; Irribarren, D.; Dufour, J. Assessing the Life-Cycle Performance of Hydrogen Production via Biofuel Reforminng in Europe. Resources 2015, 4, 398–411. [Google Scholar] [CrossRef]
  11. Triana, C.A.R. Energetics of Brazilian ethanol: Comparison between assessment approaches. Energy Policy 2011, 39, 4605–4613. [Google Scholar] [CrossRef]
  12. Macedo, I.C.; Seabra, J.E.A.; Silva, J.E.A.R. Greenhouse gases emissions in the production and use of ethanol from sugarcane in Brazil: The 2005/2006 averages and a prediction for 2020. Biomass Bioenergy 2008, 32, 582–595. [Google Scholar] [CrossRef]
  13. Boddey, R.M.; Soares, L.H.B.; Alves, B.J.R.; Urquiaga, S. Bio-Ethanol Production in Brazil. In Biofuels, Solar and Wind as Renewable Energy Systems; Pimentel, D., Ed.; Springer: New York, NY, USA, 2008; pp. 321–356. [Google Scholar]
  14. Pimentel, D.; Patzek, T.W. Ethanol Production: Energy and Economic Issues Related to U.S. and Brazilian Sugarcane. In Biofuels, Solar and Wind as Renewable Energy Systems; Pimentel, D., Ed.; Springer: New York, NY, USA, 2008; pp. 357–371. [Google Scholar]
  15. Shapouri, H.; Duffield, J.A.; Wang, M. The Energy Balance of Corn Ethanol: An Update; United States Department of Agriculture: Washington, DC, USA, 2002.
  16. Kim, S.; Dale, B.E. Life cycle assessment of various cropping systems utilized for producing biofuels: Bioethanol and biodiesel. Biomass Bioenergy 2005, 29, 426–439. [Google Scholar] [CrossRef]
  17. Pimentel, D.; Patzek, T.W. Ethanol Production Using Corn, Switchgrass, and Wood; Biodiesel Production Using Soybean and Sunflower. Nat. Resour. Res. 2005, 14, 65–76. [Google Scholar] [CrossRef]
  18. Cai, H.; Dunn, J.B.; Wang, Z.; Han, J.; Wang, M.Q. Life-cycle energy use and greenhouse gas emissions of production of bioethanol from sorghum in the United States. Biotechnol. Biofuels 2013, 6, 1–15. [Google Scholar] [CrossRef] [PubMed]
  19. Munoz, I.; Flury, K.; Jungbluth, N.; Rigarlsford, G.; Canals, L.M.; King, H. Life cycle assessment of bio-based ethanol produced from different agricultural feedstocks. Int. J. Life Cyle Assess. 2014, 19, 109–119. [Google Scholar] [CrossRef]
  20. Guerra, J.P.M.; Colete, J.R., Jr.; Arruda, L.C.M.; Silva, G.A.; Kulay, L. Comparative analysis of electricity cogeneration scenarios in sugarcane production by LCA. Int. J. Life Cyle Assess. 2014, 19, 814–825. [Google Scholar] [CrossRef]
  21. Curran, M.A. Life Cycle Assessment Handbook: A Guide for Environmentally Sustainable Products; Willey; Scrivener: Cincinnati, OH, USA, 2012. [Google Scholar]
  22. Guinee, J.B.; Haes, H.A.U.; Huppes, G. Quantitative life cycle assessment of products 1: Goal definition and inventory. J. Clean. Prod. 1993, 1, 3–13. [Google Scholar] [CrossRef]
  23. Hellweg, S.; Canals, L.M. Emerging approaches, challenges and opportunities in life cycle assessment. Science 2014, 344, 1109–1113. [Google Scholar] [CrossRef] [PubMed]
  24. UNEP—United Nations Environment Programme. Why Take a Life Cycle Approach? United Nations Environment Programme: Nairobi, Kenya, 2004. [Google Scholar]
  25. Heijungs, R.; Guinee, J.B. An overview of the Life Cycle Assessment Method—Past, Present, and Future. In Life Cycle Assessment Handbook: A Guide for Environmentally Sustainable Products; Curran, M.A., Ed.; Willey; Scrivener: Cincinnati, OH, USA, 2012. [Google Scholar]
  26. ISO—International Organization for Standardization. ISO 14044. Environmental Management—Life Cycle Assessment—Requirements and Guidelines; International Organization for Standardization: Geneva, Switzerland, 2006. [Google Scholar]
  27. CONAB—Companhia Brasileira de Abastecimento. Acompanhamento da Safra Brasileira de Graos. V3. Safra 2015/16. N. 12. 2016. Available online: http://www.conab.gov.br (accessed on 10 August 2016). [Google Scholar]
  28. IBGE—Instituto Brasileiro de Geografia e Estatistica. Indicadores Sociais Municipais: Uma Analise dos Resultados do Universo do Censo Demográfico, 2010. Available online: http://biblioteca.ibge.gov.br/visualizacao/livros/liv54598.pdf (accessed on 7 December 2016).
  29. UNDP—United Nations Development Programme. Atlas do Desenvolvimento Humano no Brasil; Fundação João Pinheiro; Instituto de Pesquisa Econômica Aplicada (IPEA): Belo Horizonte, Brasil, 2013.
  30. Domingues, M.S.; Bermann, C. O arco de desflorestamento na Amazonia: Da pecuaria a soja. Ambiente Soc. 2012, 15, 1–22. [Google Scholar] [CrossRef]
  31. IBAMA—Instituto Brasileiro de Meio Ambiente e dos Recursos Naturais Renovaveis. Relatorios de Comercializacao de Agrotoxicos. Available online: http://www.ibama.gov.br/areas-tematicas-qa/relatorios-de-comercializacao-de-agrotoxicos/tudo (accessed on 14 July 2016).
  32. UNEP—United Nations Environment Programme. Global Guidance Principles for Life Cycle Assessment Databases: A Basis for Greener Processes and Products; United Nations Environment Programme: Nairobi, Kenya, 2011. [Google Scholar]
  33. Frischknecht, R.; Jungbluth, N.; Althaus, H.J.; Doka, G.; Dones, R.; Hischier, R.; Hellweg, S.; Humbert, S.; Margni, M.; Nemecek, T.; et al. Implementation of Life Cycle Impact Assessment Methods: Data v2.0.; Ecoinvent Report No. 3; Swiss Centre for Life Cycle Inventories: Dubendorf, Switzerland, 2007. [Google Scholar]
  34. Hammerschlag, R. Ethanol’s Energy Return on Investment: A Survey of the Literature 1990-Present. Environ. Sci. Technol. 2006, 40, 1744–1750. [Google Scholar] [CrossRef] [PubMed]
  35. CONAB—Companhia Brasileira de Abastecimento. Series Historicas. Series Historicas de Area Plantada, Produtividade e Producao, Relativas as Safras 2005/06 a 2014/15 de Cana-de-Acucar. Available online: http://www.conab.gov.br (accessed on 14 July 2016).
  36. Borghi, E.; Crusciol, C.A.C.; Nascente, A.S.; Sousa, V.V.; Martins, P.O.; Mateus, G.P.; Costa, C. Sorghum grain yield, forage biomass production and revenue as affected by intercropping time. Eur. J. Agron. 2013, 51, 130–139. [Google Scholar] [CrossRef]
  37. Rodigheri, H.R.; Pinto, A.F.; Dhlson, J.C. Custo de Producao, Produtividade e Renda do Eucalipto Conduzido para uso Multiplo no Norte Pioneiro do Estado do Parana; Circular Tecnica 51 Embrapa: Colombo, Sri Lanka, 2001. [Google Scholar]
  38. Granda, C.B.; Zhu, L.; Holtzapple, M.T. Sustainable Liquid Biofuels and Their Environmental Impact. Environ. Prog. 2007, 26, 233–250. [Google Scholar] [CrossRef]
  39. Nemecek, T.; Kagi, T. Life Cycle Inventories of Agricultural Production Systems; Ecoinvent Report v.2.0, n.15; Swiss Centre for Life Cycle Inventories: Dubendorf, Switzerland, 2007. [Google Scholar]
  40. Nemecek, T.; Schnetzer, J.; Reinhard, J. Updated and harmonized greenhouse gas emissions for crop inventories. Int. J. Life Cycle Assess. 2016, 21, 1361–1378. [Google Scholar] [CrossRef]
  41. Kim, Y.; Mosier, N.S.; Hendrickson, R.; Ezeji, T.; Blaschek, H.; Dien, B.; Cotta, M.; Dale, B.; Ladisch, M.R. Composition of corn dry-grind ethanol by-products: DDGS, wet cake, and thin stillage. Bioresour. Technol. 2008, 99, 5165–5176. [Google Scholar] [CrossRef] [PubMed]
  42. Perez, E.R.; Cardozo, D.R.; Franco, D.W. Analise dos alcoois, esteres e compostos carbonilicos em amostras de oleo fusel. Quim. Nova 2001, 15, 10–12. [Google Scholar] [CrossRef]
  43. Cortez, L.A.B.; Brossard Perez, L.E. Experiences on vinasse disposal—Part III: Combustion of vinasse-# 6 fuel oil emulsions. Braz. J. Chem. Eng. 1997, 14. [Google Scholar] [CrossRef]
  44. Matsuura, M.I.S.F.; Dias, F.R.T.; Picoli, J.F.; Lucas, K.R.G.L.; Castro, C.; Hirakuri, M.H. Life-cycle assessment of the soybean-sunflower production system in the Brazilian Cerrado. Int. J. Life Cycle Assess. 2016. [Google Scholar] [CrossRef]
  45. Canals, L.M. Contributions to LCA Methodology for Agricultural Systems. Site-Dependency and Soil Degradation Impact Assessment. Doctoral Thesis, Universitat Autonoma de Barcelona, Barcelona, Brazail, 2003. [Google Scholar]
  46. Sugawara, E.T. Comparacao dos Desempenhos Ambientais do B5 Etilico de Soja e do Oleo Diesel, por meio da Avaliacao do Ciclo de Vida (ACV). Master Thesis, Universidade de Sao Paulo, Sao Paulo, Brazil, 2012. [Google Scholar]
  47. Garcia, J.C.C.; Sperling, E.V. Emissao de gases de efeito estufa no ciclo de vida do etanol: Estimativa nas fases de agricultura e industrializacao em Minas Gerais. Eng. Sanit. Ambient. 2010, 15, 217–222. [Google Scholar] [CrossRef]
  48. IPCC. Guidelines for National Greenhouse Gas Inventories, Prepared by the National Greenhouse Gas Inventories Programme. Hayana, Japan: IGES. Available online: http://www.ipcc-nggip.iges.or.jp/public/2006gl/ (accessed on 13 July 2016).
  49. CE—Comissao Europeia. Decisao da Comissao de 10 de Junho de 2010 Relativa a Directrizes para o Calculo das Reservas de Carbono nos Solos para Efeitos do Anexo V da Directiva 2009/28/CE; CE: Brussels, Belgium, 2010. [Google Scholar]
  50. Novaes, R.M.L.; Pazianotto, R.A.A.; Luiz, A.J.B.; May, A.; Bento, D.F.; Dias, F.R.T.; Matsuura, M.I.S.F. Parametros para estimative de emissoes decorrentes de mudanca de uso da terra para inventarios de ciclo de vida de produtos agropecuarios. In Proceedings of the V Congresso Brasileiro em Gestao do Ciclo de Vida, Gestao de Ciclo de Vida nos Tropicos, Fortaleza, Brasil, 19–22 September 2016; pp. 514–520.
  51. IBGE—Instituto Brasileiro de Geografia e Estatistica. Sistema IBGE de Recuperação Automática. Available online: www.sidra.ibge.gov.br (accessed on 15 July 2016).
  52. IBA—Industria Brasileira de Arvores. Relatorio Iba 2015. Available online: http://iba.org/pt/biblioteca-iba/publicacoes (accessed on 15 July2016).
  53. Goedkoop, M.; Heijungs, R.; Huijbregts, M.; De Schryver, A.; Struijs, J. Description of the ReCiPe Methodology for Life Assessment Impact Assessment; ReCiPe Main Report Revised 13 July 2012. Available online: http://www.lcia-recipe.net (accessed on 28 July 2016).
  54. Huijbreagts, M.; Hauschild, M.; Jolliet, O.; Margni, M.; McKone, T.; Rosenbaum, R.K.; Meent, D. USEtox User Manual, February 2010. Available online: http://www.usetox.org (accessed on 27 July 2016).
Figure 1. (a) Diagram of the Product System for the ethanol production model from sugarcane; (b) Diagram of the Product System for the ethanol production model from corn or grain sorghum.
Resources 06 00001 g001
Figure 2. Absolute and Relative major contributions in terms of NRF in the production of 1.0 m3 ethanol from sugarcane (SC Et), corn (C Et) and grain sorghum (GS Et).
Resources 06 00001 g002
Figure 3. Comparison of the performances of sugarcane ethanol (SC Et), corn ethanol (C Et), and grain sorghum ethanol (GS Et), and stages contributing to different types of impact. The values above the bars are the absolute contribution and the percentages express the participation of each stage for the type of emission. (a) Climate Change; (b) Agricultural Land Occupation; (c) Terrestrial Acidification; (d) Photochemical Oxidant Formation; (e) Human Toxicity (carcinogenic); (f) Ecotoxicity.
Resources 06 00001 g003
Figure 4. Emissions for Climate Change for 1.0 m3 of sugarcane ethanol (SC Et), corn (C Et), and grain sorghum (GS Et) according to CO2 dLUC contribution and other CO2 emissions.
Resources 06 00001 g004
Figure 5. Results of the integration scenarios sugarcane, corn, and grain sorghum, according to EROI.
Resources 06 00001 g005
Figure 6. Performance of integration scenarios between the production of ethanol from sugarcane, corn, and grain sorghum. (a) Climate Change; (b) Photochemical Oxidant Formation; (c) Agricultural Land Occupation; (d) Terrestrial Acidification; (e) Human Toxicity (carcinogenic); (f) Ecotoxicity.
Resources 06 00001 g006
Figure 7. Comparison of the results of Climate Change for integration scenarios. (a) Greenhouse gases (GHG) from fossil fuels and dLUC; (b) Adjusted Climate Change Balance.
Resources 06 00001 g007
Table 1. Main characteristics of the product systems considered in this study.
FeatureSugarcane EthanolCorn EthanolSorghum Ethanol
Agricultural productivity (t·ha−1)82.07.543.83
Harvesting75% manual (preceded by straw burning) + 25% mechanized100% mechanized
Industrial yield (L·t−1) *77.0362354
Raw material crushing capacity (t·day−1)4000900
Maximum operation (days)218330
Fuel for cogeneration systemsugarcane bagassewood chips
Vinasse coproduction (t·t−1) *1.802.77
Water consumption (t·t−1) *1.655.20
* Parameters expressed per ton of raw material processed.
Table 2. Allocation factors regarding ethanol production from different feedstock.
CoproductSugarcane EthanolCorn EthanolGrain Sorghum Ethanol
Ethanol38.7%31.8%31.0%
Fusel oil1.20%1.30%1.00%
Vinasse60.1%29.1%29.6%
DDGSn.a. 137.8%38.4%
1 Not applicable to ethanol from sugarcane.
Table 3. EROI for the production of 1.0 m3 ethanol (95%w/w) from the different agricultural raw materials under analysis.
Impact CategorySugarcane EthanolCorn EthanolGrain Sorghum Ethanol
EROI 111.56.858.64
1 Estimates based on an average LHV of hydrate ethanol of 21,350 MJ·m−3 [1].
Table 4. CC Balance for 1 m3 ethanol (95%w/w) for sugarcane, corn and grain sorghum.
Contributions for CC ImpactUnitSugarcane EthanolCorn EthanolGrain Sorghum Ethanol
Accumulated value (ReCiPe)kg CO2 eq125617092436
CO2,fixkg CO2 eq(–) 5407(–) 2973(–) 3138
CO2,bkg CO2 eq342616321600
Adjusted CC balancekg CO2 eq(–) 725368898
Table 5. Integrated production scenarios with sugarcane ethanol and corn/sorghum ethanol.
ScenariosCompositionConsumption of Renewable Fuel for Cogeneration
Sugarcane EthanolCorn/Sorghum EthanolBagasseWood Chips
%t·m−3 Ethanol
A65351.030.95
B60400.841.06
C55450.691.15
D50500.561.22
E45550.461.28
F40600.371.32
G35650.301.36
H30700.241.40
I25750.191.43
J20800.141.46
K15850.101.48
L10900.061.50
M5950.031.52

