Resource Use in the Production and Consumption System—The MIPS Approach

 ,
, 

Abstract
:1. Introduction
- Discussion of several application fields of calculating material intensity mainly developed in German/European research projects;
- Discussion of current challenges and open questions of MAIA method;
- Discussion of future research needs;
- Finally, provide an updated basis for further discussion of the MIPS concept and MAIA method with an international scientific community of environmental assessment.
2. MIPS Concept and Methodology
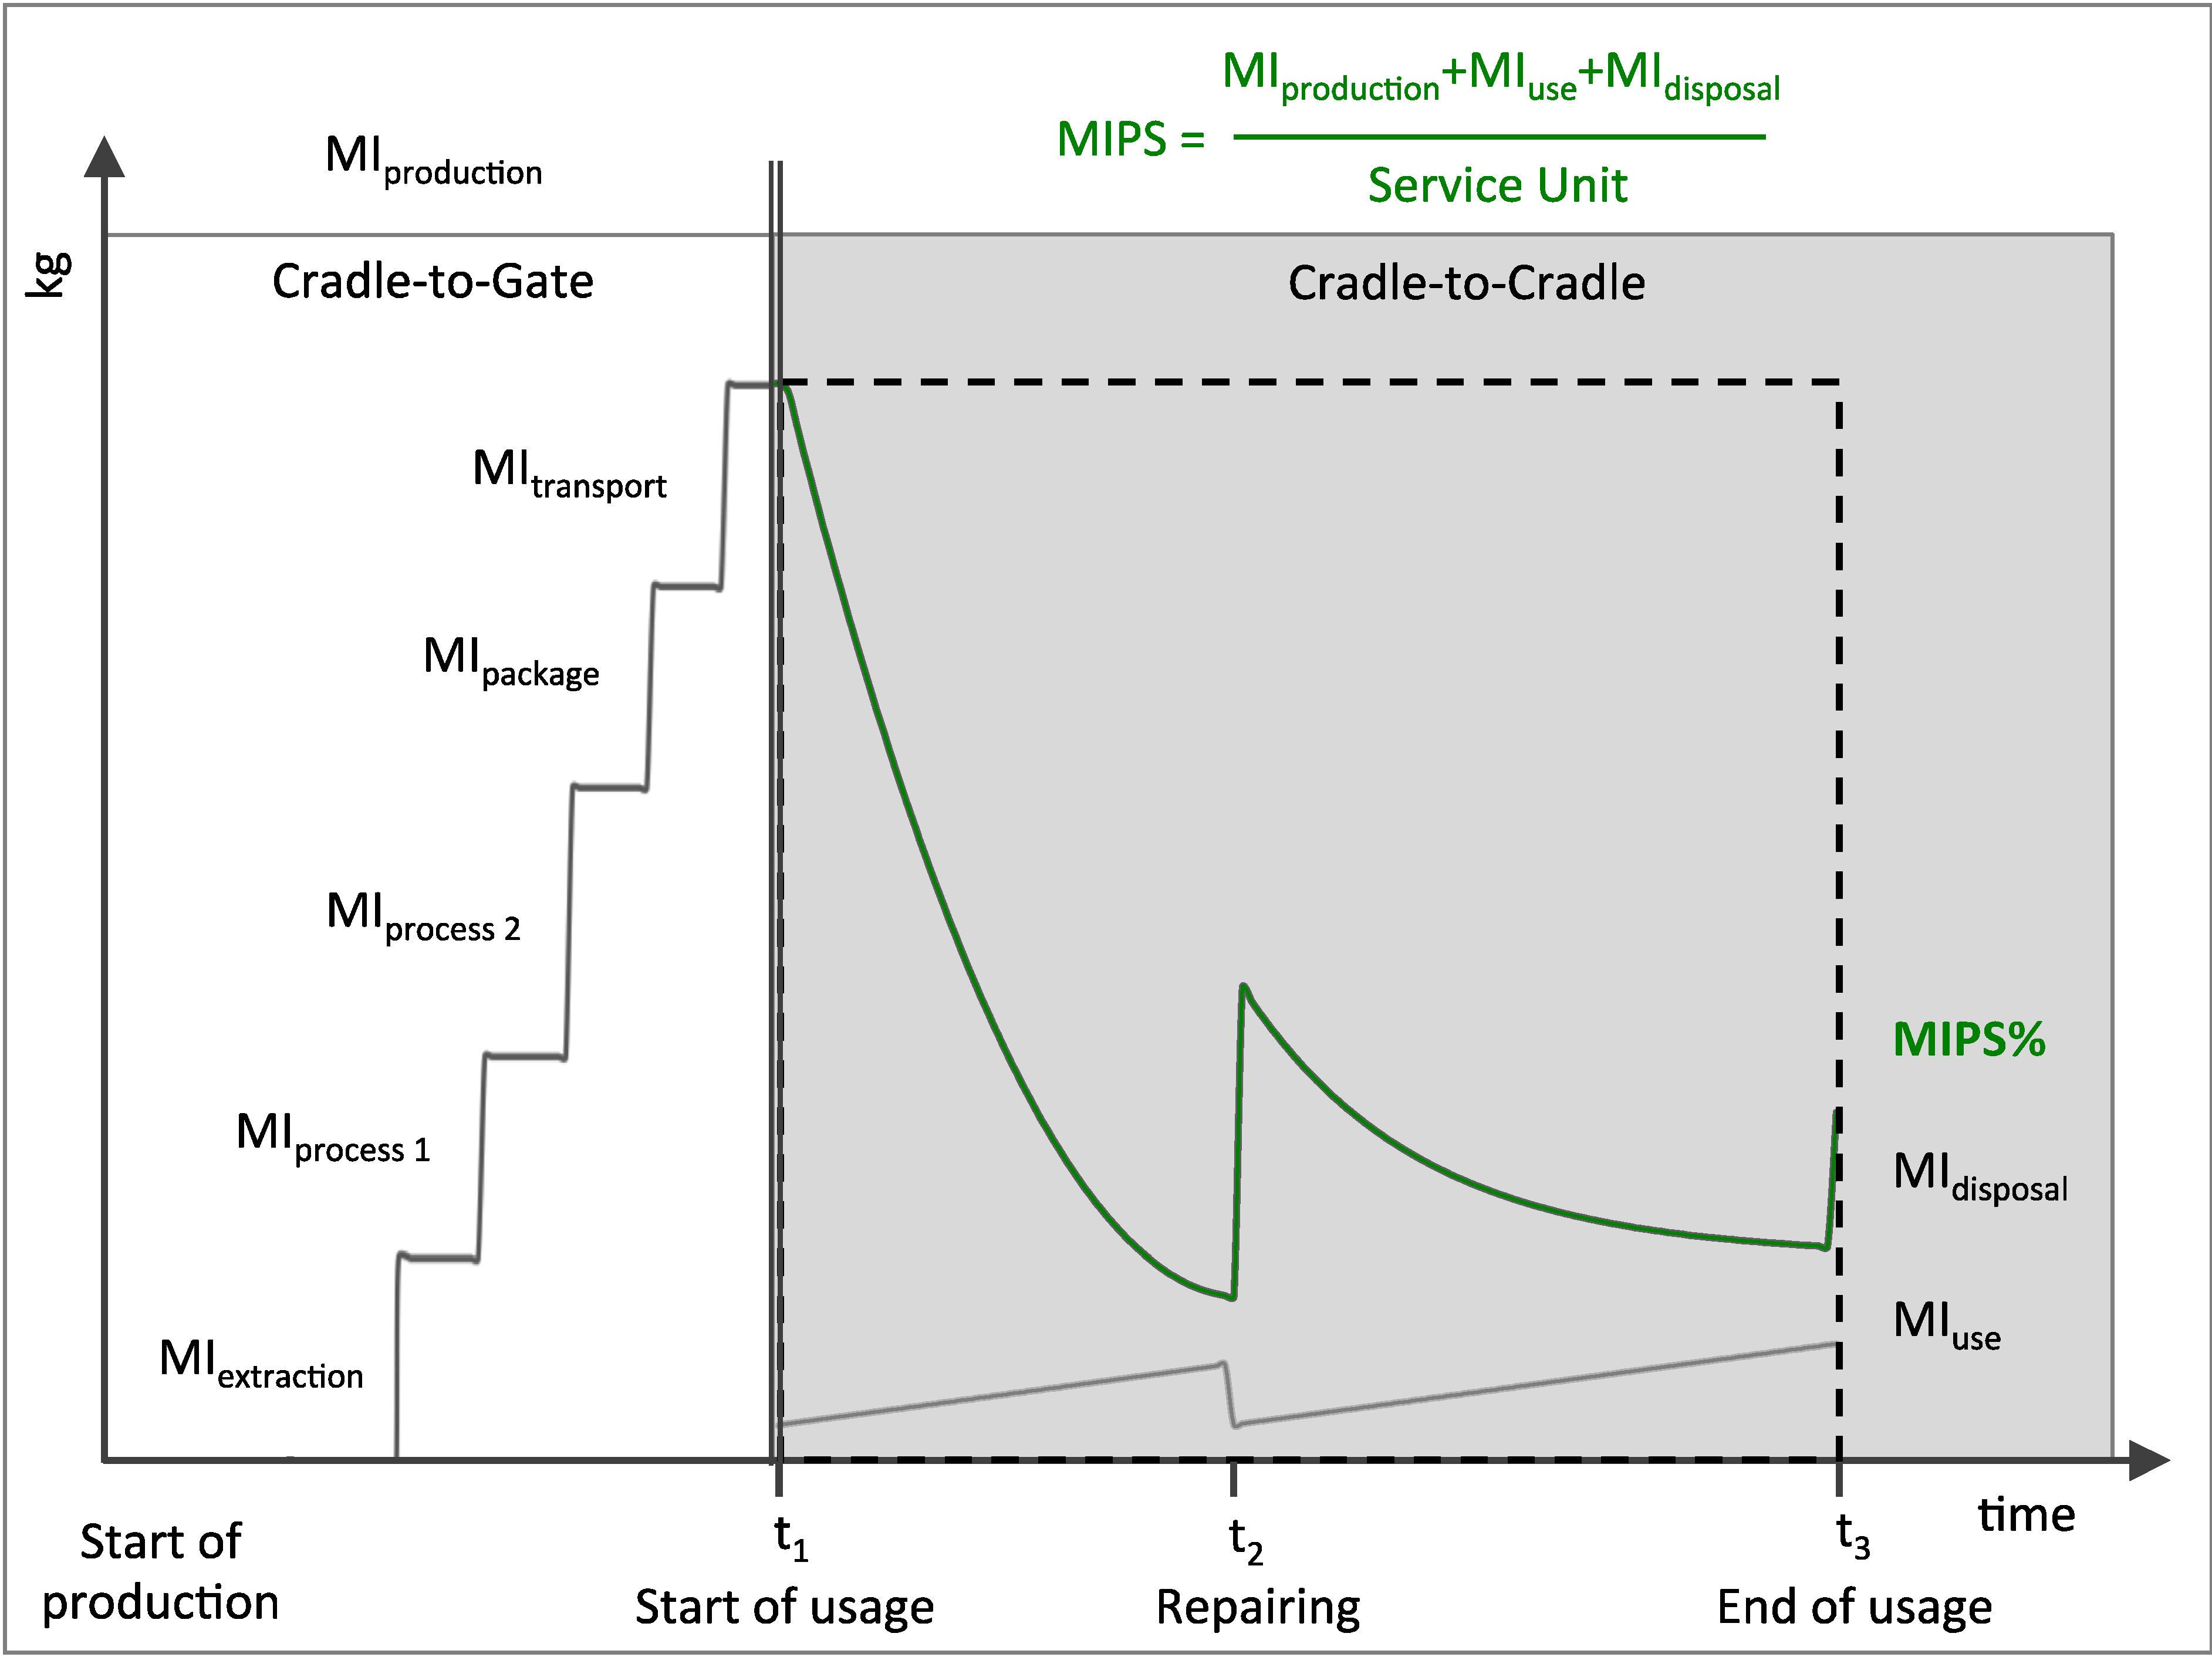
2.1. Principle of Input Orientation: Prevention Indicator
2.2. MIPS Calculation


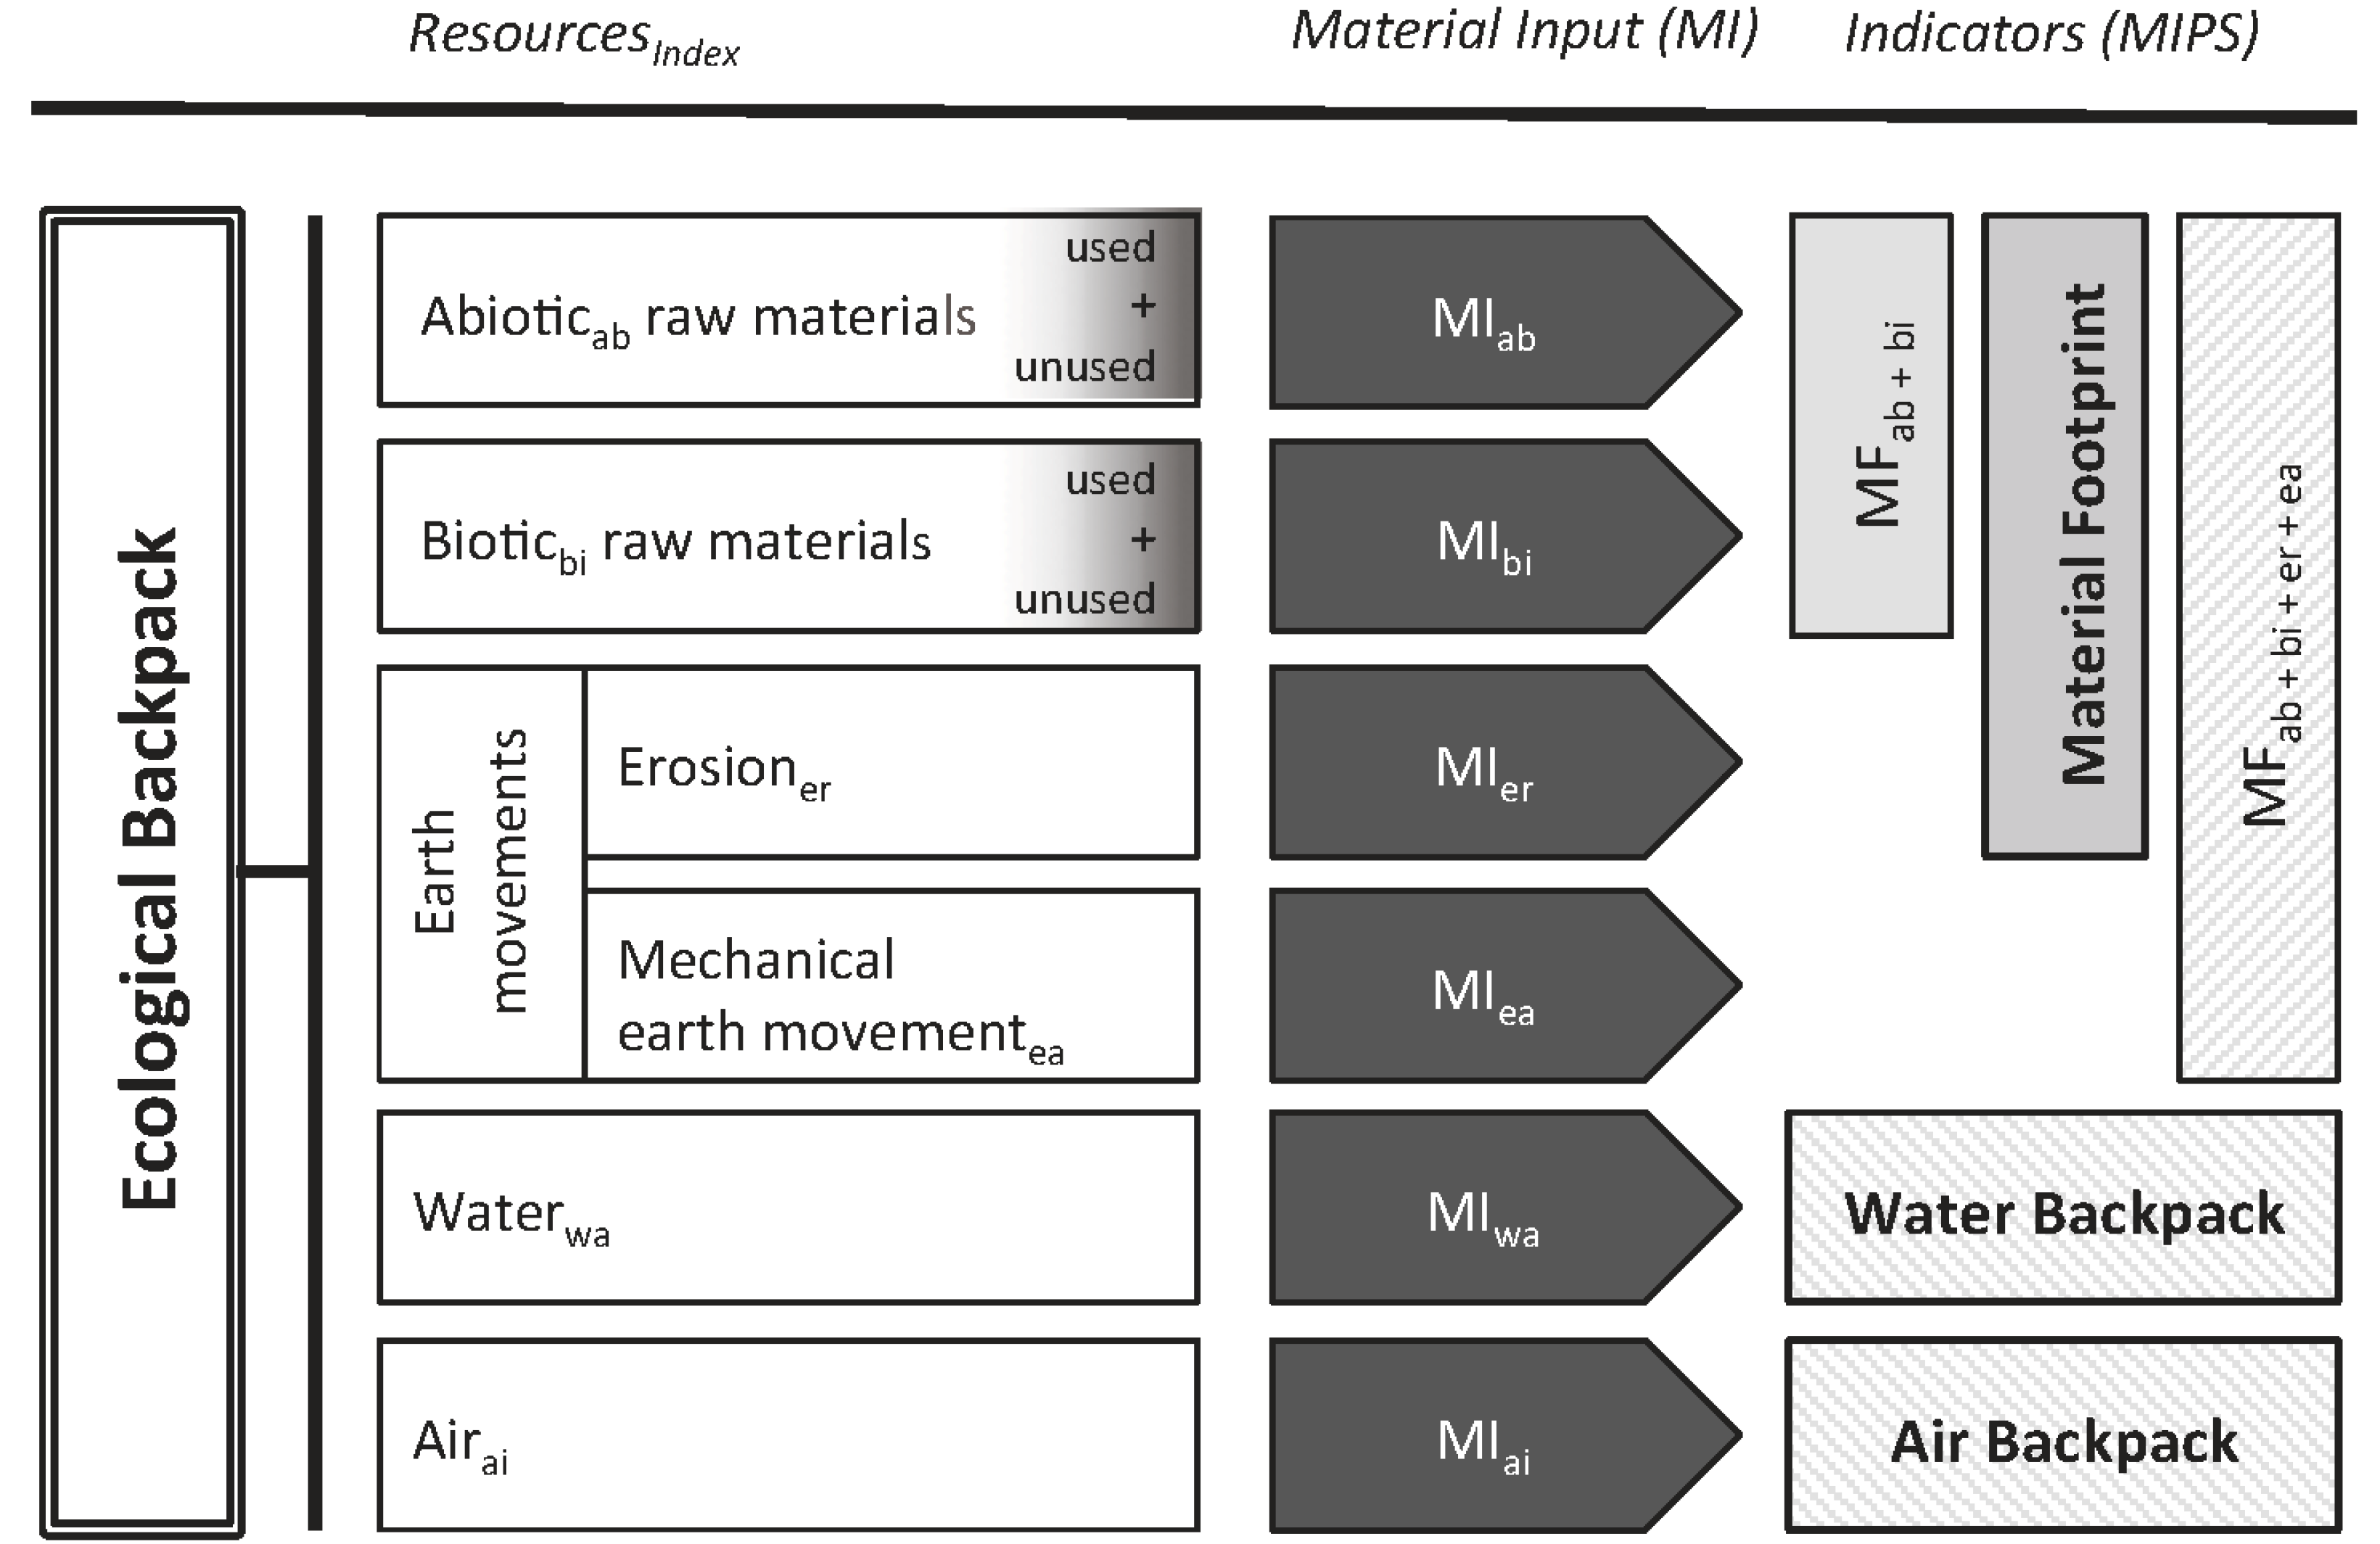
2.3. MIPS, Material Footprint and Ecological Backpack

| partial process 1 up to partial process n | Abiotic (ab) | Biotic (bi) | Earth movement (ea)/erosion (er) | Water (wa) | Air (ai) | |||||||
|---|---|---|---|---|---|---|---|---|---|---|---|---|
| substance /pre-product | amount | unit | MIT factor | kg/unit | MIT factor | kg/unit | MIT factor | kg/unit | MIT factor | kg/unit | MIT factor | kg/unit |
| kg/unit | main product | kg/unit | main product | kg/unit | main product | kg/unit | main product | kg/unit | main product | |||
| [name] 1 | m1 | MI1 | m1 × MI1 | ... | ... | ... | ... | ... | ... | ... | ... | |
| [name] 2 | m2 | MI2 | m2 × MI2 | ... | ... | ... | ... | ... | ... | ... | ... | |
| [name] 3 | m3 | MI3 | m3 × MI3 | ... | ... | ... | ... | ... | ... | ... | ... | |
| ... | ... | ... | ... | ... | ... | ... | ... | ... | ... | ... | ... | |
| [name n] | mn | MIn | mn × MIn | ... | ... | ... | ... | ... | ... | ... | ... | |
| ∑ partial process 1 | ∑mi × MIi | ∑mi × MIi | ... | ∑mi × MIi | ∑mi × MIi | ∑mi × MIi | ||||||
| (...) calculation of further partial processes (e.g., life cycle stages) | ... | ... | ... | ... | ... | ... | ... | ... | ... | ... | ||
| ∑ MI (sum of all partial processes) | MI ab | MI bi | MI er MI ea | MI wa | MI ai | |||||||
| Total amount of service units | ||||||||||||
| MIPS (MI per one service) | MIPS ab | MIPS bi | MIPS er MIPS ea | MIPS wa | MIPS ai | |||||||
2.4. Principle: Service Approach

3. MIPS Application Fields at Micro and Meso Level
3.1. MIPS Application along the Value Chain
3.2. MIPS Application towards Integration of Sustainability Strategies
| MIPS application: Current examples (selection) and future application (own suggestion) | References of current examples (selection) | |
|---|---|---|
| Production | MI Processes and life cycle phases: Single processes up to life cycle phase (e.g., extraction, production, use, recycling), R&D of processes | [66,69,94,95,96,97,98,99,100,101] |
| MI Value chain: Cradle to Gate, Cradle to Grave/Cradle, Gate to Grave/Cradle, comparison of value chains and life cycle phases, material selection/design, R&D of technologies/products (including development, prototyping, testing, roll out), R&D of services | [66,69,95,96,97,100,102] | |
| MI Production site: Gate to Gate, multinational companies, small and medium sized enterprises, cluster, industrial symbiosis | [12,13,53,103,104] | |
| MI Products & services: Single products, product bunch for services, comparison of product & service bundles | [13,14,15,69,94,96,102,103,105] | |
| MI Business models: Service concepts, concepts for logistics/distribution/diffusion | [12,13,15,53,54,99,101,102,106,107] | |
| MI Infrastructure: Construction & maintenance of infrastructure | [69,96,100,108,109,110] | |
| MI Energy: Power stations, energy source/storage, electricity/heat supply | [69,71,100,110] | |
| MI Transport: Mode of transport, mobility, logistics, fleet management | [50,69,111] | |
| MI Closed loops: at the production site, between process chains,closed loops in whole value chains, between sectors, micro and meso level | [12,54,66,67,100,101,102,112] | |
| MI Critical resources: Share of critical resources in total MI, integration of material input into assessment of critical resources | [113,114] | |
| Consumption | MI Consumption: Households, individuals, groups (e.g., singles, families, age, profession), social milieus, companies, public institutions,city district, region | [66,111,115,116,117] |
| MI Needs: Housing, mobility, nutrition, tourism, clothing, leisure time, health, education, participation | [66,67,75,111,112,118,119] | |
| MI Social practices: Routines, action patterns (of production, consumption, production/consumption) | [105,120,121] | |
| MI Rebound effects: Shifting between areas of need, products, services, direct and indirect rebound effects | [14,15,114] | |
| MI Use (including management): Operate, maintain, repair, re-use, re-manufacture; leasing, contracting, sharing, cooperative use concepts, Do it Yourself | [15,67,75,94,106,116,117] | |
| Balance | Material flow balances: MAIA is applicable on several levels (product, small company or, e.g., the material footprint of multinationals, economic sector, local, regional or national economy) | [12,56,101,116,117,122,123,124,125,126] |
| MI Input per Output: Resource productivity of households, companies and sites | [12,101,114,121,122,123,124,125,126] | |
| Business management | MI company in relation to their added value: time series, comparison between branches | [12,54,101,122,127,128] |
| Sales per working place or MI per working place: e.g., sales and resource use in large-scale enterprises per region and business unit; comparison between branches | [54,114,126] | |
| MI of process costs or production costs: at process level: identification of high ecological and economic “cost drivers”; comparison of similar processes within branch; at product level: time series, knowledge base for product portfolio management | [54,55,114,127] | |
| MI resource accounting: Resource cost accounting, direct material (costs), costs for processing/disposal burden/overhead materials | [54,55,114,127] | |
| MI Price: Method and indicator base for calculation of “ecological appropriate prices” | [54,114,127,129] | |
| Material Input (kg/MWh) | MFab | MFbi | MFer | Water Backpack | Air Backpack | MFab + bi + er |
|---|---|---|---|---|---|---|
| Offshore wind energy | 177 | 0 | 0 | 795 | 9 | 177 |
| Biogas plant | 595 | 2,973 | 346 | 1,747 | 954 | 3,914 |
| Lignite-fired power plant | 11,271 | 0 | 0 | 56,824 | 875 | 11,271 |
| Material Input (kg/kg) | MFab | MFbi | MFer | Water Backpack | Air Backpack | MFab + bi + er |
|---|---|---|---|---|---|---|
| Aluminium primary | 37 | 0 | 0 | 1,074 | 10.87 | 37 |
| Aluminium secondary | 0.85 | 0 | 0 | 30.74 | 0.95 | 0.85 |
| MIPS application aspect | Application examples (selection) | References of current examples (selection) | |
|---|---|---|---|
| Efficiency | Used/unused resources | Value chain perspective: proportion of used and unused resources over life cycle | [12,13,14,15,49,51,54,55,66,69,71,101,113,116,117,130] |
| Unused resources/profit Used resources/profit | Company level: proportion of unused resources and profit | ||
| Consistency | Unused/product weight MI/product weight | Assessment of recycling strategies at different levels: location, process chains, value chain, between sectors, micro and meso level | [14,15,69] |
| Unused resources/production costs | Assessment of recycling strategies, closed loops, costs of unused resources processed during the life cycle or per production site | [14,15,69] | |
| Sufficiency | MI individual resource use/resource target | Assessment of current resource use against resource targets or of earlier resource use against reduced resource use | [36,135] |
| Well-being/MI | Experienced well being per household inventory, time, activities | [14,15,75,135] | |
| MI/time | Deceleration/slowdown in different areas of need/activity fields | [12,14,15,135] | |
| MI/S | Resource input per service aiming at high service and low material input | [14,15,75,91,92,101,132] | |
| MI/land use of activities | Land use of activities, e.g., living, working; specific inventories of products, materials, raw materials, clearing out | [9,24,25,37,136] | |
| Targets | MI targets MI present resource use/MI target | Political targets and sustainable limits at city/regional, company or household level | [36,124,125,131,137,138] |
4. Discussions and Conclusions
4.1. Political Key Strategy: Resource Efficiency
4.2. Data Base Challenges
4.3. MIPS: Methodology
4.4. MIPS: Application
4.5. Future Challenges for Research
- Mobility and logistics (infrastructure, individual mobility and transportation of goods). Studies like Lähteenoja et al. [56] should be done for different countries and for Europe as a whole;
- Construction and housing including infrastructure as well as individual preferences and habits [36];
- Mobility and communication (e.g., focusing products for information and communication technology (ICT) and physical mobility to explore low resource shifts between both);
- Energy production (further update) and electrical grids (macro and micro models);
- Nutritional turn via lifestyle changes supported by common defined strategies developed by public and private catering establishments, producers, retailer, politicians and households.
- Extended resource efficiency analysis to screen processes, products, sectors, activities and lifestyles of high relevance and dematerialisation potential;
- Sustainable service design and new business models;
- Integration of other sustainability and resource management/value chain management approaches;
- Scenario development (e.g., [135]) and modeling—Integration with agent based modeling;
- Breakdown of resource targets on a per day and per year per person level for illustrating and giving input for development of products, services, infrastructures, etc.
Author Contributions
Conflicts of Interest
References and Notes
- Die Erfindung der Nachhaltigkeit. Leben, Werk und Wirkung des Hans Carl von Carlowitz; Sächsische Carlowitz-Gesellschaft (Ed.) Oekom Verlag: München, Germany, 2013; pp. 13–82.
- United Nations Environment Programme (Ed.) Paving the Way for Sustainable Consumption and Production. The Marrakech Process Progress Report; UNEP Division of Technology Industry and Economics (DTIE) Sustainable Consumption and Production Branch: Paris, France, 2011. Available online: http://www.unep.fr/scp/marrakech (accessed on 24 May 2013).
- United Nations Environment Programme (Ed.) Global Outlook on Sustainable Consumption and Production Policies: Taking Action Together; UNEP Division of Technology Industry and Economics (DTIE) Sustainable Consumption and Production Branch: Paris, France, 2012. Available online: http://www.unep.fr/scp/publications/details.asp?id=DTI/1498/PA (accessed on 24 May 2013).
- Stahel, W.R. Langlebigkeit und Materialrecycling - Strategien zur Vermeidung von Abfällen im Bereich der Produkte; Vulkan Verlag: Essen, Germany, 1991. [Google Scholar]
- Fussler, C.; James, P. Driving Eco-Innovation: A Breakthrough Discipline for Innovation and Sustainability; Pitman Publishing: London, UK, 1996. [Google Scholar]
- Schmidt-Bleek, F. Wieviel Umwelt braucht der Mensch? MIPS—Das Maß für ökologisches Wirtschaften; Birkhäuser: Berlin, Germany, 1993. [Google Scholar]
- Schmidt-Bleek, F. The Earth: Natural Resources and Human Intervention (The Sustainability Project); Wiegand, K., Ed.; Haus Publishing: London, UK, 2009. [Google Scholar]
- Giljum, S.; Burger, E.; Hinterberger, F.; Lutter, S.; Bruckner, M. A comprehensive set of resource use indicators from the micro to the macro level. Resour. Conserv. Recycl. 2011, 55, 300–308. [Google Scholar] [CrossRef]
- Sustainable Resource Management: Global Trends, Visions and Policies; Bringezu, S.; Bleischwitz, R. (Eds.) Greenleaf: Sheffield, UK, 2009.
- World Business Council for Sustainable Development (WBSCD) (Ed.) Vision 2050. The New Agenda for Business; WBCSD: Conches-Geneva, Switzerland, 2010. ISBN: 978-3-940388-56-8. Available online: http://www.wbcsd.org/pages/edocument/edocumentdetails.aspx?id=219 (accessed on 20 April 2012).
- Von Weizsäcker, E.U.; Lovins, A.B.; Lovins, L.H. Faktor Vier: Doppelter Wohlstand—Halbierter Naturverbrauch. Der neue Bericht an den Club of Rome; Droemer Knaur: München, Germany, 1995. [Google Scholar]
- Liedtke, C.; Rohn, H.; Kuhndt, M.; Nickel, R. Applying Material Flow Accounting. Eco-Auditing and Resource Management at the Kambium Furniture Workshop. J. Ind. Ecol. 1998, 2, 131–147. [Google Scholar] [CrossRef]
- Eco-efficiency and beyond: towards the Sustainable Enterprise; Seiler-Hausmann, J.-D.; Liedtke, C.; von Weizsäcker, E.U. (Eds.) Greenleaf Publishing Limited: Sheffield, UK, 2004.
- Liedtke, C.; Buhl, J.; Ameli, N. Designing value through less by integrating sustainability strategies into lifestyles. Int. J. Sustain. Des. 2013, 2, 167–180. [Google Scholar]
- Liedtke, C; Buhl, J.; Ameli, N. Microfoundations for Sustainable Growth with Eco-Intelligent Product Service-Arrangements. Sustainability 2013, 5, 1141–1160. [Google Scholar] [CrossRef]
- Bleischwitz, R. International economics of resource productivity: relevance, measurement, empirical trends, innovation, resource policies. Int. Econ. Econ. Policy 2010, 7, 227–244. [Google Scholar] [CrossRef]
- Faulstich, M.; Köglmeier, M.; Leipprand, A.; Mocker, M. Strategies to Increase Resource Efficiency. In Factor X, Resource—Designing the Recycling Society; Angrick, M., Burger, A., Lehmann, H., Eds.; Springer: Dordrecht, Germany, 2013; pp. 135–149. Volume 30. [Google Scholar]
- Science Communication Unit, University of the West of England (Ed.) Science for Environment Policy In-depth Report: Resource Efficiency Indicators; Report Produced for the European Commission DG Environment, University of the West of England: Bristol, UK, 2013. Available online: http://ec.europa.eu/science-environment-policy (accessed on 24 May 2013).
- SCU defines decoupling as follows: “Relative Decoupling: Both economic performance and resource use grow, but the resource use is growing at a lower rate than the economy. Resource productivity increases. Absolute Decoupling: Economic growth is achieved, while resource use is falling in absolute terms. (...) Resource and impact decoupling: Resource decoupling means reducing the rate of resource use per unit of economic activity, leading to ‘dematerialisation’. Greater resource decoupling is indicated by increased economic output relative to resource input—also known as resource productivity (GDP/DMC). Impact decoupling refers to increasing economic output while reducing negative environmental impacts (...)” [18] (p. 6)
- Fischer-Kowalski, M.; Swilling, M.; von Weizsäcker, E.U.; Ren, Y.; Moriguchi, Y.; Crane, W.; Krausmann, F.; Eisenmenger, N.; Giljum, S.; Hennicke, P.; et al. Decoupling Natural Resource Use and Environmental Impacts from Economic Growth; International Resource Panel, Ed.; UNEP Division of Technology Industry and Economics (DTIE) Sustainable Consumption and Production Branch: Paris, France, 2011. Available online: http://www.unep.org/resourcepanel/decoupling/files/pdf/decoupling_report_english.pdf (accessed on 2 May 2013).
- Fischer-Kowalski, M.; Krausmann, F.; Giljum, S.; Lutter, S.; Mayer, A.; Bringezu, S.; Moriguchi, Y.; Schütz, H.; Schandl, H.; Weisz, H. Methodology and Indicators of Economy-wide Material Flow Accounting: State of the Art and Reliability across Sources. J. Ind. Ecol. 2011, 15, 855–876. [Google Scholar] [CrossRef]
- Bringezu, S.; Schütz, H.; Moll, S. Analysis and Evaluation of the Metabolism of Economies Rationale and Interpretation of Economy-wide Material Flow Analysis and Derived Indicators. J. Ind. Ecol. 2003, 7, 43–64. [Google Scholar] [CrossRef]
- “TMR refers to the global total ‘material base’ of an economic system. (…) TMR includes the so called “ecological rucksacks”. These consist on the one hand of unused domestic extraction like overburden from coal mining, excavated soil for constructions or soil erosion in agriculture. On the other hand, TMR includes all foreign life-cycle wide required materials, used and unused, which were necessary to provide an imported good. These are in general called indirect material flows. TMR thus constitutes the most comprehensive Input-Indicator and measures the total physical basis of an economy. TMR thus represents an estimation value for the magnitude of potential environmental pressure exerted through the extraction and use of natural resources.” [26] (p. 80)
- Bringezu, S. Visions of a sustainable resource use. In Sustainable Resource Management. Global Trends, Visions and Policies; Bringezu, S., Bleischwitz, R., Eds.; Greenleaf: Sheffield, UK, 2009; pp. 155–215. [Google Scholar]
- Bringezu, S.; Schütz, H. Ziele und Indikatoren für die Umsetzung von ProgRess. RessourcenPolitik Arbeitspapier 1.2/1.3, 2013. Available online: http://www.ressourcenpolitik.de/wp-content/uploads/2013/04/PolRess_ZB_AP1-1.2-3_Indikatoren-und-Ziele_final.pdf (accessed on 24 October 2013).
- Schütz, H.; Bringezu, S. Ressourcenverbrauch von Deutschland—aktuelle Kennzahlen und Begriffsbestimmungen (Final Report: Resource consumption of Germany—Indicators and definitions); Federal Environment Agency: Dessau-Roßlar, Germany, 2008. (in German). Available online: http://www.umweltbundesamt.de/uba-info-medien/3427.html (accessed on 16 June 2013).
- Wang, H.; Yue, Q.; Lu, Z.; Schuetz, H.; Bringezu, S. Total Material Requirement of Growing China: 1995–2008. Resources 2013, 2, 270–285. [Google Scholar] [CrossRef]
- Steinberger, J.K.; Krausmann, F.; Eisenmenger, N. Global patterns of material use: A socio-economic and geophysical analysis. Ecol. Econ. 2010, 69, 1148–1158. [Google Scholar] [CrossRef]
- Bringezu, S.; Schütz, H.; Saurat, M.; Moll, S.; Acosta-Fernández, J.; Steger, S. Europe’s resource use. Basic trends, global and sectoral patterns and environmental and socioeconomic impacts. In Sustainable Resource Management. Global Trends, Visions and Policies; Bringezu, S., Bleischwitz, R., Eds.; Greenleaf: Sheffield, UK, 2009; pp. 52–154. [Google Scholar]
- Wiedmann, T.O.; Schandl, H.; Lenzen, M.; Moran, D.; Suh, S.; West, J.; Kanemoto, K. The material footprint of nations. Proc. Nat. Acad. Sci. 2013. [Google Scholar] [CrossRef]
- Krausmann, F.; Gingrich, S.; Eisenmenger, N.; Erb, K.H.; Haberl, H.; Fischer-Kowalski, M. Growth in global materials use, GDP and population during the 20th century. Ecol. Econ. 2009, 68, 2696–2705. [Google Scholar] [CrossRef]
- Schmidt-Bleek, F.; Liedtke, C. Key Words in Environmental Policy; Wuppertal Paper No. 30; Wuppertal Institute for Climate, Environment and Energy: Wuppertal, Germany, 1995. [Google Scholar]
- Lehmann, H.; Schmidt-Bleek, F. Material flows from a systematical point of view. Fresenius Environ. Bull. 1993, 8, 413–418. [Google Scholar]
- Schmidt-Bleek, F. Das MIPS-Konzept – Faktor 10; Drömer: München, Germany, 1998. [Google Scholar]
- Schmidt-Bleek, F. Factor 10: The future of stuff. Sustain. Sci. Pract. Policy 2008, 4, 1–4. [Google Scholar]
- Lettenmeier, M.; Liedtke, C.; Rohn, H. Eight Tons of Material Footprint—Suggestion for a Resource Cap for Household Consumption in Finland. Resources 2014, 3, 488–515. [Google Scholar] [CrossRef]
- Bringezu, S. Key elements for Economy-wide Sustainable Resource Management. Annales des Mines, Responsabilité et Environnement 2011, 61, 78–87. [Google Scholar]
- In 1992 at the UN Conference on the Environment and Development in Rio de Janeiro the Agenda 21 was adopted (linking environment and development). In 2002 the Johannesburg Plan of Implementation at the World Summit on Sustainable Development (WSSD) recommended sustainable production and consumption patterns to be implemented worldwide and a “10-year framework of programmes on sustainable consumption and production patterns (10YFP)” should be developed; Therefore the Marrakesh Process was launched in 2003 (worldwide multi-stakeholder process): The 10YFP was supposed to be adopted 2012 at the UN Conference on Sustainable Development (Rio +20); In 2012 a comprehensive status quo analysis has been created (Marrakesh progress Report 2011, Global Outlook on Sustainable Consumption and Production Policies 2012; Country Reports 2012, Vision for SCP 2012); Resource efficiency is one of UNEP’s six crosscutting priorities. This theme is managed through targeted activities, including the 10YFP, the Life Cycle Initiative, and business-oriented programmes, such as Global Compact and Global Reporting Initiative, see [2,3].
- Bahn-Walkowiak, B.; Steger, S. Politische und rechtliche Ansätze für inputorientierte Ressourcenziele in Europa und weltweit. RessourcenPolitik Arbeitspapier 1.1, 2013. Available online: http://www.ressourcenpolitik.de/wp-content/uploads/2013/04/Polress_ZB_AP1-AS1.1_Übersicht-Ressourcenziele-Europa-und-weltweit_final.pdf (accessed on 24 Oct 2013).
- Commission of the European Communities. Communication from the Commission to the Council and the European Parliament—On the Review of the Sustainable Development Strategy, A Platform for Action; COM(2005) 658 final; Commission of the European Communities: Brussels, Belgium, 2005. [Google Scholar]
- Commission of the European Communities. Communication from the Commission to the Council, the European Parliament, the European Economic and Social Committee and the Committee of the Regions—Thematic Strategy on the Sustainable Use of Natural Resources; COM(2005) 670 final; Commission of the European Communities: Brussels, Belgium, 2005. [Google Scholar]
- Commission of the European Communities. Communication from the Commission to the European Parliament, the Council, the European Economic and Social Committee and the Committee of the Regions—On the Sustainable Consumption and Production and Sustainable Industrial Policy Action Plan; COM(2008) 397 final; Commission of the European Communities: Brussels, Belgium, 2008. [Google Scholar]
- Commission of the European Communities. Communication from the Commission to the European Parliament, the Council, the European Economic and Social Committee and the Committee of the Regions—Roadmap to a Resource Efficient Europe; COM (2011) 571 final; European Commission: Brussels, Belgium, 2011. [Google Scholar]
- Environmental pressures from European Consumption and Production. A Study in Integrated Environmental and Economic Analysis; European Environment Agency (EEA) (Ed.) Technical report No 2/2013; EEA: Copenhagen, Denmark, 2013.
- Commission of the European Communities. Commission Staff Working Paper—Analysis Associated with the Roadmap to a Resource Efficient Europe Part II; SEC(2011) 1067 final; European Commission: Brussels, Belgium, 2011. [Google Scholar]
- International Resource Panel (Ed.) Responsible Resource Management for a Sustainable World: Findings from the International Resource Panel; United Nations Environment Programme: Nairobi, Kenya, 2012. Available online: http://www.unep.org/resourcepanel/ (accessed on 29 June 2013).
- Swilling, M.; Robinson, B.; Marvin, S.; Hodson, M. City-Level Decoupling: Urban resource flows and the governance of infrastructure transitions; International Resource Panel, Ed.; UNEP Division of Technology Industry and Economics (DTIE) Sustainable Consumption and Production Branch: Paris, France, 2013. Available online: http://www.unep.org/resourcepanel/ (accessed on 29 June 2013).
- Bundesministerium für Umwelt Naturschutz und Reaktorsicherheit (BMU) (Ed.) German ResourceEfficiency Programme (ProgRess). Programme for the Sustainable Use and Conservation of Natural Resources; Federal Ministry for the Environment, Nature Conservation and Nuclear Safety (BMU): Berlin, Germany, 2012. Available online: http://www.bmu.de/fileadmin/bmu-import/files/pdfs/allgemein/application/pdf/progress_en_bf.pdf (accessed on 15 March 2013).
- Bringezu, S. Towards increasing resource productivity: How to measure the total material consumption of regional or national economies? Fresenius Environ. Bull. 1993, 8, 437–442. [Google Scholar]
- Schmidt-Bleek, F.; Bringezu, S.; Hinterberger, F.; Liedtke, C.; Spangenberg, J.; Stiller, H.; Welfens, J. MAIA: Einführung in die Material-Intensitäts-Analyse nach dem MIPS-Konzept; Birkhäuser: Berlin, Germany, 1998. [Google Scholar]
- Eurostat. Economy-wide Material Flow Accounts (EW-MFA). Compilation Guide, 2012. Available online: http://epp.eurostat.ec.europa.eu (accessed on 29 June 2013).
- Schmidt-Bleek, F.; Lehmann, H.; Bringezu, S.; Hinterberger, F.; Welfens, M.J.; Schütz, H.; Kranendonk, S.; Liedtke, C.; Stiller, H.; Brüggemann, U.; et al. Special Issue “Material Intensity per Unit Service (MIPS)”. Fresenius Environ. Bull. 1993, 8, 407–490. [Google Scholar]
- Liedtke, C.; Rohn, H. Zukunftsfähiges Unternehmen (1) Öko-Audit und Ressourcenmanagement bei der Kambium Möbelwerkstätte GmbH; Wuppertal Paper No. 69; Wuppertal Institut für Klima, Umwelt, Energie: Wuppertal, Germany, 1997. [Google Scholar]
- Busch, T.; Beucker, S.; Müller, A. Computer Aided Resource Efficiency Accounting. In Material Flow Management: Improving Cost Efficiency and Environmental Performance; Wagner, B., Ed.; Physica-Verlag: Heidelberg, Germany, 2005; pp. 21–55. [Google Scholar]
- Geibler, J.V.; Wiesen, K.; Mostyn, R.; Werner, M.; Riera, N. Forming the Nucleus of a Novel Ecological Accounting System: The myEcoCost Approach. Key Eng. Mater. 2014, 572, 78–83. [Google Scholar]
- Lähteenoja, S.; Lettenmeier, M.; Kotakorpi, E. The Ecological Rucksack of Households: Huge Differences, Huge Potential for Reduction? In Sustainable Consumption and Production: Framework for Action, Proceedings of Refereed Sessions III–IV, 2nd Conference of the Sustainable Consumption Research Exchange (SCORE!) Network, Brussels, Belgium, 10–11 March 2008; Ken, T.G., Tukker, A., Vezzoli, C., Ceschin, F., Eds.; Flemish Institute for Technological Research NV (VITO): Mol, Belgium; The Netherlands Organization for Applied Scientific Research (TNO): Delft, The Netherlands, 2008; pp. 319–337. [Google Scholar]
- Bringezu, S.; Schütz., H.; Steger, S.; Baudisch, J. International comparison of resource use and its relation to economic growth. The development of total material requirement, direct material inputs and hidden flows and the structure of TMR. Ecol. Econ. 2004, 51, 97–124. [Google Scholar] [CrossRef]
- Bruckner, M.; Giljum, S.; Lutz, C.; Wiebe, K.S. Materials embodied in international trade—Global material extraction and consumption between 1995 and 2005. Glob. Environ. Chang. 2012, 22, 568–576. [Google Scholar] [CrossRef]
- International Standard Organisation. Environmental Management—Life Cycle Assessment—Principles and Framework; ISO 14040:2006; International Standard Organisation: Geneva, Switzerland, 2006. [Google Scholar]
- International Standard Organisation. Environmental Management—Life Cycle Assessment—Requirements and Guidelines; ISO 14044:2006; International Standard Organisation: Geneva, Switzerland, 2006. [Google Scholar]
- Van den Berg, H. Global Status of DDT and Its Alternatives for Use in Vector Control to Prevent Disease. Environ. Health Perspect. 2009, 117, 1656–1663. [Google Scholar] [CrossRef]
- Dürkop, J.; Englert, N. (Eds.) Environmental Health in Germany. Everyday Examples. Federal Environmental Agency: Berlin, Germany, 2004. Available online: http://www.apug.de/archiv/ pdf/Brochure_EH.pdf (accessed on 30 May 2013).
- Lettenmeier, M.; Rohn, H.; Liedtke, C.; Schmidt-Bleek, F. Resource Productivity in 7 Steps; Wuppertal Spezial 41. Wuppertal Institute for Climate, Environment and Energy: Wuppertal, Germany, 2009. Available online: http://epub.wupperinst.org/files/3384/WS41.pdf (accessed on 30 May 2013).
- Mancini, L. Food Habits and Environmental Impact: An Assessment of the Natural Resource Demand in Three Agri-Food Systems. Ph.D. Thesis, Marche Polytechnic University, Ancona, Italy, 2010. Available online: http://openarchive.univpm.it/jspui/bitstream/123456789/288/1/Tesi.Mancini.pdf (accessed on 12 August 2012). [Google Scholar]
- Spangenberg, J.H. Indikatoren für biologische Vielfalt. In Zugänge zur Biodiversität—Disziplinäre Thematisierungen und Möglichkeiten integrierender Ansätze; Görg, C., Hertler, C., Schramm, E., Weingarten, M., Eds.; Metropolis Verlag: Marburg, Germany, 1999; pp. 215–236. [Google Scholar]
- Mancini, L.; Lettenmeier, M.; Rohn, H.; Liedtke, C. Application of the MIPS method for assessing the sustainability of production–consumption systems of food. J. Econ. Behav. Organ. 2012, 81, 779–793. [Google Scholar] [CrossRef]
- Lukas, M.; Liedtke, C.; Rohn, H. The Nutritional Footprint—Assessing environmental and health impacts of foodstuffs. Presented at World Resources Forum, Davos, Switzerland, 6–9 October 2013; Topic 4: Lifestyles and Education: Session on Food & Nutrition. Available online: http://www.worldresourcesforum.org/files/WRF2013/Full%20Papers/Lukas%2CLiedtke%26Rohn_WRF2013.pdf (accessed on 17 January 2014).
- Aachener Stiftung Kathy Beys (Ed.) Factsheet Measuring Resource Extraction. Sustainable Resource Management Needs to Consider Both Used and Unused Extraction; Aachener Stiftung Kathy Beys: Aachen, Germany, 2011. Available online: http://www.faktor-x.info/fileadmin/ content/Factsheet_Measuring_Resource_Extraction.pdf (accessed on 9 January 2011).
- Rohn, H.; Pastewski, N.; Lettenmeier, M.; Wiesen, K.; Bienge, K. Resource efficiency potential of selected technologies, products and strategies. Sci. Total Environ. 2014, 473–474, 32–35. [Google Scholar] [CrossRef]
- Material Intensity Factors. Available online: http://wupperinst.org/en/info/details/wi/a/s/ad/365/ (accessed on 7 May 2013).
- Samus, T.; Lang, B.; Rohn, H. Assessing the natural resource use and the resource efficiency potential of the Desertec concept. Solar Energy 2013, 87, 176–183. [Google Scholar] [CrossRef]
- Ritthoff, M.; Rohn, H.; Liedtke, C. Calculating MIPS—Resource Productivity of Products and Services; Wuppertal Institute for Climate, Environment and Energy: Wuppertal, Germany, 2002, 1st ed. Wuppertal Spezial 27e. Available online: http://wupperinst.org/en/publications/ details/wi/a/s/ad/584/ (accessed on 15 Febuary 2012).
- Saurat, M.; Ritthoff, M. Calculating MIPS 2.0. Resources 2013, 2, 581–607. [Google Scholar] [CrossRef]
- Wiesen, K.; Saurat, M.; Lettenmeier, M. Calculating the Material Input per Service Unit using the Ecoinvent database. Int. J. Perform. Eng. 2014, 10, 357–366. [Google Scholar]
- Lettenmeier, M.; Hirvilammi, T.; Laakso, S.; Lähteenoja, S.; Aalto, K. Material Footprint of Low-Income Households in Finland—Consequences for the Sustainability Debate. Sustainability 2012, 4, 1426–1447. [Google Scholar] [CrossRef]
- Rees, W.E. Ecological footprints and appropriated carrying capacity: What urban economics leaves out. Environ. Urban. 1992, 4, 121–130. [Google Scholar] [CrossRef]
- Wackernagel, M. Ecological Footprint and Appropriated Carrying Capacity: A Tool for Planning Toward Sustainability. Ph.D. Thesis, School of Community and Regional Planning, The University of British Columbia, Vancouver, Canada, 1994. [Google Scholar]
- Weinzettel, J.; Steen-Olsen, K.; Galli, A.; Cranston, G.; Ercin, E.; Hawkins, T.; Wiedmann, T.; Hertwich, E. Footprint Family Technical Report: Integration into MRIO Model; One Planet Economy Network: Surrey, UK, 2011. Available online: http://oneplaneteconomynetwork.org (accessed on 28 April 2013).
- Rushforth, R.R.; Adams, E.A.; Ruddell, B.L. Generalizing ecological, water and carbon footprint methods and their worldview assumptions using Embedded Resource Accounting. Water Resour. Ind. 2013, 1–2, 77–90. [Google Scholar] [CrossRef]
- Laschke, M.; Hassenzahl, M.; Diefenbach, S. Things with attitude: Transformational Products. In Proceedings of Create 11 Conference, London, UK, 23 June 2011; Available online: http://www.create-conference.org/storage/create11papersposters/Things%20with%20attitude.pdf (accessed on 22 July 2014).
- Walker, S. Form beyond function: practice-based research in objects, environment and meaning. Int. J. Sustain. Des. 2011, 1, 335–347. [Google Scholar]
- Vezzoli, C.; Manzini, E. Design for Sustainable Consumption: new roles designing system innovations. In Perspective on Radical Changes to Sustainable Consumption and Production (SCP), Proceedings of Workshop of the Sustainable Consumption Research Exchange (SCORE!) Network (Parallel Session II), Copenhagen, Denmark, 20–21 April 2006; Andersen, M.M., Tukker, A., Eds.; RISØ: Roskilde, Denmark; TNO: Delft, The Netherlands, 2006; pp. 167–198. [Google Scholar]
- Schmidt-Bleek, F.; Tischner, U. Produktentwicklung—Nutzen gestalten—Natur schonen; Wirtschaftskammer Österreich: Wien, Austria, 1995. [Google Scholar]
- Schaltegger, S.; Synnestvedt, T. The Link between “Green” and Economic Success. Environmental Management as the Crucial Trigger between Environmental and Economic Performance. J. Environ. Manag. 2002, 65, 339–346. [Google Scholar]
- Dyllick, T.; Schaltegger, S. Nachhaltigkeitsmanagement mit einer Sustainability Balanced Scorecard. UmweltWirtschaftsForum 2001, 9, 68–73. [Google Scholar]
- Walther, G. Nachhaltige Wertschöpfungsnetzwerke. Überbetriebliche Planung und Steuerung von Stoffströmen entlang des Produktlebenszyklus; Gabler: Wiesbaden, Germany, 2010. [Google Scholar]
- Rockström, J.; Steffen, W.; Noone, K.; Persson, Å.; Chapin, F.S.; Lambin, E.F.; Lenton, T.M.; Scheffer, M.; Folke, C.; Schellnhuber, H.J.; et al. A safe operating space for humanity. Nature 2009, 461, 461–472. [Google Scholar] [CrossRef]
- Baumol, W.J.; Oates, W.E. The Use of Standards and Prices for Protection of the Environment. Swed. J. Economics 1971, 73, 42–54. [Google Scholar] [CrossRef]
- Radermacher, F.J. Balance oder Zerstörung. Ökosoziale Marktwirtschaft als Schlüssel zu einer weltweit nachhaltigen Entwicklung; Österreichischer Agrarverlag: Wien, Austria, 2002. [Google Scholar]
- Braungart, M.R.; McDonough, W.A. Die nächste industrielle rEvolution. Politische Ökologie 1999, 62, 18–22. [Google Scholar]
- Linz, M.; Bartelmus, P.; Hennicke, P.; Jungkeit, R.; Sachs, W.; Scherhorn, G.; Wilke, G.; von Winterfeld, U. Von nichts zu viel: Suffizienz gehört zur Zukunftsfähigkeit. Über ein Arbeitsvorhaben des Wuppertal Instituts; Wuppertal Paper 125; Wuppertal Institut für Klima, Umwelt, Energie: Wuppertal, Germany, 2002. [Google Scholar]
- Stengel, O. Suffizienz: die Konsumgesellschaft in der ökologischen Krise; Dissertationsschrift, Wuppertaler Schriften zur Forschung für eine nachhaltige Entwicklung 1; oekom verlag: München, Germany, 2011. [Google Scholar]
- Sachs, W. Geschwindigkeit und Ökologie. Prokla, Z. krit. Sozialwissenschaft 1997, 107, 181–194. [Google Scholar]
- Liedtke, C.; Ameli, N.; Buhl, J.; Oettershagen, P.; Pears, T.; Abbis, P. Wuppertal Institute Designguide—Background Information & Tools; Wuppertal Spezial No. 46. Wuppertal Institute for Climate, Environment and Energy: Wuppertal, Germany, 2013. Available online: http://epub.wupperinst.org/files/4893/WS46.pdf/ (accessed on 15 June 2013).
- Liedtke, C.; Baedeker, C.; Kolberg, S.; Lettenmeier, M. Resource intensity in global food chains: the Hot Spot Analysis. Br. Food J. 2010, 112, 1138–1159. [Google Scholar] [CrossRef]
- Geibler, J.V.; Kuhndt, M.; Türk, V. Virtual networking without a backpack? Resource consumption of information technologies. Inf. Syst. Sustain. Dev. 2005, 109–127. [Google Scholar]
- Liedtke, C. Material intensity of paper & board production in Western Europe. Fresenius Environ. Bull. 1993, 8, 57–62. [Google Scholar]
- Engelmann, T.; Liedtke, C.; Rohn, H. Nachhaltiges Wirtschaften im Mittelstand. Möglichkeiten zur Steigerung der Ressourceneffizienz in kleinen und mittleren Unternehmen. Abteilung Wirtschafts- und Sozialpolitik der Friedrich-Ebert-Stiftung, Ed.; WISO Diskurs. 2013. Available online: http://library.fes.de/pdf-files/wiso/10079.pdf (accessed on 11 June 2013).
- Schmidt-Bleek, F.; Tischner, U. Designing Goods with MIPS. Fresenius Environ. Bull. 1993, 8, 479–484. [Google Scholar]
- Lang-Koetz, C.; Pastewski, N.; Rohn, H. Identifying New Technologies, Products and Strategies for Resource Efficiency. Chem. Eng. Technol. 2010, 33, 559–566. [Google Scholar]
- Rohn, H.; von Proff-Kesseler, A. Sustainable product design and resource management at the Kambium Furniture Workshop. In Sustainable Solutions: Developing Products and Services for the Future; Charter, M., Ed.; Greenleaf Publishing: Sheffield, UK, 2001; pp. 364–371. [Google Scholar]
- Kristof, K.; Türk, V.; Walliczek, K.; Welfens, M.J. Organizational and institutional innovation in companies for resource productivity. In Sustainable Consumption and Production: Opportunities and Challenges, Proceedings of Launch Conference of the Sustainable Consumption Research Exchange (SCORE!) Network, Delft, The Netherlands, 23–25 November 2006; Charter, M., Tukker, A., Andersen, M.M., Eds.; RISØ: Roskilde, Denmark; TNO: Delft, The Netherlands, 2006; pp. 77–82. [Google Scholar]
- Bienge, K.; Geibler, J.v.; Lettenmeier, M.; Biermann, B.; Adria, O.; Kuhndt, M. Sustainability Hot Spot Analysis: A streamlined life cycle assessment towards sustainable food chains. In Proceedings of the 9th European IFSA Symposium, Vienna, Austria, 4–7 July 2009; Darnhofer, I., Grötzer, M., Eds.; Universität für Bodenkultur (BOKU): Vienna, Austria, 2010; pp. 1822–1832. [Google Scholar]
- Der Mittelstand gewinnt. Über Effizienz, Produkte und Allianzen; Liedtke, C.; Baedeker, C.; Rohn, H.; Klemisch, H. (Eds.) Hirzel: Stuttgart, Germany, 2002.
- Leismann, K.; Schmitt, M.; Rohn, H.; Baedeker, C. Collaborative Consumption: Towards a Resource-Saving Consumption Culture. Resources 2013, 2, 184–203. [Google Scholar] [CrossRef]
- Pulkkinen, K.-L. (Ed.) 4th Sustainable Summer School, Transition to Sustainable Development. Documentation of 4th Sustainable Summer School. Helsinki, Finland, 25 August–3 September 2012; 2013. Available online: http://sustainable-summer-school.org/fileadmin/designwalks/4th_documents/4thSSS_documentation.pdf (accessed on 14 October 2013).
- Geibler, J.V.; Kristof, K. Developing sustainable future markets: Business strategies and tools for stakeholder and consumer integration. In Sustainable Consumption and Production: Framework for Action, Proceedings of Refereed Sessions III–IV, 2nd Conference of the Sustainable Consumption Research Exchange (SCORE!) Network, Brussels, Belgium, 10–11 March 2008; Ken, T.G., Tukker, A., Vezzoli, C., Ceschin, F., Eds.; Flemish Institute for Technological Research NV (VITO): Mol, Belgium; The Netherlands Organization for Applied Scientific Research (TNO): Delft, The Netherlands, 2008; pp. 89–102. [Google Scholar]
- Spies-Wallbaum, H.; Bürkin, C. Concepts and instruments for a sustainable construction sector. Ind. Environ. 2003, 26, 53–57. [Google Scholar]
- Herzog, K.; Liedtke, C.; Ritthoff, M.; Spies-Wallbaum, H.; Merten, T. Der Werkstoff Stahl im Vergleich zu Konkurrenzwerkstoffen: Verfahren, Ressourceneffizienz, Recycling, Umwelt; Forschung für die Praxis; Verl. und Vertriebsges.: Düsseldorf, Germany, 2003; p. 559. [Google Scholar]
- Wiesen, K.; Teubler, J.; Rohn, H. Resource Use of Wind Farms in the German North Sea—The Example of Alpha Ventus and Bard Offshore I. Resources 2013, 2, 504–516. [Google Scholar] [CrossRef]
- Salo, M.; Lähteenoja, S.; Lettenmeier, M. Natural resource consumption of tourism: Case study on free time residences and hotel accommodation in Finland. In Sustainable Consumption and Production: Framework for Action, Proceedings of Refereed Sessions V, 2nd Conference of the Sustainable Consumption Research Exchange (SCORE!) Network, Brussels, Belgium, 10–11 March 2008; Ken, T.G., Tukker, A., Vezzoli, C., Ceschin, F., Eds.; Flemish Institute for Technological Research NV (VITO): Mol, Belgium; The Netherlands Organization for Applied Scientific Research (TNO): Delft, The Netherlands, 2008; pp. 303–319. [Google Scholar]
- Lettenmeier, M.; Göbel, C.; Liedtke, Christa; Rohn, H.; Teitscheid, P. Material Footprint of a Sustainable Nutrition System in 2050—Need for Dynamic Innovations in Production, Consumption and Politics. Proceedings in Food System Dynamics, North America, October 2012; pp. 584–598. Available online: http://centmapress.ilb.uni-bonn.de/ojs/index.php/proceedings/article/view/260 (accessed on 22 July 2014).
- STROM—Assist: Global Perspectives and Life Cycle Assessment (LCA) of Electromobility. Subproject within the joint research project: Accompanying research on Technologies and LCA of Electromobility. Available online: http://wupperinst.org/en/projects/details/wi/p/s/pd/385/ (accessed on 25 February 2014).
- Busch, T. Value-at-risk of resource scarcity: The example of oil. Invest. Manag. Financ. Innov. 2005, 1, 39–56. [Google Scholar]
- Geibler, J.V.; Berner, S.; Erdmann, L.; Jordan, N.D.; Leismann, K.; Liedtke, C.; Rohn, H.; Schnalzer, K.; Stabe, M. Sustainable Innovations I LivingLabs: Exploring the Potential of a German Research Infrastructure for User-lead Product and Service Innovations. In Presented at the Sustainable Innovation 2012—17th International Conference, Bonn, Germany, 29–30 October 2012.
- Mancini, L.; Lettenmeier, M.; Rohn, H.; Liedtke, C. MIPS as a tool for analysing food chains sustainability. In Proceedings of the 9th European International Farming Systems Association (IFSA) Symposium Building Sustainable Rural Futures, Vienna, Austria, 4–7 July 2010; pp. 1833–1843.
- Mancini, L.; Lettenmeier, M.; Rohn, H.; Liedtke, C. Material flows-based indicators for evaluating agro-food systems sustainability: A survey on Italian beef. In Presented at the 119th EAAE Seminar “Sustainability in the Food Sector: Rethinking the Relationship between the Agro-Food System and the Natural, Social, Economic and Institutional Environments”; Capri, Italy, 30 June–2 July 2010, European Association of Agricultural Economists (EAAE), Ed.; Università Politecnica delle Marche: Ancona, Italy, 2010; pp. 1–15. [Google Scholar]
- Hirvilammi, T.; Laakso, S.; Lettenmeier, M.; Lähteenoja, S. Studying Well-being and Its Environmental Impacts: A Case Study of Minimum Income Receivers in Finland. J. Hum. Dev. Capab. A Multi Discip. J. Peop. Cent. Dev. 2013, 14, 134–154. [Google Scholar]
- Liedtke, C.; Baedeker, C.; Hasselkuß, M.; Rohn, H.; Grinewitusch, V. User-integrated innovation in Sustainable LivingLabs: an experimental infrastructure for researching and developing sustainable product service systems. J. Clean. Production 2014. [Google Scholar] [CrossRef]
- Liedtke, C.; Hasselkuß, M.; Welfens, M.J.; Nordmann, J.; Baedeker, C. Transformation towards sustainable consumption: Changing consumption patterns through meaning in social practices. In Presented at the 4th International Conference on Sustainability Transitions (IST); Zurich, Switzerland, 18–21 June 2013, ETH Zurich: Zürich, Switzerland, 2013; pp. 702–729. [Google Scholar]
- Rohn, H.; Bliesner, A.; Dreuw, K.; Klinke, S.; Schmitt, M.; Masson, T. Resourceculture: Analysis of resource efficiency innovations and cultures of trust: How to advance innovation for sustainable management in SMEs. In Presented at the ERSCP-EMSU Conference “Knowledge Collaboration & Learning for Sustainable Innovation”, Delft, The Netherlands, 25–29 October 2010; pp. 1–30.
- Onischka, M.; Ritthoff, M.; Liedtke, C. Instrumentenwegweiser zur Steigerung der Ressourceneffizienz: Praxishandbuch des Umwelt- und Nachhaltigkeitscontrollings für KMU; Books on Demand GmbH: Norderstedt, Germany, 2008. [Google Scholar]
- Kuhndt, M.; Schaefer, J.; Liedtke, C. Developing a system of sectoral sustainability indicators for the European aluminium industry. Ind. Environ. 2002, 25, 67–71. [Google Scholar]
- Geibler, J.V.; Kuhndt, M. Helping small and not-so-small businesses improve their triple bottom line performance. Ind. Environ. 2002, 25, 63–66. [Google Scholar]
- Kuhndt, M.; Geibler, J.V. Developing a sectoral sustainability indicator system of using the COMPASS methodology. Futura 2002, 2, 29–44. [Google Scholar]
- Geibler, J.V.; Kuhndt, M. Developing a sectoral sustainability indicator set: the case of the European aluminium industry. In Proceedings of the Fifth International Conference on EcoBalance: practical tools and thoughtful principles for sustainability, Tsukuba, Japan, 6–8 November 2002; Society of Non-Traditional Technology: Toranomon, Japan, 2002; pp. 383–386. [Google Scholar]
- Busch, T.; Liedtke, C. Resource efficiency accounting. In Management Models for Corporate Social Responsibility (CSR): A Comprehensive Overview; Jonker, J., de Witte, M., Eds.; Nijmegen School of Management (NSM), Radboud University Nijmegen; Springer: Berlin/Heidelberg, Germany, 2006; pp. 274–280. [Google Scholar]
- Orbach, T.; Liedtke, C. Eco-management Accounting in Germany: Concepts and Practical Implementation. A study of Operational and Material Flows Analysis, Particulary as it is Practised in Germany and How it might be Used as a Part of Management Accounting; Wuppertal Paper No. 88; Wuppertal Institute for Climate, Environment and Energy: Wuppertal, Germany, 1998. [Google Scholar]
- Haas, A.; Onischka, M.; Fucik, M. Black Swans, Dragon Kings, and Bayesian Risk Management, Economics Discussion Papers No. 11, Kiel Institute for the World Economy. Available online: http://www.economics-ejournal.org/economics/discussionpapers/2013-11 (accessed on 11 October 2013).
- Wiesen, K.; Lang, B.; Rohn, H. Ressourceneffizienzpotenziale der Stromerzeugung durch Windenergie und Biomasse in Deutschland. Technologien, Produkte und Strategien—Ergebnisse der Potenzialanalysen; Rohn, H., Pastewski, N., Lettenmeier, M., Eds.; Ressourceneffizienz Paper 1.5. Wuppertal Institut für Klima, Umwelt, Energie: Wuppertal, Germany, 2010; pp. 48–58. Available online: http://ressourcen.wupperinst.org/downloads/ MaRess_AP1_5.pdf (accessed on 2 March 2010).
- Spangenberg, J.H. Environmental space and the prism of sustainability: frameworks for indicators measuring sustainable development. Ecol. Indic. 2002, 2, 295–309. [Google Scholar] [CrossRef]
- Schneidewind, U.; Palzkill-Vorbeck, A. Suffizienz als Business Case: nachhaltiges Ressourcenmanagement als Gegenstand einer transdisziplinären Betriebswirtschaftslehre. Impulse zur Wachstumswende. Wuppertal Institut für Klima, Umwelt, Energie: Wuppertal, Germany, 2011. Available online: epub.wupperinst.org/files/3955/ImpW2.pdf (accessed on 2 August 2012).
- Kotakorpi, E.; Lähteenoja, S.; Lettenmeier, M. Household MIPS. Natural Resource Consumption of Finnish Households and Its Reduction. In The Finnish Environment; Ministry of the Environment: Helsinki, Finland, 2008; p. 43. [Google Scholar]
- Liedtke, C.; Baedeker, C.; Geibler, J.; Hasselkuß, M. User-integrated innovation: sustainable LivingLabs research and development of sustainable products and services through user-driven innovation. In Beyond consumption: Pathways to Responsible Living. Conference Proceedings of 2nd PERL International Conference, Berlin, Germany, 19–20 March 2012; Fricke, V., Schrader, U., Thoresen, V.W., Eds.; Technische Universität Berlin: Berlin, Germany; pp. 203–218.
- Consumer-Transitions: Roadmaps for Transformation Potentials of Sustainable Consumption Patterns. Available online: http://wupperinst.org/en/projects/details/wi/p/s/pd/450/ (accessed on 27 February 2014).
- Baedeker, C. Flächenintensitätsanalyse von Produkten aus geographischer Sicht—eine praxisbezogene Methodendiskussion. Diplomarbeit im Fachbereich der Geographie, diploma thesis, Universität zu Köln, Köln, Deutschland, 19 June 1997. [Google Scholar]
- Leppänen, J.; Neuvonen, A.; Ritola, M.; Ahola, I.; Hirvonen, S.; Hyötyläinen, M.; Kaskinen, T.; Kauppinen, T.; Kuittinen, O.; Kärki, K.; et al. Scenarios for Sustainable Lifestyles 2050: From Global Champions to Local Loops; Report D4.1 Future Scenarios for New European Social Models with Visualisations of the project SPREAD Sustainable Lifestyles 2050; Demos Helsinki: Helsinki, Finland; Collaborating Centre on Sustainable Consumption and Production (CSCP): Wuppertal, Germany, 2012. [Google Scholar]
- Opschoor, J.B.; Costanza, R. Environmental Performance Indicators, Environmental Space and the Preservation of Ecosystem Health. In Global Environmental Change and Sustainable Development in Europe; Jäger, J., Liberatore, A., Grundlach, K., Eds.; Office for Official Publications of the European Communities: Luxembourg, 1995; pp. 157–190. [Google Scholar]
- Meyer, B. Ressourceneffiziente Wirtschaftsentwicklung unter dem Primat Ökologischer Ziele. In Postwachstumsgesellschaft: Konzepte für die Zukunft; Seidl, I., Zahrnt, A., Eds.; Metropolis: Marburg, Germany, 2010; pp. 167–178. [Google Scholar]
- Schepelmann, P.; Stock, M.; Koska, T.; Schüle, R.; Reutter, O. A green new deal for Europe: towards green modernisation in the face of crisis; A report by the Wuppertal Institute for Climate, Environment and Energy. Green new deal series. Green European Foundation: Brussels, Belgium, 2009; Volume 1. Available online: ://www.gef.eu/fileadmin/user_upload/ GEF_GND_for_Europe_publication_web.pdf (accessed on 7 March 2010).
- Onischka, M.; Liedtke, C.; Jordan, N.D. How to sensitize the financial industry to resource efficiency considerations and climate change related risks. J. Environ. Assess. Policy Manag. 2012, 14, 1250017:1–1250017:26. [Google Scholar]
- Lemken, T.; Meinel, U.; Liedtke, C.; Kristof, K. Maßnahmenvorschläge zur Ressourcenpolitik im Bereich unternehmensnaher Instrumente: Feinanalysepaper für die Bereiche Innovation und Markteinführung, Ressourceneffizienz Paper 4.5. Wuppertal Institut für Klima, Umwelt, Energie: Wuppertal, Germany, 2010. Available online: http://ressourcen.wupperinst.org/downloads/ MaRess_AP4_5.pdf (accessed on 10 October 2010).
- Distelkamp, M.; Meyer, B.; Meyer, M. Quantitative und qualitative Analyse der ökonomischen Effekte einer forcierten Ressourceneffizienzstrategie; Abschlussbericht zu AS5.2 und AS5.3. Ressourceneffizienz Paper 5.5. Wuppertal Institut für Klima, Umwelt, Energie: Wuppertal, Germany, 2010. Available online: http://ressourcen.wupperinst.org/downloads/MaRess_AP5_5.pdf (accessed on 10 October 2010).
- Schmidt, M.; Schneider, M. Kosteneinsparungen durch Ressourceneffizienz in produzierenden Unternehmen. UmweltWirtschaftsForum 2010, 18, 153–164. [Google Scholar] [CrossRef]
- Schmidt, M.; Schneider, M. Ressourceneffizienz spart Produktionskosten. In Ressourceneffizienz—Potenziale von Technologien, Produkten und Strategien, 1st ed.; Rohn, H., Lettenmeier, M., Pastewski, N., Eds.; Fraunhofer Verlag: Stuttgart, Germany, 2013; pp. 9–19. [Google Scholar]
- Kristof, K. Models of Change: Einführung und Verbreitung sozialer Innovationen und gesellschaftlicher Veränderungen in transdisziplinärer Perspektive; vdf Hochschulverlag an der ETH Zürich: Zürich, Schweiz, 2010. [Google Scholar]
- Kristof, K.; Hennicke, P. Kernstrategien zur Steigerung der Ressourceneffizienz in Deutschland. In Aus weniger mehr machen: Strategien für eine nachhaltige Ressourcenpolitik in Deutschland; Hennicke, P., Kristof, K., Götz, T., Eds.; Oekom Verlag: München, Germany, 2011; pp. 258–280. [Google Scholar]
- Manstein, C.; Bienge, K.; Giljum, S.; Burger, E. Datenentwicklung. Endbericht Arbeitspaket 3. BRIX Projekt—Business Resource Intensity Index. 2010. Available online: http://www.brix-index.net/data/BRIX_AP3_Daten_Endbericht_oeffentlich.pdf (accessed on 3 Dec 2010).
- Wardenaar, T.; van Ruijven, T.; Mendoza Beltran, A.; Vad, K.; Guinée, J.; Heijungs, R. Differences between LCA for analysis and LCA for policy: A case study on the consequences of allocation choices in bio-energy policies. Int. J. Life Cycle Assess 2012, 17, 1059–1067. [Google Scholar] [CrossRef]
- Bierter, W.; Irgang, G.; Manstein, C.; Schmidt-Bleek, F. Machbarkeitsstudie für den Aufbau einer Zentralstelle für Ressourcenproduktivität und Materialflüsse (PROREGIS); Factor 10 Innovation Network: Giebenach, Switzerland, 2000. Available online: http://www.factor10-institute.org/files/PROREGIS_d.pdf (accessed on 9 January 2010).
- Giljum, S.; Hinterberger, F.; Biermann, B.; Wallbaum, H.; Bleischwitz, R.; Bringezu, S.; Liedtke, C.; Ritthoff, M.; Schütz, H. Towards an International Data Base on Resource Intensity; Aachen Foundation, Ed.; Druckerei und Verlagsgruppe Mainz: Aachen, Germany, 2009. Available online: http://www.aachener-stiftung.de/ (accessed on 9 January 2010).
- Giljum, S.; Burger, E. Wissenschaftliche Synthese. Endbericht von Arbeitspaket 7; Mit Beiträgen von allen wissenschaftlichen Projektpartnern; BRIX Projekt—Business Resource Intensity Index; Faktor 10 Institut: Klagenfurt, Austria; Wuppertal Institut für Klima, Umwelt, Energie: Wuppertal, Germany; SERI: Wien, Austria, 2010. Available online: http://www.brix-index.net/data/BRIX_AP3_Daten_Endbericht_oeffentlich.pdf (accessed on 3 December 2010).
- Giljum, S.; Polzin, C. INDI-LINK: Indicator-Based Evaluation of Interlinkages between Different Sustainable Development Objectives; Publishable Activity Report; December 2009. Deliverable 0.4 (Final Report). SERI: Wien, Austria, 2009. Available online: http://www.indi-link.net/images/stories/Download/indi-link_final_report.pdf (accessed on 14 Aug 2014).
- CREEA—Compiling and Refining Environmental and Economic Accounts. Available online: http://www.creea.eu/ (accessed on 29 June 2013).
- Organisation for Economic Co-Operation and Development (OECD) (Ed.) Synthesis report. Measuring Material Flows and Resource Productivity; OECD: Danvers, MA, USA, 2008. Available online: http://old.seri.at/documentupload/pdf/oecd_2008_material_flows_and_resource_ productivity.pdf (accessed on 29 June 2013).
- Eco-Innovation Observatory (Ed.) Methodological Report. Eco-Innovation Observatory. Funded by the European Commission. DG Environment: Brussels, Belgium, 2010. Available online: http://www.eco-innovation.eu/media/Methodological_Report_2010.pdf (accessed on 10 June 2012).
- Bringezu, S. Where does the cradle really stand? System boundaries for ecobalancing procedures could be harmonized. Fresenius Environ. Bull. 1993, 8, 419–424. [Google Scholar]
- Sorrell, S.; Dimitriopolous, J.; Sommerville, M. Empirical estimates of the direct rebound effects: A review. Energy Policy 2009, 37, 1356–1371. [Google Scholar] [CrossRef]
- Hufenbach, W.; Kupfer, R.; Lucas, P.; Reichardt, B. Ressourceneffizienzpotenziale von Elektrofahrzeugen. In Ressourceneffizienz—Potenziale von Technologien, Produkten und Strategien, 1st ed.; Rohn, H., Lettenmeier, M., Pastewski, N., Eds.; Fraunhofer Verlag: Stuttgart, Germany, 2013; pp. 164–173. [Google Scholar]
- Verein deutscher Ingenieure (VDI). VDI Richtlinienwerk zur Ressourceneffizienzanalyse. Available online: http://www.vdi.de/technik/fachthemen/energie-und-umwelt/fachbereiche/ressourcenmanagement/themen/richtlinienwerk-zur-ressourceneffizienz-zre/ (accessed on 20 June 2013).
- Global nachhaltige materielle Wohlstandsniveaus. Available online: http://www.gws-os.com/de/content/view/992/149/ (accessed on 20 June 2013).
- Liedtke, C.; Geibler, J.V.; Baedeker, C.; Hasselkuß, M.; Jordan, N.D.; Rohn, H. The “sustainability living lab” as a reflexive user-integrating research infrastructure. In Proceedings of the 3rd International Conference on Sustainability TransitionsE Sessions “Theory Development & Critical Perspectives”, Lyngby, Denmark, 29–31 August 2012; Technical University of Denmark (DTU): Lyngby, Denmark, 2012; pp. 206–222. [Google Scholar]
- Liedtke, C.; Welfens, M.J.; Rohn, H.; Nordmann, J. LIVING LAB: User-driven innovation for sustainability. Int. J.Sustain. High. Educ. 2012, 12, 106–118. [Google Scholar]
© 2014 by the authors; licensee MDPI, Basel, Switzerland. This article is an open access article distributed under the terms and conditions of the Creative Commons Attribution license (http://creativecommons.org/licenses/by/3.0/).
Share and Cite
Liedtke, C.; Bienge, K.; Wiesen, K.; Teubler, J.; Greiff, K.; Lettenmeier, M.; Rohn, H. Resource Use in the Production and Consumption System—The MIPS Approach. Resources 2014, 3, 544-574. https://doi.org/10.3390/resources3030544
Liedtke C, Bienge K, Wiesen K, Teubler J, Greiff K, Lettenmeier M, Rohn H. Resource Use in the Production and Consumption System—The MIPS Approach. Resources. 2014; 3(3):544-574. https://doi.org/10.3390/resources3030544
Chicago/Turabian StyleLiedtke, Christa, Katrin Bienge, Klaus Wiesen, Jens Teubler, Kathrin Greiff, Michael Lettenmeier, and Holger Rohn. 2014. "Resource Use in the Production and Consumption System—The MIPS Approach" Resources 3, no. 3: 544-574. https://doi.org/10.3390/resources3030544