Low-Gain, Low-Noise Integrated Neuronal Amplifier for Implantable Artifact-Reduction Recording System

Abstract
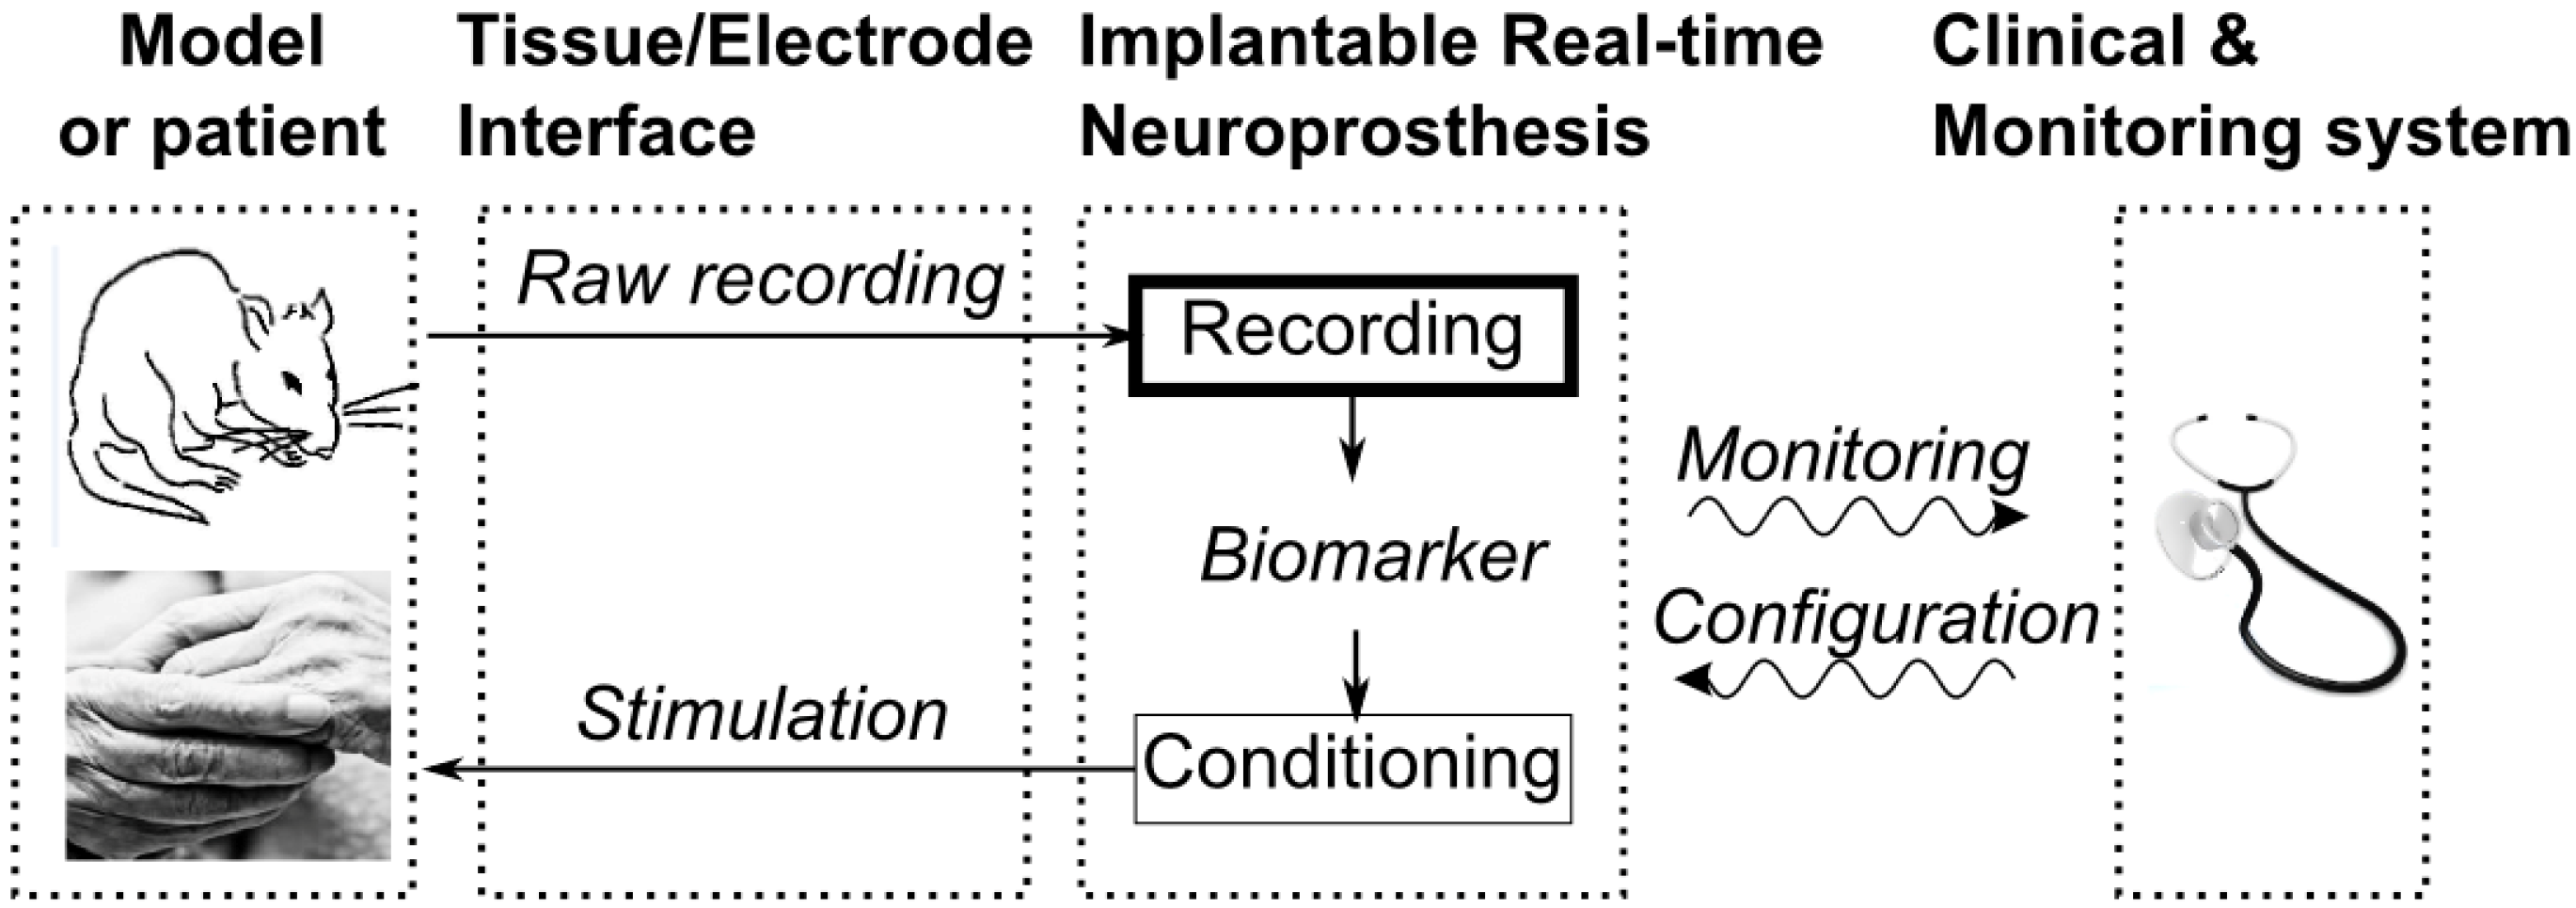
:1. Introduction


| Feature | Requirements | Specifications |
|---|---|---|
| Macro-electrode | Tissue/macro-electrode model on LFP band (NEX100) | No in vivo data |
| Engineering Challenges | Compliant with an closed-loop system using a single electrode (stimulation artifact) | Recording circuit strategy |
| Low power | ≥10 μW | |
| Low area | ≥0.2 mm2 | |
| Noise | 5 μVRMS | |
| in vivo biosignal | Characteristics | Range |
| LFP | Band | 1–300 Hz |
| Amplitude | 10 μV–1 mV | |
| Spike | Band | 300Hz–10 kHz |
| Amplitude | 10 μV–1 mV |
2. Design Methods
2.1. Specifications
2.1.1. Biosignal Characteristics
2.1.2. Tissue/Macro-Electrode Interface Characterization
2.1.3. Neuronal Amplifier Topology for Recording Circuit Strategy Used in Closed-Loop System for Artifact Rejection
2.1.4. Integrated Neuronal Amplifier Specifications
2.2. Design of the Integrated Neuronal Amplifier
2.2.1. Integrated Neuronal Amplifier Topology


2.2.2. Sizing Procedure and Layout Considerations
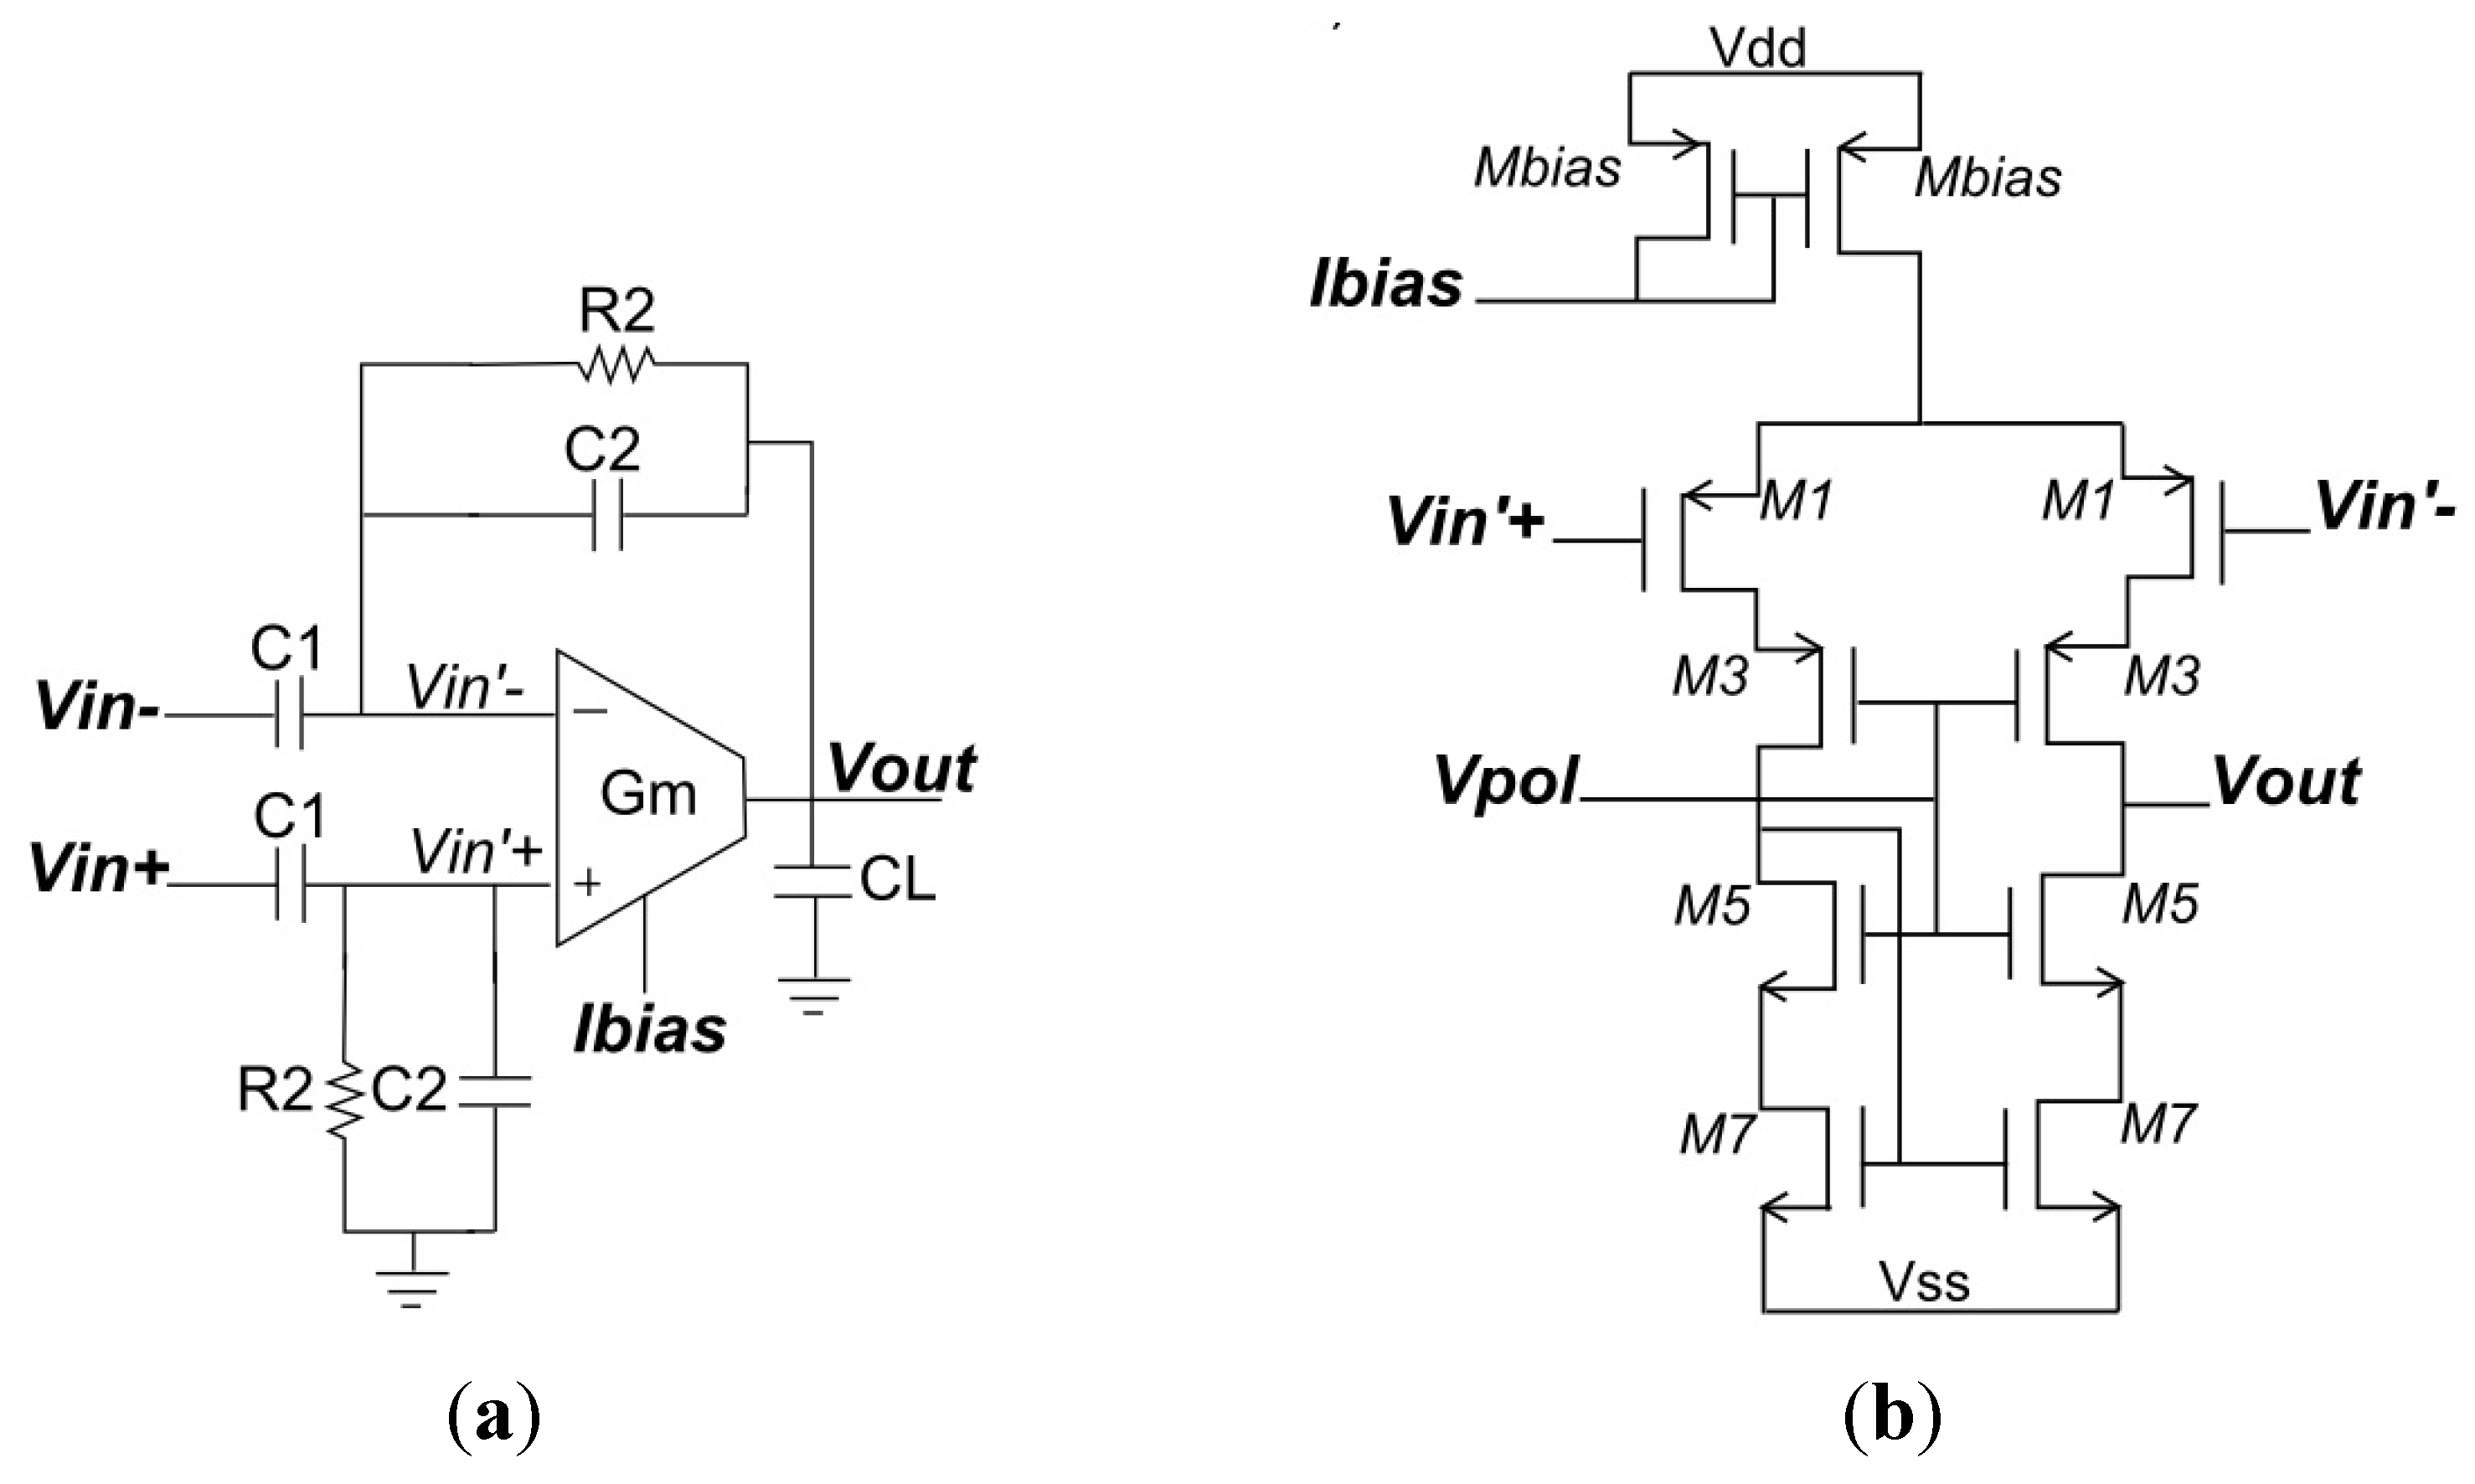
 is significantly larger than C2. Electrical specifications define the bandpass filter parameters. The definition of R2 dictates the C2 sizing in reference to the low cut-off frequency flow. Moreover, our neuronal amplifier design differs from others in that it uses a low gain. Although a high gain decreases the influence of the noise of subsequent stages, we limited it to 20dB as stated in the electrical specifications. Using Cadence simulations to evaluate performance and tradeoffs, we chose the following component values: C1 = 45 pF, C2 = 4.5 pF, CL = 8 pF, R2 = 35.3 GΩ, Gm = 5.02 µS.

3. Validation Methods
3.1. Animal Preparation
3.2. Tissue/Macro-Electrode Interface Characterization

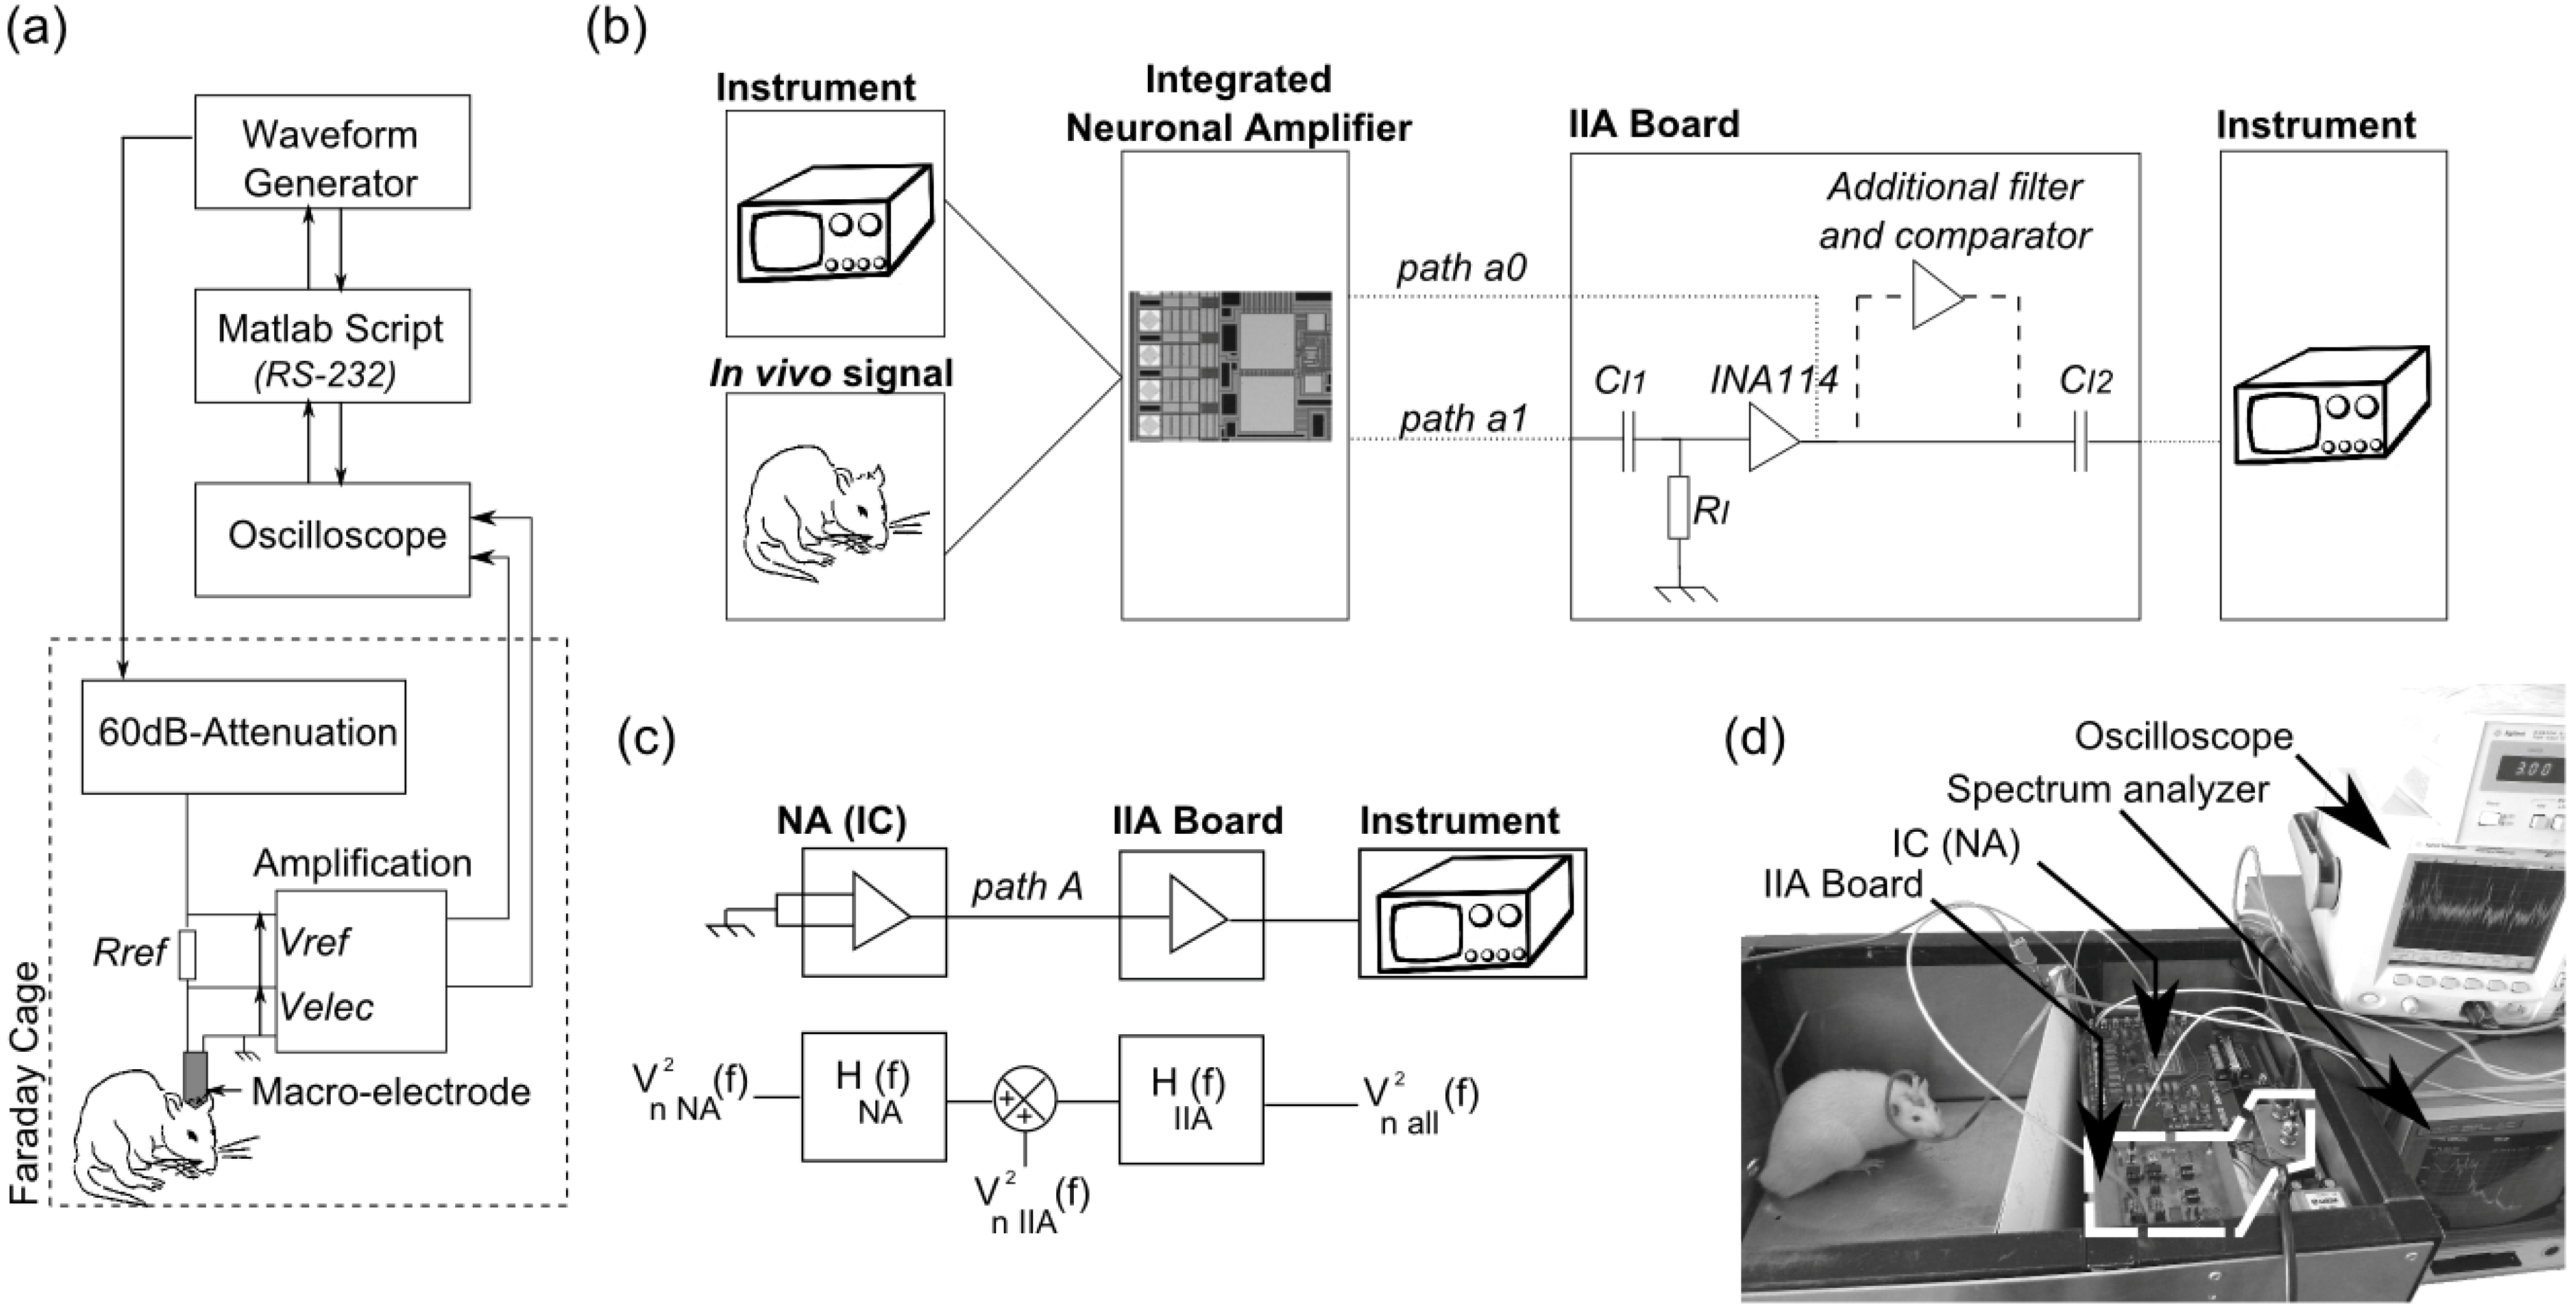
 of the NA on the integrated circuit and that on the IIA board or the overall chain and their transfer functions H(f). The setup used a Faraday cage and all device grounds and NA inputs were shorted. Measurements were recorded on a computer through a GPIB connection and controlled using Labview TM software. 4. The in vivo signal was recorded by a macro-electrode (NEX100, Phymep, France) and was connected to the integrated NA by a ground shielded wire, followed by the IIA board (path a1) and by instrumentation for recording or analyzing purposes (spectrum analyzer, oscilloscope, others). A single electric ground point was used for the overall setup.
3.3. Neuronal Amplifier Electrical Characterization
characterizations. Eight NA samples on eight chips were characterized. The overall measurement bandwidth was divided into two bands to improve the measurement resolution: 0.5–500 Hz and 0.1–10 kHz. The bandwidth resolution was defined as the tenth of the lowest frequency in those bands. The low frequency characterization down to DC (in the order of milli-hertz) was performed with an HP89410A spectrum analyzer. In order to measure the expected low cut-off frequency (1 Hz) for the frequency response characterization, a high value of CI2 (6.8 µF) was used.  (with NA and IIA board connected, and with NA inputs grounded), then we measured the IIA board noise PSD
  (without NA, and with IIA inputs grounded). Assuming that each contribution to noise (boards and instruments) is uncorrelated, the NA noise PSD
  is defined as in (4). Integration of discrete measured data lead to estimates of the equivalent input-referred noise over the measurement bandwidth
  as defined in Equation (5).

 the input referred noise (VRMS) usually integrated on the BW band; Itot the total supply current (A); Ut the thermal voltage; k the Boltzmann constant, and T the temperature (300.15 K).
3.4. Neuronal Amplifier Validation with Synthesized Bio-Signals
3.5. Neuronal Amplifier Validation with Awake Rodent Experiments
4. Results
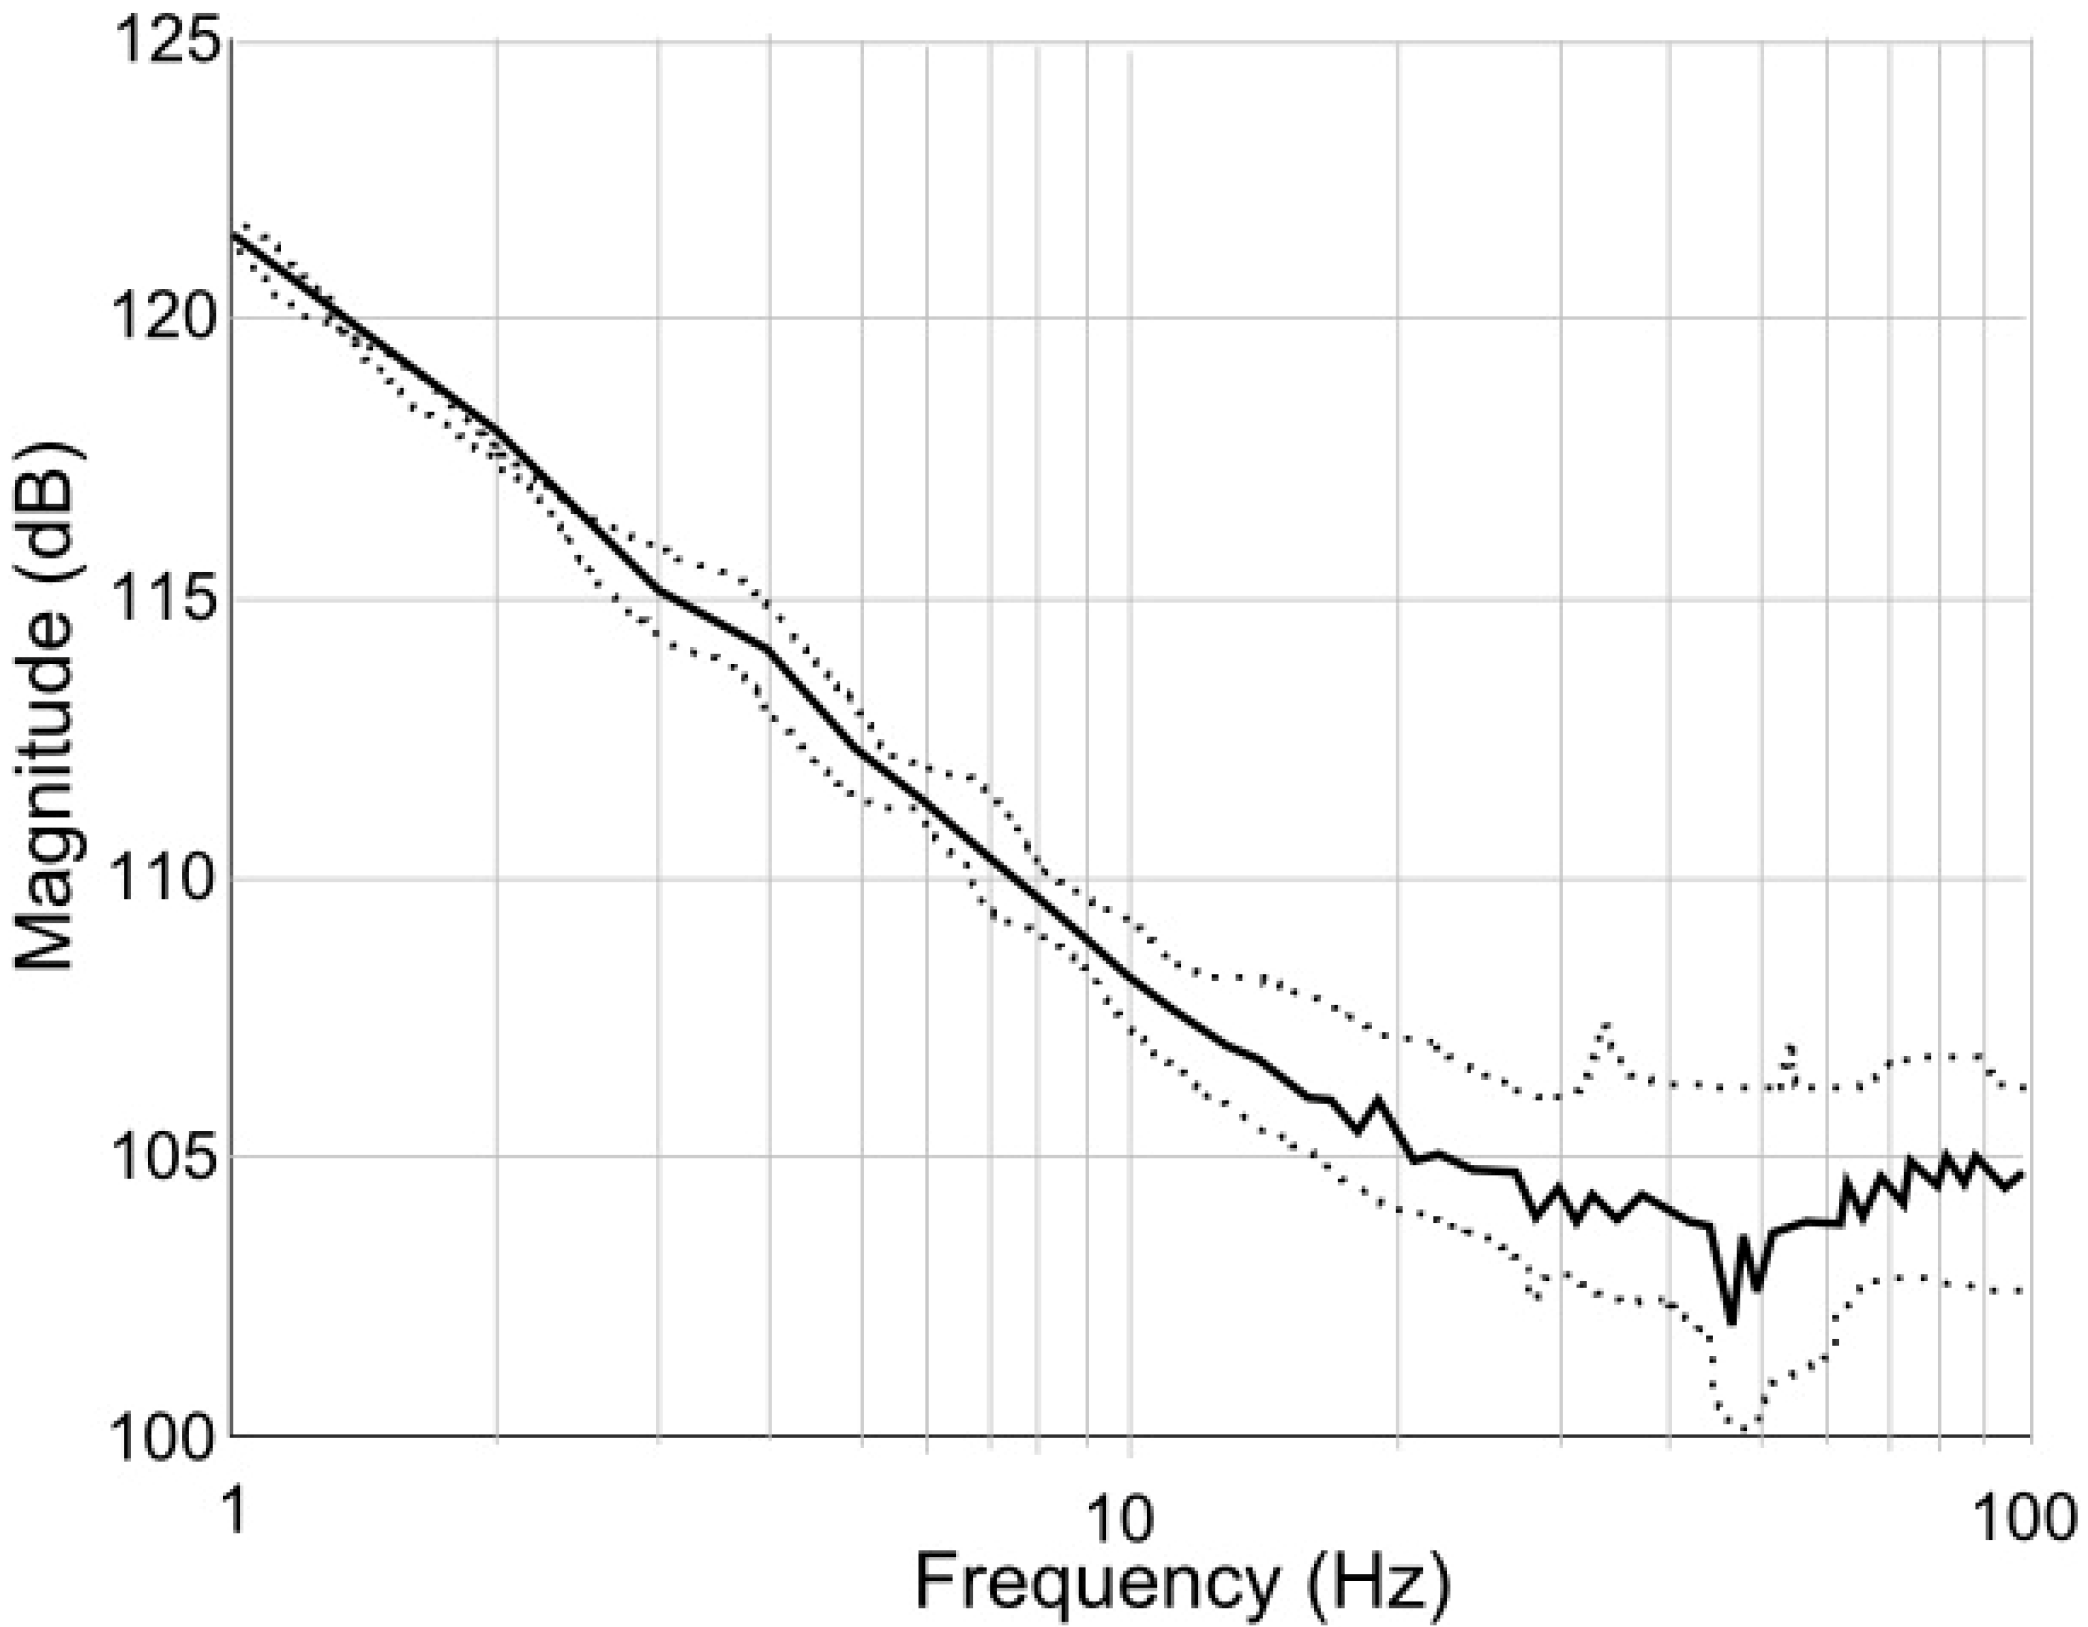
4.1. Tissue/Electrode Interface Characterization

| Electrode | Ce (F) | RP (Ohm) | RS (Ohm) |
|---|---|---|---|
| NEX100 (in vivo) | 34 nF | >4.68 MΩ | 67.8 kΩ |
| MS306/SP (in vivo) | 90 nF | >552 kΩ | 119 kΩ |
| NEX100 (in vitro) | 22.7 nF | >7 MΩ | 119 kΩ |
| MS306/SP (in vitro) | 17 nF | >4.7 MΩ | <95.5 kΩ |
| NEX100 (5 months) | 74 nF | >2.2 MΩ | 113 kΩ |
| Medtronic 3387 [10] | 10 µF | 2–5 kΩ | 1–500 Ω |
| Multielectrode array [32] | 12 pF | 6 TΩ | 2–5 kΩ |
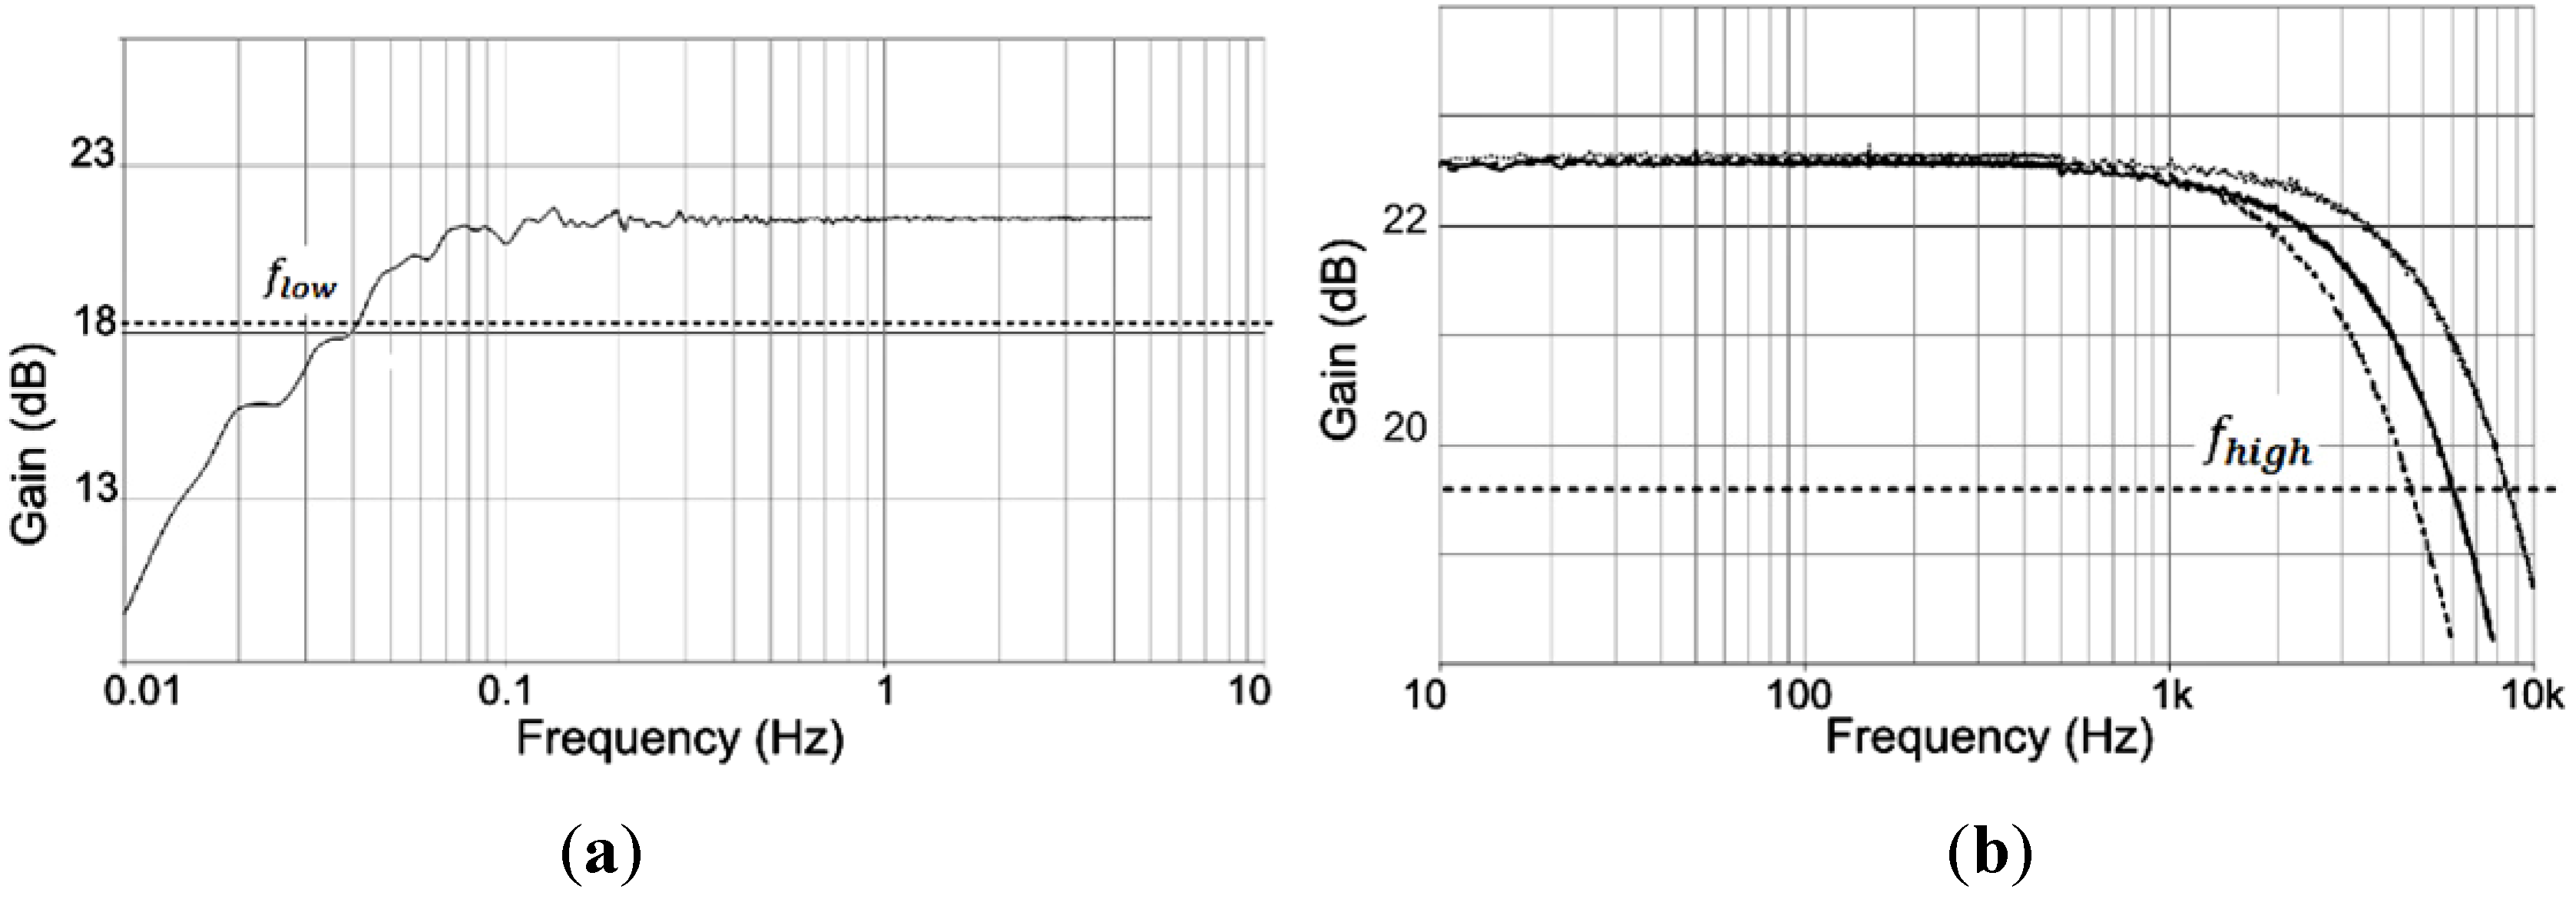
4.2. Neuronal Amplifier Electrical Characterization
| Parameter | Monte Carlo | Measure |
|---|---|---|
| Gain (dB) | 21.37 ± 3.94 | 22.53 ± 0.18 |
| High cut-off frequency(kHz) | 13.25 ± 4.13 | 8.60 ± 2.95 |
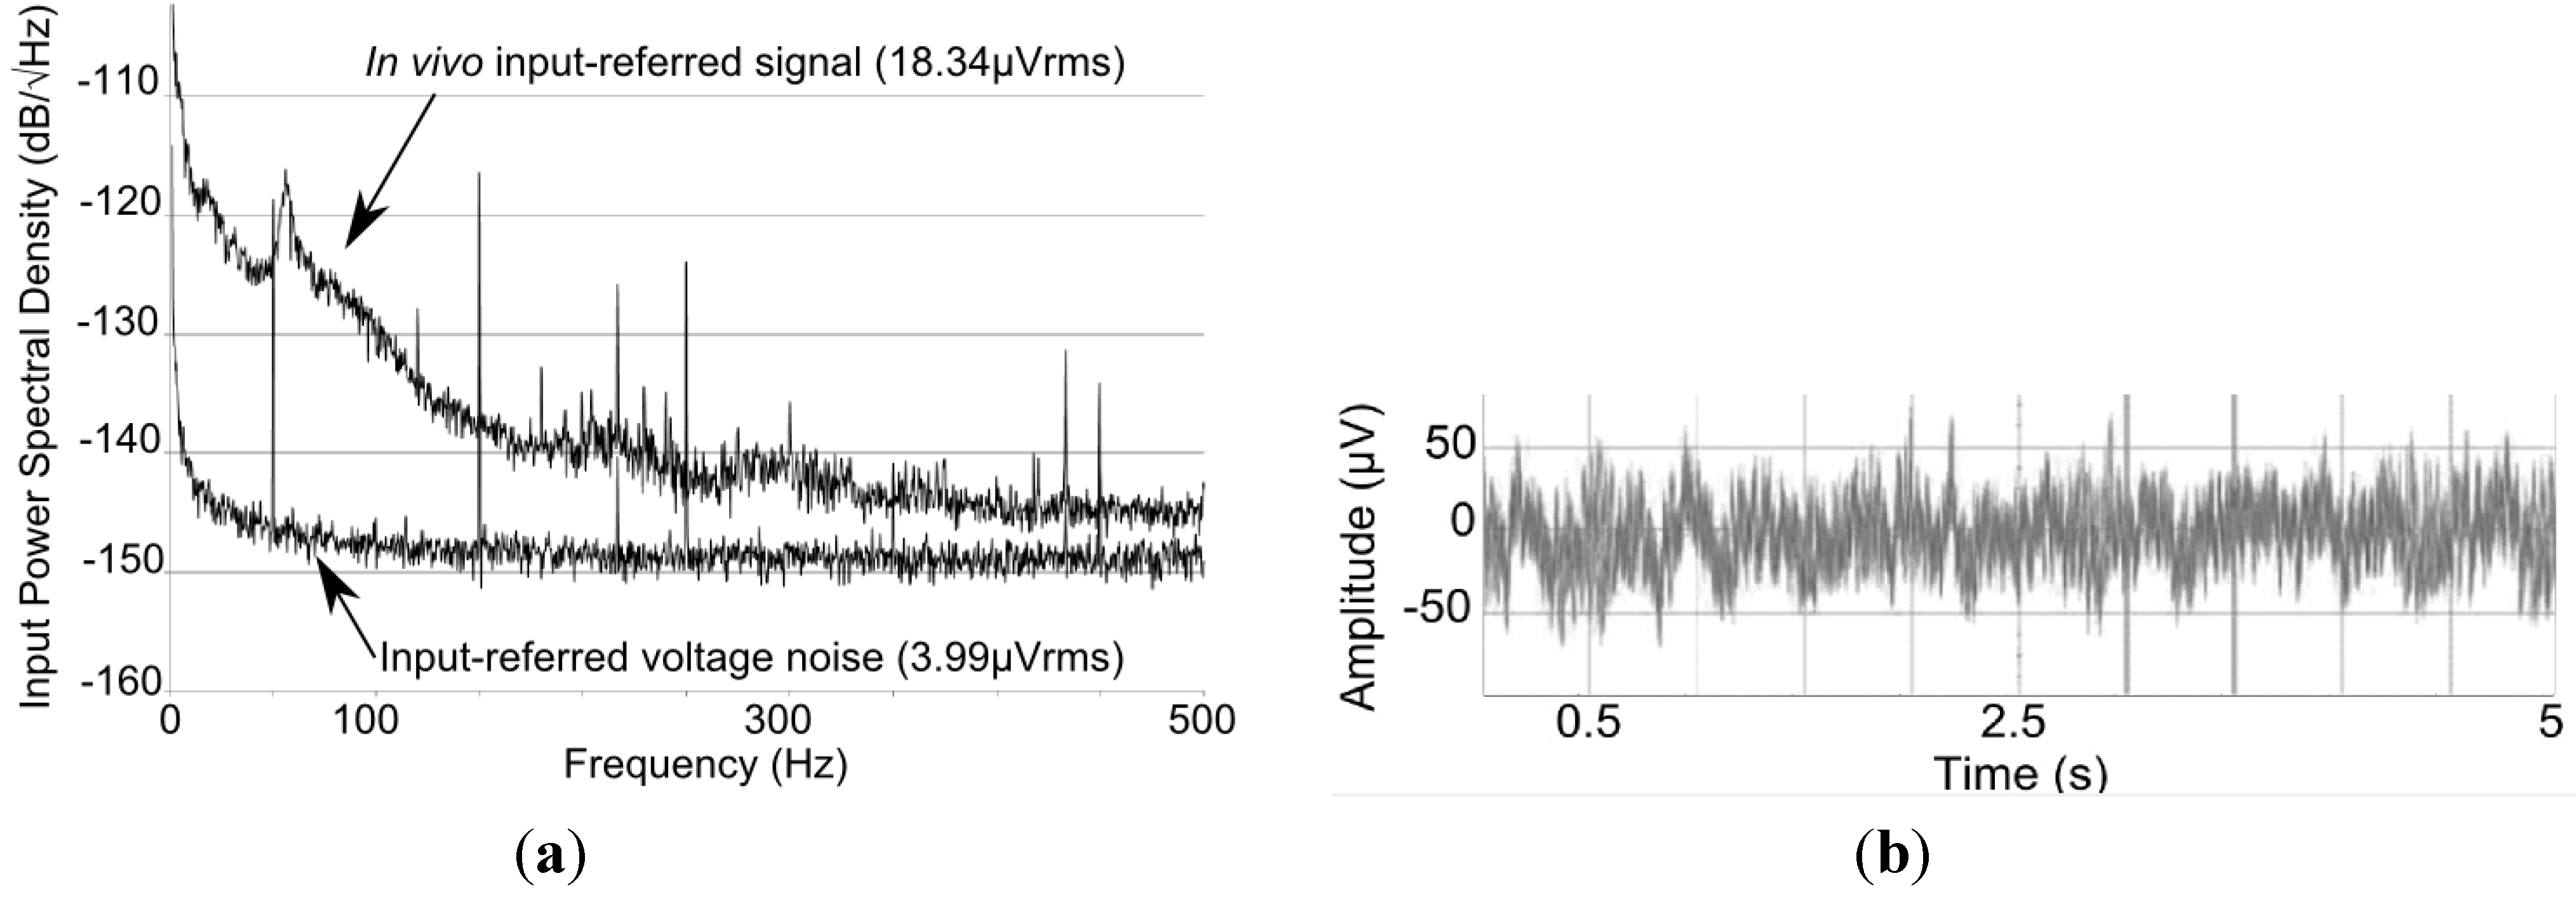
is also a maximum value, and was found to be 3.99 μVRMS over 1–10 kHz. Figure 7b illustrates the amplified input-referred in vivo signal.| Process (µm) | Gain (dB) | Spectrum (Hz) | [BW] (µVRMS, Hz) | NEF | Power/Area (µW/ mm2) | |
|---|---|---|---|---|---|---|
| 0.35 | This | 22.53 | 41.2 mHz–8.6 kHz | 3.99 [1–10 kHz] | 2.04 | 6.73/0.15 |
| [17] | 46–74 | 0.1–10 kHz | 13.0 [10–10 kHz] | 3.53 | 1.65/0.05 | |
| [18] | 34 | 2.6–6.2 kHz | 1.90 [1–6 kHz] | 5.10 | 66/N/A | |
| [33] | 33 | 10–5 kHz | 6.08 [10–5 kHz] | 5.55 | 8.4/0.02 | |
| 0.13 | [34] | 37 | 5–7 kHz | 5.5 [NA–7 kHz] | 2.58 | 1.5/N/A |
| 0.13 | [35] | 40 | 0.05–10.5 kHz | 2.2 [0.1–105 kHz] | 2.90 | 12.1/0.072 |
| 0.18 | [19] | 39.4 | 10–7.2 kHz | 3.5 [10–100 kHz] | 3.35 | 7.92/0.0625 |
| 1.5 | [36] | 80 | 0.5–10 kHz | 3.12 [0.5–50 kHz] | 13.80 | 300/N/A |
| 0.5 | [37] | 39.6 | 0.2–8.2 kHz | 1.94 [0.5–50 kHz] | 2.90 | 40.1/N/A |
4.3. Neuronal Amplifier Validation: Test-Bench Experiments
| Noise level | Waveform Generator | Recording Output |
|---|---|---|
| No noise wave | 20.4 V/V ± 4.0% | 2.9 V/V ± 7.2% |
| Noise level #1 | 3.0 V/V ± 2.1% | 2.2 V/V ± 6.4% |
| Noise level #2 | 2.2 V/V ± 1.6% | 2.0 V/V ± 6.5% |
| Noise level #3 | 1.9 V/V ± 2.6% | 1.7 V/V ± 6.8% |
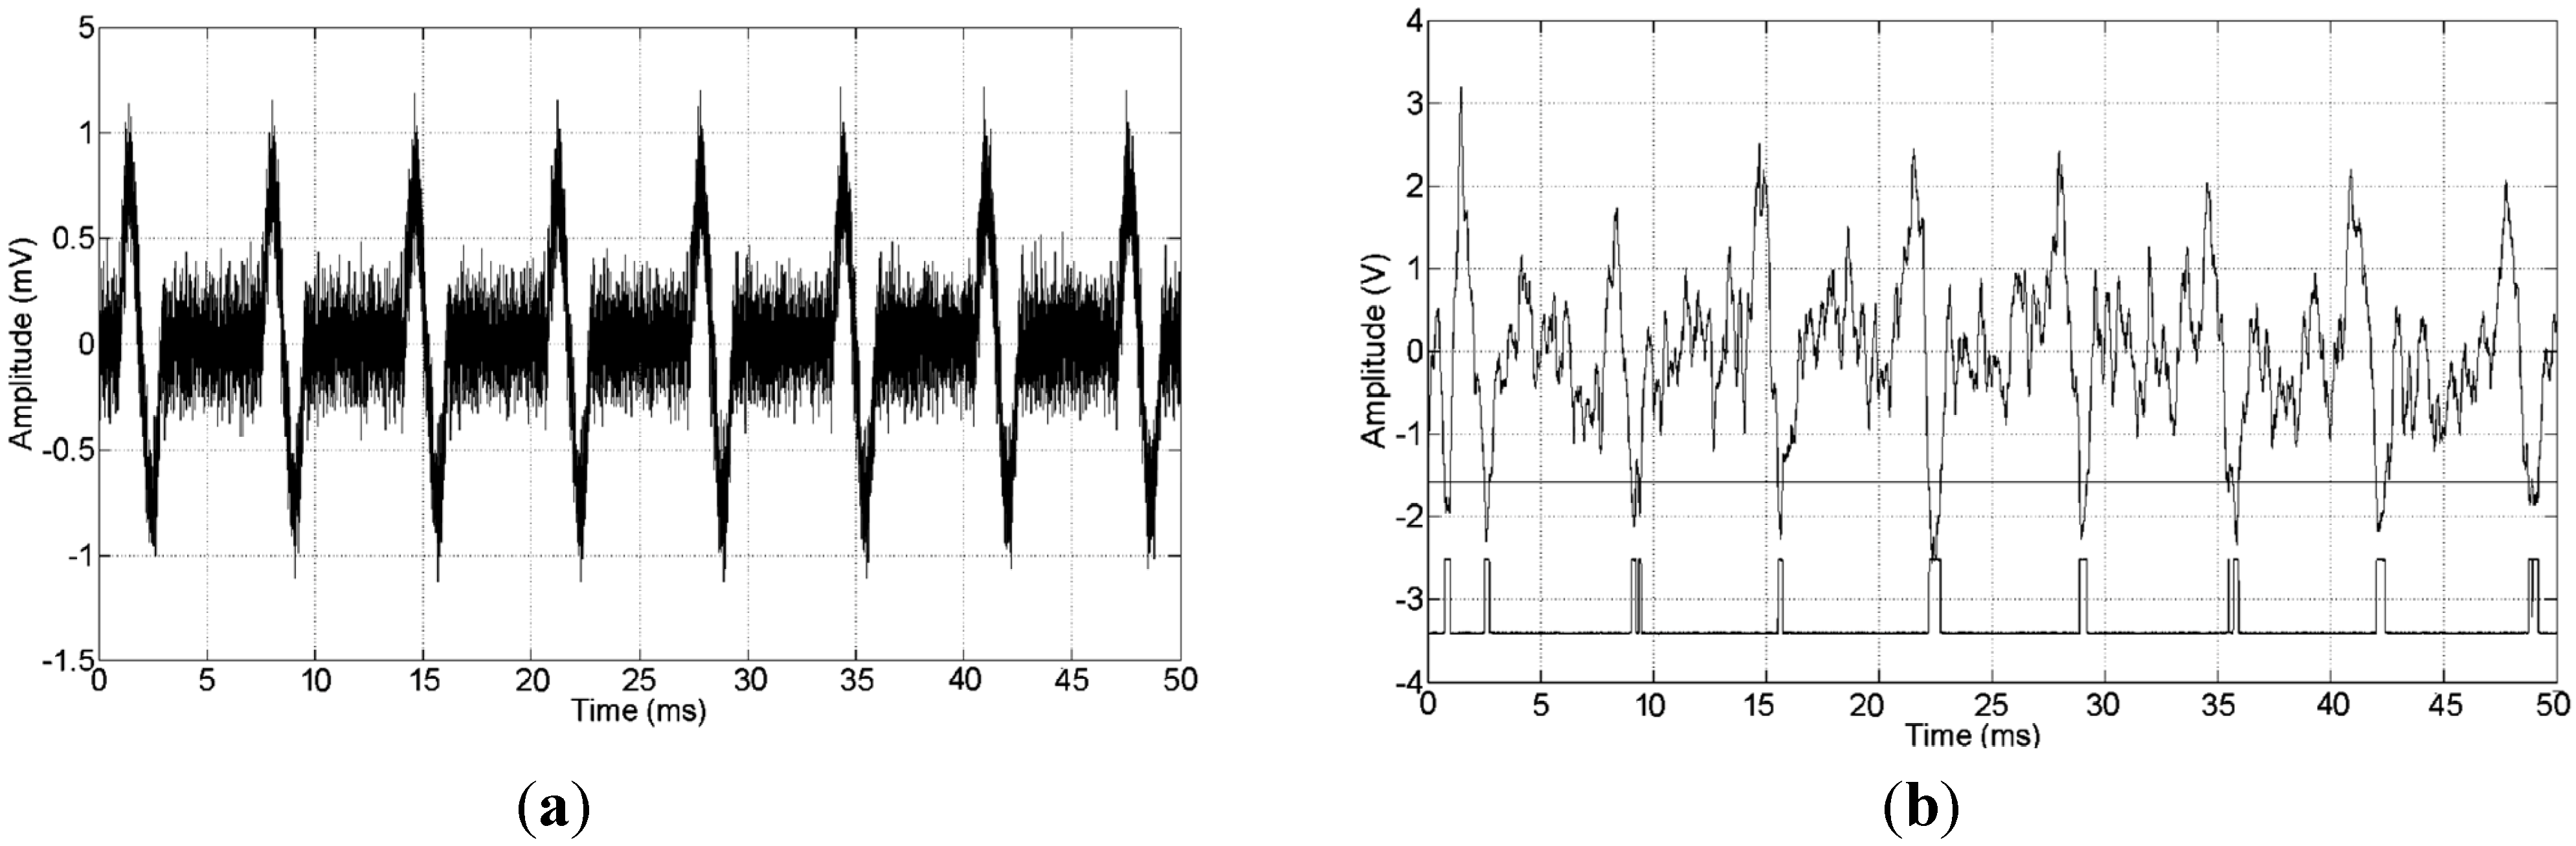
4.4. Neuronal Amplifier Validation: Awake Rodents Experiments
5. Discussion
5.1. Tissue/Electrode Interface Characterization
5.2. Neuronal Amplifier Topology
5.3. Neuronal Amplifier Performances
5.4. Neuronal Amplifier Validation: Test-Bench and Awake Rodent Experiments
Acknowledgment
Conflicts of Interest
References
- Eberle, W.; Penders, J.; Yazicioglu, R.F. Closing the Loop for Deep Brain Stimulation Implants Enables Personalized Healthcare for Parkinson’s Disease Patients. In Proceedings of the Annual International Conference of the IEEE Engineering in Medicine and Biology Society, MA, USA, 30 Auguest–3 September 2011; pp. 1556–1558.
- Santaniello, S.; Fiengo, G.; Glielmo, L.; Grill, W.M. Closed-loop control of deep brain stimulation: A simulation study. IEEE Trans. Neural Syst. Rehabil. Eng. 2011, 19, 19–24. [Google Scholar]
- Chung, P.Y.; Sheng, F.L.; Da, W.C.; Yi, C.L.; Fu-Zen, S.; Chao-Hsien, H. A portable wireless online closed-loop seizure controller in freely moving rats. IEEE Trans. Instrum. Meas. 2011, 60, 513–521. [Google Scholar] [CrossRef]
- Little, S.; Pogosyan, A.; Kuhn, A.A.; Brown, P. Beta band stability over time correlates with parkinsonian rigidity and bradykinesia. Exp. Neurol. 2012, 236, 383–388. [Google Scholar] [CrossRef]
- McLaughlin, M.; Lu, T.; Dimitrijevic, A.; Fan, G.Z. Towards a closed-loop cochlear implant system: Application of embedded monitoring of peripheral and central neural activity. IEEE Trans. Neural Syst. Rehabil. Eng. 2012, 20, 443–454. [Google Scholar] [CrossRef]
- Rossi, L.; Foffani, G.; Marceglia, S.; Bracchi, F.; Barbieri, S.; Priori, A. An electronic device for artefact suppression in human local field potential recordings during deep brain stimulation. J. Neural Eng. 2007, 4, 96–106. [Google Scholar] [CrossRef]
- Jochum, T.; Denison, T.; Wolf, P. Integrated circuit amplifiers for multi-electrode intracortical recording. J. Neural Eng. 2009, 6. [Google Scholar] [CrossRef]
- Kent, A.R.; Grill, W.M. Recording evoked potentials during deep brain stimulation: Development and validation of instrumentation to suppress the stimulus artefact. J. Neural Eng. 2012, 9. [Google Scholar] [CrossRef]
- Stanslaski, S.; Afshar, P.; Cong, P.; Giftakis, J.; Stypulkowski, P.; Carlson, D.; Linde, D.; Ullestad, D.; Avestruz, A.; Denison, T. Design and validation of a fully implantable, chronic, closed-loop neuromodulation device with concurrent sensing and stimulation. IEEE Trans. Neural Syst. Rehabil. Eng. 2012, 20, 410–421. [Google Scholar] [CrossRef]
- Wei, X.F.; Grill, W.M. Impedance characteristics of deep brain stimulation electrodes in vitro and in vivo. J. Neural. Eng. 2009, 6. [Google Scholar] [CrossRef]
- Lempka, S.F.; Miocinovic, S.M.; Jonson, M.D.; Vitek, J.L.; McIntyre, C.C.; Wei, X.F.; Grill, W.M. In vivo impedance spectroscopy of deep brain stimulation electrodes. J. Neural Eng. 2009, 6. [Google Scholar] [CrossRef]
- Gubellini, P.; Salin, P.; Kerkerian-Le, G.L.; Baunez, C. Deep brain stimulation in neurological diseases and experimental models: From molecule to complex behavior. Prog. Neurobiol. 2009, 89, 79–123. [Google Scholar] [CrossRef]
- Denison, T.; Consoer, K.; Santa, W.; Avestruz, A.T.; Cooley, J.; Kelly, A. A 2uw 100 nv/rthz chopper-stabilized instrumentation amplifier for chronic measurement of neural field potentials. IEEE J. Solid State Circuits 2007, 42, 2934–2945. [Google Scholar] [CrossRef]
- Harrison, R.R. A Versatile Integrated Circuit for the Acquisition of Biopotentials. In Proceedings of the IEEE Custom Integrated Circuits Conference, San Jose, CA, USA, 16–19 September 2007; pp. 115–122.
- Schwartz, A.B.; Cui, X.T.; Weber, D.J.; Moran, D.W. Brain-controlled interfaces: Movement restoration with neural prosthetics. Neuron 2006, 52, 205–220. [Google Scholar] [CrossRef]
- Dagtekin, M.; Wentai, L.; Bashirullah, R. A Multi Channel Chopper Modulated Neural Recording System. In Proceedings of the 23rd Annual International Conference of Engineering in Medicine and Biology Society, Istanbul, Turkey, 25–28 October 2001; pp. 757–760.
- Aziz, J.N.Y.; Genov, R.; Bardakjian, B.L.; Derchansky, M.; Carlen, P.L. Brain-silicon interface for high-resolution in vitro neural recording. IEEE Trans. Biomed. Circuits Syst. 2007, 1, 56–62. [Google Scholar] [CrossRef]
- Lopez, C.M.; Prodanov, D.; Braeken, D.; Gligorijevic, I.; Eberle, W.; Bartic, C.; Puers, R.; Gielen, G. A multichannel integrated circuit for electrical recording of neural activity, with independent channel programmability. IEEE Trans. Biomed. Circuits Syst. 2012, 6, 101–110. [Google Scholar] [CrossRef] [Green Version]
- Majidzadeh, V.; Schmid, A.; Leblebici, Y. Energy efficient low-noise neural recording amplifier with enhanced noise efficiency factor. IEEE Trans. Biomed. Circuits Syst. 2011, 5, 262–271. [Google Scholar] [CrossRef]
- Harrison, R.R.; Charles, C. A low-power low-noise CMOS amplifier for neural recording applications. IEEE J. Solid State Circuits 2003, 38, 958–965. [Google Scholar] [CrossRef]
- Bai, Q.; Wise, K.D. Single-unit neural recording with active microelectrode arrays. IEEE Trans. Biomedl. Eng. 2001, 48, 911–920. [Google Scholar] [CrossRef]
- Heer, F.; Hafizovic, S.; Franks, W.; Blau, A.; Ziegler, C.; Hierlemann, A. cmos microelectrode array for bidirectional interaction with neuronal networks. IEEE J. Solid State Circuits 2006, 41, 1620–1629. [Google Scholar] [CrossRef]
- Delbruck, T.; Mead, C.A. Adaptive photoreceptor with wide dynamic range. IEEE Int. Symp. Circuits Syst. 1994, 334, 339–342. [Google Scholar]
- Laker, K.R.; Sansen, W.M.C. Design of Analog Integrated Circuits and Systems; Mcgraw-Hill College Division: New York, NY, USA, 1994. [Google Scholar]
- Binkley, D.M.; Hopper, C.E.; Tucker, S.D.; Moss, B.C.; Rochelle, J.M.; Foty, D.P. A cad methodology for optimizing transistor current and sizing in analog CMOS design. IEEE Trans. Comput. Aided Des. Integr. Circuits Syst. 2003, 22, 225–237. [Google Scholar] [CrossRef]
- Harrison, R.R. The design of integrated circuits to observe brain activity. Proc. IEEE 2008, 96, 1203–1216. [Google Scholar] [CrossRef]
- Zbrzeski, A.; Lewis, N.; Syed, E.; Benazzouz, A.; Boraud, T.; Renaud, S. A Tunable Integrated Device for LFP Tracking. In Proceedings of the 26th Conference on Design of Circuits and Integrated systems, Albufeira, Portugal, 16–18 November 2011; pp. 439–442.
- Paxinos, G.; Watson, C. The Rat Brain in Stereotaxic Coordinates; Academic Press: London ,UK, 1998. [Google Scholar]
- Kolbl, F.; Zbrzeski, A.; Syed, E.; Renaud, S.; Lewis, N. In in vivo Electrical Characterization of Deep Brain Electrode and Impact on Bio-Amplifier Design. In Proceedings of the IEEE Biomedical Circuits and Systems Conference, Paphos, Cyprus, 3–5 November 2010; pp. 210–213.
- Steyaert, M.S.J.; Sansen, W.M.C. A micropower low-noise monolithic instrumentation amplifier for medical purposes. IEEE J. Solid State Circuits 1987, 22, 1163–1168. [Google Scholar] [CrossRef]
- Zbrzeski, A.; Hasler, P.; Ko, X.; lbl, F.; Syed, E.; Lewis, N.; Renaud, S. A Programmable Bioamplifier on FPAA for in vivo Neural Recording. In Proceedings of the IEEE Biomedical Circuits and Systems Conference, Paphos, Cyprus, 3–5 November 2010; pp. 114–117.
- Najafi, K.; Wise, K.D. An implantable multielectrode array with on-chip signal processing. IEEE J. Solid State Circuits 1986, 21, 1035–1044. [Google Scholar] [CrossRef]
- Shahrokhi, F.; Abdelhalim, K.; Serletis, D.; Carlen, P.L.; Genov, R. The 128-channel fully differential digital integrated neural recording and stimulation interface. IEEE Trans. Biomed. Circuits Syst. 2010, 4, 149–161. [Google Scholar] [CrossRef]
- Chaturvedi, V.; Amrutur, B. An area-efficient noise-adaptive neural amplifier in 130 nm cmos technology. IEEE J. Emerg. Sel. Top. Circuits Syst. 2011, 1, 536–545. [Google Scholar] [CrossRef]
- Zhang, F.; Holleman, J.; Otis, B.P. Design of ultra-low power biopotential amplifiers for biosignal acquisition applications. IEEE Trans. Biomed. Circuits Sys. 2012, 6, 344–355. [Google Scholar] [CrossRef]
- Farshchi, S.; Pesterev, A.; Nuyujukian, P.; Guenterberg, E.; Mody, I.; Judy, J.W. Embedded neural recording with tinyos-based wireless-enabled processor modules. IEEE Trans. Neural Syst. Rehabil. Eng. 2010, 18, 134–141. [Google Scholar] [CrossRef]
- Mollazadeh, M.; Murari, K.; Cauwenberghs, G.; Thakor, N. Micropower cmos integrated low-noise amplification, filtering, and digitization of multimodal neuropotentials. IEEE Trans. Biomed. Circuits Syst. 2009, 3, 1–10. [Google Scholar] [CrossRef]
- Olsson, R.H., III; Wise, K.D. A three-dimensional neural recording microsystem with implantable data compression circuitry. IEEE J. Solid. State Circuits 2005, 40, 2796–2804. [Google Scholar] [CrossRef]
- Yazicioglu, R.F.; Merken, P.; Puers, R.; Van Hoof, C. A 60 µw 60 nv/hz Readout Front-End for Portable Biopotential Acquisition Systems. In Proceedings of the IEEE International Solid-State Circuits Conference, San Francisco, CA, USA, 6–9 February 2006; pp. 109–118.
- Ziel, A.V.D. Noise: Sources, Characterization, Measurement; Prentice-Hall: Upper Saddle River, NJ, USA, 1970. [Google Scholar]
© 2013 by the authors; licensee MDPI, Basel, Switzerland. This article is an open access article distributed under the terms and conditions of the Creative Commons Attribution license (http://creativecommons.org/licenses/by/3.0/).
Share and Cite
Zbrzeski, A.; Lewis, N.; Rummens, F.; Jung, R.; N'Kaoua, G.; Benazzouz, A.; Renaud, S. Low-Gain, Low-Noise Integrated Neuronal Amplifier for Implantable Artifact-Reduction Recording System. J. Low Power Electron. Appl. 2013, 3, 279-299. https://doi.org/10.3390/jlpea3030279
Zbrzeski A, Lewis N, Rummens F, Jung R, N'Kaoua G, Benazzouz A, Renaud S. Low-Gain, Low-Noise Integrated Neuronal Amplifier for Implantable Artifact-Reduction Recording System. Journal of Low Power Electronics and Applications. 2013; 3(3):279-299. https://doi.org/10.3390/jlpea3030279
Chicago/Turabian StyleZbrzeski, Adeline, Noëlle Lewis, Francois Rummens, Ranu Jung, Gilles N'Kaoua, Abdelhamid Benazzouz, and Sylvie Renaud. 2013. "Low-Gain, Low-Noise Integrated Neuronal Amplifier for Implantable Artifact-Reduction Recording System" Journal of Low Power Electronics and Applications 3, no. 3: 279-299. https://doi.org/10.3390/jlpea3030279