Article

Constructing a 3D Multiple Mobile Medical Imaging System through Service Science, Management, Engineering and Design

1
Institute of Computer Science and Engineering, National Chiao Tung University, Hsihchu 30010, Taiwan
2
Faculty of International Tourism and Management, City University of Macau, Macao
3
Institute of Network Engineering, National Chiao Tung University, Hsinchu 30010, Taiwan
4
College of Computer Science, National Chiao Tung University, Hsinchu 30010, Taiwan
*
Author to whom correspondence should be addressed.
Submission received: 11 November 2016 / Revised: 4 January 2017 / Accepted: 11 January 2017 / Published: 17 January 2017
(This article belongs to the Special Issue Service Systems)

Abstract

:
Following the trend of using mobile devices for healthcare, a 3D multiple mobile medical imaging system (3D MMMIS) for doctor’s diagnosis and treatment was constructed through service science, management, engineering and design (SSMED) that can co-create the value between technology and humanity. Service experience engineering (SEE) methods were applied to a scenario of a doctors’ consultation, which is a deliberation of two or more healthcare doctors about diagnosis or treatment in particular cases. Proof of service was processed to test the prototype of the 3D MMMIS to check the doctors’ satisfaction with the innovative systems. Results show that doctors are satisfied with the 3D MMMIS. Conclusions suggested that the 3D MMMIS can be a helpful health technology for future healthcare.

1. Introduction

The potential for mobile devices to transform healthcare and clinical intervention in the healthcare industry is tremendous. Extensive reviews of the use of mobile phones and handheld computing devices in health and clinical practice can be found [1,2]. Kaplan [3] highlighted the successful use of mobile devices to support telemedicine and remote healthcare in developing nations, with examples including their use in off-site medical diagnosis [4]. Studies assessing specific functionalities of mobile devices have recently featured in the literature, including a cloud service for dental care [5,6,7], an examination of the use of onboard digital diaries in symptom research [8] and the use of short message service (SMS) text in the management of behavior change. Kailas et al. [9] claimed that there are already in excess of 7000 documented cases of smartphone health apps. Free et al. [1] highlight several key features that give advantages to the mobile phone over other information and communication technologies, including portability, continuous uninterrupted data stream and the capability through sufficient computing power to support multimedia software applications. Significant economic benefits have also been reported where mobile communication is employed in the provision of remote healthcare advice and telemedicine [10].
However, the application of mobile devices to the 3D medical imaging field is still limited. Synchronization of 3D medical imaging on multiple devices is even rare. Most importantly, the 3D multiple mobile medical imaging system (MMMIS) is a solution for doctors’ consultation of cases through their own mobile devices. Thus, this study does not just construct a health technology on engineering perspective, but also designs a service that can fulfill the requirements of doctors from the humanity perspective. There are many challenges to the development of the 3D MMMIS. User-oriented service is the most significant key to conquering all challenges. The mobile platform must be user-friendly, seamless and autonomous, in its operation, as well. System and service reliability is also an important issue; exact diagnosis and treatment are vital for some emergency cases. From an implementation point of view, the issues regarding the implementation of intelligent mechanisms in a mobile resource-limited device should also be considered. In order to close the gap between service-oriented requirements and technology-driven devices, service science, management, engineering and design (SSMED) was implemented for the 3D MMMIS to highlight the core of value co-creation through interdisciplinary collaboration. In practice, the present case study aims to demonstrate the process of the service design of the 3D MMMIS that can meet the requirements of doctors’ diagnosis and treatment to show the potential of applying mobile devices and apps in the healthcare industry.
The present study was initiated from a perspective of service innovation in applying the technology of mobile devices and medical image processing for the consultation among doctors in a surgery or between a doctor and a patient in a clinic. Service experience engineering (SEE) was conducted to investigate the service requirements of doctors’ usage of medical image processing through mobile devices. Service functions of the 3D MMMIS were extracted by the research team, and a prototype was developed to adjust the service system for doctors’ satisfaction in consultation. Finally, proof of service was conducted for doctors’ satisfaction of the 3D MMMIS for practical consultation. This study aims to apply modern information and communication technology (ICT) for our healthcare. For example, a doctor and a patient can use their own mobile devices to show a cascade of medical images through the 3D MMMIS to discuss the doctor’s diagnosis and further treatment for the patient. Figure 1 gives an overview of this study.

2. Service Innovation on Mobile Medical Image Processing

2.1. Service Innovation

The term “service innovation” is defined as the service process from idea to specification [11,12]. This definition of service innovation was formed from a narrow view of being concerned with the “idea generation” portion of the new service development process [13] to the entire process of service development [14]. The concept of service innovation has been raised by IBM as the goal of SSMED, which is the interdisciplinary study of service systems aiming to create a basis for systematic service innovation [15]. SSMED integrates diverse fields with an interdisciplinary approach not only to study the service in humanity factor, but also to develop the service systems in technology factor. Such an approach requires collaboration among different disciplines, government, academia and enterprises to achieve service innovation [16]. At the heart of SSMED is transferring and sharing resources within and among service systems through service design. Four categories of resources have been noted and examined, namely: (1) resources with rights (e.g., people and organizations); (2) resources as property (e.g., intellectual property); (3) physical entities (e.g., technology); and (4) socially-constructed entities (e.g., shared information) [17]. Spohrer and Maglio [15] explained that “entities within service systems exchange competence along at least four dimensions: information sharing, work-sharing, risk-sharing, and goods-sharing.” They suggested that the key to understanding the exchange of resources within service systems could be found in the distribution of competences, such as knowledge and skills, among service systems. Understanding the value co-creation propositions that connect such systems is also essential. Applying the knowledge of SSMED can then co-create higher value through interdisciplinary collaboration in constructing service systems through service design. SSMED is an emerging discipline concerned with the evolution, interaction and reciprocal co-creation of value among service systems [18]. SSMED can foster the capability of systemic service innovation for industrial upgrading. Industrial value is created by reengineering business processes and the application of new technology based on a service-oriented value co-creation proposition. Value co-creation can be achieved by interdisciplinary collaboration among stakeholders in an integrated system. The present research aims to apply SSMED to deploy service innovations for the healthcare industry. We narrowed down the application to the healthcare devices, which is the 3D MMMIS for doctors, to fulfill the action philosophy of SSMED towards to service innovation for doctors’ diagnosis function.

2.2. 3D MMMIS-Explicit Related Works

In the 3D visualization field, virtual reality is already a widely-used technology to provide user 3D illusions, and the user can interact with 3D objects by wearing special design equipment. In immersion virtual reality, a user can see 3D scenes by wearing a head-mounted display or standing in a room with surrounding digital projections, as well as interact with 3D objects by wearing hand motion capture gloves or equipped with other devices that have sensors inside for motion detection. The pCubee was invented to combine 3D display and motion capture in one device [19]. However, the above technologies have three drawbacks. First, the hardware is expensive and difficult to reach. Second, the hardware is heavy. Third, a big room for display is needed. Mobility restraint limits the user to see 3D images anywhere anytime. Thus, the rapid development of mobile devices, equipped with various sensors, has been provided a solution for 3D visualization and interaction. As a result, in this study, we proposed to use mobile devices as our display and interaction devices.
Traditional visualization technique rendered 2D images to form the 3D object in two steps. First, construct the 3D model of the 3D object. The 3D model is created by a set of points in the 3D space, which are connected by geometric data, such as lines. Second, render the shape of 3D objects from 2D images according to the user’s viewpoint. However, in some cases, cutting faces of objects are more valuable than shapes of objects. For example, in medical imaging, the cutting face of the body is more important than the appearance of the body. Therefore, we propose a multi-plane 3D display system that employs a novel rendering method for constructing cutting faces of a 3D object via multiple handheld devices. Computed tomography image was applied as a 3D image source in the present study. Magnetic sensor data and the accelerometer data were used to obtain the orientation and to compute the cutting faces for displaying on mobile devices. We developed multiple handheld devices that can interact with each other and cooperate to see cutting faces at different positions in 3D objects.
Nowadays, a variety of sensors, including accelerometers, orientation sensors and gyroscope sensors, has become basic equipment in mobile devices; therefore, many works take advantage of different sensors to generate various 3D interaction commands to manipulate the 3D object or change user’s point of view. For instance, Chittaro and Ranon [20] used an accelerometer to manipulate the 3D molecular model. They provide a system that they can rotate the 3D molecular model by leaning a mobile device and change viewing location by moving a mobile device. The accelerometer in the system will detect the leaning direction and rotate the molecular model in the same direction. Hürst and Helder [21] provided two visualization concepts and used different sensors for each concept. One was shoebox visualization, and the other was fixed world visualization. In the shoebox visualization concept, graphics were changed based on the accelerometer to create an illusion of a box attached to the mobile device. On the other hand, in the fixed world visualization concept, graphics were changed based on the orientation sensor to create an illusion of a box surrounding the user. Moreover, they also provided touch methods to navigate or select objects in the scene. Hansen, et al. [22] used the orientation sensor in the mobile device acting like a controller when a user wants to navigate in the virtual reality environment on a large display; they can tilt the phone for viewpoint transforming. The tilting is detected by the orientation sensor. In addition, they also designed touch interactions to control avatar moving and viewing camera zooming. Geen and Krakauer [23] used mobile devices as controllers to manipulate 3D objects shown on a large display. They used the gyroscope sensor to detect moving and rotating for users to move and rotate objects. However, user’s point of view can be speculated not only by utilizing sensors’ information, but also by face tracking. Thus, Francone and Nigay [24] computed the position of the device according to the user’s head and use it to control the viewpoint on a 3D scene. However, the 360 degrees of the scene can be seen only when using sensors. Studies about the 3D visualization are increasing; however, they mainly focus on one mobile device. Limited works discuss applying more than one mobile device for the 3D visualization.
Some studies develop information sharing systems for which the user can interchange information among mobile devices and public displays through interaction methods. Francone and Nigay [24] allow users to interchange digital information among their portable computers, table and wall displays, as well as other physical objects through hyper-dragging. A proposed interaction technique of hyper-dragging is that users can easily share information like a picture or video by using a cursor to drag them to the physical place where they want to upload the information [25]. As a result, tables and walls can be seen as a spatially-continuous extension of personal portable computers. Their work has an embedded infrastructure including an embedded control surface and two embedded displays. They provided a collaborative workspace that users can connect their personal mobile devices with the workspace through a network and share information or their personal screen with others by manipulating the control surface. Butler et al. [26] proposed a pairing method to solve the problem of identifying who is interacting with a multi-user interactive touch display in a multiple mobile device situation. They use a depth camera to track user position and associate each mobile device with a particular user by analyzing accelerometer data on the mobile device. Then, body tracking and touch contact positions are compared to associate a touch contact with a specific user. After these identification processes, users can interchange information among personal mobile devices and the public touch screen. Kray et al. [27] investigated whether gesturing with a mobile phone can help to perform complex tasks involving two devices, and recommended several possible techniques for gesture recognition; for example, measuring the signal strengths or runtime differences between signals to estimate the distance between mobile devices and using this to recognize devices’ approaching or pulling away gestures. Hinckley [28] provided a different gesture recognition method to recognize bumping between mobile devices. Users can tile together the displays of multiple tablets just by physically bumping a tablet into another one lying flat on a desk. The tiling is detected by an accelerometer. However, studies about the interaction between mobile devices have not been concerned with the 3D visualization and the 3D interaction in their works. Thus, this study aims to fill the gaps mentioned above.

3. Methodology

3.1. Scenario

The 3D MMMIS is a new mobile app specifically designed for doctors to facilitate consultation or communication for healthcare purpose. Doctors can setup the 3DMMMIS on their smartphones or other mobile devices when discussing and making a diagnosis with other doctors, namely doctors’ consultation. According to this scenario, we offer the solution of the 3D MMMIS through interdisciplinary collaboration from different files. The research team was formed by 3 doctors in the fields of family medicine and dentistry and 3 researchers in the fields of computer science and service science. Thirty doctors joined as volunteers for proof of service in a hospital of the T University, a flagship public University in Taiwan, at the final stage of this study. The interdisciplinary collaboration took actions to implement the core of service science, value co-creation, through constructing the 3D MMMIS of medical innovation for human’s wellness.

3.2. SEE

The activism of SSMED can be implemented through service experience engineering (SEE) methodology (Figure 1) [29]. For example, several integrated service systems have been constructed through SEE to offer service innovations [6,7,16,30]. The current research applied an experimental design to determine the service of the 3DMMMIS through SEE, which is a potentially useful and easy to implement technique from user experiences for developing new services that really satisfy users. SEE methods were conducted through a two-stage process to design the services of the 3D MMMIS that satisfy the requirements of users, such as doctors and patients. The first stage was service experience inquiry, which obtains insights into the needs of users. The second stage was service design, which comprises quality function deployment (QFD), service blueprint and service resource support, to improve the service of the 3D MMMIS [6,7,16,30]. The service-oriented contents are value co-creation systems that can be performed by these two stages.

3.2.1. Service Experience Inquiry

The first stage of service experience inquiry applies qualitative research methods to explore the perceived requirements of users when designing the 3D MMMIS. The process involves service requirement inquiry, contextual inquiry, as well as service opportunities and deployment. These methods are the user-centered design of the ethnographic research method to focus on problem identification and action implementation. The inquiry interview is structured as a one-on-one interaction in which researchers observe users undertaking their normal activities and discuss their actions when designing the 3D MMIS. Service problems can be found and solved during this process. Service requirement discovery is then used to develop every possible service opportunity. Brainstorming is performed frequently to create new ideas. A cause and effect chart is constructed to integrate comprehensive insights into the value of users in large data and to include creative ideas to capture validated items and service requirements of service design for the next stage of research [6,7,16].

3.2.2. Service Design

The second stage of the service design is conducted after the first stage of service experience inquiry. Researchers list and analyze service contents by QFD, followed by backup systems of service blueprint and service resource support to identify the service contents and to implement the service system of the 3D MMMIS. The processes of the service design are conducted through three methods. First, QFD: QFD reveals the relationship among service requirements, functions and thresholds that facilitate communication during the service design period. QFD is demonstrated as a foundation to reveal the actual needs of users. Second, service blueprint: The service blueprint offers a systematic view to the service providers that can lead to the type of experimentation and management necessary for service innovation and development [31]. A mutual involvement design process helps service providers and receivers to experience and adjust service contents to the actual requirements in the 3D MMMIS. A service blueprint is a technique used for service interactions. This method highlights processes within a system and divides service processes into different components. These components are separated by end users, onstage, backstage and support processes to clarify the responsibilities and designated resources for the different interfaces of the system. Third, service resource support: Service resources were provided to implement the services in the QFD and the processes in the service blueprint of the 3D MMMIS. Resources of hardware and software, as well as academic and practical organizations, were used to back up the operating function of the 3D MMMIS [6,7,16,30]. Service modeling followed the results of SEE results and constructed a service prototype to test the performance of the 3D MMMIS.

3.3. Service Modelling

Service modelling concluded the results of SEE methods that were used to construct the service prototype of the 3D MMMIS. Figure 2 indicates that users have 6 service requirements, which were listed in the QFD to obtain suggestions for the 3D MMMIS. Three service functions were chosen to develop the 3D MMMIS with unique service thresholds and competitive advantages. Each combination of service user and provider requirement is considered in turn by the QFD team. Research team members and users joined together to identify if the interrelationships of QFD elements were significant [32]. Service functions were integrated as positive correlation signs at the top of the QFD. Correlations of service requirements and service functions are indicated by the numbers in the middle of the matrix. Number 5 indicates the strongest correlation. This study found that service demand and supply should be fulfilled when the strongest correlation was indicated in QFD, such that the service design and prototype of the 3D MMIS could be implemented with good quality. The semantic context of the analysis is the delivery of the right service to address the real needs of users in service systems. Based on QFD, the service opportunities appear from the strong requirements of users. We found that six service requirements of the 3D medical imaging, medical image processing, mobile device app, consultation, communication and doctor-patient relationship were essential for users. We concluded that 3 service functions of the 3D medical imaging, mobile app and cloud platform can be provided to fulfil the service requirements with service thresholds of multiple devices, user experience (UX) and cloud computing. Compared to functions working on PC, the 3D MMMIS performed better on the requirements of the 3D medical imaging, mobile device app, consultation and commutation. The requirement of medical image processing cannot satisfy users mainly because the bandwidth and throughput performance are still working better on a PC.
The service blueprint (Figure 3) illustrates the interactions among layers of the user, onstage, backstage and support process. The service blueprint enabled the research team to test the service concept on paper before service prototypes were made. The blueprint facilitated problem solving and creative thinking by identifying the potential points of failure and highlighting the opportunities to enhance user perceptions of the service. Corresponding to the QFD and service blueprint, service resources assure that service design can be implemented to construct the 3D MMMIS. The contribution of the present study is the application of SEE to the 3D MMMIS for medical service innovation that consequently enlarges the activism of service design to a better quality of healthcare [6,16,30].

4. Results

4.1. The Practical Result: Construction of the 3D MMMIS

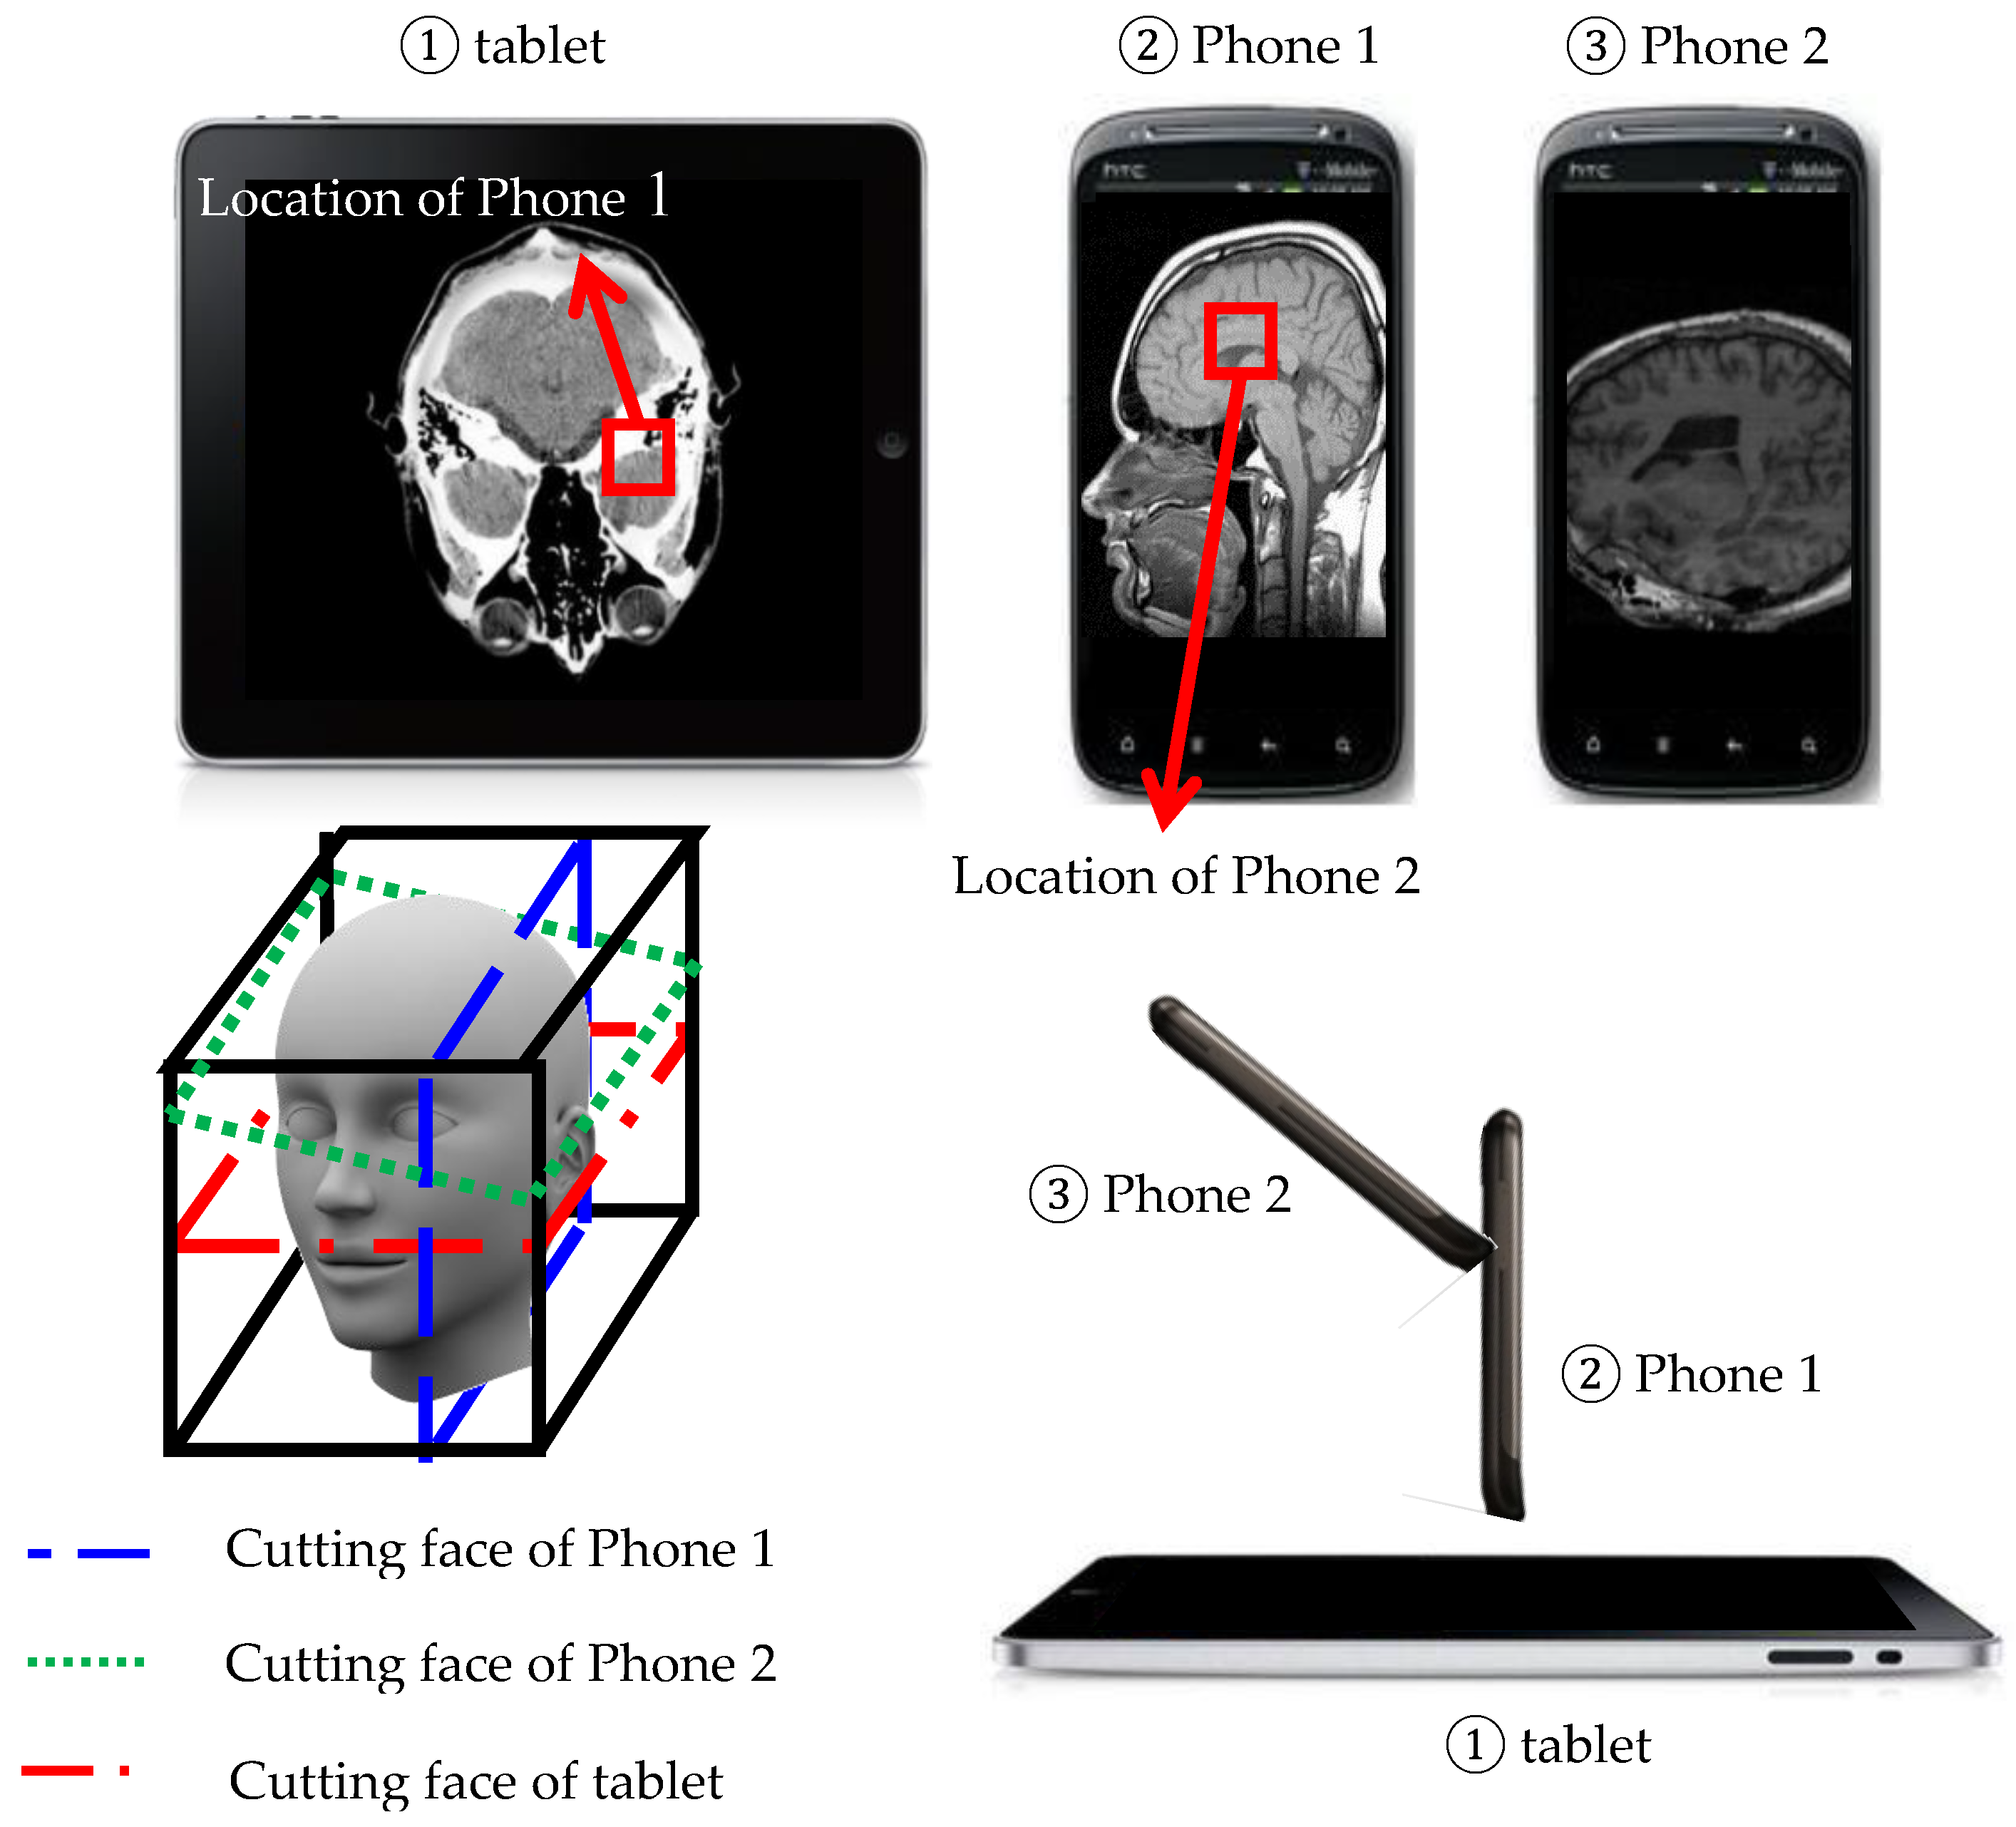
Comparing to the existing medium, we present a novel method to interact with the 3D object using handheld devices. The 3D object is placed in front of users as a virtual 3D image in the air, and users can use handheld devices, such as tablet personal computers or smartphones, to interact with them and see cutting faces. As shown in Figure 4, we use a 3D human head as an example, and we have a tablet and two smartphones in our environment. First, the user can use a tablet put on a desk to see a horizontal cutting face of the human head and then use another handheld device, a smart phone (Figure 4②), standing on the tablet to see a vertical cutting face relative to the cutting face on the tablet by obtaining the location on the tablet’s screen. After that, the user can also use another smartphone (Figure 4③) to see other cutting faces with the location obtained from Smartphone 1 and with different geographical orientations. System-adapted HTC phones and a tablet with the Android operating system, HTC, New Taipei City, Taiwan, were capable of image processing and wireless streaming. Key specifications for image processing were as follows: the CPU was Quad-core 2.3 GHz; the display was a Super LCD3 capacitive touchscreen, 16 M colors. The network latency was set as the data rate per stream up to 866.7(Mbit/s) for the experiments in this study.
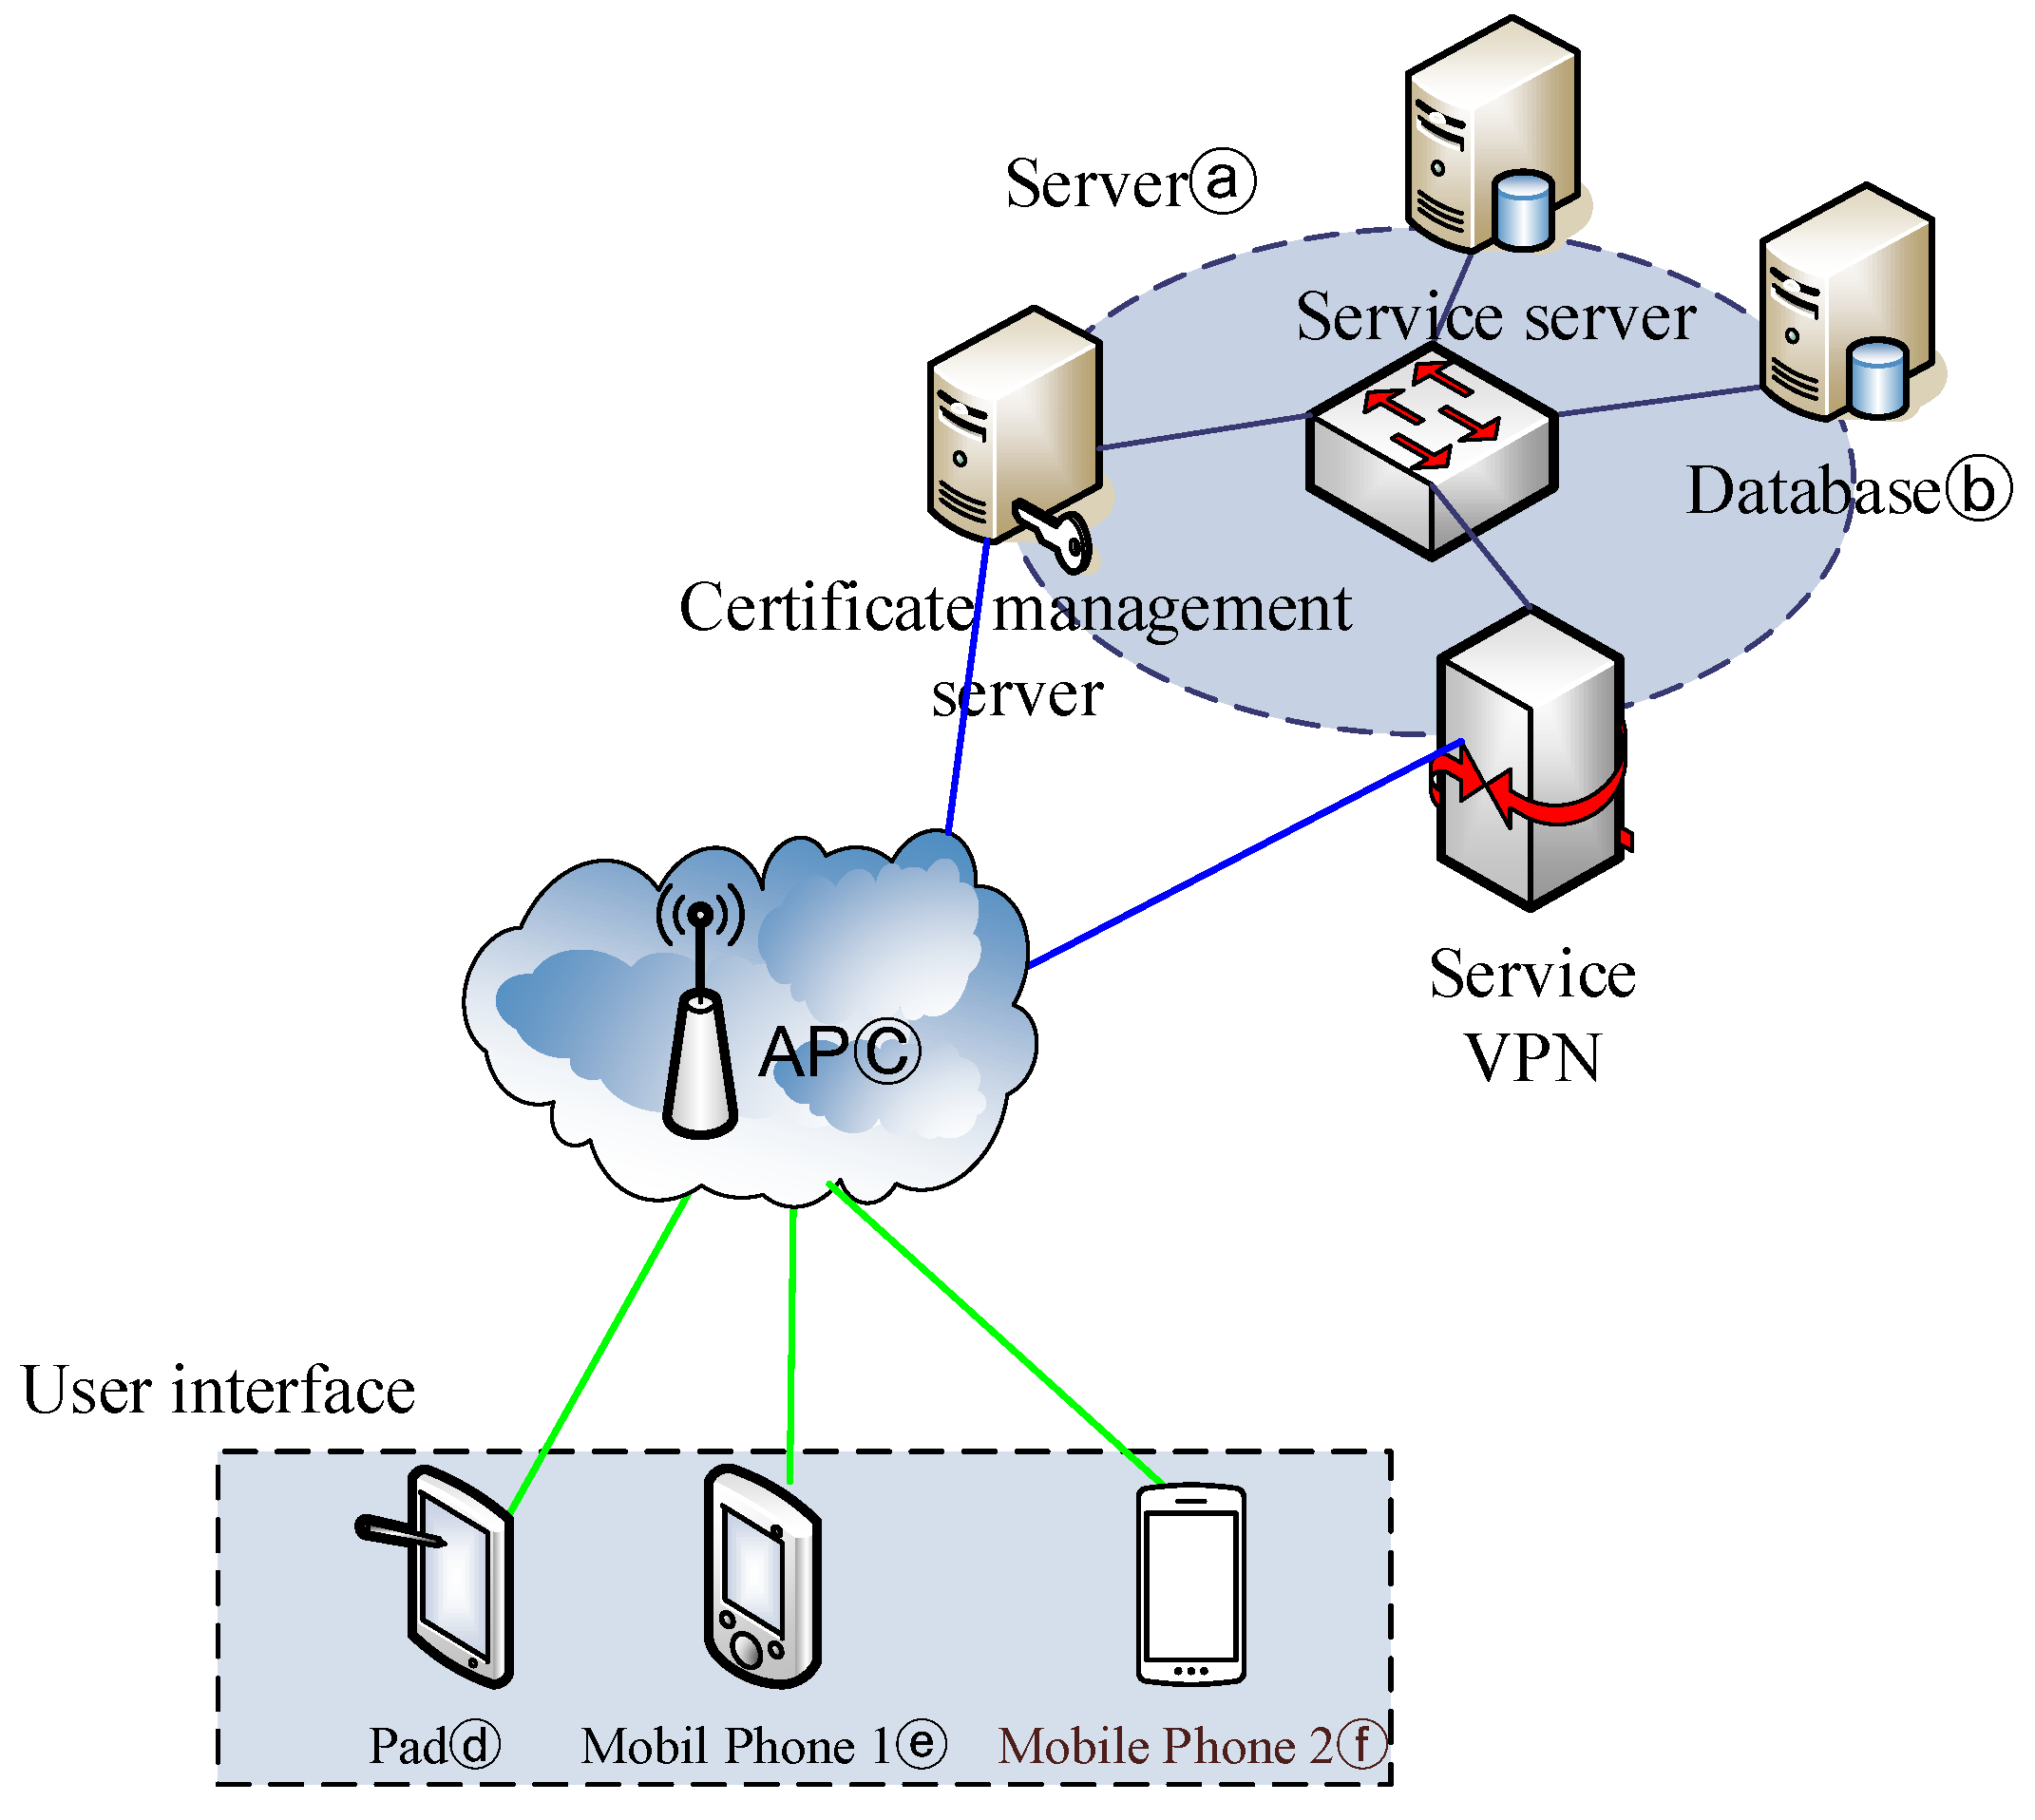
To achieve the novel 3D visualization and interaction with the 3D image via multiple handheld devices, we proposed a multi-plane 3D display system. Figure 5 shows our system architecture. Our system employs basic client-server architecture. The server side contains a server (Figure 5ⓐ) and a database (Figure 5ⓑ). The server is responsible for all computing work, including processing raw data of the 3D object, constructing cutting faces and cutting faces’ location computation. The other component of the server side, the database, stores the raw data of the 3D image, bookmarks and annotations. On the other hand, the client side is a tablet PC (Figure 5ⓓ) or smartphones (Figure 5ⓔ, Figure 5ⓕ), and each handheld device can connect to the Internet through a wireless access point (AP; Figure 5ⓒ) and communicate with our server. Mobile devices used on the client side are responsible for motion capture to detect the orientation of cutting faces and the cutting faces’ location obtainment and provides a user interface for displaying cutting faces and commands’ input, such as requesting a cutting face.
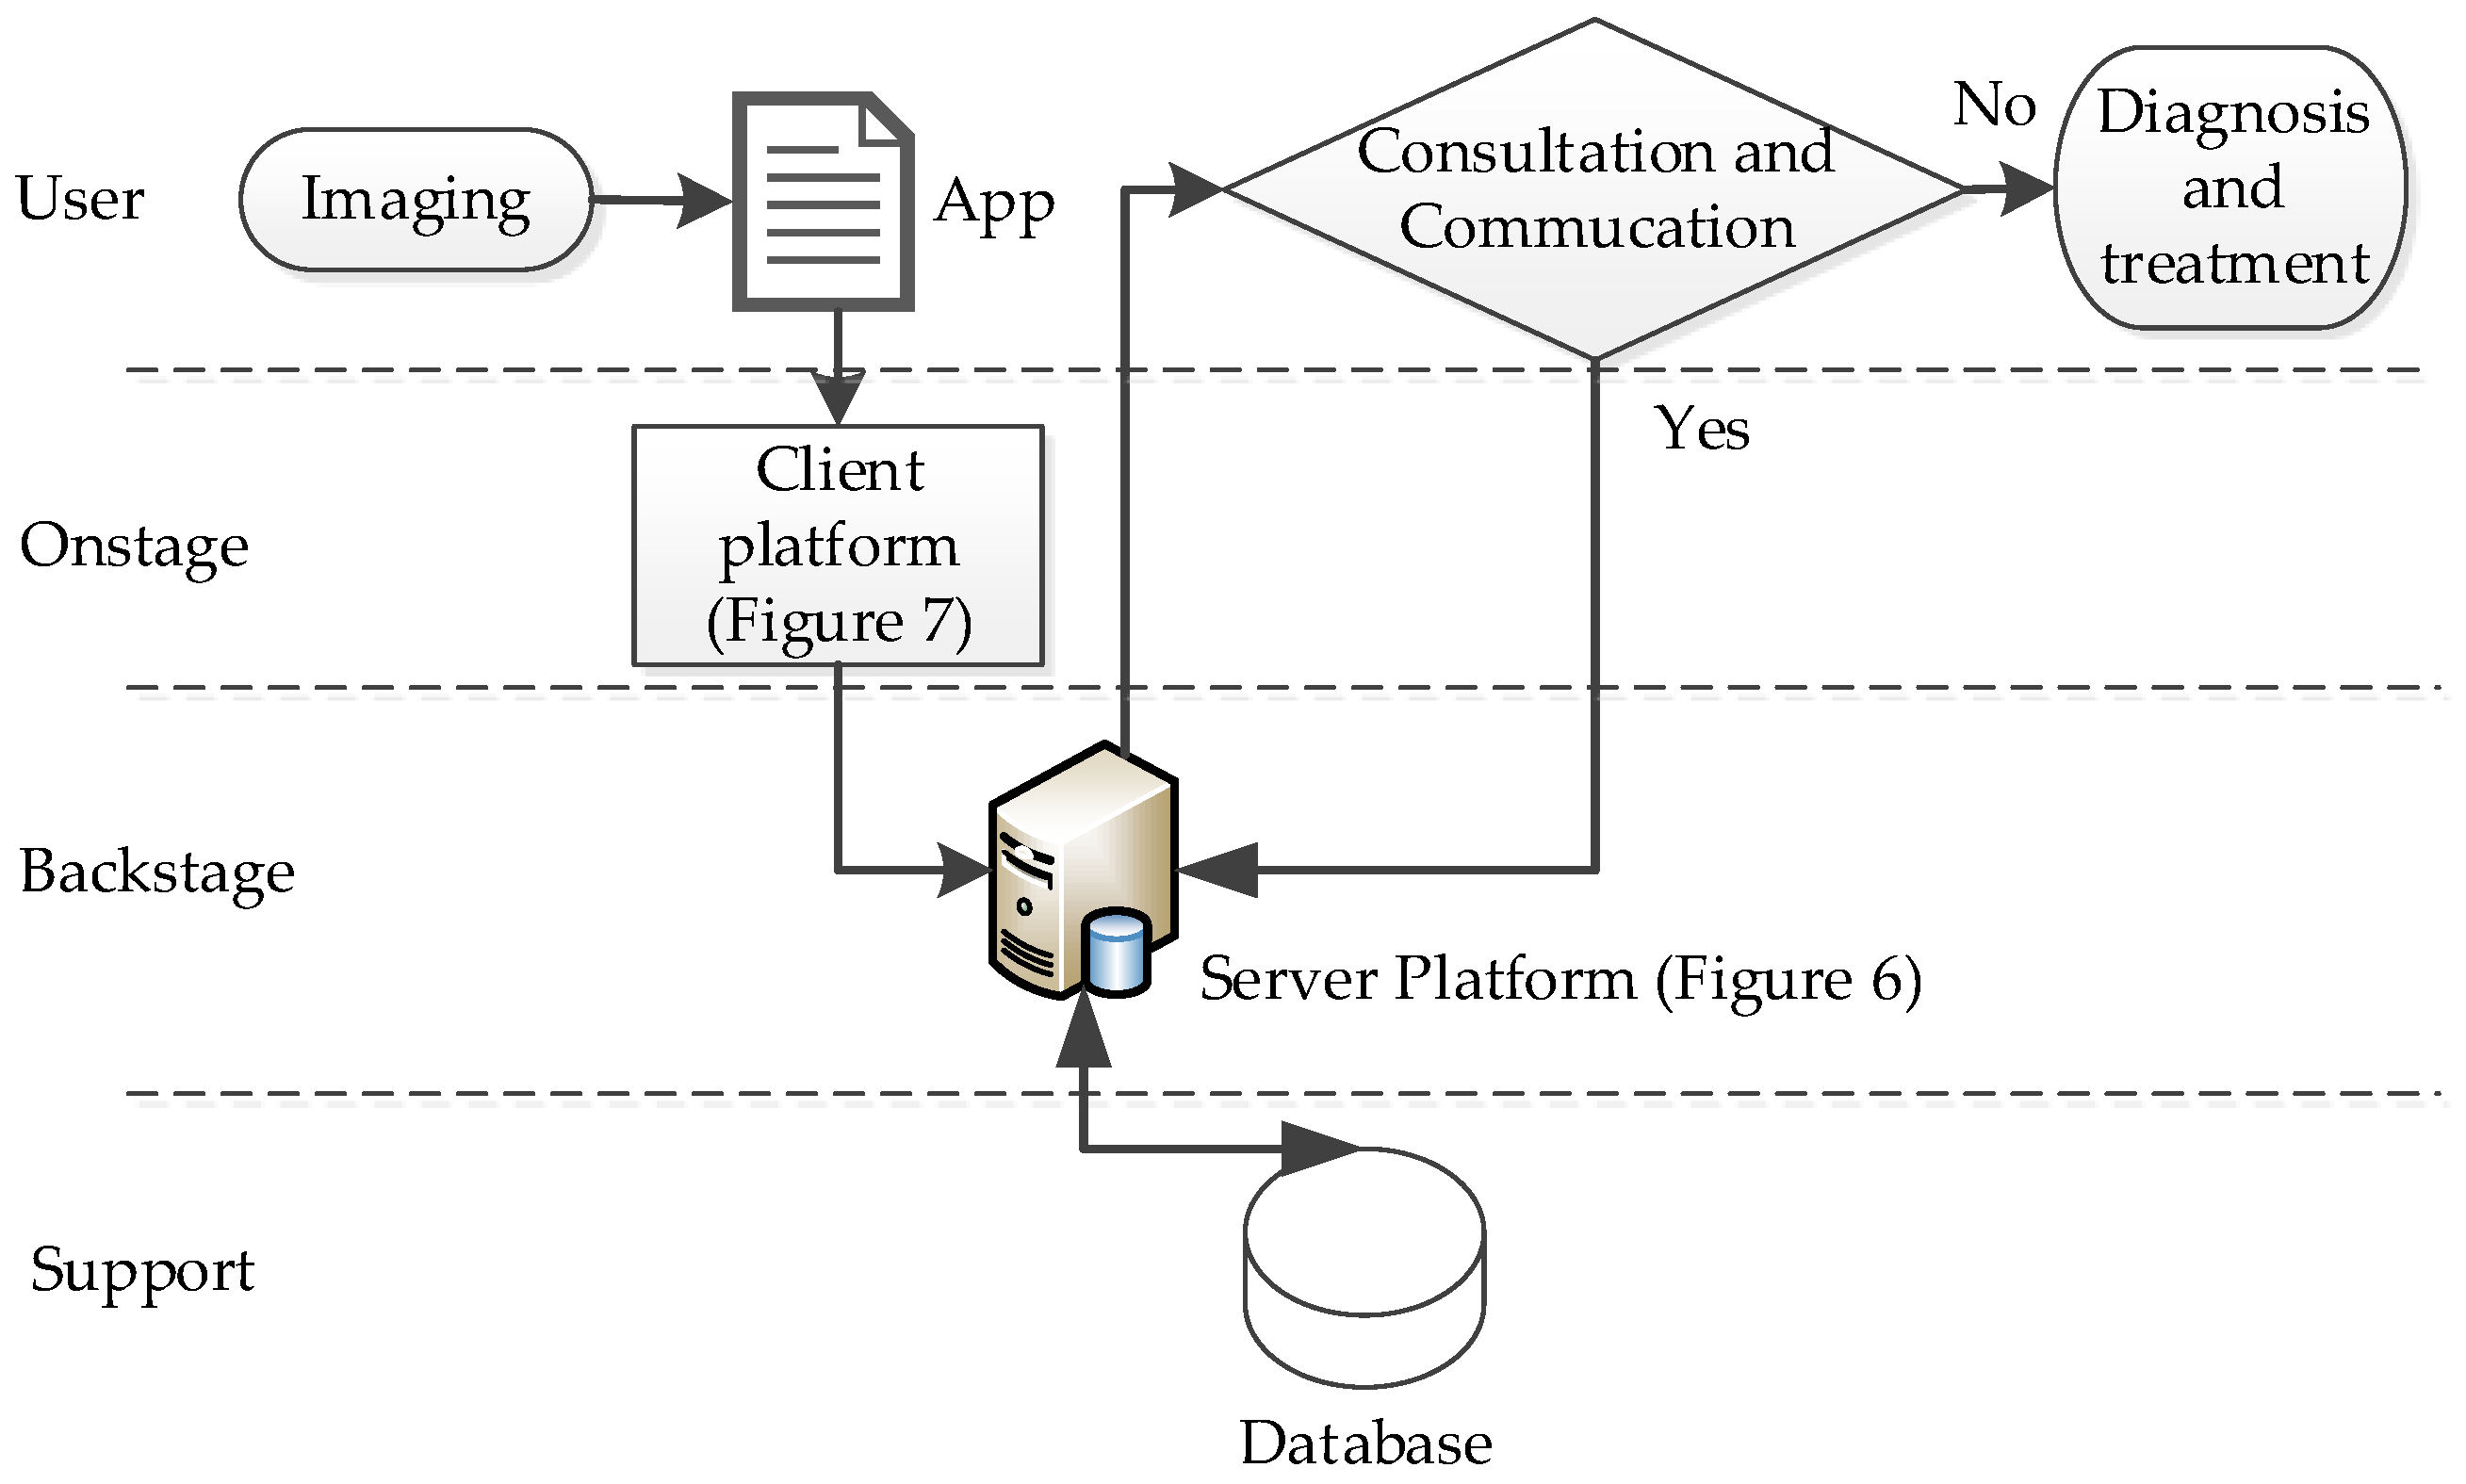
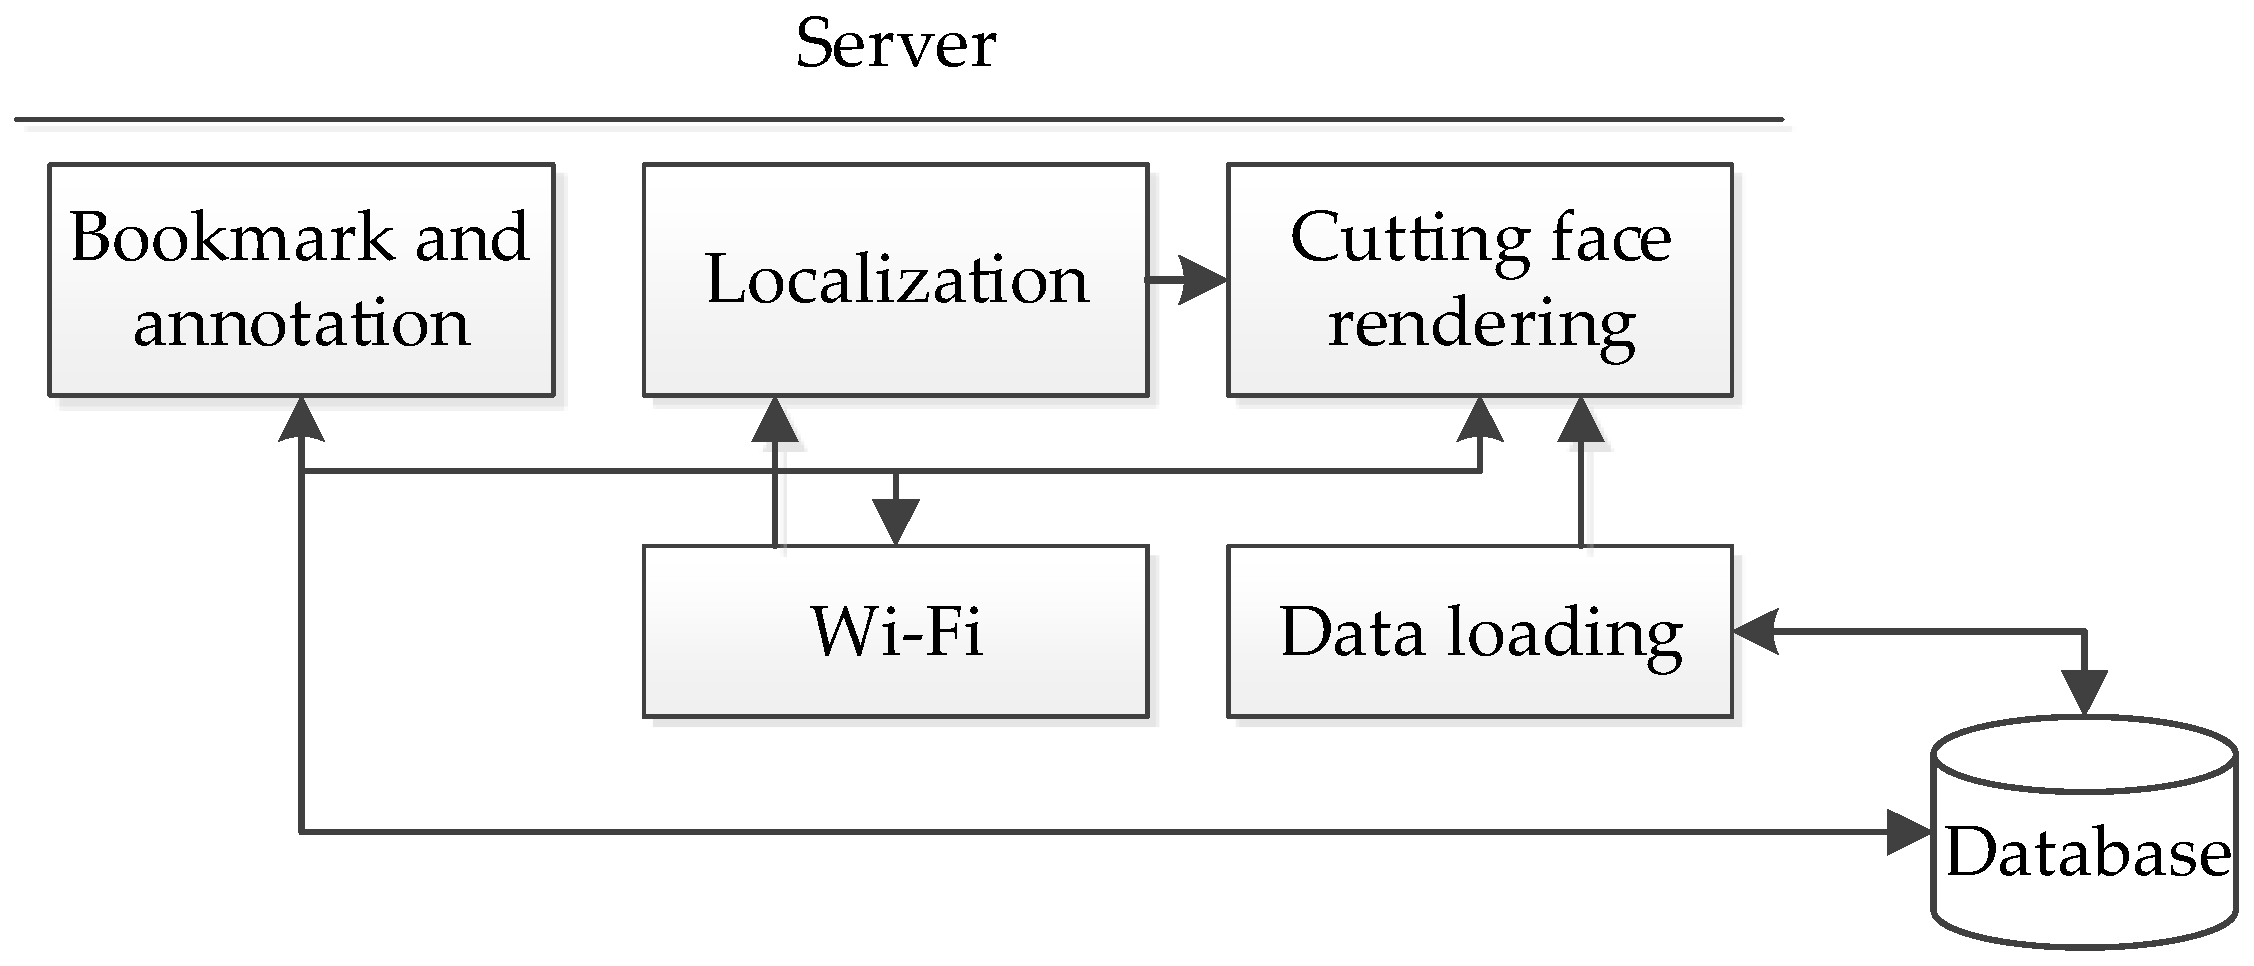
According to the hardware architecture, the software architecture of our system consists of two parts. One part is the server platform, and the other part is the client platform. Each platform is divided into three layers, including the hardware layer, middleware layer and application layer. For the clarity of the software architecture, the modules in different layers are in different colors. Modules in the hardware layer are in blue, in the middleware layer are in orange and in application layer are in blue-green. The software architecture of the server platform is shown in Figure 6. In our system, we provide three major functionalities, including rendering cutting faces, locating cutting faces, storing cutting faces as bookmarks and annotating on cutting faces, and according to the order, these functionalities are implemented by the “cutting face rendering” module, the “localization” module and the “bookmark and annotation” module in the application layer. Regarding the middleware layer, the “data loading” module will load in the raw data of the 3D object from the database and construct the 3D image for the use of rendering cutting faces. For example, in the medical image case, 2D medical images are stored in the database, and the “data loading” module will load the images and construct the 3D medical imaging at start-up of the system. In the hardware layer, the “Wi-Fi” module is in charge of client connections’ establishment and maintenance, as well as network communication, including request acceptance and corresponding response sending. More specifically, the “Wi-Fi” module will classify the requests sent from the client and forward them to the appropriate application module for further handling, as well as send back the result in response. For instance, the client may send a request to ask for the cutting face, then the “Wi-Fi” module will forward the request the “cutting face rendering” module and send back the cutting face to the client after rendering.
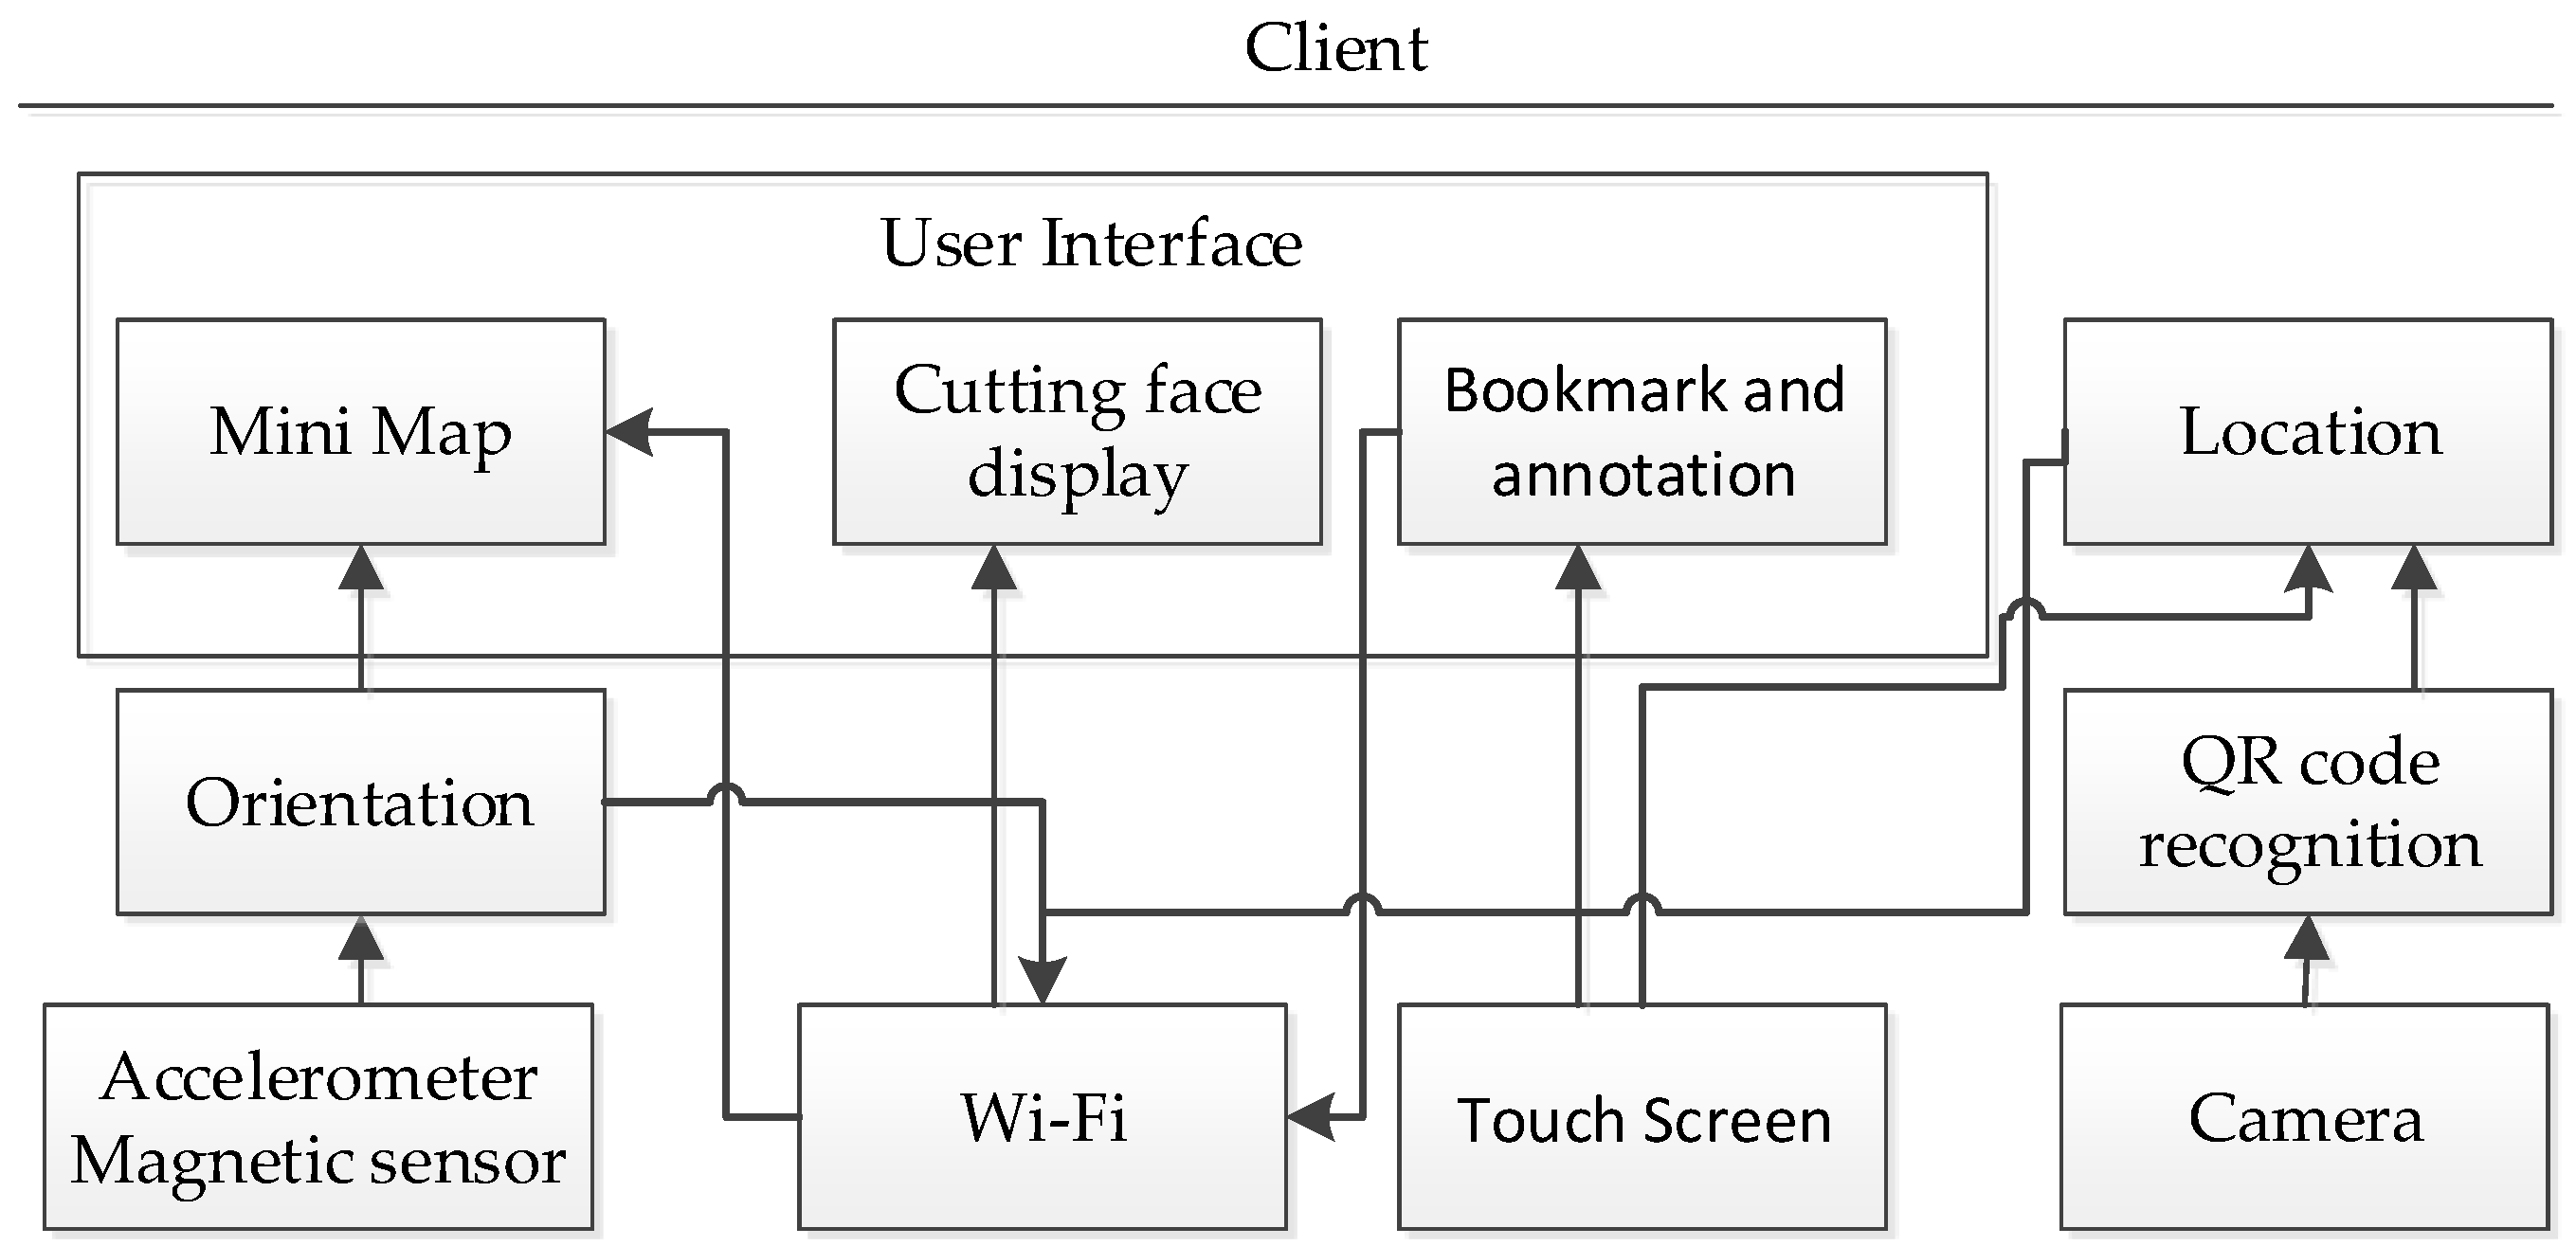
The diagram of the client platform is shown in Figure 7. We provide the user a graphical user interface for the display of not only the cutting face, but also a map of the cutting face and other control inputs, such as requests for bookmarks or commands of storing annotations. As a result, in the application layer, we implement a “user interface” module that contains three sub-modules. One is the “mini map” module, which is in charge of updating the map of the cutting face when the orientation or location changes. The second is the “cutting face display” module, which is in charge of updating the cutting face image sent from the server. The third is the “bookmark and annotation” module, which handles the input commands of storing and retrieving for bookmarks or annotations, sends it to the server and then displays the corresponding results, such as the bookmark list sent from the server. Another application module, the “localization” module, manages localization events when the user wants to locate or relocate cutting faces. According to different localization methods, the “localization” module will acquire different formats of location inputs from the middleware layer or hardware layer and convert it into one mutual format, then send it to the server for location computing. The “QR code recognition” module in the middleware layer is only used when the user chooses the barcode-based localization method to the cutting faces, and it is in charge of decoding the quick response code image captured by the camera and then forwarding the decoded location information to the localization module. Another the middleware module, the “orientation” module, is responsible for computing the new rotation matrix when the orientation changes and pass it to the “mini map” module to update the map of the cutting face. In the meantime, the “orientation” module will send the rotation matrix to the server for acquiring the new cutting face. In the hardware layer, the combination of the triaxial accelerometer and magnetic sensor can detect the changes of orientation and pass the orientation angles of the handheld device to the upper layer for further processing. The “Wi-Fi” module builds the connection with the server at the start-up of the client program and is responsible for sending requests to the server and receiving a corresponding response from the server. The “touchscreen” module senses the user’s touch and forwards the touch coordinates to different upper layer modules according to different purposes. The last hardware layer module, the “camera” module, is used when the user wants to capture QR code images.
In our system, we are not doing traditional 3D rendering that converts 3D models to 2D images; instead, we propose a special rendering method to construct the cutting faces of the 3D image. In the next paragraph of “cutting face construction”, we will give a definition of a cutting face and introduce our crucial rendering method executed by rendering the cutting face module. Besides, according to our scenario, the user can see cutting faces with different orientation angles by putting handheld devices in different geographical orientations, but there exists an orientation issue, so we proposed two orientation control methods to solve it.
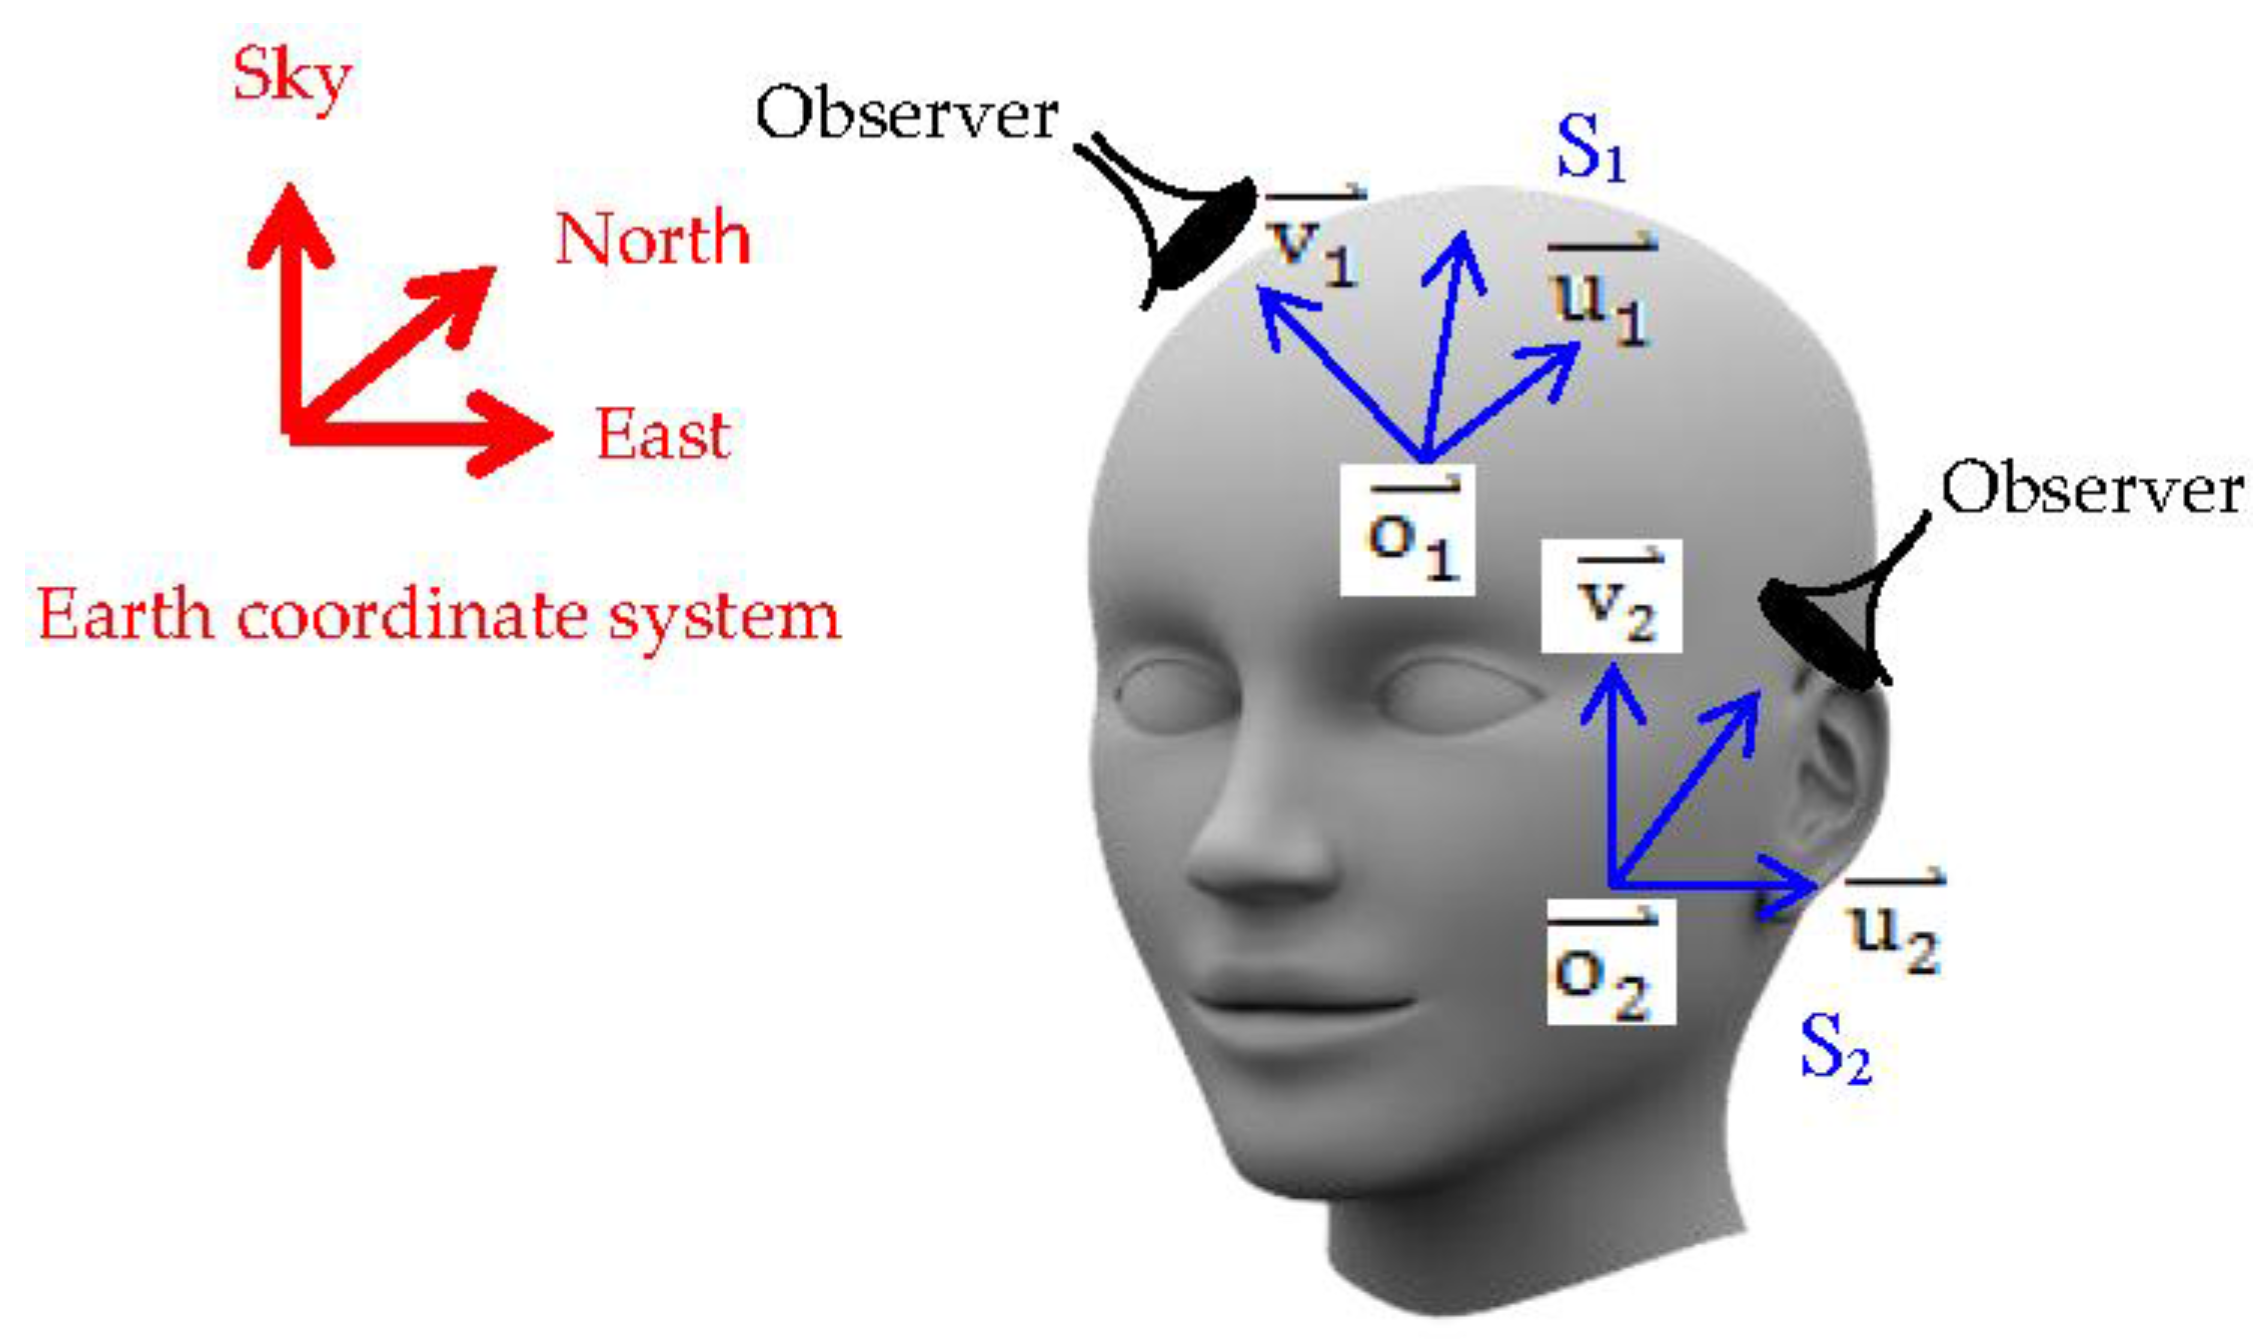
For clarity of cutting face construction, first, we give the definition of a cutting face. A cutting face S i is constructed by two vectors u i and v i and their start point o i where u i T v i = 0 , | u i | = 1 , | v i | = 1 and o i is the center of the cutting face, which also represents the location of the cutting face. Besides, the observer’s optical direction is orthogonal to both u i and v i . As shown in Figure 8, continuing with using the 3D human head as example, S 1 and S 2 are cutting faces with different orientations and locations. Second, we give the definition of the 3D object. The 3D object is composed of pixels, so we consider it as a pixel matrix, termed Set   ( O ) , and we define that the 3D object is in the Earth coordinate system; therefore, each pixel of the 3D object has its exact location p in Earth coordinates, which are represented by a row vector, i.e., p = [ x   y   z ] .
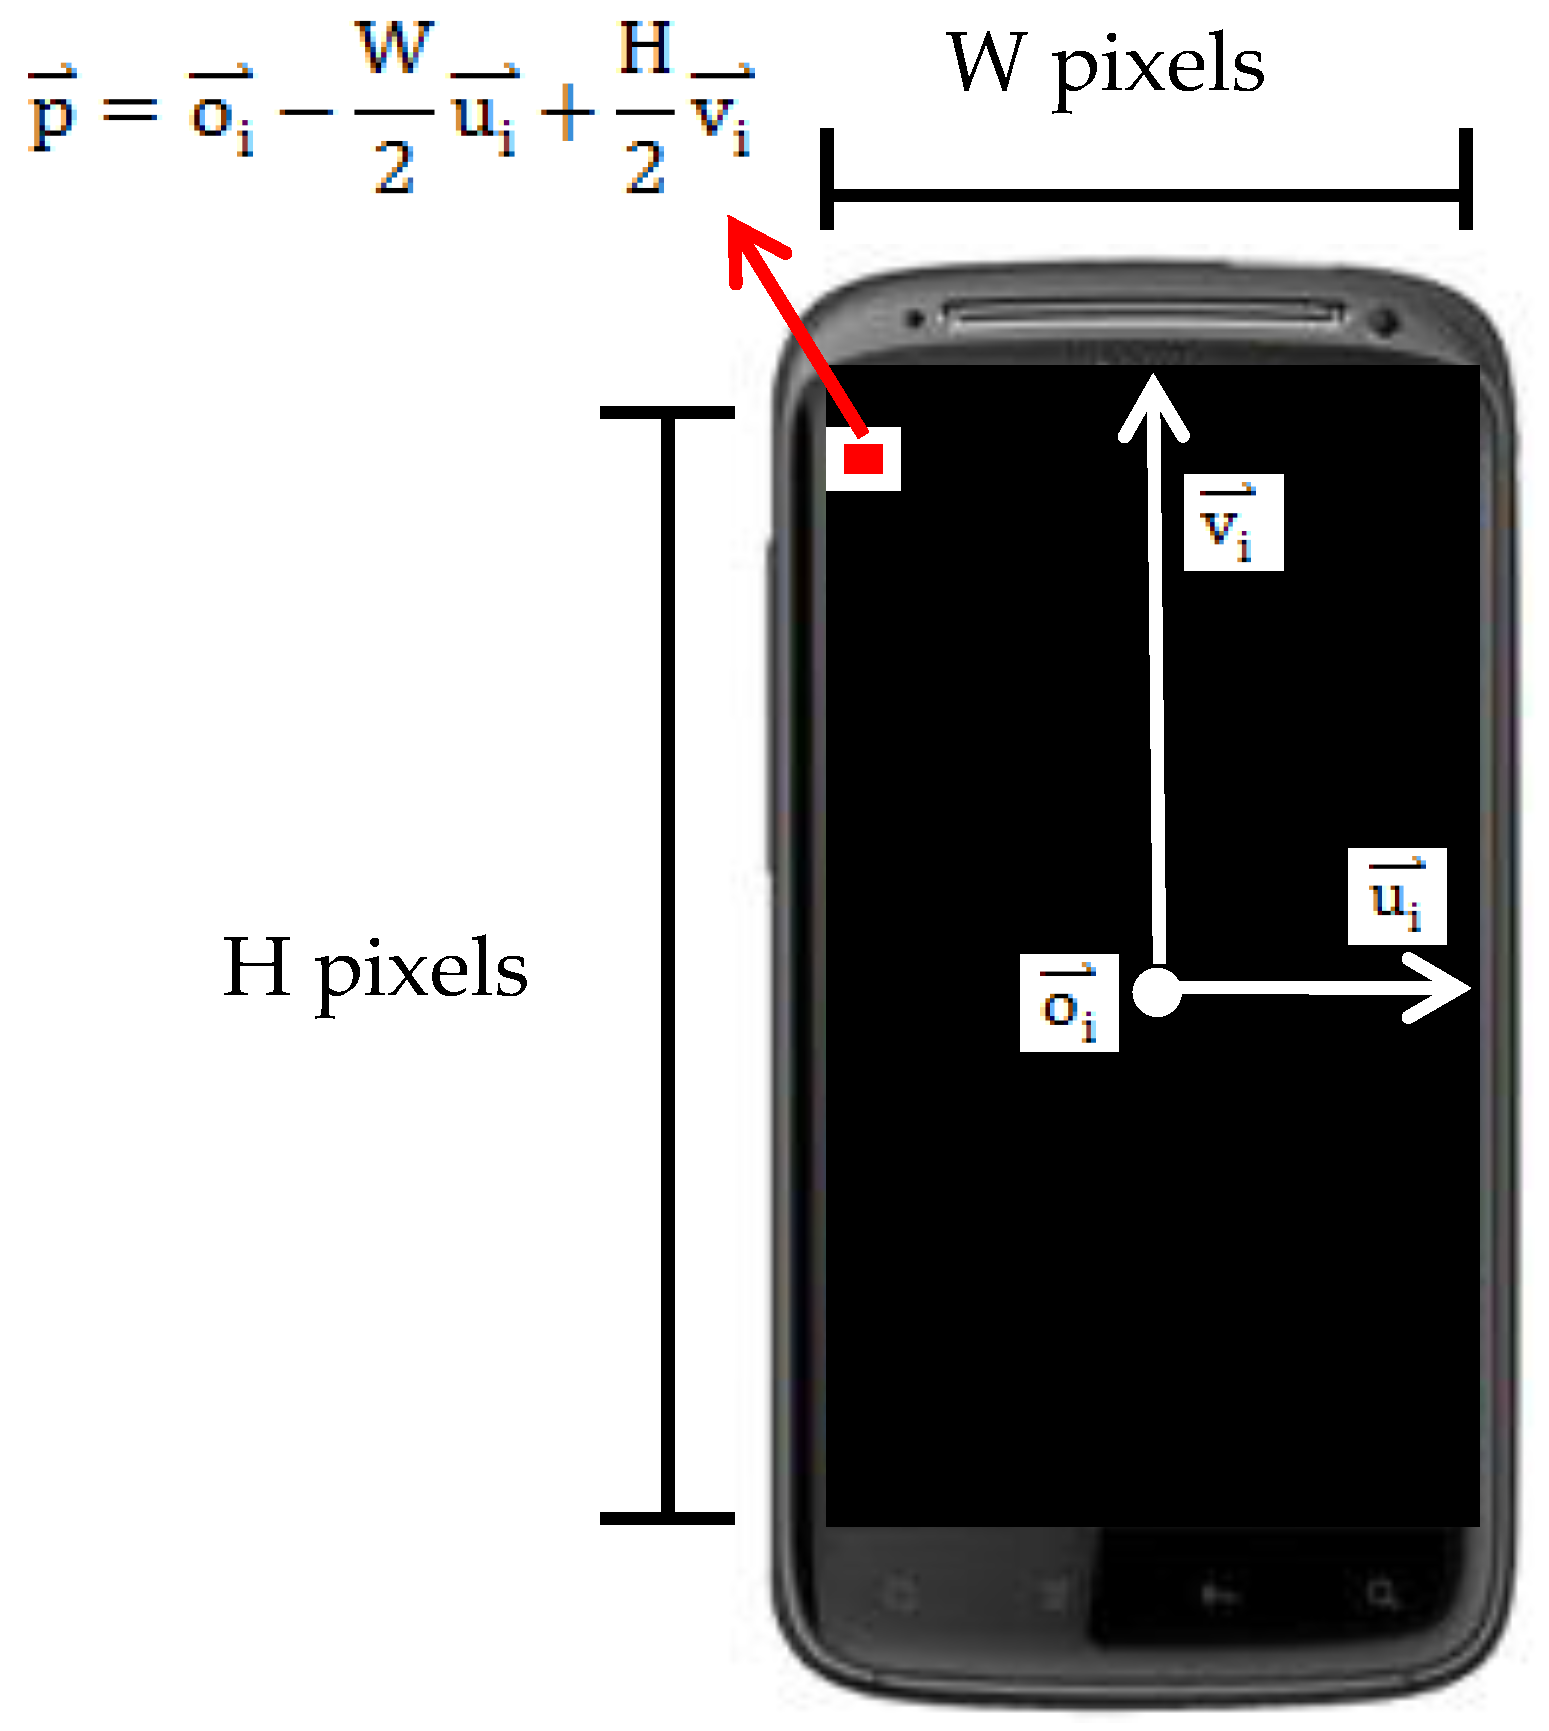
For cutting faces, we are required to find all pixels’ location of the cutting face in the 3D object cube to construct the 2D image. To achieve this goal, we can calculate each pixel’s location p of the cutting face by a simple formula:
p = o i + k u   u i + k v v i , p ϵ   Set ( O )
where k u and k v are integer scale factors, which are responsible for controlling and identifying which pixel of the cutting face is currently calculated. k u and k v have upper bounds and lower bounds, W 2 k u W 2 and H 2 k v H 2 , where H represents the pixel height of the image and W represents the pixel width of the image, as shown in Figure 9.
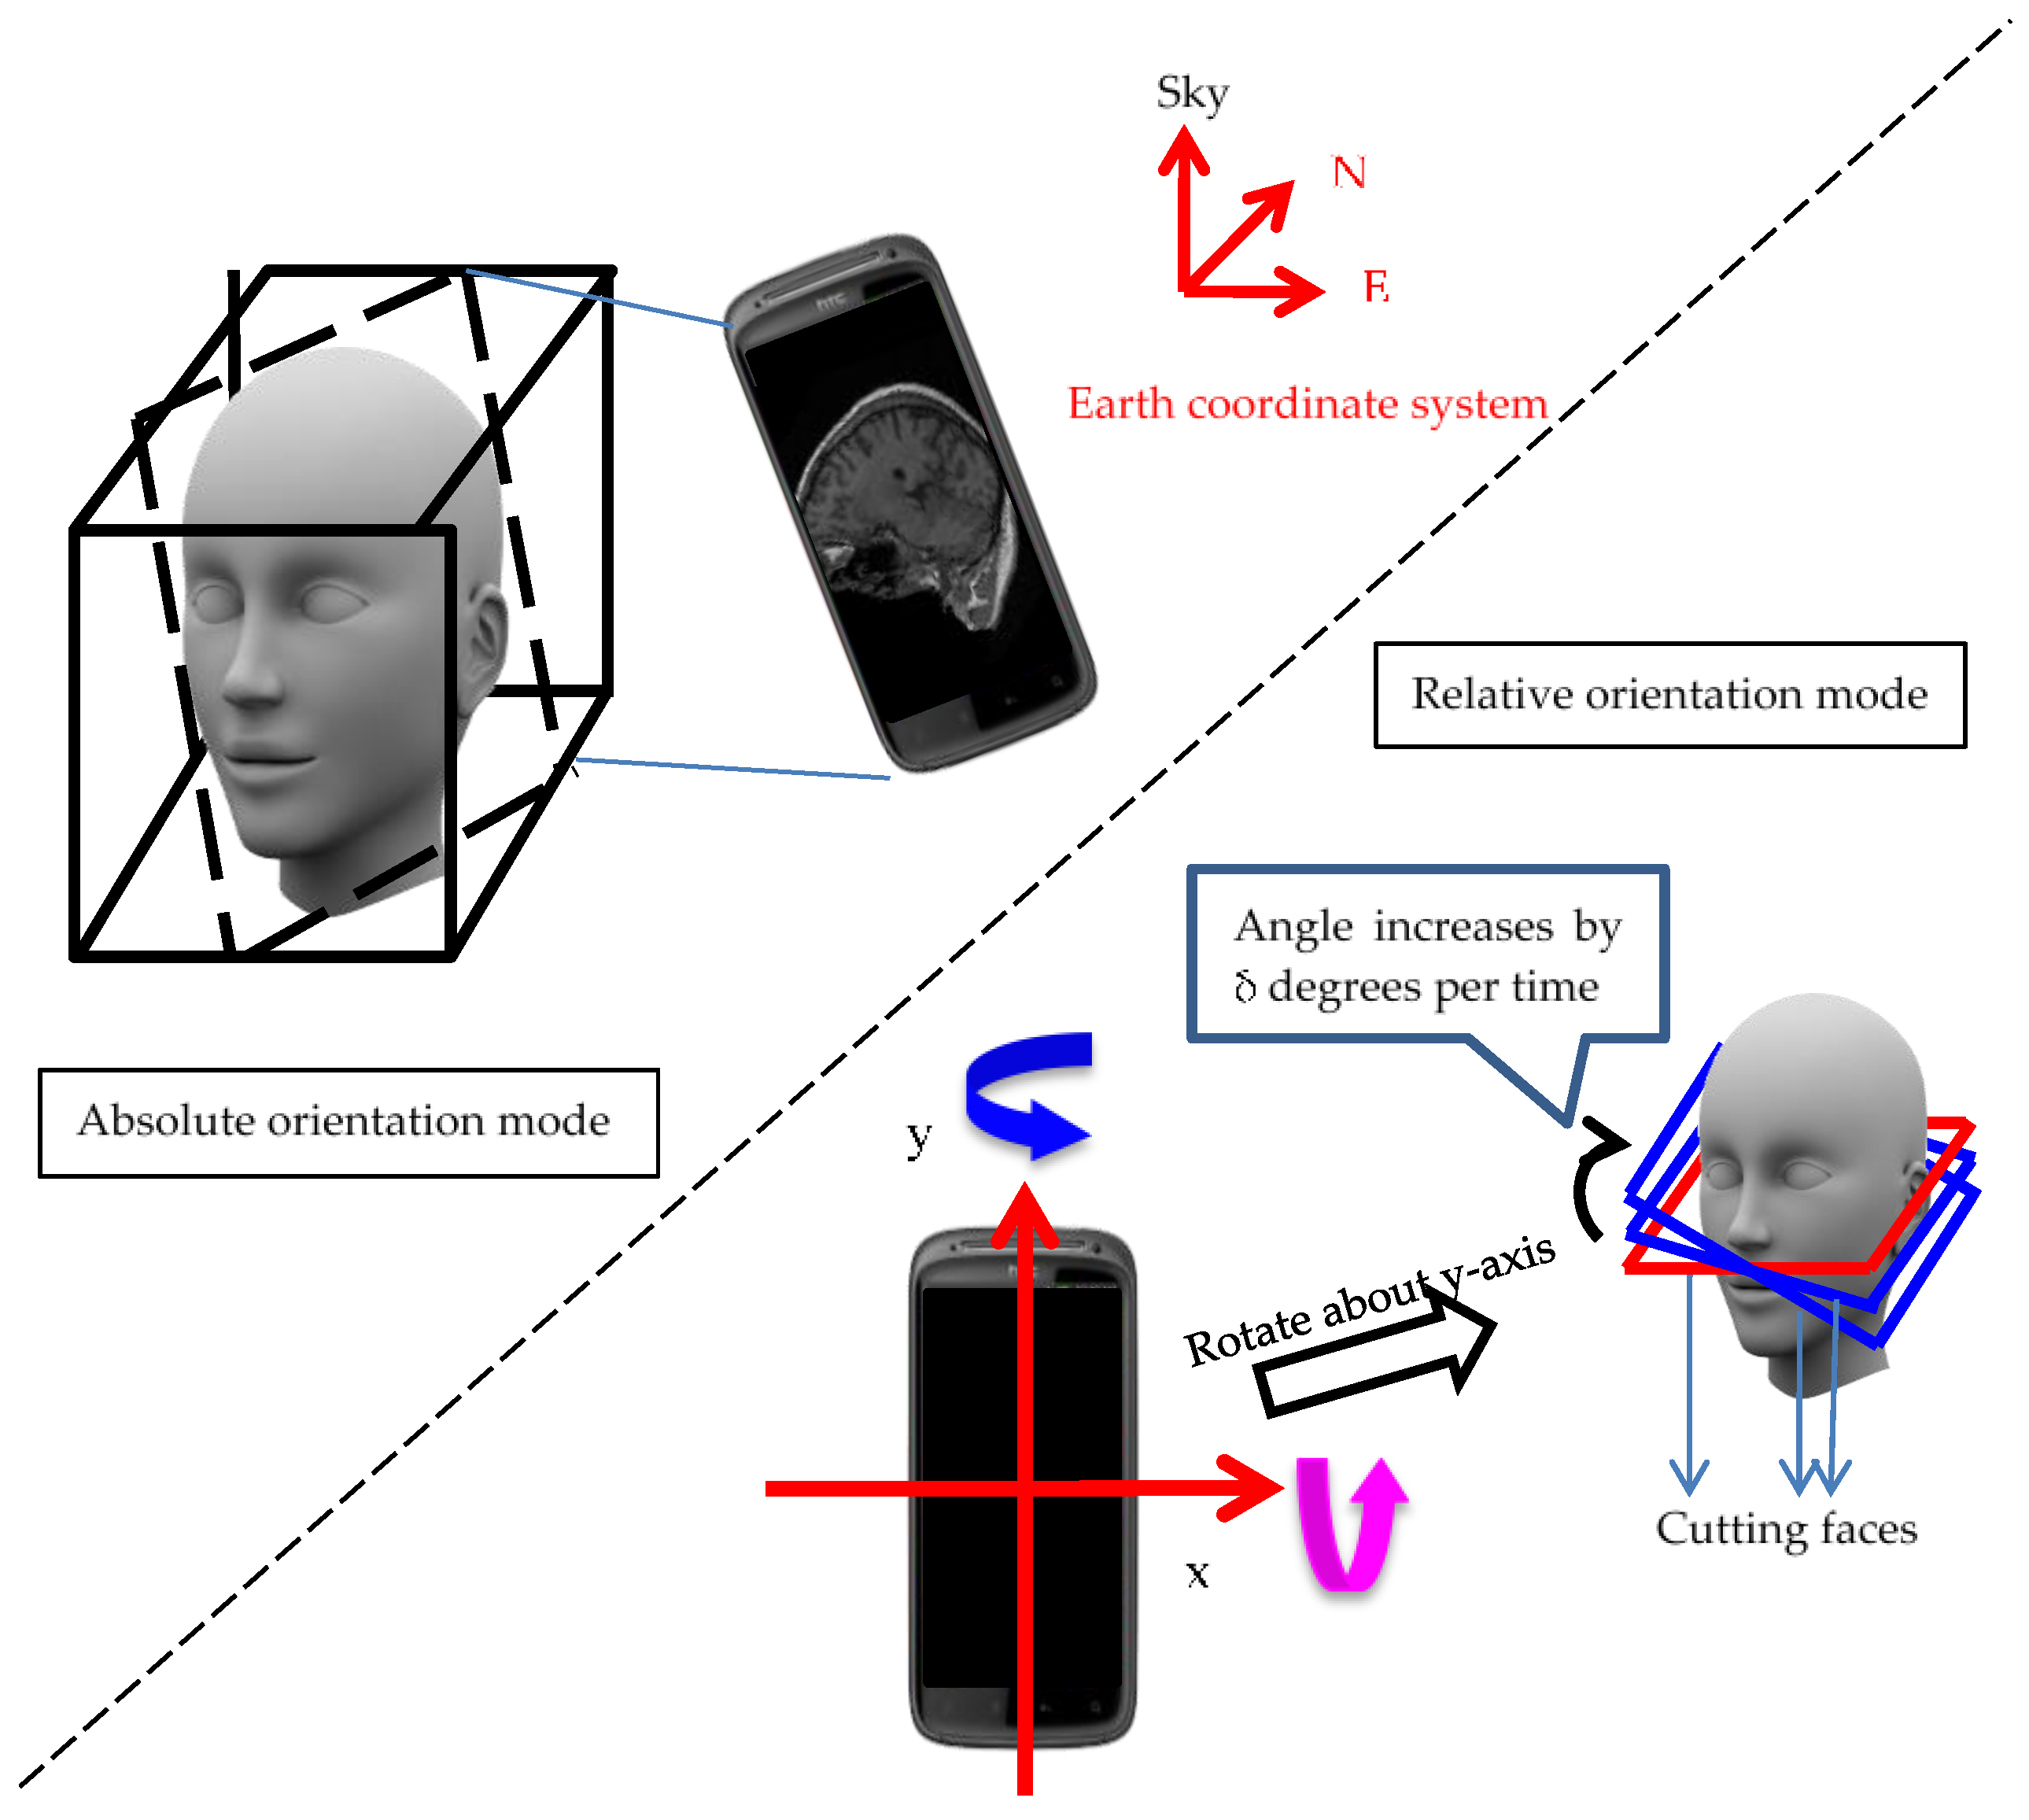
In our design of orientation control methods, the user can see any cutting face in any orientation by putting the handheld device in the user-interested geographical orientation. Therefore, users are able to see cutting faces in 360 degrees by rotating handheld devices about any axis, but if we consider the limitation of hardware ability that handheld devices do not have a monitor in the back face, we can easily find out that seeing cutting faces in 360 degrees without moving our head or body is not possible. Hence, we designed two control modes to solve this problem, and users can switch between these two modes according to their preference. The first mode is “absolute orientation mode”; the orientation angles of cutting faces follow the geographic orientations of handheld devices. The geographic orientations are detected by combining an embedded magnetic sensor and a triaxial accelerometer sensor, so users can simply rotate handheld devices to a preferred orientation, as shown in Figure 8. The second mode is “relative orientation mode”; users can rotate handheld devices along the x-axis or y-axis of handheld devices, and once the rotation and the rotated axis are detected by the embedded triaxial accelerometer sensor, the orientation angle will slowly increase or decrease by δ degrees along the rotated axis depending on the rotation direction, as shown in Figure 10. The advantage of this mode is that when the user finds that the monitor’s viewing angle is not comfortable, the user can switch from “absolute orientation mode” to “relative orientation mode” instead of moving his/her head or body to adapt to the monitor.
The means to obtain u and v defined in the previous section depend on orientation modes. In absolute orientation mode, embedded sensors including a magnetic sensor and a triaxial accelerometer sensor will give rotation angles α(roll), β(pitch) and γ(yaw), when the sensors detect that the handheld devices are rotated. Then, the orientation module will compute a rotation matrix according to the information of rotation angles. The rotation matrix is listed below:
R xyz ( α , β , γ ) = R z ( γ ) R y ( β ) R x ( α ) = [ cos γ cos β cos γ sin β sin α sin γ cos α cos γ sin β cos α + sin γ sin α sin γ cos β sin γ sin β sin α + cos γ cos α sin γ sin β cos α cos γ sin α sin β cos β sin α cos β cos α ]
The first column is the transposed vector of u , and the second column is the transposed vector of v . Differently, in relative orientation mode, the embedded triaxial accelerometer sensor will give gravity values in three axes, and we can analyze the measured value to obtain the information about the axis about which the handheld device is rotating. Then, we increase or decrease the rotation angle of the cutting face manually by δ degrees per time unit along the detected rotation axis. Below is the formula for computing the rotation matrix:
R t xyz = R t 1 xyz R d   ,   R d = { R xyz ( ± δ , 0 , 0 )   |   R xyz ( 0 , ± δ , 0 )   |   R xyz ( 0 , 0 , ± δ ) }
where t represents time and R d is the rotation matrix that rotates the cutting face by δ degrees per time unit. The first column of R t xyz is the transposed vector of u , and the second column of R t xyz is the transposed vector of v .
In contrast with obtaining u and v , the means of obtaining o are the same in two modes. We provide two localization methods, which will be introduced in next section, to obtain o .
The methods introduced above are all about how to render cutting faces, but the location of cutting faces is just as important as the rendering of cutting faces. Therefore, we provide two localization methods, the touch-based localization method and the barcode-based localization method, to locate cutting faces and one relocation method to relocate cutting faces after applying localization methods. All methods introduced in this section are implemented by cooperation of localization modules in both the client and server sides.
Basically, the user just has to touch the location he/she wants to the new cutting face on one handheld device, such as a tablet, and the new cutting face will show on the screen of another handheld device, such as a smartphone, as shown in 
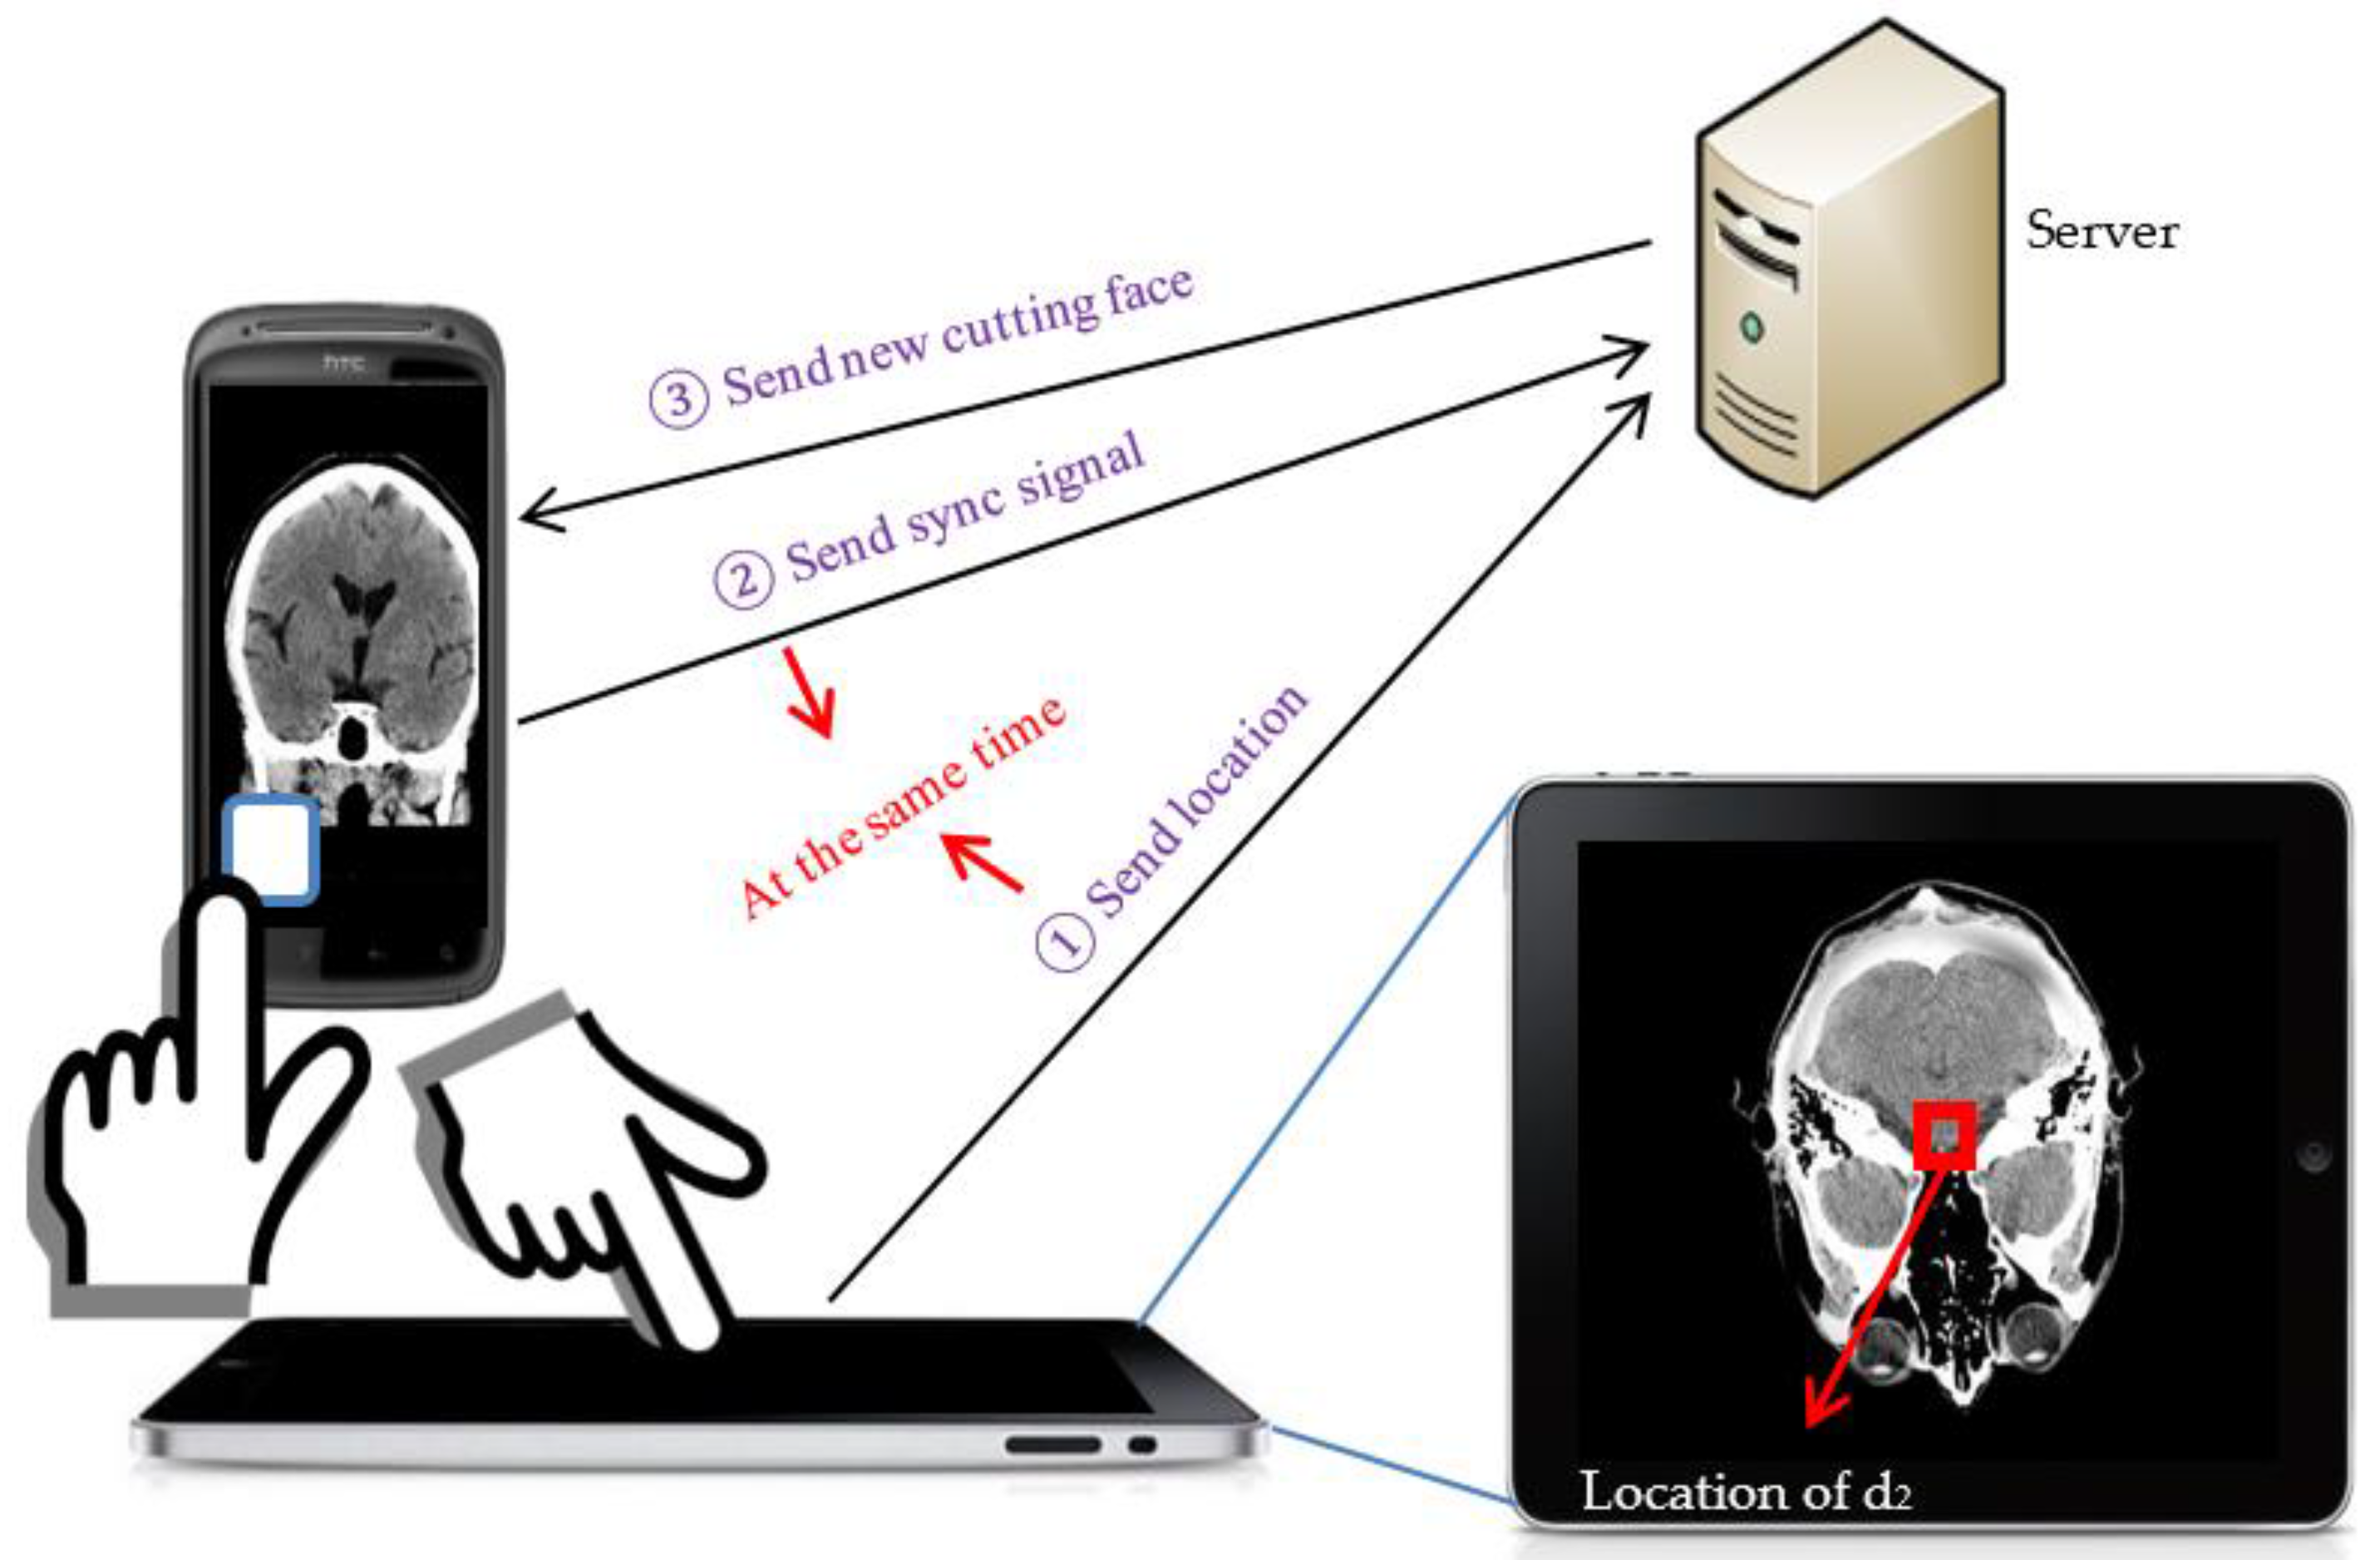
Figure 11. However, in a more than two handheld devices environment, there exist some identification issues. When we have more than two handheld devices in our environment, we have to identify the locating handheld device, which will show the new cutting face, and the to be-located handheld device, which is responsible for providing a location. Therefore, we provide an identification scheme to identify and pair these two handheld devices. We use a figure to illustrate the operations of the touch-based localization method with the identification phase. In Figure 12, we have a server that is in charge of constructing cutting faces, one tablet, d1, for location selection and one smartphone, d2, for showing the cutting face with the location obtained from the tablet. First, the user touches d1 to select and send the new location to the server. In the meantime, the user touches the synchronization button on d2 to send a synchronization signal to the server. Then, the server will record timestamps when it receives the location and synchronization signal. After that, the server will compare the timestamps to see whether they are synchronous, and if they are synchronous, the computing server will construct the new cutting face with the new location and send it back to the smartphone.
The barcode-based localization method is designed for the condition that the user has handheld devices in both hands, so the touch-based localization method is not convenient for the user. Considering this situation, we provide a method that utilizes the image recognition technique to recognize the location by capturing an image on the screen. At the beginning, we want to do pixel level localization as the touch-based localization method does, but due to the limitation of technology that the processing time of the arbitrary image recognition without geometric pattern matching is too long, we finally determined to employ the 2D code, quick response code, as our solution. The quick response code has three main advantages. The first advantage is that it can directly encode any literal information, like location information inside codes, so that we can save the time of doing additional data access. The second advantage is that decoding quick response codes only takes a little bit of time that it is almost a real-time action. The last advantage is that we can generate any size of quick response code according to our preference. The third advantage allows us to generate small quick response codes, so that we can use more codes to represent locations on the screen, and this makes the accuracy of location more acceptable.
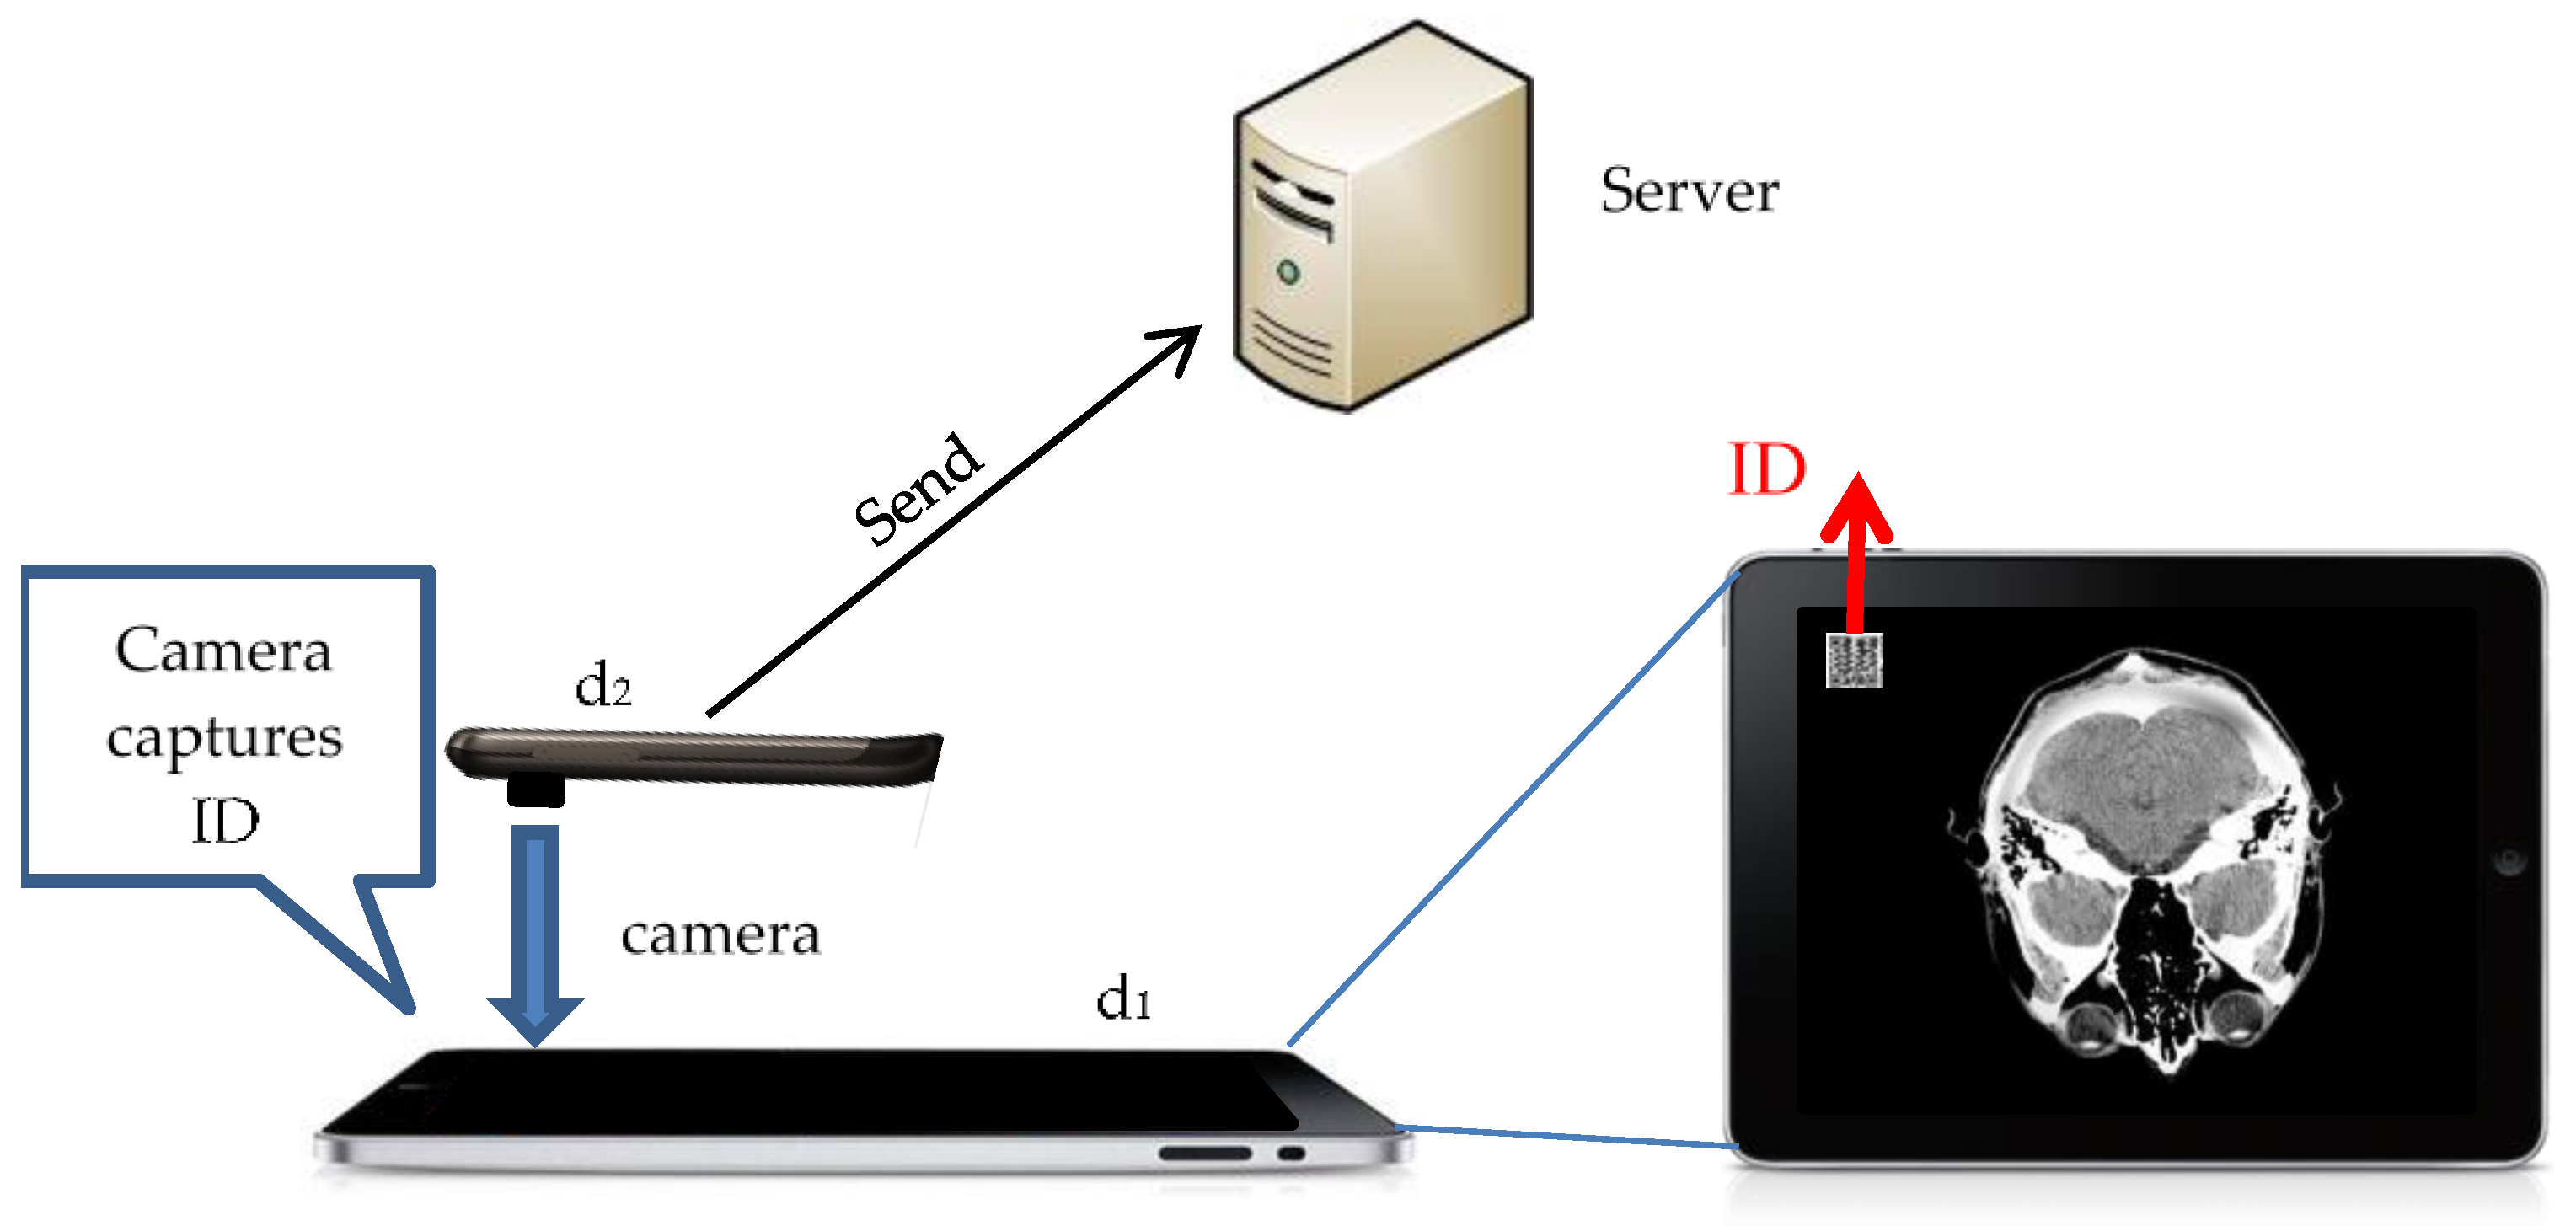
The main idea of the barcode-based localization method is that we will show quick response codes on screen, and each quick response code represents one location. Then, the user can use the camera to capture the quick response codes on screen, and by employing the image recognition technique, we can get locations after decoding quick response codes. However, the barcode-based localization method also has an identification issue as the touch-based localization method does. As a result, we provide a barcode version identification scheme to solve this problem, as shown in Figure 13. In the figure, we have a server that is in charge of constructing cutting faces, one tablet, d1, for location selection, and one smartphone, d2, for showing the cutting face with the location obtained from the tablet. First, before the localization phase, the user should use the camera on d2 to capture the ID quick response code on the screen of d1. Then, d2 will send the decoded ID to the server for pairing. The server will pair d1 and d2. After that, each time when the user wants to get the location by using d2, our system will know that the location is supposed to come from d1.
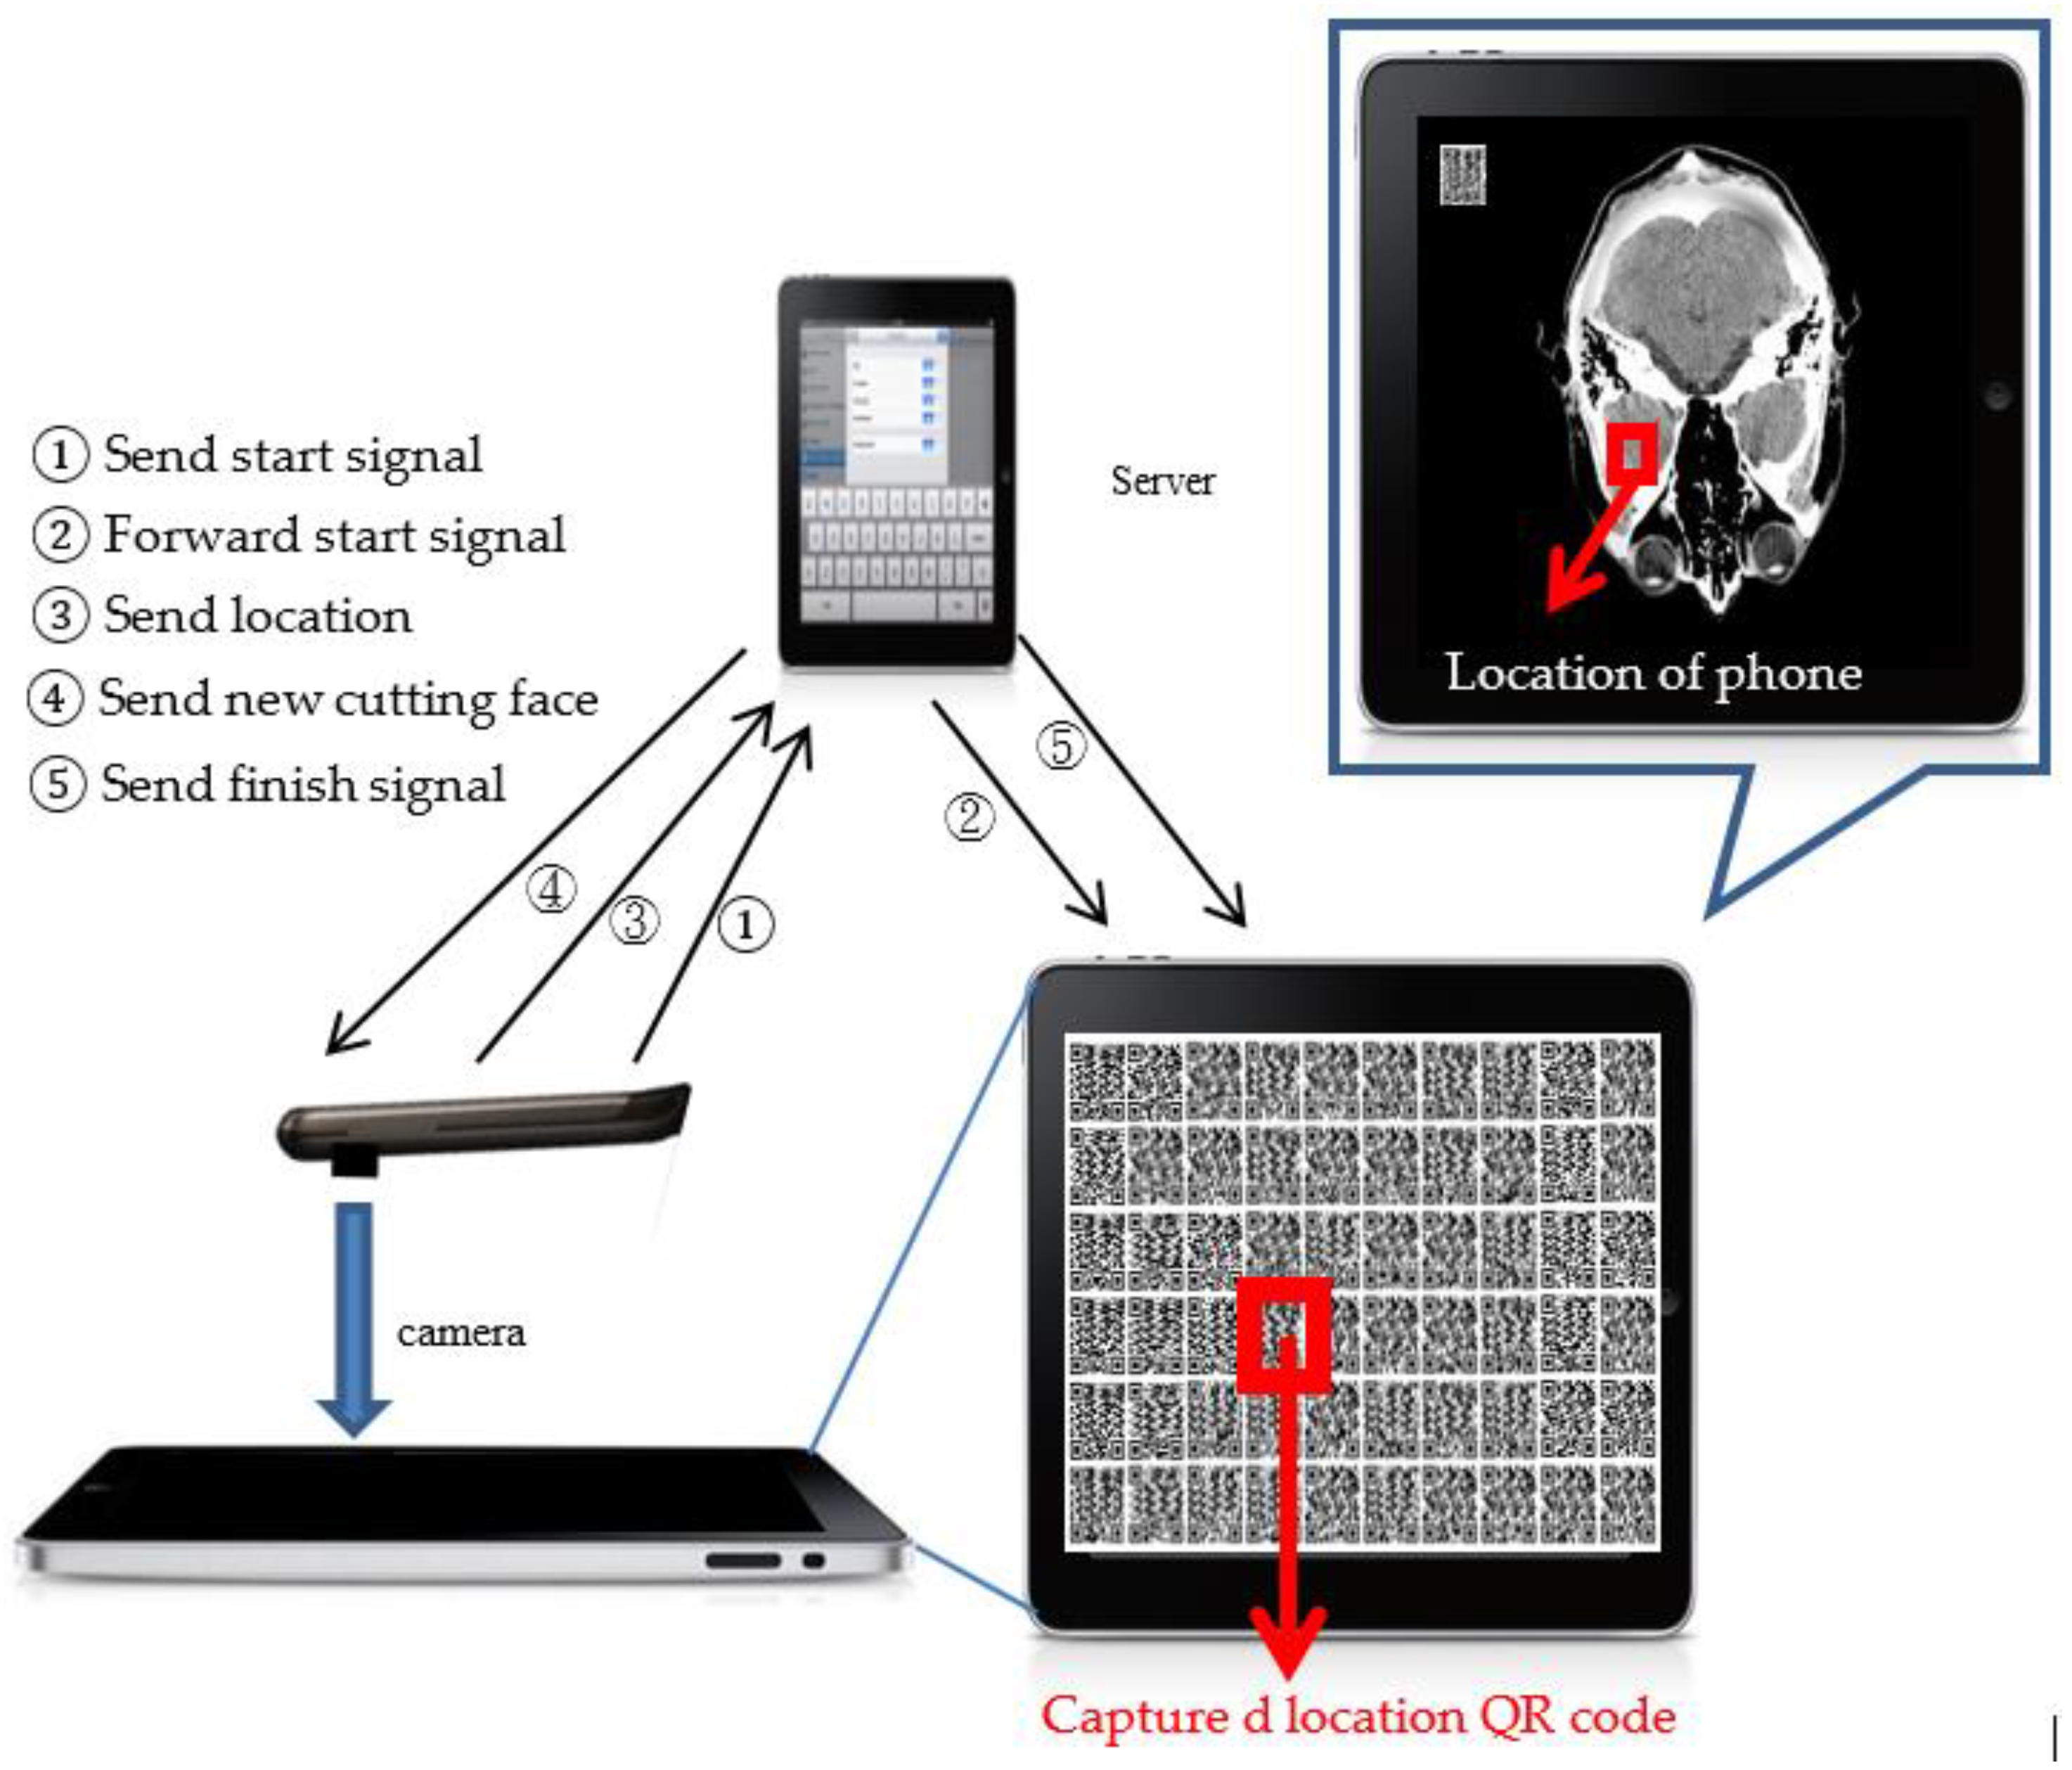
Regarding localization, we use another figure to illustrate the detail of localization operations. As shown in Figure 14, first, d2 will send a start signal to the server, and then, the server will forward the start signal to d1 for notifying d1 to open the quick response code map. Then, the user can use the camera on d1 to capture the quick response code on the interested location and sends it to the server. After getting the location, the server can construct a new cutting face with the new location and send it back to d2, and in the meantime, the server will send a finish signal to notify d1 to close the quick response code map. Then, a complete localization is accomplished.
In our system, the location sent from d
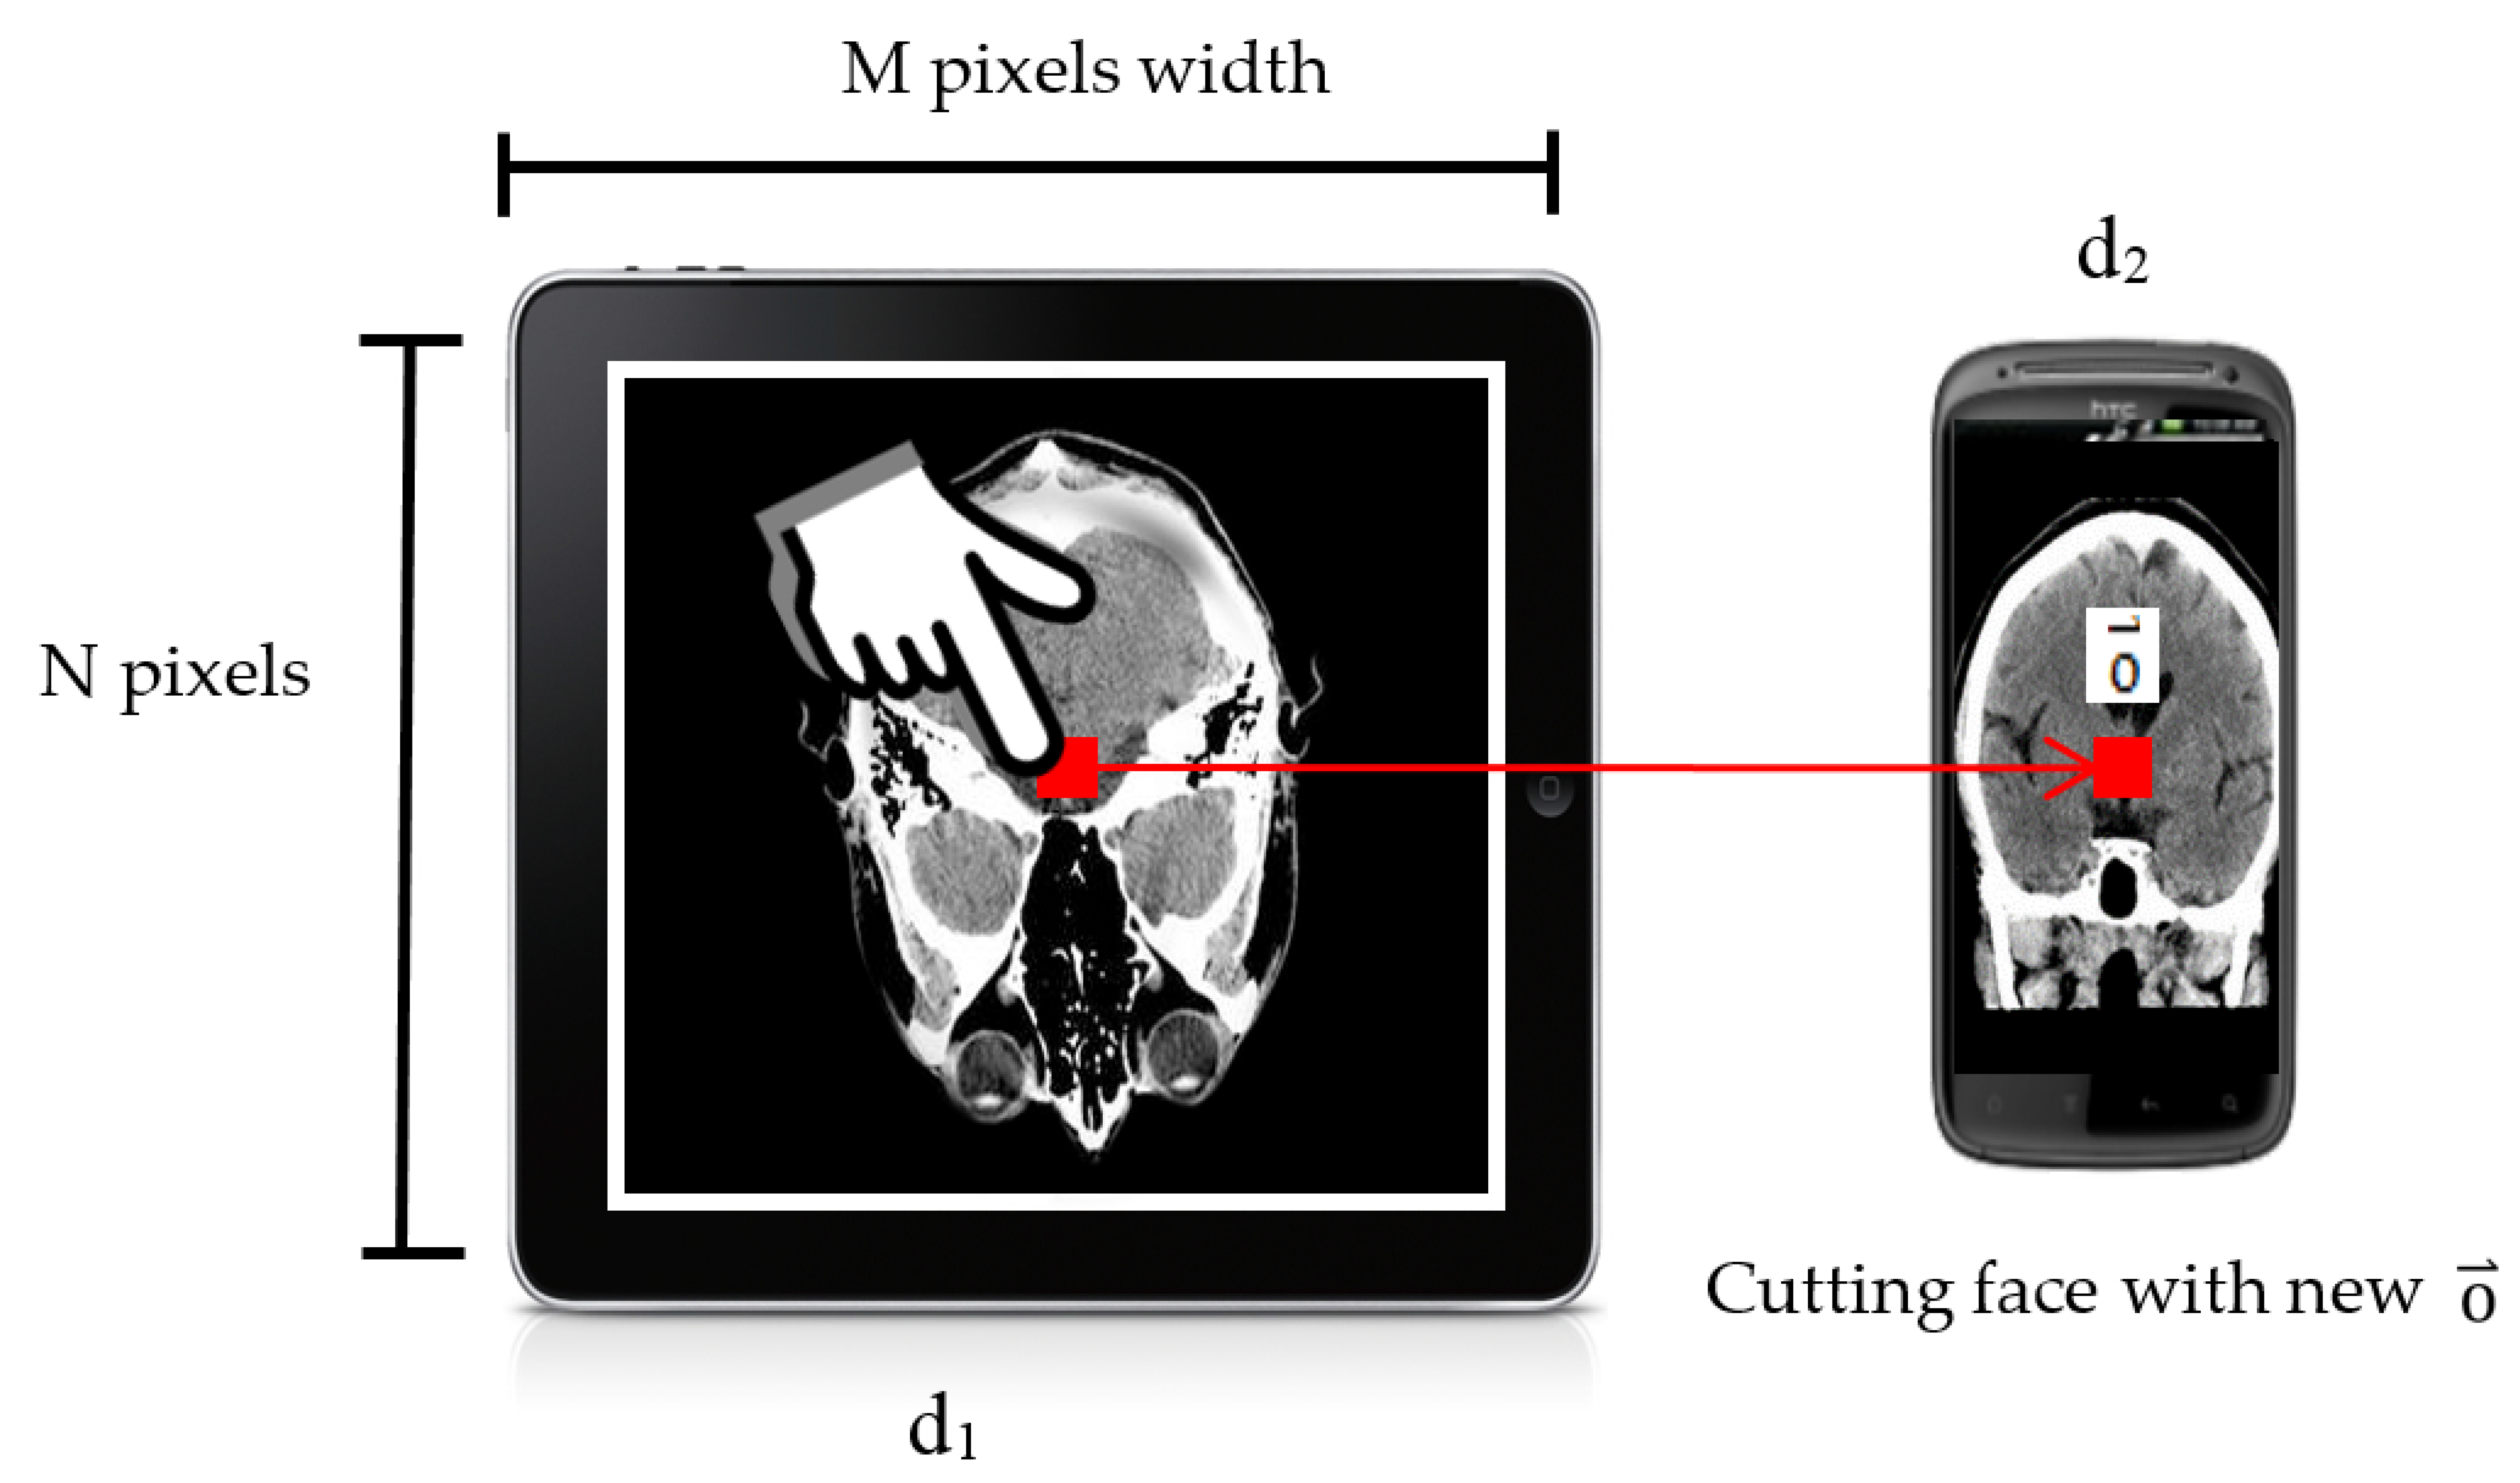
2 to the server only represents the location on screen, but does not represent the location on the cutting face. Hence, we need to map the location on the screen to the location on the cutting face. Below, we will introduce our mapping method. 
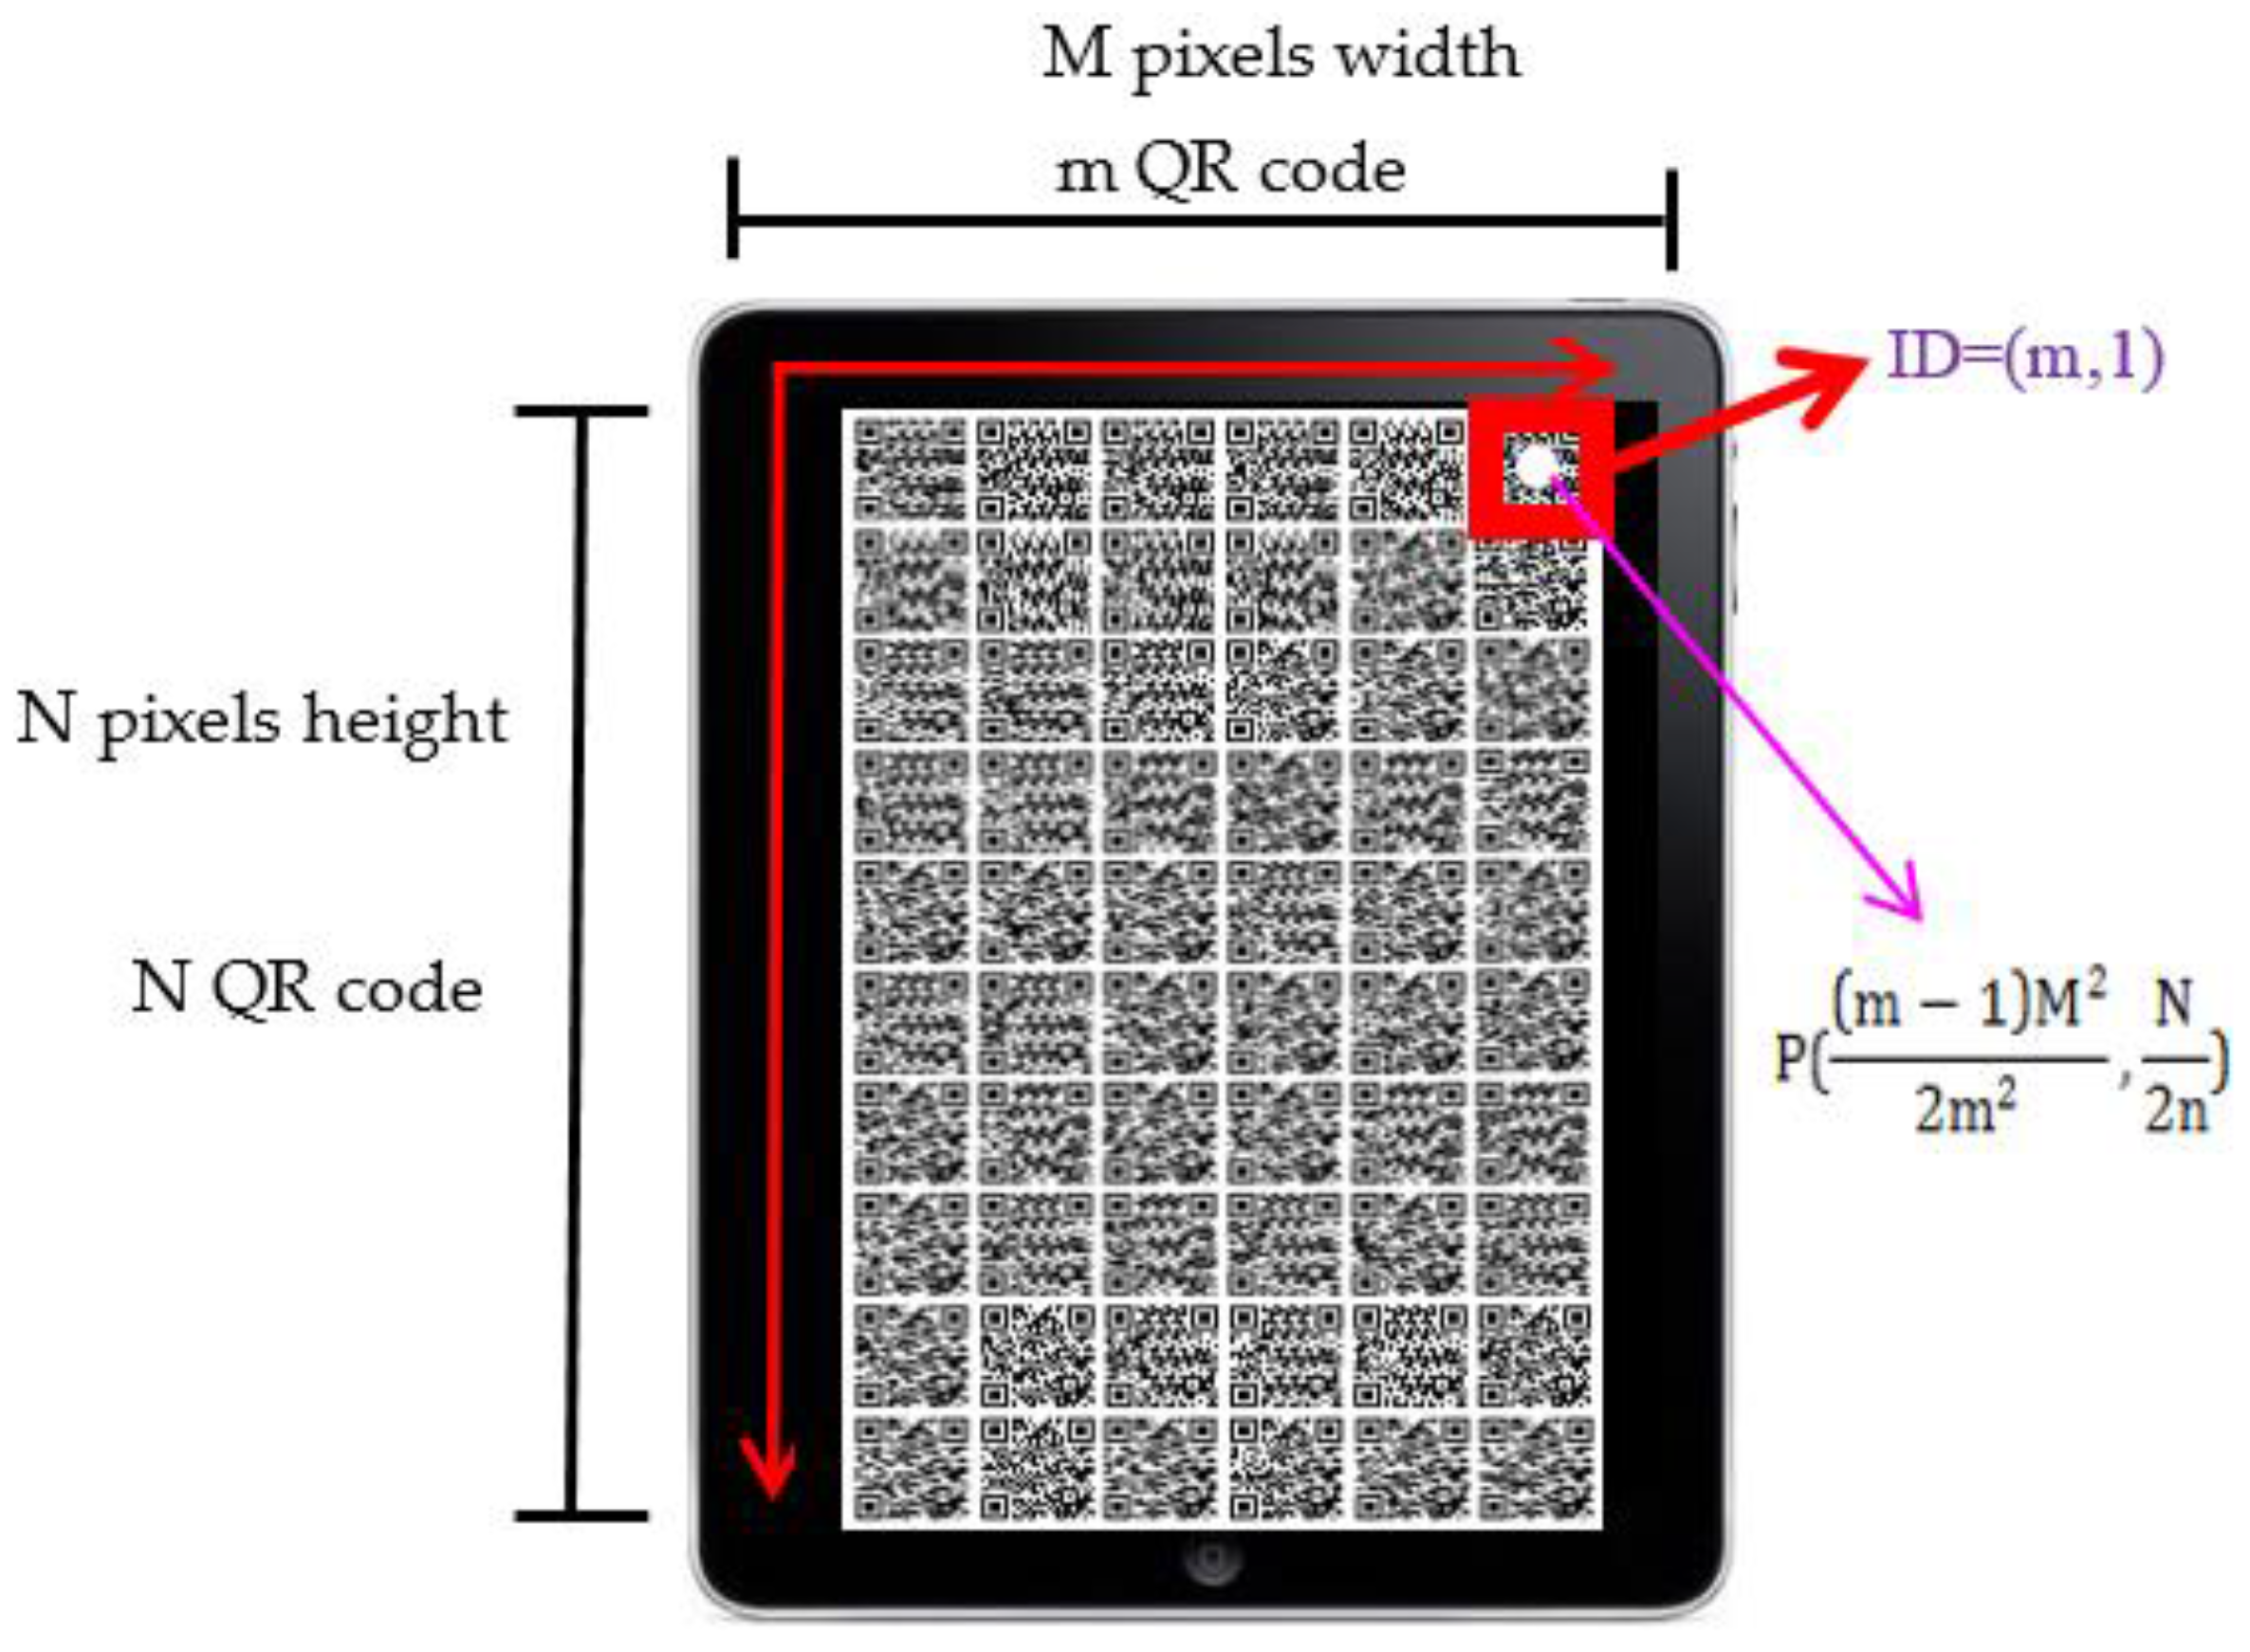
Figure 15 shows the layout of quick response codes on the screen. The total number of quick response codes depends on the dimension of the cutting face. We will calculate the ratio of the cutting face’s height and width and then estimate the number of quick response codes. In Figure 13, we assume that the cutting face is M pixels in width and N pixels in height, and it can afford m quick response codes in a row and n quick response codes in a column. Furthermore, we give each quick response code an ID to distinguish them. The ID is represented by the combination of the quick response code’s position in the x-axis and y-axis of the map, i.e., ID = ( Q x   ,   Q y ) . For example, in Figure 15, the quick response code on the bottom right of the screen has an ID = ( m ,   n ) . The basic idea of our mapping method is that we overlap the quick response code map and the cutting face, and the pixel point, P ( P x   ,   P y ) , which exactly mapped to the center of quick response code, is the location that the quick response code represents. The pixel point’s location on the cutting face, P ( P x   ,   P y ) , can be calculated by the following equations:
P x = 1 × M 2 m + ( Q x 1 ) × M m
P y = 1 × N   2 n   + ( Q y 1 ) × N n
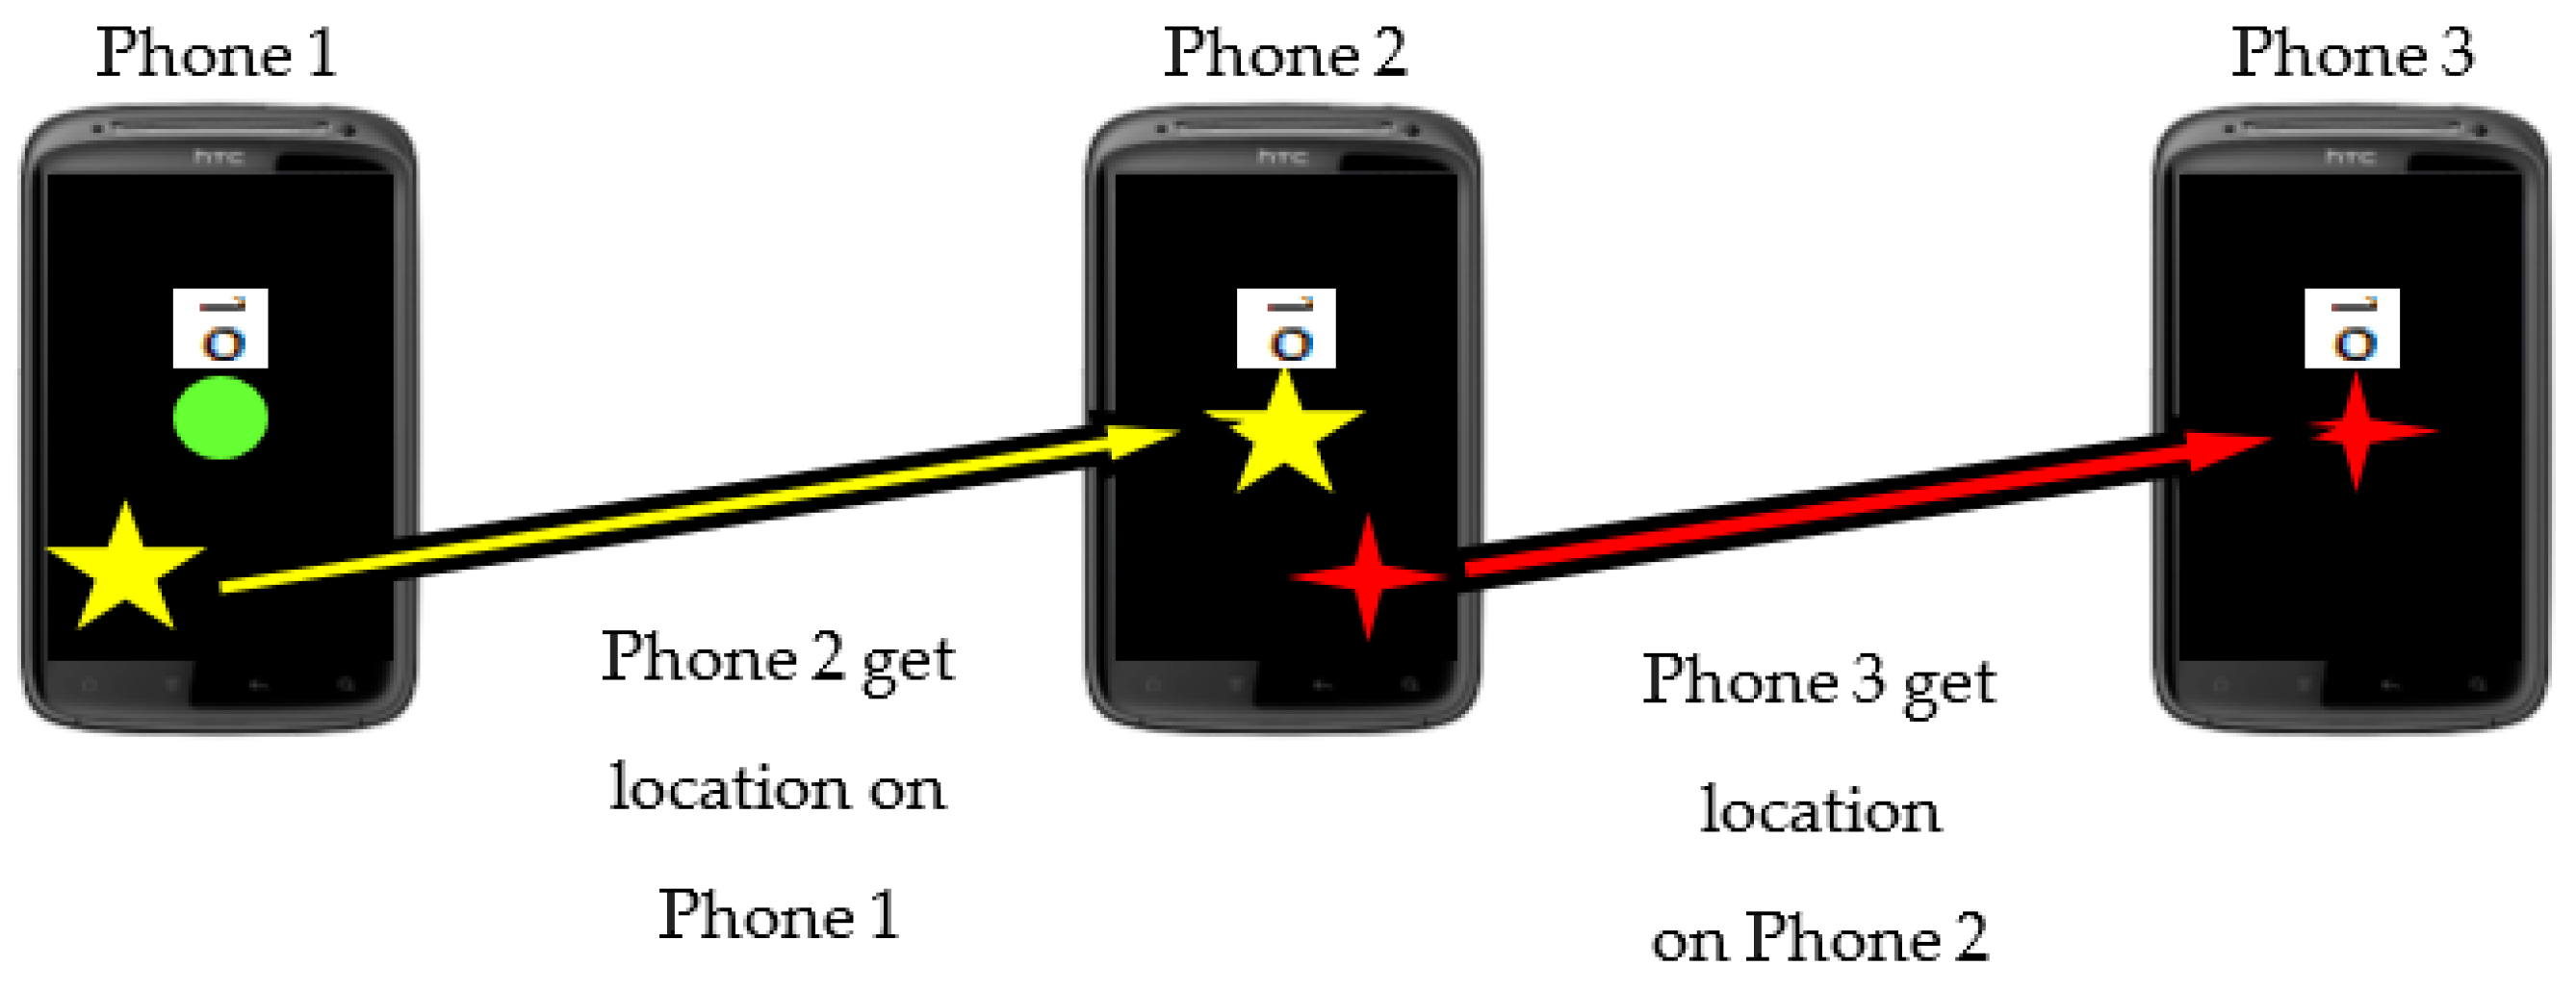
It is worth noting that according to our localization methods’ characteristics, we can find an interesting phenomenon called the cascade event; the localization events can connect like a chain that one handheld device can get the location from another handheld device and offer a location to the other handheld device, as shown in Figure 16.
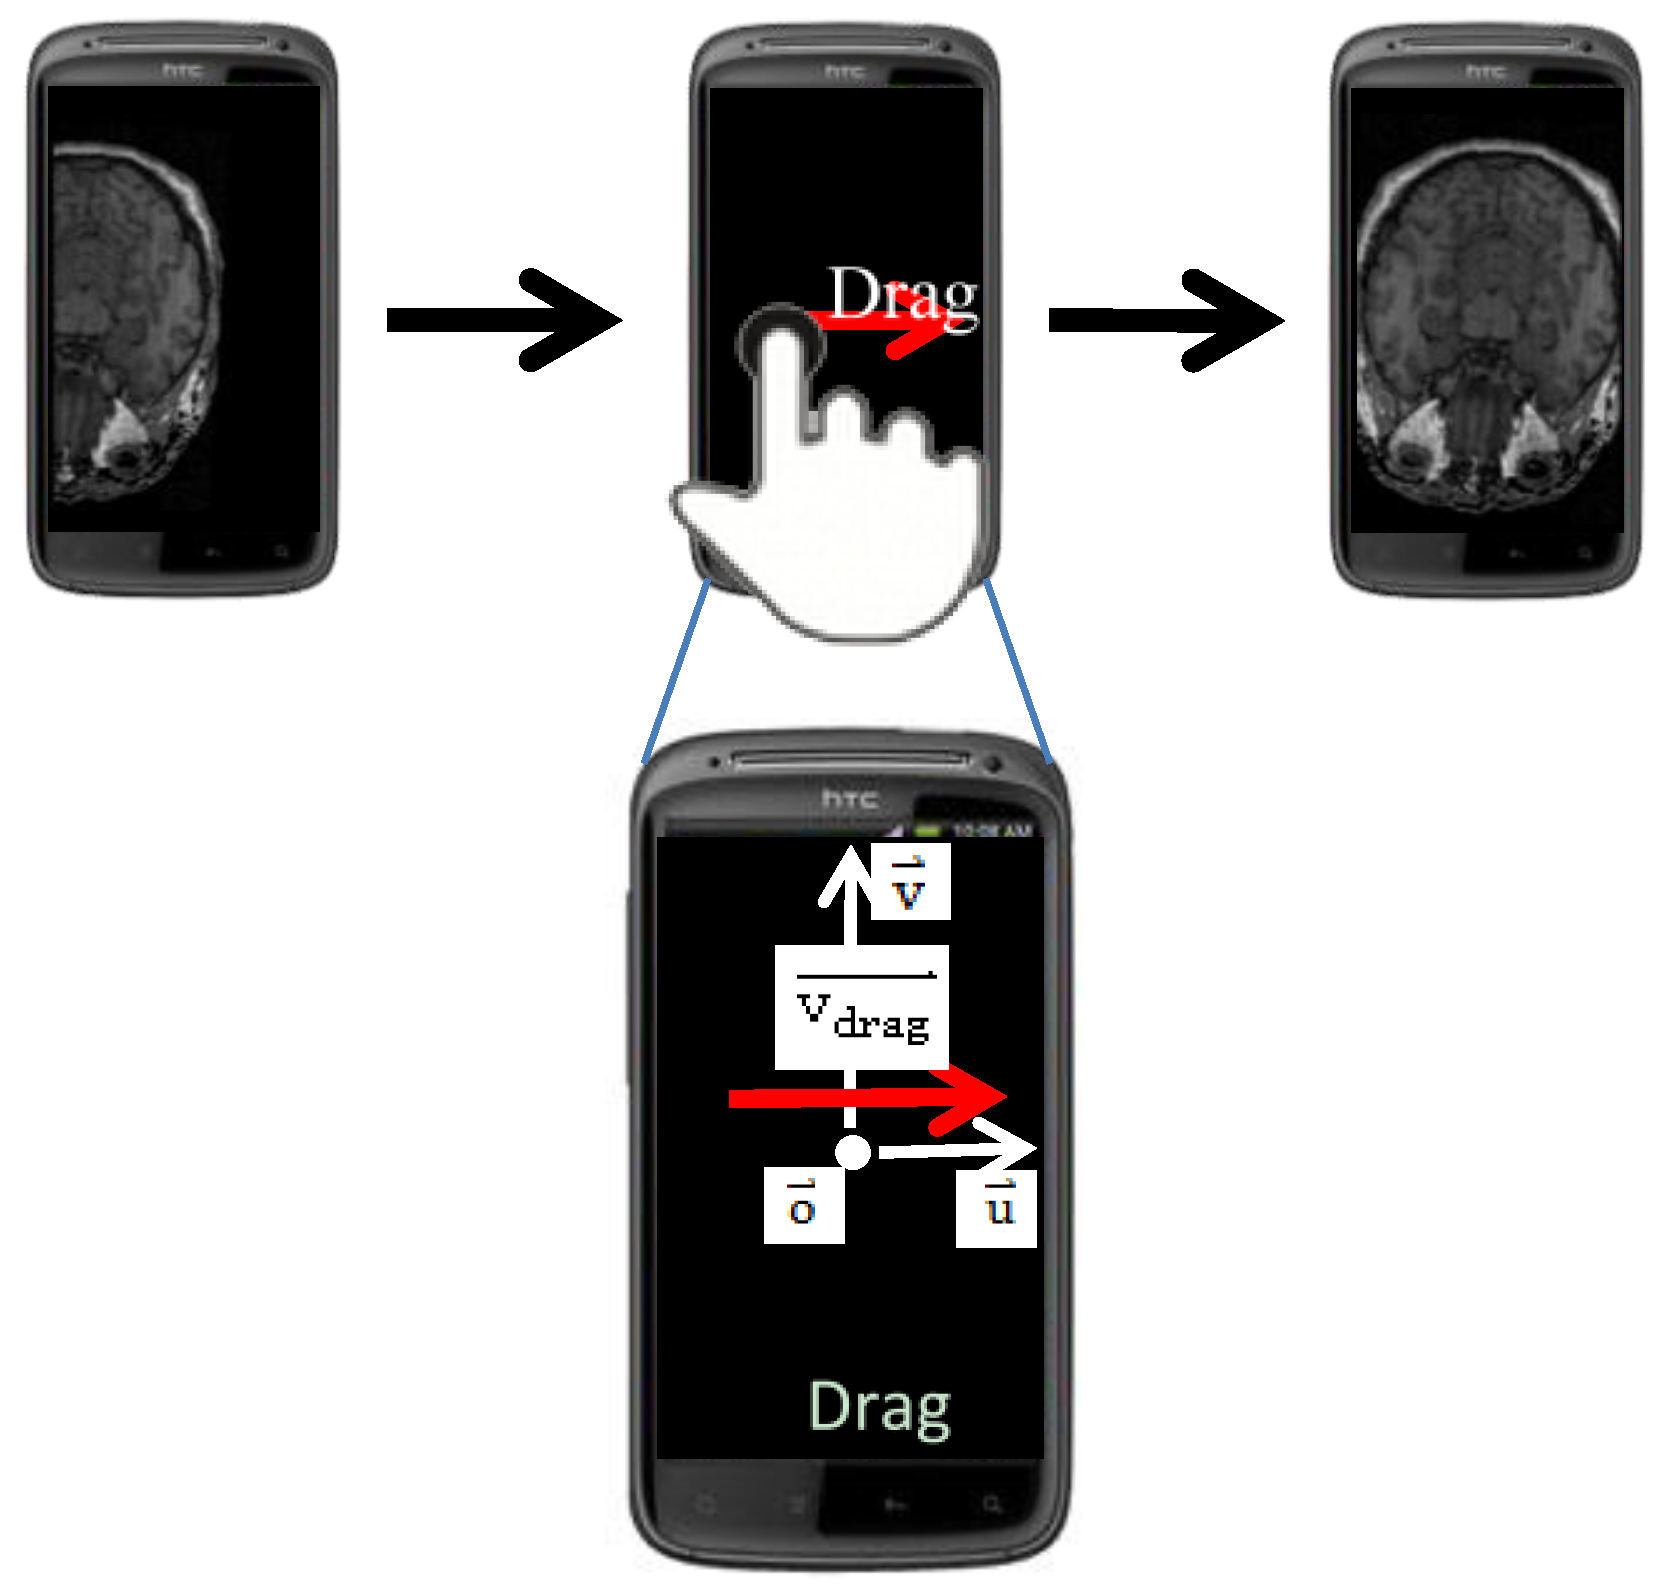
The localization methods mentioned above offer users a way to locate cutting faces in an absolute manner. In addition, we provide a relocation method for users to do minus adjustment to the location of cutting faces in a relative manner. In the relocation method, user can use touch gestures to move o the location of the cutting face. We designed two categories of touch gestures to move o in different dimensions. One of the categories contains only one gesture called drag. Drag is responsible for moving o on the u v plane, as shown in Figure 17. v drag is the moving vector, which defines the moving direction and the amount of movement. The new location of the cutting face, o new , can be calculated by the following equation:
o new = o + | v drag | u + | v drag | v
where v drag is a projected vector, which is projected from v drag to u , and v drag is another projected vector, which is projected from v drag to v .
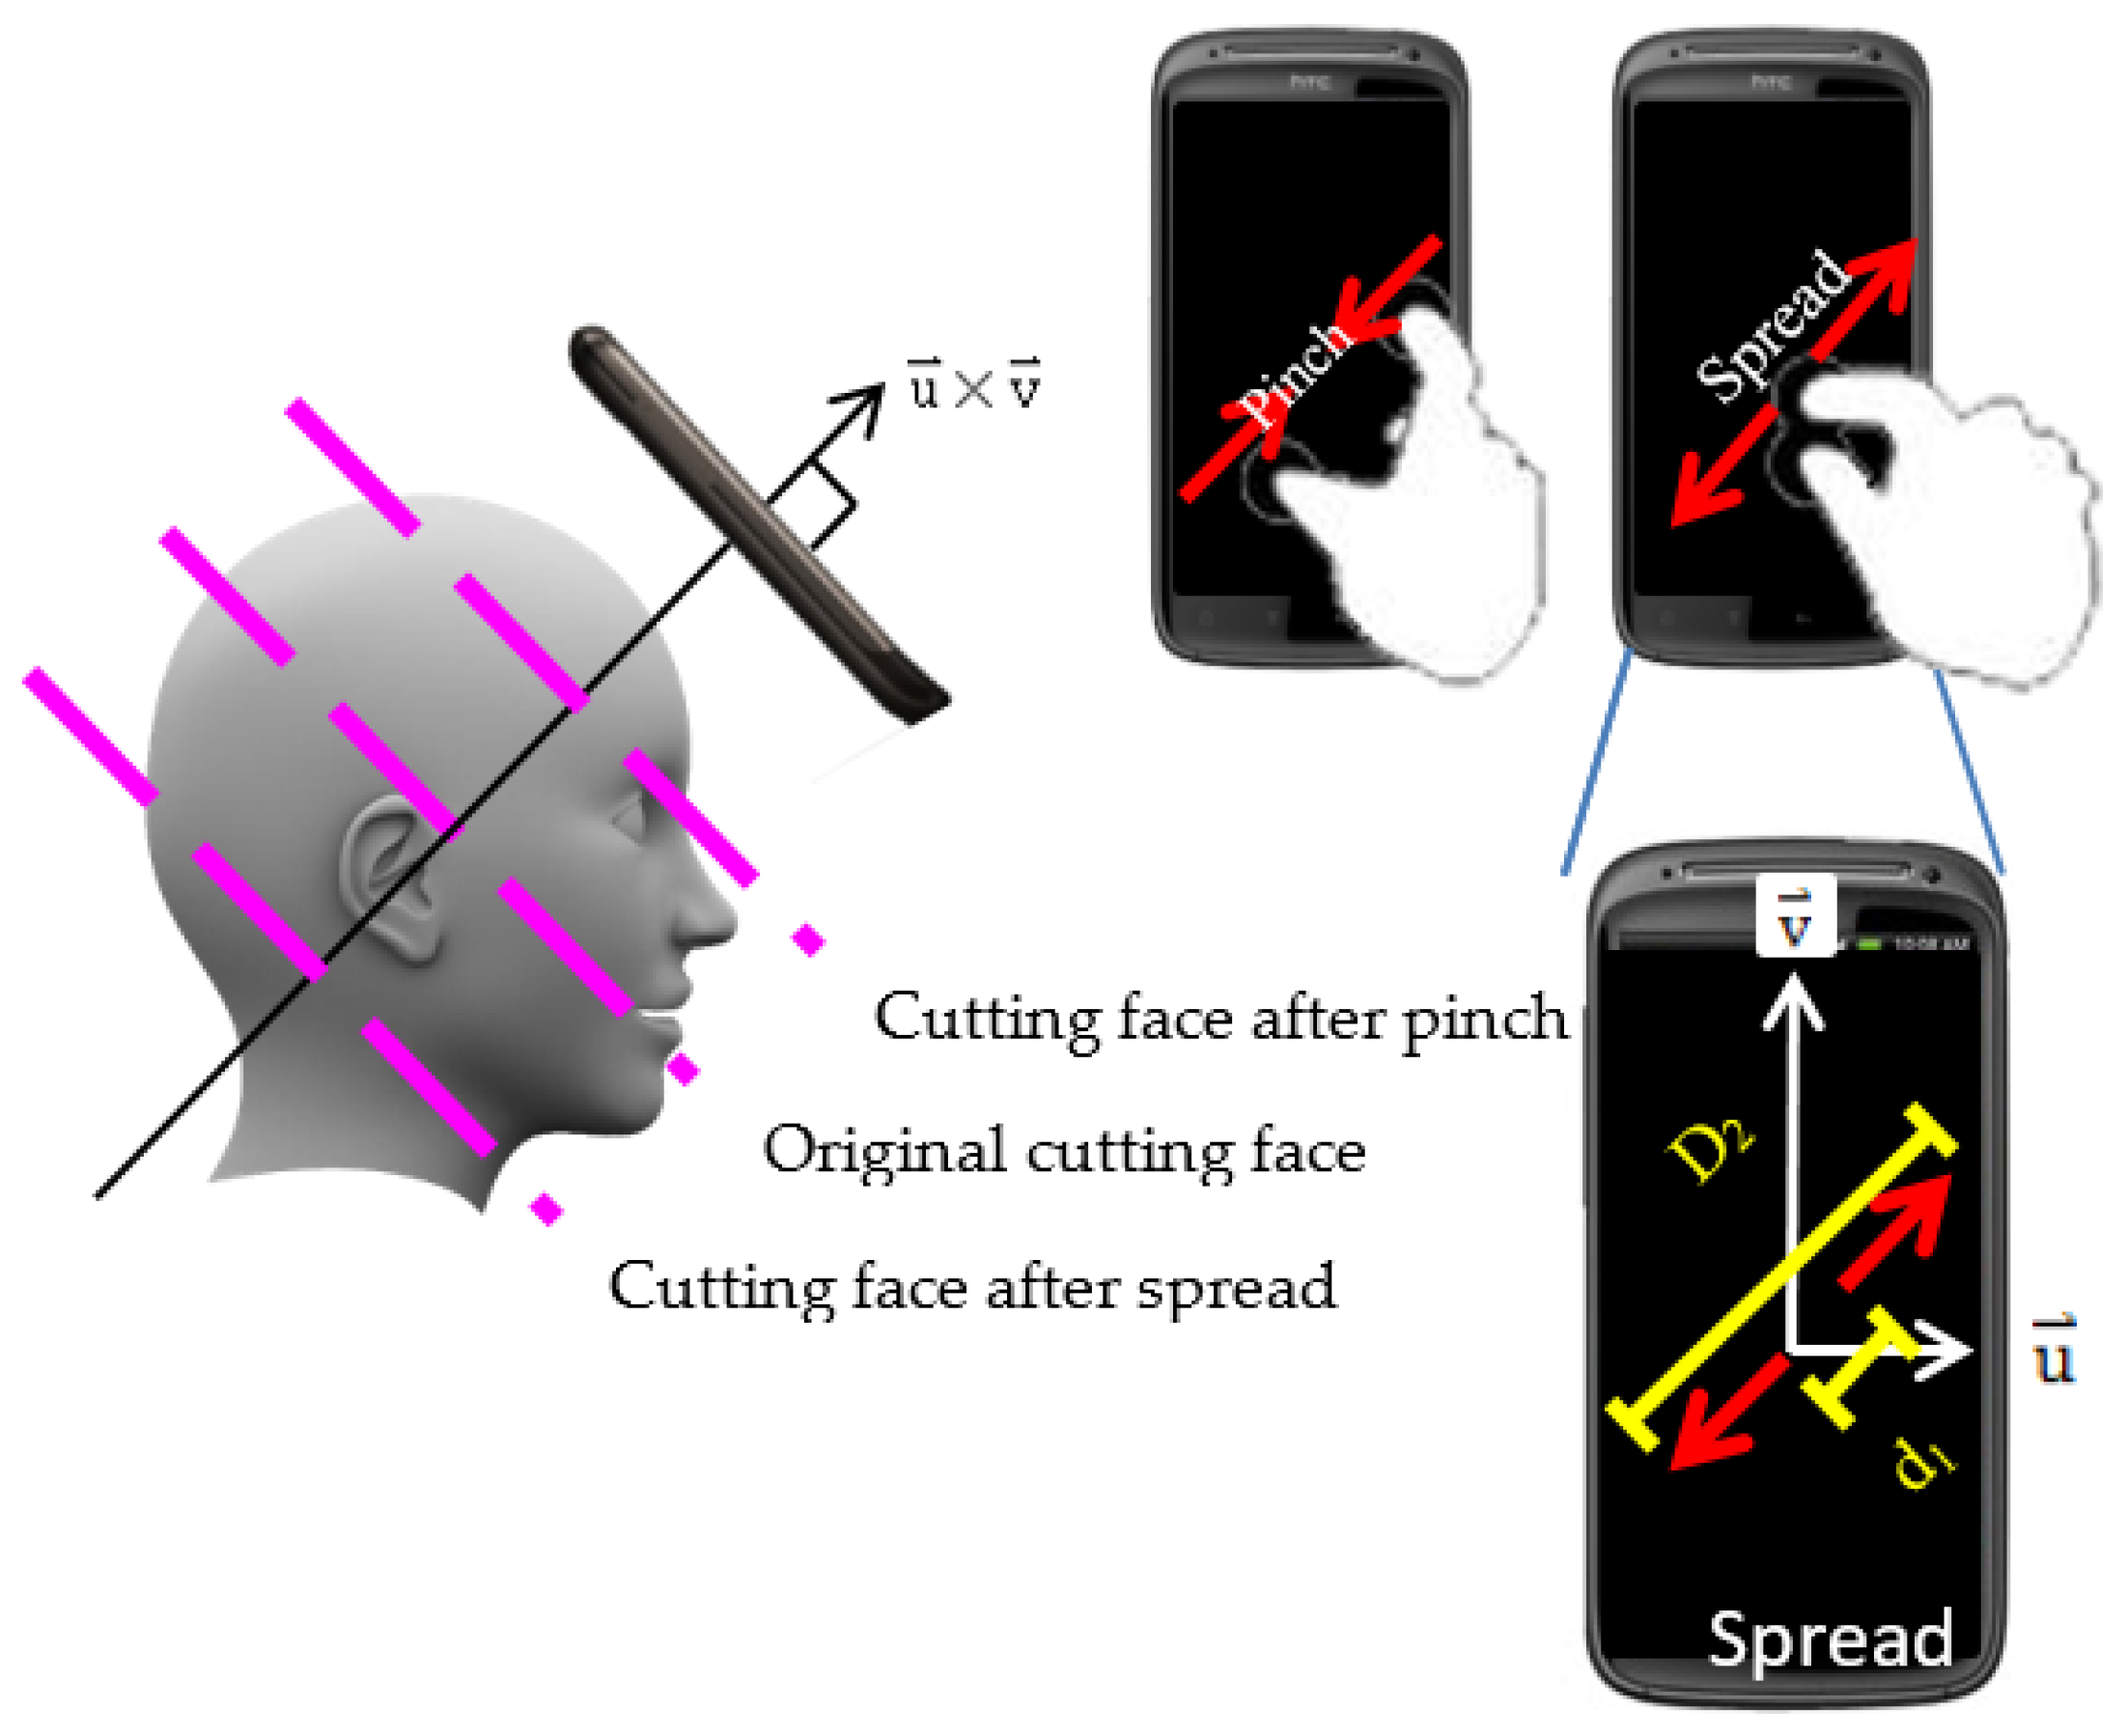
The other category contains two gestures, pinch and spread. The gestures in this category are responsible for moving o along the axis of u × v , as shown in Figure 18.
Pinch moves o in the direction of u × v , and spread moves in the inverse direction. The new location of cutting face, o new , can be calculated by the following equation:
o new = o + k s w
where k s is a scalar factor to control the amount of o ’s movement. k s is defined as k s = d new d old d old is the start distance between two fingers before making a gesture, and d new is the finish distance between two fingers after making a gesture. w is the notation for u × v .
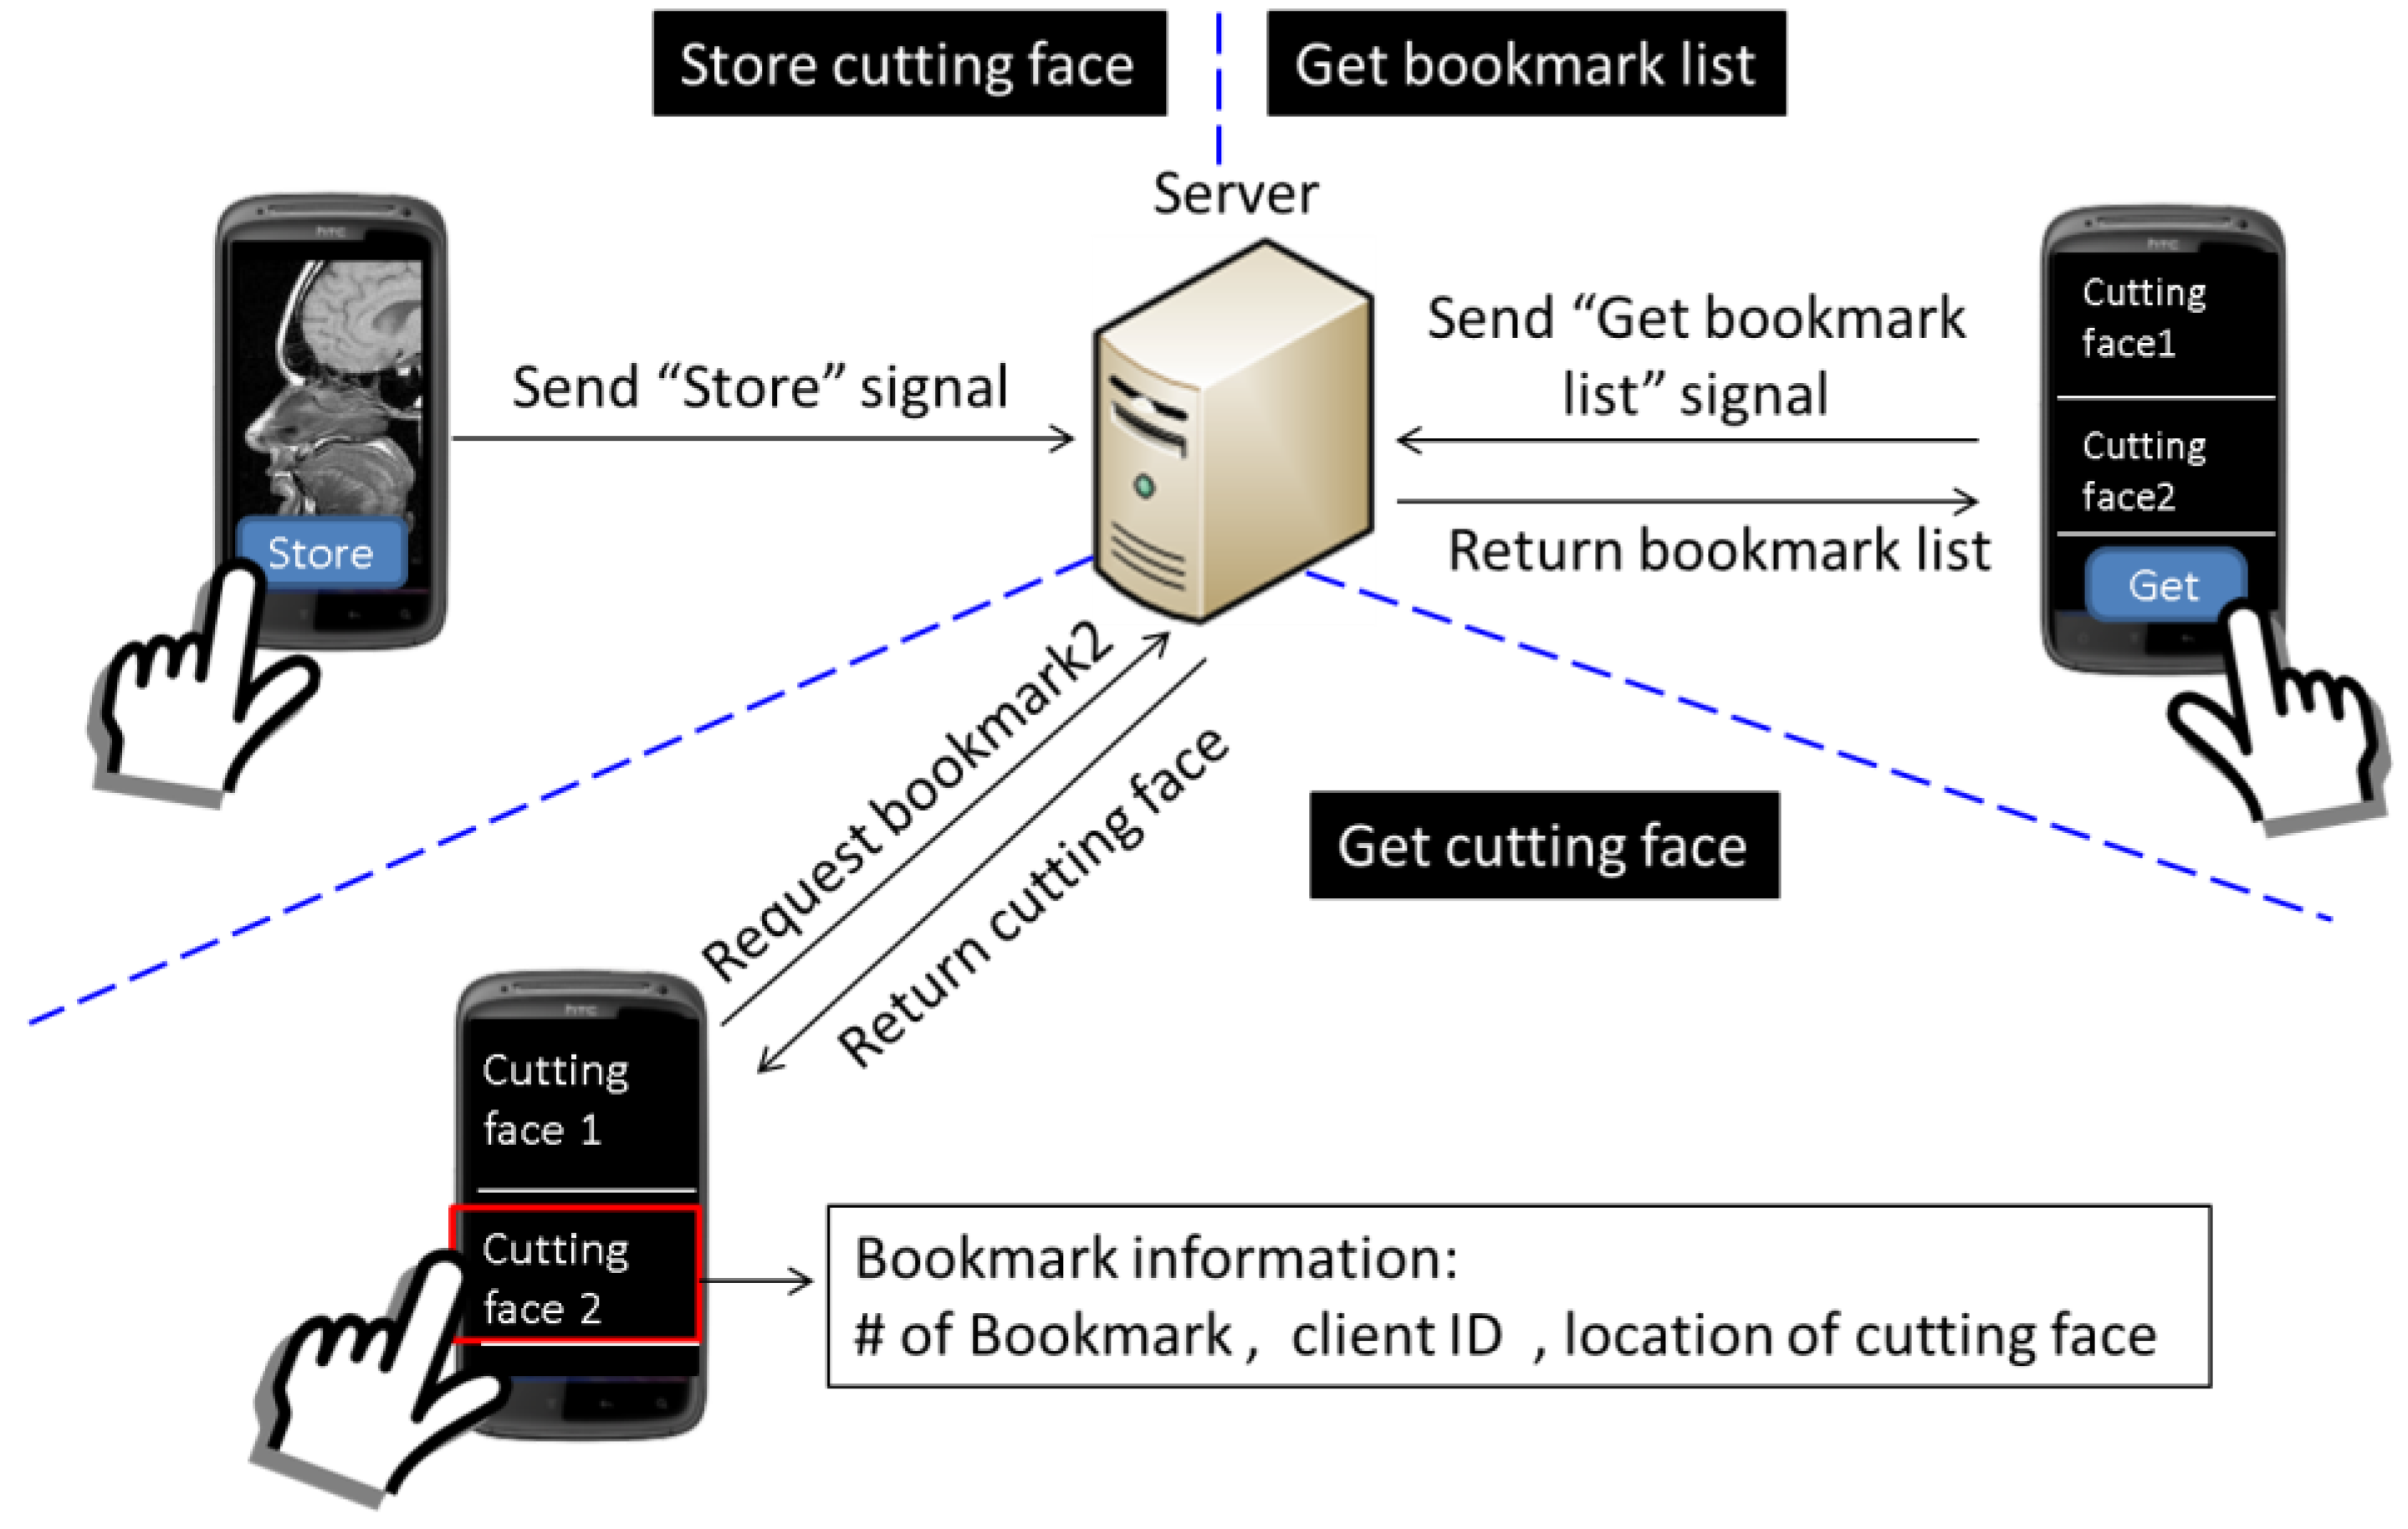
Considering user experience, it may be difficult for the user to re-access a specific cutting face with exactly the same orientation as the cutting face’s, which she/he has accessed earlier. As a result, we design a function called bookmark for users to record any cutting face that she/he thinks is important or interesting, which she/he may re-access the other day. The processes of storing the cutting face and retrieving the cutting face are shown in Figure 19. If the user wants to store the current cutting face as a bookmark, the user can send a “store” signal to the server, and then, the server will record the metadata of the cutting face for the use of reconstruction and produce corresponding bookmark information. The bookmark information includes the sequence number of this new bookmark, the client ID, which indicates the owner of the cutting face, and the location of the cutting face in the 3D image. Then, if the user wants to re-access the cutting face, the user can send a “get bookmark list” signal to the server to retrieve the information of bookmarks and then select the desired bookmark to get the cutting face.
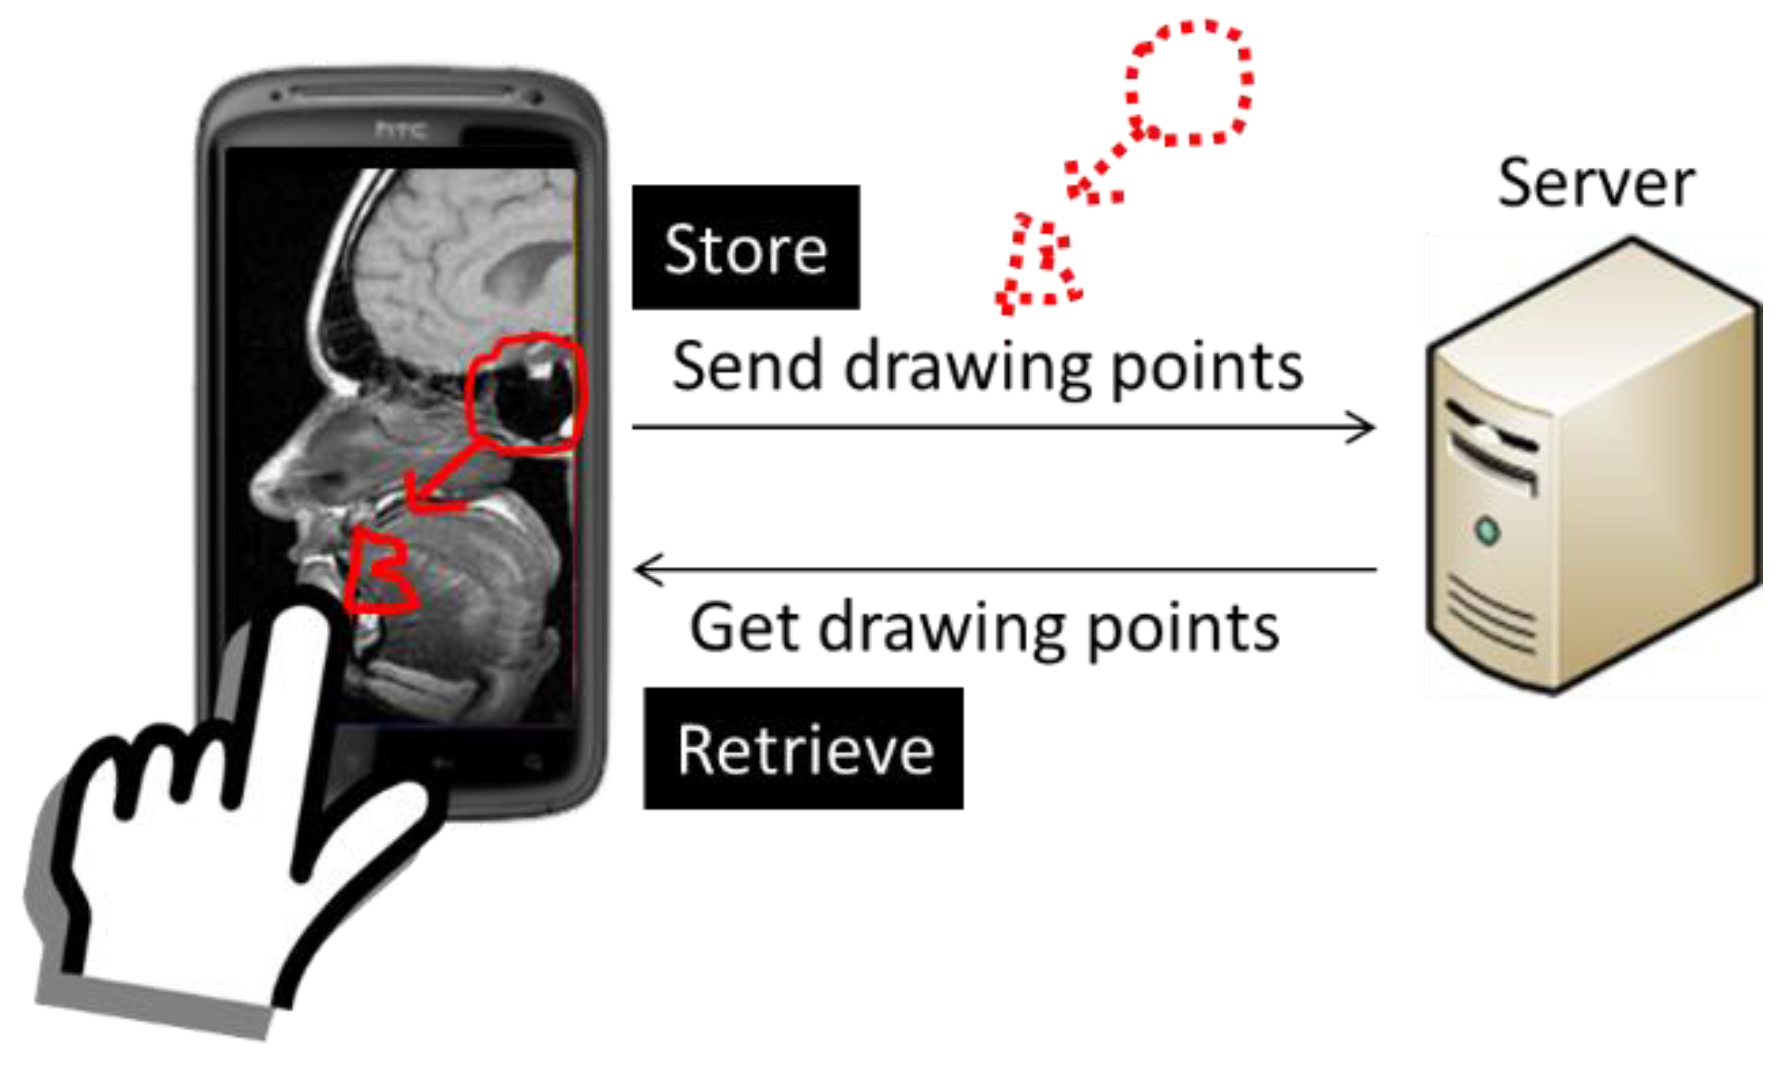
Furthermore, the user may want to put marks on cutting faces as reminders or just write notes on cutting faces to indicate some important information. Therefore, we designed another function, annotation, which allows the user to annotate directly on cutting faces. For example, if the 3D object is a medical 3D image, such as a computed tomography image, doctors may want to mark the part of the disease, and with the annotation function, doctors can easily mark it. As shown in Figure 20, the user can touch the screen to annotate on the cutting face, and the client program will send the drawing points to the server. Then, the server will store the cutting face with annotation on it as a new bookmark. If the user wants to re-access this cutting face, the drawing points will be sent with the cutting face to the user, and the client program will rebuild the annotation by drawing a quadratic Bézier curve between each of the two points.
In our system, the information of bookmarks is open to everyone, which means users can access others’ bookmarks. Therefore, users can easily share cutting faces or other information through bookmarks. The bookmark and annotation functions are implemented by cooperation of the “bookmark and annotation” module in both the client and server sides.
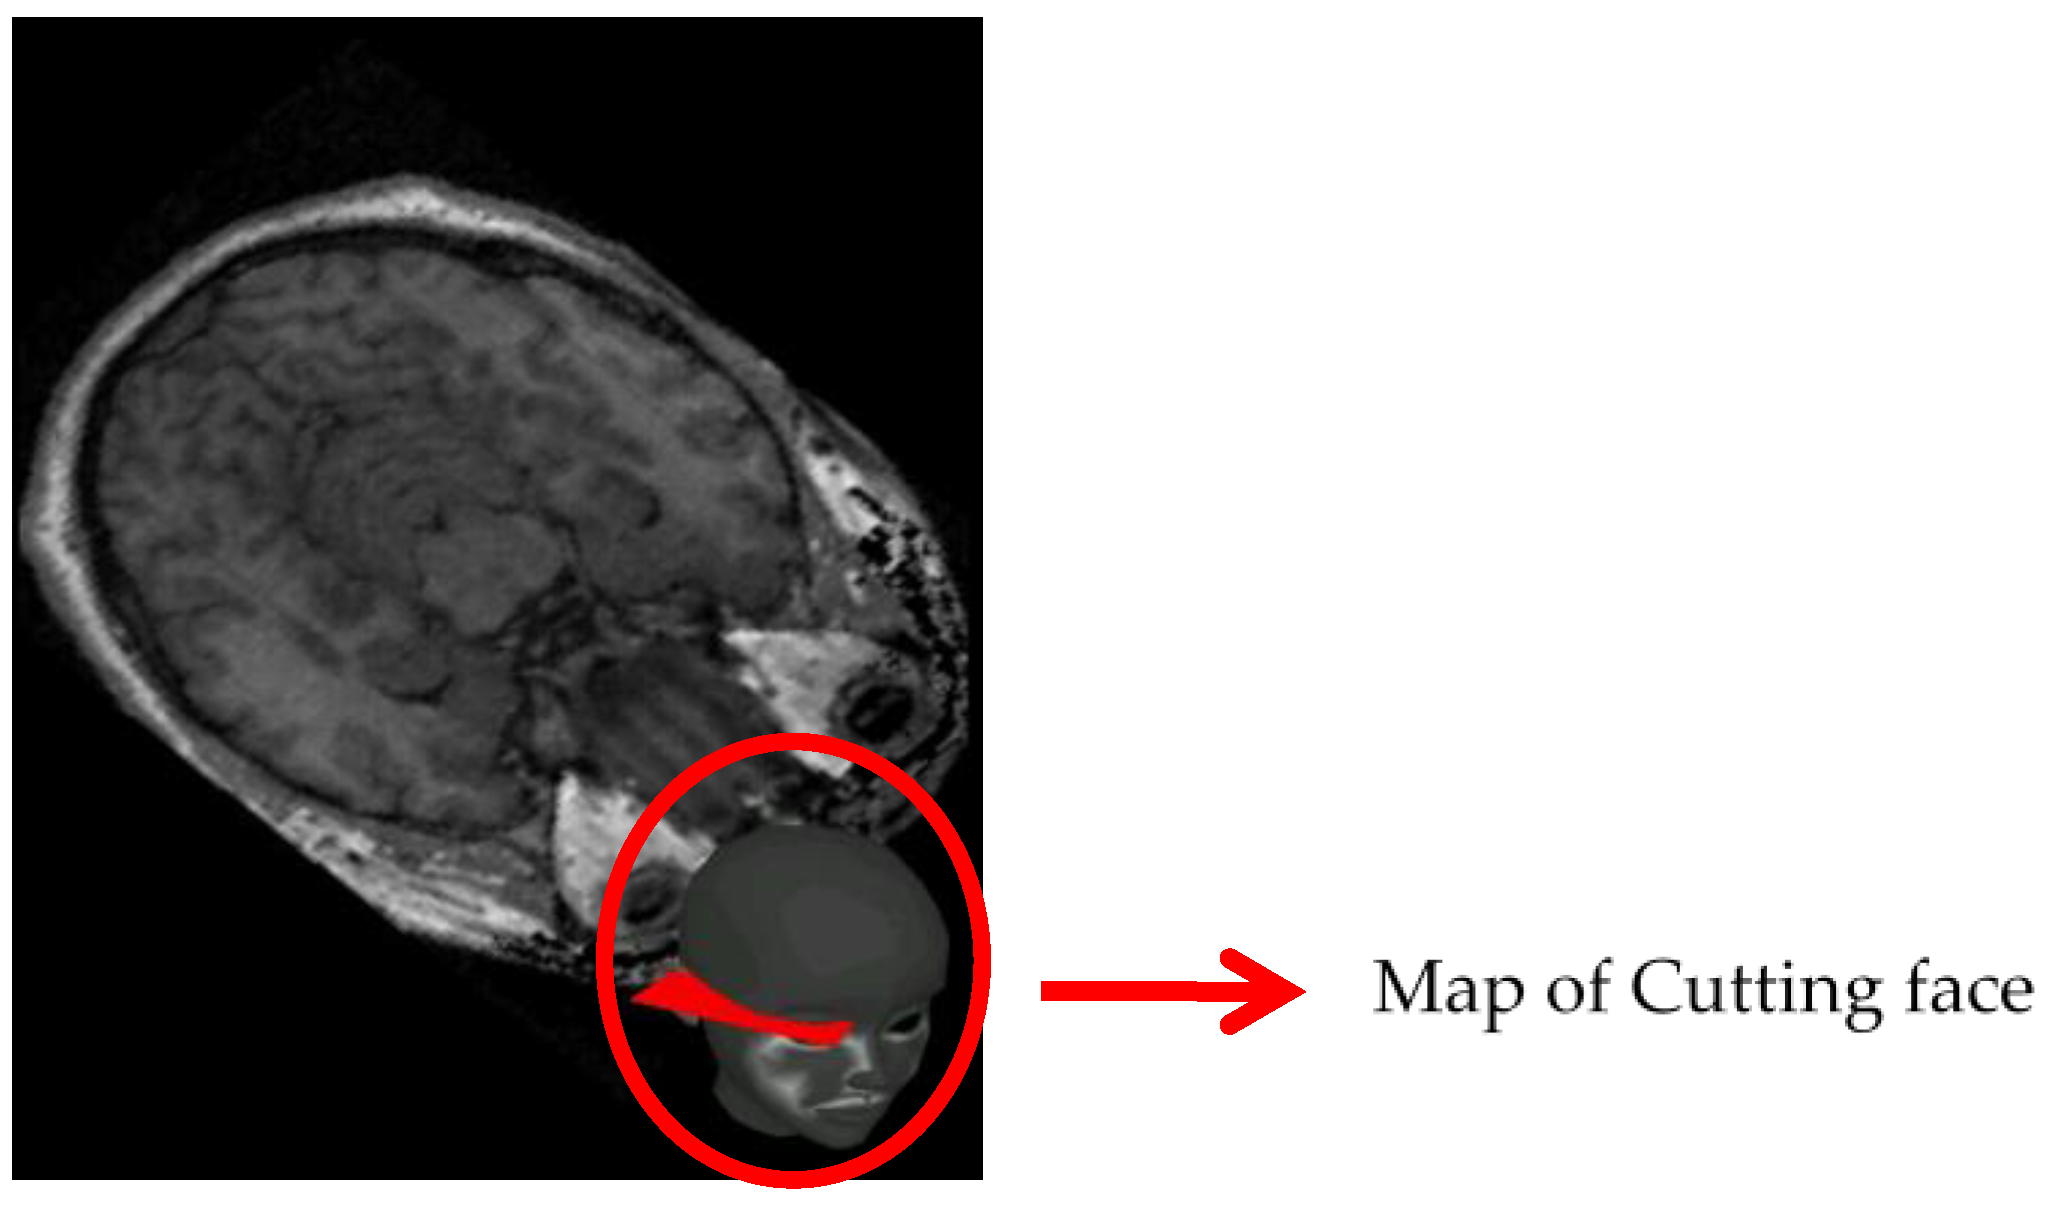
In our system, the 3D object is virtual, such that user cannot see it directly, but by using a handheld device to interact with it, the user can see cutting faces of the 3D object. However, only seeing cutting faces without other information on the screen, the user cannot have a perfect idea about the positions and orientations of the cutting faces relative to the 3D object. Therefore, we provide a small map, which will permanently show on screen and real-time update the position and orientation of the cutting face relative to the 3D object. As a result, the user can easily imagine the relationship between the cutting face and the 3D object. Figure 21 gives an example of the map. This function is implemented by the mini map module in the client side.

4.2. The Theoretical Result: Proof of Service

Proof of service was applied to test doctors’ satisfaction with the 3D MMMIS prototype through the t-test, which tells the differences between the 3D MMMIS and traditional PC mentioned in QFD. The proof of service completed the SEE research process from service requirements inquiry, service design, service prototyping to the last stage of a business model that has been shown in Figure 1. The present study can further strengthen the SEE methodology with this practical case and the empirical test. We developed a questionnaire; the questions were the six service requirements in Figure 2 that compared satisfaction between the 3D MMMIS and PC, for 30 doctors to test the proof of service of the 3D MMMIS. Doctors were sampled from a department of medical education of a university hospital in Taipei. Results of assessments by the t-test indicated that there was a significant increase (p < 0.05) among doctors’ overall experiences (Table 1). Doctors gave a positive rating and high satisfaction with scores increased by 13.27% after using the 3D MMMIS.
The details of service requirements revealed that five requirements, 3D medical imaging, app, consultation, communication and the doctor-patient relationship, were all significantly better than the traditional PC (p < 0.05). Only one requirement, medical imaging processing, was significantly worse than the traditional PC because of the computing and Internet speed problems. The 3D MMMIS through multiple mobile devices can help doctors’ consultations and satisfaction by applying SEE. However, some challenges still need to be overcome. First, the cloud computing ability of mobile devices still suffers from the growing big data of medical image processing. Second, the concern of confidentiality and privacy in health has caused difficulty integrating with the picture archiving and communication system (PACS) and the database in hospital information system (HIS). In this study, we can tell that the 3D MMMIS applied on personal mobile devices would be a modern need for improving healthcare. More corrections and modifications based on the vision of cloud medical imaging processing for healthcare could be done as Figure 22. The application of mobile devices combined with the techniques of medical image processing, the 3D MMMIS, is a practical service innovation that can benefit clinic consultations.

5. Conclusions

SSMED encourages value co-creation through interdisciplinary collaboration to solve problems for a better life. In this study, the knowledge and methodology of SSMED were applied to construct the 3D MMMIS following the trend of using mobile devices to help doctors’ requirements of medical image processing in their diagnosis and treatment. Our prototype combined with the services of the mobile app, medical imaging and cloud platform, the first product and service in using multiple mobile devices, can help consultation and communication, and the doctor-patient relationship would benefit wellness. An obvious gap between telemedicine and doctors was closed by this study. Direct application in the clinical situation could be worthy of expectation. SEE was applied to explore the satisfaction of users, which can strengthen the methodology of SSMED for the theoretical contribution. The service prototype was constructed to prove the service of the 3D MMMIS, which can enhance the ICT application in the healthcare industry for practical contributions. Results show that doctors are satisfied with our prototype of the 3D MMMIS, which is ready for the next stage of a business model. Conclusions are that the proposed the 3D MMMIS could be helpful for future healthcare industries and human’s wellness.

Author Contributions

Peng, K.-L. initiated, conceived and designed this study as well as wrote the paper. Lin, Y.-L. constructed and adjusted the systems. Tseng, Y.-C. offered resources, analyzed the data and draw the conclusions.

Conflicts of Interest

The authors declare no conflict of interest.

References

  1. Free, C.; Phillips, G.; Felix, L.; Galli, L.; Patel, V.; Edwards, P. The Effectiveness of M-Health Technologies for Improving Health and Health Services: A Systematic Review Protocol. BMC Res. Notes 2010, 3, 250. [Google Scholar] [CrossRef] [PubMed]
  2. Terry, M. Medical Apps for Smartphones. Telemed. J. e-Health 2010, 16, 17–22. [Google Scholar] [PubMed]
  3. Kaplan, W.A. Can the Ubiquitous Power of Mobile Phones Be Used to Improve Health Outcomes in Developing Countries? Global Health 2006, 2, 9. [Google Scholar] [CrossRef] [PubMed]
  4. Martinez, A.W.; Phillips, S.T.; Carrilho, E.; Thomas, S.W.; Sindi, H.; Whitesides, G.M. Simple Telemedicine for Developing Regions: Camera Phones and Paper-Based Microfluidic Devices for Real-Time, Off-Site Diagnosis. Anal. Chem. 2008, 80, 3699–3707. [Google Scholar] [CrossRef] [PubMed]
  5. Lin, C.Y.; Peng, K.L.; Cheng, J.; Tsai, J.Y.; Tseng, Y.C.; Chen, M.H. Improvements in Dental Care Using a New Mobile App with Cloud Services. J. Formos. Med. Assoc. 2014, 113, 742–749. [Google Scholar] [CrossRef] [PubMed]
  6. Lin, C.Y.; Peng, K.L.; Tsai, J.Y.; Tseng, Y.C.; Wu, C.C.; Chen, M.; Chen, J. Apply Cloud Services of Medical Image Processing on Dental Field. In Proceedings of the International Association for Dental Research Meeting, Seattle, WA, USA, 20–23 March 2013.
  7. Peng, K.L.; Lin, C.Y.; Tseng, Y.C.; Tsai, J.Y.; Chen, J. Service Design for Cloud Services of Dental Clinics. In Proceedings of the 19th International Conference on Distributed Multimedia Systems, Brighton, UK, 8–10 August 2013.
  8. Burton, C.; Weller, D.; Sharpe, M. Are Electronic Diaries Useful for Symptoms Research? A Systematic Review. J. Psychosom. Res. 2006, 62, 553–561. [Google Scholar] [CrossRef] [PubMed]
  9. Kailas, A.; Chong, C.C.; Watanabe, F. From Mobile Phones to Personal Wellness Dashboards. IEEE Pulse 2010, 1, 57–63. [Google Scholar] [CrossRef] [PubMed]
  10. Noel, H.C.; Vogel, D.C.; Erdos, J.J.; Cornwall, D.; Levin, F. Home Telehealth Reduces Healthcare Costs. Telemed J. e-Health 2004, 10, 170–183. [Google Scholar] [CrossRef] [PubMed]
  11. Zeithaml, V.A.; Berry, L.L.; Parasuraman, A. Delivering Quality Service: Balancing Customer Perceptions and Expectations; Free Press: New York, NY, USA, 1990. [Google Scholar]
  12. Martin, C.R.; Horne, D.A. Service Innovations: Successful Versus Unsuccessful Firms. Int. J. Serv. Ind. Manag. 1993, 4, 49–65. [Google Scholar]
  13. Edvardsson, B.; Gustavsson, A.; Johnson, M.D.; Sanden, B. New Service Development and Innovation in the New Economy; Student Literature: Lund, Sweden, 2000. [Google Scholar]
  14. Sundbo, J. The Organisation of Innovation in Services; Roskide University Press: Roskide, Denmark, 1998. [Google Scholar]
  15. Spohrer, J.; Maglio, P.P. The Emergence of Service Science: Toward Systematic Service Innovations to Accelerate Co-Creation of Value. Prod. Oper. Manag. 2008, 17, 238–246. [Google Scholar] [CrossRef]
  16. Peng, K.-L.; Hsieh, Y.-P.; Hsiao, S.-L.; Yang, R.-D. Service Design for Intelligent Vending Machine. In Proceedings of the International Conference in Humanities, Social Sciences and Global Business Management, Singapore, 30–31 December 2012.
  17. Maglio, P.P.; Spohrer, J. Fundamentals of Service Science. J. Acad. Mark. Sci. 2008, 36, 18–20. [Google Scholar] [CrossRef]
  18. Vargo, S.L.; Akaka, M.A. Service-Dominant Logic as a Foundation for Service Science: Clarifications. Serv. Sci. 2009, 1, 32–41. [Google Scholar] [CrossRef]
  19. Stavness, I.; Lam, B.; Fels, S. pCubee: A Perspective-Corrected Handheld Cubic Display. In Proceedings of the SIGCHI Conference on Human Factors in Computing Systems, Atlanta, GA, USA, 2010.
  20. Chittaro, L.; Ranon, R. Web3d Technologies in Learning, Education and Training: Motivations, Issues, Opportunities. Comput. Educ. 2007, 49, 3–18. [Google Scholar] [CrossRef]
  21. Hürst, W.; Helder, M. Mobile 3d Graphics and Virtual Reality Interaction. In Proceedings of the 8th International Conference on Advances in Computer Entertainment Technology, Lisbon, Portugal, 8–11 November 2011.
  22. Hansen, T.R.; Eriksson, E.; Lykke-Olesen, A. Mixed Interaction Space—Expanding the Interaction Space with Mobile Devices. In People and Computers Xix—The Bigger Picture; McEwan, T., Gulliksen, J., Benyon, D., Eds.; Springer: London, UK, 2006; pp. 365–380. [Google Scholar]
  23. Geen, J.; Krakauer, D. New Imems® Angular Rate-Sensing Gyroscope. Analog Dialogue 2003, 37, 1–4. [Google Scholar]
  24. Francone, J.; Nigay, L. Using the User’s Point of View for Interaction on Mobile Devices. In Proceedings of the IHM ′11 23rd French Speaking Conference on Human-Computer Interaction, Antipolis, France, 24–27 October 2011.
  25. Rekimoto, J.; Saitoh, M. Augmented Surfaces: A Spatially Continuous Work Space for Hybrid Computing Environments. In Proceedings of the SIGCHI Conference on Human Factors in Computing Systems, Pittsburgh, PA, USA, 15–20 May 1999.
  26. Butler, A.; Izadi, S.; Hodges, S. Sidesight: Multi-“Touch” Interaction around Small Devices. In Proceedings of the 21st Annual ACM Symposium on User Interface Software and Technology, Monterey, CA, USA, 19–22 October 2008.
  27. Kray, C.; Nesbitt, D.; Dawson, J.; Rohs, M. User-Defined Gestures for Connecting Mobile Phones, Public Displays, and Tabletops. In Proceedings of the 12th International Conference on Human Computer Interaction with Mobile Devices and Services, Lisboa, Portugal, 7–10 September 2010.
  28. Hinckley, K.P. Distributed Sensing Techniques for Mobile Devices. US Patent 7,532,196, 12 May 2009. [Google Scholar]
  29. Hsiao, S.-L.; Yang, H.-L. A Service Experience Engineering(See) Method for Developing New Services. Int. J. Manag. 2010, 27, 437–449. [Google Scholar]
  30. Peng, K.-L.; Hsieh, Y.-P. Service Design for Intelligent Vending Machine—Application of Service Experience Engineering Methods. Manag. Inf. Comput. 2014, 3, 255–270. [Google Scholar]
  31. Shostack, G.L. How to Design a Service? Eur. J. Mark. 1982, 16, 49–63. [Google Scholar] [CrossRef]
  32. Lowe, A.J. Quality Function Deployment. Available online: http://www.webducate.net/qfd/qfd.html (accessed on 11 April 2016).
Figure 1. Service experience engineering (SEE) methodology.
Systems 05 00005 g001
Figure 2. Quality function deployment of the 3D medical image processing.
Systems 05 00005 g002
Figure 3. Service blueprint.
Systems 05 00005 g003
Figure 4. A basic scenario of interaction.
Systems 05 00005 g004
Figure 5. System architecture.
Systems 05 00005 g005
Figure 6. Software architecture of the server platform.
Systems 05 00005 g006
Figure 7. Software architecture of the client platform.
Systems 05 00005 g007
Figure 8. Cutting faces.
Systems 05 00005 g008
Figure 9. Example of calculating the pixel’s location.
Systems 05 00005 g009
Figure 10. Orientation control modes.
Systems 05 00005 g010
Figure 11. Original touch-based localization method.
Systems 05 00005 g011
Figure 12. Touch-based localization method, including the identification phase.
Systems 05 00005 g012
Figure 13. Barcode version identification scheme.
Systems 05 00005 g013
Figure 14. Barcode-based localization scheme.
Systems 05 00005 g014
Figure 15. Cascade event.
Systems 05 00005 g015
Figure 16. Cascade event.
Systems 05 00005 g016
Figure 17. Drag gesture.
Systems 05 00005 g017
Figure 18. Pinch and spread gestures.
Systems 05 00005 g018
Figure 19. Processes of cutting face storing and retrieving.
Systems 05 00005 g019
Figure 20. Annotation storing and retrieving.
Systems 05 00005 g020
Figure 21. Map of the cutting face.
Systems 05 00005 g021
Figure 22. Cloud services of medical image processing for healthcare. MMMIS, multiple mobile medical imaging system.
Systems 05 00005 g022
Table 1. Independent samples test.
tdfSignificant (2-Tailed)Mean DifferenceStandard Error Difference95% Confidence Interval of the Difference
LowerUpper
3.648290.001 *0.416670.114220.187250.64608
Note: Levene’s test for equality of variances of the t-test is insignificant (p > 0.05). The * means significant.

