Review

The Cytochrome CYP4 in Breast and Other Cancers

by
Gloria M. Calaf
1,*,
Leodan A. Crispin
1,
Felipe Ossandon-Acosta
2,
Summer Perez-Tapia
2 and
Luis N. Ardiles
1
1
Instituto de Alta Investigación, Universidad de Tarapacá, Arica 1000000, Chile
2
Departamento de Química, Facultad de Ciencias, Universidad de Tarapacá, Arica 1000007, Chile
*
Author to whom correspondence should be addressed.
Biology 2025, 14(7), 812; https://doi.org/10.3390/biology14070812
Submission received: 30 May 2025 / Revised: 27 June 2025 / Accepted: 1 July 2025 / Published: 4 July 2025
(This article belongs to the Section Cancer Biology)

Simple Summary

The complex relationship between CYP enzymes and estrogen receptors in breast cancer is highlighted, revealing potential therapeutic interventions. The study reveals genomic alterations and differential expression patterns between normal and tumor tissues, suggesting a functional role in tumorigenesis. The positive correlation of these genes with estrogen receptor status strengthens their potential as predictive biomarkers.

Abstract

Breast cancer has emerged as the leading cause of death among females worldwide. The CYPs play a crucial role in carcinogenesis. The role of the CYP enzyme family, particularly the CYP4 family, in cancer biology has attracted significant attention in recent years. Bioinformatics indicated that breast cancer is influenced by genes like CYP4B1, CYP4F12, and CYP4F3. CYP4B1 has a non-significant correlation with BRCA1 and BRCA2, but a positive correlation with ESR1 in the basal subtype. CYP4F12 has a significant positive correlation with BRCA1 in the Luminal B subtype, but not with BRCA2, and a positive correlation with ESR1 in the basal subtype. CYP4F3 has a significant positive correlation with BRCA1 in the Luminal A and Luminal B subtypes and with BRCA2 in Her2, Luminal A, and Luminal B subtypes, and a positive correlation with ESR1 in the basal subtype and Luminal B patients. This article aims to emphasize the functional importance of CYP4, highlighting the complex interplay between CYP enzymes and estrogen receptors in breast cancer, and indicating new avenues for future research and potential therapeutic interventions. In addition, their expression profiles and alterations were examined across various organs and cancer types. These findings underscore the potential relevance of these genes as predictive biomarkers and prospective therapeutic targets in specific cancer settings.

1. Introduction

Cancer, a multifaceted group of diseases, is characterized by the uncontrolled growth and spread of abnormal cells, which can invade nearby tissue and metastasize to distant organs [1]. Breast cancer has become the leading cause of death in females worldwide, being responsible for 670,000 deaths in 2022, according to the World Health Organization [2]. The global incidence of cancer is increasing, driven by aging populations, lifestyle factors, and environmental exposures, placing an immense physical, emotional, and economic burden on society. These burdens are felt particularly in low- and middle-income countries, where healthcare systems often lack the resources for early diagnosis and access to treatment [3]. By contrast, in countries with robust healthcare infrastructures, cancer survival rates are improving thanks to advancements in early detection and prevention, and the availability of high-quality treatments [4].
Cancer types vary by gender and region. Among men, lung, prostate, colorectal, stomach, and liver cancers are the most prevalent, while women are more frequently diagnosed with breast, colorectal, lung, cervical, and thyroid cancers [5]. Despite the differences in cancer types and risk factors, certain biological mechanisms underlie the development and progression of tumors, and understanding these mechanisms is essential for developing new therapeutic strategies [6].
Estrogen receptor (ER), progesterone receptor (PGR), and erb-b2 receptor tyrosine kinase 2 (ERBB2) are three important receptors that are commonly utilized to categorize breast cancers. The lack of these receptors is a characteristic of TNBC, a subtype of breast cancer [7]. When the ER is positive, estrogens cause cancer cells to proliferate. However, TNBC does not have this receptor. TNBC also lacks PGRs, which are associated with the hormone progesterone. TNBC is more aggressive than other subtypes of breast cancer and is associated with a higher risk of recurrence and a worse prognosis [8]. African American women and young patients are the main victims of basal-like tumors, which account for 15% of all breast cancers [9]. Because TNBC does not react to hormone therapies or drugs that target HER2, therapeutic choices are more limited [10]. Standard treatment often includes chemotherapy, but researchers are also looking into immunotherapies and tailored medicines. Researchers are looking into the molecular characteristics of TNBC to identify potential targeted medications and biomarkers that could indicate how therapy will proceed. Clinical trials and innovative immunotherapy strategies have enormous potential to improve TNBC patients’ prognosis [11].
Many research studies have used microarray analysis to propose a new taxonomy of breast cancer based on genetic characteristics. Gene expression microarray-based class discovery studies have revealed at least five molecular breast cancer subtypes: basal-like, Her2, normal breast-like, luminal A, and luminal B [12,13,14,15,16,17]. The greatest distinction between the transcriptomes of estrogen receptor-positive (ERþ) and ER-negative (ER) breast cancers was found by microarray research. The basal-like group is a subject of debate regarding the molecular subtypes of breast cancer identified by gene expression profiling studies. The characteristics of basal-like breast cancer have been studied, and pathologists are aware of the distinctions between triple-negative and basal-like breast cancers [15,18,19,20].
The molecular subtypes identified by microarrays and immune histochemical markers are not often directly comparable [21,22]. The definition of basal-like breast cancers is not generally accepted. Using panels of immune histochemical markers and microarray-based expression profiling [23], several groups have tried to identify basal-like breast cancers. These include the following: (1) the triple-negative immune phenotype (absence of ER, PGR, and HER2 expression); (2) the expression of one or more high-molecular-weight/basal cytokeratins (CK5/6, CK14, and CK17); (3) absence of ER and HER2 expression in conjunction with CK5/6 and/or EGFR expression [22]; and (4) the absence of ER, PGR, and HER2 expression in conjunction with CK5/6 and/or EGFR expression. Histological characteristics [21,24], chemotherapeutic response [12,16,25,26,27,28,29,30,31], and distinct clinical presentations [32] are all displayed by these malignancies.
Estrogen receptor-negative (ER-) breast cancer is a heterogeneous disease that is characterized by an earlier time-to-lapse compared to ER+ breast tumors [33,34]. As opposed to estrogen receptor-positive (ER+) breast cancer, where the estrogen receptor signaling has a critical biological and therapeutic role, there is limited knowledge available regarding the pathophysiology of ER- disease. Therefore, to discover effective therapeutic strategies, there is a need for a better understanding of the biology of ER- breast cancer. This disease can be divided into molecular subgroups based on the expression microarray profiling, and the two most prominent ER- subgroups include molecular apocrine and basal subtypes [34,35,36]. The molecular apocrine subtype is characterized by a steroid response gene signature that includes the androgen receptor, FOXA1, TFF3, and a high frequency of ErbB2 overexpression [35,36,37].
An area of research that has attracted significant attention in recent years is the role of the cytochrome P450 (CYP) enzyme family, particularly the CYP4 family, in cancer biology. The cytochrome P450 enzymes are traditionally known for their function in drug metabolism and the biotransformation of endogenous compounds such as fatty acids and eicosanoids [38,39]. This is a large superfamily of integral membrane-conserved proteins present in animals, plants, and microorganisms [7].
These enzymes catalyze the oxidation of a wide range of substrates, including xenobiotics, and their activity is crucial for maintaining lipid homeostasis and detoxifying foreign substances [40]. However, emerging evidence suggests that the CYP4 family of enzymes may also have a profound impact on tumorigenesis, cancer progression, and the response to therapy [41]. The CYPs include exogenous (xenobiotics) and endogenous compounds, such as cholesterol, testosterone, progesterone, prostaglandin H2, corticosterone, retinoic acid, and integral membrane conserved proteins present in animals, plants, and microorganisms [42,43]. CYP is a subfamily of enzymes that catalyze the metabolism of drugs and other substances, such as estradiol, and also act in various metabolic processes in different cell tissue [7]. The CYP isoenzyme superfamily comprises 57 CYP genes and 58 pseudogenes, which are arranged into 18 families and 43 subfamilies in man [8]. These are heme-containing proteins that catalyze the oxidative metabolism of many structurally diverse drugs and chemicals [9].
In mammals, the CYP system is expressed in all examined tissue [42]. They predominate in the endoplasmic reticulum membrane and other cellular compartments, such as the cell surface and mitochondria [44]. The CYP superfamily is primarily located in the liver, small intestine, and kidney [45,46]. CYP enzymes catalyze different oxidation and some reduction reactions [47]. The CYP4A subfamily is responsible for encoding a variety of CYP enzymes. These enzymes can hydroxylate the terminal omega-carbon and, less commonly, the (omega-1) position on both saturated and unsaturated fatty acids. Additionally, they include enzymes that are involved in the omega-hydroxylation of different prostaglandins [48].
The present study aims to analyze the complex interplay between CYP enzymes and estrogen receptors in breast cancer, looking for new avenues for potential therapeutic interventions. However, this study emphasizes CYP4B1, CYP4F12, and CYP4F3 gene expression levels, focusing on the tumor and normal tissue analysis; their expression, adjusted in stages; their correlation with BRCA1, BRCA2, and ESR1; the estrogen receptor status; and the overall survival analysis in breast cancer patients, while also exploring their expression profiles and alterations across other organs and cancer types.

2. Database Analysis

This review included datasets from web servers such as the Tumor Immune Estimation Resource v2.0 (TIMER2.0) [49] (http://timer.cistrome.org, accessed on 1 August 2024), the University of Alabama at Birmingham Cancer Data Analysis Portal (UALCAN) [50], (https://ualcan.path.uab.edu/, accessed on 12 November 2024), and the University of California, Santa Cruz, (UCSC) Xena functional genomics explorer [51] (https://xena.ucsc.edu/, accessed on 1 August 2024). Such datasets were used to explore CYP4B1, CYP4F12, and CYP4F3 mRNA expressions in several types of cancer. Additionally, this exploration contained data from The Cancer Genome Atlas (TCGA) and The Genotype-Tissue Expression (GTEx) projects.
TIMER2.0 GeneDE module of the Cancer Exploration component provided the analysis of tumor and normal tissues, while statistical significance was computed via the Wilcoxon test, annotated with the number of stars (*: p-value < 0.05; **: p-value < 0.01; ***: p-value < 0.001). The gene expression levels of CYPs and breast cancer stages were retrieved from the UALCAN web server, and the significance difference was estimated by Student’s t-test, considering unequal variance. The correlation analysis was obtained using the Gene-Corr module of the Exploration component of TIMER2.0, and significance was facilitated by Spearman’s test. The University of California, Santa Cruz, UCSC Xena web server (https://xena.ucsc.edu/, accessed on 1 August 2024) provided online visualization of the estrogen receptor status of the genes under study, and the statistical significance was computed via a one-way ANOVA test.
The overall survival (OS) analysis was conducted using the Gene_Outcome module of TIMER2.0 [49]. This module used the Cox proportional hazard model modified by the clinical stage factor to provide the outcome significance. To display the normalized coefficient of the gene in the Cox model, a heatmap table was created. The Kaplan–Meier (KM) curves of the genes were obtained by clicking on a cell in the heatmap when surfing the web server. The statistical significance of the KM survival curves was assessed using the log-rank test. p < 0.05 was considered to indicate a statistically significant difference.

3. The Effect of CYPs on Several Types of Cancer

3.1. Breast Cancer

The CYP family consists of 11 subfamilies (CYP4A-CYP4M) that encode constitutive and inducible isozymes expressed in mammals, and CYP2E1 is one of the most active ROS-generating CYP isoforms [11]. Considering the link between oxidative stress and tumor growth, it has been hypothesized that CYP2E1-mediated ROS generation could regulate breast carcinogenesis [52]. Exogenous CYP substrates consist of polycyclic aromatic hydrocarbons and around 80% of the drugs in use today. Certain isoforms can activate pro-carcinogens, transforming them into actual carcinogens [53]. In addition, genetic variations in CYP enzymes can influence their catalytic activity, and these differences have been observed in various populations, linking them to a range of diseases and negative reactions to medications.
Authors [54] studied the expression of 21 cytochrome P450 (CYP) enzymes that were assessed in breast tumors. The results indicated that CYP4V2, CYP4X1, and CYP4Z1 expression were correlated with a higher tumor grade. Furthermore, the absence of CYP4V2, CYP2S1, CYP3A4, and CYP26A1 was associated with better survival, although none were identified as independent prognostic factors.
The CYP4 family consists of several isoforms, including the Cytochrome P450 family 4 subfamily B member 1 (CYP4B1), the Cytochrome P450 family 4 subfamily F member 12 (CYP4F12), and the Cytochrome P450 family 4 subfamily F member 3 (CYP4F3), each with distinct tissue expression patterns and biological functions.
The CYP4B1, due to its ability to activate pro-carcinogens in rodent models, is capable of leading to the formation of DNA adducts and subsequent tumorigenesis; however, the role of CYP4B1 in human cancer is still not well understood. Some studies suggest that CYP4B1 may contribute to the metabolic activation of environmental carcinogens, particularly in tissue such as the lung and bladder, which are common sites of exposure to airborne and waterborne carcinogenic compounds [55].
A study conducted with 20 paired samples of tumor tissue and adjacent normal breast tissue from women diagnosed with invasive ductal carcinoma examined the expression of several cytochrome P450 (CYP) enzymes. The results showed that both the tumor tissue and the surrounding normal breast tissue expressed the enzymes CYP4B1 and others, such as CYP1B1, CYP2B6, CYP2C, CYP2D6, CYP2E1, and CYP11A1 [56].
The CYP4F12 is primarily expressed in the liver and gastrointestinal tract, and is known for its role in metabolizing antihistamines such as ebastine and terfenadine. Additionally, CYP4F12 participates in the oxidation of polyunsaturated fatty acids like arachidonic acid and prostaglandins. The arachidonic acid metabolism generates a variety of bioactive metabolites that are involved in the regulation of inflammation, cell proliferation, and vascular function, which are key processes in cancer development [57,58].
The CYP4F3 isoform exists in two distinct variants that are expressed in different tissues: one form is found in leukocytes, while the other is expressed in the liver. This enzyme plays a crucial role in the metabolism of leukotriene B4 (LTB4), a potent inflammatory mediator that has been implicated in the pathogenesis of various cancers due to its ability to promote cell proliferation, angiogenesis, and resistance to apoptosis, CYP4F3 could potentially modulate inflammatory responses and reduce the tumor-promoting effects of chronic inflammation by inactivating LTB4 [59]. A study demonstrated that the combination of the organophosphorus pesticide parathion and estrogen caused a decrease in the gene expression of CYP4F3 and CYP2F1 enzymes in mammary cells. These results suggest that the presence of estrogen may alter the action of parathion, modifying the metabolism of both xenobiotic and endogenous compounds in mammary tissue [60].
Additionally, CYP4F3 catalyzes the formation of 20-hydroxyeicosatetraenoic acid (20-HETE) from arachidonic acid, a metabolite involved in the regulation of blood pressure, vascular tone, and angiogenesis. Given the importance of angiogenesis in tumor growth and metastasis, alterations in 20-HETE production may influence cancer progression [58,61]. The cytochrome CYP4Z1, associated with breast cancer, contributes to the formation of the signaling molecule 20-HETE [62]. Angiogenesis is inhibited by HET0016, a specific inhibitor of 20-HETE production. 20-HETE has been identified as a second mitogenic messenger of growth factors that induce angiogenesis. The effects of HET0016 on breast cancer cell lines such as MDA-MB-231 were examined in mice and in vitro studies. By lowering the expression of a variety of pro-angiogenic factors, HET0016 decreased the growth of tumors; however, after 21 days, treatment resistance appeared to occur [63]. Estrogen receptor-positive (ER+) breast cancer, which accounts for 80% of occurrences, is the most prevalent subtype of breast cancer and has emerged as a major global public health issue. There is no doubt that ER+ breast cancers are caused by the female hormone estrogen. Although the mechanisms by which estrogen influences breast cancer development have long been understood, more research is needed to fully understand the molecular processes in the ERα signaling pathway that contribute to the progression of ER+ breast cancer [64]. It has been suggested to have a potential role as a tumor-associated antigen since it has been detected in the plasma membrane of MCF-7 cells and the sera of breast cancer patients [65].
Furthermore, its interaction with CYP4Z2P in the miRNA-mediated ceRNET network may inhibit apoptosis while promoting angiogenesis and CDK3 release [66]. Given their multifaceted roles in cancer biology, CYP4 enzymes represent promising therapeutic targets. Inhibitors of specific CYP4 isoforms could be used to modulate the production of pro-inflammatory or metabolites of pro-angiogenesis, thereby limiting tumor growth and improving the efficacy of existing cancer therapies [61]. In a study conducted by Murray G [54], the expression of 21 cytochrome P450 (CYP) enzymes was evaluated in 170 breast tumors. The results showed that CYP4V2, CYP4X1, and CYP4Z1 expression correlated with a higher tumor grade. Additionally, the absence of CYP4V2, as well as CYP2S1, CYP3A4, and CYP26A1, was associated with better survival, although none were identified as independent prognostic factors.
Beyond their roles in xenobiotic metabolism, the enzymes of the CYP4 family have been implicated in broad biological processes relevant to cancer, such as inflammation, angiogenesis, and immune regulation [67]. Chronic inflammation is a well-established risk factor for many types of cancer, as it can create a microenvironment that supports tumor initiation and progression. The metabolites generated by CYP4 enzymes, such as those derived from arachidonic acid, can either promote or resolve inflammation, depending on the specific pathways involved. For example, prostaglandins, which are synthesized from arachidonic acid, can stimulate the inflammatory response and have been shown to promote tumor growth and metastasis in certain cancers [68].
In addition to their involvement in inflammation, CYP4 enzymes play a role in angiogenesis, the formation of new blood vessels from existing vasculature. Angiogenesis is critical for tumor growth, as rapidly proliferating cancer cells require an increased supply of oxygen and nutrients, which is delivered through newly formed blood vessels [69]. Metabolites like 20-HETE, produced by CYP4 enzymes, regulate angiogenic processes, and their dysregulation may contribute to the abnormal vascularization observed in tumors [70]. By influencing both inflammation and angiogenesis, CYP4 enzymes may act as key regulators of the tumor microenvironment, influencing the interactions between cancer cells and their surrounding tissue [71]. Additionally, since CYP4 enzymes are involved in the metabolism of certain chemotherapeutic agents, understanding their activity could help design personalized treatment regimens that minimize drug resistance and enhance therapeutic outcomes [72].

3.2. Bioinformatic Analysis of CYPs in Breast Cancer

This study emphasizes CYP4B1, CYP4F12, and CYP4F3 gene expression levels, presenting tumor versus normal tissue analysis, their expression adjusted by stages, their correlation with BRCA1, BRCA2, and ESR1, the estrogen receptor status, and the overall survival analysis in breast cancer patients.

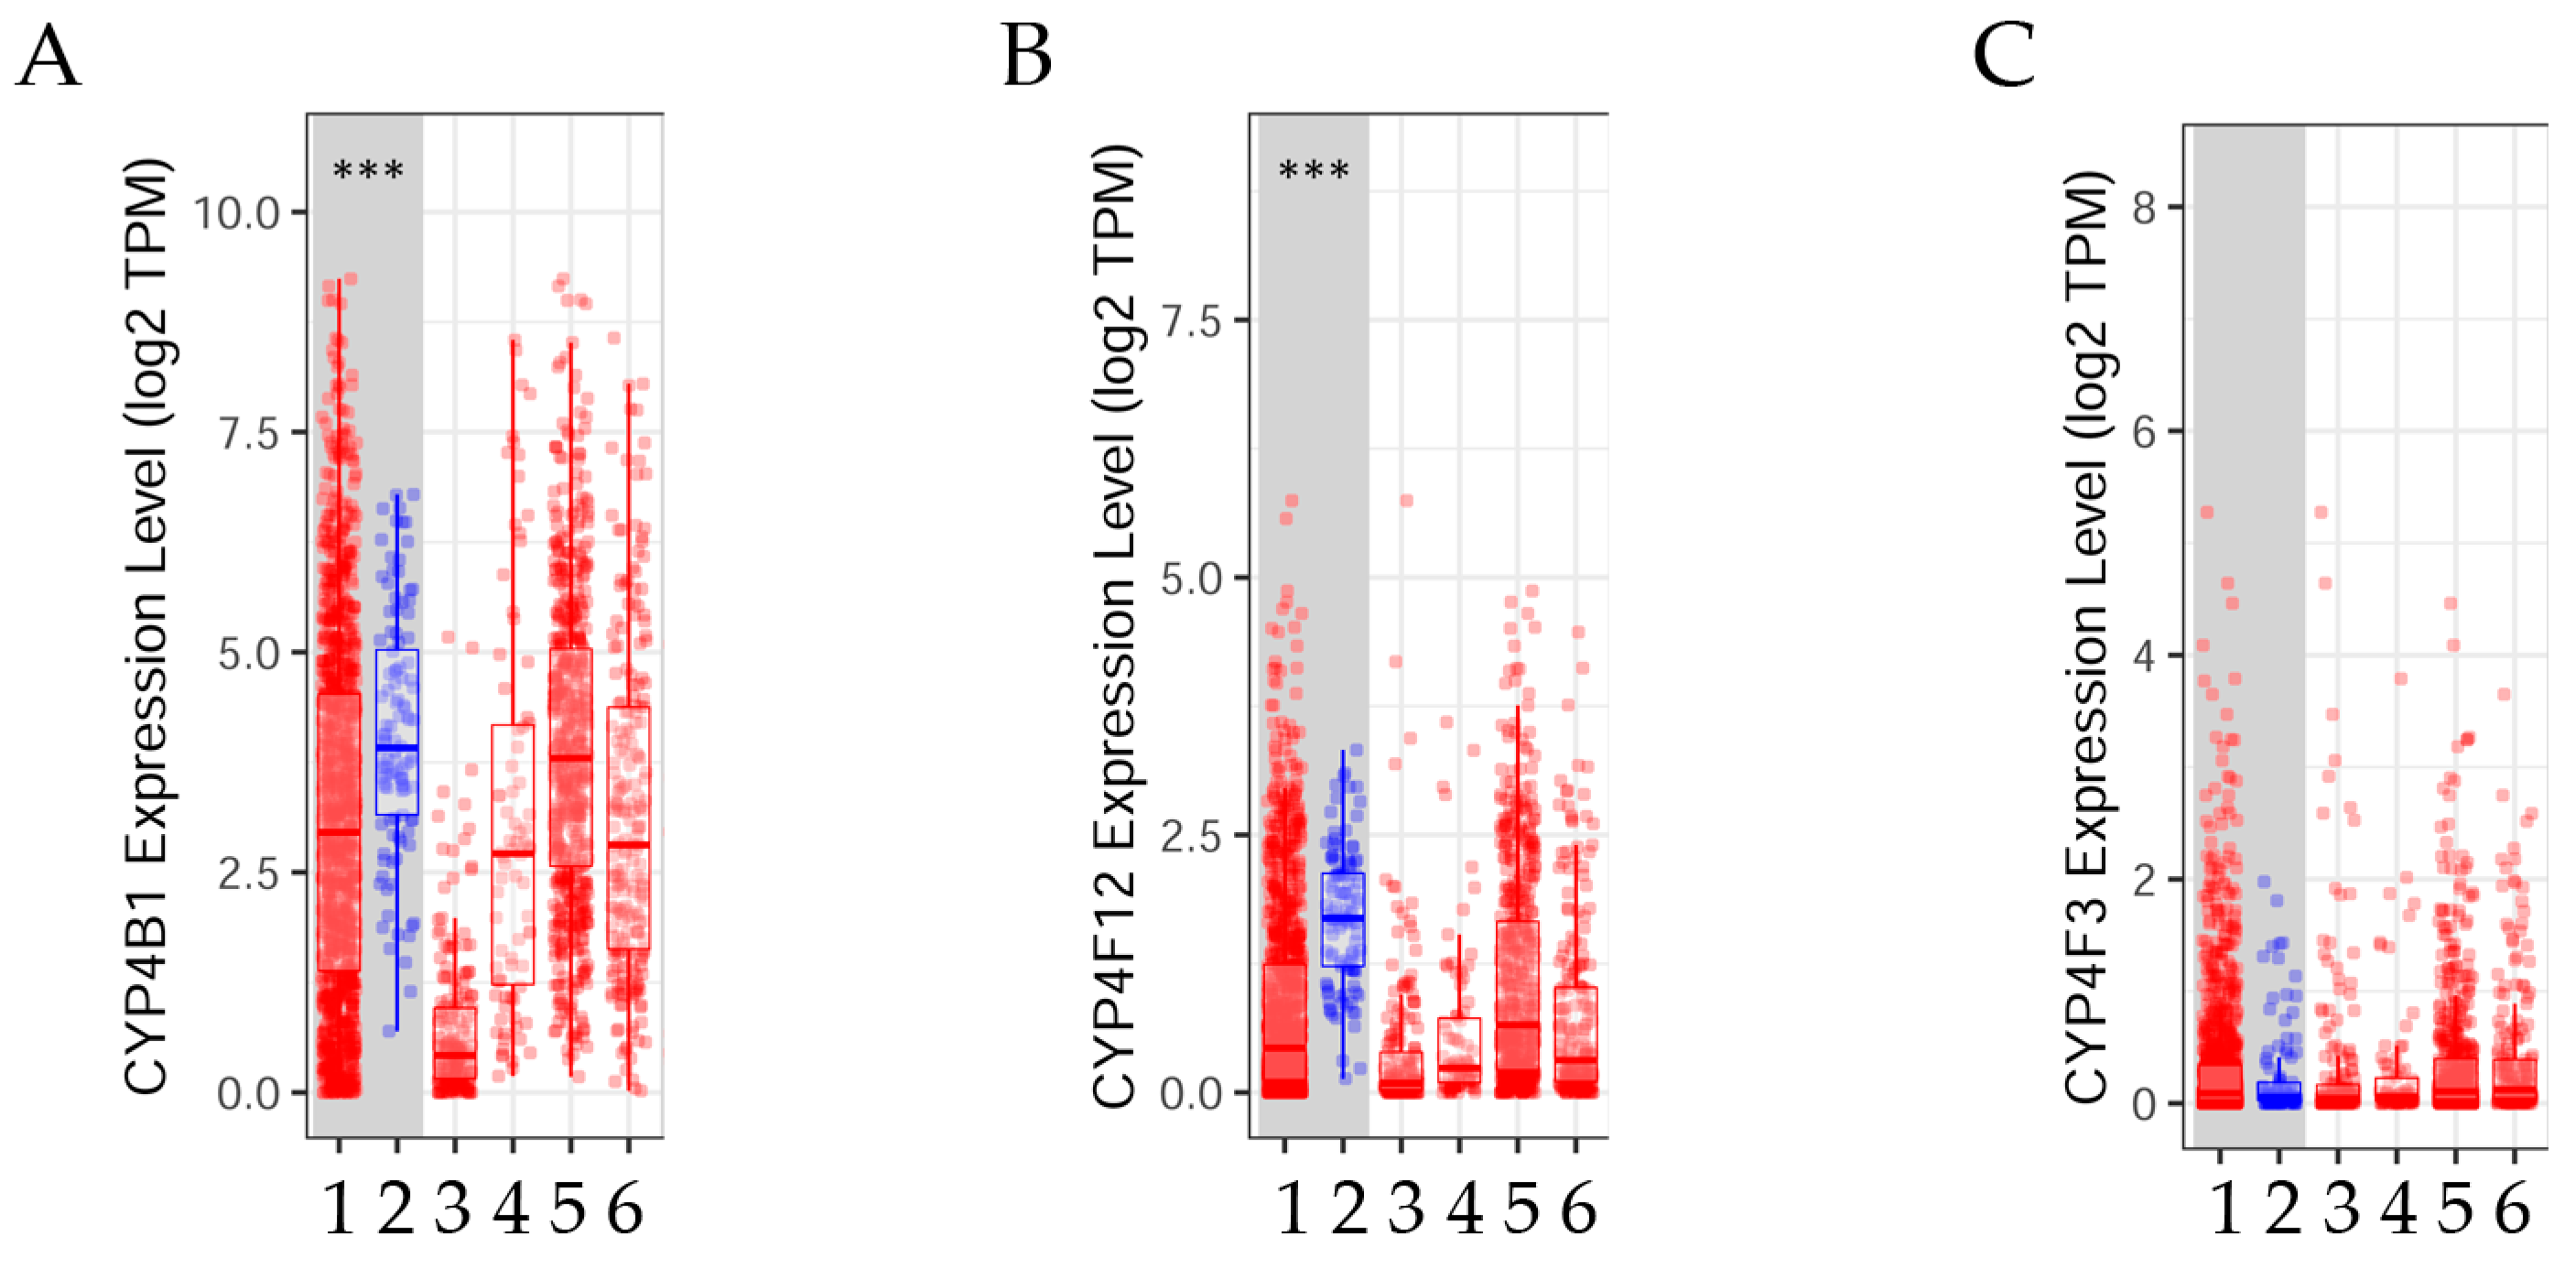
3.2.1. Gene Expression Levels in Normal Versus Tumor Tissues

Gene expression levels between normal and tumor tissue (Figure 1) were estimated using the Tumor Immune Estimation Resource v2.0 (TIMER2.0) in breast cancer [49]. TIMER2.0 is a web server that provides a comprehensive analysis and visualization of the associations between immune infiltrates and genetic or clinical features, and the exploration of cancer-related associations in The Cancer Genome Atlas (TCGA) cohorts through three main components, such as Immune Association, Cancer Exploration, and Immune Estimation. TIMER2.0 GeneDE module of the Cancer Exploration component provided the analysis of tumor and normal tissues.
The results indicated that the expression levels of (A) CYP4B1 and (B) CYP4F12 genes were higher (p < 0.05) in normal tissue than in tumor tissue, whereas (C) CYP4F3 expression levels were not significantly different.

3.2.2. CYP4B1, CYP4F12, and CYP4F3 Gene Expression Levels Adjusted by Stages

The gene expression of CYPs and breast cancer stages was obtained from the University of Alabama at Birmingham Cancer Data Analysis Portal (UALCAN) [50] (https://ualcan.path.uab.edu/), accessed on 12 November 2024 (Figure 2).
According to the breast cancer stage results, no significant expression level of CYP4B1 can be observed between stages 1–4 and control (normal tissue). However, CYP4F12 expression levels showed a significant (p < 0.01) difference between stage 1 and control and a significant (p < 0.001) difference between control and stages 2, 3, and 4. CYP4F3 expression levels were only significant in stages 2 and 4 (p < 0.001 and p < 0.01, respectively) in comparison with the control.

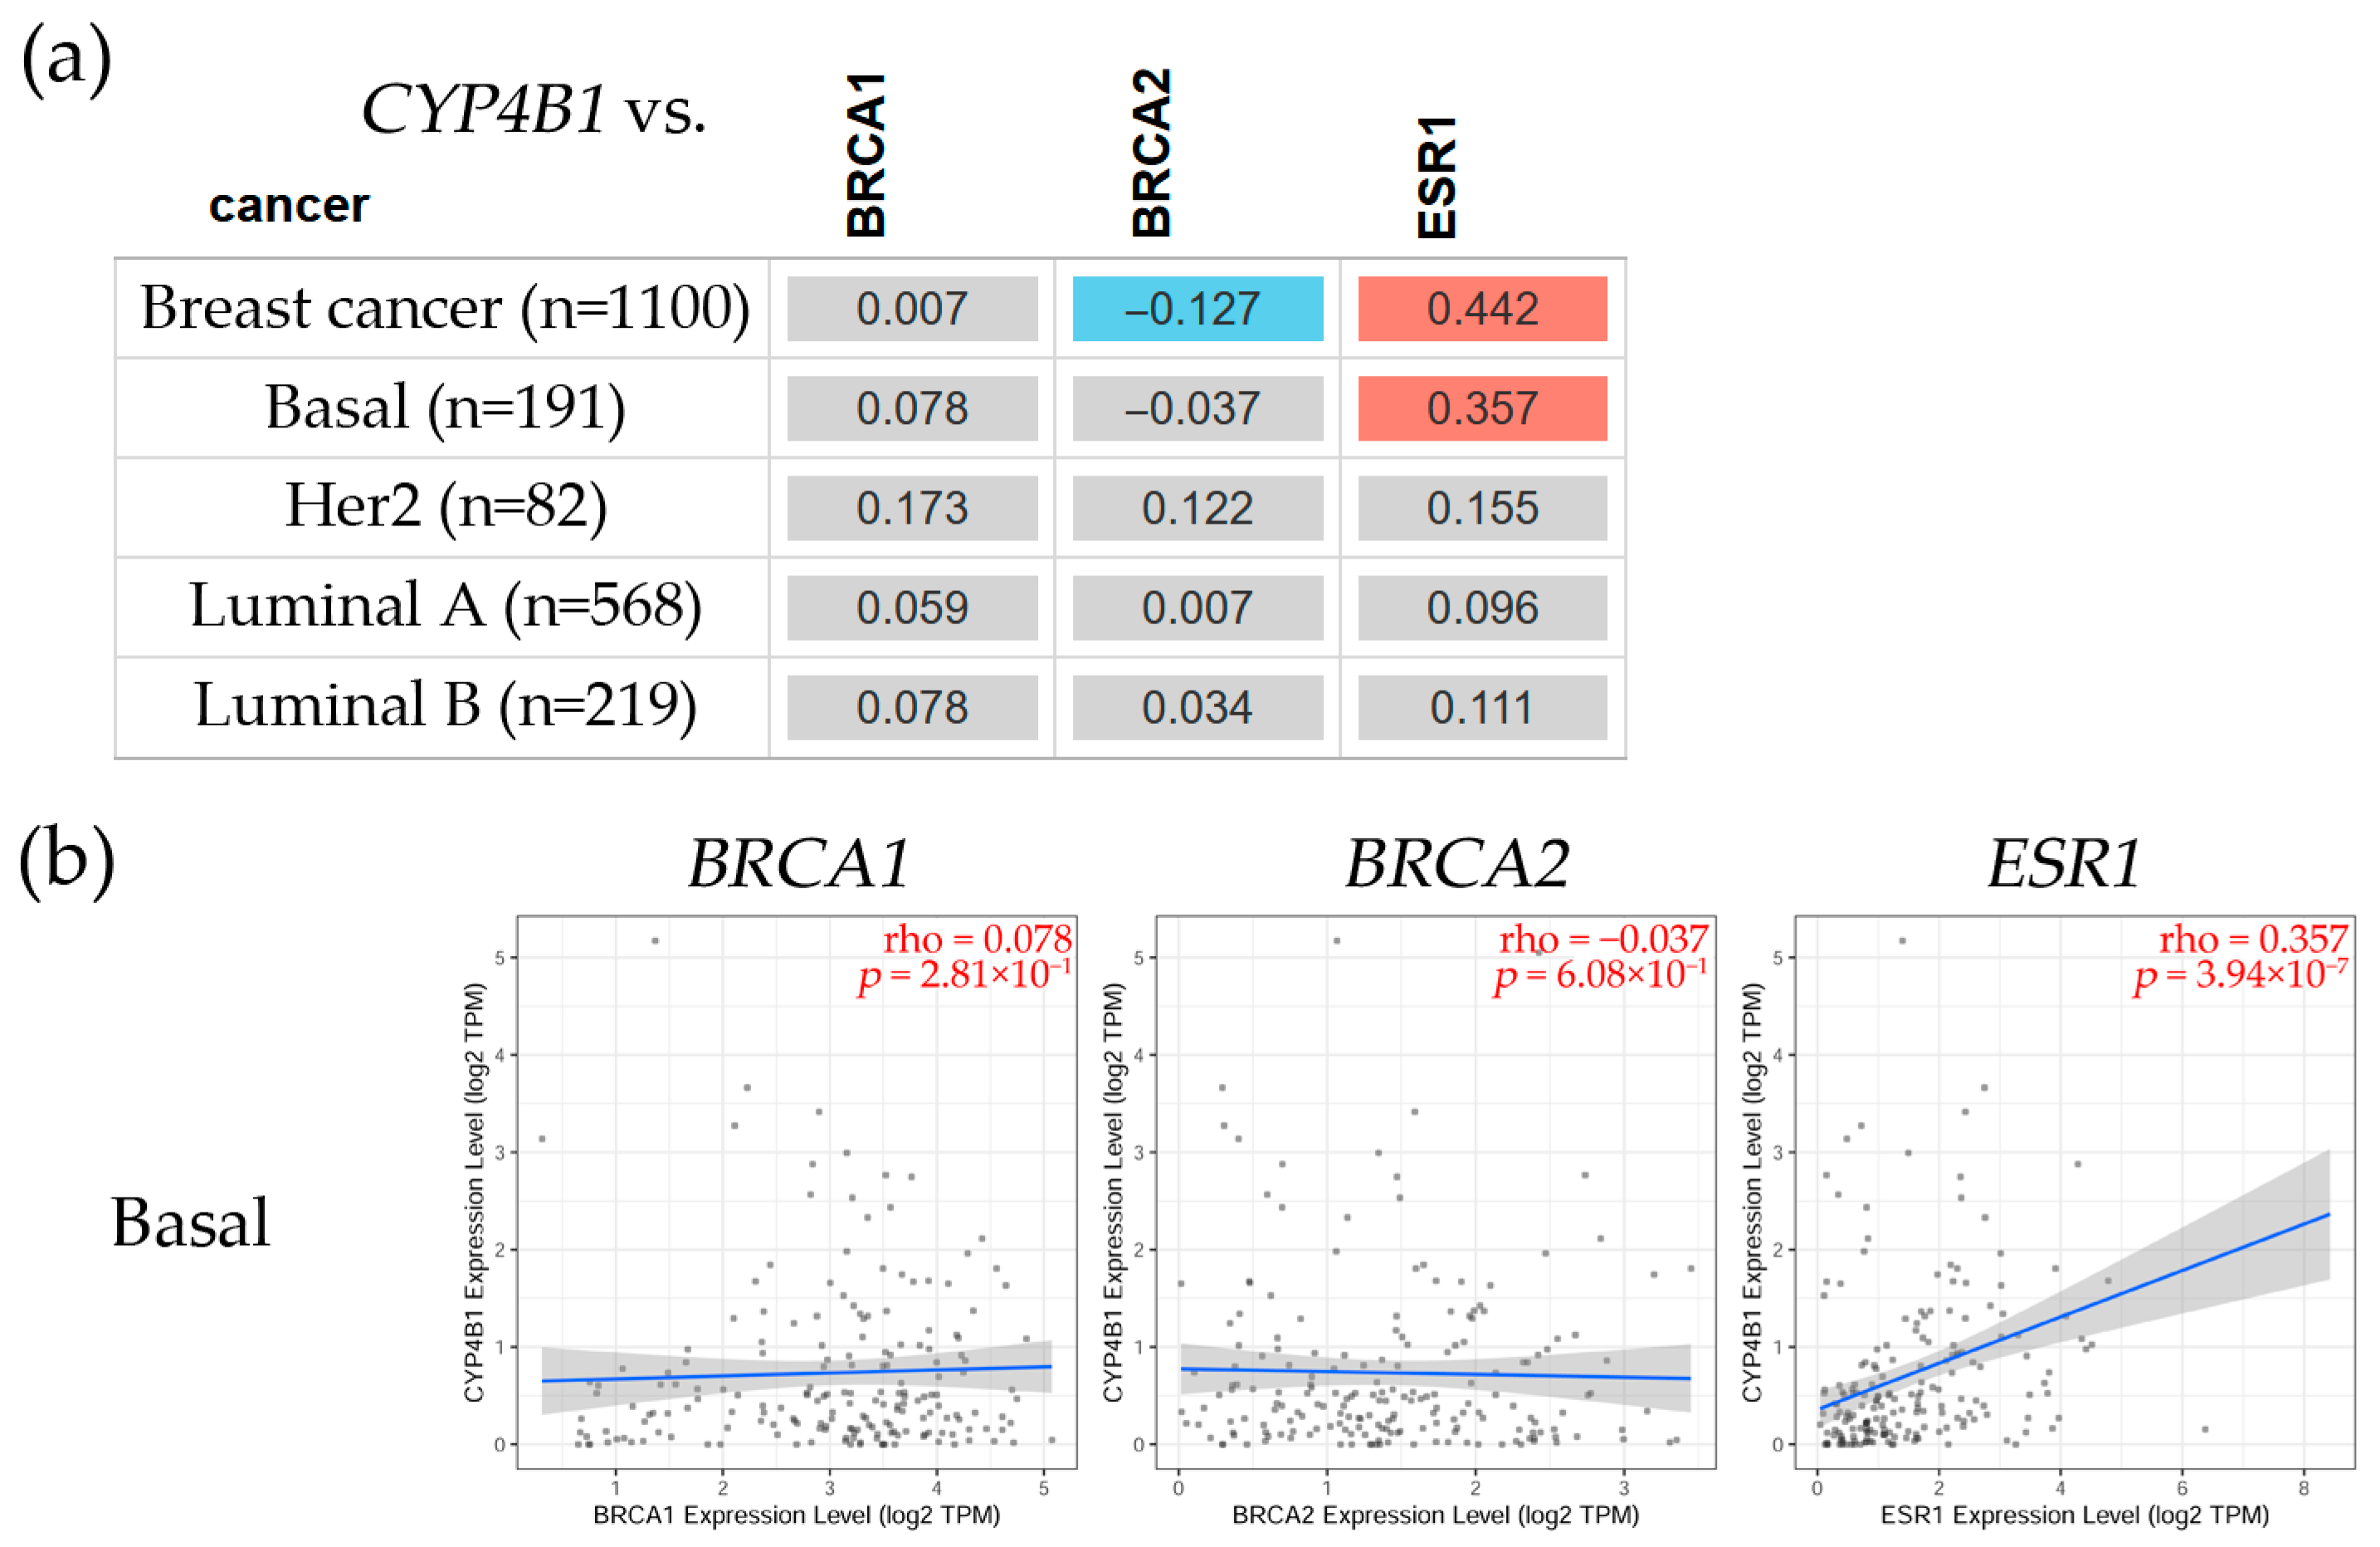
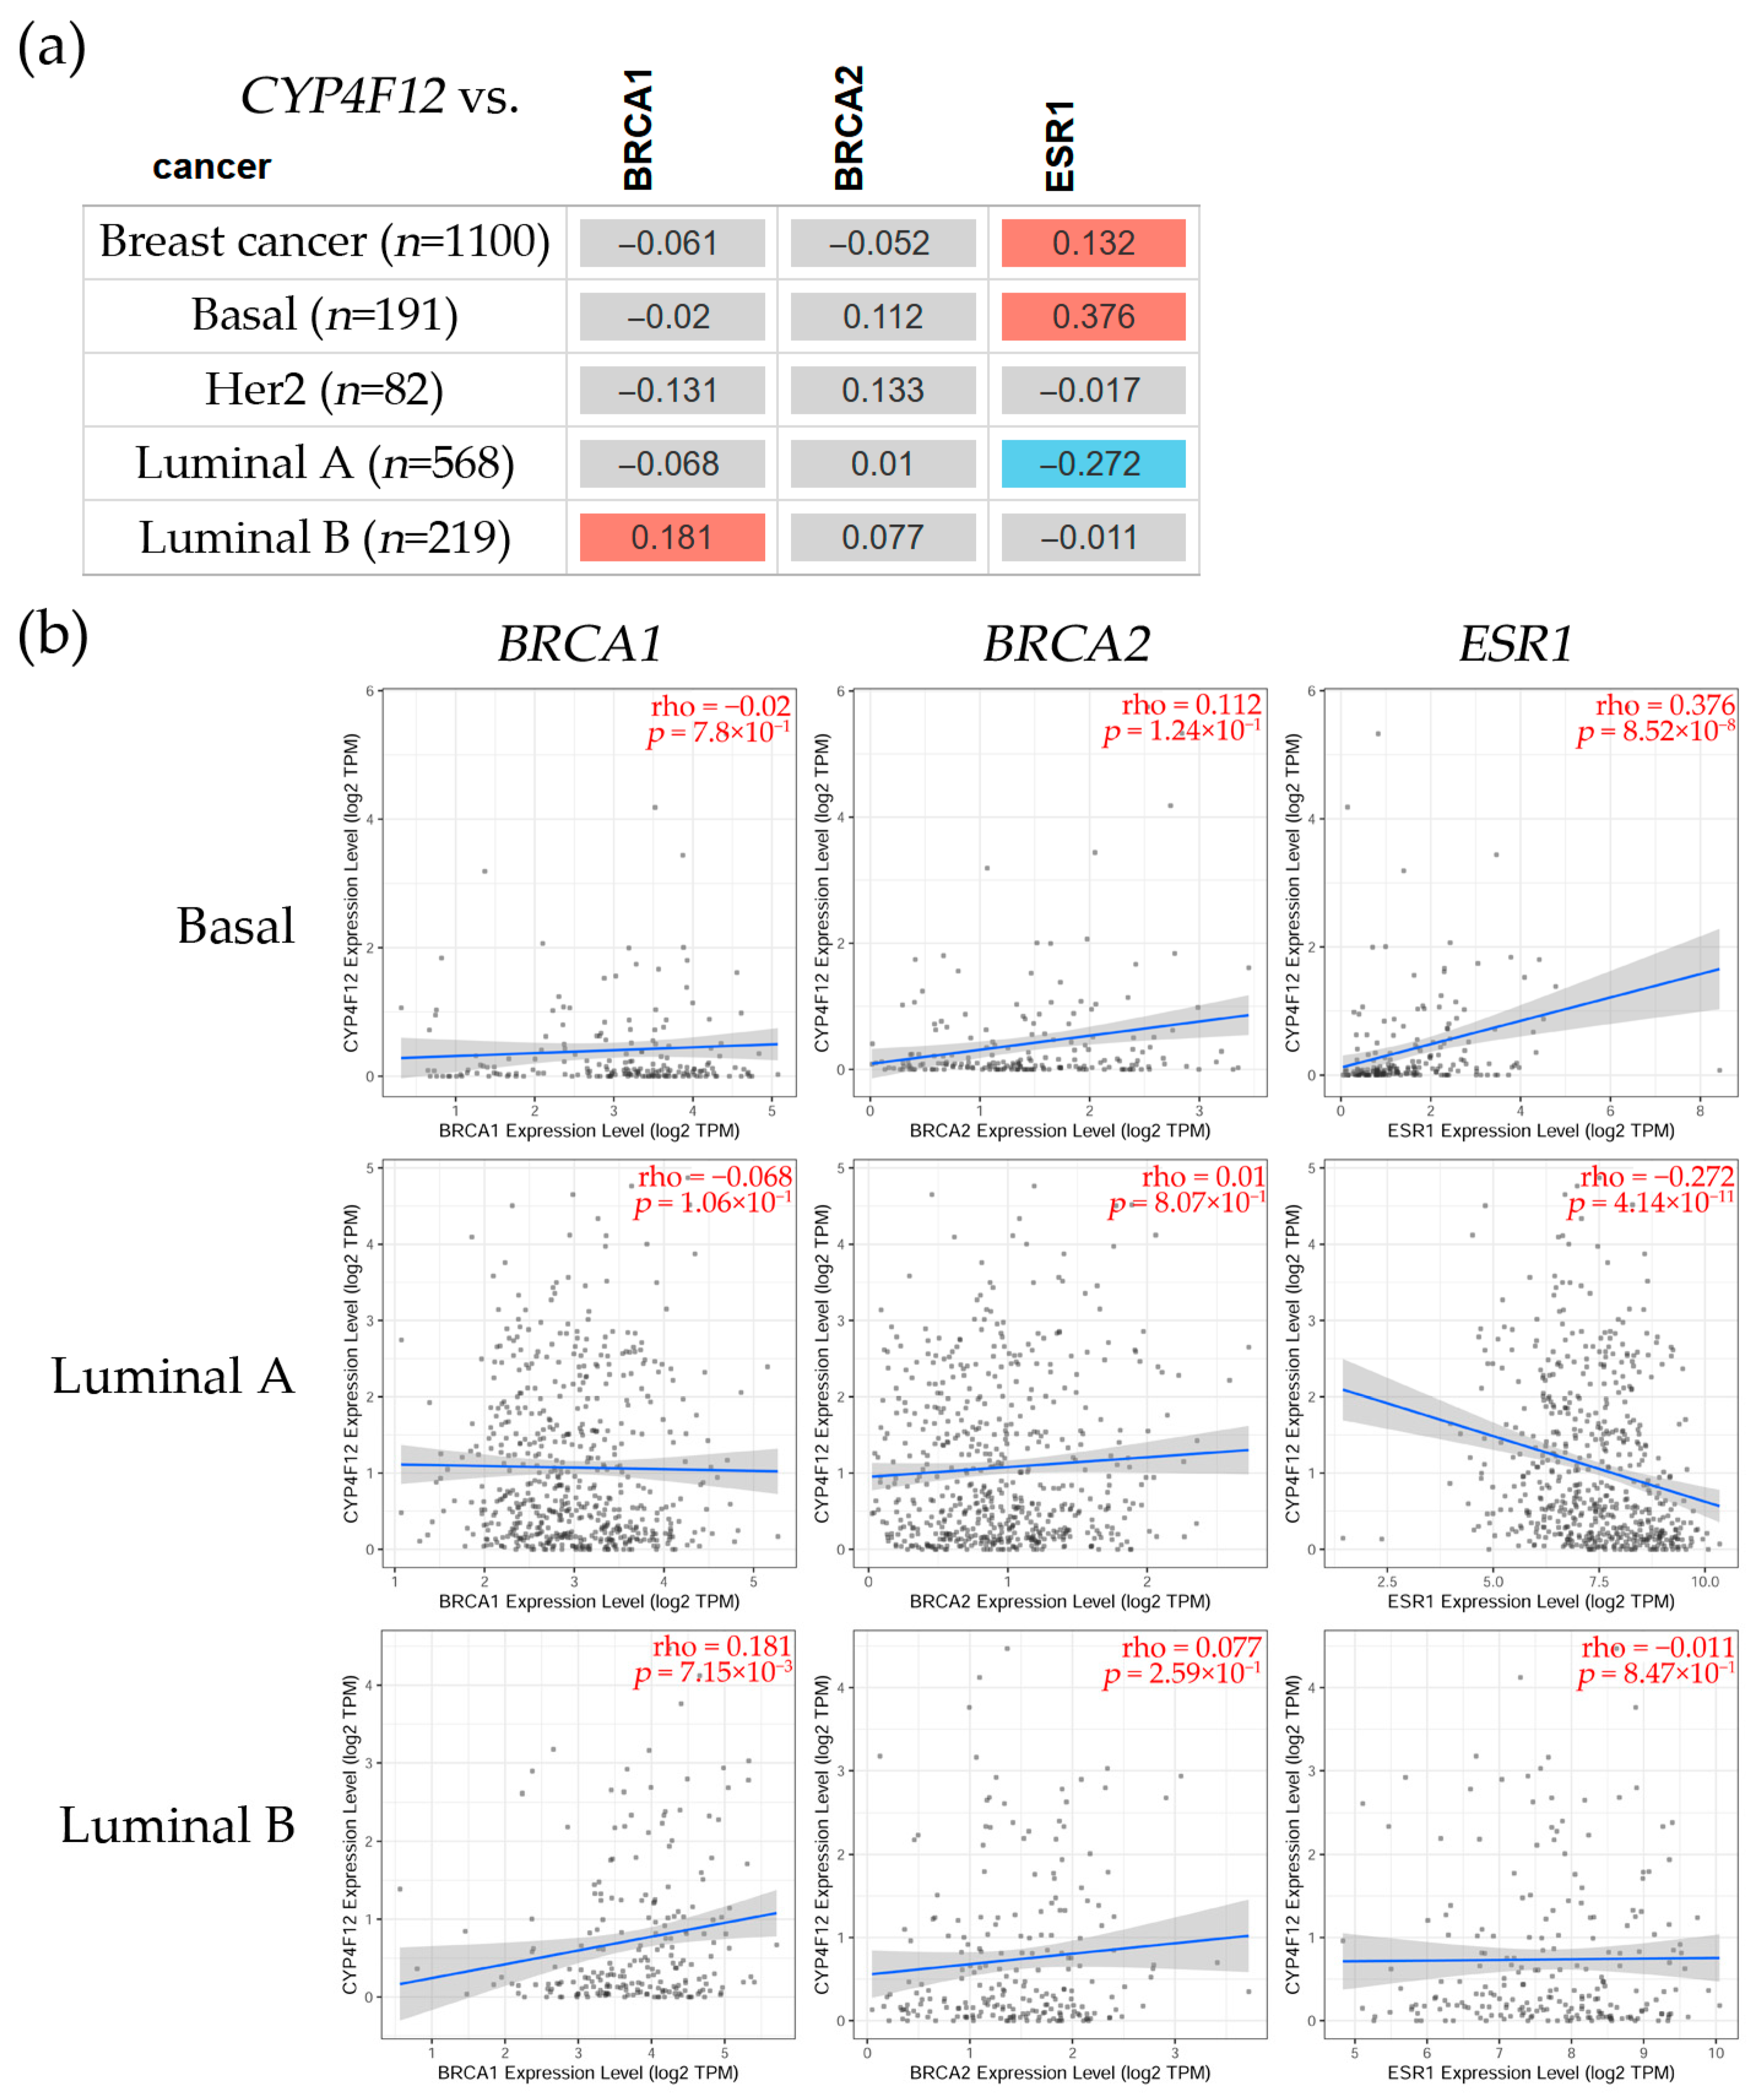
3.2.3. Correlation Between CYP4B1, CYP4F12, and CYP4F3 and BRCA1, BRCA2, and ESR1 Gene Expression Levels in Breast Cancer

To further analyze CYP4s expression, a correlation was observed between CYP4B1, CYP4F12, CYP4F3, and genes with high incidence in breast cancer, such as the BRCA1 DNA repair-associated (BRCA1), the BRCA2 DNA repair-associated (BRCA2), and the estrogen receptor alpha (ESR1), as seen in Figure 3. The analysis was carried out using the TIMER2.0 Gene_Corr module of the Cancer Exploration component [49]. It explores the correlation between a gene of interest and a list of genes in various cancer types, such as breast cancer. A heatmap table displays the partial Spearman’s rho value as the degree of the correlation.
The results showed that this gene had a non-significant correlation with BRCA1 and BRCA2, but it was positively correlated with ESR1 (ρ = 0.357, p = 3.94 × 10⁻⁷) in the basal subtype.
The correlation analysis (Figure 4) between CYP4F12 and BRCA1, BRCA2, and ESR1 gene expression indicated that CYP4F12 had a significant (ρ = 0.181, p = 7.15 × 10⁻³) positive correlation with BRCA1 in the Luminal B subtype; however, it was non-significant with BRCA2 but positively correlated with ESR1 (ρ = 0.376, p = 8.52 × 10⁻⁸) in the basal subtype and negatively correlated with ESR1 (ρ = −0.272, p = 4.14 × 10⁻¹¹) in the Luminal A subtype.
Figure 5 shows the correlation between CYP4F3 and BRCA1, BRCA2, and ESR1 gene expression. This indicates that CYP4F3 had a significant positive correlation with BRCA1 in Luminal A (ρ = 0.129, p = 1.99 × 10⁻³) and Luminal B (ρ = 0.25, p = 1.9 × 10⁻⁴) subtypes. This gene also had a significant positive correlation with BRCA2 in Her2, Luminal A, and Luminal B subtypes (ρ = 0.219, p = 4.86 × 10⁻², ρ = 0.202, p = 1.2 × 10⁻⁶, and ρ = 0.201, p = 2.78 × 10⁻³, respectively). CYP4F3 had a significant positive correlation with ESR1 expression levels in Basal (ρ = 0.275, p = 1.18 × 10⁻⁴) and Luminal A (ρ = 0.143, p = 3.41 × 10⁻²) subtypes.

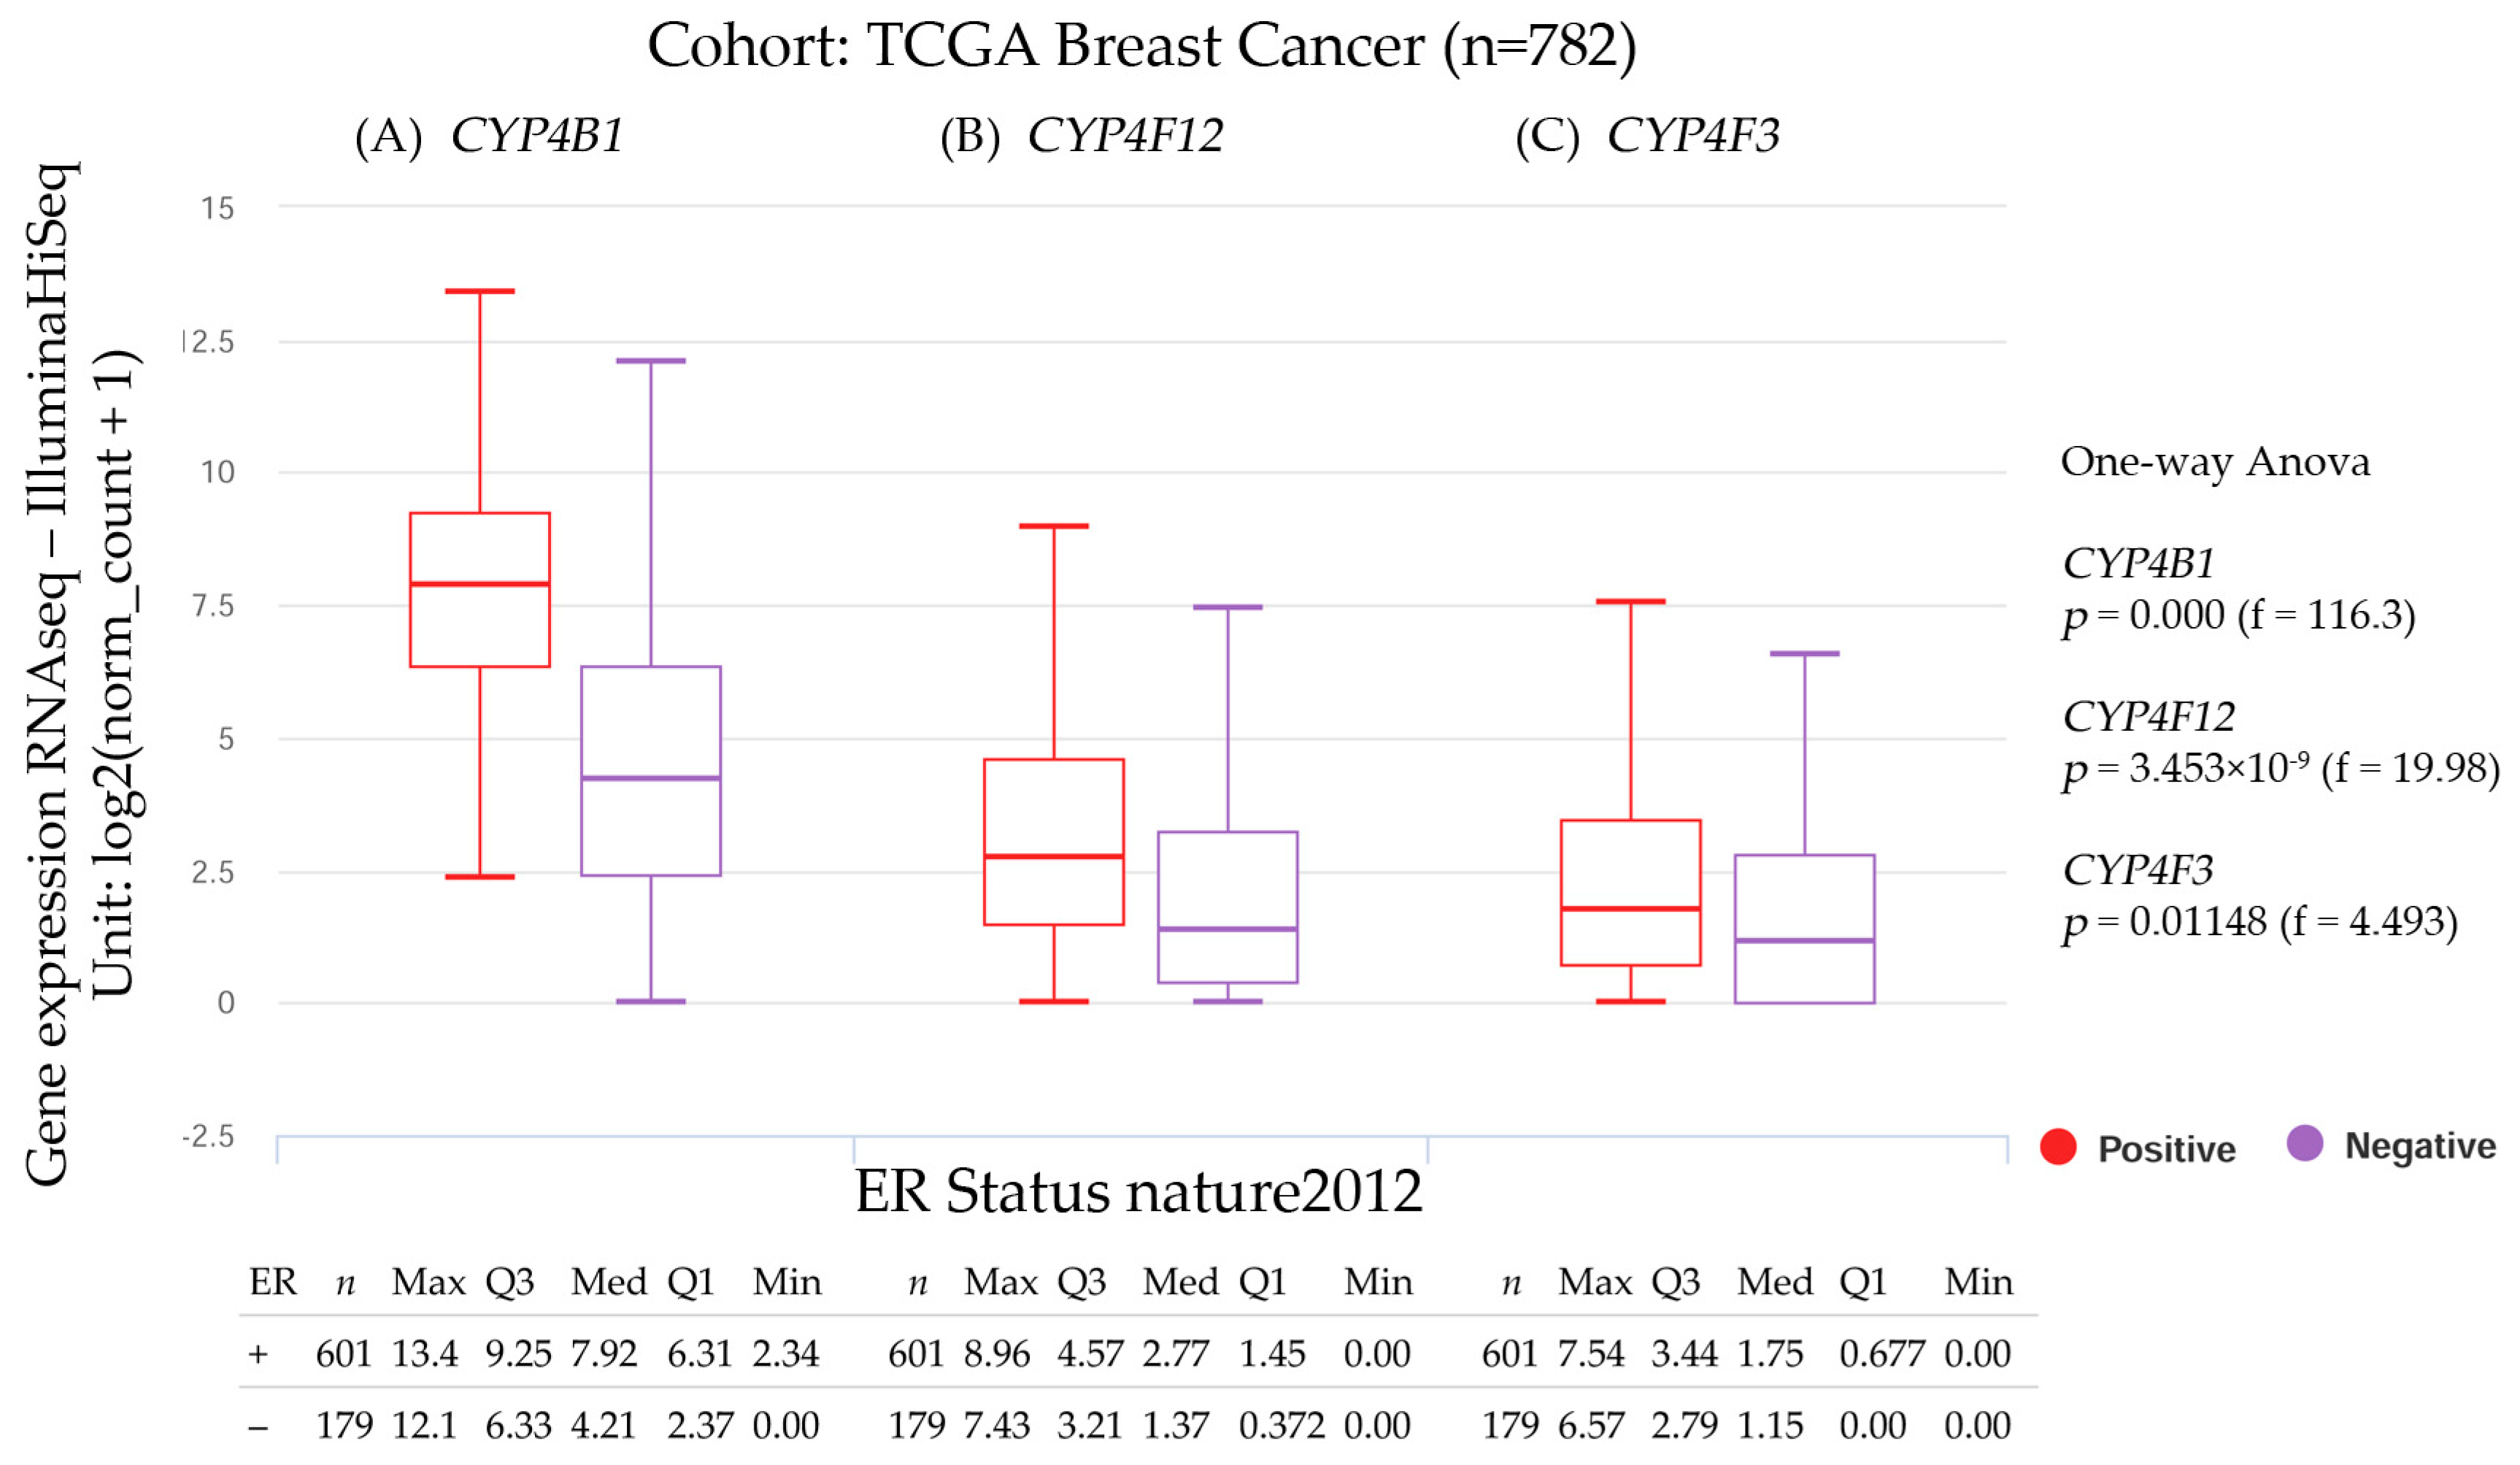
3.2.4. CYP4B1, CYP4F12, and CYP4F3 Gene Expression and the Estrogen Receptor Status

The genes that encode for the CYP proteins and estrogen receptor (ER) status are shown in Figure 6. The results were estimated using the University of California, Santa Cruz (UCSC) Xena functional genomics explorer [51] (https://xena.ucsc.edu/), accessed on 1 August 2024. The statistical significance was computed via a one-way ANOVA test.
The ER status of CYP4B1, CYP4F12, and CYP4F3 gene expression levels analyzed in breast cancer patients are shown in Figure 6. CYP4B1, CYP4F12, and CYP4F3 expression levels were higher in patients with a positive ER status than those with a negative ER status. The ER status was analyzed using the UCSC Xena genomic dataset, which included data from the Cancer Genome Atlas (TCGA), International Cancer Genome Consortium (ICGC), and Genomic Data Commons (GDC). The results were mostly positive; the three cases provided a positive significance (p < 0.05) in patients with high levels of CYP4B1, CYP4F12, and CYP4F3 gene expression. On the other hand, the CYP4B1 median expression level in patients with positive ER status (7.92) was higher than in patients with negative ER status (4.21). Similarly, CYP4F12 median expression level was higher in patients with positive ER status (2.77) than in patients with negative ER status (1.37), and CYP4F3 median expression level was also higher in patients with positive ER status (1.75) than in those with negative ER status (1.15).

3.2.5. Overall Survival Analysis of Breast Cancer Patients

The CYP4B1, CYP4F12, and CYP4F3 overall survival (OS) analyses were retrieved using the TIMER2.0 [49] web server in breast cancer. TIMER2.0 Gene_Outcome module assessed the outcome significance of gene expression using the Cox proportional hazard model modified by the clinical stage factor. To display the normalized coefficient of the gene in the Cox model, a heatmap table was created (Figure 7A). The Kaplan–Meier (KM) curves of the genes (Figure 7B–D) were obtained by clicking on a cell in the heatmap when surfing the web server.
The results in the table (Figure 7A) indicate that patients with CYP4B1 gene expression levels showed a significantly (p < 0.05) increased risk of breast cancer in the Lumina B subtype, whereas those patients with CYP4F12 gene expression levels depicted a significantly (p < 0.05) decreased risk of breast cancer in the Luminal A subtype, while CYP4F3 showed no significant difference. KM analysis indicated that breast cancer patients with high CYP4B1 expression in the Luminal B subtype (n = 219) did not survive within 140 months (Figure 7B), whereas those patients with high CYP4F12 expression in the Luminal A subtype (n = 568) had a decrease in cumulative survival by 70% at about 130 months (Figure 7C); the hazard ratio (HR) values were 1.47 and 1.04, respectively. On the other hand, breast cancer patients (n = 1100) with low CYP4B1 and CYP4F12 expression levels showed better cumulative survival, whereas patients with high CYP4F3 expression had better overall survival than their counterparts (Figure 7D).

3.3. Adrenocortical Carcinoma

In a study [73], CYP4B1 expression was markedly suppressed in adrenocortical carcinoma (ACC), with almost complete silencing observed in both adenomas and carcinomas. Quantitative PCR confirmed minimal expression in ACC compared to normal adrenal cortex. Functional assays revealed that the forced expression of CYP4B1 in ACC cell lines increased cell death and sensitivity to mitotane and cisplatin, suggesting a possible role for CYP4B1 in tumor suppression and chemosensitization [73].
CYP4F12 does not exhibit appreciable expression in normal adrenal cortex tissue or adrenocortical carcinoma, according to data from the Human Protein Atlas. To date, there is no published evidence directly implicating this gene in the pathogenesis or clinical behavior of adrenocortical tumors [74]. According to data from the Human Protein Atlas, CYP4F3 shows no detectable expression in adrenocortical carcinoma, suggesting a limited role in the molecular profile of this malignancy. To date, no specific studies have established a direct association between CYP4F3 and adrenocortical carcinoma, either as a diagnostic biomarker or a prognostic indicator [74].

3.4. Bladder Urothelial Carcinoma

CYP4B1 and CYP4F12 display low expression in normal bladder tissue and are detectable in certain cases of bladder urothelial carcinoma (BLCA), as reported by the Human Protein Atlas. Nonetheless, their expression levels are not markedly elevated in this malignancy, and no prognostic, diagnostic, or mechanistic associations have been established to date. Currently, there is a lack of dedicated studies investigating the functional role of CYP4B1 and CYP4F12 in the context of BLCA [74]. Elevated RNA expression of cytochrome monooxygenases (CYP4F11 and CYP4F3) and glutathione peroxidase 2 (GPX2), among others, was found in smoking-related malignancies that had minimal baseline leukocyte infiltration. These genes are recognized downstream targets of the redox-sensitive Nrf2 transcription factor pathway and have been connected to the negative regulation of arachidonic acid metabolism, a well-established inflammatory process. However, in BLCA, GPX2 showed a stronger correlation with reduced infiltration of several leukocyte subtypes than Nrf2 markers [75].

3.5. Cervical and Endocervical Cancer

CYP1B1 expression was indicated as a promising diagnostic and prognostic biomarker, as well as a potential therapeutic target in cervical and endocervical cancer (CESC) [76]. In a study conducted by Guoyu Dai, the relationship between gene expression and patient survival was evaluated using Kaplan–Meier survival curves. The results demonstrated that low expression levels of several genes, including CYP4F12, were significantly associated with reduced overall survival compared to patients exhibiting high gene expression. These findings suggest a potential protective role of CYP4F12 in tumor progression and highlight its promise as a prognostic biomarker in specific oncological contexts [77]. Calcitriol treatment was shown to increase CYP4F3 expression, as confirmed by microarray analysis, qPCR validation, and Western blotting. While the specific role of CYP4F3 in tumorigenesis remains unclear, its involvement in the metabolism of bioactive lipids and drugs points to it as a promising candidate in cancer research [78].

3.6. Colon Adenocarcinoma

The available data indicate that CYP4B1 expression is very low in colon adenocarcinoma (COAD) tissues. Furthermore, no significant association has been established between its expression and patient prognosis, limiting its usefulness as a biomarker in colon cancer [74]. According to data from the Human Protein Atlas, CYP4F12 displays RNA-level expression in colon cancer tissues, with an average of 8.4 transcripts per million (TPM) observed in COAD samples. However, survival analyses indicate that CYP4F12 does not serve as a significant prognostic marker in this cancer type [74]. A study explored the role of CYP4F3 in colon cancer with liver metastasis using transcriptomic datasets from TCGA and GEO. Bioinformatic analyses revealed significant overexpression of CYP4F3 in metastatic tissues, which was associated with poor overall survival. Additionally, its expression correlated positively with M2 macrophage infiltration, suggesting its involvement in an immunosuppressive tumor microenvironment. miRNA–mRNA network analysis further indicated potential post-transcriptional regulatory mechanisms; collectively, these findings identified CYP4F3 as a negative prognostic biomarker and a potential therapeutic target in this type of cancer [79].

3.7. Esophageal Carcinoma

The CYP4B1 protein was detected in the esophageal mucosa of 25 non-neoplastic human tissues, but its validation via immunoblot was not possible due to the lack of a specific antibody, despite the confirmed presence of its mRNA [80]. A study identified CYP4F12 as a histone acetylation–responsive gene in esophageal cancer, showing increased expression following trichostatin A treatment through the p300-mediated acetylation of H3K18 and H3K27. Transcriptomic data from TCGA and GSE53624 confirmed its overexpression in tumor tissue and associated high CYP4F12 levels with a favorable prognosis. Functionally, CYP4F12 correlated with reduced cell migration, enhanced B-cell infiltration, and downregulation of immune checkpoint markers. These findings positioned CYP4F12 as a promising prognostic biomarker and potential therapeutic target in esophageal cancer [81]. According to available data from the Human Protein Atlas, CYP4F3 exhibits detectable transcript-level expression in esophageal cancer cell lines. However, the lack of corresponding protein-level evidence limits the interpretation of its clinical significance in this malignancy. Consequently, no prognostic association can currently be established for CYP4F3 in esophageal cancer [74].

3.8. Lung Adenocarcinoma

Analysis of the TCGA lung adenocarcinoma (LUAD) cohort (n = 567) revealed that CYP4B1 was significantly overexpressed in tumor tissue compared to normal lung samples (p < 0.001), with high expression correlating with improved overall survival (HR = 0.64; p = 0.001) [82]. CYP4B1 expression showed an inverse relationship with myeloid-derived suppressor cells (r = −0.578; p < 0.001) and a positive correlation with M2 macrophages (r = 0.211; p < 0.001). Additionally, CYP4B1 was positively associated with immune checkpoints such as PD-1 and PD-L1; these findings suggest that CYP4B1 could serve as a favorable prognostic biomarker and holds predictive value in the context of immunotherapy for lung adenocarcinoma [82]. Data from the Human Protein Atlas show that CYP4F12 had low or undetectable levels of RNA in LUAD and lacked prognostic value; its expression did not correlate with patient survival. Immunohistochemistry records in lung tissue were insufficient to confirm a protein pattern, and so far, no functional studies have been published linking it to the tumor biology of LUAD. Overall, the available evidence indicates that CYP4F12 is not considered a relevant biomarker or a therapeutic target in lung adenocarcinoma [74].
A meta-analysis of six genome-wide association studies (GWAS) from the TRICL consortium identified CYP4F3 as a potential gene involved in lung cancer susceptibility. Among 28 significant single-nucleotide polymorphisms (SNPs) identified after FDR correction, 26 were located within CYP4F3, with SNP rs4646904 showing a strong association with lung cancer risk (p = 8.65 × 10⁻⁶; FDR = 0.018). This variant may influence RNA splicing and gene expression. Although statistical significance diminished upon inclusion of the Harvard Lung Cancer Study cohort (p = 3.52 × 10⁻³), the findings suggested a possible role for CYP4F3 in lung cancer predisposition, particularly among smokers, warranting further functional investigation [78].

3.9. Lung Squamous Cell

An analysis of TCGA-lung squamous cell carcinoma (LUSC) data revealed that elevated CYP4B1 expression in LUSC correlated with reduced overall survival. Its expression was positively associated with immune infiltrates such as regulatory T cells and M2 macrophages, indicating a potential role in fostering an immunosuppressive tumor microenvironment. These findings suggest that CYP4B1 could serve as a prognostic and predictive biomarker in LUSC, particularly in the context of immunotherapeutic interventions [83]. Current evidence from the Human Protein Atlas indicates that CYP4F12 exhibited low or undetectable protein expression levels in LUSC. Immunohistochemical analyses revealed no significant staining in LUSC tissues, suggesting a limited role for this gene in the tumor biology of this cancer subtype [74]. According to the Human Protein Atlas, CYP4F3 exhibited low or undetectable expression at both mRNA and protein levels in LUSC. Although mRNA transcripts were broadly present in these tumors, there was no significant overexpression or reliable protein evidence. Collectively, these data do not indicate a meaningful association between CYP4F3 expression and prognosis in LUSC [74].

3.10. Ovarian Serous

In a study of ovarian cancer (OV), CYP4B1 was identified as a differentially expressed gene in patients with advanced ovarian carcinoma, with significantly lower levels in those who experienced relapse following curative treatment. This reduced expression was associated with an increased risk of recurrence and was consistently validated across multiple platforms, including microarray analysis, NanoString nCounter, and RT-PCR, in both frozen and FFPE tissue samples. As a member of the cytochrome P450 family involved in drug metabolism, decreased CYP4B1 expression could impair chemotherapeutic efficacy. These findings supported its potential as a prognostic biomarker and therapeutic target in ovarian cancer [84].
A study published in Clinical Cancer Research examined gene expression profiles in the early stages of OV. CYP4F12 was identified among the genes associated with oxidative stress response, particularly in mucinous tumor subtypes. However, the investigation did not explore the specific functional role or clinical implications of CYP4F12 in this context [85]. According to the Human Protein Atlas, CYP4F3 exhibits moderate mRNA expression levels, averaging approximately 1.5 TPM, in serous ovarian carcinoma samples. However, no significant correlation between CYP4F3 expression and patient survival was identified, indicating that CYP4F3 is unlikely to serve as a prognostic biomarker in this cancer type [74].

3.11. Prostate Adenocarcinoma

In a study of prostate adenocarcinoma (PRAD), the expression of CYP2A6, CYP3A5, and CYP4B1 genes was evaluated in prostate tissue using real-time quantitative PCR (RT-qPCR). Both normal and cancerous prostate samples were analyzed to assess differential gene expression. The results indicated that CYP4B1 was expressed in prostate tissue; however, no statistically significant differences were observed between normal and tumor samples. The study concluded that although CYP4B1 was present in the prostate, its expression levels did not correlate with malignancy, suggesting its limited utility as a biomarker for distinguishing healthy from cancerous prostate tissue in this context [86].
To date, no studies have specifically investigated the expression or functional role of CYP4F12 in prostate cancer. Data from the Human Protein Atlas indicated low or undetectable expression of this gene in prostate tissue. While polymorphisms in cytochrome P450 family genes were examined concerning prostate cancer, no direct association between CYP4F12 and disease progression or treatment response was established [74]. Likewise, CYP4F3 exhibited low mRNA expression levels in prostate tissue, with an average of approximately 0.6 TPM. Immunohistochemical analyses further revealed that CYP4F3 protein expression was low or undetectable in prostate tumor samples. Survival analyses using TCGA data indicated that CYP4F3 lacked prognostic significance in prostate adenocarcinoma [74].

3.12. Rectum Adenocarcinoma

The Human Protein Atlas web server indicated that CYP4B1 expression in rectum adenocarcinoma (READ) tissue was low or undetectable, and no significant association was established between its expression levels and patient prognosis [74]. Similarly, CYP4F12 protein expression exhibited low to moderate expression in rectal cancer, with no significant correlation to patient prognosis, according to data from The Human Protein Atlas. Although detectable in tumor tissue, its clinical significance remains undefined [74]. Additionally, CYP4F3 displayed low or nearly undetectable expression at both RNA and protein levels in normal and rectal cancer tissues. No significant overexpression or clear association with prognosis or immune cell infiltration was observed in rectal cancer. Therefore, the evidence does not support a relevant functional role or biomarker potential for CYP4F3 in this malignancy [74].

3.13. Stomach Adenocarcinoma

The Human Protein Atlas showed no differential expression pattern or suggested a significant functional role for CYP4B1 in stomach adenocarcinoma (STAD) tissues. No evidence of overexpression or prognostic relevance was reported. Overall, CYP4B1 did not emerge as a notable biomarker or potential therapeutic target in the context of gastric malignancies [74]. Likewise, CYP4F12 exhibited low to undetectable expression in both normal gastric tissue and gastric cancer. No significant overexpression or prognostic association was established. Consequently, based on the evidence, CYP4F12 did not appear to serve as a relevant biomarker or therapeutic target in gastric cancer [74]. Additionally, CYP4F3 showed low to undetectable expression at both mRNA and protein levels in gastric adenocarcinoma according to the Human Protein Atlas, and no significant association was identified between its expression and patient prognosis in this cancer type [74].

3.14. Uterine Corpus

CYP4B1 was investigated in various malignancies, including uterine corpus endometrial carcinoma (UCEC), as a potential therapeutic target; however, its role in this type of cancer remained poorly characterized. The Human Protein Atlas indicated low or undetectable expression of CYP4B1 in both normal uterine tissue and endometrial carcinoma, with no significant correlation with patient prognosis. These findings suggest that CYP4B1 has limited diagnostic or therapeutic relevance in uterine cancer [74]. Although direct evidence linking CYP4F12 to uterine cancer is missing, data from the Human Protein Atlas showed its expression across multiple malignancies, including uterine and liver cancers, with higher levels observed in hepatic tumors. In uterine cancer, CYP4F12 was identified as a favorable prognostic marker, suggesting that elevated expression may be associated with improved clinical outcomes [74]. An analysis of the TCGA dataset identified CYP4F3 as a component of a prognostic model in endometrial cancer, where elevated expression correlated with reduced overall survival. Despite the low expression levels in endometrial tissue reported by the Human Protein Atlas, these findings implicate CYP4F3 in tumor progression and warrant further investigation to elucidate its functional role [74].

3.15. Bioinformatic Analysis of CYPs in Pan-Cancer

CYP4B1, CYP4F12, and CYP4F3 gene expression levels were found to correlate with ESR1; then, a tumor versus normal tissue analysis and an overall survival evaluation in several types of cancer were conducted.

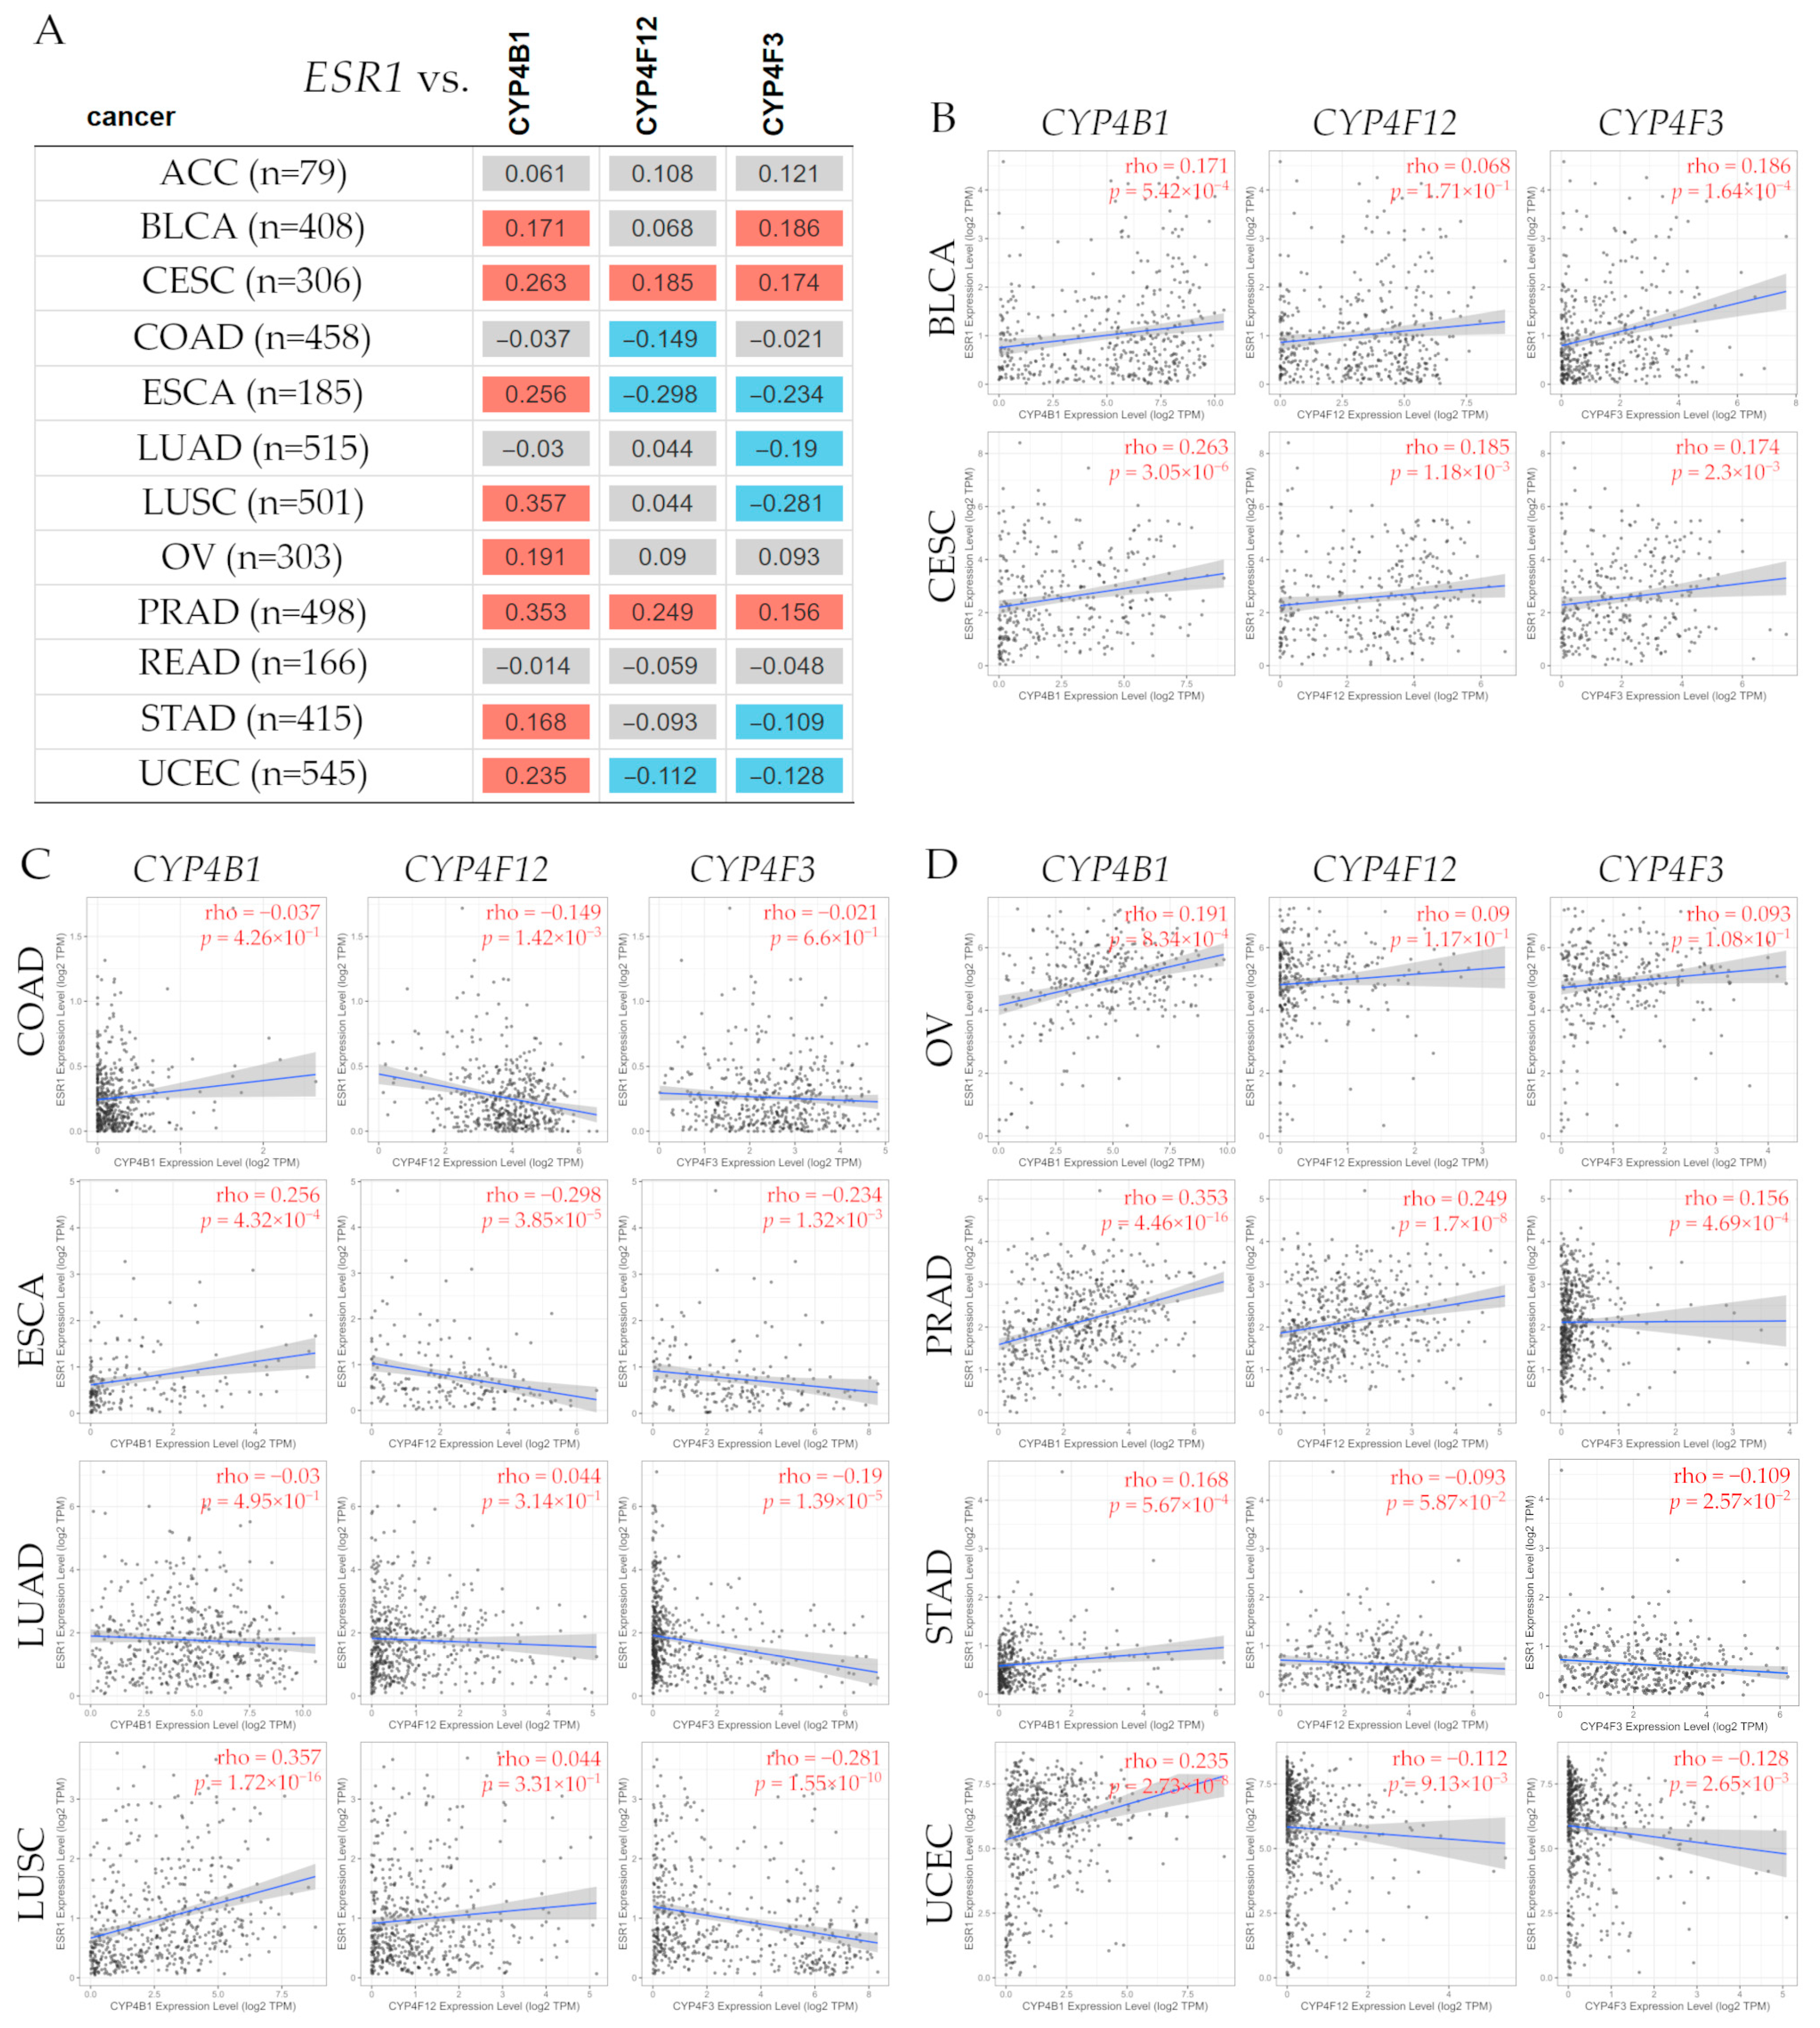
3.15.1. Correlation Between ESR1 and CYP4B1, CYP4F12, and CYP4F3 Gene Expression Levels in Several Types of Cancer

To analyze CYP4B1, CYP4F12, and CYP4F3 gene expression levels and the estrogen receptor alpha (ESR1) gene, a correlation analysis was conducted using the TIMER2.0 web server [49] (http://timer.cistrome.org), accessed on 1 August 2024, as seen in Figure 8.
The correlation analysis between ESR1 and CYP4B1, CYP4F12, and CYP4F3 gene expression levels (Figure 8) indicated that ESR1 had a significant positive correlation with CYP4B1 in BLCA (ρ = 0.171, p = 5.42 × 10⁻⁴), CESC (ρ = 0.263, p = 3.05 × 10⁻⁶), ESCA (ρ = 0.256, p = 4.32 × 10⁻⁴), LUSC (ρ = 0.357, p = 1.72 × 10⁻¹⁶), OV (ρ = 0.191, p = 8.34 × 10⁻⁴), PRAD (ρ = 0.353, p = 4.46 × 10⁻¹⁶), STAD (ρ = 0.168, p = 5.67 × 10⁻⁴), and UCEC (ρ = 0.235, p = 2.73 × 10⁻⁸). ESR1 had a positive correlation with CYP4F12 in CESC (ρ = 0.185, p = 1.18 × 10⁻³) and PRAD (ρ = 0.249, p = 1.7 × 10⁻⁸), but a negative correlation in COAD (ρ = −0.149, p = 1.42 × 10⁻³), ESCA (ρ = −0.298, p = 3.85 × 10⁻⁵), and UCEC (ρ = −0.112, p = 9.13 × 10⁻³). Similarly, ESR1 was positively correlated with CYP4F3 in BLCA (ρ = 0.186, p = 1.64 × 10⁻⁴), CESC (ρ = 0.174, p = 2.3 × 10⁻³), and PRAD (ρ = 0.156, p = 4.96 × 10⁻⁴), but the correlation was negative in ESCA (ρ = −0.234, p = 1.32 × 10⁻³), LUAD (ρ = −0.19, p = 1.39 × 10⁻⁵), LUSC (ρ = −0.281, p = 1.55 × 10⁻¹⁰), STAD (ρ = −0.109, p = 2.57 × 10⁻²), and UCEC (ρ = −0.128, p = 2.65 × 10⁻³).

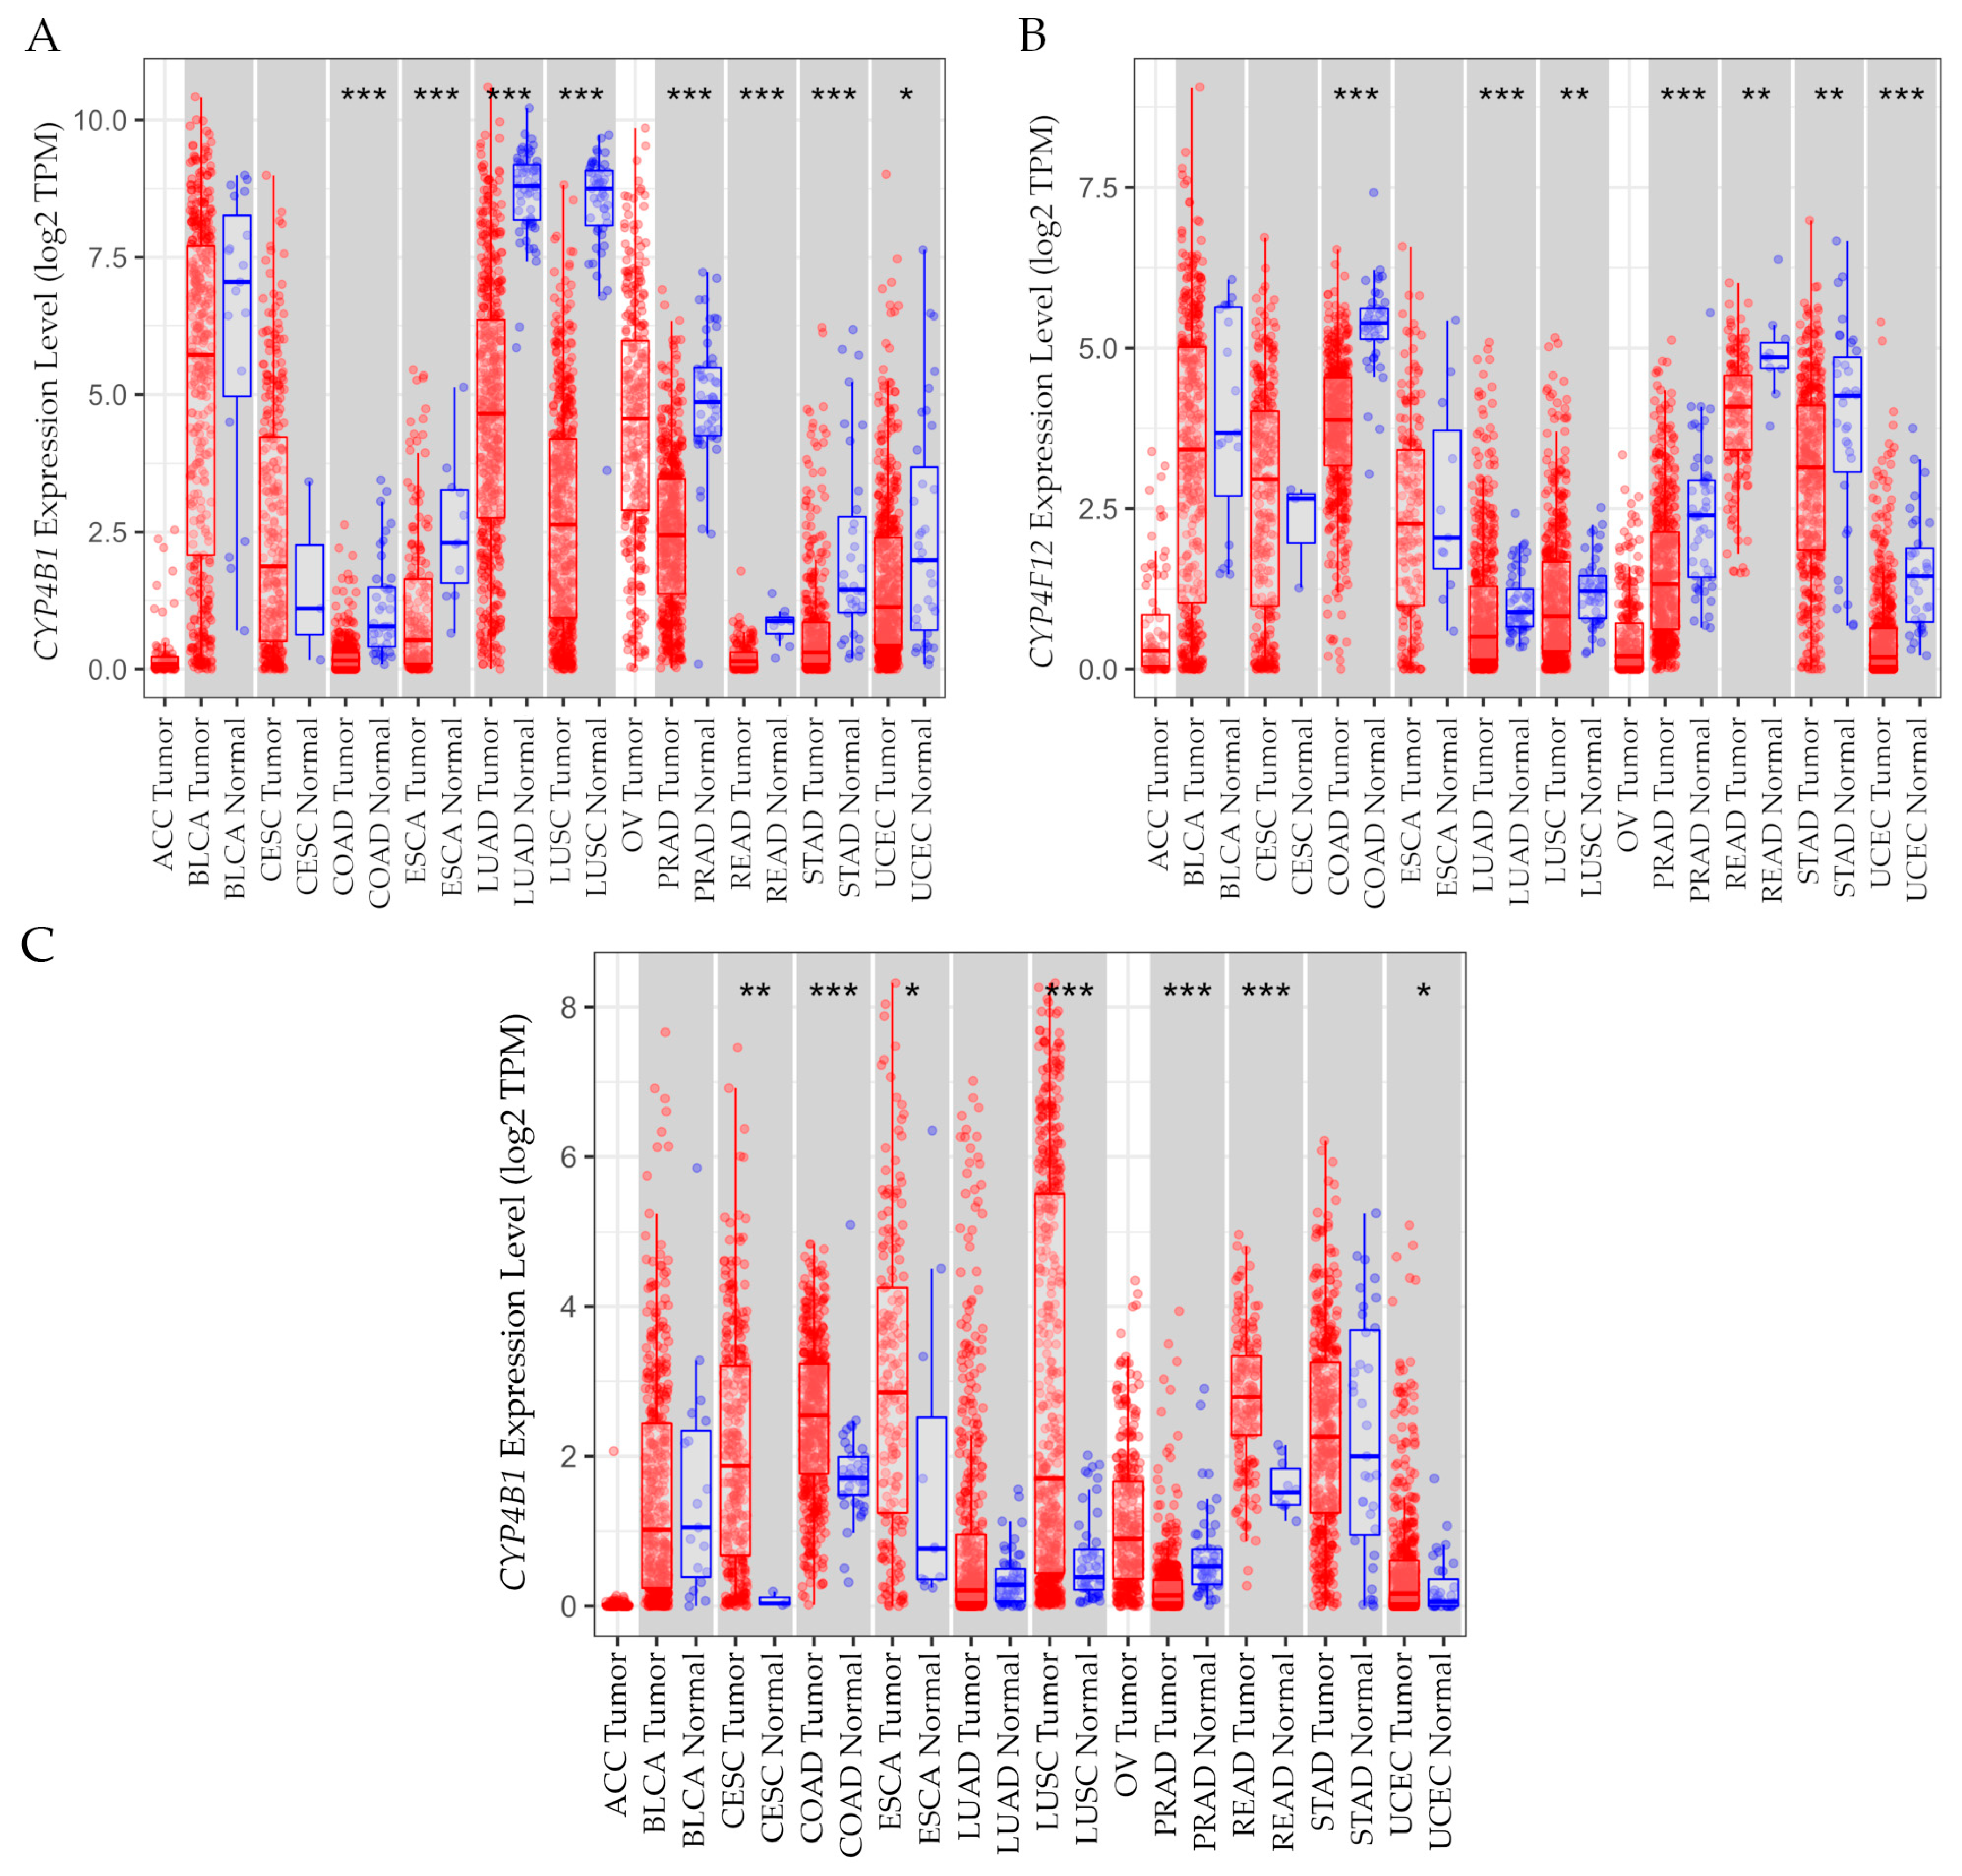
3.15.2. Gene Expression Levels in Tumor Versus Normal Tissues

Gene expression levels between normal and tumor tissue (Figure 9) were estimated using the Tumor Immune Estimation Resource v2.0 (TIMER2.0) in pan-cancer [49].
TIMER2.0 GeneDE module of the Cancer Exploration component was used for the analysis. The results indicated that CYP4B1 mRNA expression levels were non-significant in ACC, BLCA, CESC, and OV; however, expression showed a statistically significant (either * p < 0.05 or *** p < 0.001) upregulation in normal tissue compared to tumors in COAD, ESCA, LUAD, LUSC, PRAD, READ, STAD, and UCEC. A significant (either ** p < 0.01 or *** p < 0.001) upregulation of CYP4F12 mRNA was observed in normal tissue in comparison with tumors in COAD, LUAD, LUSC, PRAD, READ, STAD, and UCEC, whereas upregulation in ACC, BLCA, CESC, ESCA, and OV was non-significant. A statistically significant (either * p < 0.05, or ** p < 0.01, or *** p < 0.001) CYP4F3 mRNA overexpression was found in tumors in comparison with normal tissue in CESC, COAD, ESCA, LUSC, READ, and UCEC; however, such overexpression was higher in the normal tissue than tumor tissue in PRAD, whereas ACC, BLCA, LUAD, OV, and STAD showed no significant difference.

3.15.3. Overall Survival Analysis of CYPs in Pan-Cancer

The CYP4B1, CYP4F12, and CYP4F3 overall survival (OS) analyses were conducted using the TIMER2.0 [49] in pan-cancer. The TIMER2.0 Gene_Outcome module of the Cancer Exploration component assessed the outcome significance of gene expression using the Cox proportional hazard model, which could be modified by clinical parameters like stage. To display the normalized coefficient of the gene in the Cox model, a heatmap was created (Figure 10A). The Kaplan–Meier (KM) curve of the gene (Figure 10B–D) was obtained by clicking on a cell in the heatmap.
The heatmap table results indicated that patients with CYP4B1 gene expression levels showed a significantly (p < 0.05) decreased risk of CESC and LUAD, but an increased risk of LUSC. Patients with CYP4F12 expression levels showed a decreased risk of BLCA and CESC, but an increased risk of UCEC. Additionally, those patients with CYP4F3 gene expression levels depicted an increased risk of PRAD and UCEC. KM analysis showed that patients were grouped into two different categories depending on their CYP4 expression levels: the high-expression (red line) and the low-expression (blue line) groups. Representative KM graphs are presented for (B) CYP4B1, (C) CYP4F12, and (D) CYP4F3 gene expression levels. The results in Figure 10B show that patients with low CYP4B1 expression presented a reduced probability of survival, by 40%, in cervical cancer at about 100 months, lung adenocarcinoma patients did not survive within 120 months, and lung squamous cell carcinoma patients showed reduced survival within 170 months, with HR values were 0.774, 0.863, and 1.17, respectively. Patients with high CYP4F12 gene expression levels had a decrease in cumulative survival by 70% in bladder cancer at around 120 months, cervical cancer patients with high CYP4F12 expression showed a decrease in survival by 60% at about 140 months, and endometrial cancer patients had a decrease in survival by 55% at 120 months, HR values were 0.836, 0.736, and 1.05, respectively (Figure 10C). Prostate cancer patients with low CYP4F3 gene expression showed a decreased cumulative survival of about 35% at about 130 months, whereas endometrial cancer patients with high CYP4F3 gene expression levels depicted a decreased cumulative survival of about 50% at 120 months.

3.16. Advantages of Using CYP Enzymes as Biomarkers in Breast Cancer Compared to Other Solid Cancers

Subtype-Specific Expression: Certain CYP isoforms, like CYP1B1 [87] and CYP2W1 [88], are overexpressed in specific breast cancer subtypes (e.g., basal-like or triple-negative), offering potential for targeted diagnostics and therapies. Hormone Metabolism Insight: CYP enzymes are involved in estrogen metabolism, which is highly relevant in hormone receptor-positive breast cancers [89]. This makes them particularly useful for prognostic and therapeutic decisions in breast cancer [90]. Therapeutic Activation: Some CYPs can activate prodrugs selectively within breast tumors, opening doors for tumor-specific drug delivery with fewer systemic side effects [71,91].

3.17. Clinical Trials Based on CYP Family-Based Drugs for Therapeutic Targets in Specific Cancer Settings

There is a growing interest in using CYP enzymes as therapeutic targets in cancer, and several clinical trials have explored this, especially in the context of drug metabolism and resistance [7,39,92,93,94]. One promising approach is gene-directed enzyme prodrug therapy (GDEPT), where genes encoding CYP enzymes are introduced into cancer cells to activate chemotherapy prodrugs directly at the tumor site. This strategy enhances drug efficacy while minimizing systemic toxicity in preclinical and clinical trials. For example, engineered CYP enzymes have been studied for their ability to convert prodrugs into active anticancer agents more efficiently [72]. Additionally, natural CYP inhibitors—like flavonoids—are being investigated for their ability to reduce drug metabolism and improve the bioavailability of chemotherapeutic agents such as paclitaxel. These inhibitors may help overcome drug resistance by suppressing overexpressed CYP enzymes in tumors [89]. Clinical trials have also examined specific CYP isoforms like CYP3A4 in breast cancer settings. For instance, erythromycin, a moderate CYP3A4 inhibitor, was tested for its effect on the pharmacokinetics of palbociclib, a standard breast cancer treatment [95].

3.18. CYP1B1 in Tumor-Selective Activation

CYP1B1 is often overexpressed in tumors but not in normal tissues. This makes it a prime target for tumor-selective prodrugs [96]. For example, compounds like aminoflavone and Phortress are activated by CYP1B1, releasing cytotoxic agents only in cancer cells [97]. Hormone-Dependent Cancers CYP enzymes like CYP19 (aromatase) and CYP17 have been successfully targeted in breast and prostate cancers, respectively [98,99]. Aromatase inhibitors (e.g., anastrozole) are already standard in estrogen-receptor-positive breast cancer therapy [100,101,102]. The NIH ClinicalTrials.gov database provides comprehensive access to both ongoing and completed clinical trials, systematically organized by CYP isoform, cancer subtype, and therapeutic modality. Notably, several investigations involving CYP2D6 polymorphisms have contributed to the refinement of tamoxifen-based therapy in breast cancer patients, enabling a pharmacogenomically guided, individualized treatment strategy [103,104,105].
Aromatase inhibitors such as anastrozole and letrozole are now frontline treatments for ER+ breast cancer, effectively reducing estrogen synthesis in postmenopausal women [102,106,107,108,109]. Some key references that support the use of CYP enzymes in hormone-dependent cancers are as follows:
Aromatase (CYP19) and breast cancer: Aromatase is a cytochrome P450 enzyme that catalyzes the conversion of androgens to estrogens [110,111,112].
CYP17 and Prostate Cancer: CYP17 is crucial in androgen biosynthesis [113]. Inhibitors like abiraterone acetate (Zytiga) are FDA-approved for treating castration-resistant prostate cancer [99,114].
CYP2D6 and Tamoxifen Metabolism: CYP2D6 polymorphisms significantly affect tamoxifen metabolism and therapeutic response in breast cancer [103,105]. This is a key area of pharmacogenomic research [115].
Clinical Trials Using Anastrozole (CYP19 Inhibitor). The National Cancer Institute (NCI) lists multiple ongoing trials evaluating anastrozole in breast cancer. These include the following:
The DEBRA Trial: Testing radiation plus hormonal therapy vs. hormonal therapy alone in early-stage breast cancer [116,117,118].
LoTam Trial: Investigating low-dose tamoxifen for invasive breast cancer [119,120].
CAMBRIA-2 Study: Evaluating camizestrant vs. standard endocrine therapy in ER+/HER2- early breast cancer [121,122].
Some studies [123,124] discussed how CYP2D6 polymorphisms affected tamoxifen metabolism. While CYP2D6 genotyping can predict endoxifen levels [125], a comprehensive review in The Oncologist concluded that aromatase inhibitors were equivalent or superior to tamoxifen as first-line therapy for metastatic breast cancer and as neoadjuvant treatment [126]. They also offer a more favorable toxicity profile in many cases [127].

4. Conclusions

Overall, the document highlights the complex relationship between CYP enzymes and estrogen receptors in breast cancer, suggesting avenues for further research and potential therapeutic interventions. The study provides a comprehensive approach to the expression, clinical relevance, and genetic variation of the CYP4B1, CYP4F12, and CYP4F3 genes in breast and other cancers. The detected differential expression patterns between normal and tumor tissue suggest a functional role in tumorigenesis. Additionally, the positive correlation of these genes with estrogen receptor status and clinical data strengthen their potential as predictive biomarkers. Overall, the article emphasizes the functional importance of CYP4, highlighting the complex interplay between CYP enzymes and estrogen receptors in breast cancer. This study demonstrates their relevance not only in chemical detoxification but also in fundamental physiological processes such as hormonal regulation and oxidative stress response, indicating new avenues for future research and potential therapeutic interventions. Several cancer types beyond breast cancer were also explored, revealing multiple gene functions depending on the tissue context. While expression of these genes was generally low or undetectable in many tissues, specific organ-related contexts revealed functional and prognostic implications. Based on clinical prognostic relevance, CYP4B1 showed significant activity in adrenocortical cancer as a tumor-suppressor with drug-sensitizing effects; in lung adenocarcinoma, it was associated with improved survival, whereas in lung squamous cell carcinoma, it correlated with poor prognosis and an immunosuppressive profile; in ovarian cancer, it was linked to recurrence and chemoresistance. Significant associations of CYP4F12 included favorable prognosis in cervical cancer; in esophageal cancer, they were associated with reduced migration and immune modulation; and in ovarian mucinous tumors, they were associated with responsiveness to oxidative stress. In the case of CYP4F3, the findings included its emergence as a progression marker in bladder cancer, modulated by calcitriol in cervical cancer; it was also associated with poor prognosis in colorectal liver metastasis and included in a prognostic model of endometrial cancer. Collectively, these findings suggested the potential functional significance of these genes as predictive biomarkers or emerging therapeutic targets in selected cancer types. On the other hand, even though the mechanisms by which estrogen influences breast cancer development have long been understood, more research is needed to fully understand the molecular processes in the 17ß-estradiol-estrogen receptor α (ERα) signaling pathway that contribute to the progression of ER+ breast cancer, particularly lipid metabolism, to provide more options for customized and individualized therapy.

Author Contributions

Conceptualization, G.M.C.; writing—original draft, G.M.C.; software, L.A.C.; writing—review and editing, G.M.C., L.N.A., F.O.-A., S.P.-T., and L.A.C.; funding acquisition, G.M.C. All authors have read and agreed to the published version of the manuscript.

Funding

This research was funded by grants from the Fondo Nacional de Desarrollo Científico y Tecnológico (FONDECYT/ANID), FONDECYT 1231537 (G.M.C.), and FONDECYT 1200656 (G.M.C.).

Institutional Review Board Statement

Not applicable.

Informed Consent Statement

Not applicable.

Data Availability Statement

The data presented in this study are openly available in the Tumor Immune Estimation Resource v2.0 (TIMER2.0) [49], freely available at http://timer.cistrome.org (accessed on 1 August 2024); The University of Alabama at Birmingham Cancer Data Analysis Portal (UALCAN), available at https://ualcan.path.uab.edu/ [50] (accessed on 12 November 2024); the University of California, Santa Cruz, UCSC Xena functional genomics explorer [51], freely available at https://xena.ucsc.edu/, accessed on 1 August 2024. The data generated in the present study may be requested from the corresponding author.

Acknowledgments

The authors want to thank the Agencia Nacional de Investigación y Desarrollo (ANID) of the Government of Chile for its financial support.

Conflicts of Interest

The authors declare no conflicts of interest. The funders had no role in the design of the study; in the collection, analyses, or interpretation of data; in the writing of the manu-481 script; or in the decision to publish the results.

Abbreviations

The following abbreviations are used in this manuscript:
ER-Estrogen receptor-negative
ER+Estrogen receptor-positive
CYPCytochrome P450
CYP4B1Cytochrome P450 family 4 subfamily B member 1
CYP4F12Cytochrome P450 family 4 subfamily F member 12
CYP4F3Cytochrome P450 family 4 subfamily F member 3
LTB4Leukotriene B4
20-HETE20-hydroxyeicosatetraenoic acid
TCGAThe Cancer Genome Atlas
GTExGenotype-tissue expression
GEPIA2Gene Expression Profiling Interactive Analysis
UALCANUniversity of Alabama at Birmingham Cancer Data Analysis Portal
HPAHuman Protein Atlas
BRCA1BRCA1 DNA repair-associated
BRCA2BRCA2 DNA repair-associated
ESR1Estrogen receptor alpha
TIMER2.0Tumor Immune Estimation Resource v2.0
ρCorrelation coefficients
UCSC XenaUniversity of California, Santa Cruz, Xena explorer
ICGCInternational Cancer Genome Consortium
GDCGenomic Data Commons
OSOverall survival
KMKaplan–Meier

References

  1. Obeagu, E.I.; Obeagu, G.U. Breast cancer: A review of risk factors and diagnosis. Medicine 2024, 103, e36905. [Google Scholar] [CrossRef]
  2. WHO. Breast Cancer. World Health Organization. Available online: https://www.who.int/news-room/fact-sheets/detail/breast-cancer (accessed on 9 April 2025).
  3. Thun, M.J.; DeLancey, J.O.; Center, M.M.; Jemal, A.; Ward, E.M. The global burden of cancer: Priorities for prevention. Carcinogenesis 2010, 31, 100–110. [Google Scholar] [CrossRef]
  4. Barrios, C.; de Lima Lopes, G.; Yusof, M.M.; Rubagumya, F.; Rutkowski, P.; Sengar, M. Barriers in access to oncology drugs—A global crisis. Nat. Rev. Clin. Oncol. 2023, 20, 7–15. [Google Scholar] [CrossRef]
  5. Wang, B.; He, F.; Hu, Y.; Wang, Q.; Wang, D.; Sha, Y.; Wu, J. Cancer incidence and mortality and risk factors in member countries of the “ Belt and Road “ initiative. BMC Cancer 2022, 22, 582. [Google Scholar] [CrossRef]
  6. Antoni, M.H.; Lutgendorf, S.K.; Cole, S.W.; Dhabhar, F.S.; Sephton, S.E.; McDonald, P.G.; Stefanek, M.; Sood, A.K. The influence of bio-behavioural factors on tumour biology: Pathways and mechanisms. Nat. Rev. Cancer 2006, 6, 240–248. [Google Scholar] [CrossRef]
  7. Nebert, D.W.; Russell, D.W. Clinical importance of the cytochromes P450. Lancet 2002, 360, 1155–1162. [Google Scholar] [CrossRef]
  8. Nelson, D.R.; Zeldin, D.C.; Hoffman, S.M.; Maltais, L.J.; Wain, H.M.; Nebert, D.W. Comparison of cytochrome P450 (CYP) genes from the mouse and human genomes, including nomenclature recommendations for genes, pseudogenes and alternative-splice variants. Pharmacogenetics 2004, 14, 1–18. [Google Scholar] [CrossRef]
  9. Ma, M.K.; Woo, M.H.; McLeod, H.L. Genetic basis of drug metabolism. Am. J. Health Syst. Pharm. 2002, 59, 2061–2069. [Google Scholar] [CrossRef]
  10. Luthra, A.; Denisov, I.G.; Sligar, S.G. Spectroscopic features of cytochrome P450 reaction intermediates. Arch. Biochem. Biophys. 2011, 507, 26–35. [Google Scholar] [CrossRef]
  11. Hodges, N.J.; Green, R.M.; Chipman, J.K.; Graham, M. Induction of DNA strand breaks and oxidative stress in HeLa cells by ethanol is dependent on CYP2E1 expression. Mutagenesis 2007, 22, 189–194. [Google Scholar] [CrossRef]
  12. Hu, Z.; Fan, C.; Oh, D.S.; Marron, J.S.; He, X.; Qaqish, B.F.; Livasy, C.; Carey, L.A.; Reynolds, E.; Dressler, L.; et al. The molecular portraits of breast tumors are conserved across microarray platforms. BMC Genom. 2006, 7, 96. [Google Scholar] [CrossRef]
  13. Parker, J.S.; Mullins, M.; Cheang, M.C.; Leung, S.; Voduc, D.; Vickery, T.; Davies, S.; Fauron, C.; He, X.; Hu, Z.; et al. Supervised risk predictor of breast cancer based on intrinsic subtypes. J. Clin. Oncol. 2009, 27, 1160–1167. [Google Scholar] [CrossRef]
  14. Perou, C.M.; Sorlie, T.; Eisen, M.B.; van de Rijn, M.; Jeffrey, S.S.; Rees, C.A.; Pollack, J.R.; Ross, D.T.; Johnsen, H.; Akslen, L.A.; et al. Molecular portraits of human breast tumours. Nature 2000, 406, 747–752. [Google Scholar] [CrossRef]
  15. Rakha, E.A.; Reis-Filho, J.S.; Ellis, I.O. Basal-like breast cancer: A critical review. J. Clin. Oncol. 2008, 26, 2568–2581. [Google Scholar] [CrossRef]
  16. Sorlie, T.; Perou, C.M.; Tibshirani, R.; Aas, T.; Geisler, S.; Johnsen, H.; Hastie, T.; Eisen, M.B.; van de Rijn, M.; Jeffrey, S.S.; et al. Gene expression patterns of breast carcinomas distinguish tumor subclasses with clinical implications. Proc. Natl. Acad. Sci. USA 2001, 98, 10869–10874. [Google Scholar] [CrossRef]
  17. Sorlie, T.; Tibshirani, R.; Parker, J.; Hastie, T.; Marron, J.S.; Nobel, A.; Deng, S.; Johnsen, H.; Pesich, R.; Geisler, S.; et al. Repeated observation of breast tumor subtypes in independent gene expression data sets. Proc. Natl. Acad. Sci. USA 2003, 100, 8418–8423. [Google Scholar] [CrossRef]
  18. Gusterson, B. Do ‘basal-like’ breast cancers really exist? Nat. Rev. Cancer 2009, 9, 128–134. [Google Scholar] [CrossRef]
  19. Rakha, E.A.; El-Sayed, M.E.; Reis-Filho, J.; Ellis, I.O. Patho-biological aspects of basal-like breast cancer. Breast Cancer Res. Treat. 2009, 113, 411–422. [Google Scholar] [CrossRef]
  20. Rakha, E.A.; Reis-Filho, J.S.; Ellis, I.O. Impact of basal-like breast carcinoma determination for a more specific therapy. Pathobiology 2008, 75, 95–103. [Google Scholar] [CrossRef]
  21. Livasy, C.A.; Karaca, G.; Nanda, R.; Tretiakova, M.S.; Olopade, O.I.; Moore, D.T.; Perou, C.M. Phenotypic evaluation of the basal-like subtype of invasive breast carcinoma. Mod. Pathol. 2006, 19, 264–271. [Google Scholar] [CrossRef]
  22. Nielsen, T.O.; Hsu, F.D.; Jensen, K.; Cheang, M.; Karaca, G.; Hu, Z.; Hernandez-Boussard, T.; Livasy, C.; Cowan, D.; Dressler, L.; et al. Immunohistochemical and clinical characterization of the basal-like subtype of invasive breast carcinoma. Clin. Cancer Res. 2004, 10, 5367–5374. [Google Scholar] [CrossRef]
  23. Cheang, M.C.; Voduc, D.; Bajdik, C.; Leung, S.; McKinney, S.; Chia, S.K.; Perou, C.M.; Nielsen, T.O. Basal-like breast cancer defined by five biomarkers has superior prognostic value than triple-negative phenotype. Clin. Cancer Res. 2008, 14, 1368–1376. [Google Scholar] [CrossRef]
  24. Fulford, L.G.; Easton, D.F.; Reis-Filho, J.S.; Sofronis, A.; Gillett, C.E.; Lakhani, S.R.; Hanby, A. Specific morphological features predictive for the basal phenotype in grade 3 invasive ductal carcinoma of breast. Histopathology 2006, 49, 22–34. [Google Scholar] [CrossRef]
  25. Banerjee, S.; Reis-Filho, J.S.; Ashley, S.; Steele, D.; Ashworth, A.; Lakhani, S.R.; Smith, I.E. Basal-like breast carcinomas: Clinical outcome and response to chemotherapy. J. Clin. Pathol. 2006, 59, 729–735. [Google Scholar] [CrossRef]
  26. Carey, L.A.; Dees, E.C.; Sawyer, L.; Gatti, L.; Moore, D.T.; Collichio, F.; Ollila, D.W.; Sartor, C.I.; Graham, M.L.; Perou, C.M. The triple negative paradox: Primary tumor chemosensitivity of breast cancer subtypes. Clin. Cancer Res. 2007, 13, 2329–2334. [Google Scholar] [CrossRef]
  27. Haffty, B.G.; Yang, Q.; Reiss, M.; Kearney, T.; Higgins, S.A.; Weidhaas, J.; Harris, L.; Hait, W.; Toppmeyer, D. Locoregional relapse and distant metastasis in conservatively managed triple negative early-stage breast cancer. J. Clin. Oncol. 2006, 24, 5652–5657. [Google Scholar] [CrossRef]
  28. Kennecke, H.; Yerushalmi, R.; Woods, R.; Cheang, M.C.; Voduc, D.; Speers, C.H.; Nielsen, T.O.; Gelmon, K. Metastatic behavior of breast cancer subtypes. J. Clin. Oncol. 2010, 28, 3271–3277. [Google Scholar] [CrossRef]
  29. Rakha, E.A.; Ellis, I.O.; Reis-Filho, J.S. Immunohistochemical heterogeneity of breast carcinomas negative for estrogen receptors, progesterone receptors and Her2/neu (basal-like breast carcinomas). Mod. Pathol. 2008, 21, 1060–1061; author reply 1061–1062. [Google Scholar] [CrossRef]
  30. Thike, A.A.; Cheok, P.Y.; Jara-Lazaro, A.R.; Tan, B.; Tan, P.; Tan, P.H. Triple-negative breast cancer: Clinicopathological characteristics and relationship with basal-like breast cancer. Mod. Pathol. 2010, 23, 123–133. [Google Scholar] [CrossRef]
  31. Thike, A.A.; Iqbal, J.; Cheok, P.Y.; Chong, A.P.; Tse, G.M.; Tan, B.; Tan, P.; Wong, N.S.; Tan, P.H. Triple negative breast cancer: Outcome correlation with immunohistochemical detection of basal markers. Am. J. Surg. Pathol. 2010, 34, 956–964. [Google Scholar] [CrossRef]
  32. Carey, L.A.; Perou, C.M.; Livasy, C.A.; Dressler, L.G.; Cowan, D.; Conway, K.; Karaca, G.; Troester, M.A.; Tse, C.K.; Edmiston, S.; et al. Race, breast cancer subtypes, and survival in the Carolina Breast Cancer Study. JAMA 2006, 295, 2492–2502. [Google Scholar] [CrossRef]
  33. Putti, T.C.; El-Rehim, D.M.; Rakha, E.A.; Paish, C.E.; Lee, A.H.; Pinder, S.E.; Ellis, I.O. Estrogen receptor-negative breast carcinomas: A review of morphology and immunophenotypical analysis. Mod. Pathol. 2005, 18, 26–35. [Google Scholar] [CrossRef]
  34. Guedj, M.; Marisa, L.; de Reynies, A.; Orsetti, B.; Schiappa, R.; Bibeau, F.; MacGrogan, G.; Lerebours, F.; Finetti, P.; Longy, M.; et al. A refined molecular taxonomy of breast cancer. Oncogene 2012, 31, 1196–1206. [Google Scholar] [CrossRef]
  35. Farmer, P.; Bonnefoi, H.; Becette, V.; Tubiana-Hulin, M.; Fumoleau, P.; Larsimont, D.; Macgrogan, G.; Bergh, J.; Cameron, D.; Goldstein, D.; et al. Identification of molecular apocrine breast tumours by microarray analysis. Oncogene 2005, 24, 4660–4671. [Google Scholar] [CrossRef]
  36. Teschendorff, A.E.; Naderi, A.; Barbosa-Morais, N.L.; Caldas, C. PACK: Profile Analysis using Clustering and Kurtosis to find molecular classifiers in cancer. Bioinformatics 2006, 22, 2269–2275. [Google Scholar] [CrossRef]
  37. Doane, A.S.; Danso, M.; Lal, P.; Donaton, M.; Zhang, L.; Hudis, C.; Gerald, W.L. An estrogen receptor-negative breast cancer subset characterized by a hormonally regulated transcriptional program and response to androgen. Oncogene 2006, 25, 3994–4008. [Google Scholar] [CrossRef]
  38. Guengerich, F.P. Characterization of human microsomal cytochrome P-450 enzymes. Annu. Rev. Pharmacol. Toxicol. 1989, 29, 241–264. [Google Scholar] [CrossRef]
  39. Guengerich, F.P. Cytochrome P-450 3A4: Regulation and role in drug metabolism. Annu. Rev. Pharmacol. Toxicol. 1999, 39, 1–17. [Google Scholar] [CrossRef]
  40. Niwa, T.; Murayama, N.; Yamazaki, H. Oxidation of endobiotics mediated by xenobiotic-metabolizing forms of human cytochrome. Curr. Drug Metab. 2009, 10, 700–712. [Google Scholar] [CrossRef]
  41. Al-Saraireh, Y.M.; Alshammari, F.; Abu-Azzam, O.H.; Al-Dalain, S.M.; Al-Sarayra, Y.M.; Haddad, M.; Makeen, H.; Al-Qtaitat, A.; Almermesh, M.; Al-Sarayreh, S.A. Targeting Cytochrome P450 Enzymes in Ovarian Cancers: New Approaches to Tumor-Selective Intervention. Biomedicines 2023, 11, 2898. [Google Scholar] [CrossRef]
  42. Porter, T.D.; Coon, M.J. Cytochrome P-450. Multiplicity of isoforms, substrates, and catalytic and regulatory mechanisms. J. Biol. Chem. 1991, 266, 13469–13472. [Google Scholar] [CrossRef]
  43. Chang, G.W.; Kam, P.C. The physiological and pharmacological roles of cytochrome P450 isoenzymes. Anaesthesia 1999, 54, 42–50. [Google Scholar] [CrossRef]
  44. Neve, R.M.; Chin, K.; Fridlyand, J.; Yeh, J.; Baehner, F.L.; Fevr, T.; Clark, L.; Bayani, N.; Coppe, J.P.; Tong, F.; et al. A collection of breast cancer cell lines for the study of functionally distinct cancer subtypes. Cancer Cell 2006, 10, 515–527. [Google Scholar] [CrossRef]
  45. Thelen, K.; Dressman, J.B. Cytochrome P450-mediated metabolism in the human gut wall. J. Pharm. Pharmacol. 2009, 61, 541–558. [Google Scholar] [CrossRef]
  46. Renaud, H.J.; Cui, J.Y.; Khan, M.; Klaassen, C.D. Tissue distribution and gender-divergent expression of 78 cytochrome P450 mRNAs in mice. Toxicol. Sci. 2011, 124, 261–277. [Google Scholar] [CrossRef]
  47. Guengerich, F.P. Mechanisms of cytochrome P450 substrate oxidation: MiniReview. J. Biochem. Mol. Toxicol. 2007, 21, 163–168. [Google Scholar] [CrossRef]
  48. Simpson, A.E. The cytochrome P450 4 (CYP4) family. Gen. Pharmacol. 1997, 28, 351–359. [Google Scholar] [CrossRef]
  49. Li, T.; Fu, J.; Zeng, Z.; Cohen, D.; Li, J.; Chen, Q.; Li, B.; Liu, X.S. TIMER2.0 for analysis of tumor-infiltrating immune cells. Nucleic Acids Res. 2020, 48, W509–W514. [Google Scholar] [CrossRef]
  50. Chen, F.; Zhang, Y.; Chandrashekar, D.S.; Varambally, S.; Creighton, C.J. Global impact of somatic structural variation on the cancer proteome. Nat. Commun. 2023, 14, 5637. [Google Scholar] [CrossRef]
  51. Goldman, M.; Craft, B.; Hastie, M.; Repecka, K.; McDade, F.; Kamath, A.; Banerjee, A.; Luo, Y.; Rogers, D.; Brooks, A.N.; et al. The UCSC Xena platform for public and private cancer genomics data visualization and interpretation. bioRxiv 2019, 1–16. [Google Scholar] [CrossRef]
  52. Leung, T.; Rajendran, R.; Singh, S.; Garva, R.; Krstic-Demonacos, M.; Demonacos, C. Cytochrome P450 2E1 (CYP2E1) regulates the response to oxidative stress and migration of breast cancer cells. Breast Cancer Res. 2013, 15, R107. [Google Scholar] [CrossRef]
  53. Elfaki, I.; Mir, R.; Almutairi, F.M.; Duhier, F.M.A. Cytochrome P450: Polymorphisms and Roles in Cancer, Diabetes and Atherosclerosis. Asian Pac. J. Cancer Prev. 2018, 19, 2057–2070. [Google Scholar] [CrossRef]
  54. Murray, G.I.; Patimalla, S.; Stewart, K.N.; Miller, I.D.; Heys, S.D. Profiling the expression of cytochrome P450 in breast cancer. Histopathology 2010, 57, 202–211. [Google Scholar] [CrossRef]
  55. Roder, A.; Husken, S.; Hutter, M.C.; Rettie, A.E.; Hanenberg, H.; Wiek, C.; Girhard, M. Spotlight on CYP4B1. Int. J. Mol. Sci. 2023, 24, 2038. [Google Scholar] [CrossRef]
  56. Iscan, M.; Klaavuniemi, T.; Coban, T.; Kapucuoglu, N.; Pelkonen, O.; Raunio, H. The expression of cytochrome P450 enzymes in human breast tumours and normal breast tissue. Breast Cancer Res. Treat. 2001, 70, 47–54. [Google Scholar] [CrossRef]
  57. Hashizume, T.; Imaoka, S.; Mise, M.; Terauchi, Y.; Fujii, T.; Miyazaki, H.; Kamataki, T.; Funae, Y. Involvement of CYP2J2 and CYP4F12 in the metabolism of ebastine in human intestinal microsomes. J. Pharmacol. Exp. Ther. 2002, 300, 298–304. [Google Scholar] [CrossRef]
  58. Johnson, A.L.; Edson, K.Z.; Totah, R.A.; Rettie, A.E. Cytochrome P450 omega-Hydroxylases in Inflammation and Cancer. Adv. Pharmacol. 2015, 74, 223–262. [Google Scholar] [CrossRef]
  59. Corcos, L.; Lucas, D.; Le Jossic-Corcos, C.; Dreano, Y.; Simon, B.; Plee-Gautier, E.; Amet, Y.; Salaun, J.P. Human cytochrome P450 4F3: Structure, functions, and prospects. Drug Metabol. Drug Interact. 2012, 27, 63–71. [Google Scholar] [CrossRef]
  60. Calaf, G.M.; Roy, D. Human drug metabolism genes in parathion-and estrogen-treated breast cells. Int. J. Mol. Med. 2007, 20, 875–881. [Google Scholar] [CrossRef]
  61. Edson, K.Z.; Rettie, A.E. CYP4 enzymes as potential drug targets: Focus on enzyme multiplicity, inducers and inhibitors, and therapeutic modulation of 20-hydroxyeicosatetraenoic acid (20-HETE) synthase and fatty acid omega-hydroxylase activities. Curr. Top. Med. Chem. 2013, 13, 1429–1440. [Google Scholar] [CrossRef]
  62. McDonald, M.G.; Ray, S.; Amorosi, C.J.; Sitko, K.A.; Kowalski, J.P.; Paco, L.; Nath, A.; Gallis, B.; Totah, R.A.; Dunham, M.J.; et al. Expression and Functional Characterization of Breast Cancer-Associated Cytochrome P450 4Z1 in Saccharomyces cerevisiae. Drug Metab. Dispos. 2017, 45, 1364–1371. [Google Scholar] [CrossRef]
  63. Borin, T.F.; Zuccari, D.A.; Jardim-Perassi, B.V.; Ferreira, L.C.; Iskander, A.S.; Varma, N.R.; Shankar, A.; Guo, A.M.; Scicli, G.; Arbab, A.S. HET0016, a selective inhibitor of 20-HETE synthesis, decreases pro-angiogenic factors and inhibits growth of triple negative breast cancer in mice. PLoS ONE 2014, 9, e116247. [Google Scholar] [CrossRef]
  64. Yang, J.; Li, Y.; Han, X.; Li, T.; Li, D.; Liu, Q.; Yan, L.; Li, F.; Pei, X.; Feng, Y.; et al. Targeting estrogen mediated CYP4F2/CYP4F11-20-HETE metabolic disorder decelerates tumorigenesis in ER+ breast cancer. Biochem. Biophys. Rep. 2024, 38, 101706. [Google Scholar] [CrossRef]
  65. Nunna, V.; Jalal, N.; Bureik, M. Anti-CYP4Z1 autoantibodies detected in breast cancer patients. Cell. Mol. Immunol. 2017, 14, 572–574. [Google Scholar] [CrossRef]
  66. Li, C.; Zheng, L.; Xin, Y.; Tan, Z.; Zhang, Y.; Meng, X.; Wang, Z.; Xi, T. The competing endogenous RNA network of CYP4Z1 and pseudogene CYP4Z2P exerts an anti-apoptotic function in breast cancer. FEBS Lett. 2017, 591, 991–1000. [Google Scholar] [CrossRef]
  67. Hossam Abdelmonem, B.; Abdelaal, N.M.; Anwer, E.K.E.; Rashwan, A.A.; Hussein, M.A.; Ahmed, Y.F.; Khashana, R.; Hanna, M.M.; Abdelnaser, A. Decoding the Role of CYP450 Enzymes in Metabolism and Disease: A Comprehensive Review. Biomedicines 2024, 12, 1467. [Google Scholar] [CrossRef]
  68. Kartikasari, A.E.R.; Huertas, C.S.; Mitchell, A.; Plebanski, M. Tumor-Induced Inflammatory Cytokines and the Emerging Diagnostic Devices for Cancer Detection and Prognosis. Front. Oncol. 2021, 11, 692142. [Google Scholar] [CrossRef]
  69. Geindreau, M.; Bruchard, M.; Vegran, F. Role of Cytokines and Chemokines in Angiogenesis in a Tumor Context. Cancers 2022, 14, 2446. [Google Scholar] [CrossRef]
  70. Rocic, P.; Schwartzman, M.L. 20-HETE in the regulation of vascular and cardiac function. Pharmacol. Ther. 2018, 192, 74–87. [Google Scholar] [CrossRef]
  71. Alzahrani, A.M.; Rajendran, P. The Multifarious Link between Cytochrome P450s and Cancer. Oxid. Med. Cell. Longev. 2020, 2020, 3028387. [Google Scholar] [CrossRef]
  72. Carrera-Pacheco, S.E.; Mueller, A.; Puente-Pineda, J.A.; Zuniga-Miranda, J.; Guaman, L.P. Designing cytochrome P450 enzymes for use in cancer gene therapy. Front. Bioeng. Biotechnol. 2024, 12, 1405466. [Google Scholar] [CrossRef]
  73. Murtha, T.D.; Korah, R.; Carling, T. Suppression of cytochrome P450 4B1: An early event in adrenocortical tumorigenesis. Surgery 2017, 161, 257–263. [Google Scholar] [CrossRef]
  74. Karlsson, M.; Zhang, C.; Mear, L.; Zhong, W.; Digre, A.; Katona, B.; Sjostedt, E.; Butler, L.; Odeberg, J.; Dusart, P.; et al. A single-cell type transcriptomics map of human tissues. Sci. Adv. 2021, 7, eabh2169. [Google Scholar] [CrossRef]
  75. Ahmed, K.M.; Veeramachaneni, R.; Deng, D.; Putluri, N.; Putluri, V.; Cardenas, M.F.; Wheeler, D.A.; Decker, W.K.; Frederick, A.I.; Kazi, S.; et al. Glutathione peroxidase 2 is a metabolic driver of the tumor immune microenvironment and immune checkpoint inhibitor response. J. Immunother. Cancer 2022, 10, e004752. [Google Scholar] [CrossRef]
  76. Alshammari, F.; Al-Saraireh, Y.M.; Youssef, A.M.M.; Al-Sarayra, Y.M.; Alrawashdeh, H.M. Cytochrome P450 1B1 Overexpression in Cervical Cancers: Cross-sectional Study. Interact. J. Med. Res. 2021, 10, e31150. [Google Scholar] [CrossRef]
  77. Dai, G.; Ou, J.; Wu, B. A predictive study of metabolism reprogramming in cervical carcinoma. Ann. Transl. Med. 2022, 10, 414. [Google Scholar] [CrossRef]
  78. Yin, J.; Liu, H.; Liu, Z.; Owzar, K.; Han, Y.; Su, L.; Wei, Y.; Hung, R.J.; Brhane, Y.; McLaughlin, J.; et al. Pathway-analysis of published genome-wide association studies of lung cancer: A potential role for the CYP4F3 locus. Mol. Carcinog. 2017, 56, 1663–1672. [Google Scholar] [CrossRef]
  79. Tang, X.L.; Xu, Z.Y.; Guan, J.; Yao, J.; Tang, X.L.; Zhou, Z.Q.; Zhang, Z.Y. Establishment of a neutrophil extracellular trap-related prognostic signature for colorectal cancer liver metastasis and expression validation of CYP4F3. Clin. Exp. Med. 2024, 24, 112. [Google Scholar] [CrossRef]
  80. Lim, S.; Alshagga, M.; Ong, C.E.; Chieng, J.Y.; Pan, Y. Cytochrome P450 4B1 (CYP4B1) as a target in cancer treatment. Hum. Exp. Toxicol. 2020, 39, 785–796. [Google Scholar] [CrossRef]
  81. Chen, Y.; Wang, L.; Wang, Y.; Fang, Y.; Shen, W.; Si, Y.; Zheng, X.; Zeng, S. Integrative Analysis of Histone Acetylation Regulated CYP4F12 in Esophageal Cancer Development. Drug Metab. Dispos. 2024, 52, 813–823. [Google Scholar] [CrossRef]
  82. Smith, J.D.A.; Johnson, M. Clinical outcomes with perioperative chemotherapy in sarcomatoid carcinomas of the lung. J. Thorac. Oncol. 2022, 7, 123–130. [Google Scholar] [CrossRef]
  83. Smith, J.; Doe, A.; Johnson, M. Obinutuzumab pretreatment as a novel approach to mitigate formation of anti-drug antibodies against cergutuzumab amunaleukin in patients with solid tumors. Ann. Oncol. 2022, 33, 1422–1424. [Google Scholar] [CrossRef]
  84. Barlin, J.N.; Jelinic, P.; Olvera, N.; Bogomolniy, F.; Bisogna, M.; Dao, F.; Barakat, R.R.; Chi, D.S.; Levine, D.A. Validated gene targets associated with curatively treated advanced serous ovarian carcinoma. Gynecol. Oncol. 2013, 128, 512–517. [Google Scholar] [CrossRef]
  85. Marchini, S.; Mariani, P.; Chiorino, G.; Marrazzo, E.; Bonomi, R.; Fruscio, R.; Clivio, L.; Garbi, A.; Torri, V.; Cinquini, M.; et al. Analysis of gene expression in early-stage ovarian cancer. Clin. Cancer Res. 2008, 14, 7850–7860. [Google Scholar] [CrossRef]
  86. Zencir, S.; Alptekin, D.; Celiktas, M.; Canturk, P.; Colak, D.; Caner, V.; Luleyap, U.H.; Topcu, Z. Detection of cytochrome P450-2A6, -3A5 and -4B1 with real-time polymerase chain reaction in prostate tissue. Z. Naturforsch. C J. Biosci. 2008, 63, 780–784. [Google Scholar] [CrossRef]
  87. Abdul Aziz, A.A.; Md Salleh, M.S.; Yahya, M.M.; Zakaria, A.D.; Ankathil, R. Genetic Association of CYP1B1 4326 C>G Polymorphism with Disease-Free Survival in TNBC Patients Undergoing TAC Chemotherapy Regimen. Asian Pac. J. Cancer Prev. 2021, 22, 1319–1324. [Google Scholar] [CrossRef]
  88. Aiyappa-Maudsley, R.; Storr, S.J.; Rakha, E.A.; Green, A.R.; Ellis, I.O.; Martin, S.G. CYP2S1 and CYP2W1 expression is associated with patient survival in breast cancer. J. Pathol. Clin. Res. 2022, 8, 550–566. [Google Scholar] [CrossRef]
  89. Manthalkar, L.; Ajazuddin; Bhattacharya, S. Evidence-based capacity of natural cytochrome enzyme inhibitors to increase the effectivity of antineoplastic drugs. Discov. Oncol. 2022, 13, 142. [Google Scholar] [CrossRef]
  90. Blackburn, H.L.; Ellsworth, D.L.; Shriver, C.D.; Ellsworth, R.E. Role of cytochrome P450 genes in breast cancer etiology and treatment: Effects on estrogen biosynthesis, metabolism, and response to endocrine therapy. Cancer Causes Control 2015, 26, 319–332. [Google Scholar] [CrossRef]
  91. Fortin, S.; Charest-Morin, X.; Turcotte, V.; Lauvaux, C.; Lacroix, J.; Cote, M.F.; Gobeil, S.; René, C.G. Activation of Phenyl 4-(2-Oxo-3-alkylimidazolidin-1-yl)benzenesulfonates Prodrugs by CYP1A1 as New Antimitotics Targeting Breast Cancer Cells. J. Med. Chem. 2017, 60, 4963–4982. [Google Scholar] [CrossRef]
  92. Alaei, M.; Nazari, S.E.; Pourali, G.; Asadnia, A.; Moetamani-Ahmadi, M.; Fiuji, H.; Tanzadehpanah, H.; Asgharzadeh, F.; Babaei, F.; Khojasteh-Leylakoohi, F.; et al. Therapeutic Potential of Targeting the Cytochrome P450 Enzymes Using Lopinavir/Ritonavir in Colorectal Cancer: A Study in Monolayers, Spheroids and In Vivo Models. Cancers 2023, 15, 3939. [Google Scholar] [CrossRef]
  93. Watkins, P.B.; Wrighton, S.A.; Schuetz, E.G.; Molowa, D.T.; Guzelian, P.S. Identification of glucocorticoid-inducible cytochromes P-450 in the intestinal mucosa of rats and man. J. Clin. Investig. 1987, 80, 1029–1036. [Google Scholar] [CrossRef]
  94. Maksimovic-Ivanic, D.; Fagone, P.; McCubrey, J.; Bendtzen, K.; Mijatovic, S.; Nicoletti, F. HIV-protease inhibitors for the treatment of cancer: Repositioning HIV protease inhibitors while developing more potent NO-hybridized derivatives? Int. J. Cancer 2017, 140, 1713–1726. [Google Scholar] [CrossRef]
  95. Molenaar-Kuijsten, L.; Braal, C.L.; Groenland, S.L.; de Vries, N.; Rosing, H.; Beijnen, J.H.; Koolen, S.L.W.; Vulink, A.J.E.; van Dongen, M.G.J.; Mathijssen, R.H.J.; et al. Effects of the Moderate CYP3A4 Inhibitor Erythromycin on the Pharmacokinetics of Palbociclib: A Randomized Crossover Trial in Patients With Breast Cancer. Clin. Pharmacol. Ther. 2022, 111, 477–484. [Google Scholar] [CrossRef]
  96. Rochat, B.; Morsman, J.M.; Murray, G.I.; Figg, W.D.; McLeod, H.L. Human CYP1B1 and anticancer agent metabolism: Mechanism for tumor-specific drug inactivation? J. Pharmacol. Exp. Ther. 2001, 296, 537–541. [Google Scholar] [CrossRef]
  97. Sneha, S.; Baker, S.C.; Green, A.; Storr, S.; Aiyappa, R.; Martin, S.; Pors, K. Intratumoural Cytochrome P450 Expression in Breast Cancer: Impact on Standard of Care Treatment and New Efforts to Develop Tumour-Selective Therapies. Biomedicines 2021, 9, 290. [Google Scholar] [CrossRef]
  98. Brodie, A.; Njar, V.; Macedo, L.F.; Vasaitis, T.S.; Sabnis, G. The Coffey Lecture: Steroidogenic enzyme inhibitors and hormone dependent cancer. Urol. Oncol. 2009, 27, 53–63. [Google Scholar] [CrossRef]
  99. Yap, T.A.; Carden, C.P.; Attard, G.; de Bono, J.S. Targeting CYP17: Established and novel approaches in prostate cancer. Curr. Opin. Pharmacol. 2008, 8, 449–457. [Google Scholar] [CrossRef]
  100. Bhutani, K.; Vishwakarma, S.; Yadav, P.; Yadav, M.K. The current landscape of aromatase inhibitors for the treatment of estrogen receptor-positive breast carcinoma. J. Steroid Biochem. Mol. Biol. 2025, 250, 106729. [Google Scholar] [CrossRef]
  101. Burstein, H.J.; Prestrud, A.A.; Seidenfeld, J.; Anderson, H.; Buchholz, T.A.; Davidson, N.E.; Gelmon, K.E.; Giordano, S.H.; Hudis, C.A.; Malin, J.; et al. American Society of Clinical Oncology clinical practice guideline: Update on adjuvant endocrine therapy for women with hormone receptor-positive breast cancer. J. Clin. Oncol. 2010, 28, 3784–3796. [Google Scholar] [CrossRef]
  102. Yang, Y.; Pan, W.; Tang, X.; Wu, S.; Sun, X. A meta-analysis of randomized controlled trials comparing the efficacy and safety of anastrozole versus tamoxifen for breast cancer. Oncotarget 2017, 8, 48362–48374. [Google Scholar] [CrossRef]
  103. Lum, D.W.; Perel, P.; Hingorani, A.D.; Holmes, M.V. CYP2D6 genotype and tamoxifen response for breast cancer: A systematic review and meta-analysis. PLoS ONE 2013, 8, e76648. [Google Scholar] [CrossRef]
  104. Tamura, K.; Imamura, C.K.; Takano, T.; Saji, S.; Yamanaka, T.; Yonemori, K.; Takahashi, M.; Tsurutani, J.; Nishimura, R.; Sato, K.; et al. CYP2D6 Genotype-Guided Tamoxifen Dosing in Hormone Receptor-Positive Metastatic Breast Cancer (TARGET-1): A Randomized, Open-Label, Phase II Study. J. Clin. Oncol. 2020, 38, 558–566. [Google Scholar] [CrossRef]
  105. Schroth, W.; Goetz, M.P.; Hamann, U.; Fasching, P.A.; Schmidt, M.; Winter, S.; Fritz, P.; Simon, W.; Suman, V.J.; Ames, M.M.; et al. Association between CYP2D6 polymorphisms and outcomes among women with early stage breast cancer treated with tamoxifen. JAMA 2009, 302, 1429–1436. [Google Scholar] [CrossRef]
  106. Eisen, A.; Trudeau, M.; Shelley, W.; Messersmith, H.; Pritchard, K.I. Aromatase inhibitors in adjuvant therapy for hormone receptor positive breast cancer: A systematic review. Cancer Treat. Rev. 2008, 34, 157–174. [Google Scholar] [CrossRef]
  107. Mokbel, R.; Karat, I.; Mokbel, K. Adjuvant endocrine therapy for postmenopausal breast cancer in the era of aromatase inhibitors: An update. Int. Semin. Surg. Oncol. 2006, 3, 31. [Google Scholar] [CrossRef]
  108. Goss, P.E.; Smith, R.E. Letrozole for the management of breast cancer. Expert Rev. Anticancer Ther. 2002, 2, 249–260. [Google Scholar] [CrossRef]
  109. Smith, I.; Yardley, D.; Burris, H.; De Boer, R.; Amadori, D.; McIntyre, K.; Ejlertsen, B.; Gnant, M.; Jonat, W.; Pritchard, K.I.; et al. Comparative Efficacy and Safety of Adjuvant Letrozole Versus Anastrozole in Postmenopausal Patients With Hormone Receptor-Positive, Node-Positive Early Breast Cancer: Final Results of the Randomized Phase III Femara Versus Anastrozole Clinical Evaluation (FACE) Trial. J. Clin. Oncol. 2017, 35, 1041–1048. [Google Scholar] [CrossRef]
  110. Meinhardt, U.; Mullis, P.E. The aromatase cytochrome P-450 and its clinical impact. Horm. Res. 2002, 57, 145–152. [Google Scholar] [CrossRef]
  111. Santen, R.J.; Harvey, H.A. Use of aromatase inhibitors in breast carcinoma. Endocr. Relat. Cancer 1999, 6, 75–92. [Google Scholar] [CrossRef]
  112. Bhatnagar, A.S. The discovery and mechanism of action of letrozole. Breast Cancer Res. Treat. 2007, 105 (Suppl. S1), 7–17. [Google Scholar] [CrossRef]
  113. Yang, W.H.; Hammes, S.R. Xenopus laevis CYP17 regulates androgen biosynthesis independent of the cofactor cytochrome b5. J. Biol. Chem. 2005, 280, 10196–10201. [Google Scholar] [CrossRef]
  114. Harshman, L.C.; Taplin, M.E. Abiraterone acetate: Targeting persistent androgen dependence in castration-resistant prostate cancer. Adv. Ther. 2013, 30, 727–747. [Google Scholar] [CrossRef]
  115. Chan, C.W.H.; Law, B.M.H.; So, W.K.W.; Chow, K.M.; Waye, M.M.Y. Pharmacogenomics of breast cancer: Highlighting CYP2D6 and tamoxifen. J. Cancer Res. Clin. Oncol. 2020, 146, 1395–1404. [Google Scholar] [CrossRef]
  116. NGR-Oncology. Recently Activated! NRG-BR007: The DEBRA Trial. Available online: https://www.nrgoncology.org/Home/News/Post/NRG-BR007-The-DEBRA-Trial (accessed on 24 June 2025).
  117. NIH. De-Escalation of Breast Radiation Trial for Hormone Sensitive, HER-2 Negative, Oncotype Recurrence Score Less Than or Equal to 18 Breast Cancer (DEBRA) (DEBRA). National Library of Medicine: National Center for Biotechnology Information. Available online: https://clinicaltrials.gov/study/NCT04852887?utm_source= (accessed on 24 June 2025).
  118. Vanderbilt-Ingram. Clinical Trials Search at Vanderbilt-Ingram Cancer Center. Vanderbilt University Medical Center. Available online: https://vicc.org/clinical-trials/protocol-nrgbrebr007?utm_source= (accessed on 24 June 2025).
  119. SWOG. LoTam: A Randomized, Phase III Clinical Trial of Low-Dose Tamoxifen for Selected Patients with Molecular Low-Risk Early-Stage Breast Cancer. SWOG Cancer Research Network. Available online: https://www.swog.org/clinical-trials/ctsu-a012301?utm_source= (accessed on 24 June 2025).
  120. MedPath. Tamoxifen: Clinical Trials. Available online: https://trial.medpath.com/drug/26419669936bcbf8?utm_source= (accessed on 24 June 2025).
  121. Hamilton, E.P.; Loibl, S.; Bachelot, T.; Gnant, M.; Niikura, N.; Park, Y.H.; Tolaney, S.M.; Pistilli, B.; Rastogi, P.; Saini, K.S.; et al. CAMBRIA-1 & CAMBRIA-2 phase III trials: Camizestrant versus standard endocrine therapy in ER+/HER2- early breast cancer. Future Oncol. 2025, 21, 795–806. [Google Scholar] [CrossRef]
  122. AstraZeneca. An Adjuvant Endocrine-Based Therapy Study of Camizestrant (AZD9833) in ER+/HER2- Early Breast Cancer (CAMBRIA-2)—CAMBRIA-2. Available online: https://www.astrazenecaclinicaltrials.com/study/D8535C00001/?utm_source= (accessed on 24 June 2025).
  123. Ahmed, J.H.; Makonnen, E.; Fotoohi, A.; Aseffa, A.; Howe, R.; Aklillu, E. CYP2D6 Genotype Predicts Plasma Concentrations of Tamoxifen Metabolites in Ethiopian Breast Cancer Patients. Cancers 2019, 11, 1353. [Google Scholar] [CrossRef]
  124. Ferraldeschi, R.; Newman, W.G. The Impact of CYP2D6 Genotyping on Tamoxifen Treatment. Pharmaceuticals 2010, 3, 1122–1138. [Google Scholar] [CrossRef]
  125. Mulder, T.A.M.; de With, M.; Del Re, M.; Danesi, R.; Mathijssen, R.H.J.; van Schaik, R.H.N. Clinical CYP2D6 Genotyping to Personalize Adjuvant Tamoxifen Treatment in ER-Positive Breast Cancer Patients: Current Status of a Controversy. Cancers 2021, 13, 771. [Google Scholar] [CrossRef]
  126. Campos, S.M. Aromatase inhibitors for breast cancer in postmenopausal women. Oncologist 2004, 9, 126–136. [Google Scholar] [CrossRef]
  127. Riemsma, R.; Forbes, C.A.; Kessels, A.; Lykopoulos, K.; Amonkar, M.M.; Rea, D.W.; Kleijnen, J. Systematic review of aromatase inhibitors in the first-line treatment for hormone sensitive advanced or metastatic breast cancer. Breast Cancer Res. Treat. 2010, 123, 9–24. [Google Scholar] [CrossRef]
Figure 1. The box plots show the distribution of (A) Cytochrome P450 family 4 subfamily B member 1 (CYP4B1), (B) Cytochrome P450 family 4 subfamily F member 12 (CYP4F12), and (C) Cytochrome P450 family 4 subfamily F member 3 (CYP4F3) gene expression levels in normal (n = 112) and tumor (n = 1093) tissue in breast cancer; data retrieved from TIMER2.0 dataset [49], http://timer.cistrome.org/, accessed 1 August 2024. Red denotes tumor tissue and blue normal tissue. Wilcoxon test: *** p < 0.001. Abbreviations: 1: Breast cancer tumor (n = 1093); 2: normal tissue (n = 112); 3: basal subtype (n = 190); 4: Her2 subtype (n = 82); 5: luminal A subtype (n = 564); 6: luminal B subtype (n = 217).
Biology 14 00812 g001
Figure 2. Gene expression levels of (A) the cytochrome P450 family 4 subfamily B member 1 (CYP4B1), (B) the Cytochrome P450 family 4 subfamily F member 12 (CYP4F12), and (C) the Cytochrome P450 family 4 subfamily F member 3 (CYP4F3) across different breast cancer stages, such as stage 1 (n = 183), stage 2 (n = 615), stage 3 (n = 247), and stage 4 (n = 20), including normal tissue (n = 114) for reference; data provided by UALCAN dataset [50], accessed 12 November 2024. (** p < 0.01, *** p < 0.001).
Biology 14 00812 g002
Figure 3. Table (a) depicts the cytochrome P450 family 4 subfamily B member 1 (CYP4B1) expression levels in several breast cancer subtypes, such as basal, Her2, Luminal A, and Luminal B. Red color shows a significant (Spearman’s, p < 0.05) positive correlation, blue denotes a significant (Spearman’s, p < 0.05) negative one, and gray indicates a non-significant correlation. (b) The scatter plot graphs show the associations between CYP4B1 and BRCA1, BRCA2, and ESR1 gene expression levels in the Basal subtype. These plots depict linear regression lines and correlation coefficients (ρ) for every gene. The linear regression fit is represented by the blue lines that indicate the relationship between CYP4B1 and BRCA1, BRCA2, and ESR1 gene expression levels. The gray area surrounding the regression line represents the confidence interval. The correlation analysis for each box is shown in red in the upper right corner. The statistical significance (Spearman, p < 0.05) was determined using the TIMER2.0 web server [49], accessed on 1 August 2024.
Biology 14 00812 g003
Figure 4. Table (a) shows the cytochrome P450 family 4 subfamily F member 12 (CYP4F12) expression in several breast cancer subtypes, such as basal, Her2, Luminal A, and Luminal B. Red color shows a significant (Spearman’s, p < 0.05) positive correlation, blue denotes a significant (Spearman’s, p < 0.05) negative one, and gray indicates a non-significant correlation. (b) Scatter plots indicate the associations between CYP4F12 gene expression and BRCA1, BRCA2, and ESR1 expression levels in several breast cancer subtypes. These plots show linear regression lines and correlation coefficients (ρ) for every gene. The linear regression fit is represented by the blue lines, which indicate the relationship between CYP4F12 expression and BRCA1, BRCA2, and ESR1 expression levels, whereas the gray area surrounding the regression line depicts the confidence interval. The correlation analysis for each box is shown in red in the upper right corner. The statistical significance (Spearman, p < 0.05) was determined using the TIMER2.0 dataset [49], accessed on 1 August 2024.
Biology 14 00812 g004
Figure 5. Table (a) shows the Cytochrome P450 family 4 subfamily F member 3 (CYP4F3) expression in breast cancer subtypes, such as basal, Her2, Luminal A, and Luminal B. Red color shows a significant (Spearman’s, p < 0.05) positive correlation and gray indicates a non-significant one. (b) Representative scatter plots showing the associations between CYP4F3 and BRCA1, BRCA2, and ESR1 gene expression levels in breast cancer subtypes. These plots depict linear regression lines and correlation coefficients (ρ) for every gene. The linear regression fit is represented by blue lines, which indicate the relationship between CYP4F3 and BRCA1, BRCA2, and ESR1 gene expression levels, whereas the gray area surrounding the regression line depicts the confidence interval. The correlation analysis for each box is shown in red in the upper right corner. The statistical significance (Spearman, p < 0.05) was determined using the TIMER2.0 dataset [49], accessed on 1 August 2024.
Biology 14 00812 g005
Figure 6. Gene expression and estrogen receptor status of (A) Cytochrome P450 family 4 subfamily B member 1 (CYP4B1), (B) Cytochrome P450 family 4 subfamily F member 12 (CYP4F12), and (C) Cytochrome P450 family 4 subfamily F member 3 (CYP4F3) in breast invasive carcinoma stratified by nature2012. Data were extracted from the University of California, Santa Cruz, UCSC Xena functional genomics explorer [51], accessed on 1 August 2024.
Biology 14 00812 g006
Figure 7. (A) Heatmap table depicting the normalized coefficient of the P450 family 4 subfamily B member 1 (CYP4B1), the cytochrome P450 family 4 subfamily F member 12 (CYP4F12), and the cytochrome P450 family 4 subfamily F member 3 (CYP4F3) expression levels in the Cox model, adjusted by clinical stage factor in breast cancer. The red color denotes a statistically significant increased risk (Z-score, p < 0.05), the blue color indicates a statistically significant decreased risk (Z-score, p < 0.05), and gray denotes a non-significant result. Representative Kaplan–Meier graphs display (B) CYP4B1 in the Luminal B subtype, (C) CYP4F12 in the Luminal A breast cancer subtype, and (D) CYP4B1, CYP4F12, and CYP4F3 expression levels in all breast cancers. Patients were categorized into high- or low-expression groups. Red indicates high expression levels and blue indicates low expression levels. The group cutoff was set to the median with a cutoff-high and cutoff-low at 50% and a 95% confidence interval. Data retrieved from TIMER2.0 [49] web server, accessed 1 August 2024.
Biology 14 00812 g007
Figure 8. Table (A) shows the correlation between estrogen receptor alpha (ESR1) gene expression levels and the cytochrome P450 family 4 subfamily B member 1 (CYP4B1), the cytochrome P450 family 4 subfamily F member 12 (CYP4F12), and the Cytochrome P450 family 4 subfamily F member 3 (CYP4F3) expression in several types of cancer. Red color denotes a significant (Spearman’s, p < 0.05) positive correlation, blue denotes a significant (Spearman’s, p < 0.05) negative correlation, and gray indicates a non-significant one. (BD) Representative scatter plots showing the significant associations between ESR1 gene expression levels and CYP4B1, CYP4F12, and CYP4F3 in several cancer types. These plots depict linear regression lines and correlation coefficients (ρ) for every gene. The linear regression fit is represented by blue lines, which indicate the relationship between the corresponding CYP and ESR1 gene expression levels, while the gray area surrounding the regression line depicts the confidence interval. The correlation analysis for each box is shown in red in the upper right corner. The statistical significance (Spearman, p < 0.05) was determined using the TIMER2.0 dataset [49], accessed on 1 August 2024. Abbreviations: ACC: adrenocortical carcinoma; BLCA: bladder urothelial carcinoma; CESC: cervical and endocervical cancer; COAD: colon adenocarcinoma; ESCA: esophageal carcinoma; LUAD: lung adenocarcinoma; LUSC: lung squamous cell carcinoma; OV: ovarian serous cystadenocarcinoma; PRAD: prostate adenocarcinoma; READ: rectum adenocarcinoma; STAD: stomach adenocarcinoma; UCEC: uterine corpus endometrial carcinoma.
Biology 14 00812 g008
Figure 9. (A) Cytochrome P450 family 4 subfamily B member 1 (CYP4B1), (B) Cytochrome P450 family 4 subfamily F member 12 (CYP4F12), and (C) Cytochrome P450 family 4 subfamily F member 3 (CYP4F3) gene expression levels in normal and tumor tissue in pan cancer; data retrieved from TIMER2.0 dataset [49], http://timer.cistrome.org/, accessed 1 August 2024. Red denotes tumor tissue and blue denotes normal tissue. Wilcoxon test: * p < 0.05, ** p < 0.01, *** p < 0.001. Abbreviations: ACC: adrenocortical carcinoma; BLCA: bladder urothelial carcinoma; CESC: cervical and endocervical cancer; COAD: colon adenocarcinoma; ESCA: esophageal carcinoma; LUAD: lung adenocarcinoma; LUSC: lung squamous cell carcinoma; OV: ovarian serous cystadenocarcinoma; PRAD: prostate adenocarcinoma; READ: rectum adenocarcinoma; STAD: stomach adenocarcinoma; UCEC: uterine corpus endometrial carcinoma.
Biology 14 00812 g009
Figure 10. Overall survival in pan-cancer. (A) Heatmap table showing the normalized coefficient of P450 family 4 subfamily B member 1 (CYP4B1), cytochrome P450 family 4 subfamily F member 12 (CYP4F12), and cytochrome P450 family 4 subfamily F member 3 (CYP4F3) expression levels in the Cox model, adjusted by clinical factors such as the stage of adrenocortical carcinoma (AAC), bladder urothelial carcinoma (BLCA), cervical and endocervical cancer (CESC), colon adenocarcinoma (COAD), esophageal carcinoma (ESCA), lung adenocarcinoma (LUAD), lung squamous cell carcinoma (LUSC), ovarian serous cystadenocarcinoma, prostate adenocarcinoma (PRAD), rectum adenocarcinoma (READ), stomach adenocarcinoma (STAD), and uterine corpus endometrial carcinoma (UCEC). The red color indicates a statistically significant increased risk (Z-score, p < 0.05), the blue color indicates a statistically significant decreased risk (Z-score, p < 0.05), and gray denotes a non-significant result. Representative Kaplan–Meier graphs displaying (B) CYP4B1, (C) CYP4F12, and (D) CYP4F3 expression levels in several cancers. Patients were categorized into high- or low-expression groups; red indicates high expression levels and blue indicates low expression levels. The hazard ratio and the log-rank p-value are indicated. The group cutoff was set to the median with a cutoff-high and cutoff-low at 50% and a 95% confidence interval. Data were retrieved from the TIMER2.0 dataset [49].
Biology 14 00812 g010
Disclaimer/Publisher’s Note: The statements, opinions and data contained in all publications are solely those of the individual author(s) and contributor(s) and not of MDPI and/or the editor(s). MDPI and/or the editor(s) disclaim responsibility for any injury to people or property resulting from any ideas, methods, instructions or products referred to in the content.

