1. Introduction
Automotive lightweighting is a central strategy for improving energy efficiency and reducing use-phase emissions. This has accelerated the substitution of conventional metals with fiber-reinforced polymers (FRPs), particularly carbon-fiber and glass-fiber composites, in structural and high-performance transport components [
1]. In parallel, the sector is exploring renewable reinforcements to reduce the environmental burden, with natural-fiber composites (NFCs) increasingly considered for automotive applications [
2] and hybrid concepts proposed to balance performance, cost, and sustainability [
3].
Reliable comparisons between candidate chassis materials require standardized mechanical characterization. For laminate bending-dominated components, three-point flexural testing is commonly reported using ISO 14125 [
4], while tensile testing of the orthotropic FRPs is governed by ISO 527-4 [
5]. Within this context, NCFs are of particular interest because their low fiber waviness and efficient load transfer offer mechanical advantages over conventional woven reinforcements, making biaxial NCF laminates attractive for parts subjected to combined in-plane and bending loads [
6]. Processing remains a key lever as post-curing can significantly change the matrix cross-linking and fiber–matrix bonding, thereby shifting the stiffness and strength [
7].
Sustainability-driven reinforcement choices introduce additional trade-offs. Flax-based composites are among the more promising natural-fiber systems, with mechanical properties that can be improved through fiber development and appropriate composite design [
8]. However, their variability and moisture sensitivity often limit structural deployment; consequently, surface-modification routes are widely used to improve interfacial adhesion and mitigate durability issues [
9]. Comprehensive assessments of the flax fibers and their polymer composites emphasize both opportunities and limitations for load-bearing use, reinforcing the need for architecture- and process-specific datasets [
10].
For biaxial NCFs specifically, manufacturing-related deformation and formability can influence defect formation and final properties, so understanding the preform deformability is important when targeting the chassis geometries [
11]. Modeling work on biaxial NCF composites further underlines the role of architecture in the governing mechanical response, motivating systematic experimental validation across fiber types [
12].
Finally, advanced measurement techniques can reduce the uncertainty in reported strain and failure modes. DIC provides full-field deformation maps and supports robust extraction of the strain components and Poisson’s ratio, complementing machine readings in composite testing [
13,
14,
15]. Looking ahead, sustainable adoption also depends on end-of-life routes and circularity recycling technologies for FRPs are an active area, while bio-based resin systems and data-driven modeling/optimization are emerging enablers for greener composite design and manufacturing [
16,
17,
18].
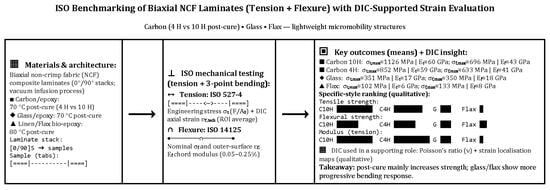
This article presents an extended version of our earlier work on biaxial NCF composites for two-wheeled EV chassis [
19]. In the present study, all tensile and flexural tests were repeated, and all properties were recalculated directly from raw machine data within a consistent ISO-based framework. In addition to the updated property values, the work provides full tensile and flexural stress–strain curves; repeatability across 4–5 specimens for each laminate type (typically 5); and DIC-supported evaluation of the axial and transverse strain to improve the reproducibility of the modulus and Poisson’s ratio determination. The main aim is to establish a more robust benchmark for comparing carbon-, glass-, and flax-based biaxial NCF laminates for lightweight mobility structures. The results show that the carbon/epoxy laminates provide the highest stiffness and strength; that post-curing duration significantly affects performance; that glass-fiber laminates offer intermediate structural capability; and that flax laminates, although less resistant, remain attractive for compliant or less critical zones.
Beyond improved repeatability and DIC-supported strain evaluation, the novelty of the present study lies in the unified ISO-based reprocessing of the full tensile and flexural dataset from raw machine data, the inclusion of complete stress–strain responses rather than only scalar properties, and the integration of laminate-quality indicators (density, Tg, and apparent ILSS) into a single comparative benchmark across carbon-, glass-, and flax-based biaxial NCF laminates.
2. Materials and Methods
2.1. Materials
Three biaxial NCFs were investigated: carbon-fiber, glass-fiber, and flax-fiber reinforcements. The NCF architecture was selected due to its low fiber waviness and efficient load transfer compared with woven reinforcements, which are beneficial for structural laminates subjected to the combined in-plane and bending loads [
6]. Reinforcements were sourced from industrial suppliers, and nominal properties (including fiber density, areal weight, and recommended processing windows) were taken from supplier datasheets.
Two epoxy systems were employed to enable comparison between conventional synthetic composites and a lower-impact alternative. Commercial carbon-fiber (CBX 300) and glass-fiber (EBX 300) biaxial reinforcements were combined with a fully synthetic epoxy system (Biresin
® CR83 + Biresin
® CH83-2), while flax (X-F-422 g/m
2, 1270 mm width) biaxial laminates used a bio-based epoxy system (SR InfuGreen 810 + SD8824). The reinforcement–matrix pairings are summarized in
Table 1.
CBX 300 and EBX 300 biaxial reinforcements were supplied by Rebelco, Lda. (Adroana, Portugal), while the flax biaxial NCF X-F-422 was supplied by SAERTEX France SAS (Arandon-Passins, France). The synthetic epoxy system Biresin® CR83 + Biresin® CH83-2 is manufactured by Sika Deutschland GmbH (Stuttgart, Germany), whereas the bio-based system SR InfuGreen 810 + SD8824 is manufactured by Sicomin SAS (Châteauneuf-les-Martigues, France).
The carbon fabric used Toray T700SC fibers (typical tensile strength ≈ 4900 MPa, tensile modulus ≈ 230 GPa, density ≈ 1.80 g·cm−3) (Toray Industries, Inc., Tokyo, Japan; typical tensile strength ≈ 4900 MPa, tensile modulus ≈ 230 GPa, density ≈ 1.80 g·cm−3), while the glass fabric used E-glass fibers according to the supplier datasheet (typical tensile strength ≈ 2500 MPa, tensile modulus ≈ 74 GPa, density ≈ 2.54 g·cm−3). The flax textile supplier datasheet reports the laminate architecture and textile characteristics (±45° flax layers of 204 g·m−2 each, total areal weight 422 g·m−2, nominal width 1270 mm) rather than a directly comparable single-fiber property set. The flax NCF also includes very light 0°/90° E-glass stabilizing layers and synthetic stitching, which are used for textile handling and form stability during processing.
The resin systems were selected because both are low-viscosity infusion-grade epoxies suitable for vacuum-assisted processing while also allowing comparison between a conventional synthetic route (Biresin® CR83 + CH83-2) and a lower-impact bio-based route (SR InfuGreen 810 + SD8824) for the natural-fiber laminates.
2.2. Laminate Design and Manufacturing
Laminates were designed as symmetric stacks (S) and manufactured in both [0°/90°] and [±45°] configurations (
Table 2), depending on specimen extraction requirements. The 0° direction was defined as the fabric roll direction (stitch direction). Samples were cut with their longitudinal axis aligned to the relevant laminate principal direction.
The nominal [0°/90°]nS and [±45°]nS lay-ups were selected as balanced and symmetric laminate families for the specimen extraction in the broader mechanical characterization campaign while also remaining consistent with the 0°/90°/±45° orientation family used in the chassis-oriented laminate definition and optimization work of the MariaBike project. No fixed numerical fiber-volume-fraction target was imposed by closed-loop process control during vacuum infusion; instead, laminate architecture, ply count, nominal ply thickness, and vacuum compaction defined the intended laminate structure, while achieved constituent fractions were measured after manufacture for the synthetic laminates.
Composite panels were produced by a vacuum infusion (VI) process. A mold release agent was applied, dry reinforcements were laid up with peel-ply and flow media, and the layup was sealed using a vacuum bag. The resin and hardener were mixed and degassed prior to infusion. The infusion was driven by the pressure differential between the atmospheric inlet pressure and an outlet vacuum maintained at approximately 0.4 bar absolute during infusion. The laminates were cured at room temperature for 24 h before demolding. The panel sizes, ply thickness, number of plies, lay-up (stacking sequence), and number of panels produced are listed in
Table 2, and an example of a carbon NCF composite laminate is shown in
Figure 1.
2.3. Post-Curing and Specimen Preparation
To quantify the influence of the cure schedule on the mechanical response, carbon composite laminates (C) were post-cured at 70 °C for either 4 h (C4H) or 10 h (C10H). Glass composites (G) were post-cured at 70 °C for 10 h, and flax composites (L) at 80 °C for 8 h. The heating rate was ~0.2 °C/min; cooling was not actively controlled. Steel plates were placed on top of panels during cooling to minimize distortions. Post-curing is known to affect matrix cross-linking and fiber–matrix bonding, with measurable impact on stiffness and strength [
7]. The applied post-cure cycles for each type of composite material are summarized in
Table 3. The post-cure cycles reported in
Table 3 correspond to the nominal programmed set points used in the present campaign. “N.C.” denotes natural cooling under laboratory ambient conditions, with steel plates placed on top of the laminates to limit distortion during cooling.
The carbon 4 h and 10 h conditions were included to probe cure-duration sensitivity in the primary structural candidate material, whereas the glass and flax laminates were manufactured using the project-selected cure schedules for their respective resin systems. For the flax system, the 80 °C/8 h schedule is consistent with the manufacturer’s recommended curing options for SR InfuGreen 810/SD8824.
After post-curing, specimens were cut using a table circular saw for subsequent tensile and flexural characterizations, according to the relevant ISO standard in each case. For tensile testing, all end tabs were bonded to commercial glass-fiber end tabs to reduce stress concentrations at the grips and improve load transfer into the gauge section of the mechanical testing machine.
All flax samples were tested in laboratory ambient conditions without dedicated moisture pre-conditioning or humidity control; because moisture is known to affect NFC stiffness and strength, the flax results should be interpreted as representative of an uncontrolled ambient moisture state, i.e., as-tested values that may be sensitive to environmental humidity [
20].
Accordingly, the flax data reported in this study should be interpreted as representative of an uncontrolled ambient state rather than of a moisture-conditioned reference condition. This limits strict quantitative comparison with literature datasets obtained under controlled conditioning or humidity equilibration.
All mechanical tests were performed at laboratory ambient conditions (temperature and relative humidity not controlled), unless otherwise stated.
2.4. Tensile Testing
Tensile tests were performed on a Shimadzu
® AG-100 kN machine (Shimadzu Corporation, Kyoto, Japan) equipped with a 100 kN load cell and a GOM
® ARAMIS
® 3D 5M optical system. Full-field surface strains were obtained by stereo DIC using a calibrated camera setup and speckle pattern [
13,
14,
15]. In this study, DIC was used to support strain-based property extraction (e.g., tensile modulus and Poisson’s ratio) and to document strain localization prior to rupture, while stress and strength values were calculated from the force signal and specimen geometry following the ISO definitions.
For each composite laminate family, several specimens were tested per loading mode, and the Results section reports the corresponding mean values. The exact sample size (
n), standard deviation (SD), and coefficient of variation (COV) for all tensile properties are reported in
Supplementary Table S1, while specimen-level tensile scalar outputs are reported in
Supplementary Table S2. The rectangular specimens used for the tensile tests measured the nominal dimensions of 250 ± 3 mm total length, a 150 mm gauge length, and 25 ± 2 mm width. The thickness of each specimen was measured individually in the gauge section and used in the corresponding stress calculations.
For stress calculations, the initial width b0 and thickness t0 were measured in the gauge section at multiple positions and averaged to compute A0 = b0t0. All tests were conducted at 2 mm/min and captured at least 100 images per specimen. The main DIC (GOM ARAMIS) processing parameters (facet/subset size, point distance/step, and strain filtering) were kept constant across all tensile tests; the complete ARAMIS project settings can be provided upon reasonable request to support reproducibility.
Engineering tensile stress was computed from the recorded machine force F and the specimen’s initial cross-sectional area of the parallel section A0, with A0 = b0t0 (where b0 is the initial width and t0 the initial thickness). The strains used to construct the 1D uniaxial σ–ε response were obtained from DIC (ARAMIS) as technical (engineering) strains, spatially averaged over the selected region of interest (ROI) within the gauge section (≈the DIC measurement zone).
The axial technical strain in the loading direction, εY,tech, was used as the tensile strain, while the transverse technical strain, εX,tech, was used for Poisson’s ratio evaluation. The major principal technical strain was employed only for the qualitative full-field visualization and for assessing strain localization/damage onset; it was not used to define the uniaxial stress–strain curve.
Based on the engineering stress and DIC technical strains defined above, the following tensile properties were extracted: tensile strength
σt,max, tensile modulus
Eₜ, Poisson’s ratio
ν, and axial strain at break
εY,tech,break. The tensile strength was taken as the maximum engineering stress and computed from the maximum recorded force
Fmax and the initial area
A0:
The tensile modulus was evaluated on the
σt–εY,tech curve as the ISO chord modulus between the prescribed axial strain limits ε
1 = 0.05% (0.0005) and ε
2 = 0.25% (0.0025), i.e.,
where
σ1 and
σ2 are the stresses corresponding to
ε1 and
ε2, respectively.
Poisson’s ratio was obtained from DIC by linear regression of
−εX,tech versus
εY,tech, yielding
The regression interval was selected within the linear-elastic regime, intentionally beyond the very small-strain modulus window (to reduce resolution sensitivity) and prior to any detectable nonlinearity or strain localization, which was verified qualitatively from the full-field strain maps.
Finally, the tensile strain at rupture was reported as the axial DIC technical strain measured at specimen failure:
where
εt,break is the tensile strain at rupture and
εY,tech,break is the axial engineering strain in the loading direction at the instant of failure. When reported as a percentage, the value is given as 100·
εt,break.
2.5. Flexural Testing
Flexural properties were characterized by three-point bending on a Shimadzu® AGS-X-10 kN universal testing machine equipped with a 10 kN load cell and an ISO 14125-compliant fixture (loading nose radius R1 = 5 ± 0.2 mm; support radii R2 = 2 ± 0.2 mm). The specimens had nominal dimensions of 100 ± 0.5 mm in length and 15 ± 1 mm in width, while the thickness was measured individually for each specimen. The support span was L = 80 mm. During testing, the machine recorded the load and mid-span deflection, from which the nominal flexural stress, strain, and modulus were determined using the ISO 14125 Method A relations.
The nominal flexural stress σf and nominal outer-surface flexural strain εf were then computed from F, L, b, h, and s using the ISO 14125 Method A relations; the flexural modulus Ef was evaluated as the standard chord modulus in the initial linear region between the prescribed nominal strain levels εf’ = 0.0005 and εf’’ = 0.0025 (0.05–0.25%). In the exported machine results, the standard-consistent quantities correspond as follows: Sfb = maximum flexural stress (i.e., σf,max, flexural strength), s = mid-span deflection, εf = flexural strain, and Ef = flexural modulus. All specimens were tested at a constant crosshead speed of 5 mm/min.
From each flexural test, the following quantities were extracted and analyzed using the definitions above: flexural strength σf,max, flexural modulus Ef, deflection at break (or maximum deflection at rupture) sB, and flexural strain at break (or deformation at rupture) εf,break.
The flexural strength was taken as the maximum nominal flexural stress and computed from the maximum recorded load
Fmax and specimen geometry:
The flexural modulus was determined as the standard chord modulus between
εf’ = 0.0005 and
εf’’ = 0.0025, either from the stress–strain chord slope:
or, equivalently, from the chord slope of the load–deflection curve:
where
m =
(F″ −
F′)/(
s″ −
s′) is the slope of the
F–
s curve evaluated between the two deflection levels
s′ and
s″, corresponding to
εf′ and
εf″ (via the standard relation between the strain and mid-span deflection).
The flexural strain at break was computed as the nominal outer-surface strain at mid-span at the instant of rupture:
where
εf,break is the flexural strain at break,
h is the specimen thickness,
sB is the mid-span deflection at rupture, and
L is the support span. When reported as a percentage, the value is given as 100·
εf,break.
2.6. Physical and Interlaminar Characterization
To ensure the prepared composite laminates met the expected standards and to support the interpretation of the observed mechanical trends, panel density, constituent fractions (synthetic laminates only), glass transition temperature, and interlaminar shear strength were also evaluated, using the appropriate and established standard procedures in each case.
The density of the various composite laminates was measured in accordance with ISO 1183-1 [
21], using the immersion (buoyancy) method. The fiber, matrix, and void fractions were determined via calcination-based procedures for carbon and glass laminates, following the ISO 1172 [
22] standard. This method was not applicable to flax laminates, and therefore flax fiber, matrix, and void fractions are not reported. The mean density values and the fiber, matrix, and void fractions were measured using three samples per laminate (each with mass > 2 g).
The DSC (differential scanning calorimetry) technique was used to accurately determine the thermal properties of the composites and to confirm the post-cure state through
Tg (glass transition temperature) measurements (heating from 20 °C to 140 °C with 10 °C/min, under a nitrogen flow rate of 50 mL/min). This was carried out using a Q20 model calorimeter from TA Instruments
®(New Castle, DE, USA), following ISO 11357-2 [
23].
Interlaminar shear strength (ILSS) tests were also performed, following the ISO 14130 [
24] standard. These tests used small beam specimens with a span-to-depth ratio of 5:1, subjected to three-point bending. For the flax fiber-based specimens, a ratio of approximately 3:1 was necessary to achieve a valid short-beam failure mode; consequently, the flax ILSS values are used only as supportive indicators of interlaminar sensitivity and not as directly comparable pure-shear quantities relative to the synthetic laminates tested at ≈5:1. These tests were conducted on an Instron 5900R(Instron, Norwood, MA, USA), using a crosshead speed of 1 mm/min.
The specimens measured 20 mm × 10 mm × (2 to 3.5) mm, ensuring a comprehensive evaluation of the interlaminar shear properties. Since the fiber orientation and distribution in the material do not differ significantly between the two principal directions, the test specimens were taken in the two directions, according to the standard. The short-beam specimens were extracted in the two principal laminate directions, as illustrated in
Figure 2.
Because short-beam testing can be influenced by non-uniform stress states and mixed failure modes, the reported ILSS values are treated here as the
apparent interlaminar shear resistance for comparative ranking between laminates, rather than as a pure shear material constant [
25]. Accordingly, the ILSS values reported here are used only as supportive laminate quality indicators and not as direct predictors of flexural strength or as intrinsic interlaminar material properties. Their interpretation must remain cautious because the short-beam response depends not only on the laminate architecture and interface quality but also on the mixed stress state and the adopted span-to-depth ratio.
DIC was applied in the tensile campaign because the main objective was robust strain-field measurement and strain-based property extraction, whereas the ILSS tests were used here as supportive short-beam indicators of interlaminar sensitivity and were not part of the same full-field optical analysis framework.
2.7. Software and Reproducibility
All graphs and plots were generated using OriginPro 8.5 (OriginLab Corporation, Northampton, MA, USA), and full-field strain maps were processed using GOM ARAMIS v5.3.0 (GOM GmbH, Braunschweig, Germany). Manufacturer technical details/datasheets for all fabrics, adhesives, and resins used are available upon request. Raw tensile source-data descriptors, specimen-level tensile and flexural scalar outputs, and the statistical summaries used in the present manuscript are reported in the
Supplementary Information. Additional project-level raw files remain available from the corresponding author upon reasonable request, subject to ongoing industrial R&D restrictions.
4. Discussion
Although the present tensile–flexural dataset provides a useful benchmark for material screening, it is not sufficient on its own for chassis-level structural design. For such applications, additional characterization of compressive behavior, in-plane/shear response, impact resistance, and fatigue/durability remains necessary before design allowables or component-level validation can be established.
The ordering seen in
Table 4 is consistent with the general motivation for using the carbon composites in lightweight mobility structures and for considering the natural-fiber systems when low density and reduced environmental burden are prioritized [
1,
2,
3,
29,
31]. For both carbon post-cure schedules, the mean density remained essentially unchanged between the 4 H and 10 H conditions for a given panel size, indicating that post-curing mainly affects the polymer network (and therefore mechanical performance) rather than the composite laminate mass/volume balance [
7].
Looking at the results from
Table 5, it is clear that for the synthetic composite laminates (carbon and glass), calcination-based measurements yielded fiber mass fractions W
fiber in a narrow range (≈67–70 wt.%) across materials and panel sizes, with complementary matrix mass fractions W
matrix ≈ 30–33 wt.%. When converted to volume fractions, the carbon composite laminates reached V
fiber ≈ 55–56 vol.%, whereas the glass composite laminates were slightly lower at V
fiber ≈ 49–51 vol.%, despite similar W
fiber values. This difference is expected because the fiber volume fraction depends on the relative densities of the fiber and matrix; for a similar fiber mass fraction, the higher density of the glass fibers results in a lower fiber volume fraction than carbon. In practical terms, the higher V
fiber in carbon composites is consistent with their higher stiffness potential, since fiber volume fraction is a primary driver of elastic properties in continuous-fiber FRPs [
6]. The calculated void volume fractions V
void were generally low to moderate for the synthetic systems, with the lowest values observed in the 300 × 300 mm panels (e.g., ≈1.1% for carbon 10H and ≈0% for the glass within the scatter), and the highest values occurring in the 300 × 150 mm panels (≈5–7%). The larger scatter reported for some V
void values reflects that void fraction is obtained as a residual term from density and constituent measurements, so small measurement uncertainties can propagate into V
void, especially when the true porosity is low. The observed panel-size sensitivity is plausible for VI laminates, where local flow paths, edge effects, and permeability variability can influence impregnation quality and entrapped air content [
6,
11]. For flax laminates, constituent fractions are not reported because the applied calcination approach is not suitable for reliably isolating flax fiber content under the same conditions used for the synthetic reinforcements.
The close agreement seen in
Table 6 indicates that the applied cure/post-cure schedules achieved the expected resin network state, improving confidence that the differences observed later in the mechanical response are primarily driven by the reinforcement type, architecture, and processing history rather than uncontrolled under-curing [
7]. Notably, the Carbon 10H system exhibited a slightly higher
Tg than the Carbon 4H, consistent with the general role of longer post-cure holds in increasing the degree of cure and cross-link density [
7].
The directional dependence from
Table 7 was evident for all systems, with τ
M values consistently lower in the 90° direction than in the 0° direction. Such anisotropy is expected in textile-based laminates, where differences in the fiber architecture, stitching/ply arrangement, and local resin-rich regions can influence the interlaminar stress state and the effective resistance to the shear-driven damage [
6,
29,
31]. Comparing the two post-cure schedules for carbon, τ
M in the 0° direction was essentially unchanged (≈44.5 vs. 44.7 MPa), whereas the 90° direction increased from ≈35.5 MPa (4H) to ≈39.6 MPa (10H). This suggests that extended post-curing may have preferentially improved the matrix-dominated and interface-sensitive components of interlaminar resistance for the less favorable loading direction, consistent with the known sensitivity of interfacial efficiency to cure state and matrix properties [
7]. For flax laminates, valid short-beam failures required a reduced span-to-depth ratio (≈3:1 instead of ≈5:1), and fewer valid specimens were obtained in the 90° direction (n = 2). This behavior is consistent with the higher compliance and greater variability typically reported for NFCs, where fiber/matrix adhesion, lumen structure, and moisture-related effects can limit interlaminar performance [
2,
9,
10,
30]. Because flax samples were not moisture-conditioned in this study, part of the observed compliance and interlaminar sensitivity may also reflect the uncontrolled moisture-related effects, which are widely reported to modify fiber/matrix adhesion and damage development in NFCs [
20]. For this reason, the flax results are best interpreted as screening-level comparative values for the as-tested state used here, rather than as directly transferable design-level properties or strictly comparable benchmarks against moisture-conditioned flax composite datasets. For the flax laminates specifically, the observed response should be interpreted in light of both the uncontrolled ambient state and the actual textile/processing route used in this work. Natural fibers can absorb moisture through their hydrophilic cell-wall structure, and moisture uptake may promote fiber swelling, weaken fiber–matrix adhesion, increase local stress concentrations at the interface, and contribute to earlier matrix cracking, debonding, fiber pull-out, and interlaminar damage. In addition, the SAERTEX X-F-422 reinforcement is a stitched biaxial flax NCF, consisting mainly of ±45° flax layers, with very light 0°/90° E-glass stabilizing layers and synthetic stitching. This architecture is intended to improve handling and form stability during vacuum infusion, but it may also introduce local heterogeneity through stitching points, tow/bundle crossovers, and resin-rich regions. In combination with the SR InfuGreen 810/SD8824 bio-epoxy system and the as-tested vacuum-infused laminate state, these features can affect resin wetting, compaction, interfacial stress transfer, and damage development. Since the specimen moisture content was not measured, no moisture correction or normalization was applied. Therefore, the lower stiffness/strength, lower apparent ILSS, broader strain localization, and more progressive deformation behavior of the flax laminates should be interpreted as the combined result of fiber type, stitched NCF architecture, natural-fiber moisture sensitivity, bio-epoxy matrix system, and the as-tested processing/exposure condition, rather than as a consequence of the fiber strength alone. Accordingly, the present study should be interpreted as a comparison of the candidate reinforcement–matrix laminate systems produced for a common application context, rather than as a single-variable study isolating the fiber type while keeping all other material parameters constant.
Overall,
Table 4,
Table 5,
Table 6 and
Table 7 indicate that the synthetic composite laminates achieved fiber volume fractions near ~50–56% with generally low porosity and
Tg values consistent with the intended cure state, providing a robust baseline for comparing tensile and flexural performance. The flax laminates achieved the expected low density and
Tg, but their lower apparent ILSS resistance (strength) to delamination highlights a weaker interlaminar shear resistance, which is relevant for interpreting bending-dominated failure modes and damage tolerance [
2,
9,
10]. This connection should be interpreted qualitatively rather than as a direct one-to-one relation, because the short-beam ILSS is obtained under a mixed stress state and, in the case of flax, under a different span-to-depth ratio than the synthetic laminates. For this reason, the ILSS results are used here to support discussion of interlaminar sensitivity and damage-proneness, not to provide a direct quantitative explanation of flexural performance. For the synthetic laminates, the comparison between carbon and glass systems reflects both reinforcement type and achieved laminate structure. Although both used the same Biresin
® CR83/CH83-2 epoxy system and were manufactured by the same VI route, the carbon laminates achieved higher fiber volume fractions (≈55–56 vol.%) than the glass laminates (≈49–51 vol.%), and carbon fibers have a much higher intrinsic tensile modulus than the E-glass fibers. These factors are consistent with the much higher tensile and flexural moduli measured for the carbon laminates. By contrast, the comparison between C4H and C10H is more directly related to the post-cure effects, because the reinforcement type, matrix system, laminate architecture, and measured density/fiber-fraction ranges are broadly similar. The limited change in tensile modulus between C4H and C10H therefore supports the interpretation that the initial elastic response is mainly fiber-dominated, whereas the higher tensile strength, higher flexural strength, slightly higher T
g, and improved apparent ILSS in the 90° direction for C10H indicate improved matrix/interface-sensitive load transfer after the longer post-cure.
Across all mechanical metrics from
Table 8 and
Figure 3, the carbon/epoxy laminates delivered the highest structural performance. Carbon 10H reached a tensile modulus
Et = 60 GPa and tensile strength
σt,max = 1126.25 MPa, together with a flexural modulus
Ef = 43 GPa and flexural strength
σf,max = 696 MPa. Carbon 4H remained similarly stiff in tension (
Et = 59 GPa) but exhibited a marked reduction in tensile strength (
σt,max = 852.40 MPa), mirrored by a smaller—yet still clear—decrease in the flexural metrics (
σf,max = 633 MPa;
Ef = 41 GPa). This “strength-sensitive/modulus-insensitive” response to post-curing is consistent with the general role of post-cure in increasing the matrix cross-link density and improving fiber–matrix interfacial efficiency (thereby delaying damage initiation and enhancing ultimate load transfer), while the initial elastic stiffness remains largely fiber-dominated in continuous-fiber laminates [
7]. The trend is also coherent with the physical and interlaminar data sets presented earlier: Carbon 4H and Carbon 10H have very similar laminate densities (
Table 4) and broadly comparable constituent fractions, while Carbon 10H shows a slightly higher
Tg and a higher apparent ILSS in the 90° direction, supporting the interpretation that the main mechanical gain is associated with cure state/interlaminar integrity rather than gross density or fiber fraction differences [
6,
7].
The glass laminates provide an intermediate performance baseline that is often targeted in mobility structures when carbon is not economically justified, balancing stiffness/strength against cost [
1]. In
Table 8, the glass system reached
σt,max = 351 MPa and
Et = 17 GPa in tension and
σf,max = 350 MPa and
Ef = 18 GPa in bending. The flax laminates showed the lowest stiffness and strength (
Et = 6 GPa;
σt,max = 102 MPa) yet retained notable deformation capacity, reaching an axial tensile strain at break
εY,tech,break = 2.025% and an even higher flexural strain at break
εf,break = 3.7332% (
Table 8). This positioning agrees with the broader view that NFCs can be attractive for secondary structures, energy-absorbing zones, or sustainability-driven design envelopes but are generally limited for highly stressed primary members unless hybridized and/or carefully engineered to mitigate variability and environmental sensitivity [
2,
8,
9,
10,
31]. In the present dataset, the comparatively low ILSS of flax is particularly relevant because interlaminar shear and interface-dominated mechanisms strongly influence bending performance and failure morphology in layered composites, especially for more compliant reinforcement families [
6,
10].
Figure 3 helps contextualize the scalar properties through the shapes of the tensile and flexural responses. The carbon stress–strain curves remain predominantly linear-elastic up to a comparatively abrupt failure, whereas glass and flax show more progressive curvature and extended strain accommodation in bending, consistent with earlier damage accumulation (matrix cracking, local debonding, and distributed microdamage) prior to the final rupture in the lower-stiffness laminate systems [
6,
10]. A compact way to formalize the “bending is more progressive” observation is to compare flexural-to-tensile strength and strain-to-break ratios using
Table 8 mean values. For glass,
σf,max/σt,max ≈ 350/351 ≈ 1.00, while
εf,break/εY,tech,break ≈ 3.176/1.561 ≈ 2.03, indicating that bending enables roughly twice the strain capacity relative to tension at a similar nominal maximum stress. For flax,
σf,max/σt,max ≈ 133/102 ≈ 1.30 and
εf,break/εY,tech,break ≈ 3.7332/2.025 ≈ 1.84, i.e., the laminate tolerates substantially higher strain in bending and also reaches a higher nominal maximum stress in three-point bending than in uniaxial tension. By comparison, Carbon 10H exhibits
σf,max/σt,max ≈ 696/1126.25 ≈ 0.62 and
εf,break/εY,tech,break ≈ 1.752/1.765 ≈ 0.99, consistent with a high-stiffness, fiber-dominated response where bending introduces additional compressive and interlaminar shear stresses that can trigger failure earlier than the uniaxial tensile limit. Carbon 4H is intermediate (
σf,max/σt,max ≈ 633/852.4 ≈ 0.74;
εf,break/εY,tech,break ≈ 1.710/1.448 ≈ 1.18), again supporting the idea that the cure state influences not only peak properties but also the balance between strength and the extent of progressive damage evolution [
7]. These ratios are appropriate in a screening-style “Results/Discussion” section because they provide a compact, dimensionless comparison of how the same composite laminate family behaves under two standard loading modes used for the chassis-relevant sample characterization [
6,
19].
The qualitative failure observations further support the structure–property interpretation derived from the scalar mechanical data. The fracture photographs and ARAMIS strain maps from
Figure 5 support the interpretation that failure localization becomes progressively less confined when moving from carbon to glass and flax laminates. The carbon showed the most localized and abrupt tensile failure, whereas glass exhibited a more distributed, banded strain pattern along the gauge section, consistent with the progressive matrix- and ply level damage before the final rupture. The flax showed the broadest localization region and the largest areas of correlation loss, in agreement with its rougher fracture morphology and with progressive mechanisms such as matrix cracking, interface debonding, bundle splitting, and fiber pull-out/fraying [
2,
8,
9,
10]. In this sense, the DIC observations complement the earlier ILSS results (
Table 7) by qualitatively indicating a stronger role of interfacial and interlaminar damage development in the more compliant laminates, especially flax [
6,
10]. The behavior seen in
Figure 6 is especially relevant for micromobility chassis parts, where bending-dominated loading is frequent and where a more progressive flexural response can provide a warning before the final failure and enhance the energy dissipation in the secondary load paths or crash-relevant zones—hence the sustained engineering interest in glass-fiber and natural-fiber laminates alongside high-performance carbon systems [
1,
2,
3,
28]. This interpretation is consistent with the broader literature on progressive flexural damage in lower-stiffness and more compliant laminated composite systems, in which matrix cracking, interfacial debonding, and interlaminar damage accumulation precede final rupture [
2,
6,
10,
28].
When interpreted together with the laminate-quality indicators discussed earlier (
Table 4,
Table 5,
Table 6 and
Table 7) and the tensile and flexural property set (
Table 8), the data support a clear screening hierarchy for the present manufacturing route and laminate designs: Carbon 10H offers the strongest stiffness/strength envelope for primary load paths; Carbon 4H remains similarly stiff but with a substantial strength penalty; glass provides a balanced mid-tier option; and flax delivers the lowest stiffness/strength but the most compliant and damage-accommodating response, which may still be useful in secondary structures or in the hybrid design concepts intended to balance the structural needs with the sustainability drivers [
2,
10,
26,
27].
For the intended two-wheeled EV chassis context, these results support the use of carbon laminates in most stiffness- and strength-critical regions, glass laminates where a more cost-balanced structural solution is required, and flax laminates in secondary or compliance-/energy-absorption-oriented zones where lower structural performance can be tolerated.
The present paper should therefore be interpreted as a tensile–flexural benchmark for comparative screening of the studied biaxial NCF laminates, rather than as a complete structural design dataset for EV chassis applications. Furthermore, the present interpretation of the post-cure and interfacial effects is based on the combined mechanical, thermal, and apparent interlaminar trends reported here; direct microstructural confirmation by SEM fractography was outside the scope of the present study and should be addressed in future work where specimen availability permits. Future work should translate this sample-level benchmark into component-level and system-level design guidance by integrating tensile and flexural behavior with compressive response, in-plane shear, impact resistance, fatigue/durability, and life-cycle considerations. A further priority is microstructural inspection and targeted fractography, including SEM where feasible, to validate the governing damage mechanisms and the role of the cure state in fiber–matrix/interlaminar behavior. First, the tensile–flexural dataset should be integrated with the already available compressive, shear, durability, and life-cycle results to build a coherent multi-criteria selection and sizing framework for chassis subcomponents, including appropriate knockdown factors and design “allowables.” Second, the strong sensitivity of carbon strength to post-cure duration motivates a more systematic process-property map coupling cure cycle, Tg evolution, void content, and interlaminar performance to mechanical response, ideally supported by microstructural inspection and targeted fractography to identify governing failure modes under tension and bending; this next step should explicitly quantify repeatability by reporting scatter metrics (e.g., SD/COV) from the existing raw datasets. Third, full-field measurements can be extended beyond qualitative localization documentation by extracting quantitative localization indicators (e.g., strain-field variance or localization-onset strain) and by applying DIC to bending and shear configurations, enabling a tighter link between damage initiation, stiffness loss, and progressive failure evolution. Finally, given the intended industrial chassis implementation, future work should prioritize validation at a subcomponent level (representative joints, cut-outs, curvature, and multi-axial load cases) and close the loop with numerical simulation, manufacturing constraints, and the project’s broader developments in chassis prototyping and connected vehicle control.
5. Conclusions
This study establishes an ISO-consistent tensile and flexural benchmark for biaxial NCF composite laminates intended for two-wheeled EV chassis applications. Tensile testing following the ISO 527-4 and three-point bending following the ISO 14125 were complemented by full-field strain measurements using a GOM ARAMIS® DIC system. In the present work, DIC is used in a supporting role to corroborate strain evaluation (notably for strain-based quantities such as the modulus and Poisson’s ratio) and to document the strain localization prior to the rupture, while the stress and strength values are computed from the testing-machine force signal and specimen geometry under the standard definitions. The laminate-level characterization (density, constituent fractions for the synthetic systems, Tg by DSC, and apparent ILSS) provides a complementary quality-control context that strengthens process–property interpretation and supports an auditable discussion of the observed mechanical trends.
Among the tested materials, carbon/epoxy laminates delivered the highest stiffness and strength in both loading modes. Extending the post-cure at 70 °C from 4 H to 10 H produced a substantial increase in tensile strength (~852 MPa to ~1126 MPa) while leaving tensile modulus essentially unchanged (~59–60 GPa), and it also increased flexural strength (~633 MPa to ~696 MPa) with only a small rise in flexural modulus (~41 to ~43 GPa). This pattern is consistent with a cure-state effect that improves the matrix-dominated and interface-dominated load transfer more strongly than it affects the fiber-dominated elastic stiffness, and it is coherent with the measured Tg increase and the higher apparent ILSS in the transverse direction for the longer post-cure condition. The glass/epoxy laminates provided an intermediate structural option (Et ≈ 17 GPa, σt,max ≈ 351 MPa; Ef ≈ 18 GPa, σf,max ≈ 350 MPa), aligning with their typical positioning as cost-effective FRPs for mobility structures. The flax laminates exhibited the lowest stiffness and strength (Et ≈ 6 GPa, σt,max ≈ 102 MPa; Ef ≈ 8 GPa, and σf,max ≈ 133 MPa) but the largest deformation capacity, particularly in bending, where the flexural strain at rupture exceeded the tensile strain at rupture by ~84%.
The flexural-to-tensile strain ratios reinforce that bending failure is substantially more progressive for glass and flax than for carbon, and the DIC strain-field maps and post-mortem fracture observations provide qualitative support for this interpretation by revealing broader strain redistribution and multiple localization bands in the more compliant laminates.
In the Ashby-type framework, carbon laminates remain dominant in specific stiffness and strength, glass provides an intermediate compromise, and flax occupies a lower specific performance region but retains a comparatively progressive deformation behavior that may be advantageous for non-primary, compliance-tuned, or energy-absorbing chassis regions.
For the intended two-wheeled EV chassis context, the present results indicate that carbon/epoxy biaxial NCF laminates are the strongest candidates for primary structural regions, the glass/epoxy laminates provide a balanced intermediate solution, and the flax-based laminates are better suited to secondary or compliance-/energy-absorption-oriented regions. These conclusions should; however, be interpreted within the scope of the present study, particularly the uncontrolled ambient-moisture state of the flax specimens and the absence of direct SEM-based microstructural validation.


 ,
, 


