Article

Laboratory Investigation of Sand-Geosynthetic Interface Friction Parameters Using Cost-Effective Vertical Pullout Apparatus

1
Department of Civil Engineering, University of Engineering and Technology, Lahore 54600, Pakistan
2
Department of Civil Engineering, University of Engineering and Technology, Taxila 47040, Pakistan
3
School of Engineering, RMIT University, Melbourne, VIC 3001, Australia
*
Authors to whom correspondence should be addressed.
Fibers 2022, 10(10), 84; https://doi.org/10.3390/fib10100084
Submission received: 14 August 2022 / Revised: 21 September 2022 / Accepted: 26 September 2022 / Published: 30 September 2022
(This article belongs to the Special Issue Carbon Fibers from Sustainable Precursors)

Abstract

:
The current research has been carried out to investigate the interactive behaviour of soil-geosynthetic interfaces. A cost-effective vertical pullout test (VPT) apparatus was designed for this purpose. A series of laboratory direct shear tests (DSTs) and vertical pullout tests (VPT) were carried out using three types of sands and four different types of geosynthetics. All three sandy samples used in this research were classified as poorly graded sand (SP) as per the Unified Soil Classification System (USCS) with median grain size ranging between 0.39~0.2 mm. The geosynthetics used were three woven and one non-woven with a tensile force of 3.3 kN/m~103.8 kN/m. The direct shear test revealed that geometric properties of geosynthetics have an influence on interface shear resistance. Interface friction angle varies between 29.2~38.3. Vertical pullout (VPT) test results show that the pullout force is in the range of 23.9~31.4. The interface friction angle by both direct and vertical pullout tests is more for coarse-grained soils than for fine-grained soils. Interface friction angles from pullout tests were around 19% smaller than direct shear tests. The interface efficiency ranged from 0.69 to 0.97 for all soils; meanwhile, for non-woven geotextiles, the efficiency values are up to 22% higher as compared to woven geotextiles due to theirtexture. The present research indicates that interface friction parameters can be efficiently determined through the interface of a cost-effective VPT which is also comparable with DST. The reliable values of interface efficiency can be obtained for soil-geosynthetic interfaces which can optimize the design and omits the need forassumed conservative values of friction parameters.

1. Introduction

The inclusion of geosynthetic reinforcement in a soil mass increases the bearing capacity and ability to sustain extra surcharge and overburden [1]. Geosynthetics are utilized to enhance the performance of foundations and fills [2]. Its main application areas include mechanically stabilized earth walls [3], reinforced soil slopes, embankments, geosynthetic landfill liner systems and other geosynthetic reinforced structures. Several studies investigated soil-geosynthetic interface shear strength using direct shear tests for sandy soils [4]. The inclusion of geosynthetic reinforcement in a soil mass increases the bearing capacity and ability to sustain extra surcharge and overburden [1]. Geosynthetics are utilized to enhance the performance of foundations and fill [5]. Investigation of the interaction behavior and mechanism of soil reinforcement is inevitable for the design and stability analysis of geosynthetic reinforced soil structures. Assessment of soil-reinforcement interaction will indicate how the composite structure will perform under different loading conditions depending upon both the type of soil and the reinforcement material and its properties. Several studies investigated soil-geosynthetic interface shear strength using direct shear tests, triaxial compression tests, and numerical modeling for sandy soils [6,7,8,9,10]. The use of geosynthetics in soils presents potential planes of weakness due to partial loss of particle-to-particle frictional interlock and resistance at the interface of soil reinforcement; therefore, it becomes necessary to evaluate the interface friction parameters for the safe design of geosynthetic reinforced soil (GRS) structures [11,12,13]. When a geosynthetic is used as soil reinforcement, the bond strength between the soil and the reinforcement should be sufficient to prevent the sliding of the soil mass against the reinforcement fibers and should prevent the pulling out of reinforcement when the tensile stresses are developed in geosynthetics [5]. The efficiency of anchorage between the soil and reinforcement depends upon the contact surfaces of both elements. Anubhav and Bashudar [14] investigated the soil/geotextile shear interface mechanism. They concluded that peak and residual coefficient friction for sands with angular particles werehigher than for sands with rounded particles. The friction coefficients were significantly higher for sands with sub-angular gains as compared to rounded grains [15]. Tuna and Altun [16] studied the effect of size of equipment, confining pressure, geosynthetic properties, and relative density. They concluded that the size of the equipment did not cause any prominent change in the interface behavior of reinforced soil. Abdi and Goband [17] revealed that interaction coefficients, which arethe ratio of roughened geotextile shear strength to sand-geotextile interface shear strength, ranged from 1.02 to 1.23 and 1.03 to 1.31 for coarse and fine sand, respectively.
Pullout resistance is determined by using laboratory pullout tests and depends on soil parameters, in-situ dry density and length, and type of geosynthetic [18]. Different research works suggest the utilization of medium to large-sized shear boxes (100~300 mm) to carefully simulate the field conditions and large interface monitoring. However, geosynthetic-soil interface shear strength can also be studied using the small shear box (60 mm × 60 mm) and the results are comparable. Several shear apparatuses have been developed for the evaluation of geosynthetic-soil shear strength. However, most of these pullout test setups are of specialized and expensive nature. For developing countries, where such laboratory facilities are scarce, there is a need to propose low-cost simplified testing apparatus to evaluate the strength of the geosynthetic-soil interface. This study is aimed to propose a simplified test apparatus to carry out a pullout resistance test on the geosynthetic-soil interface with reasonable accuracy and propose interface friction angles for different types of sandy soils and geosynthetics.

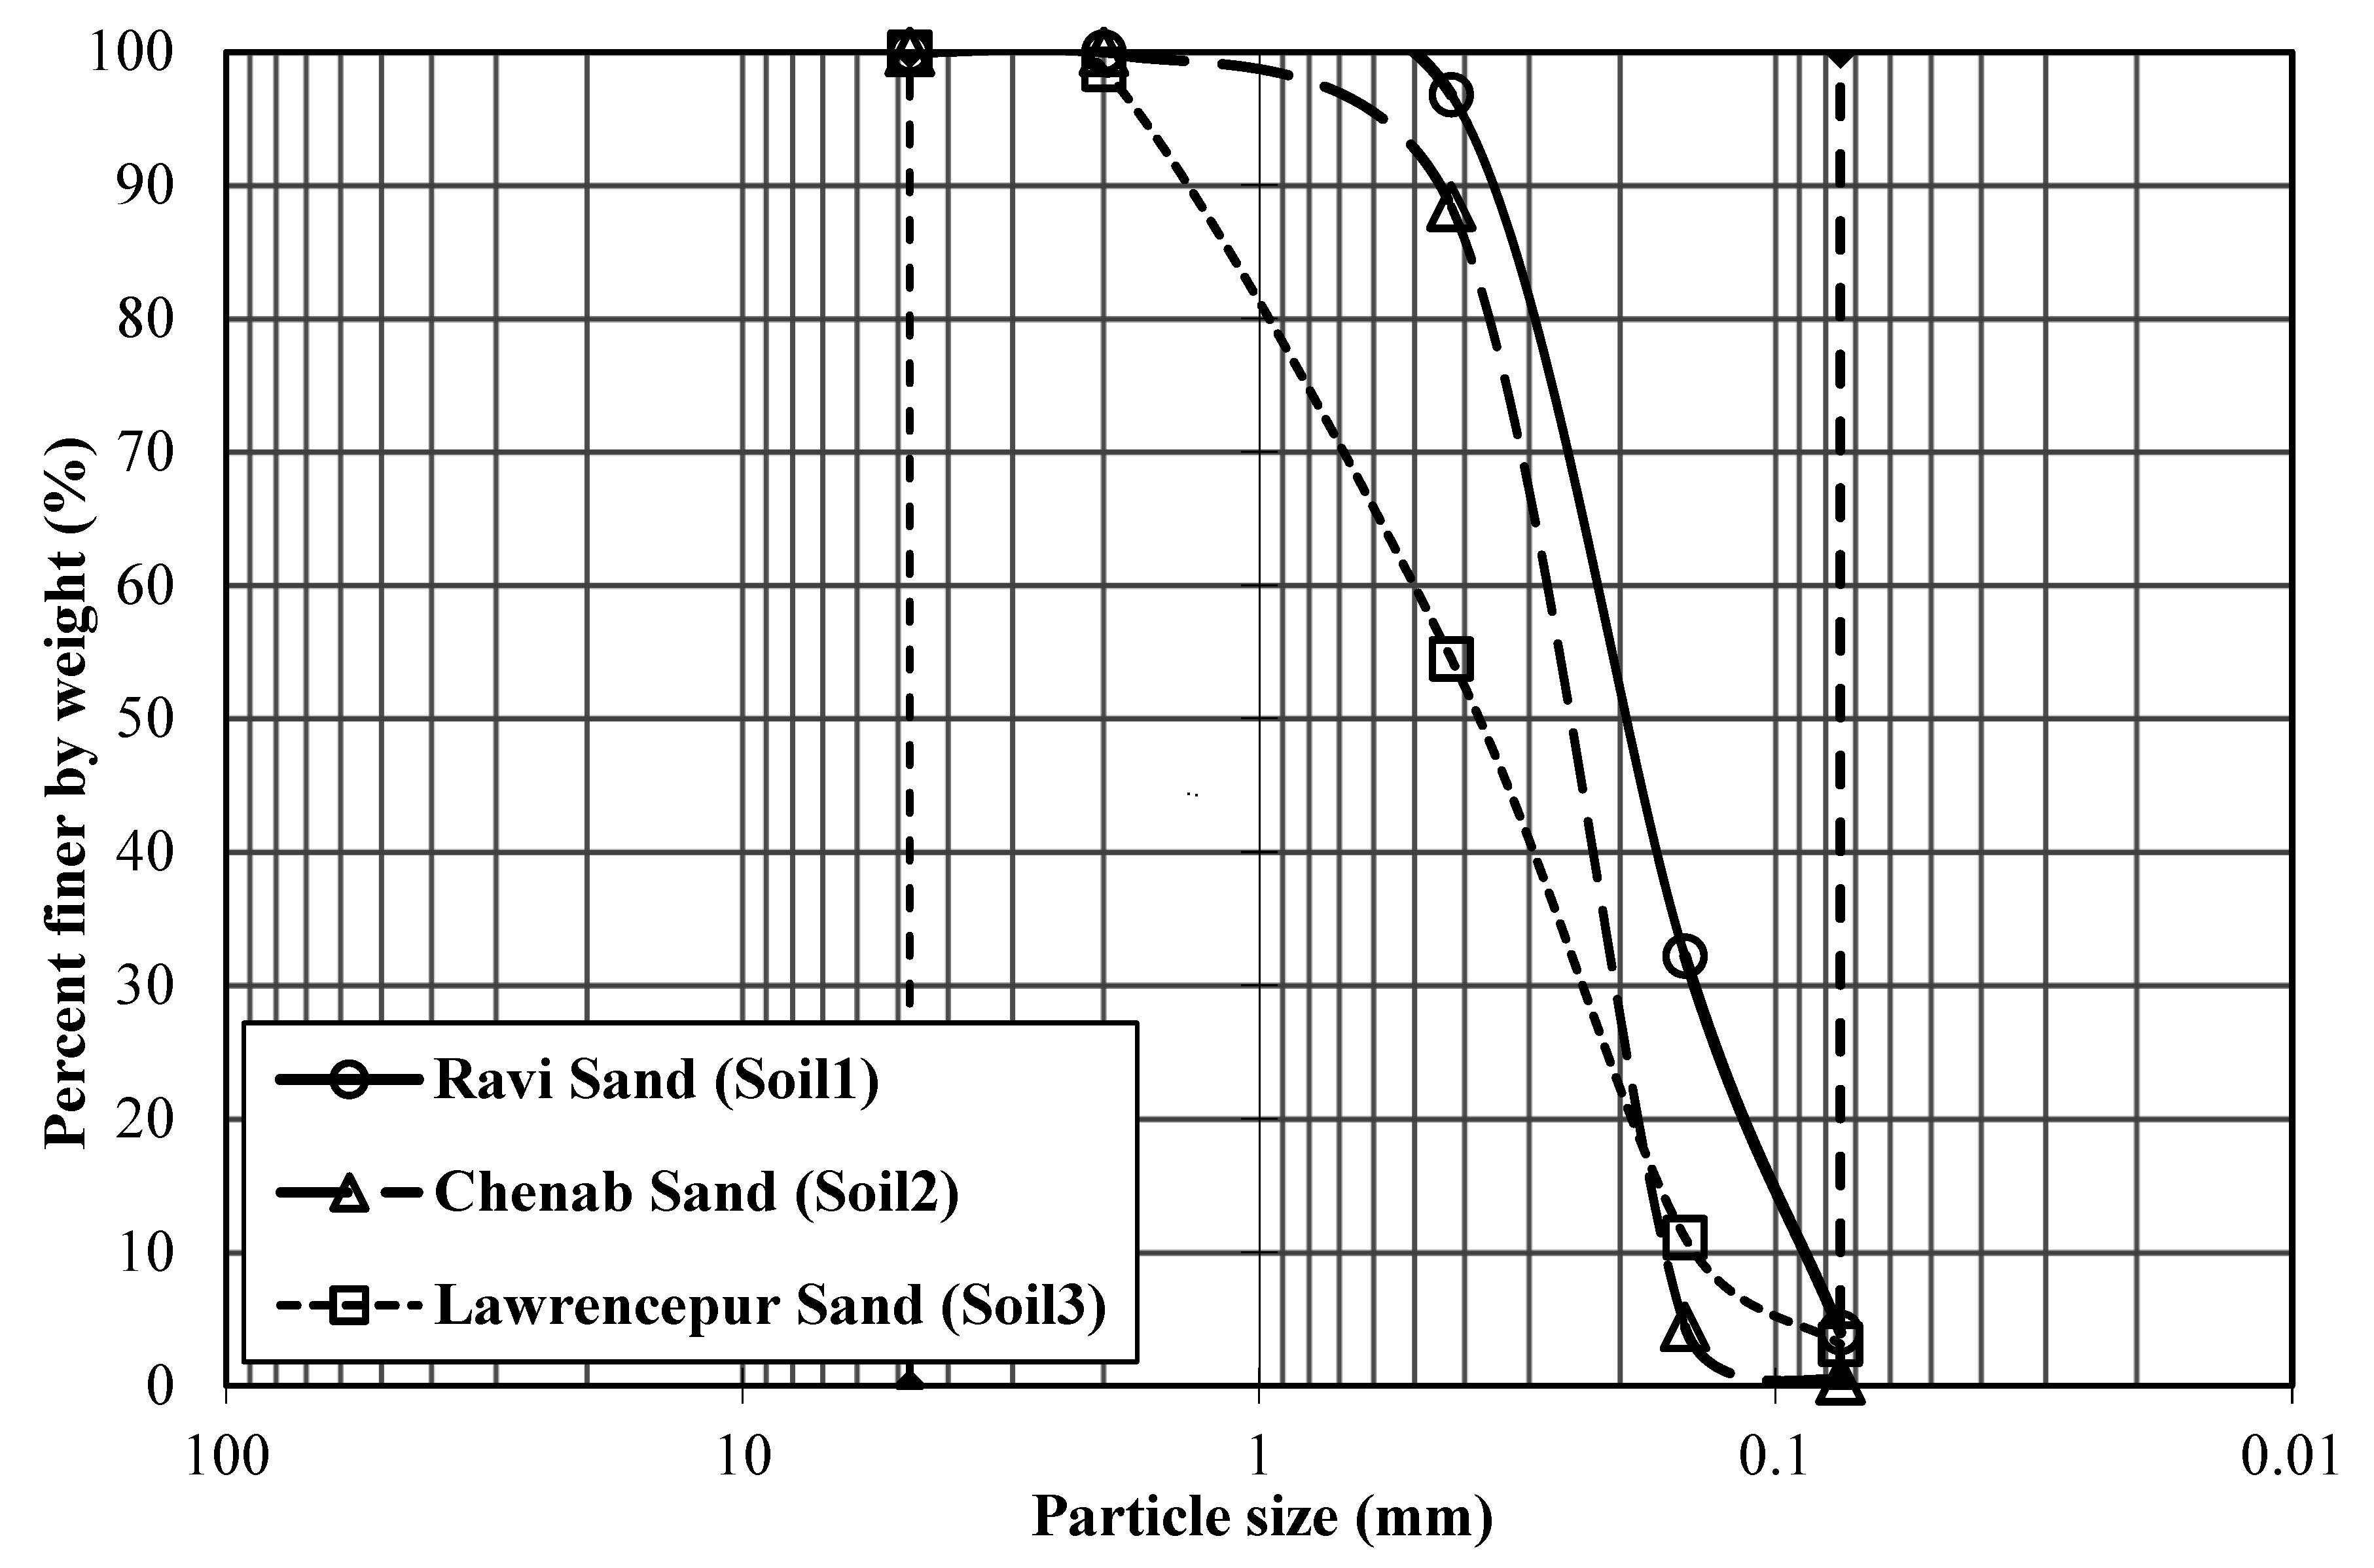
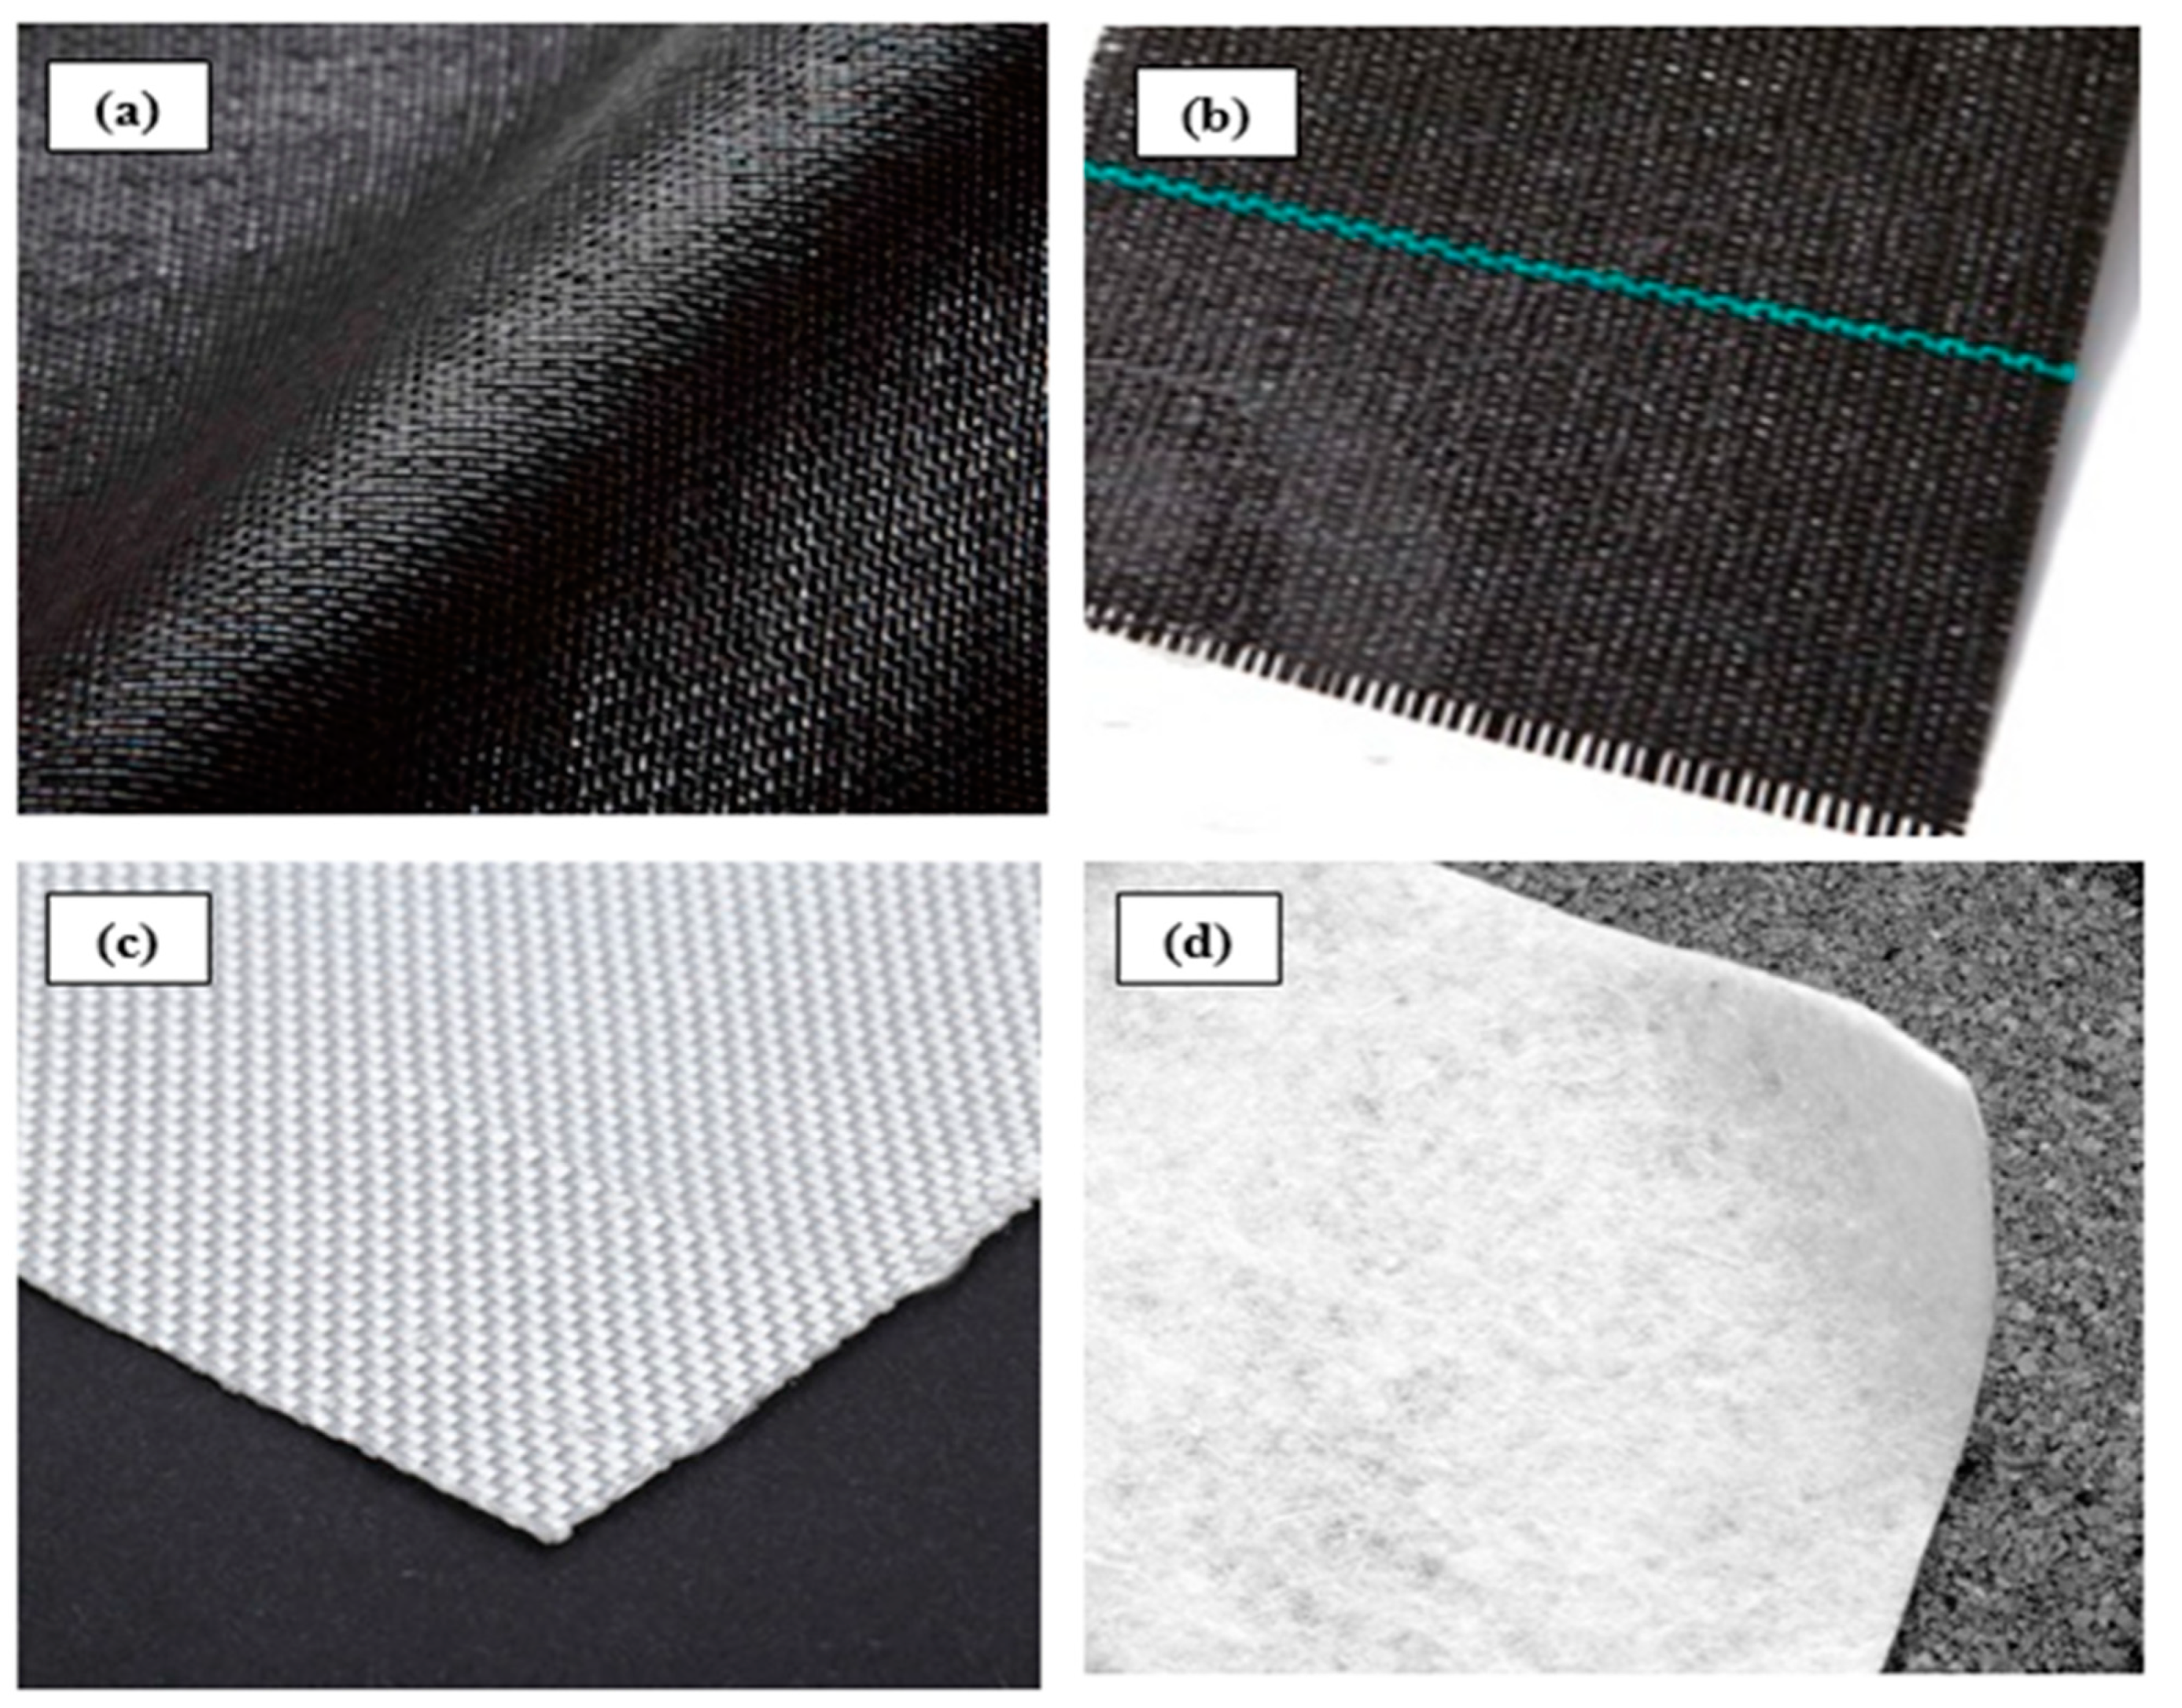
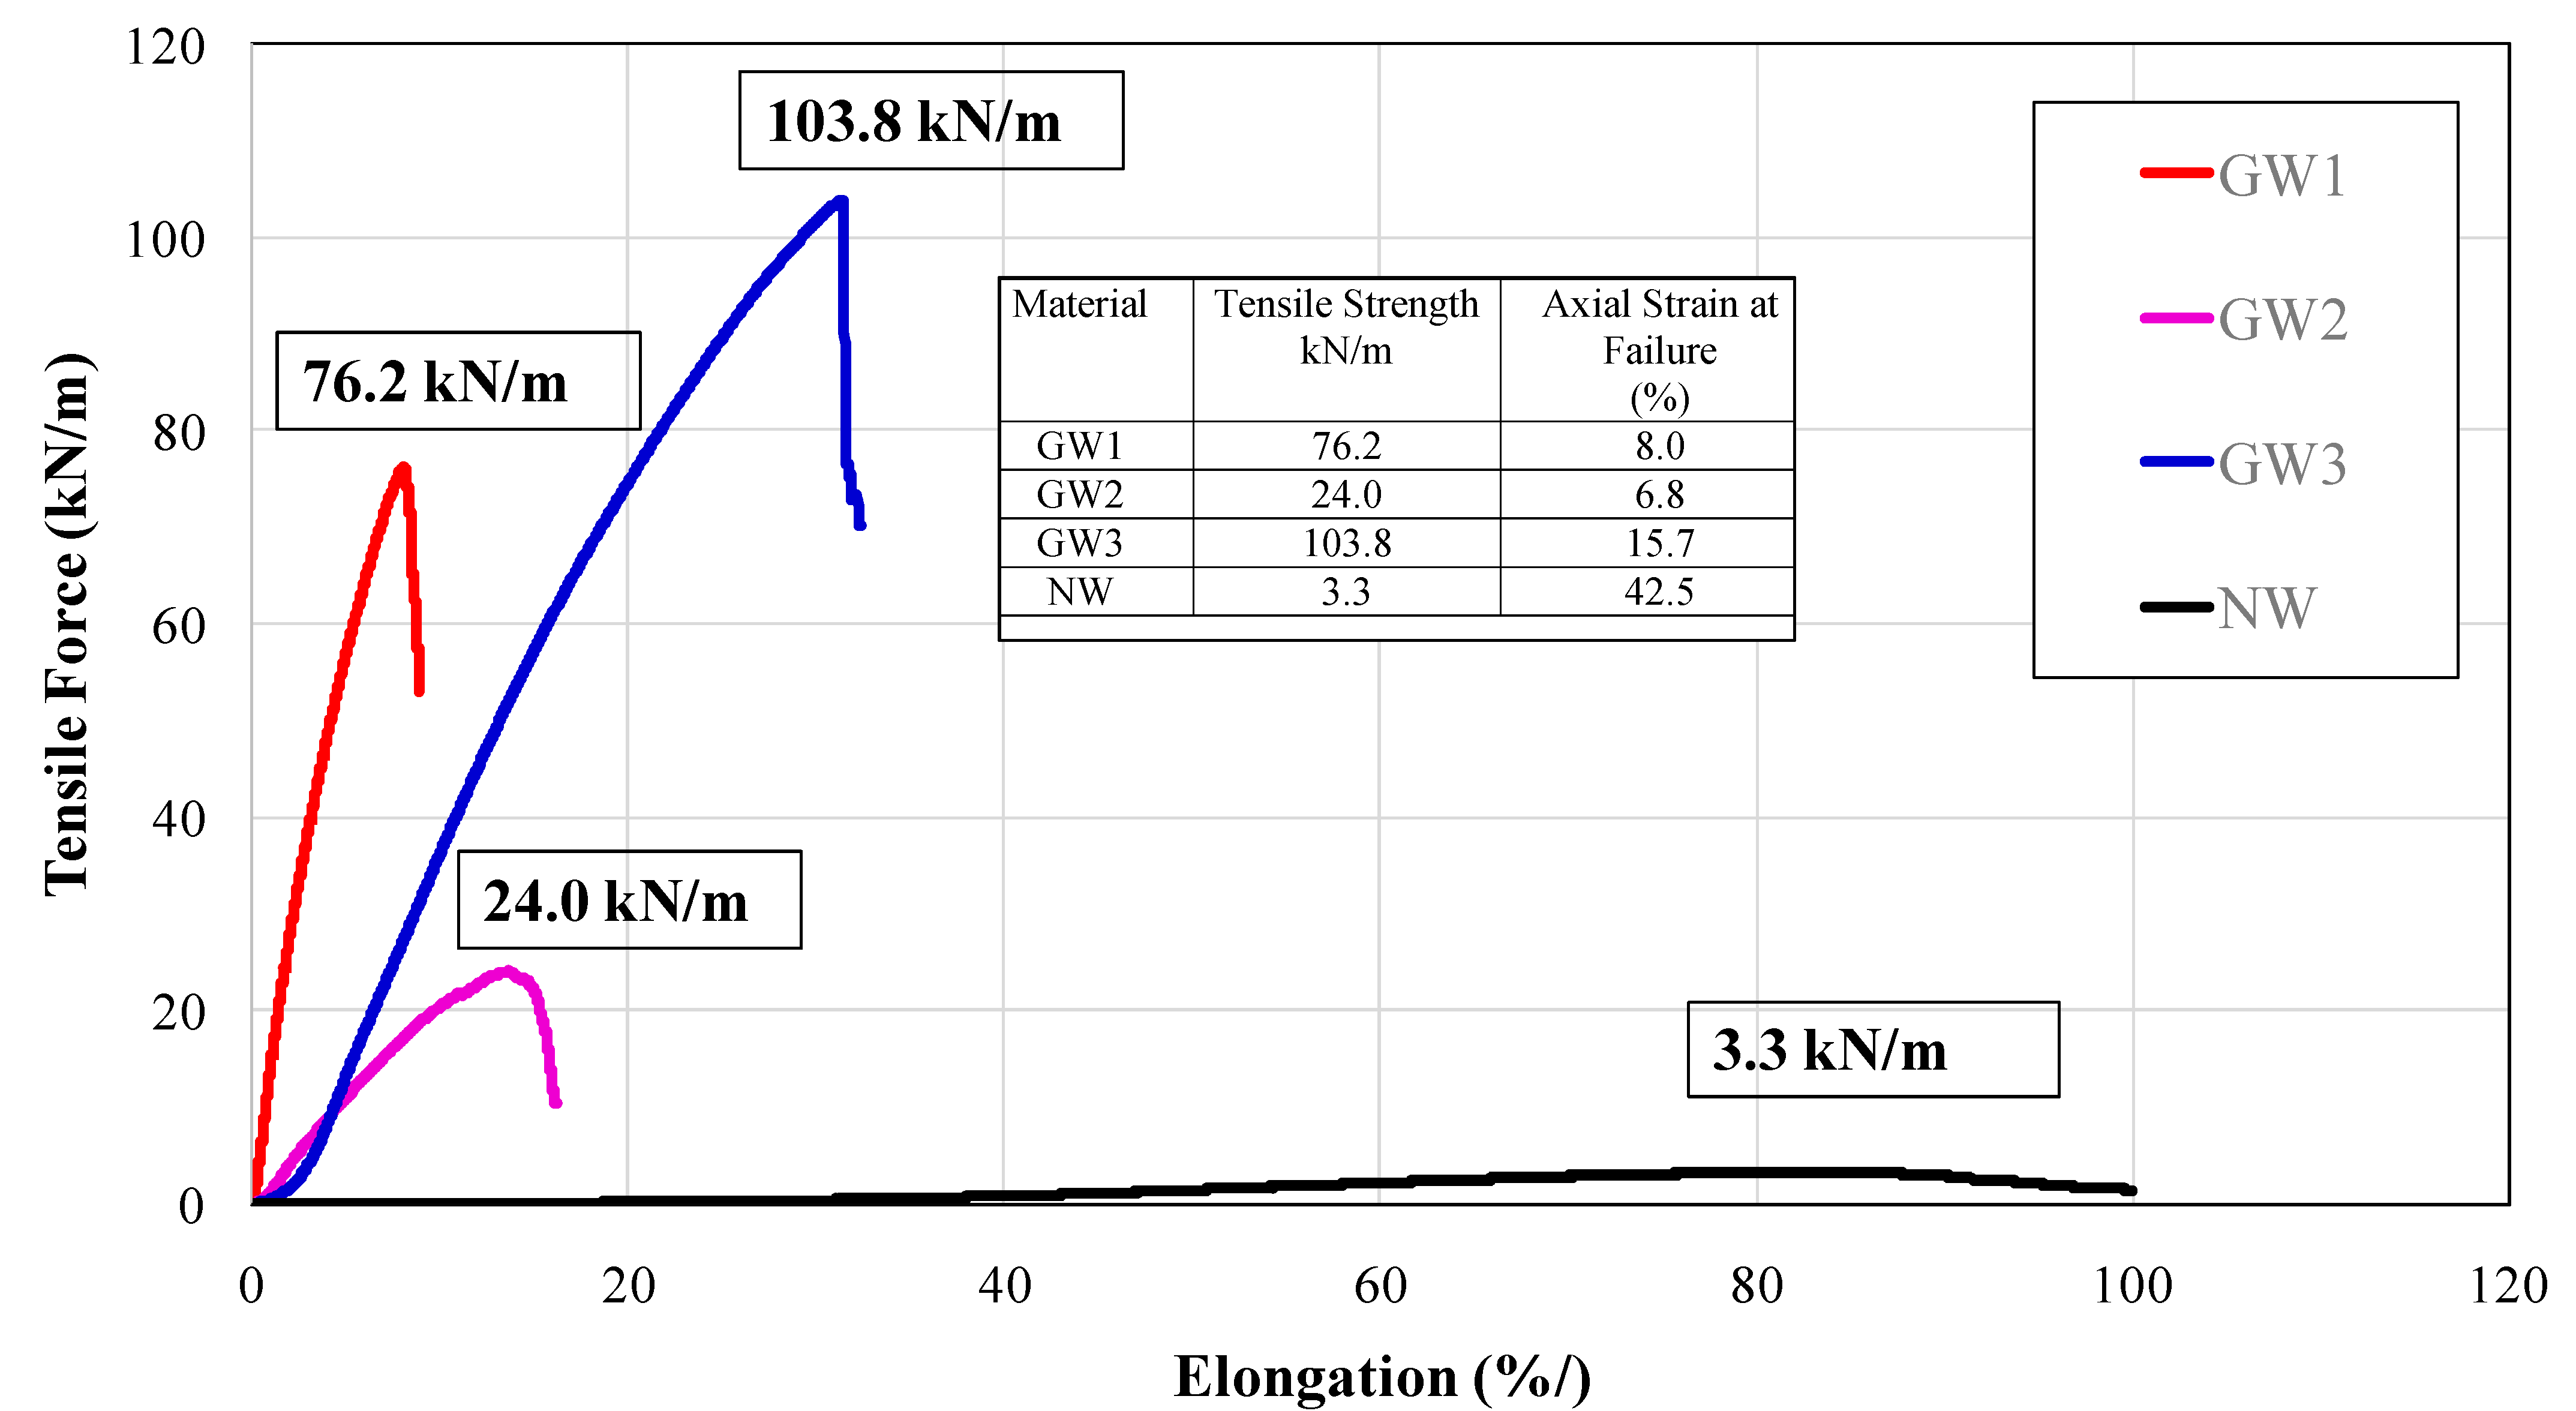
2. Materials and Methods

Three different types of locally available sands, namely Ravi, Chenab, and Lawrencepur, were used as backfill materials for this study. All three types of soils were clean sands classified as poorly graded (SP) as per the Unified soil classification system (USCS) classification system. For the present research, Ravi sand, Chenab sand, and Lawrencepur sand are designated as Soil1, Soil2, and Soil3, respectively. The physical properties of all three types of sands are determined in the laboratory. Sands selected varied in their median particle size (D50) as 0.19 mm, 0.26 mm, and 0.75 mm for Soil1, Soil2, and Soil3, respectively. Tests revealed that Soil3 has no fine contents and Soil1 and Soil2 had 4% and 0.4% fines, respectively. Based on gradation analysis, the coefficient of uniformity (Cu) varies between 2.94~1.75 while the coefficient of curvature (Cc) ranged from 0.98~1.36. Figure 1 represents the grain-size distribution curves of the sands used in the study and the engineering characteristics of these soils are listed in Table 1.
Geosynthetics used in this study were of four different types which included three woven and one non-woven geotextile as shown in Figure 2. One woven geotextile (GW1) sample was provided by Laiwu Starring Project MaterialCo., Ltd. High-Tech District, Laiwu, Jinan, Shangdong province, China, and two other woven geotextile samples (GW2, GW3) were provided by Hong Xiang New Geo-Material Co., Ltd. Ling County, Shandong province, China. The non-woven geotextile (NW) sample was collected from a local manufacturer in Pakistan. For the purpose of discussion, the woven geotextiles are referred to as GW1, GW2, and GW3, and the non-woven geotextile is referred to as NW. Two (GW1 and GW2) out of three woven geotextiles were manufactured from polypropylene material, however, one type of woven geotextile (GW3) and the non-woven were manufactured from polyester (PET yarn). Mass/unit area of the geotextiles, axial strain at failure, and thickness were measured following the relevant ASTM standards [19,20,21]. The reported values of mass/unit area, thickness, and effective opening size were provided by the relevant manufacturers while the wide-width strip tensile test is performed at the Material Testing Laboratory, Polymer and Process Engineering Department, University of Engineering & Technology, Lahore. The physical properties of the geosynthetics are summarized in Table 2.
The tensile strength of a geosynthetic is defined as the peak load applied per unit width of the geosynthetic. The tensile strength of geosynthetics is commonly determined by the wide-width strip tensile test [20]. A tensile load was applied at a rate of 1 mm/min on a 200 mm wide geosynthetic strip clamped between the jaws of UTM with a gauge length of 100 mm. Thewide-width strip test closely simulates the deformations experienced by the geosynthetics in the soil. This test provides various parameters such as maximum tensile strength, extension, and tensile modulus. The measured strength and the strain at failure depend on several variables such as the applied preload (if any), temperature, strain rate, sample geometry, gripping method, and any normal confinement applied to the geosynthetic. To minimize the influence of the geometry of geosynthetics on test results, it is suggested that the width-gauge length ratio of the geosynthetic should not be less than 2 [22]. The tensile strength of geosynthetics has a close relation with mass per unit area.
Results of tensile strength tests are presented in Figure 3. The tensile strength of GW3 is 103.8 kN/m at a strain of 15.7% which is 34.5 times more than the NW sample. The probable reason for the high tensile strength of GW3 is its woven nature as compared to the non-woven sample. The tensile strength of GW3 is 1.36~4.13 times more than GW1 and GW2, respectively.

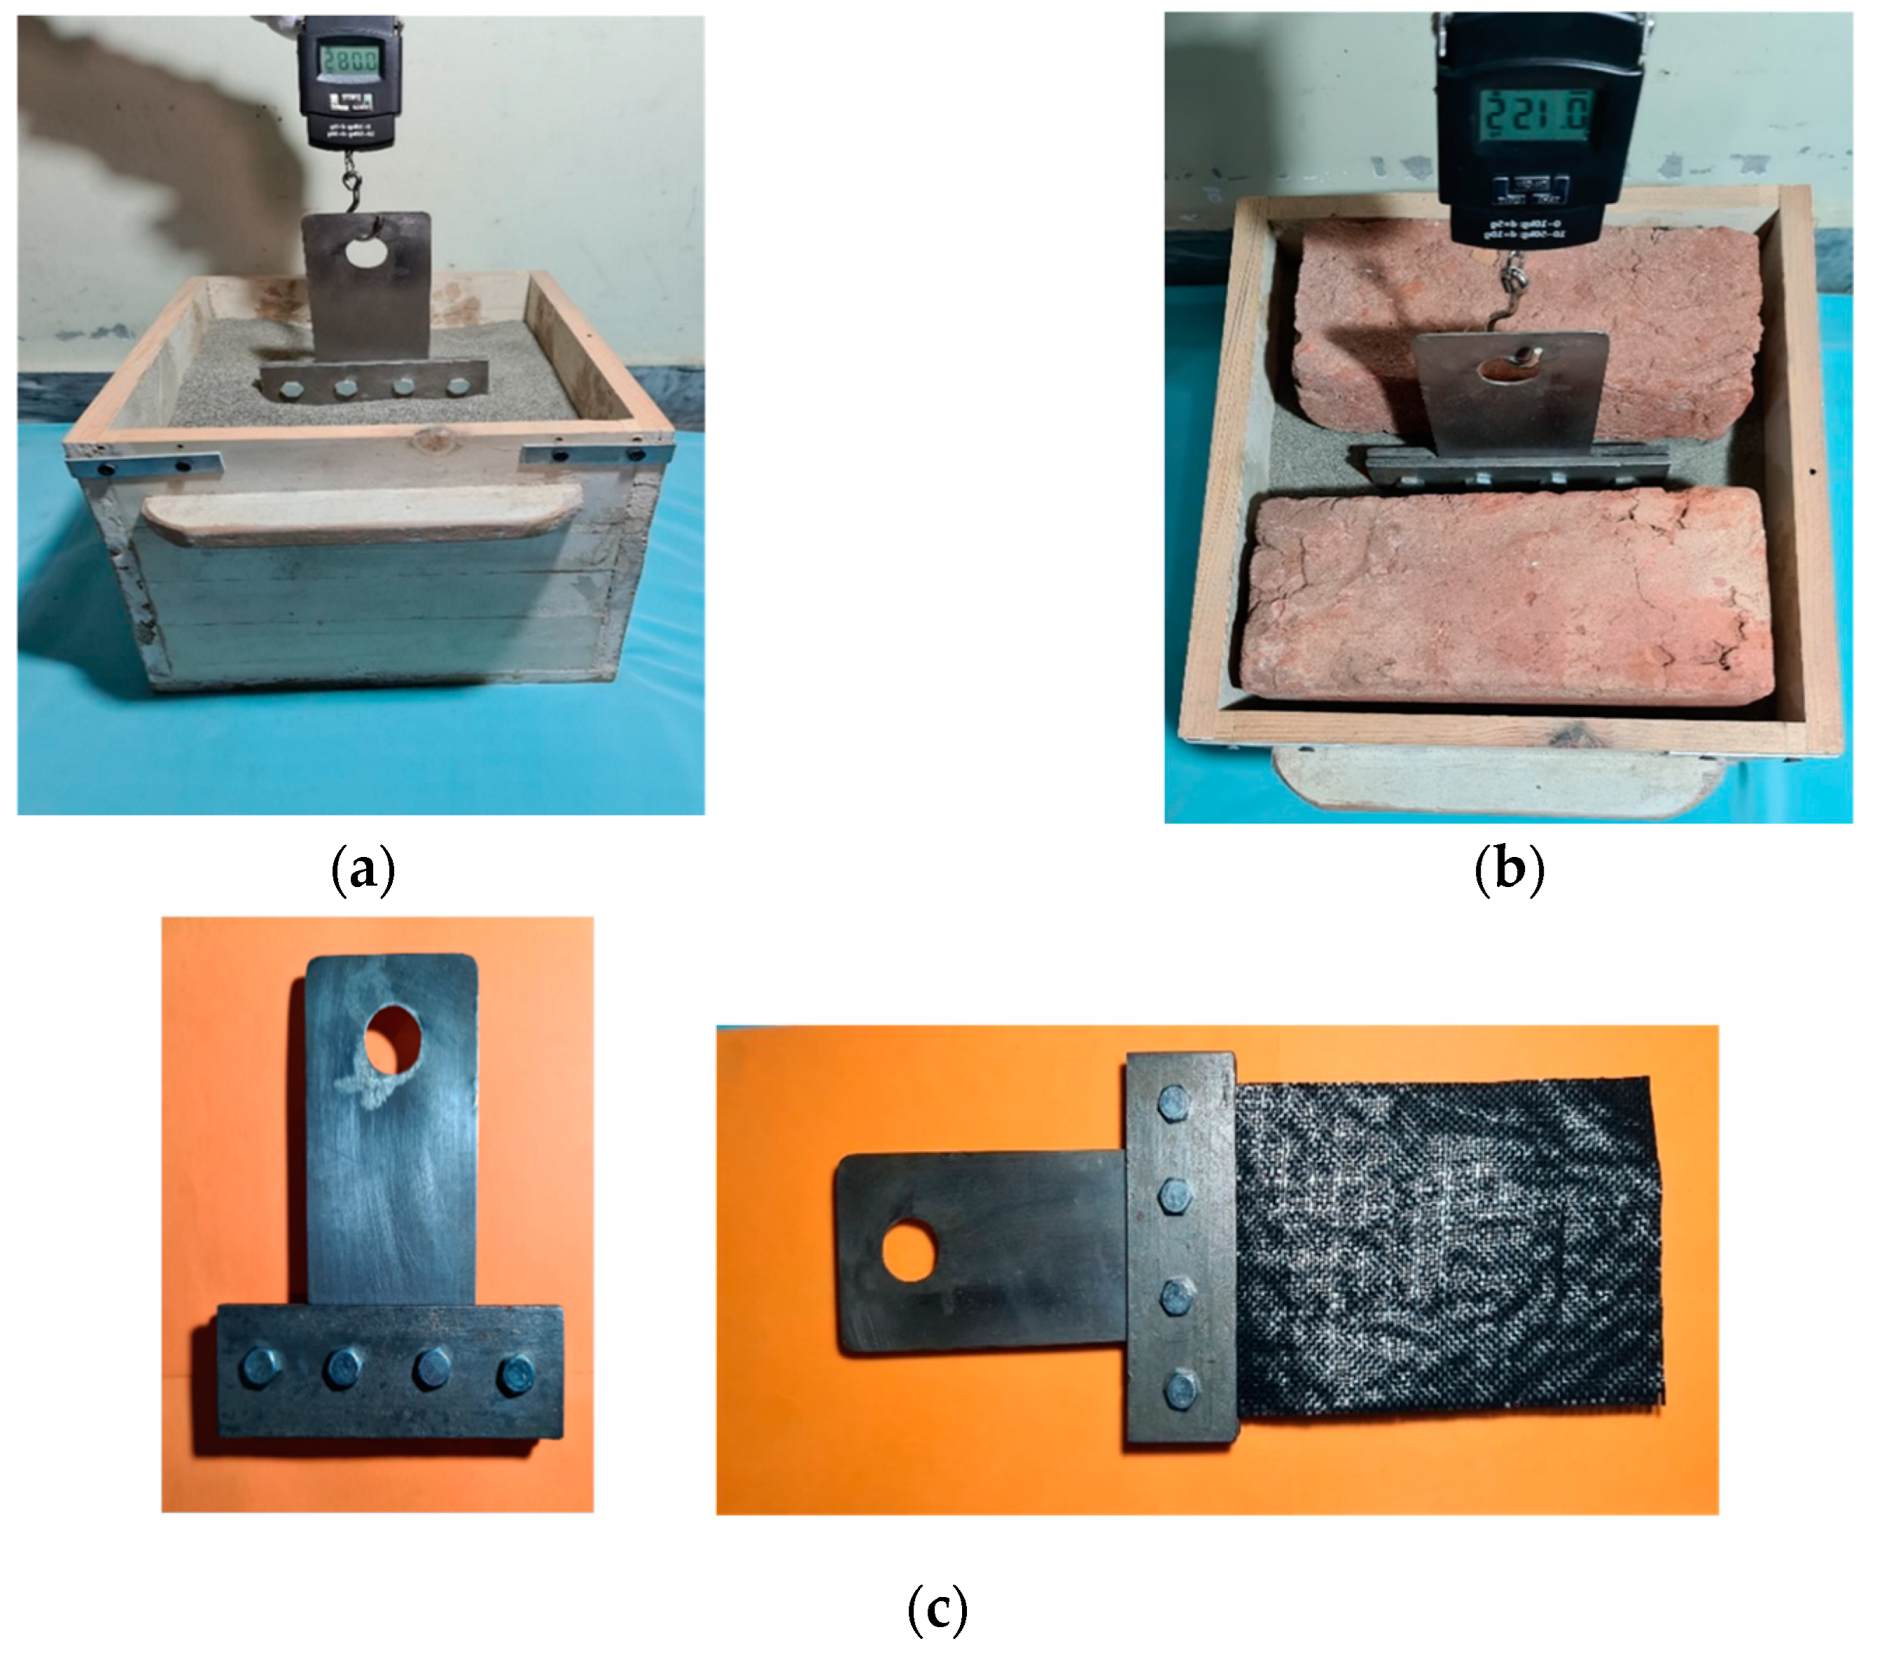
2.1. Vertical Pullout Test Apparatus

A vertical pullout test (VPT) apparatus is designed in this study as shown in Figure 4. A wooden box was prepared to constrain the soil sample. A clamp and hanger werefabricated to hold embedded geotextile in a soil sample within a wooden box. A load measuring device having an accuracy of 0.01 N and a peak hold feature was used to record the peak pullout force. Bricks of standard weight wereused to apply surcharge load on the soil-geotextile interface. In order to make this apparatus cost-effective local material was used for fabrication.

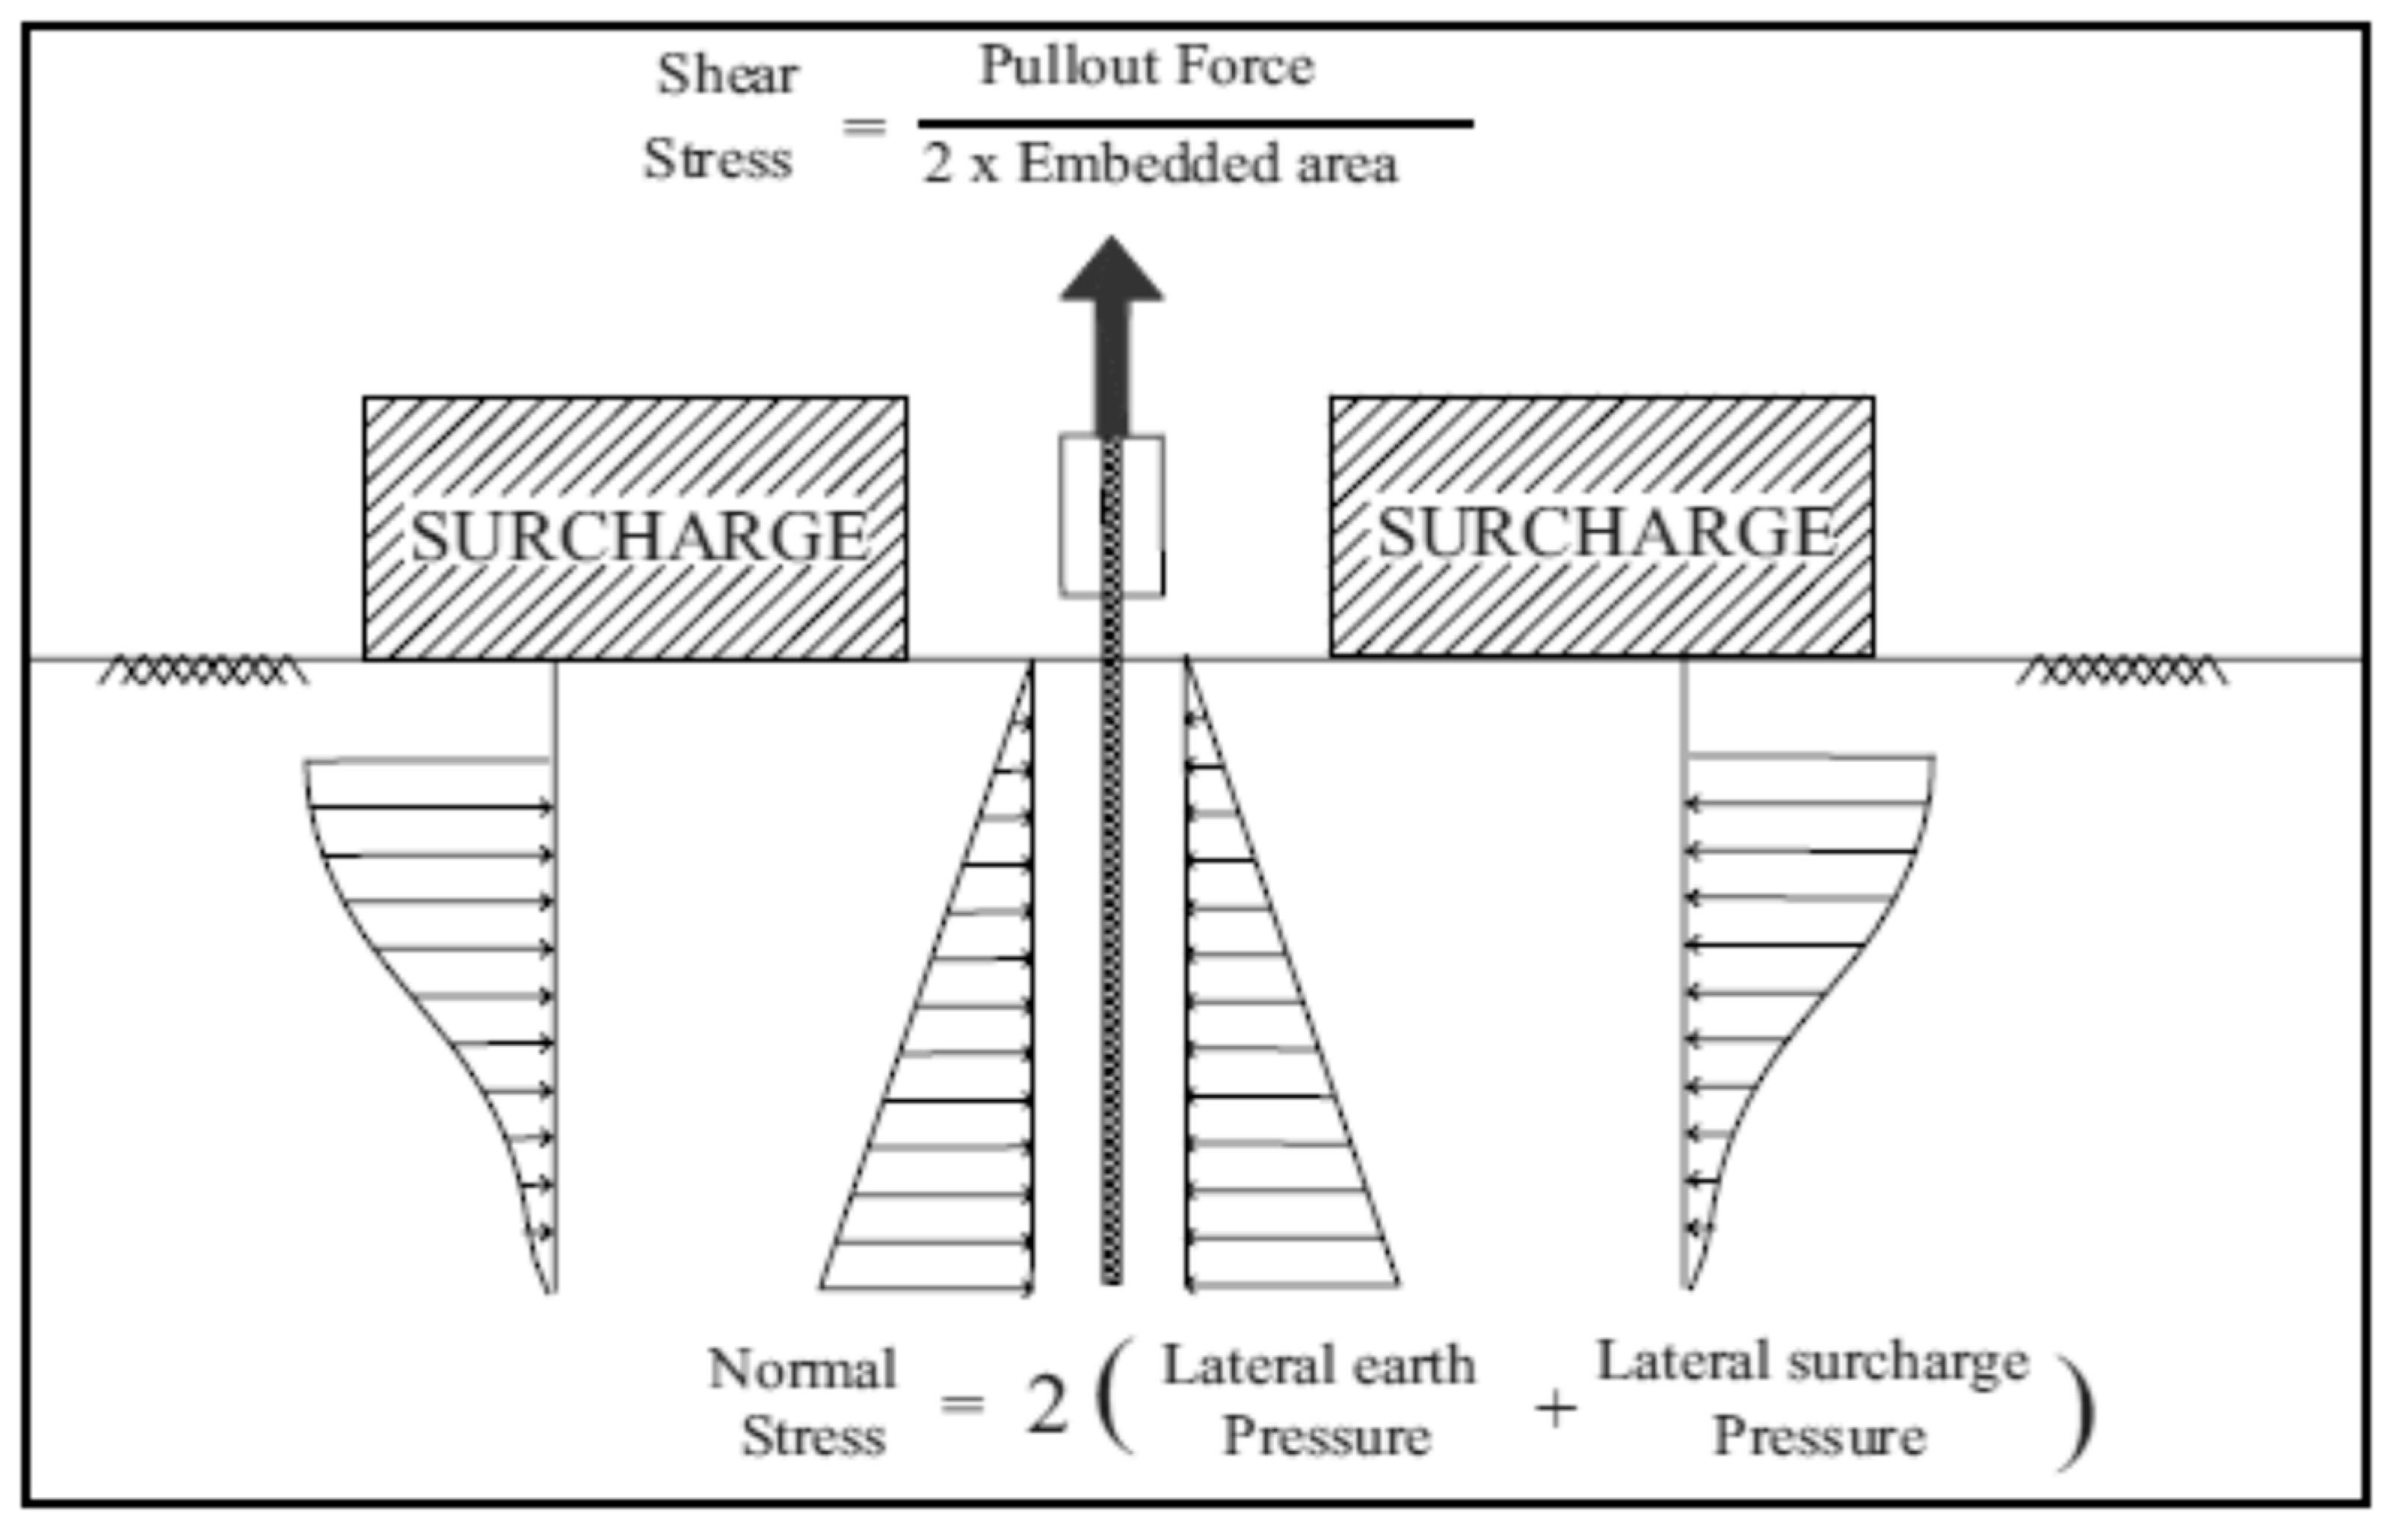
2.2. Pullout Test Philosophy

VPT is a relatively simple technique for the evaluation of interface friction parameters in the laboratory. It requires relatively inexpensive equipment that can be easily adapted by laboratories and for field experimentation. In VPT, a geosynthetic product (geotextile or geomembrane) is vertically embedded in the soil mass. The soil mass surrounding the geosynthetic provides the lateral earth pressure that is utilized as the normal force to generate normal stresses. In order to increase the normal stress, a surcharge is symmetrically placed around the geosynthetic on top of the soil mass.The shearing force is applied by vertically pulling out the geosynthetic to mobilize the friction around both faces of the reinforcement. The peak or maximum value of the pullout force is recorded.
The lateral earth pressures are determined by assuming at rest condition of the soil mass by using the angle of internal friction of soil that is estimated or already calculated through direct shear tests of soil. For the present study, the soil used is in the dry state and the lateral earth pressures acting on two faces of the geotextile were calculated using Boussinesq’s method. However, in the presence of moisture in the soil, effective stresses should be considered. The shear strength parameters and peak interface friction angle (δ) between soil and the geotextile reinforcement were determined by performing a series of tests with different levels of normal stresses generated by applying different surcharge loads and measuring the shear/pullout stresses by vertically pulling out the geotextile. Figure 5 shows the stresses used to analyze the results of VPT.
A sample of the desired dimension of geotextile was cut and fixed in the holding clamps. The size of the geotextile sample selected to embed in the soil is 100 mm × 150 mm and an additional 50 mm in height is taken for mounting the sample in the clamps and to allow clearance above the soil. The geotextile sample was placed in clamps and held vertically in the middle of the container. The soil is filled around the geosynthetic sample while carefully maintaining the vertical alignment of the reinforcement. The sand was poured into a container in three layers to achieve the desired embedment height of the geotextile. Each sand layer was compacted with equal compacting energy using the tamper to achieve the final relative density of 50%. The length of geotextile above the soil surface was noted after adding the soil to record the exact embedment length of the sample.
Surcharge load is applied using bricks placed symmetrically on both sides of the reinforcement to achieve different levels of normal stress. The clamps holding the digital scale with an accuracy of 0. 0.01 N and the peak hold feature were used to record the peak pullout force. The clamp holding the digital scale was held vertically and pulled out at a predetermined uniform pace such that the complete reinforcement was pulled out of the soil in 60 s. Figure 4 shows the photographs of the experimental procedure of VPT. The reading on the digital scale increases until the interface friction on both faces of the geotextile is fully mobilized and the peak value is recorded as the peak pullout force. After the reading on the digital scale reaches its peak, it starts dropping rapidly and the reinforcement gets pulled out. Tests were repeated for four different levels of normal stress. Initially, no surcharge was applied and the normal stress was generated by the soil lateral earth pressure, then for an increase in normal stress, bricks were added symmetrically on both sides of the reinforcement. To avoid obstruction during pulling out, a surcharge was placed about 20 mm from the clamp. Normal stress was calculated by summing up the lateral earth pressure of the soil mass and pressure due to surcharge load. The normal stress at different points was determined at equal intervals of embedment height of geotextile and then the average of the stresses was taken as normal stress due to surface surcharge (Figure 5).
A v e r a g e n o r m a l s t r e s s ( σ z ) a v g = σ 1 + σ 2 + σ 3 + σ 4 4
where
σ1, σ2, σ3, and σ4= normal stresses at height “z” of the embedded geotextile and ( σ z ) a v g = the average normal stress at one face of embedded geotextile.
Normal stress and shear stress arecalculated using Equations (2) and (3), respectively:
σ = N B × L e
τ = F v p 2 × B × L e
where
  • Fvp = peak vertical pullout force,
  • B = width of the geotextile sample, and,
  • Le = length of the geotextile embedded in soil.

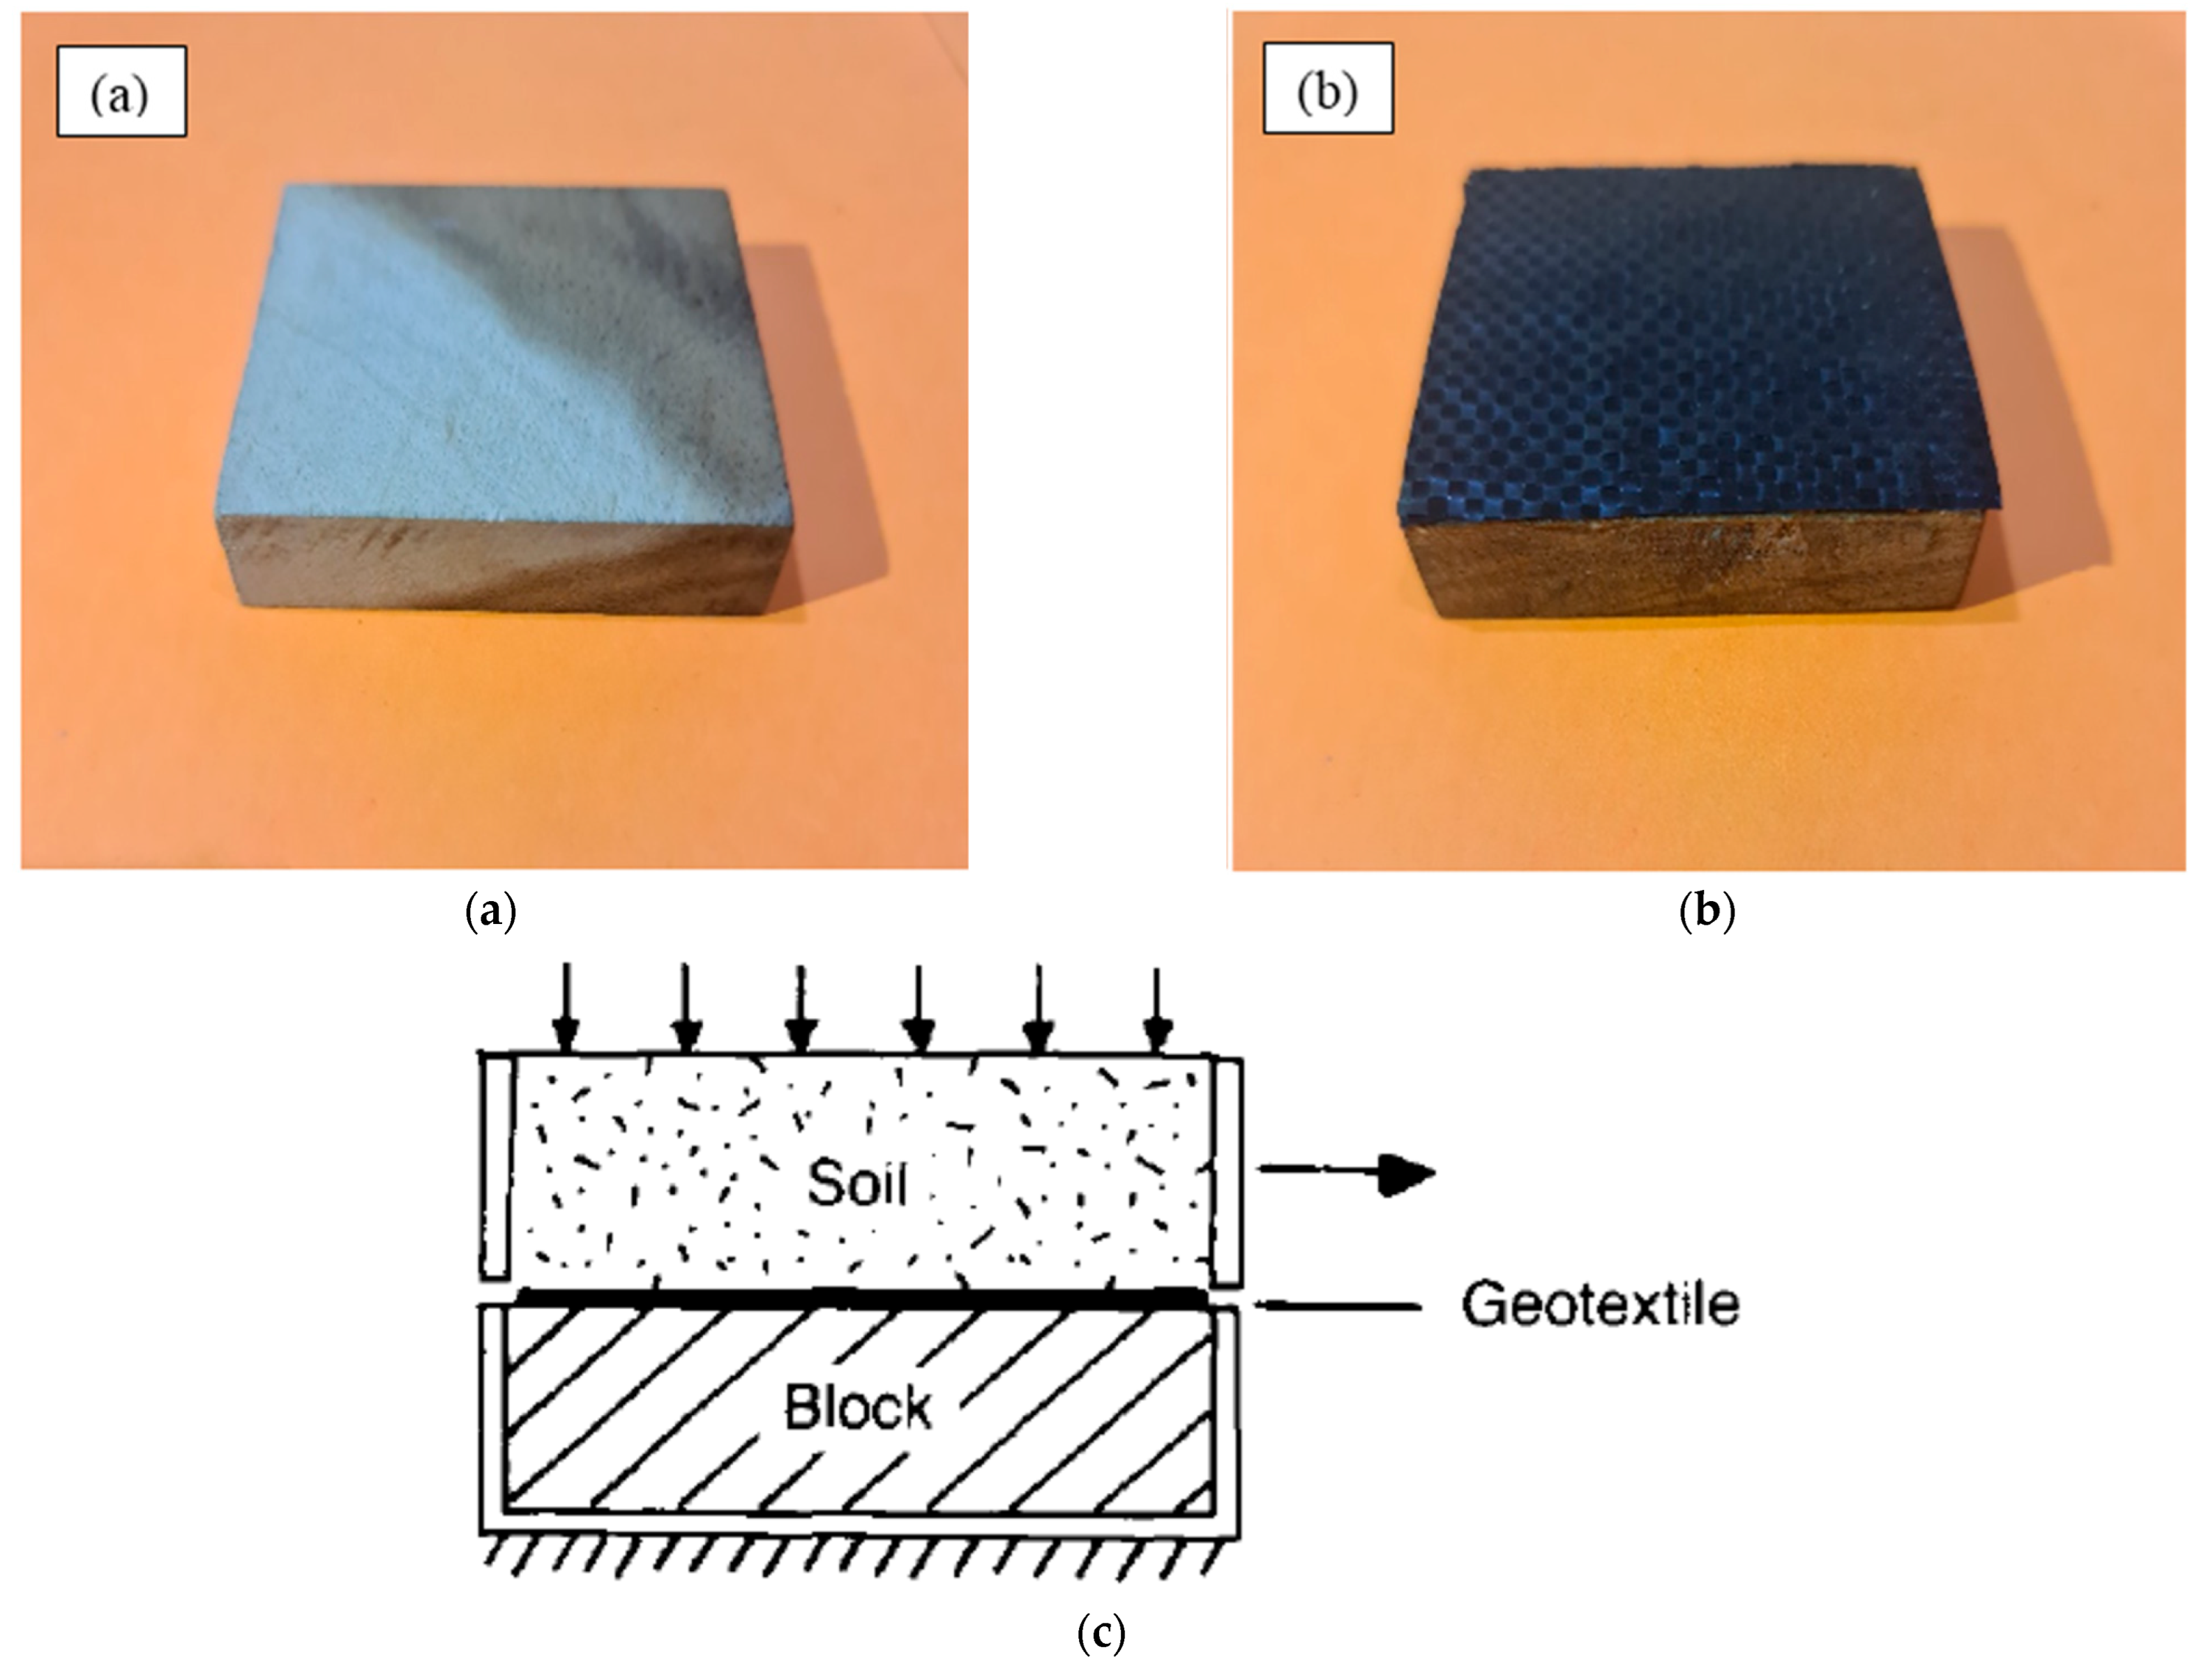
2.3. Direct Shear Test
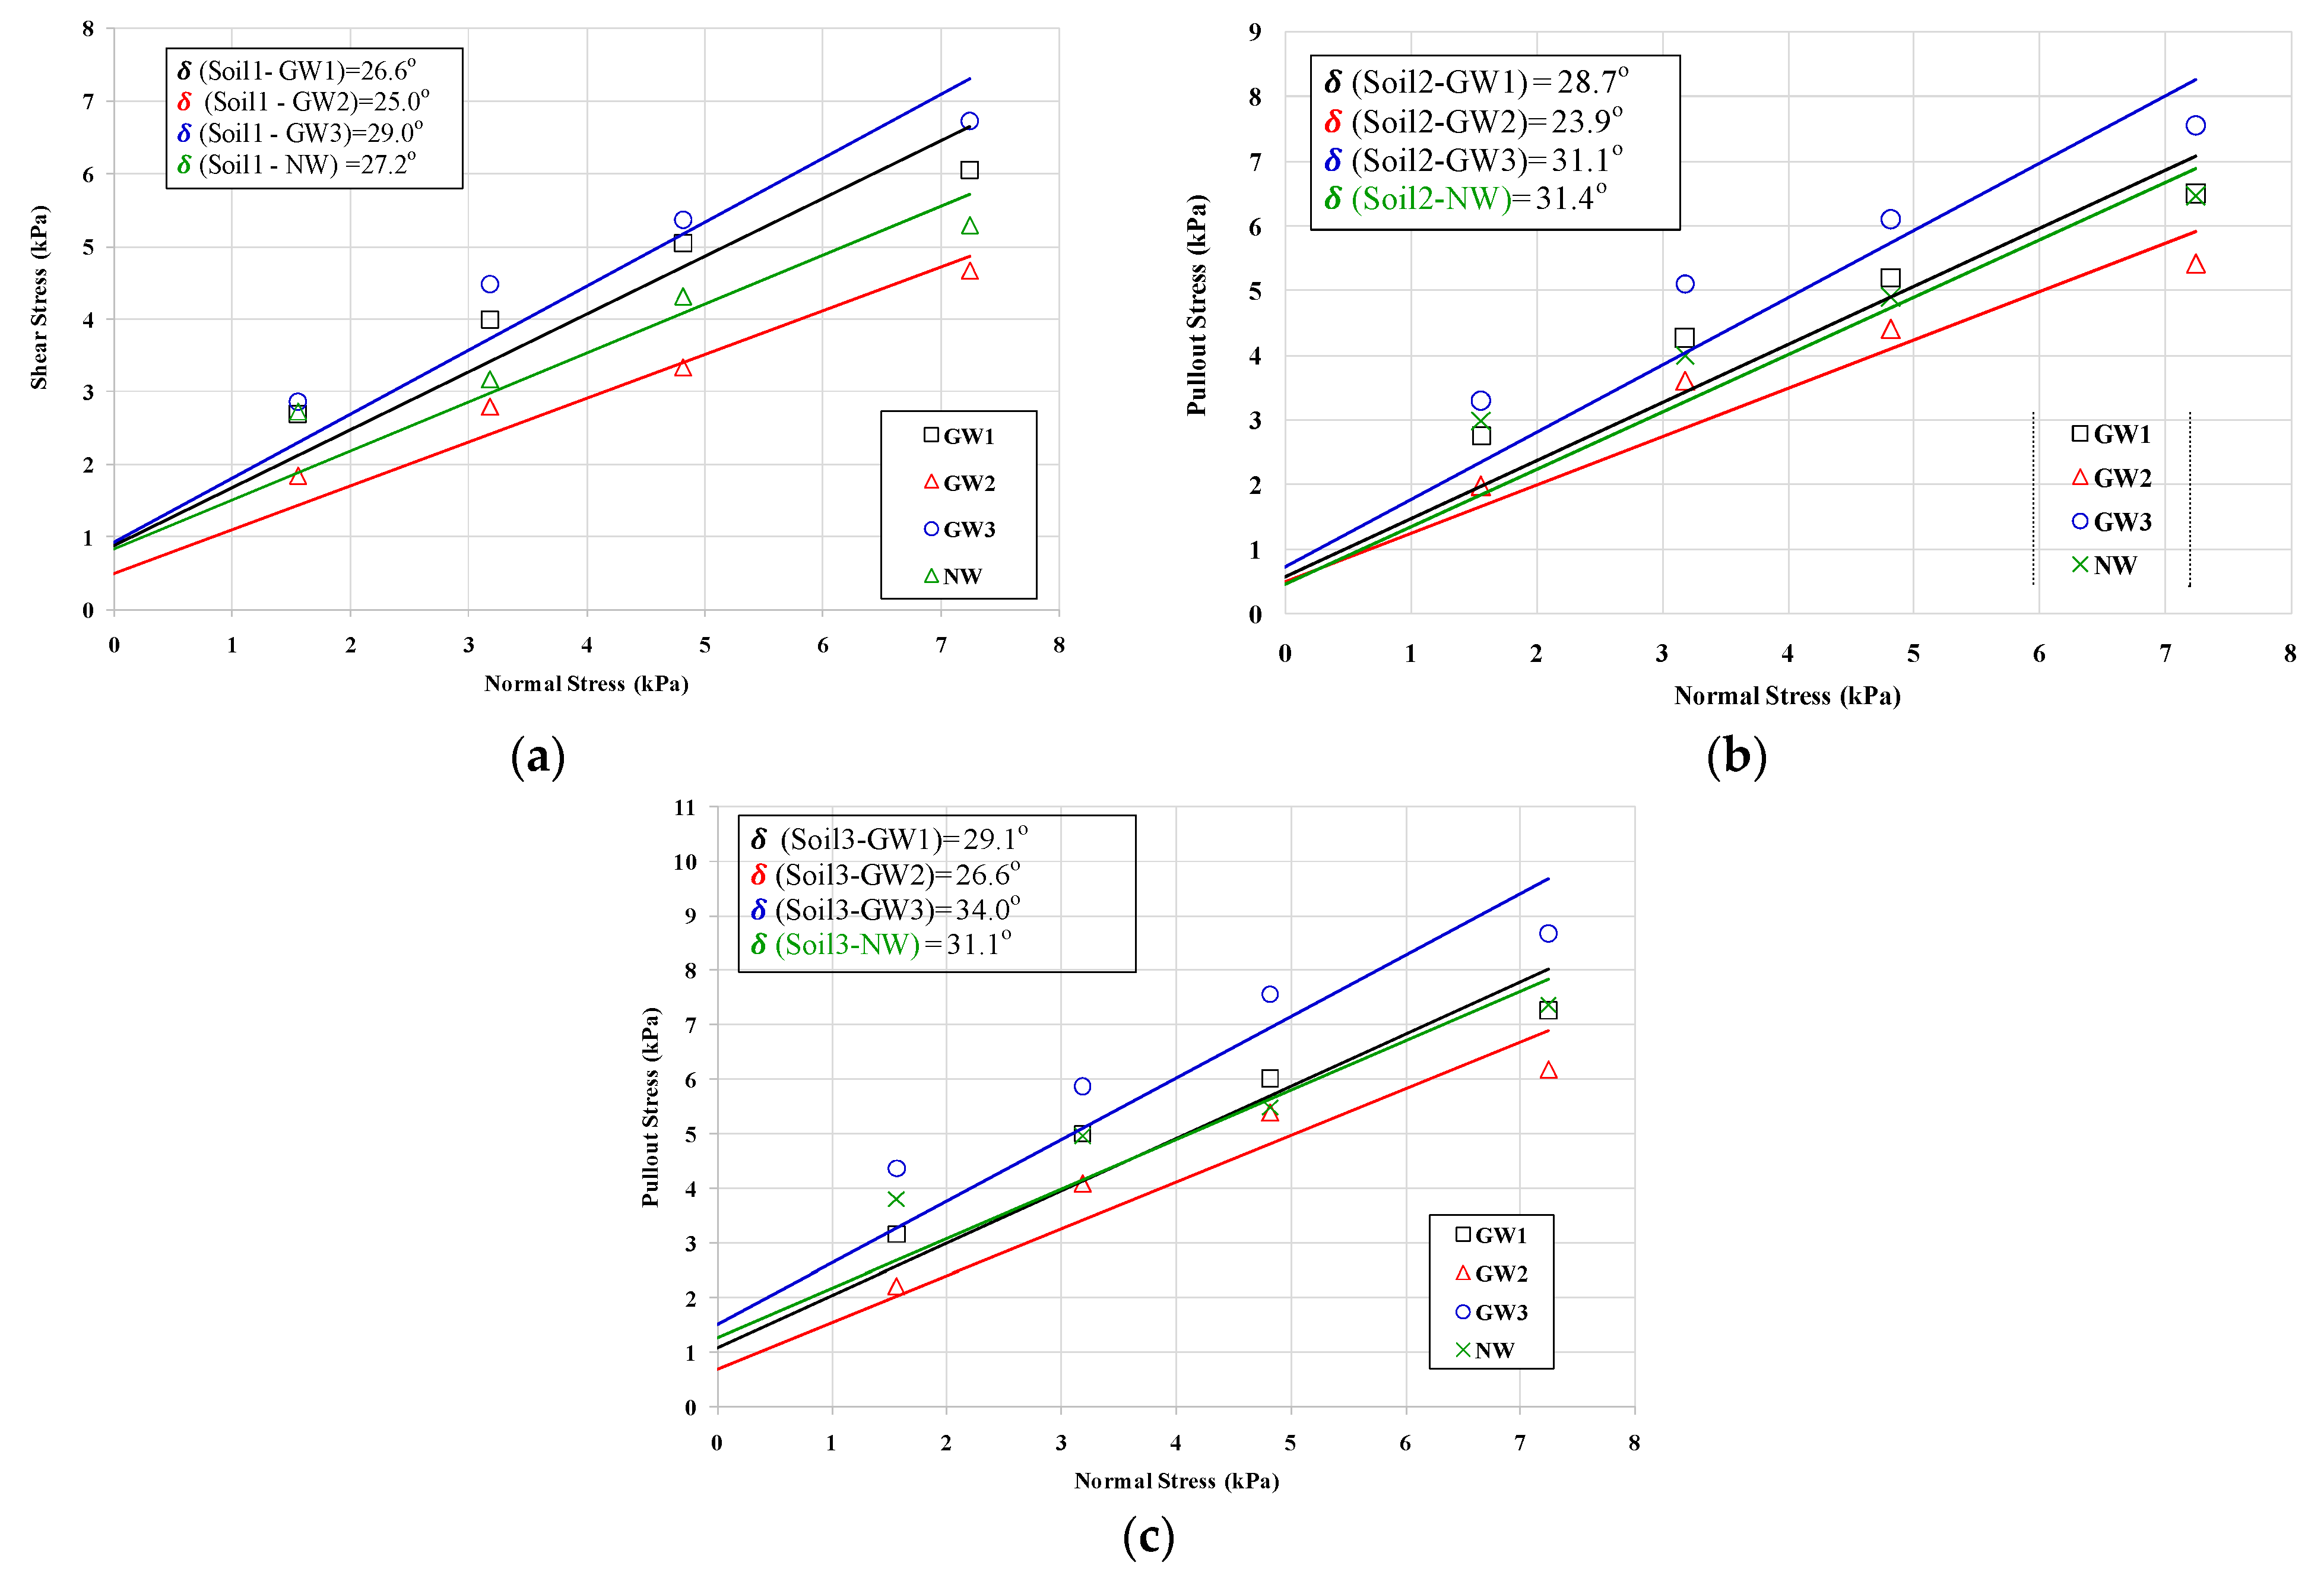
In most common modified direct shear tests performed for geotextiles, the geotextile reinforcement is fixed to some rigid block or support and placed in the lower half of the shear box [23]. The soil mass in the upper half of the shear box is made to slide against the geotextile surface while the load is applied normally to the geotextile surface to determine the interface friction characteristics of soil-geotextile interfaces. The applied normal load and the horizontal and vertical displacements are recorded using one load cell and two displacement transducers each for horizontal and vertical displacement. This is the basic concept of interface direct shear test (DST) which can be used to quantify the interaction behaviour of soil-geotextiles. Figure 6 shows the schematic sketch of a typical modified direct shear test [24]. ASTM [24] suggests the use of a large-scale direct shear box with plan dimensions of 300 mm × 300 mm. However, geosynthetic-soil interface shear strength can also be studied using a small shear box (60 mm × 60 mm) and the results are comparable [20]. In this study, the modified direct shear setup used is a conventional 60 mm × 60 mm shear box. The geotextile specimen was mounted on arigid wooden block with a roughened upper surface (Figure 6). The geotextile specimen is carefully cut to the size of the wooden block and mounted on the upper surface with adhesive. Since the geosynthetic samples varied in thickness, the size of the wooden block was challenging because the overall height of the block including the mounted geosynthetic should be such that it perfectly fits in the lower half of the shear box and meets the separation of the two halves so that during the test process the shearing takes place at the soil-geosynthetic interface accurately. If the overall height of the rigid block with geosynthetic falls short by even half a millimeter, the shearing shall not take place at the interface of soil and geosynthetic resulting in erroneous friction parameters. Similarly, if the overall height of the rigid block becomes a little higher, the block will go into the upper half of the shear box and the test will not proceed. To overcome this problem, wooden blocks of four different sizes were used for four different thicknesses of geosynthetic specimens, and additionally, a wooden spacer was used to further fine-tune the height of components of the lower half of the shear box. The sand was filled in the upper half of the shear box in three equal layers and carefully compacted with equal compaction energy to achieve a relative density of 95% (dense state) for all the interface direct shear tests. The strain rate was maintained at 1 mm/min for all the tests and tests were performed with three different levels of normal stresses of 24, 37, and 50 kPa. Readings of load and displacements were recorded at equal intervals from the load dial gauge and horizontal displacement dial gauge, respectively.

3. Results

VPT Results

Results of pullout tests (VPT) performed on Soil2 using the test setup mentioned in detail in previous sections, at a relative density of 50% have been represented in Figure 7 in terms of Mohr-Coulomb envelopes. All the tests have been carried out for dry conditions and maintain a steady pullout rate in such a way that the complete reinforcement is pulled in 60 s. For each geotextile-soil combination, at least three tests were performed with each normal stress value to ensure consistency of results, and three sets of normal stresses were applied. The lowest value of normal stress did not include the surcharge load and only the soil lateral earth pressure was utilized as the normal stress on the geotextile.
Figure 7 shows the results for Soil1, Soil2, and Soil3. The measured interface friction angle for GW2 for all soil sample is minimum (23.9~26.6°) i.e 76~91% of that interface friction angle for the NW specimen. All four geotextiles (GW1, GW2, GW3, and NW) were tested with three Soils (Soil1, Soil2, and Soil3) using a vertical pullout test (VPT). Since all three soils used in this study were cohesionless therefore the adhesion values for all interfaces were negligible.

4. Discussion

The discussion regarding the test results is as follows.

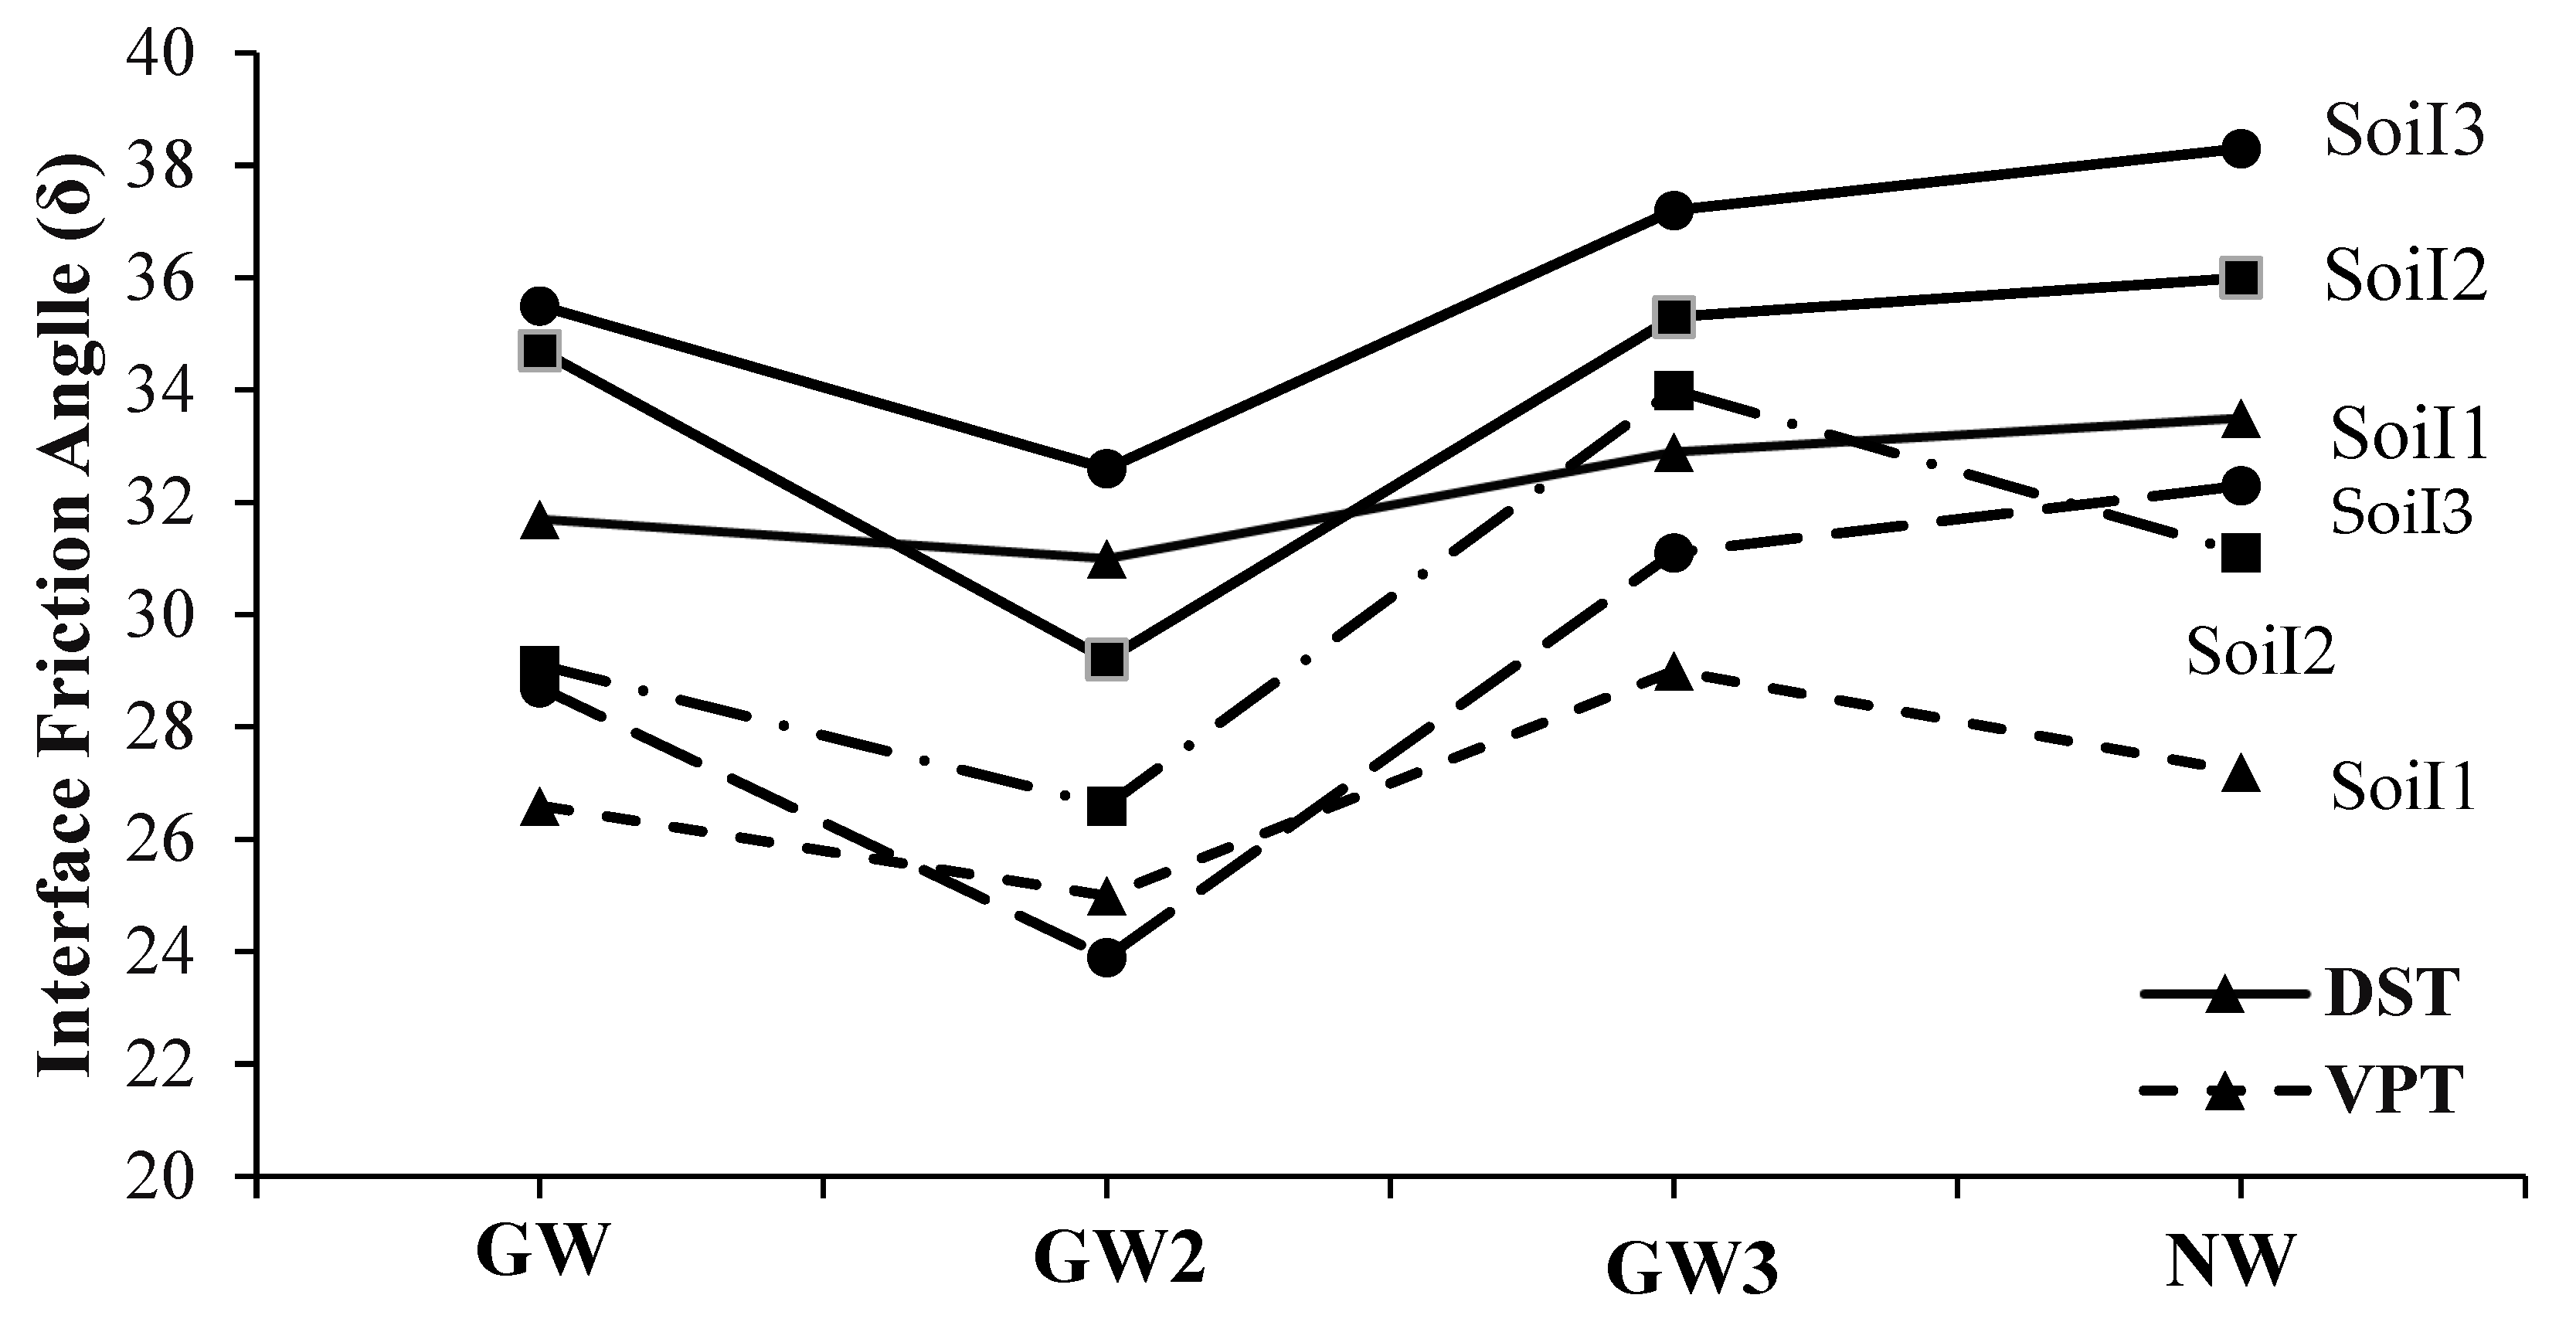
4.1. Comparison of VPT and Direct Shear Test

A comparison of the results obtained from DST and VPT is summarized in Figure 7. The results indicate that the values from DST are higher as compared to the pullout test and the values of interface friction angles are up to 19% smaller than that of DST, due to dissimilar boundary conditions in direct shear and pullout tests. Secondly, the normal stresses applied in pullout tests were comparatively smaller than that of direct shear tests.
Also in pullout mode, the reinforcement undergoes large deformations which result in comparatively lower friction. Figure 7 shows the comparison of interface friction angles from DST and VPT. It can be noted that the friction angles from VPT for GW3 and NW are closer to DST values as compared to GW1 and GW2 which is attributed to the rough surface texture of GW3 and NW specimens as compared to the smooth texture of GW1 and GW2. The interface shear strength for rough textured geotextiles is mainly due to grain-grain interlock resulting in higher friction.
Figure 8 shows the behaviour of soil-geotextile interaction of three different soils with non-woven geotextile (NW). The results from the graph indicate that peak shear stresses are 39.64, 40.02, and 43.34 kPa for Soil1, Soil2, and Soil3 with the non-woven geotextile (NW), respectively. These peak shear stress values are higher than that of woven geotextile (GW1). This suggests that non-woven geotextile developed better interactions with the neighboring soil which may be attributed to its relatively rough surface texture. The rough texture of non-woven geotextile (NW) allowed the soil particles to stick to its surface and coarser particles were also able to penetrate the surface. Further, VPT shows conservative interface strength owing to the fact actual stiffness of geotextiles is being incorporated in VPT (Figure 8); meanwhile in DST, the stiffness of geotextile increases due to mounting it on a wooden box. Therefore, VPT presents a more realistic approach to evaluating the interfacial strength of the geotextile-soil reinforcement.

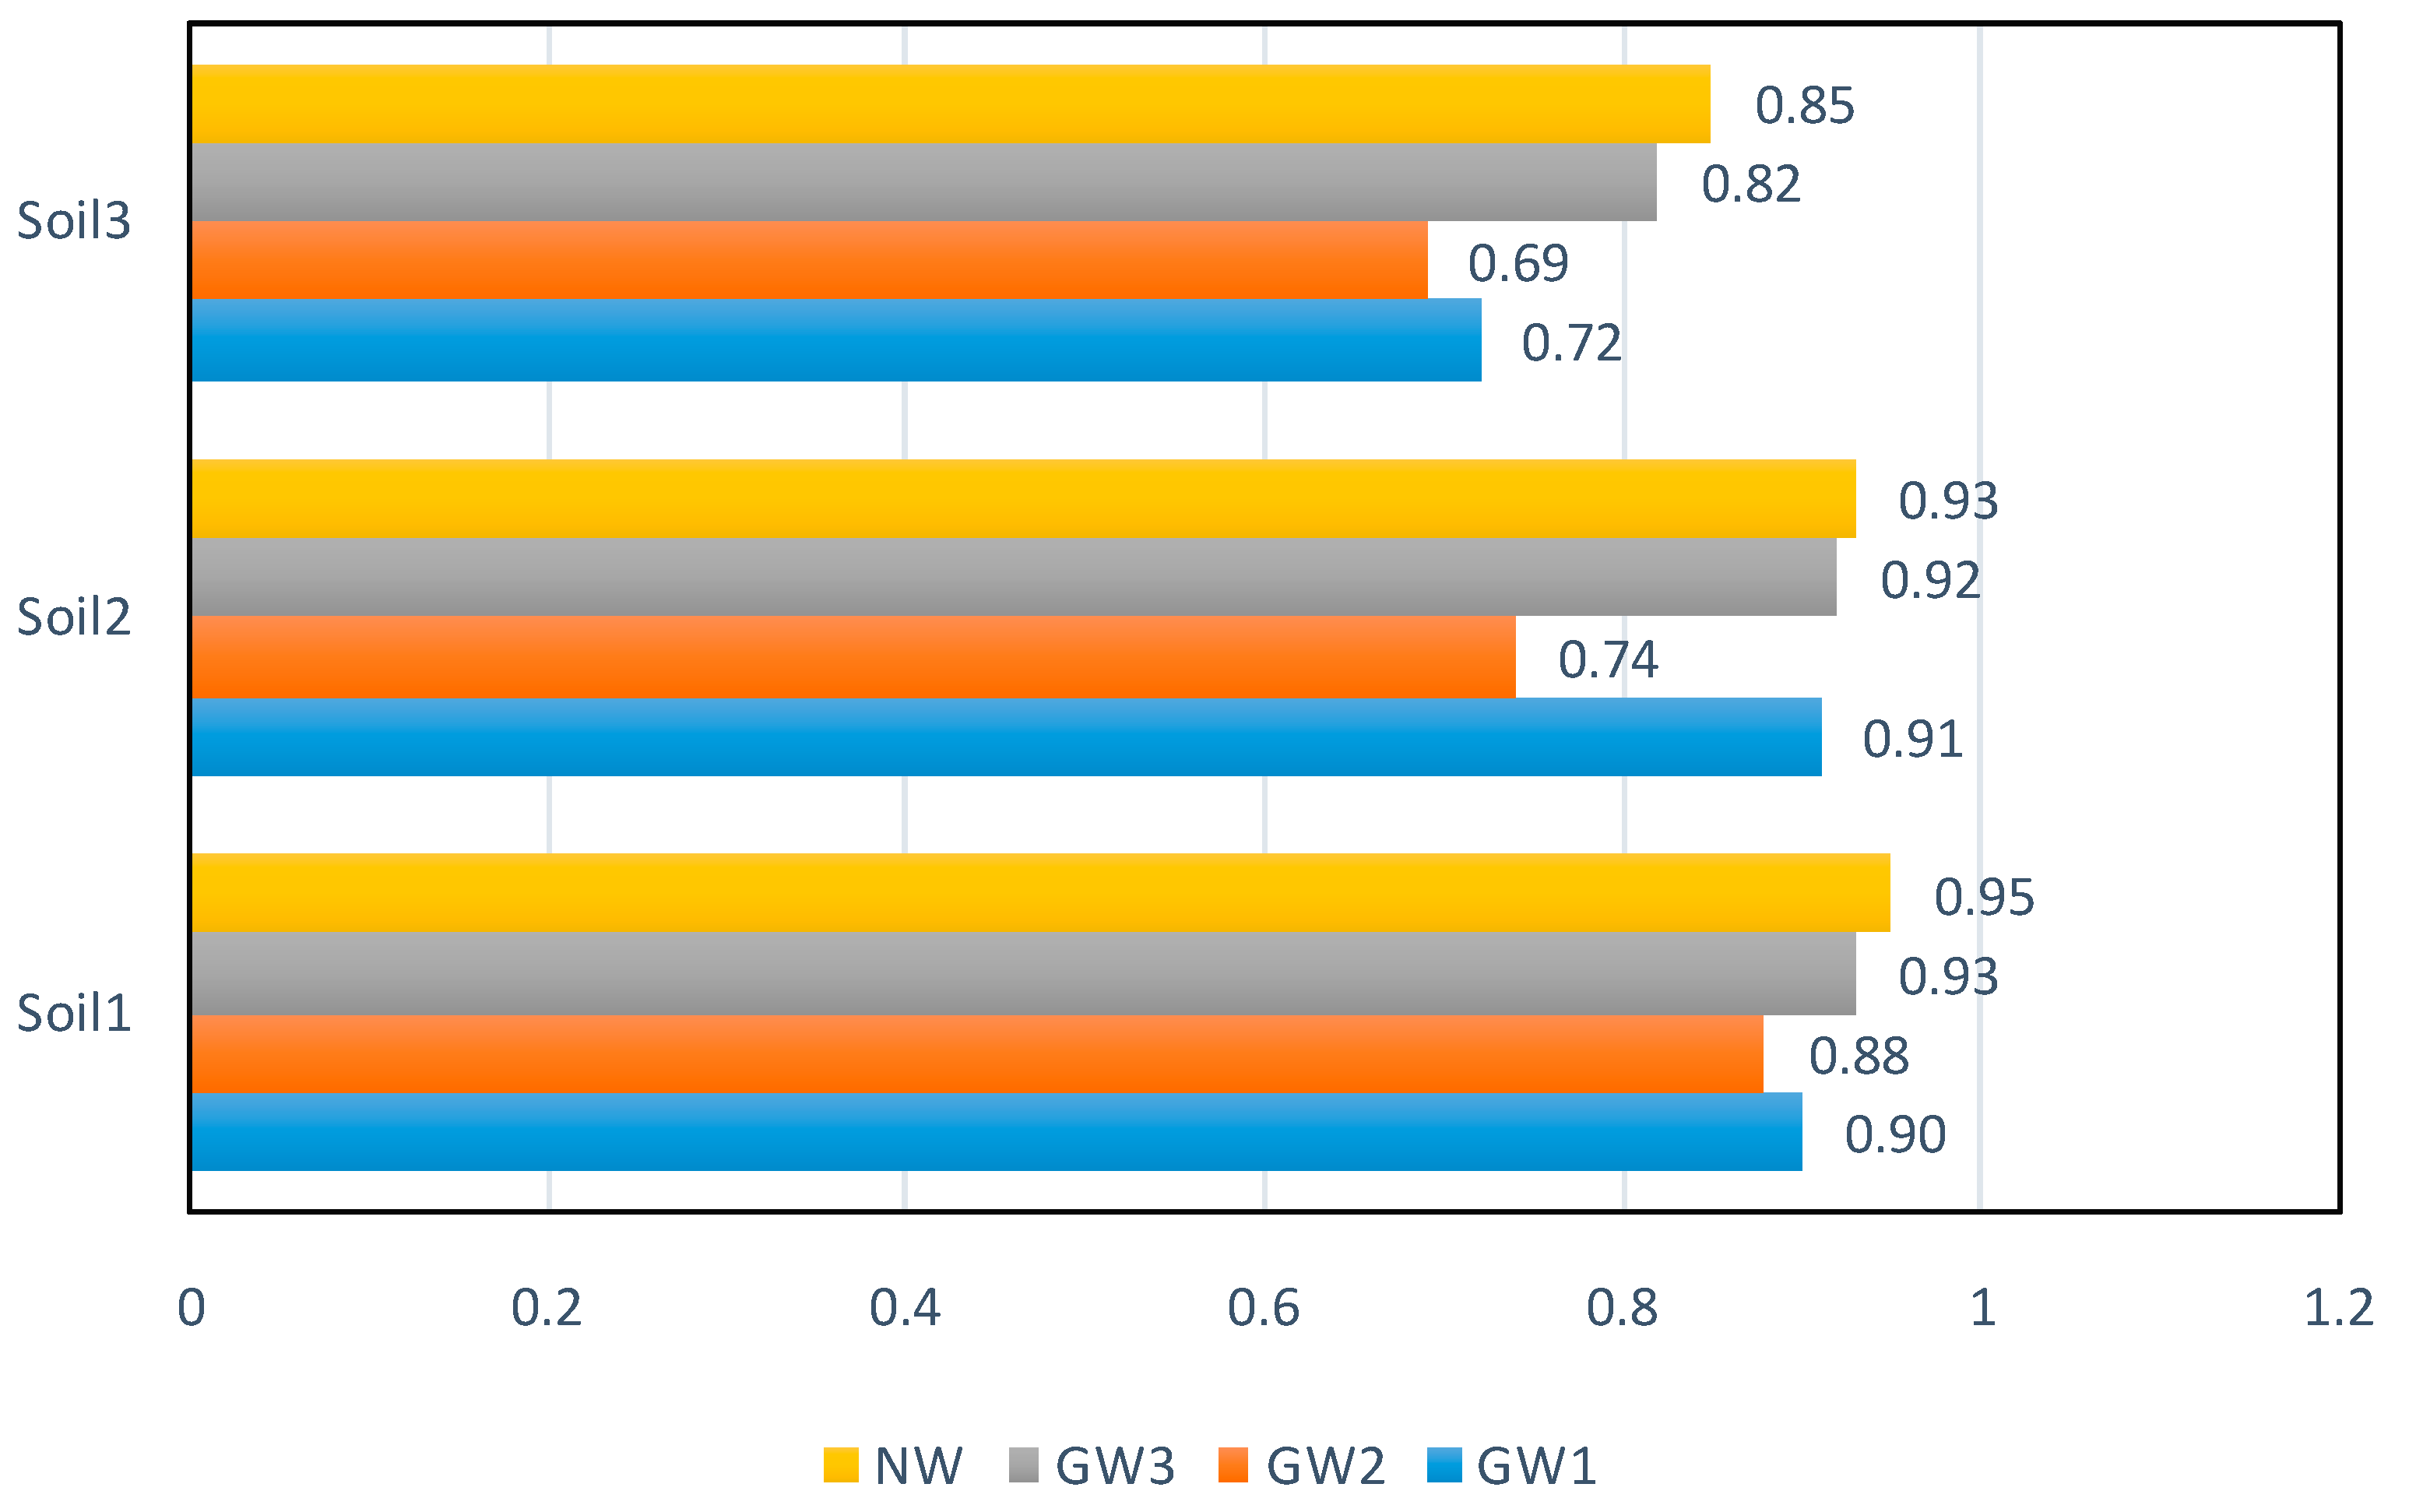
4.2. Interface Efficiency

Figure 9 and Table 3 show the behaviour of soil-geotextile interaction of three different soils with non-woven geotextile (NW). The results from the graph indicate that peak shear stresses are 39.64, 40.02, and 43.34 kPa for Soil1, Soil2, and Soil3 with non-woven geotextile (NW), respectively. These peak shear stress values are higher than that of woven geotextile (GW1). The interface efficiency ranged from 0.69 to 0.97; meanwhile, for non-woven geotextiles, the efficiency values are up to 22% higher as compared to woven geotextiles due to their texture. This suggests that non-woven geotextile developed better interactions with the neighboring soil which may be attributed to its relatively rough surface texture. The rough texture of non-woven geotextile (NW) allowed the soil particles to stick to their surface and coarser particles were also able to penetrate the surface.

5. Conclusions

The research study has been conducted to evaluate the soil-geosynthetic interaction mechanism. The interface friction parameters including interface friction angle, pullout resistance, and interface efficiency were determined by performing a series of laboratory tests including a modified direct shear test and vertical pullout test. These tests were performed on three types of sand and four different types of geosynthetics. The parameters thus determined are useful for the analyses and design of geosynthetic reinforced soil structures. Based on the laboratory investigations, the following conclusions can be made:
  • The interaction of the sand-geotextile interface can be described by a linear failure envelope with interface efficiency ranging from 0.67~0.97.
  • The sand-geotextile behavior depends on the type of geotextile and its surface characteristics. The interface efficiency of NW is 3~22% higher than the woven geotextile which is due to the rough surface of the non-woven geotextile.
  • Modified direct shear test and vertical pullout test indicated that particle size has a marked influence on interface friction parameters. Interface friction angle increased by 1.6~4.8 degrees and friction coefficient values increased by 6.5~19.3% from Soil1 to Soil 3, respectively for the same geosynthetic reinforcement.
  • VPT test yields a friction angle, i.e., 9~19% smaller as compared to the friction angles obtained by the modified direct shear test owing to the fact that the actual stiffness of the geotextile is incorporated in the VPT, meanwhile, the stiffness of the geotextile is increased by mounting it on a wooden box. Thus, VPT presents a more conservative and safe design parameter for geotextile interfacial strength.
Despite the fact, that the experimental outcomes show emphatic effects regarding the shear strength improvement of non-cohesive soils with reinforcements, the laboratory scales may limit the results, such as the size of the soil specimen or dimensions of the testing apparatus. Therefore, it is recommended to execute experiments on a broader scale by using a larger size sample simulating the field conditions.

Author Contributions

Conceptualization, M.R., Z.U.R., S.Z.A., S.M.S.K. and M.J.M.; formal analysis, M.R. and Z.U.R.; investigation, S.Z.A., H.M., M.R. and Z.U.R.; methodology, S.Z.A.; resources, H.M. and K.F.; supervision, H.M. and K.F.; validation, K.F. and S.M.S.K.; visualization, M.J.M.; writing—original draft, M.R. and Z.U.R.; writing—review and editing, S.Z.A., H.M. and M.J.M. All authors have read and agreed to the published version of the manuscript.

Funding

This research received no external funding.

Data Availability Statement

Not applicable.

Acknowledgments

The authors express their gratitude to the Department of Civil Engineering, University of Engineering & Technology, Lahore to conduct the study.

Conflicts of Interest

The authors declare no conflict of interest.

References

  1. Yang, K.-H.; Yalew, W.M.; Nguyen, M.D. Behavior of Geotextile-Reinforced Clay with a Coarse Material Sandwich Technique under Unconsolidated-Undrained Triaxial Compression. Int. J. Géoméch. 2016, 16, 4015083. [Google Scholar] [CrossRef]
  2. Bhandari, A.; Han, J. Investigation of geotextile–soil interaction under a cyclic vertical load using the discrete element method. Geotext. Geomembr. 2010, 28, 33–43. [Google Scholar] [CrossRef]
  3. Reddy, Y.R.; Reddy, T.R.P. Stabilization of Soil by using Waste Fiber Materials. Int. J. Adv. Tech. Innov. Res. 2016, 8, 2963–2966. [Google Scholar]
  4. Cen, W.-J.; Wang, H.; Sun, Y.-J. Laboratory Investigation of Shear Behavior of High-Density Polyethylene Geomembrane Interfaces. Polymers 2018, 10, 734. [Google Scholar] [CrossRef] [PubMed]
  5. Yetimoglu, T.; Salbas, O. A study on shear strength of sands reinforced with randomly distributed discrete fibers. Geotext. Geomembr. 2003, 21, 103–110. [Google Scholar] [CrossRef]
  6. Chen, X.; Zhang, J.; Li, Z. Shear behaviour of a geogrid-reinforced coarse-grained soil based on large-scale triaxial tests. Geotext. Geomembr. 2014, 42, 312–328. [Google Scholar] [CrossRef]
  7. Tang, L.; Cong, S.; Ling, X.; Lu, J.; Elgamal, A. Numerical study on ground improvement for liquefaction mitigation using stone columns encased with geosynthetics. Geotext. Geomembr. 2015, 43, 190–195. [Google Scholar] [CrossRef]
  8. Consoli, N.C.; Vendruscolo, M.A.; Fonini, A.; Rosa, F.D. Fiber reinforcement effects on sand considering a wide cementation range. Geotext. Geomembr. 2009, 27, 196–203. [Google Scholar] [CrossRef]
  9. Dai, Z.-H.; Guo, W.-D.; Zheng, G.-X.; Ou, Y.; Chen, Y.-J. Moso Bamboo Soil-Nailed Wall and its 3D Nonlinear Numerical Analysis. Int. J. Géoméch. 2016, 16, 4016012. [Google Scholar] [CrossRef]
  10. Chen, M.; Shen, S.-L.; Arulrajah, A.; Wu, H.-N.; Hou, D.-W.; Xu, Y.-S. Laboratory evaluation on the effectiveness of polypropylene fibers on the strength of fiber-reinforced and cement-stabilized Shanghai soft clay. Geotext. Geomembr. 2015, 43, 515–523. [Google Scholar] [CrossRef]
  11. Cheng, Y.M.; Choi, Y.K.; Yeung, A.T.; Tham, L.G.; Au, S.K.; Wei, W.B.; Chen, J. New soil nail material—Pilot study of grouted GFRP pipe nails in Korea and Hong Kong. J. Mater. Civil Eng. 2009, 21, 93–102. [Google Scholar] [CrossRef]
  12. Cheng, Y.; Au, S.; Pearson, A.; Li, N. An innovative Geonail system for soft ground stabilization. Soils Found. 2013, 53, 282–298. [Google Scholar] [CrossRef]
  13. Cheng, Y.; Au, S.; Yeung, A.T. Laboratory and field evaluation of several types of soil nails for different geological conditions. Can. Geotech. J. 2015, 53, 634–645. [Google Scholar] [CrossRef]
  14. Anubhav; Basudhar, P.K. Interface Behavior of Woven Geotextile with Rounded and Angular Particle Sand. J. Mater. Civ. Eng. 2013, 25, 1970–1974. [Google Scholar] [CrossRef]
  15. Markou, I.N. Direct Shear Testing of Sand—Geotextile Interfaces. In Advances in Reinforced Soil Structures, GeoMEast, 2017. Sustainable Civil Infrastructures; Shukla, S., Guler, E., Eds.; Springer: Cham, Switzerland, 2018. [Google Scholar] [CrossRef]
  16. Tuna, S.; Altun, S. Mechanical behavior of sand-geotextile interface. Sci. Iran. 2012, 19, 1044–1051. [Google Scholar] [CrossRef]
  17. Abdi, M.R.; Gonbad, M.S.S. Studying the effect of roughness on soil-geotextile interaction in direct shear test. J. Eng. Geol. 2018, 12, 1–30. [Google Scholar]
  18. Hsieh, C.W.; Chen, G.H.; Wu, J.H. The shear behavior obtained from the direct shear and pullout tests for different poor graded soil-geosynthetic systems. J. GeoEng. 2011, 6, 15–26. [Google Scholar]
  19. ASTM D5261-10; Standard Test Method for Measuring Mass per Unit Area of Geotextiles. ASTM International: West Conshohocken, PA, USA, 2018. Available online: www.astm.org (accessed on 23 April 2020).
  20. ASTM D4595-17; Standard Test Method for Tensile Properties of Geotextiles by the Wide-Width Strip Method. ASTM International: West Conshohocken, PA, USA, 2017. Available online: www.astm.org (accessed on 30 June 2020).
  21. ASTM D5199-12; Standard Test Method for Measuring the Nominal Thickness of Geosynthetics. ASTM International,: West Conshohocken, PA, USA, 2019. Available online: www.astm.org (accessed on 15 April 2020).
  22. Shukla, R.P.; Parihar, N.S.; Gupta, A.K. The effect of geotextile on low plastic sandy clay. In Proceedings of the 6th Asian Regional Conference on Geosynthetics—Geosynthetics for Infrastructure Development, New Delhi, India, 8–11 November 2016; pp. 251–259. [Google Scholar]
  23. Rehman, Z.U.; Zhang, G. Shear coupling effect of monotonic and cyclic behavior of the interface between steel and gravel. Can. Geotech. J. 2019, 56, 876–884. [Google Scholar] [CrossRef]
  24. ASTM D 5321-12; Standard Test Method for Determining the Shear Strength of Soil-Geosynthetic and Geosynthetic-Geosynthetic Interfaces by Direct Shear. ASTM International: West Conshohocken, PA, USA, 2017. Available online: www.astm.org (accessed on 15 May 2020).
Figure 1. Particle size distribution of various sands used in the study.
Fibers 10 00084 g001
Figure 2. Four different types of geotextiles, three woven; (a) GW1, (b) GW2, and (c) GW3, and one non-woven (d) (NW) used in this study. Particle size distribution for different sands used in this study.
Fibers 10 00084 g002
Figure 3. Wide-width strip test on geosynthetics used in the current research.
Fibers 10 00084 g003
Figure 4. Assembled VPT setup (a) without surcharge and (b) with surcharge. (c) Clamp and hanger fabricated for holding the reinforcement and digital scale in VPT.
Fibers 10 00084 g004
Figure 5. Surcharge load application philosophy.
Fibers 10 00084 g005
Figure 6. (a) Wooden blocks of different heights fabricated to place in the lower half of the shear box, (b) geosynthetic reinforcement mounted on top of the wooden block for interface shear tests, (c) direct shear test philosophy.
Fibers 10 00084 g006
Figure 7. Interface friction angles obtained through vertical pullout with different geosynthetics. (a) Geosynthetics~Soil1,(b) Geosynthetics~Soil2,(c) Geosynthetics~Soil3.
Fibers 10 00084 g007
Figure 8. Comparison of interface friction angles obtained from modified direct shear tests and vertical pullout tests for various soil-geotextile interfaces.
Fibers 10 00084 g008
Figure 9. Interface efficiency of soils~geosynthetics.
Fibers 10 00084 g009
Table 1. Properties of soils used in this study.
PropertyType/Value
Soil1Soil2Soil3
Effective Size, D10 (mm)0.090.160.17
D50(mm)0.190.260.75
D85 (mm)0.330.401.24
Coefficient of uniformity, Cu2.671.752.94
Coefficient of Curvature, Cc1.040.981.36
Friction angle, ϕ (deg)34.437.242.9
Specific Gravity, Gs2.672.672.66
Maximum index density,γdmax (kN/m3)15.9516.0317.69
emin0.630.640.47
emax0.960.930.73
Soil classification (USCS)*SP*SP*SP
*SP—Poorly graded sand.
Table 2. Properties of geotextiles used in this study.
MaterialPolymerMass/Unit AreaThicknessEffective Opening SizeUltimate Tensile StrengthAxial Strain at Failure
g/m2mmmmKN/m%
GW1PP310 0.42576.28.0
GW2PP190 0.2024.06.8
GW3PET2951.20.45103.815.7
NWPET1500.4--3.342.5
GW1: Woven Geotextile (PP), GW2: Split Yarn Woven Geotextile (PP), GW3: Woven Geotextile (PET), NW: Non-woven Geotextile (PET), PP: Polypropylene, PET: Polyester Yarn.
Table 3. Interface friction parameters including friction angles, friction coefficient, and interface efficiency from modified direct shear tests.
Interface TypeInterface Friction Angle, δ (°)Interface Friction Coefficient (tanδ)Interface Efficiency, Eϕ (tanδ/tanϕ)
Soil1-Soil134.4
Soil1-GW131.70.6180.90
Soil1-GW231.00.6010.88
Soil1-GW332.90.6470.94
Soil1-NW33.50.6620.97
Soil2-Soil237.2
Soil2-GW134.70.6920.91
Soil2-GW229.20.5590.74
Soil2-GW335.30.7080.93
Soil2-NW36.00.7270.96
Soil3-Soil342.9
Soil3-GW135.50.7130.77
Soil3-GW232.60.6400.69
Soil3-GW337.20.7590.82
Soil3-NW38.30.7900.85
Publisher’s Note: MDPI stays neutral with regard to jurisdictional claims in published maps and institutional affiliations.

