Application of FEM to Estimate Thermo-Mechanical Properties of Plasma Sprayed Composite Coatings

1
ICB-LTM, Université de Bourgogne Franche-Comté, IUT Le Creusot, 12 rue de la fonderie, 71200 Le Creusot, France
2
ICB-LERMPS, Université de Bourgogne Franche-Comté, UTBM, 90010 Belfort cedex, France
*
Author to whom correspondence should be addressed.
Coatings 2017, 7(7), 91; https://doi.org/10.3390/coatings7070091
Submission received: 31 May 2017
/
Revised: 20 June 2017
/
Accepted: 22 June 2017
/
Published: 30 June 2017
(This article belongs to the Special Issue Modelling and Simulation of Coating)
Abstract
:The presence of defects such as voids, inter-lamellar porosities or cracks causes a decrease in the effective thermal conductivity of plasma-sprayed coatings as well as a decrease in corresponding mechanical properties, such as the Young’s modulus. In general, the effective properties of thermal spray coatings are thus very different from that of bulk materials and thus have to be quantified to validate in service performances. A complementary approach allowing us to understand the relationships between the microstructure of a coating and its macro-properties is that of Finite Element Modeling (FEM). The case of composite coatings is more complicated still, due to the presence of different materials. In the present study, thermo-mechanical properties of a plasma-sprayed composite coating were estimated by numerical modeling based on FEM. The method applied uses directly cross-sectional micrographs without simplification, using a one-cell per pixel approach. Characteristics such as the thermal conductivity, the Young’s modulus, the Poisson’s ratio and the dilatation coefficient were considered. The example selected was an AlSi/polyester coating used as an abradable seal in the aerospace industry.
1. Introduction
The use of numerical methods such as Finite Element Modeling (FEM) to estimate the homogenized properties of thermal spray coatings has become a good complementary approach to experimental characterizations. Usually, these methods are based on virtual loadings performed on cross-sectional micrographs. Most of the time, they allow a better understanding and interpretation of the measurements. In addition, calculations can also provide general trends to respect, as well as a classification of the coatings produced with different parameter sets. A coupling with a calibration process can also provide quantitative results for the properties investigated.
The famous code OOF [1] (Object Oriented Finite Element Analysis of Microstructures) developed by the US National Institute of Standards and Technology (NIST) was largely applied to estimate the effective properties of thermal spray coatings during the last 16 years [2,3,4,5,6,7,8,9,10,11]. In practice, this free tool developed under linux is very useful but requires much RAM, which was problematic until the development of 64-bit computer system architectures.
Concerning the large application of OOF, Langer et al. [2] used this code to perform FEM calculations in order to estimate the macroscopic properties of materials from their microstructure. Kulkarni et al. [3] completed their own experimental works with FEM calculations of the effective thermal conductivity and Young’s modulus performed on artificial micrographs, in the case of partially stabilized zirconia thermal barrier coatings (PSZ TBC coatings): The results calculated were somewhat overestimated in comparison with experiments. Similarly, Wang et al. [4] performed calculations on real cross-section micrographs of coatings to estimate the effective thermal conductivity and Young’s modulus of similar PSZ TBC coatings. For as-sprayed coatings, the results calculated were overestimated in comparison with measurements. However, a better agreement was obtained for thermal cycled coatings, meaning that small scale cracks in the as-sprayed coating could explain the discrepancies for the former case. On their side, Tan et al. [5] compared the predicted and experimental values of the thermal conductivity of thermal spray coatings. Michlik and Berndt [6] also used OOF and a preprocessing program called PPM2OOF to performed FEM calculations of the thermal conductivity and Young’s modulus of TBC coatings. Around the same time, Jadhav et al. [7] also estimated the effective thermal conductivity of PSZ TBC coatings by using calculations performed on cross-sectional micrographs. Faraoun et al. [8] obtained estimations of the macroscopic properties of abradable coatings from mechanical calculations also performed with OOF on simplified 2D images of the coating microstructure, in their procedure, they applied a lowering factor of 24% to the properties of the phases. The new meshing capabilities of OOF2 for this type of application were then presented by Reid et al. [9]. Bolot et al. [10], compared the thermal conductivity of AlSi/polyester abradable coatings calculated with FEM methods such as OOF2 (nodal formulation), with data obtained with an in-house finite difference model based on a cell-center formulation. The advantage of the proposed FD model was mainly the very low consumption of RAM in comparison with OOF2. The differences observed between the different results were found to decrease with the increase of the micrograph resolution. Gupta et al. [11] again used OOF2 to characterize a new generation of TBC coatings; for each of their coatings, heat treatment was found to provide an increase in thermal conductivity. Tillmann et al. [12] and Klusemann et al. [13] applied an alternative approach using OOF2 to create the mesh and applying ABAQUS (Dassault Systèmes Simulia Corp., Providence, RI, USA) to perform similar FE calculations. More recently, 3D reconstruction techniques and 3D virtual coating volumes were used to allow the performance of 3D calculations of the effective properties, such as in the works of Wiederkehr et al. [14], Bobzin et al. [15] or Qiao et al. [16,17,18]. In this work, a 2D model based on the use of real cross-sectional micrographs of the coating was used, and a series of 8 different calculations was established to allow the calculation of a complete set of properties, namely:
- The in-plane and through-thickness thermal conductivities κx and κy;
- The in-plane and through-thickness dilatation coefficients αx and αy;
- The 4 values of the above mechanical constitutive law Ex, Ey, νxy, νyx.
2. Mechanical Constitutive Law
Thermal spray composite coatings are strongly anisotropic materials [19] thus presenting different thermal and mechanical properties depending on the direction considered. Among anisotropic materials, orthotropic materials represent a specific family with well-defined preferred directions. For example, composite fiber materials are a good illustration of orthotropic materials. Due to their manufacturing process, thermal spray coatings are usually considered as orthotropic materials with different effective properties in the through thickness and in-plane directions. More particularly, this type of material is said to be “transverse isotropic”, meaning that coating effective properties can be considered as isotropic in the coating plane but that their properties are different in the direction normal to the surface (i.e., through-thickness). Tan et al. [20] quantified the ratio between the Young’s modulus in the through-thickness and in-plane directions respectively for different type thermal spray coatings. According to their results obtained by Resonant Ultrasound Spectroscopy (RUS), this ratio is typically between 0.36 and 0.43 for ceramic coatings (YSZ type) and 0.36 and 0.62 for metallic coatings (Ni).
For such materials, considering Hooke’s law for a plane-stress calculation, the compliance matrix takes the form:
in which subscripts x and y define the coating in-plane and through-thickness directions respectively, E, ν, ε and σ represent the Young’s modulus, the Poisson’s ratio, and the strain and the stress components respectively.
Additionally, the following relationship can be demonstrated:
3. FEM Numerical Method
Table 1 summarizes the series of calculations performed on each micrograph of the coating. U stands for the displacement field, H represents the image height and W is the image width.
For sets 3 to 6, a mechanical strain ε = 10−4 was applied in each case. Moreover, sets 7 and 8 were considered in conjunction with a uniform thermal load ΔT = 1 °C.
Table 2 presents the way the final results (effective or homogenized properties) indicated in the last column of Table 1, were calculated from the FEM results calculated for each set (i.e., each loading case). In these equations, ϕx is the thermal flux calculated along the right (or left) edge, ϕy is the thermal flux calculated along the top (or bottom) edge, Fx is the mechanical force computed along the right (or left) edge and Fy is the force computed on the top (or bottom) edge.
As mentioned above, the use of OOF requires a lot of RAM (the more the better). Thus, in the present work, an alternative approach was used. This approach consisted of the development of an interface called TGA_TO_ANSYS allowing the conversion of a TGA image into an ANSYS Parametric Design Language (APDL) script.
All calculations performed in the present study were thus obtained with the ANSYS solver requiring less RAM than OOF. In practice, different strategies were tested in order to implement the TGA_TO_ANSYS interface:
- Generation of each cell independently with a given material depending on its color + gluing of the different elements;
- Generation of all nodes and edges first to avoid the gluing operation that may be long.
Finally, a more efficient method was retained, consisting of the direct generation of a single face corresponding to the whole picture and directly meshed with the required number of square elements with one of the materials. The APDL script then consists of a list of commands allowing local changes of the material number. These changes may be performed for a series of consecutive elements with the same material, which is advantageous to reduce the number of commands required.
4. Materials Properties
The material selected as a “test case” in this work was an AlSi/polyester composite coating [10,21,22]. This material is widely used as an abradable seal in aeroengines, in the low temperature range (<325 °C, i.e., compressor section only). In practice, the role of abradable coatings is to minimize the clearance between the blade tips and the casing in order to decrease the leakages and improve the engine efficiency. In general, the abradable is applied on the surface of the stator casing. In case of contact with a rotating blade, the abradable should be worn without damaging the blade.
The METCO 601NS material from Oerlikon is a mixed powder composed of Al12Si alloy (60 wt %) and EKONOL polyester (40 wt % in the powder). Table 3 presents the main thermo-mechanical properties of these two materials. Al12Si alloy is quite conventional so that its properties are available in most databases. The case of EKONOL polyester (not so different from XYDAR, another polyester used in abradable coatings) is a little trickier so that the considered references are provided.
5. Coating Microstructures
Figure 1 presents a view of the coating microstructure (M601 powder) at low magnification level (i.e., about 3 µm/pixel) [10,21]. For this example, the polyester content measured by image analysis is about 72%. Specifically, this value is somewhat higher than the volumetric polyester content within the powder (40 wt % represents about 55 vol.% according to the respective densities of the two materials). Nevertheless, the ratio of the two phases may be much more balanced depending on the plasma spray parameter set. However, a high polyester content is often desired for a better abradability.
Figure 2 presents the corresponding image after application of a threshold providing a binary picture. This type of method is commonly used to estimate the content of each phase such as polyester (grey) or AlSi (white) by a simple pixel count of each color. As mentioned previously, the TGA_TO_ANSYS interface allows creating an element for each pixel and setting of the corresponding material number.
6. Numerical Results
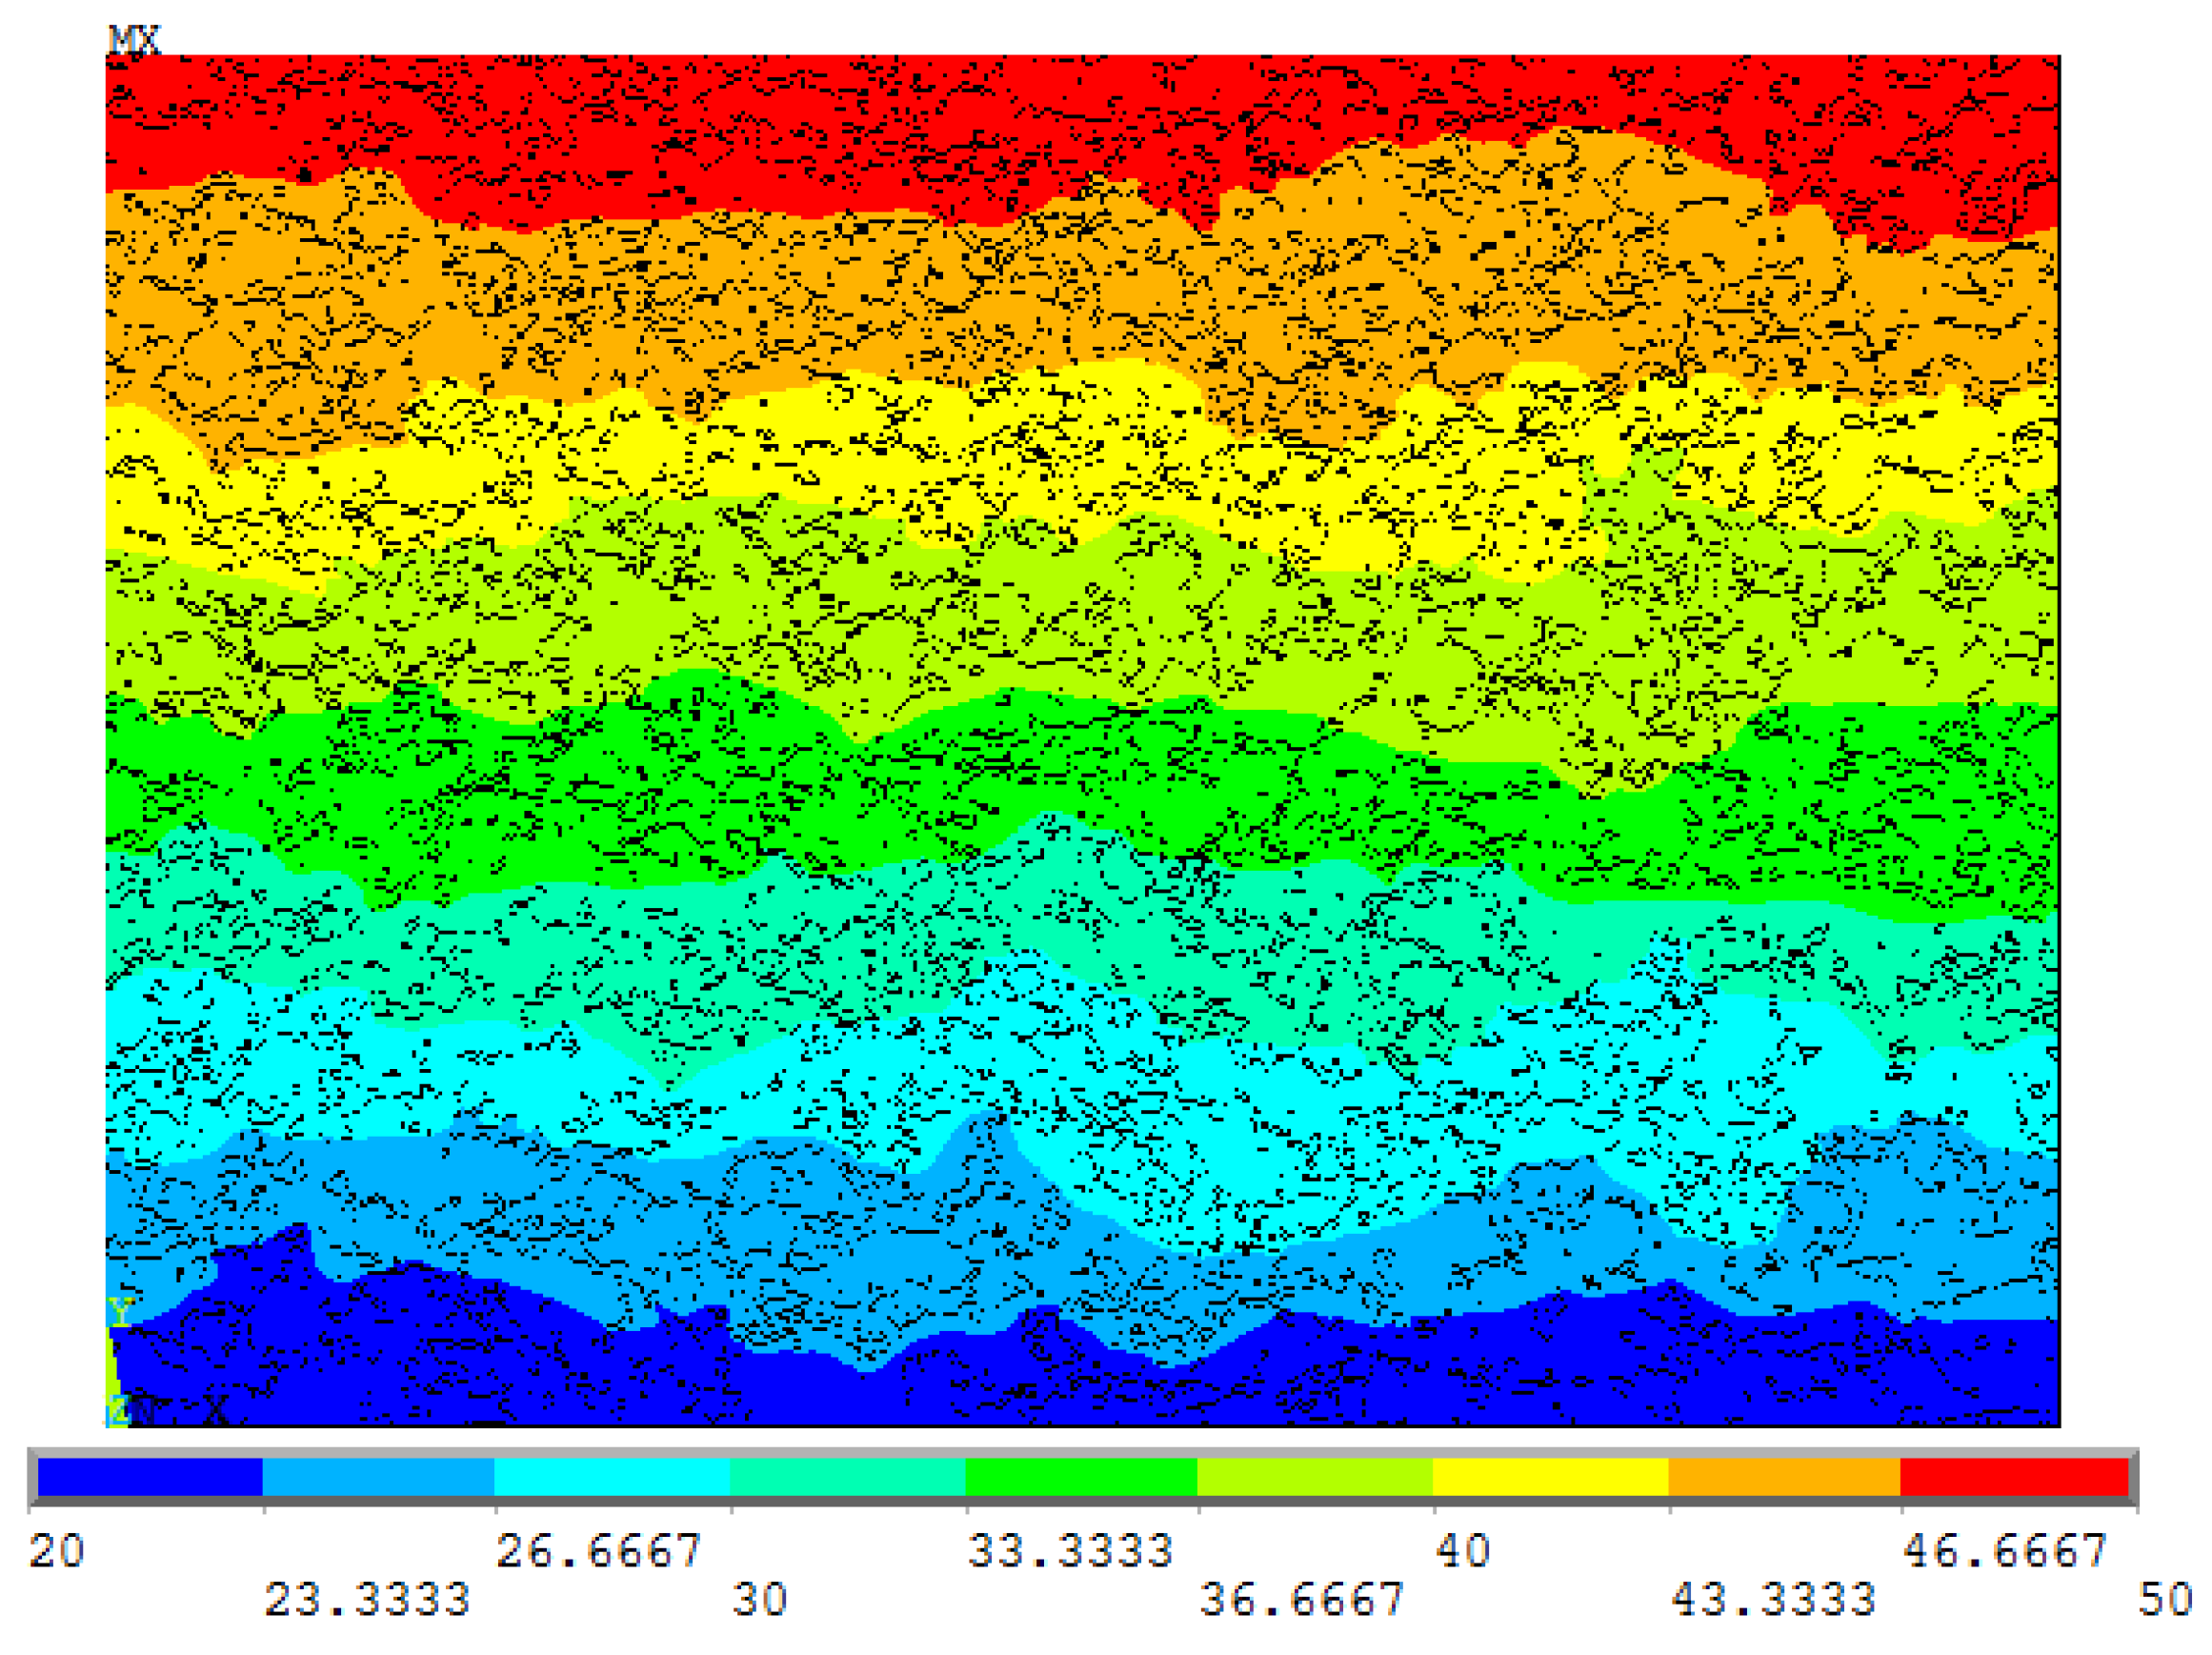
6.1. Thermal Aspects
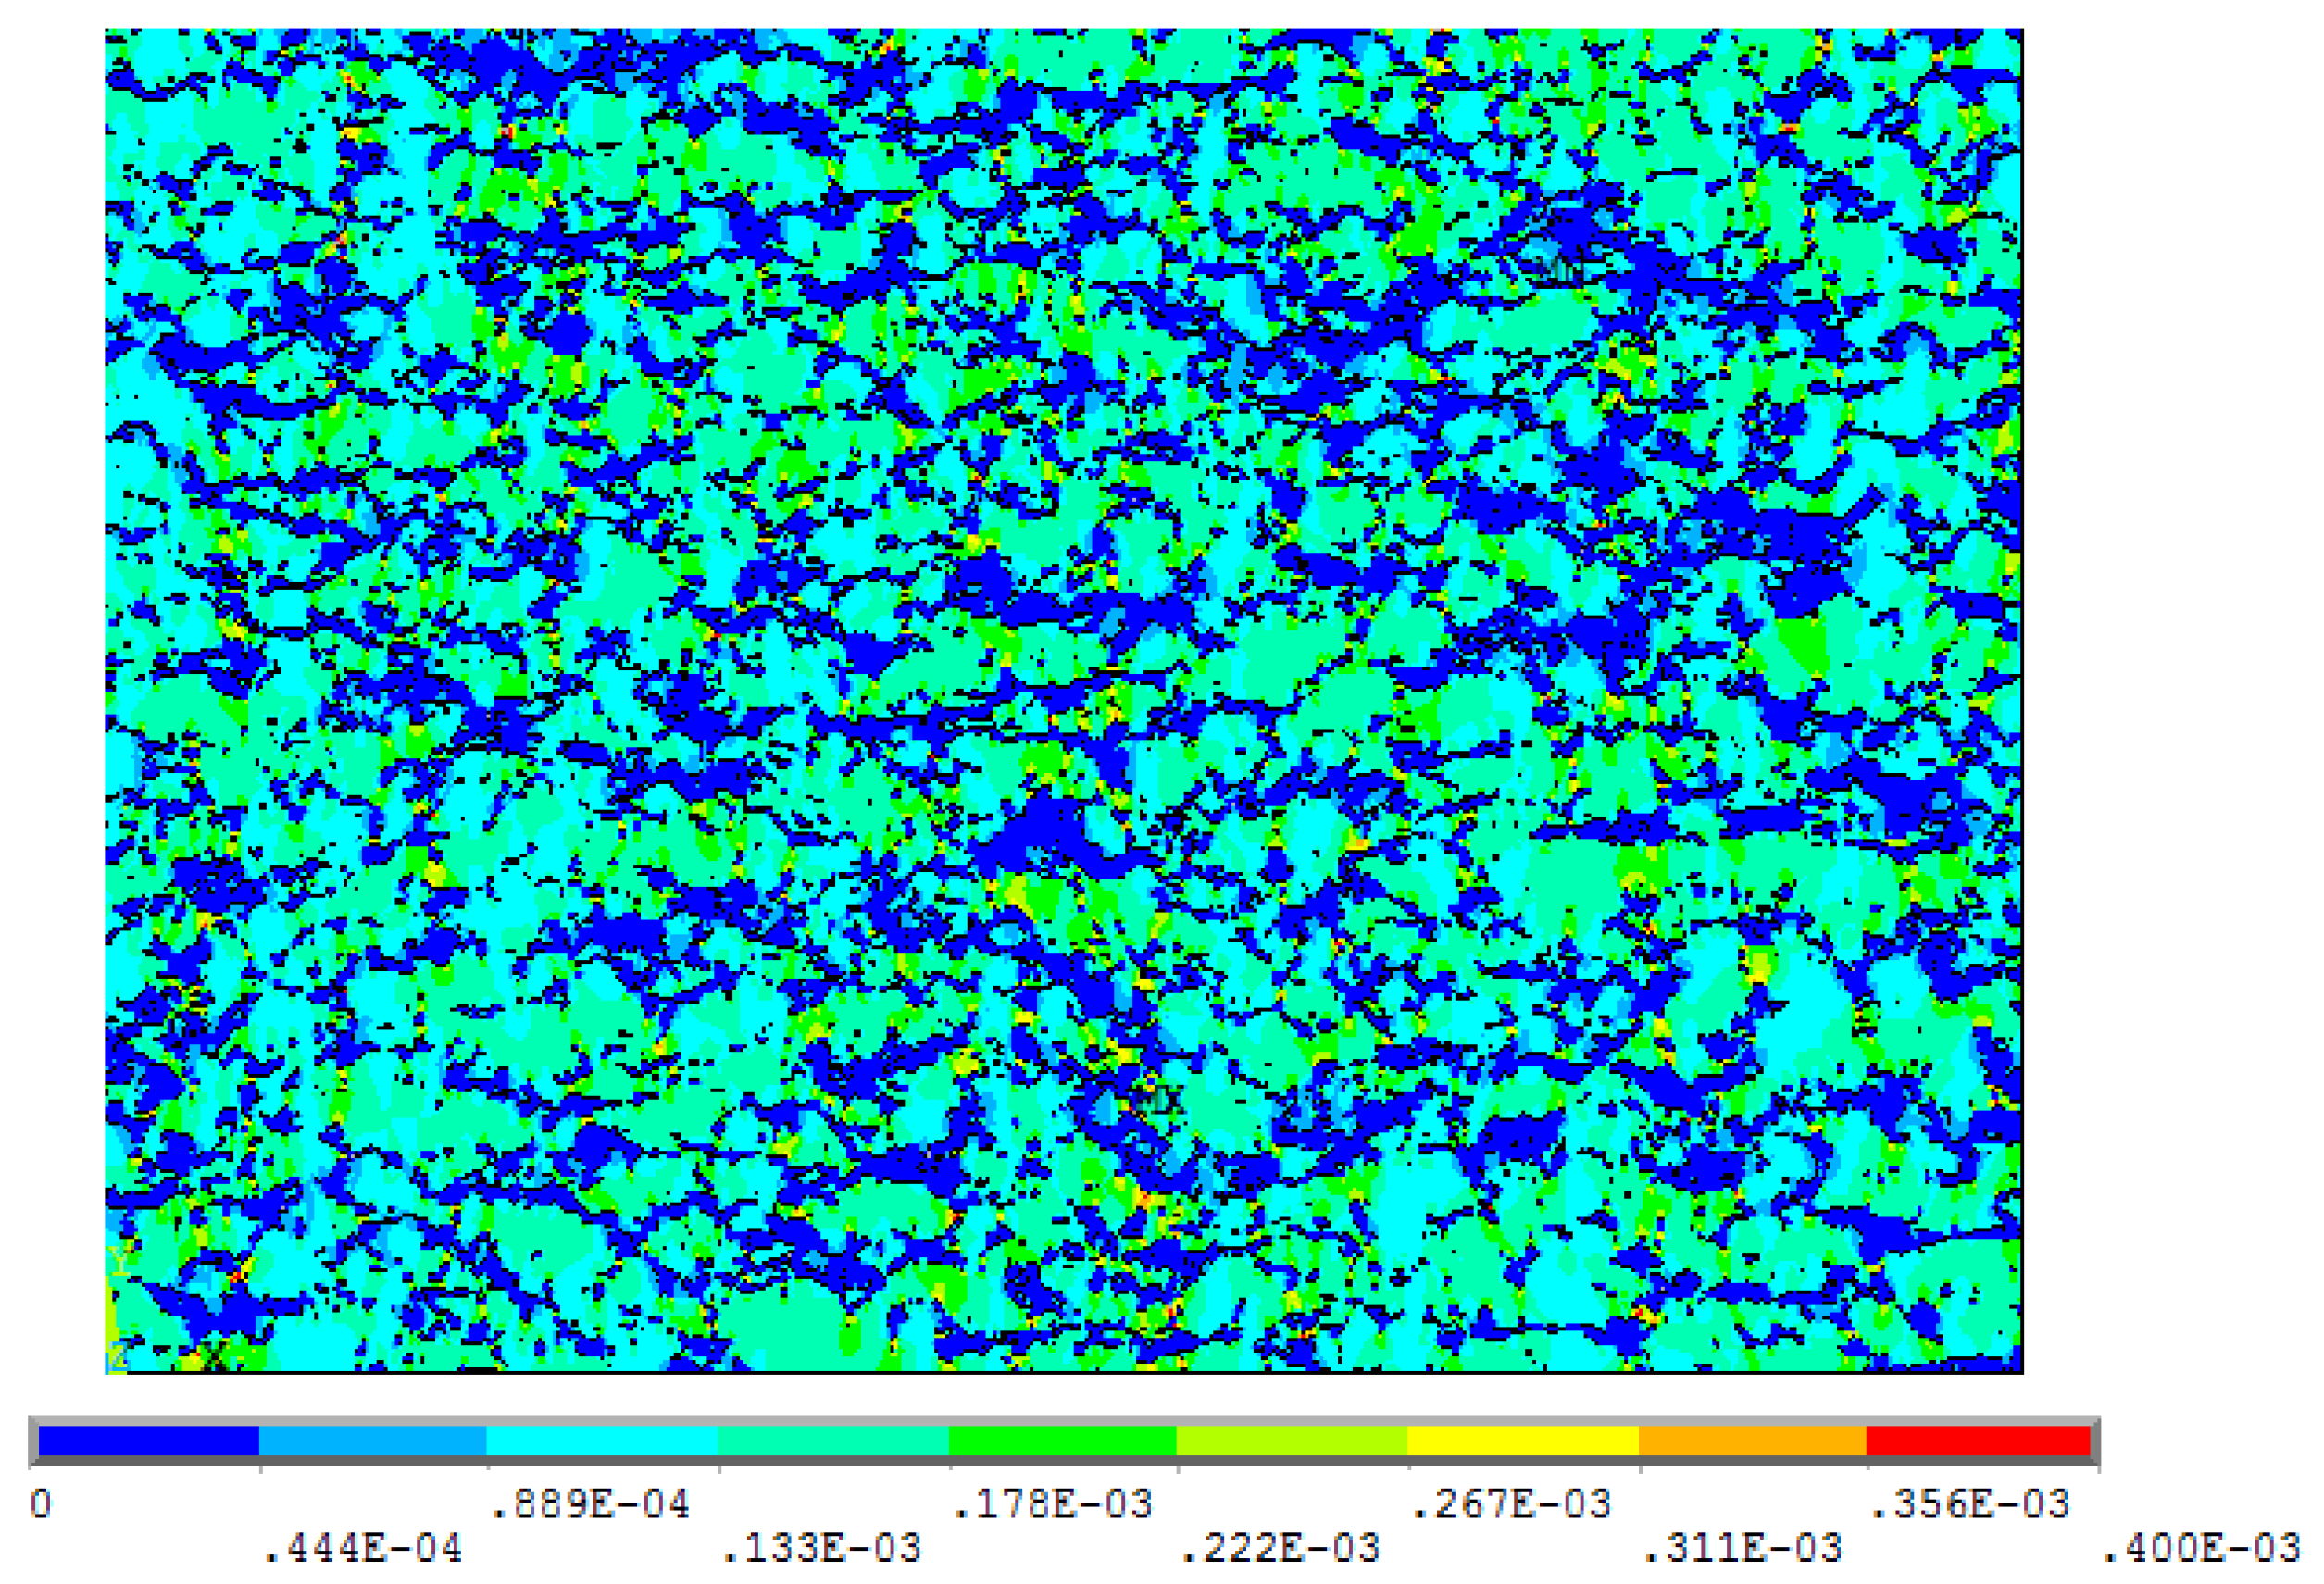
Figure 3, Figure 4 and Figure 5 present the temperature field, the temperature gradient field and the thermal flux field computed for the micrograph of Figure 2 in the case of the first loading case (set 1) allowing the calculation of κy. The depth of each isotherm is not homogenous as shown on Figure 3, due to the random distribution of the phases within the micrograph. By superposition of Figure 2 and Figure 4, one may notice that white areas of Figure 2 correspond to dark blue areas on Figure 4, meaning that the temperature gradients across the AlSi phase are low. On the contrary, light blue to red areas are all situated in the grey phase of Figure 2, meaning that the temperature gradients are much higher across the polyester phase, which acts as thermal resistance due to its lower thermal conductivity.
By superposition of Figure 2 and Figure 5, it is possible to observe that the higher thermal fluxes can be found in the white areas of Figure 2, meaning that the thermal flux flows mainly through the AlSi conductive phase. Concretely the AlSi network acts as conductive bridges that allow the thermal flux flowing through the coating. In other words, where possible, the thermal flux tries to avoid the refractory polyester matrix.
6.2. Strains and Stresses
Figure 6 presents the computed strain field εy for loading case 4 (i.e., vertical loading) allowing the estimation of Ey. Superposition of Figure 2 and Figure 6 indicates that, due to its lower Young’s modulus, the polyester phase undergoes a higher deformation in comparison with the AlSi phase (that corresponds mainly to the dark blue areas on Figure 6). Moreover, even if the overall vertical strain was ε = 10−4, many areas in the polyester phase undergo a higher deformation; according to the legend, the central green color corresponds to about 2 times this value.
Figure 7 shows the von Mises equivalent stress field corresponding to the same loading case (set 4). Each color corresponds to a step of 0.5 MPa. Although the polyester phase undergoes a higher deformation, the stress field is more uniformly distributed. In fact, areas where the stresses are the highest correspond mainly to AlSi, which more efficiently sustains the loading applied. However, since the AlSi phase is not continuous in the vertical direction, the loading is also sustained by the polyester phase which also undergoes high stresses, especially between two successive AlSi areas along the vertical direction.
6.3. Effective Homogenized Properties
Table 4 presents the results calculated for the different sets of Table 2 with input data provided in Table 3. The results show a high ratio of the effective thermal conductivities obtained in the two directions (factor higher than 2.3). In particular, the in-plane thermal conductivity is more than twice as high as the through-thickness one. This result is related to the preferred orientation of the two phases within the coating as shown on Figure 1. Anyway, the through-thickness thermal conductivity is in good agreement with data provided in the material datasheet of the powder manufacturer (κx = 0.53 W·m−1·K−1) [25]. On the other hand, the computed effective Young’s modulus shows a smaller ratio for the two directions. Only one value of the two Poisson’s ratios is in the range of the coefficients of the phases (0.34–0.4), meaning that the effective Poisson’s ratio may be smaller than that of the constitutive phases. This result is not really surprising; in all cases, the ratio of the Poisson’s coefficients in the two directions must remain equal to the ratio of the Young’s modulus in the two directions (see Equation (2)). Hence, a high preferred orientation of the phases, leading to a high ratio of the Young’s modulus in the two directions, also provides a high ratio of the Poisson’s coefficients in the two directions (and this even if the different phases would show similar Poisson’s coefficients). The dilatation coefficients provided in the two directions are in the range of the dilatation coefficients considered for the two phases (i.e., 20–60 µstrain·K−1). Nevertheless, the dilatation coefficients computed are not in the range of values provided by the powder manufacturer in the thermal spray coating information section (i.e., 20–30 µstrain·K−1) [25]. However, a good knowledge of the dilatation coefficients of the phases is required since the results are of course sensitive to the input data. In particular, the dilatation coefficient of the polyester phase seems highly variable depending on the reference considered.
As shown is Table 3, no lowering factor was applied to the mechanical properties of the coating phases (as suggested for example in the works of Faraoun [8]), meaning that the white pixels on Figure 2 have similar properties in comparison with dense AlSi and that grey pixels have the mechanical properties of dense polyester in the coating (Young’s modulus measured at 3.5 GPa from NHT measurements [22]). In reality, this assumption is not fully valid, especially for the AlSi phase due to the presence of a small-scale pore network observable at higher magnification level only (i.e., by SEM for example). In practice, this pore network induces a lowering of the properties of the AlSi phase of the coating. The reader is thus informed that the mechanical properties shown in Table 4 represent an upper limit. However, the experimental result reported in [22] (i.e., 7 GPa measured with a bending test) is only slightly below the calculated value of Ex (7.6 GPa as shown in Table 4), so the data may be considered as consistent. The strategy applied in future works will implement a two-magnification level method for this type of application (i.e., the case of composite coatings). A first calculation will be performed on high resolution SEM micrographs zooming in on individual phases. The results of the calculations performed at this high magnification level will then be used as input data for calculations performed at the lower magnification level (such that of Figure 1 and Figure 2).
6.4. Effect of the Polyester Content
Manufacture of coatings with different AlSi/polyester ratios is possible thanks to the adjustment of the thermal spray parameters. Concretely, the polyester ratio represents a feature that may be used to adjust the thermo-mechanical properties of the coating. This part of the work was thus performed in order to quantify the effect of the AlSi/polyester ratio on the coating’s effective properties. Figure 2 was used to generate a new image with a lower polyester level. An image processing dilatation of the AlSi phase was performed with the following rule: grey pixels with white left and top neighbors were set to white. This method allows slower changes of the phase contents in comparison with the case of a homogeneous dilatation of this phase in each direction.
Figure 8 presents an example of image generated from Image 2. The AlSi content of this new picture is 37% instead of 28% for Figure 2.
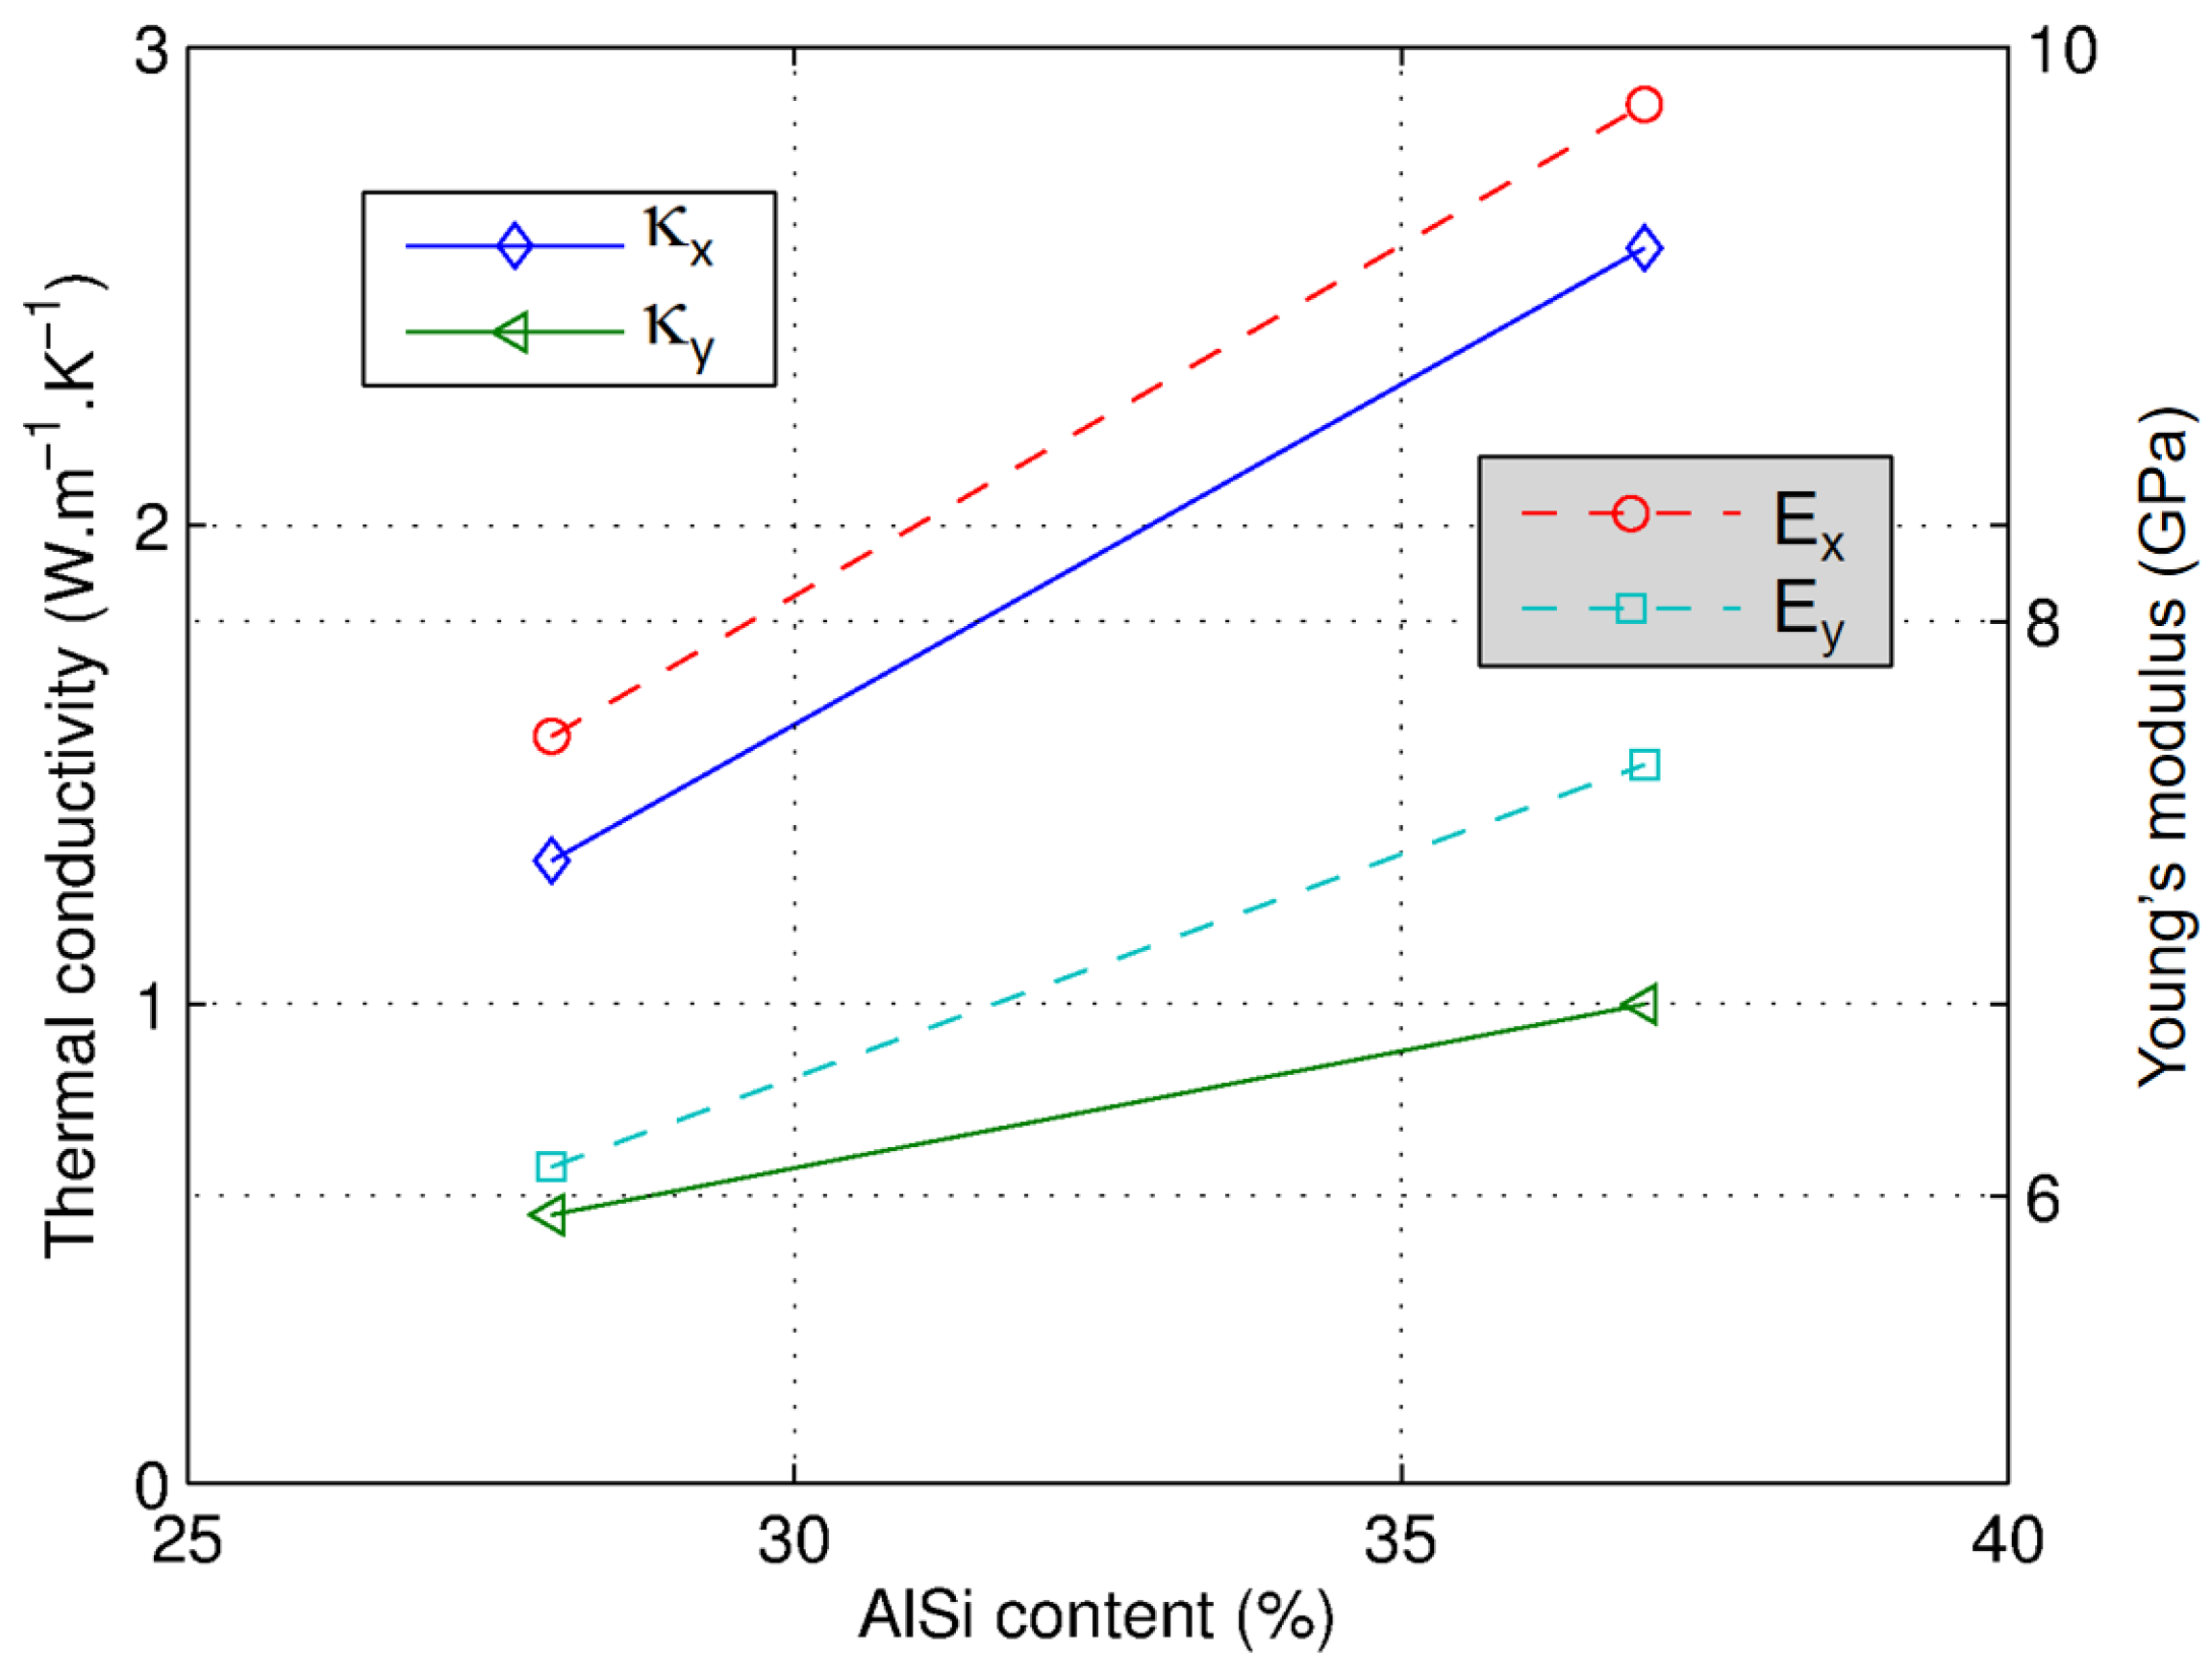
Table 5 presents the effect of the AlSi content (or polyester one) on the effective properties of the coating. The results seem very sensitive for thermal conductivity: an increase of 9% in the AlSi content (i.e., corresponding to +32% in regards of the initial value of 28% of the AlSi fraction) provides an increase of almost 100% in the effective thermal conductivity. Otherwise, the influence of the AlSi content on the mechanical properties is lower: The same variation of the AlSi content causes an increase of 23% in the Young’s modulus Ey and 29% for Ex. This difference is certainly related to the ratio of properties of the phases (i.e., about 765 for the thermal conductivity according to Table 3, against about 20 for the Young’s modulus). Figure 9 presents the evolution of the effective thermal conductivity predicted in both directions, and that of the effective Young’s modulus (in both directions also) versus AlSi content (data of Table 5). Finally, the dilatation process (such as that performed on Figure 2), which increases the AlSi content, is a good way to estimate the effect on the coating properties of a change in the thermal spray parameters (providing a change of the polyester ratio). In particular, it may be useful to test the sensitivity of the coating properties against the phase ratio, in order to evaluate in which proportions the microstructure has to evolve to vary the coating’s effective properties.
7. Conclusions
This work was focused on the study of thermo-mechanical properties of composite coatings, elaborated by atmospheric plasma spraying. The case of an AlSi/polyester coating used as an abradable seal in aircraft engines was considered. An interface was first developed to convert a micrograph into an ANSYS APDL script. This interface was then applied in order to perform virtual loadings on cross-sectional micrographs of the coating. A set of 8 different loading cases was implemented and applied in order to estimate the effective properties of the coating from these micrographs. The properties calculated were the in-plane and through thickness thermal conductivities, dilatation coefficients and Young’s modulus, as well as the two Poisson’s ratios. Due to the preferred orientation of the coating phases within the microstructure, the in-plane conductivity was found to be higher than the through thickness conductivity by a factor of 2.3. On the contrary, the ratio of the Young’s modulus, computed in the two main directions, was not so high (less than 1.3). An image processing dilatation of the AlSi phase was then applied to vary the relative ratio of the phases. This method is particularly suitable to estimating the influence of a change of the phase content on the coating’s effective properties, which could take place by modifying the thermal spray parameters, for example. In future works, a two-scale approach will be used: High resolution SEM images will first be used to estimate the properties of the two phases and the results so calculated will be set as input data to estimate the properties of the composite coating, by using a second calculation performed on lower magnification optical microscopy images. This type of calculation has been applied in the frame of the EBREAK European project.
Author Contributions
Rodolphe Bolot designed and performed the numerical calculations; Rodolphe Bolot, Delphine Aussavy and Ghislain Montavon contributed to the analysis of results and writing of the paper.
Conflicts of Interest
The authors declare no conflicts of interest.
Nomenclature
| κ | thermal conductivity, W·m−1·K−1 |
| α | dilatation coefficient, µm·m−1·K−1 |
| E | Young’s modulus, GPa |
| ν | Poisson’s ratio |
| φ | thermal flux, W |
| ε | strain |
| σ | stress, MPa |
| F | force, N |
| U | displacement, m |
| Subscripts | |
| x | in-plane property |
| y | through-thickness property |
References
- OOF: Finite Element Analysis of Microstructures. Available online: http://www.ctcms.nist.gov/oof/ (accessed on 23 June 2017).
- Langer, S.A.; Fuller, E.; Carter, W.C. OOF: An image-based finite-element analysis of material microstructures. Comput. Sci. Eng. 2001, 3, 15–23. [Google Scholar] [CrossRef]
- Kulkarni, A.; Wang, Z.; Nakamura, T.; Sampath, S.; Goland, A.; Herman, H.; Allen, J.; Ilavsky, J.; Long, G.; Frahm, J.; et al. Comprehensive microstructural characterization and predictive property modeling of plasma-sprayed zirconia coatings. Acta Mater. 2003, 51, 2457–2475. [Google Scholar] [CrossRef]
- Wang, Z.; Kulkarni, A.; Deshpande, S.; Nakamura, T.; Herman, H. Effects of pores and interfaces on effective properties of plasma sprayed zirconia coatings. Acta Mater. 2003, 51, 5319–5334. [Google Scholar] [CrossRef]
- Tan, Y.; Longtin, J.P.; Sampath, S. Modeling thermal conductivity of thermal spray coatings: Comparing predictions to experiments. In Proceedings of the International Thermal Spray Conference, Seattle, WA, USA, 15–18 May 2006. [Google Scholar]
- Michlik, P.; Berndt, C.C. Image-based extended finite element modeling of thermal barrier coatings. Surf. Coat. Techol. 2006, 201, 2369–2380. [Google Scholar] [CrossRef]
- Jadhav, A.D.; Padture, N.P.; Jordan, E.H.; Gell, M.; Miranzo, P.; Fuller, E.R., Jr. Low-thermal-conductivity plasma-sprayed thermal barrier coatings with engineered microstructures. Acta Mater. 2006, 54, 3343–3349. [Google Scholar] [CrossRef]
- Faraoun, H.I.; Seichepine, J.L.; Coddet, C.; Aourag, H.; Zwick, J.; Hopkins, N.; Sporer, D.; Hertter, M. Modelling route for abradable coatings. Surf. Coat. Technol. 2006, 200, 6578–6582. [Google Scholar] [CrossRef]
- Reid, A.C.E.; Langer, S.A.; Lua, R.C.; Coffman, V.R.; Haan, S.I.; Garcia, R.E. Image-based finite element mesh construction for material microstructures. Comput. Mater. Sci. 2008, 43, 989–999. [Google Scholar] [CrossRef]
- Bolot, R.; Seichepine, J.L.; Qiao, J.H.; Coddet, C. Predicting the thermal conductivity of AlSi/Polyester abradable coatings: Effects of the numerical method. J. Therm. Spray Technol. 2011, 20, 39–47. [Google Scholar] [CrossRef]
- Gupta, M.; Curry, N.; Nylén, P.; Markocsan, N.; Vaßen, R. Design of next generation thermal barrier coatings—experiments and modelling. Surf. Coat. Technol. 2013, 220, 20–26. [Google Scholar] [CrossRef]
- Tillmann, W.; Klusemann, B.; Nebel, J.; Svendsen, B. Analysis of the mechanical properties of an arc-sprayed WC-FeCSiMn coating: Nanoindentation and simulation. J. Therm. Spray Technol. 2011, 20, 328–335. [Google Scholar] [CrossRef]
- Klusemann, B.; Denzer, R.; Svendsen, B. Microstructure-based modeling of residual stresses in WC-12Co-sprayed coatings. J. Therm. Spray Technol. 2012, 21, 96–107. [Google Scholar] [CrossRef]
- Wiederkehr, T.; Klusemann, B.; Gies, D.; Müller, H.; Svendsen, B. An image morphing method for 3D reconstruction and FE-analysis of pore networks in thermal spray coatings. Comput. Mater. Sci. 2010, 47, 881–889. [Google Scholar] [CrossRef]
- Bobzin, K.; Kopp, N.; Warda, T.; Öte, M. Determination of the effective properties of thermal spray coatings using 2D and 3D models. J. Therm. Spray Technol. 2012, 21, 1269–1277. [Google Scholar] [CrossRef]
- Qiao, J.H.; Bolot, R.; Liao, H.L.; Coddet, C. Knudsen Effet on the estimation of the effective thermal conductivity of thermal barrier coatings. J. Therm. Spray Technol. 2013, 22, 175–182. [Google Scholar] [CrossRef]
- Qiao, J.H.; Bolot, R.; Liao, H.L.; Bertrand, P.; Coddet, C. A 3D finite-difference model for the effective thermal conductivity of thermal barrier coatings produced by plasma spraying. Int. J. Therm. Sci. 2013, 65, 120–126. [Google Scholar] [CrossRef]
- Qiao, J.H.; Bolot, R.; Liao, H. Finite element modeling of the elastic modulus of thermal barrier coatings. Surf. Coat. Technol. 2013, 220, 170–173. [Google Scholar] [CrossRef]
- Vackel, A.; Dwivedi, G.; Sampath, S. Structurally integrated, damaged-tolerant, thermal spray coatings. JOM 2015, 67, 1540–1553. [Google Scholar] [CrossRef]
- Tan, Y.; Shyam, A.; Choi, W.B.; Lara-Curzio, E.; Sampath, S. Anisotropic elastic properties of thermal spray coatings determined via resonant ultrasound spectroscopy. Acta Mater. 2010, 58, 5305–5315. [Google Scholar] [CrossRef]
- Bolot, R.; Seichepine, J.L.; Coddet, C.; Sporer, D.; Fiala, P.; Bartlett, B. Thermal conductivity of AlSi/Polyester abradable coatings. Weld. Cut. 2009, 8, 104–109. [Google Scholar]
- Duramou, Y.; Bolot, R.; Seichepine, J.-L.; Danlos, Y.; Bertrand, P.; Montavon, G.; Selezneff, S. Relationships between microstructural and mechanical properties of plasma sprayed AlSi-Polyester composite coatings: Application to abradable materials. Key Eng. Mater. 2014, 606, 155–158. [Google Scholar] [CrossRef]
- CES Selector Edupack 2014. Available online: http://www.grantadesign.com/products/ces/ (accessed on 23 June 2017).
- Ekonol® Polyester Fillers for PTFE Seals & Bearings. Available online: http://www.coatingsolutions.saint-gobain.com/ekonol.aspx (accessed on 23 June 2017).
- DSMTS_0016.5. Material Product Data Sheet, Aluminum Silicon Polymer Thermal Spray Powders. Available online: https://www.oerlikon.com/ecomaXL/files/metco/oerlikon_DSMTS-0016.5_AlSi-Poly.pdf (accessed on 23 June 2017).
Figure 1.
Coating microstructure observed by optical microscopy [10].
Figure 1.
Coating microstructure observed by optical microscopy [10].
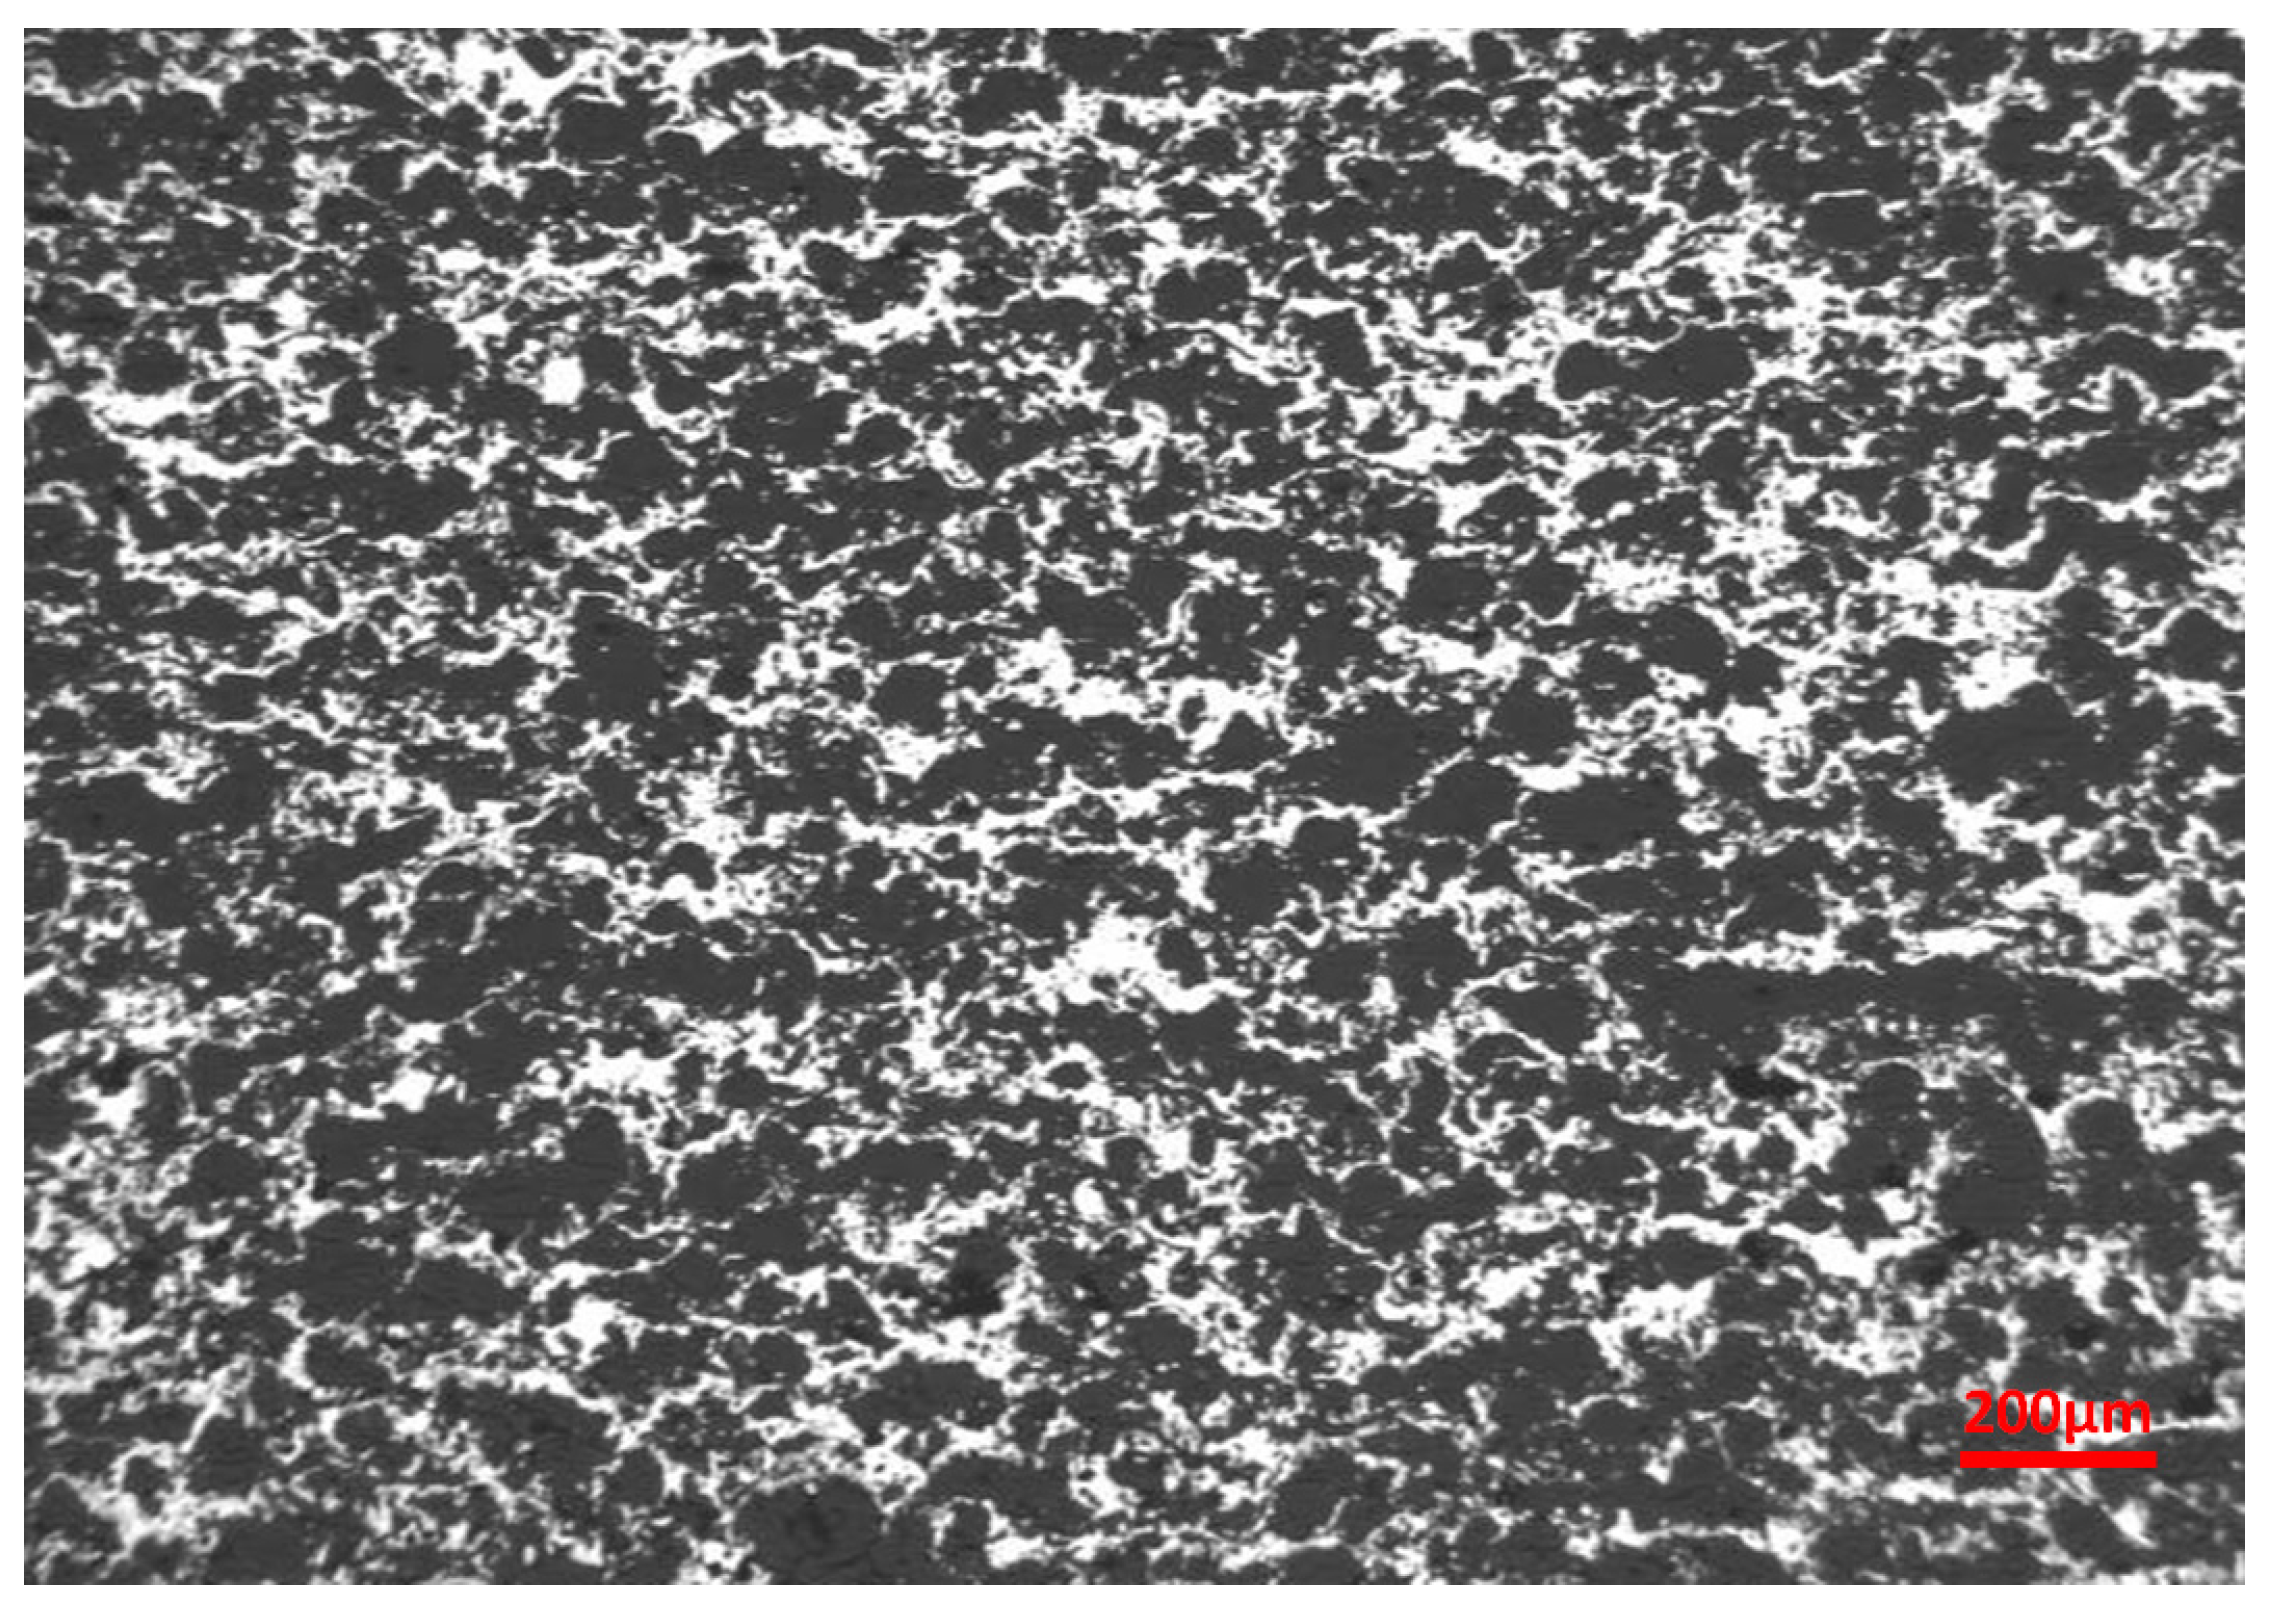
Figure 2.
Binary picture obtained by application of a single threshold.
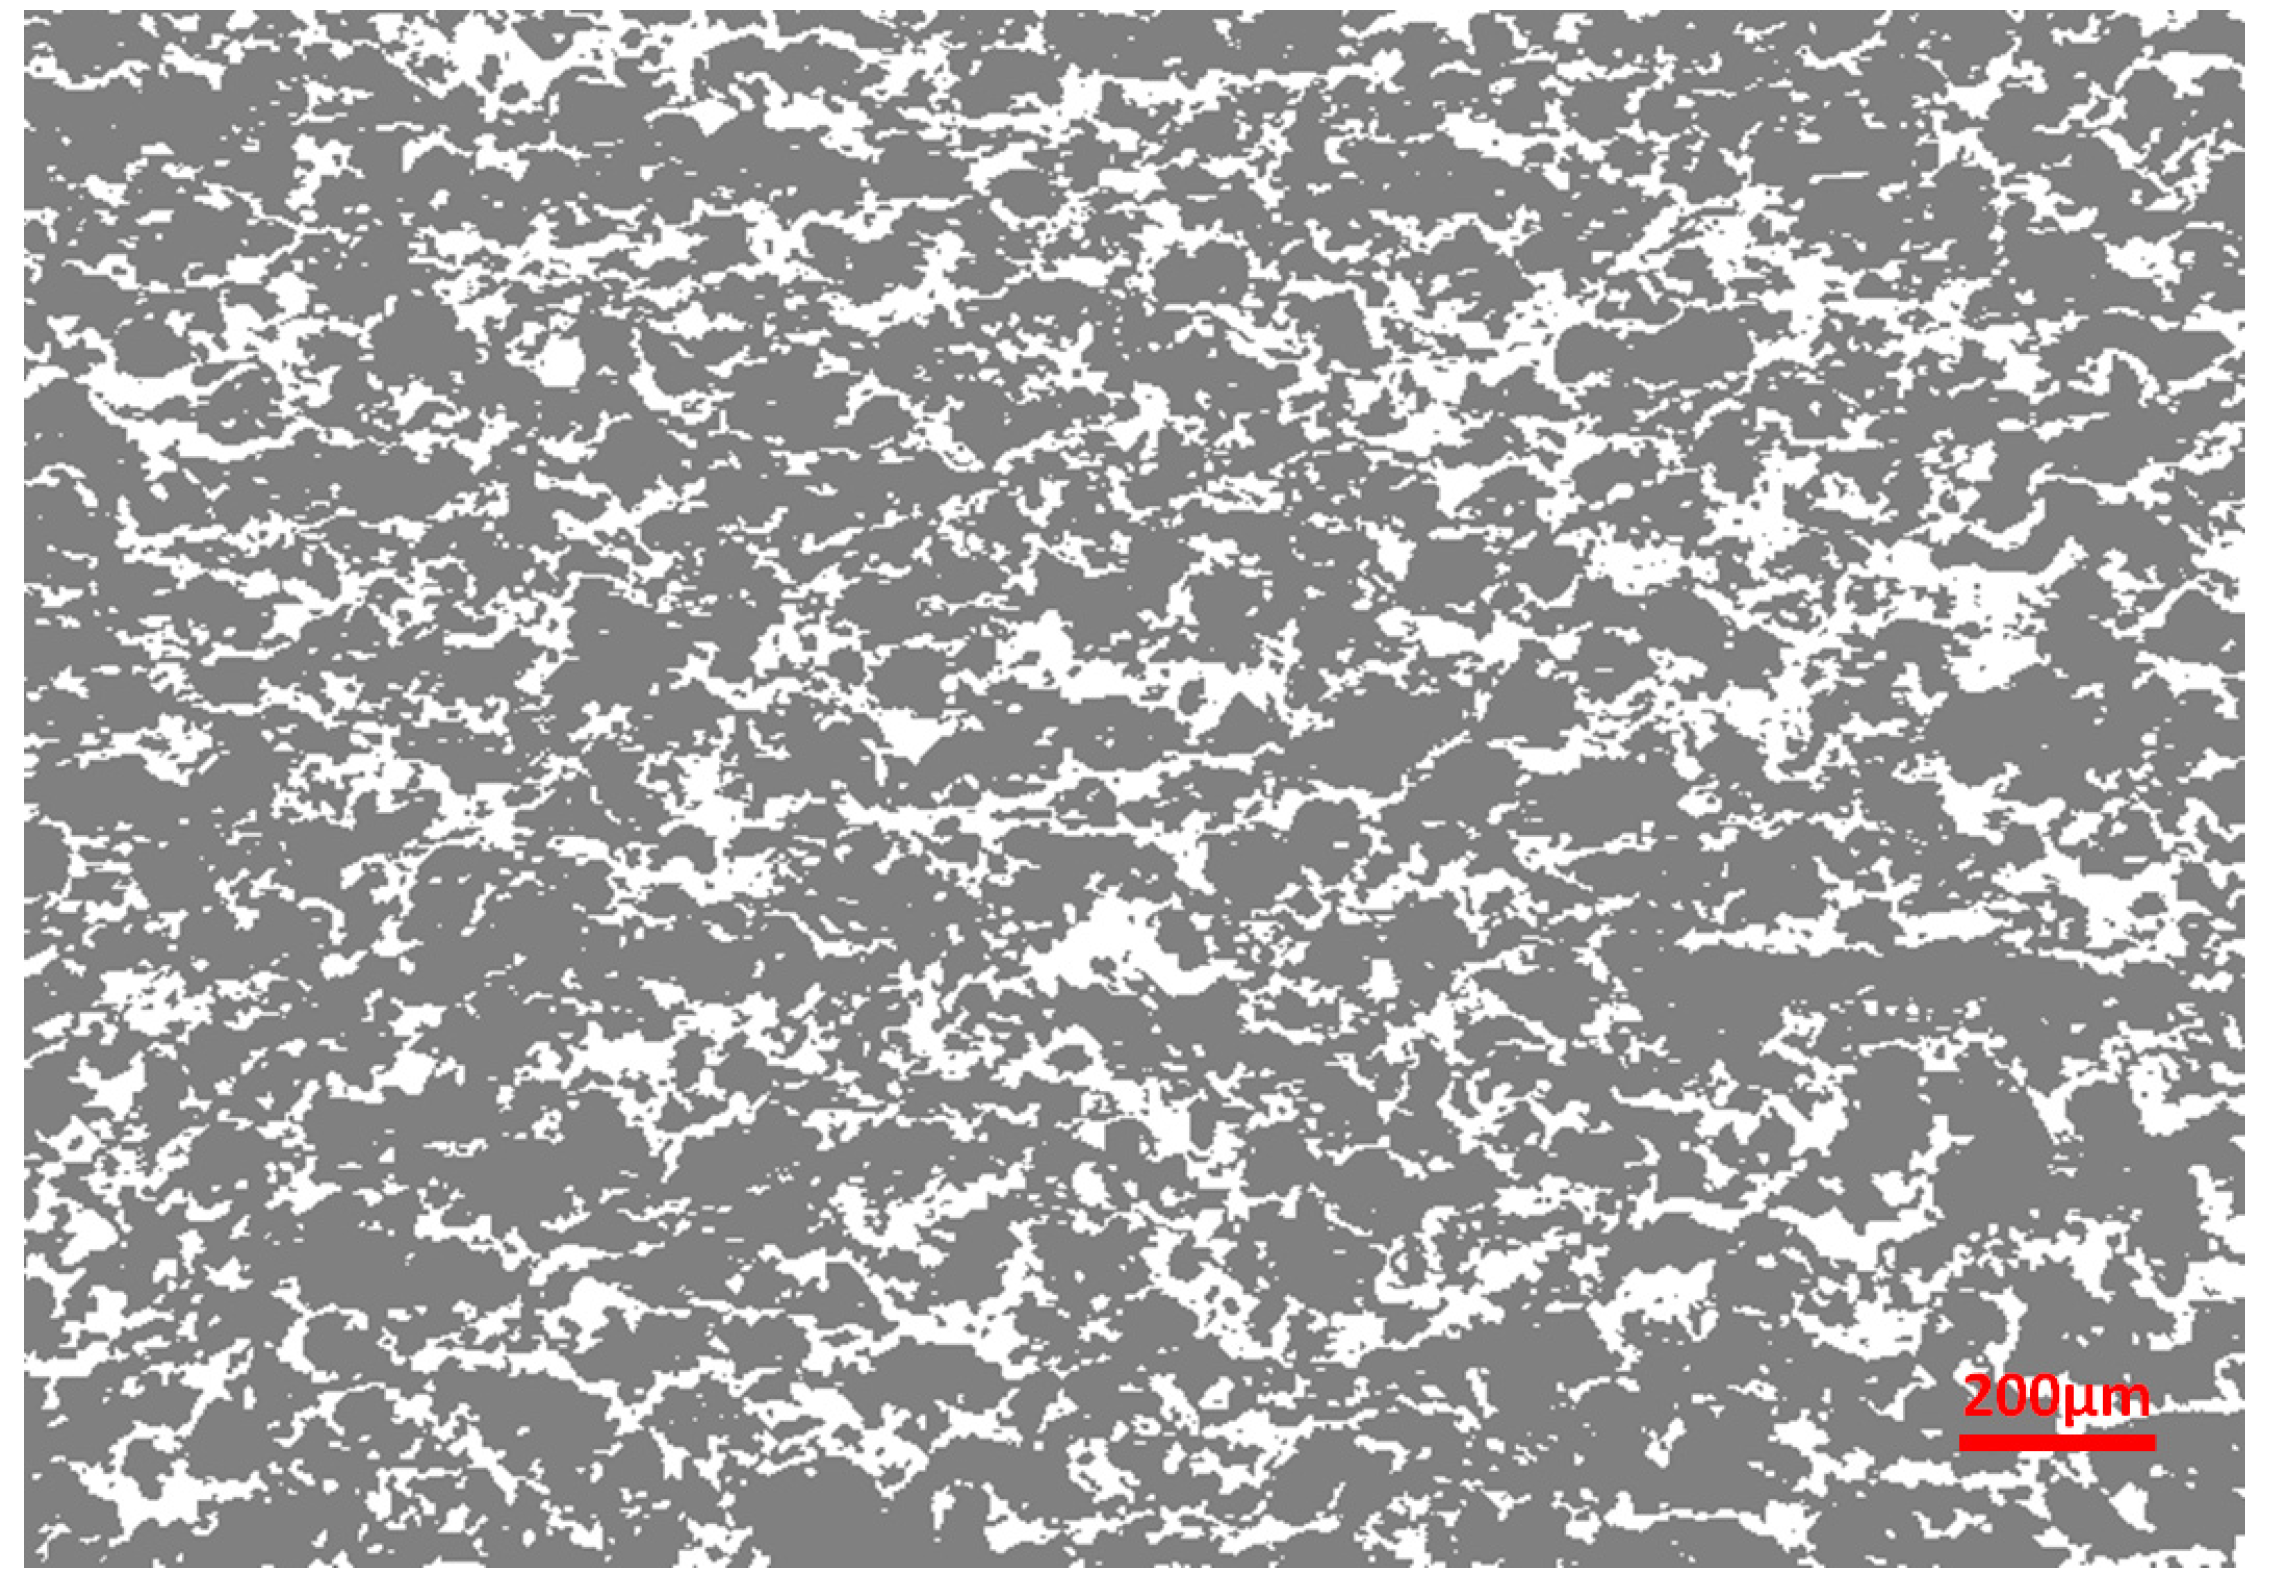
Figure 3.
Computed temperature field corresponding to the micrograph of Figure 2 for set 1 allowing the calculation of κy.
Figure 3.
Computed temperature field corresponding to the micrograph of Figure 2 for set 1 allowing the calculation of κy.

Figure 4.
Computed field of the vertical temperature gradient for microstructure of Figure 2 for the first loading case.
Figure 4.
Computed field of the vertical temperature gradient for microstructure of Figure 2 for the first loading case.
Figure 5.
Computed field of the thermal flux for microstructure of Figure 2.
Figure 5.
Computed field of the thermal flux for microstructure of Figure 2.
Figure 6.
Computed strain field εy corresponding to loading case 4 allowing the estimation of Ey.

Figure 7.
Computed field of the von Mises equivalent stress obtained for the 4th loading case.
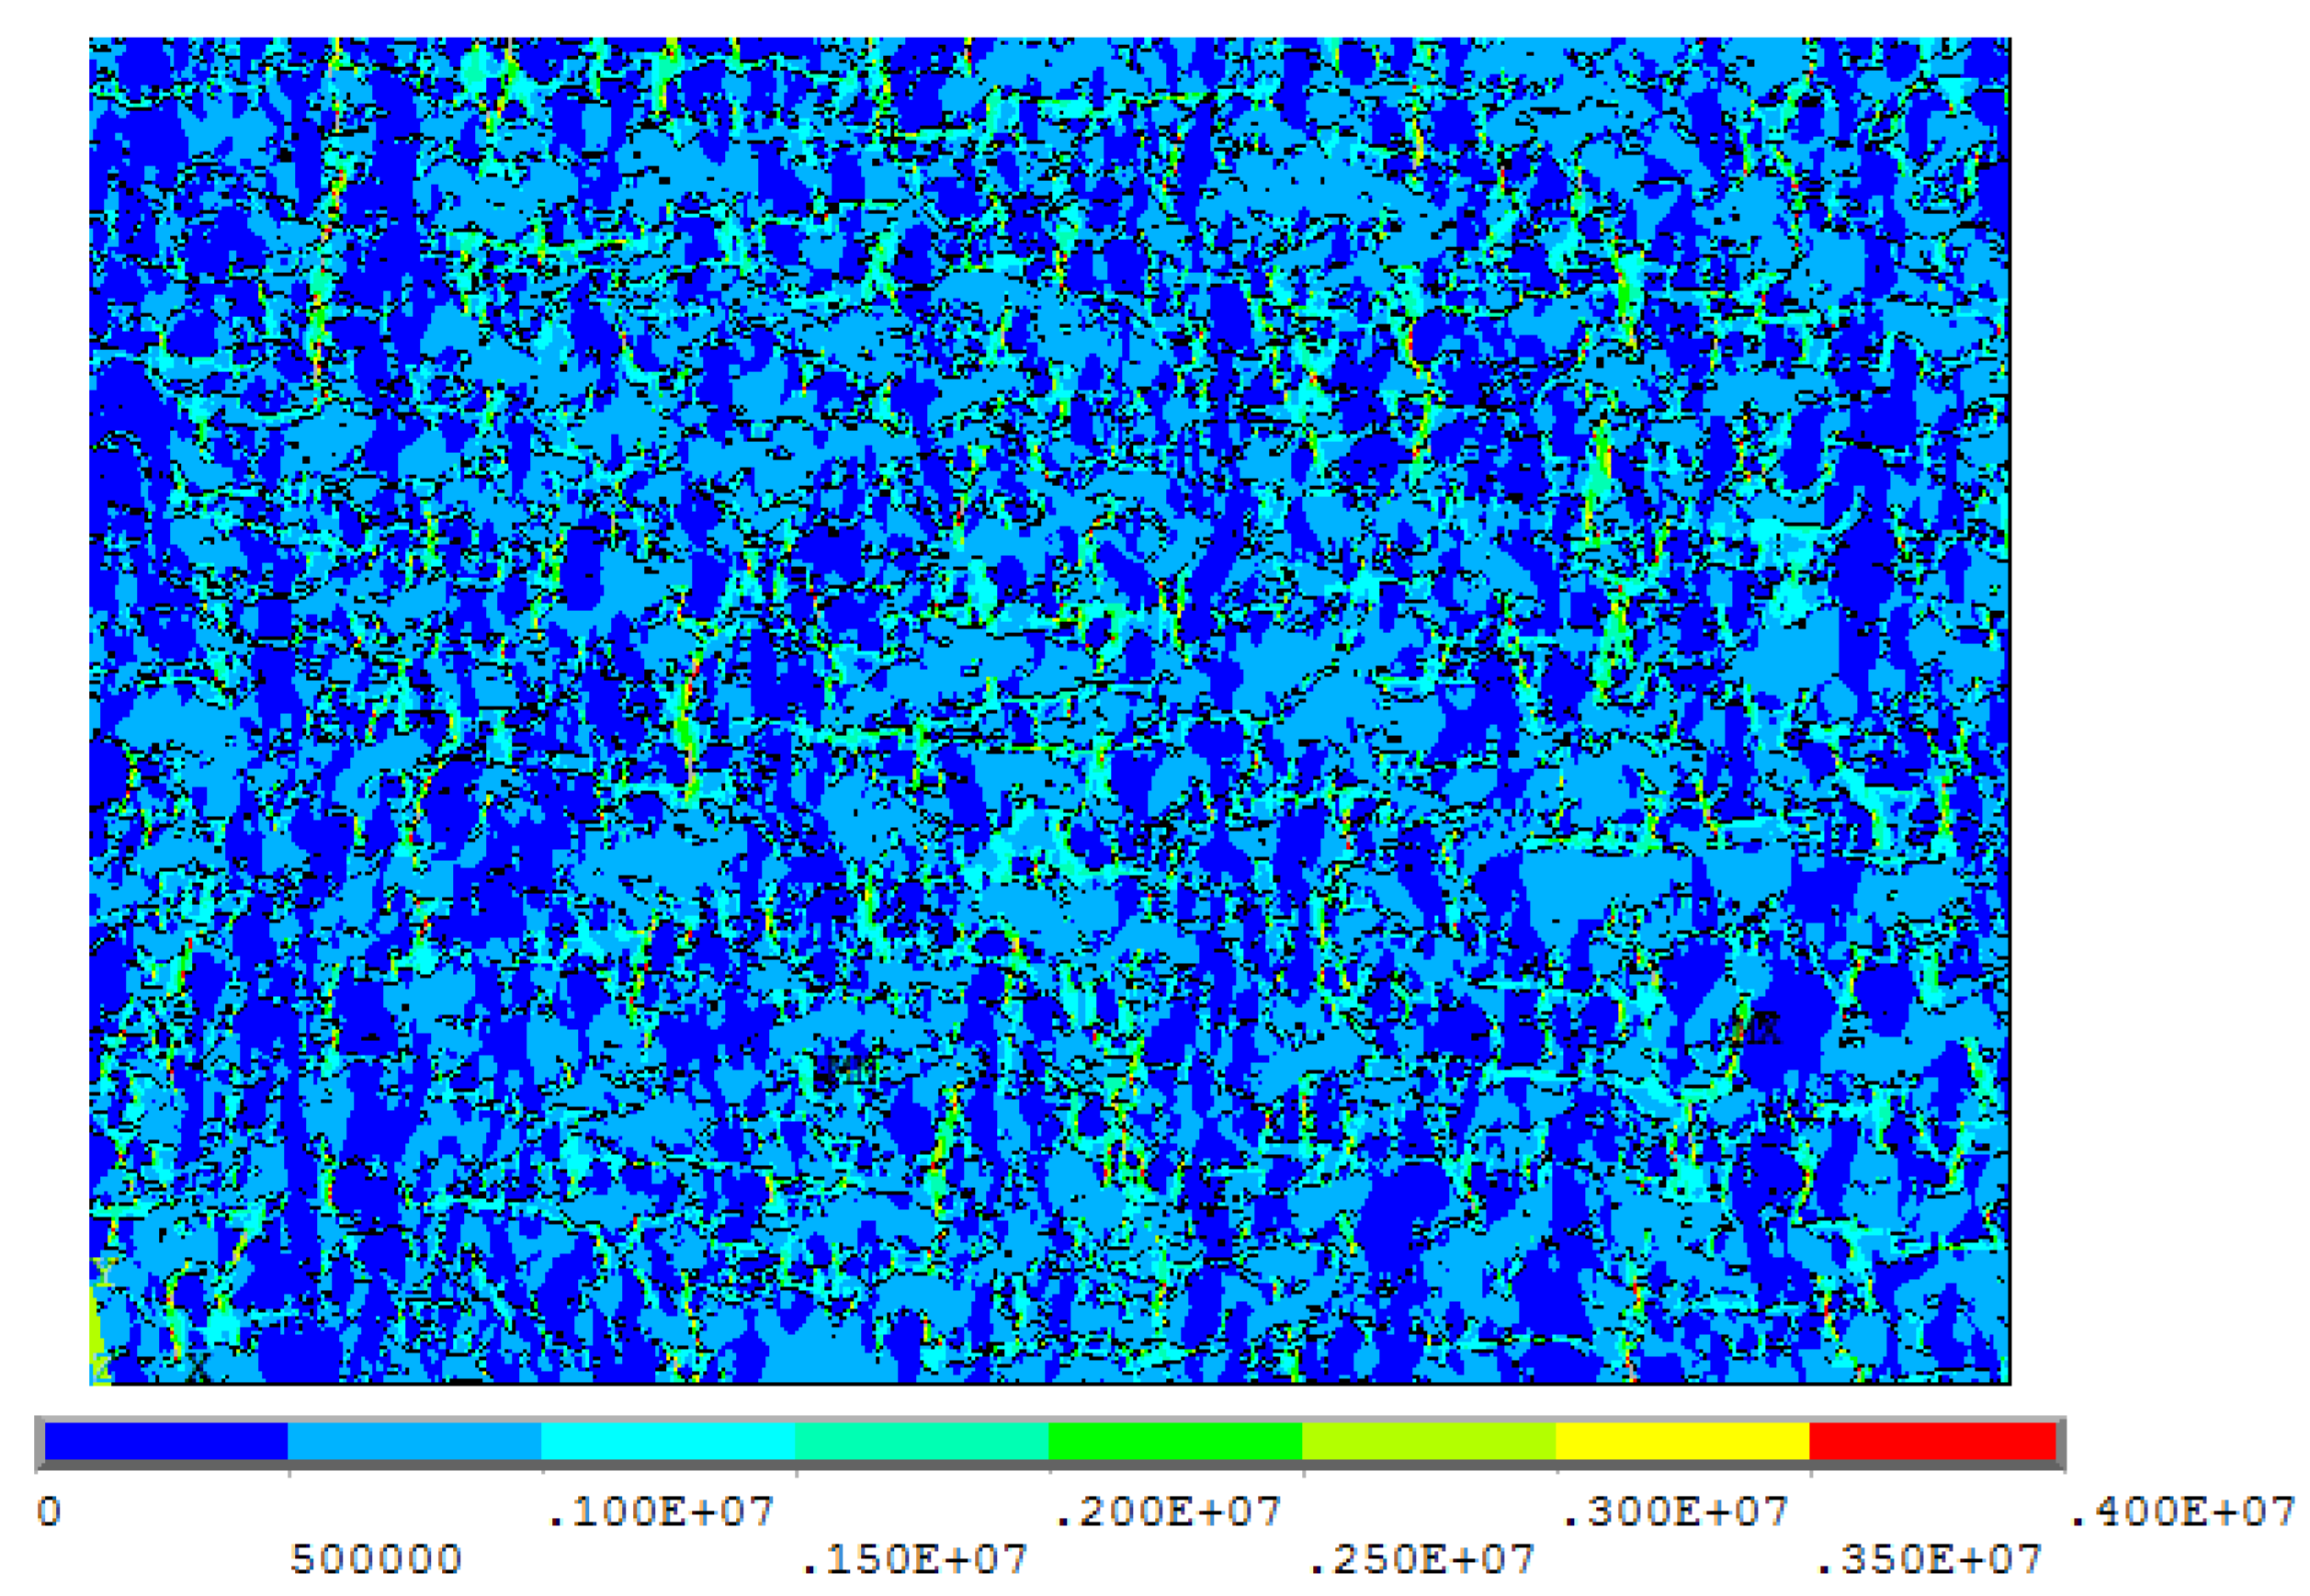
Figure 8.
New virtual image with a higher AlSi content in comparison with Figure 2.
Figure 8.
New virtual image with a higher AlSi content in comparison with Figure 2.
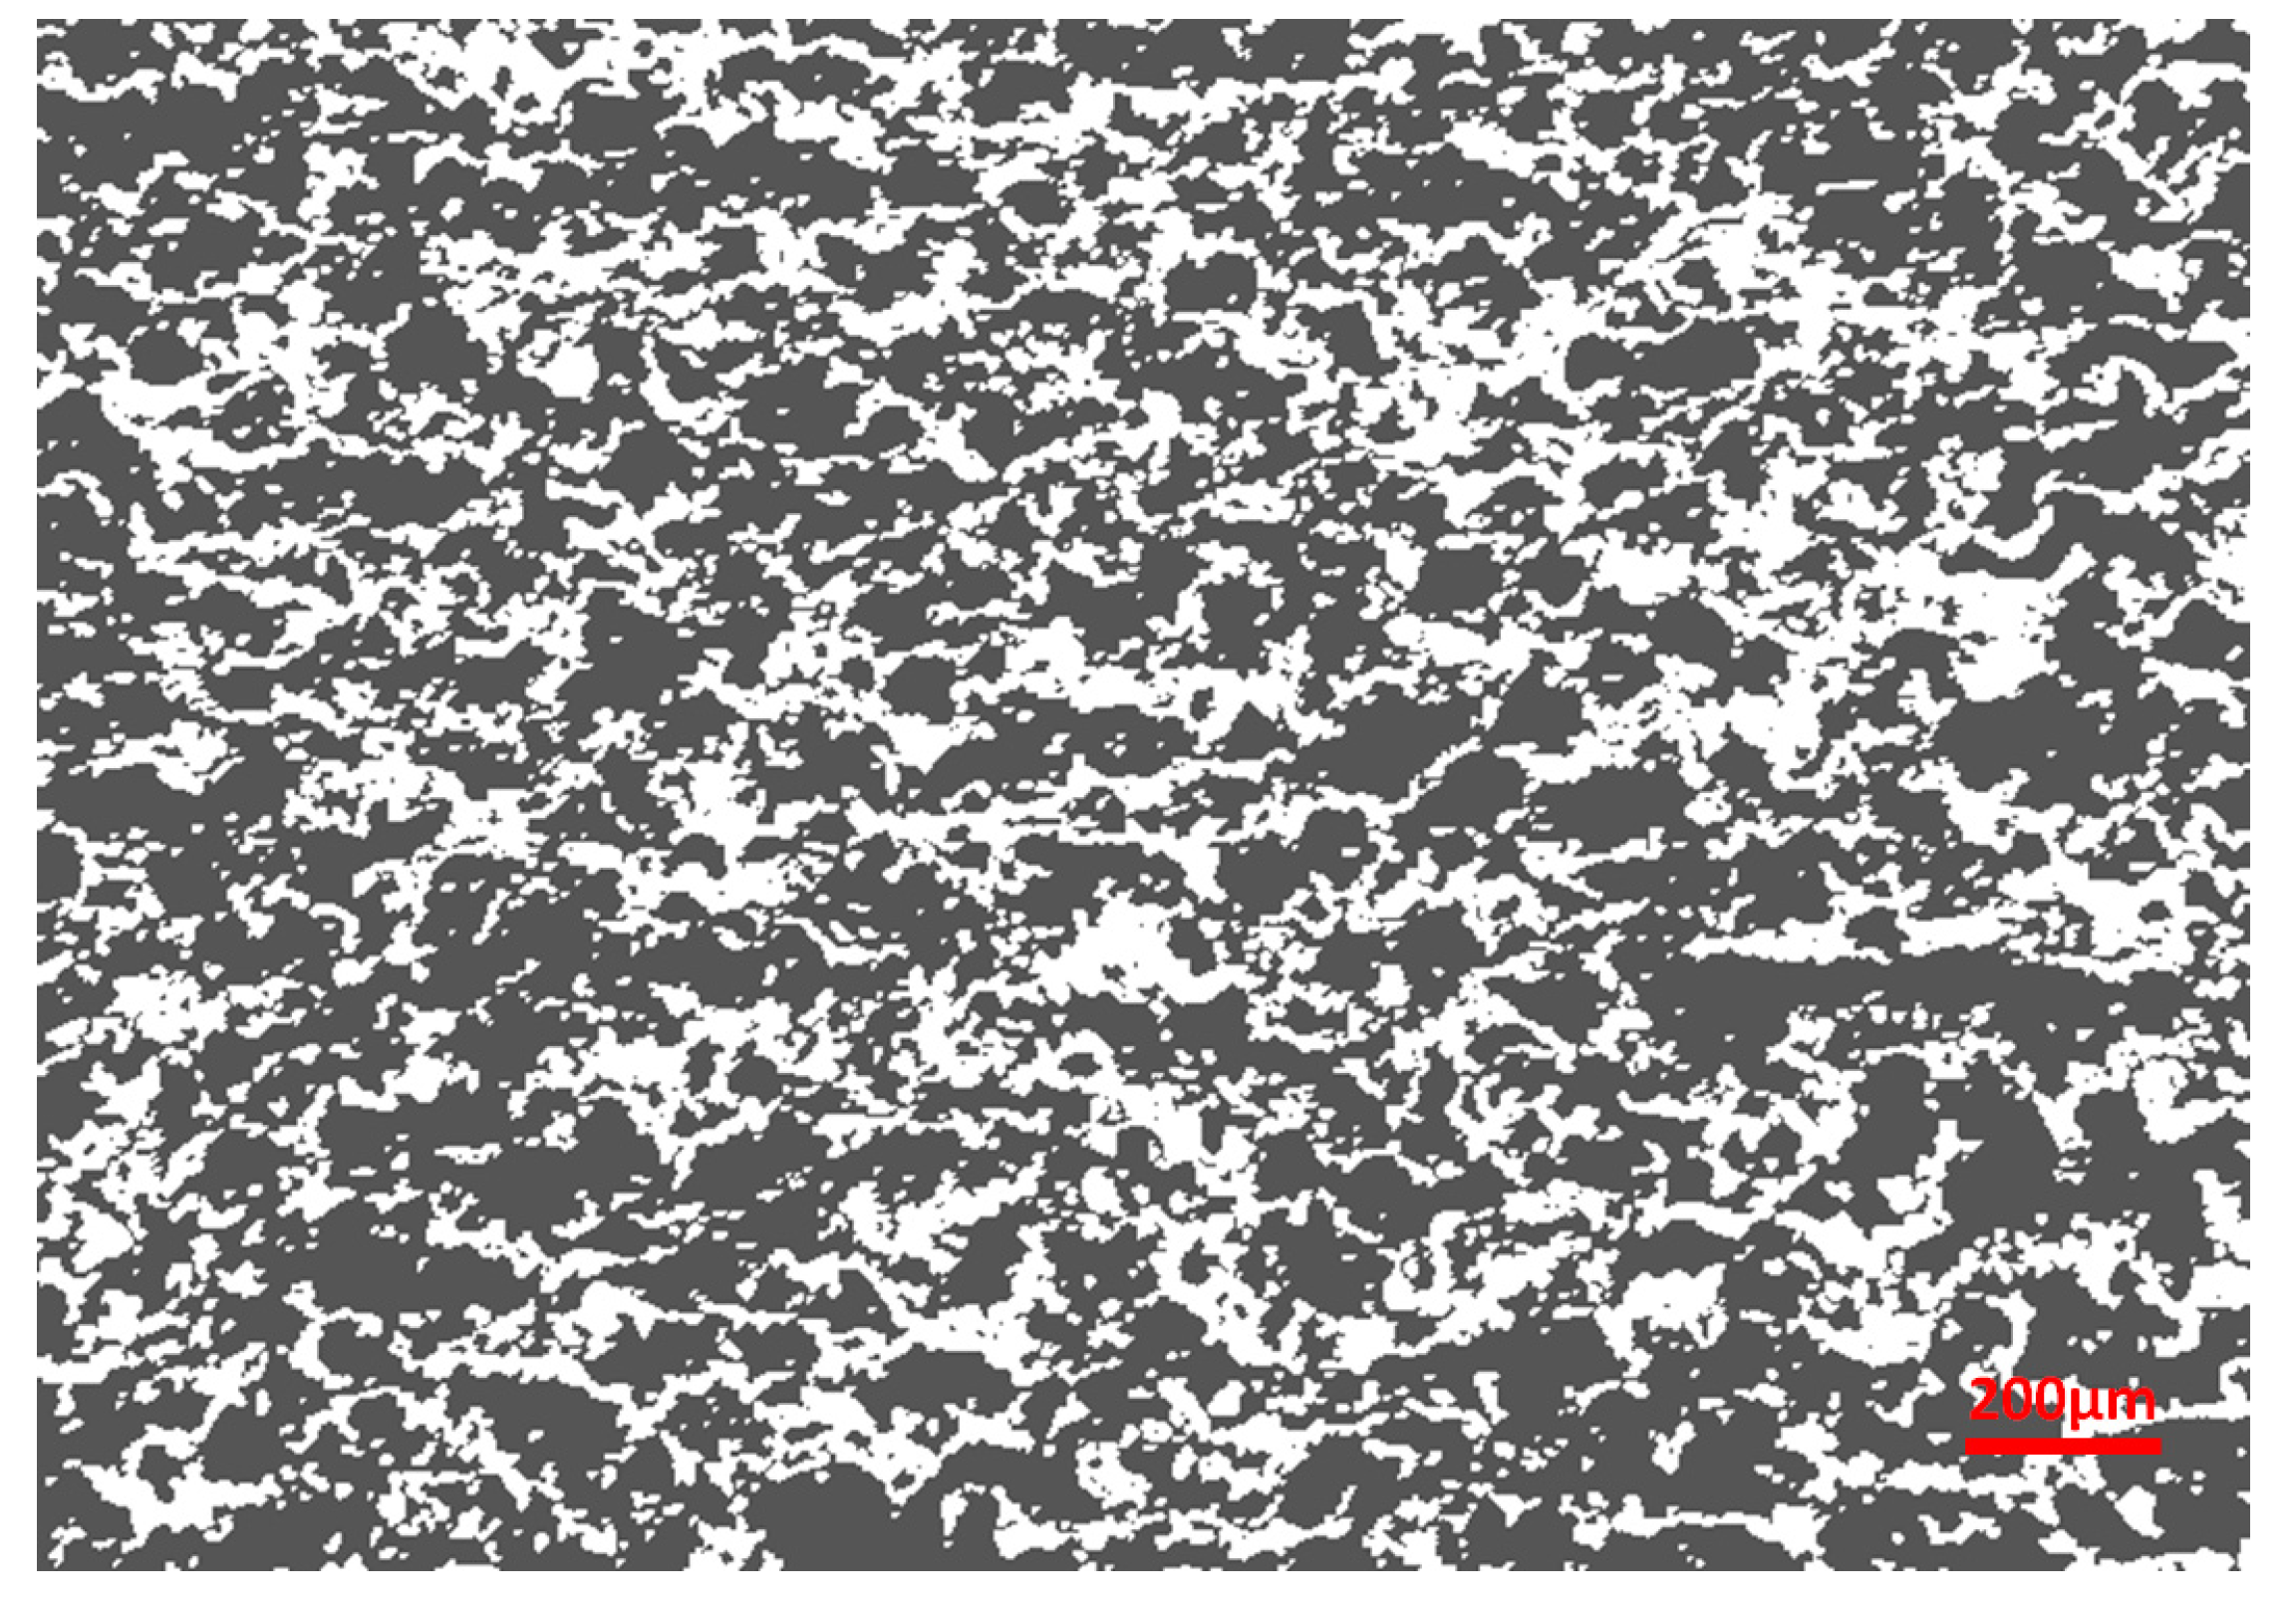
Figure 9.
Variation of the coating effective properties vs. AlSi content.

Table 1.
List of load cases applied to micrographs.
| List of Sets | Top Line | Bottom Line | Left Line | Right Line | Result |
|---|---|---|---|---|---|
| Set 1 | T = 50 °C | T = 20 °C | free | free | κy |
| Set 2 | free | free | T = 50°C | T = 20 °C | κx |
| Set 3 | free | Uy = 0 | Ux = 0 | Ux/W = ε | Ex |
| Set 4 | Uy/H = ε | Uy = 0 | Ux = 0 | free | Ey |
| Set 5 | Uy = 0 | Uy = 0 | Ux = 0 | Ux/W = ε | νxy |
| Set 6 * | Uy/H = ε | Uy = 0 | Ux = 0 | Ux = 0 | νyx |
| Set 7 | free | Uy = 0 | Ux = 0 | Ux = 0 | αx |
| Set 8 | Uy = 0 | Uy = 0 | Ux = 0 | free | αy |
* Set 6 could be omitted but was calculated just to check Equation (2) for validation purpose.
Table 2.
Expressions applied to derive the effective properties from the corresponding Finite Element Modeling (FEM) results.
Table 2.
Expressions applied to derive the effective properties from the corresponding Finite Element Modeling (FEM) results.
| Loading Case | Applied Formulas |
|---|---|
| Set 1 | |
| Set 2 | |
| Set 3 | |
| Set 4 | |
| Set 5 | |
| Set 6 | |
| Set 7 | |
| Set 8 |
Table 3.
Thermo-mechanical properties of the two materials of M601 powder.
| Material | Thermal Conductivity (W·m−1·K−1) | Young’s Modulus (GPa) | Poisson’s Ratio | Dilatation Coefficient | Density (kg·m−3) |
|---|---|---|---|---|---|
| Al12Si | 130 | 71 | 0.34 | 20.5 | 2660 |
| Polyester | 0.17 [10,21] | 3.5* [22] | 0.4 [23] | 59 [24] | 1440 [24] |
* From NHT measurements performed on coatings [22].
Table 4.
Computed effective properties of the coating.
| Effective Property | Value |
|---|---|
| Effective thermal conductivities (W·m−1·K−1) | κy = 0.556 |
| κx = 1.30 | |
| Effective Young’s modulus (GPa) | Ex = 7.6 |
| Ey = 6.1 | |
| Poisson’s ratios | νxy = 0.395 |
| νyx = 0.32 | |
| Dilatation coefficients (µm·m−1·K−1) | αx = 37.2 |
| αy = 44.7 |
Table 5.
Effect of the AlSi content on the effective thermo-mechanical properties of coatings.
| Effective Property | AlSi Content (vol %) | |
|---|---|---|
| 28% | 37% | |
| κx (W·m−1·K−1) | 1.30 | 2.58 |
| κy (W·m−1·K−1) | 0.56 | 1.00 |
| Ex (GPa) | 7.6 | 9.8 |
| Ey (GPa) | 6.1 | 7.5 |
© 2017 by the authors. Licensee MDPI, Basel, Switzerland. This article is an open access article distributed under the terms and conditions of the Creative Commons Attribution (CC BY) license (http://creativecommons.org/licenses/by/4.0/).
Share and Cite
MDPI and ACS Style
Bolot, R.; Aussavy, D.; Montavon, G. Application of FEM to Estimate Thermo-Mechanical Properties of Plasma Sprayed Composite Coatings. Coatings 2017, 7, 91. https://doi.org/10.3390/coatings7070091
AMA Style
Bolot R, Aussavy D, Montavon G. Application of FEM to Estimate Thermo-Mechanical Properties of Plasma Sprayed Composite Coatings. Coatings. 2017; 7(7):91. https://doi.org/10.3390/coatings7070091
Chicago/Turabian StyleBolot, Rodolphe, Delphine Aussavy, and Ghislain Montavon. 2017. "Application of FEM to Estimate Thermo-Mechanical Properties of Plasma Sprayed Composite Coatings" Coatings 7, no. 7: 91. https://doi.org/10.3390/coatings7070091
Note that from the first issue of 2016, this journal uses article numbers instead of page numbers. See further details here.