Article

Investigation of the Corrosion Behavior of Electroless Ni-P Coating in Flue Gas Condensate

State Key Laboratory for Mechanical behavior of Materials, School of Materials Science and Engineering, Xi’an Jiaotong University, Xi’an 710049, China
*
Author to whom correspondence should be addressed.
Coatings 2017, 7(1), 16; https://doi.org/10.3390/coatings7010016
Submission received: 27 December 2016 / Revised: 13 January 2017 / Accepted: 17 January 2017 / Published: 19 January 2017
(This article belongs to the Special Issue Coatings for Corrosion Mitigation)

Abstract

:
The corrosion behavior of Ni-P coating deposited on 3003 aluminum alloy in flue gas condensate was investigated by electrochemical approaches. The results indicated that nitrite acted as a corrosion inhibitor. The inhibiting effect of nitrite was reduced in solutions containing sulfate or nitrate. Chloride and sulfate accelerated the corrosion of Ni-P coatings greatly. This can provide important information for the researchers to develop special Ni-P coatings with high corrosion resistance in the flue gas condensate.

1. Introduction

Presently, the corrosion problem of condensers in the petroleum industry is becoming more and more severe [1,2,3]. The condensers inevitably contact acid flue gas condensate, and then are corroded by the flue gas condensate, which mainly consists of sulfate, nitrate, chloride, and nitrite. Therefore, it is of great urgency to seek suitable materials and protective measures.
It is well known that aluminum alloy can form a thin solid protective film of oxide. The aluminum-manganese alloys which partly replace stainless steels and copper alloys have been extensively used for manufacturing condensers in the petrochemical industry [4]. However, in contact with solutions containing chloride ions, aluminum undergoes pitting corrosion [5,6,7]. Recently, considerable attention has been paid to electroless plating of Ni-P on aluminum alloys. The results indicated that Ni-P coatings can improve the corrosion resistance of aluminum alloys [8,9,10,11,12]. As is known to all, the Ni-P coatings on aluminum alloys act as cathodic coatings. The electrochemical potential difference between Ni-P coatings and aluminum alloys is large. Aluminum alloy substrates are easy to attack in flue gas condensate if there are pores across the Ni-P coatings [13]. Many researchers have studied the corrosion behaviors of electroless Ni-P coatings [14,15,16]. However, only a few investigations have concentrated on the corrosion behavior of Ni-P coatings in flue gas condensate [13,17]. In addition, few researchers have considered the effects of the anion component in flue gas condensate on the corrosion behavior of Ni-P coatings. The originality of this study is to investigate the corrosion behavior of a Ni-P coating deposited on 3003 aluminum alloy in different mediums containing similar ions to that of flue gas condensate. The present data will be beneficial to accurately understand the corrosion behavior of a Ni-P coating in flue gas condensate. It can guide the researchers in developing anti-corrosive Ni-P coatings in flue gas condensate.

2. Materials and Methods

The 3003 aluminum alloy with size of 40 mm × 10 mm × 4 mm was designed as substrate material whose chemical composition was shown in Table 1. The substrate surface was abraded down to a 1000 grit SiC paper, and then polished by flannelette. The specimens were cleaned with acetone and anhydrous ethanol in an ultrasonic cleaner, successively, then dried in a vacuum oven for later use.
All chemicals used were produced by Aladdin (Shanghai, China) and were of analytical grade. The high phosphorus commercial electroless solution was commercial Slotonip 70 A that was prepared from Schlotter Company (Geislingen, Germany). The Ni-P coating was plated at pH of 4.61 and temperature of 359 K for 90 min. The bath load of electroless solution was 1 dm2/L. During the plating process, the electroless bath was continuously stirred at a rate of 200 r/min by a magnetic stirring apparatus.
The electrochemical measurements were carried out at 298 K in four types of solutions as listed in Table 2. The components of flue gas condensate which had been applied in our previous study [18] were the same with that of solution A (Table 2). The four corrosive mediums were chosen on the basis of the component of flue gas condensate. The aim of this study was to investigate the corrosion behavior of electroless Ni-P coating in solutions containing different anions. Cl, SO 4 2 , NO 3 and NO 2 in the solution are provided by HCl, H2SO4, HNO3 and NaNO2, respectively. The pH values of the four solutions were adjusted to 3.12 using dilute NH3·H2O. The electrochemical measurements were performed in the above-mentioned solutions using a conventional three-electrode cell with platinum as counter electrode, saturated calomel electrode (SCE) as reference electrode and the samples with an exposed area of 1.0 cm2 as working electrode. All potential values were referred to SCE in this study except for special statements. The changes in the open circuit potentials (OCPs) of the Ni-P coatings in the four solutions were first tested as a function of immersion time for about 40,000 s. Electrochemical impedance spectroscopy (EIS) measurements were performed from 10 kHz to 10 mHz with 10 mV amplitude perturbing signal. The samples were polarized from −1.5 V to 1.8 V versus OCP at the scan rate of 2 mV·s−1. For electrochemical measurements, three parallel samples were tested to check the coherence of the results.
The surface morphologies were observed using a field emission scanning electron microscope (FESEM) with energy-disperse spectrometer (EDS) attachment. And X-ray diffraction analysis (XRD) was utilized to examine the phase composition of the samples.

3. Results and Discussions

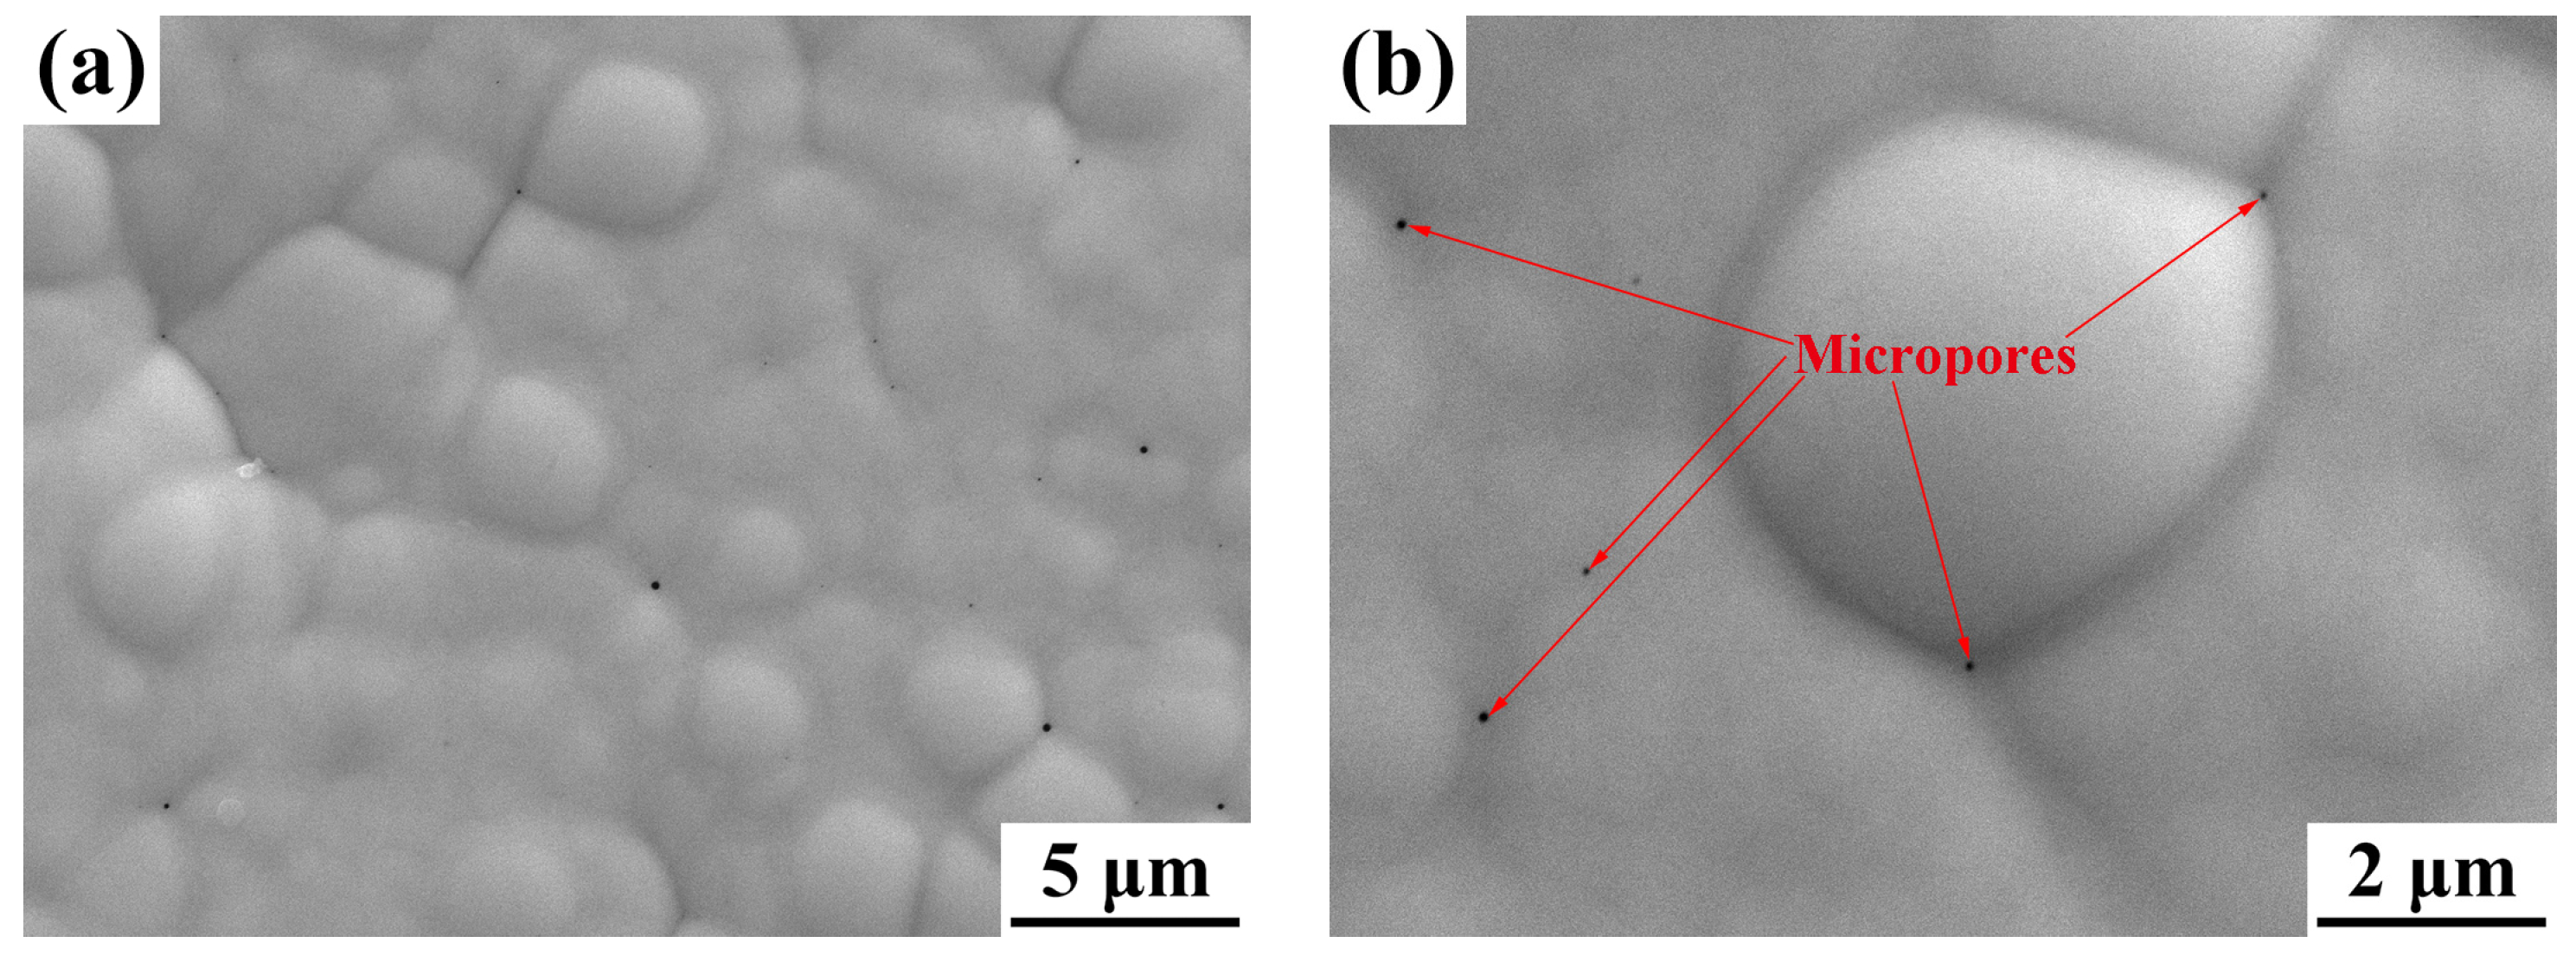
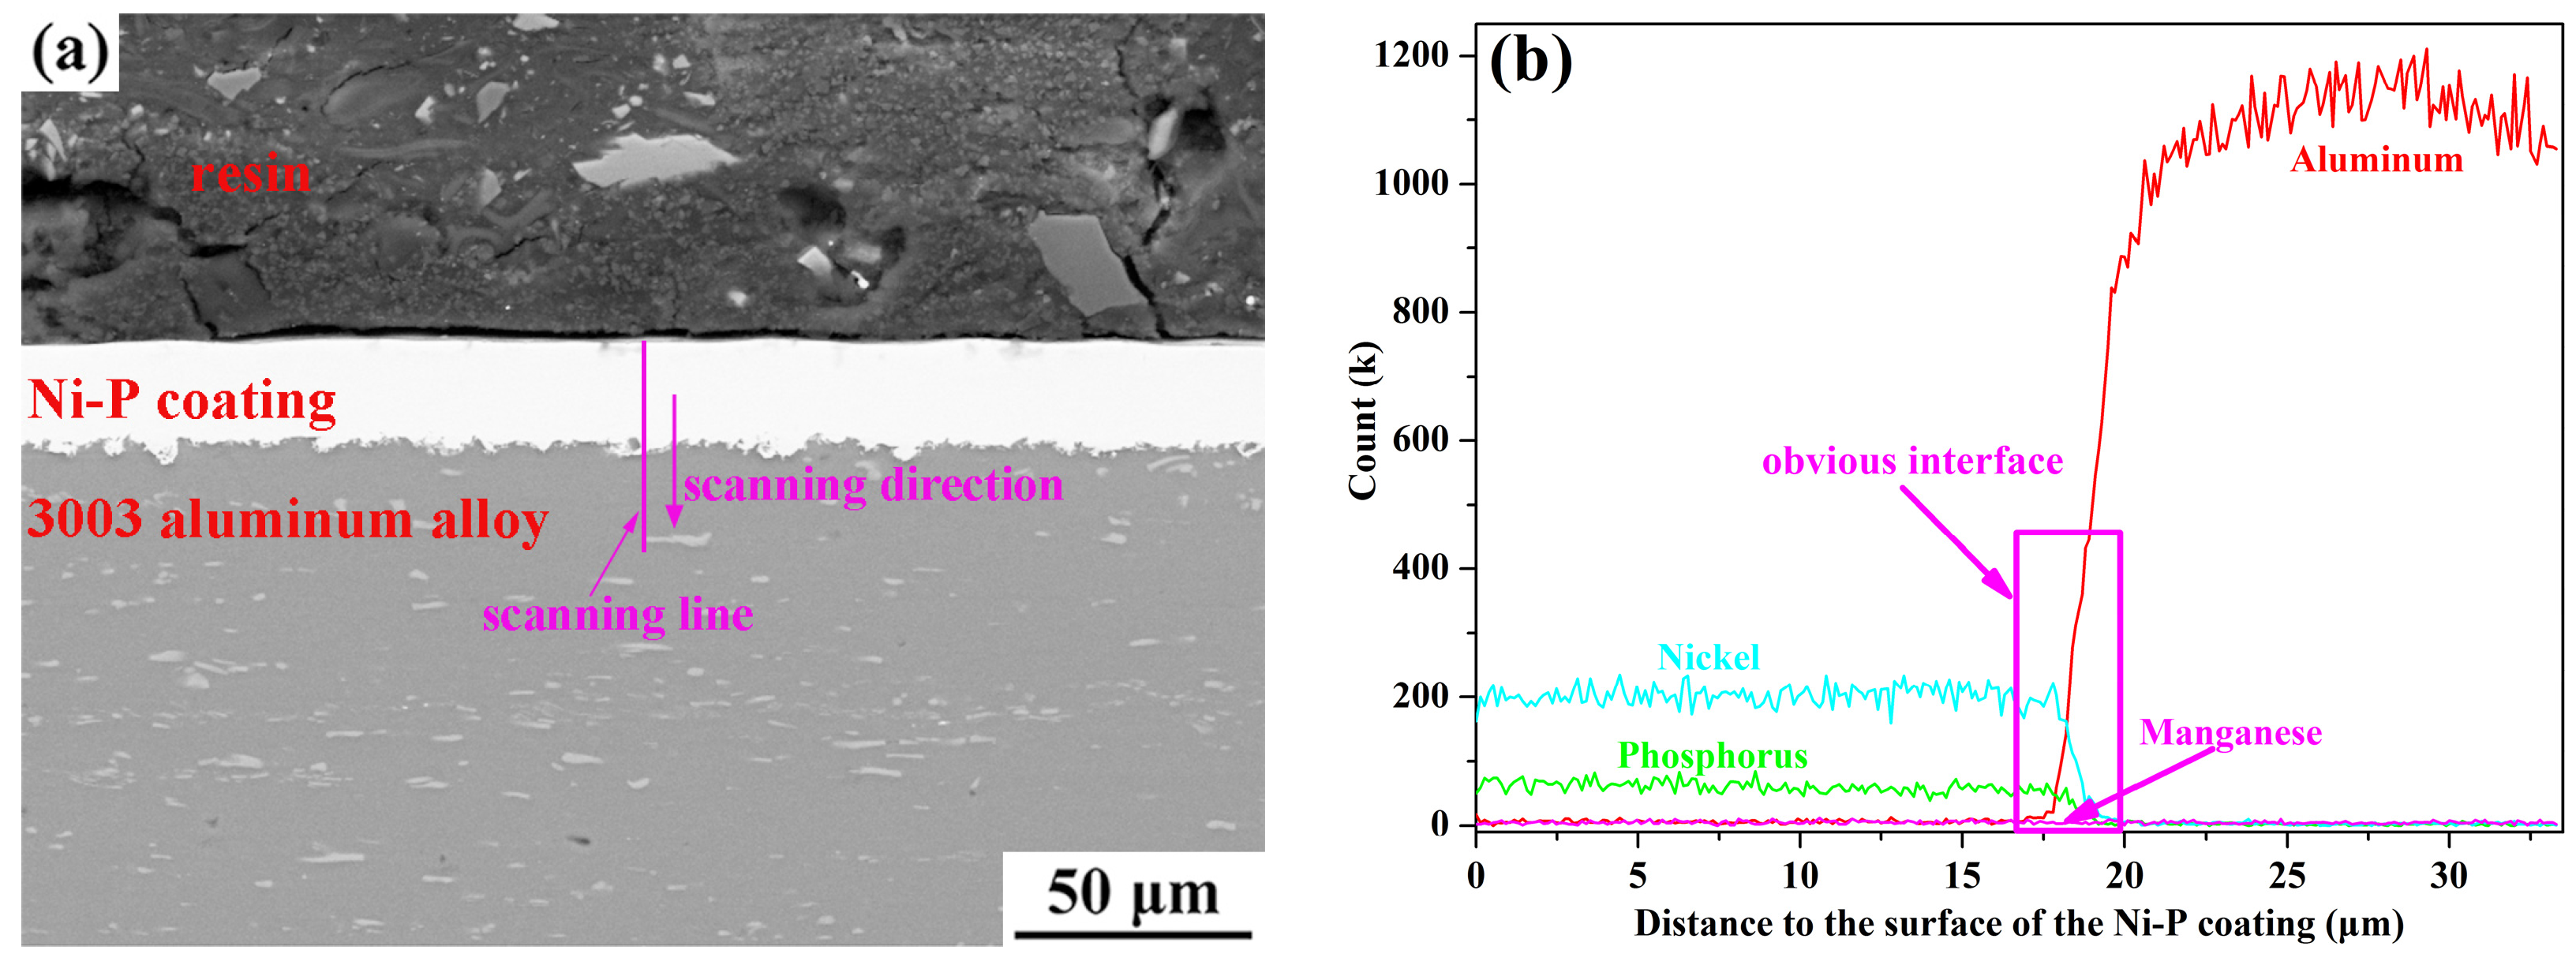
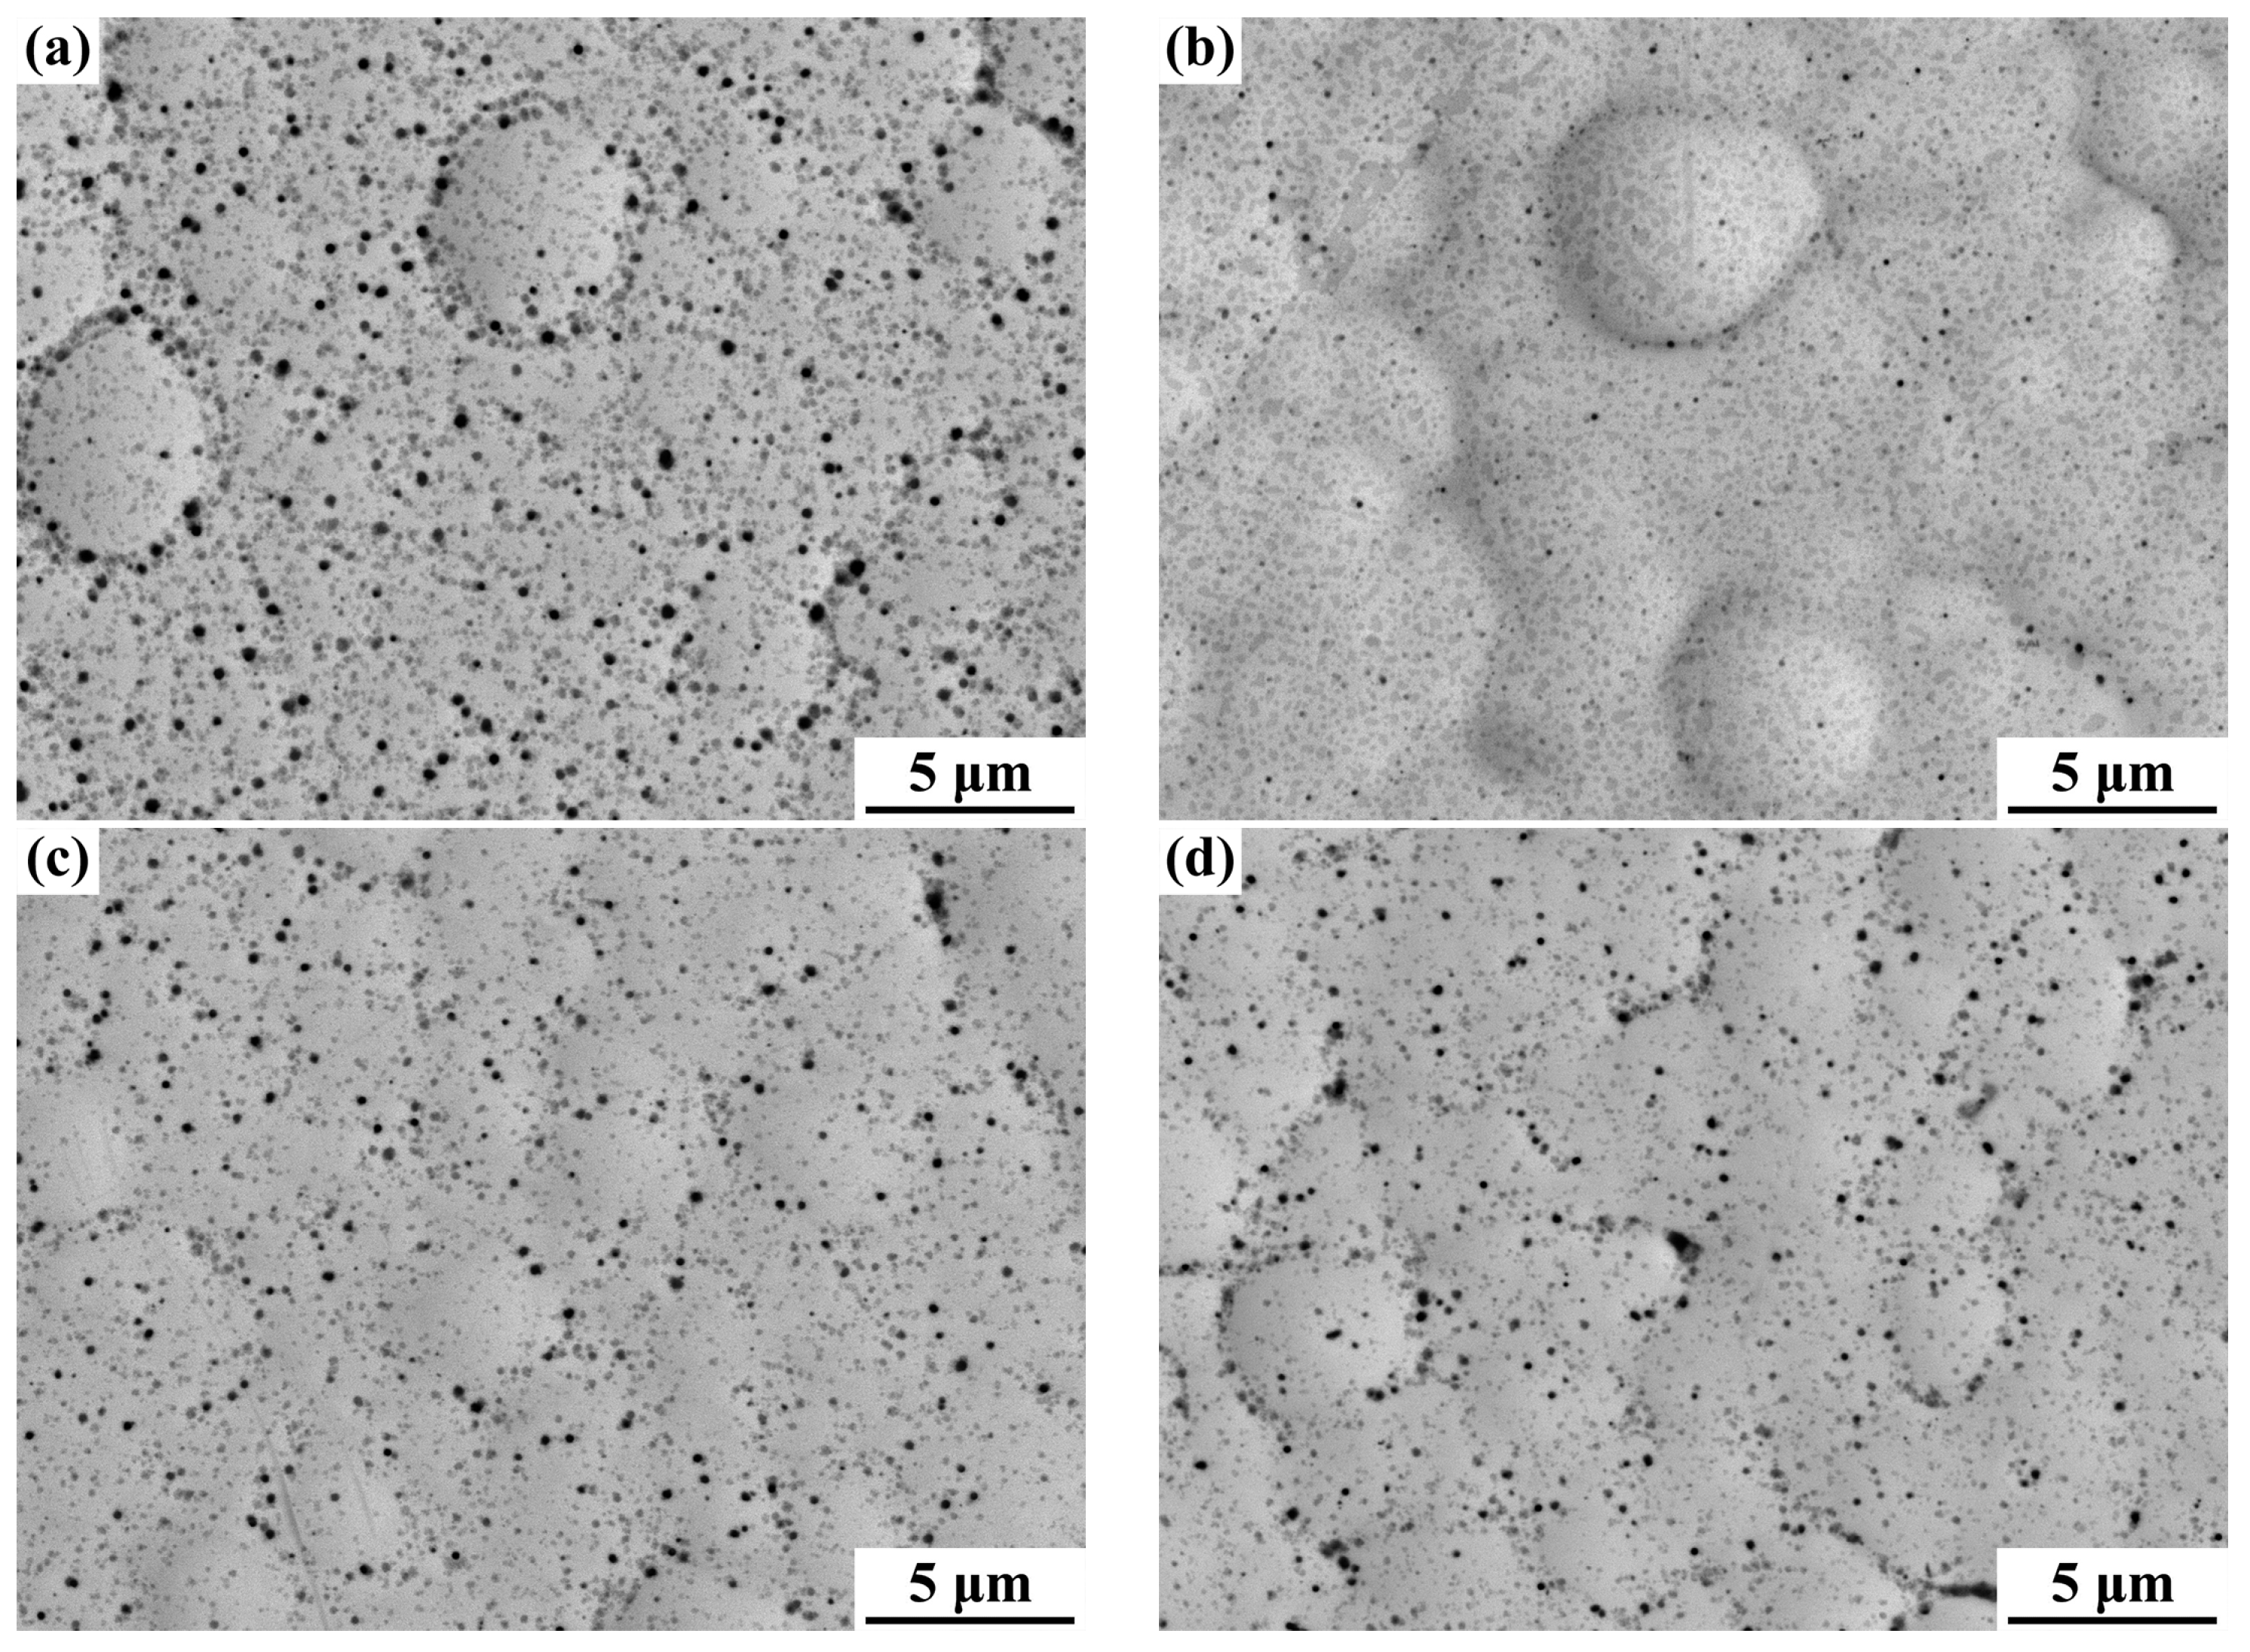
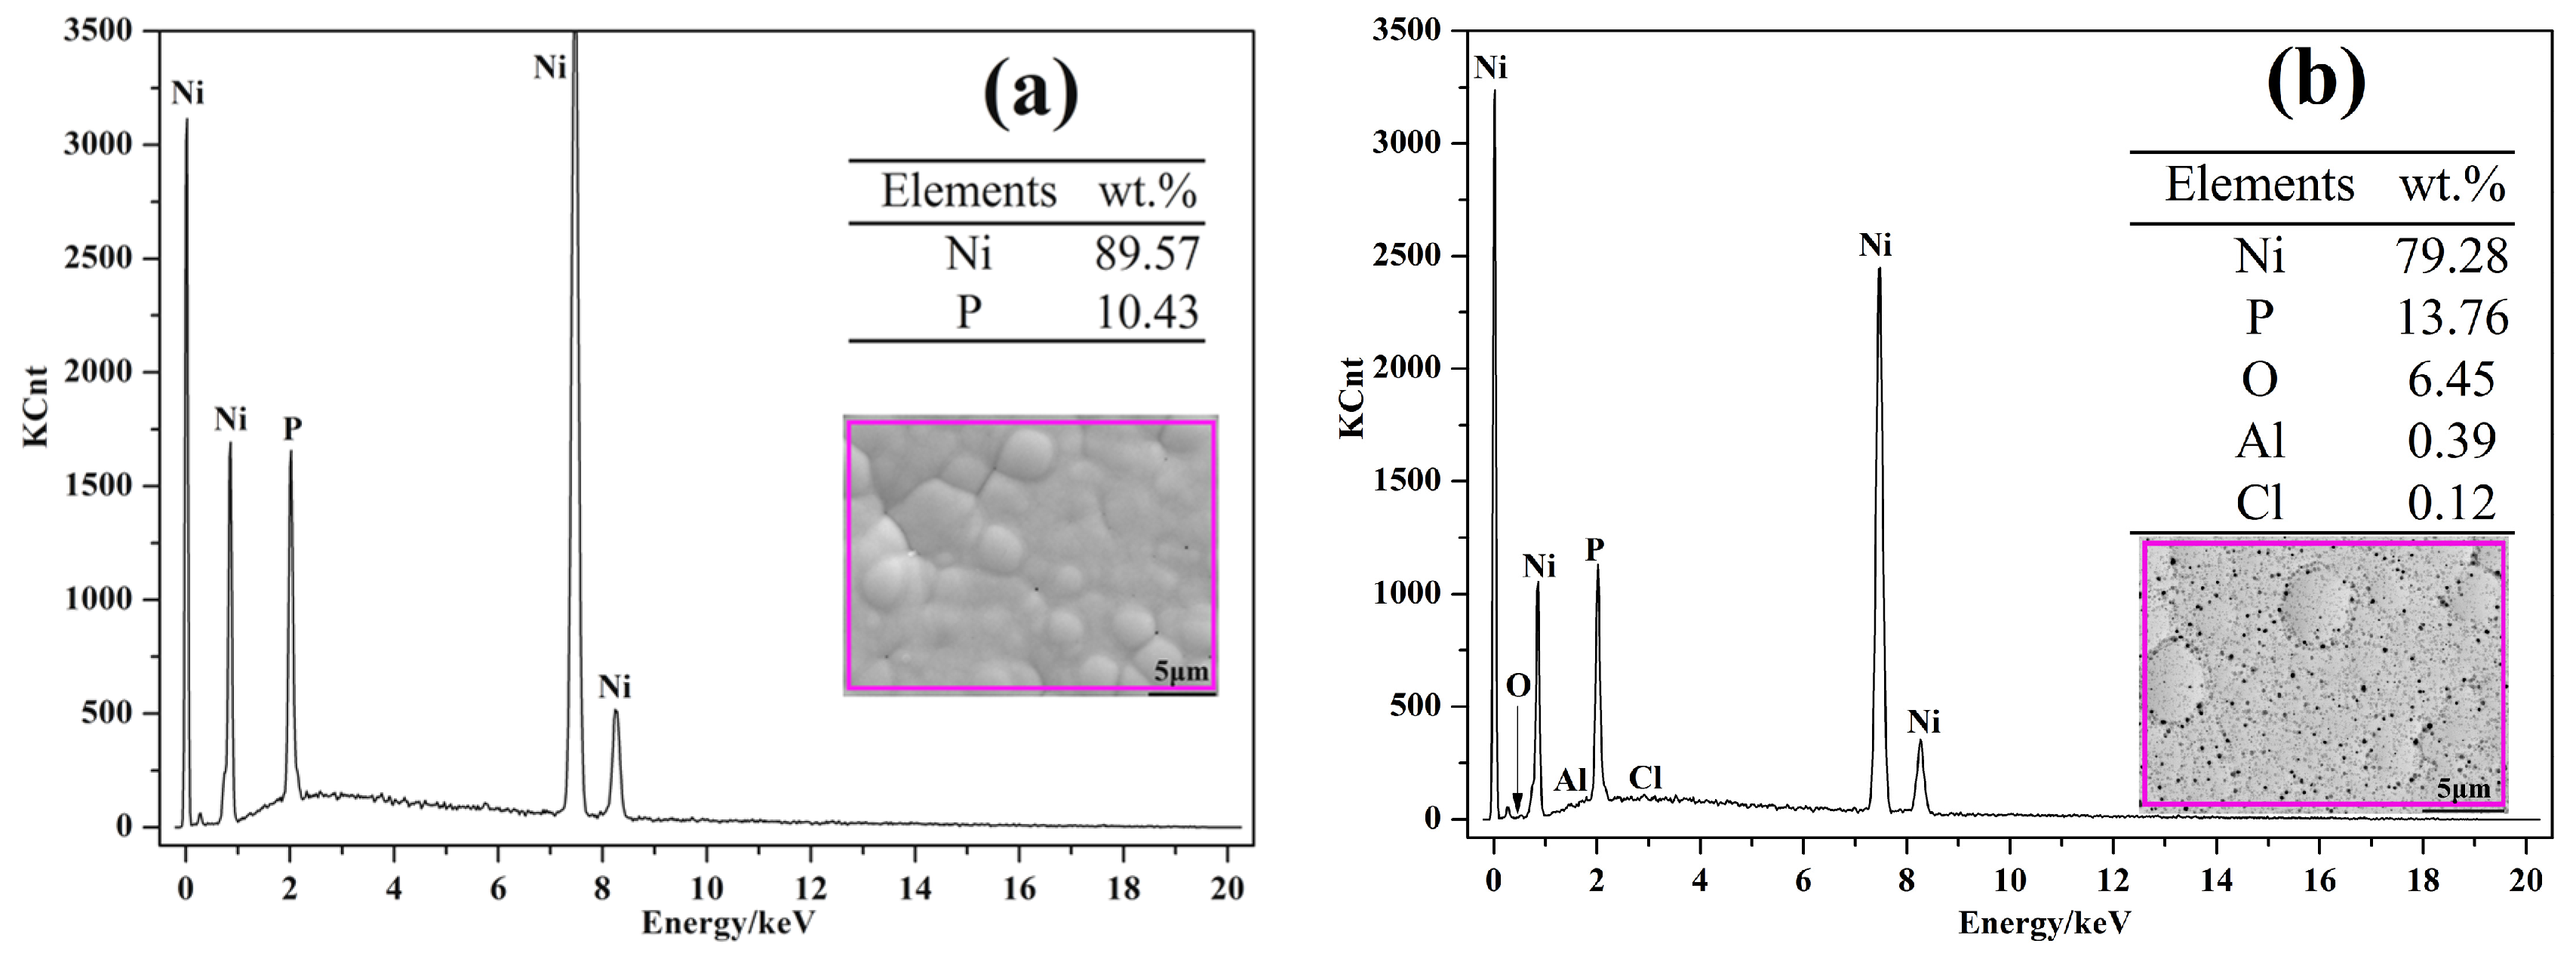
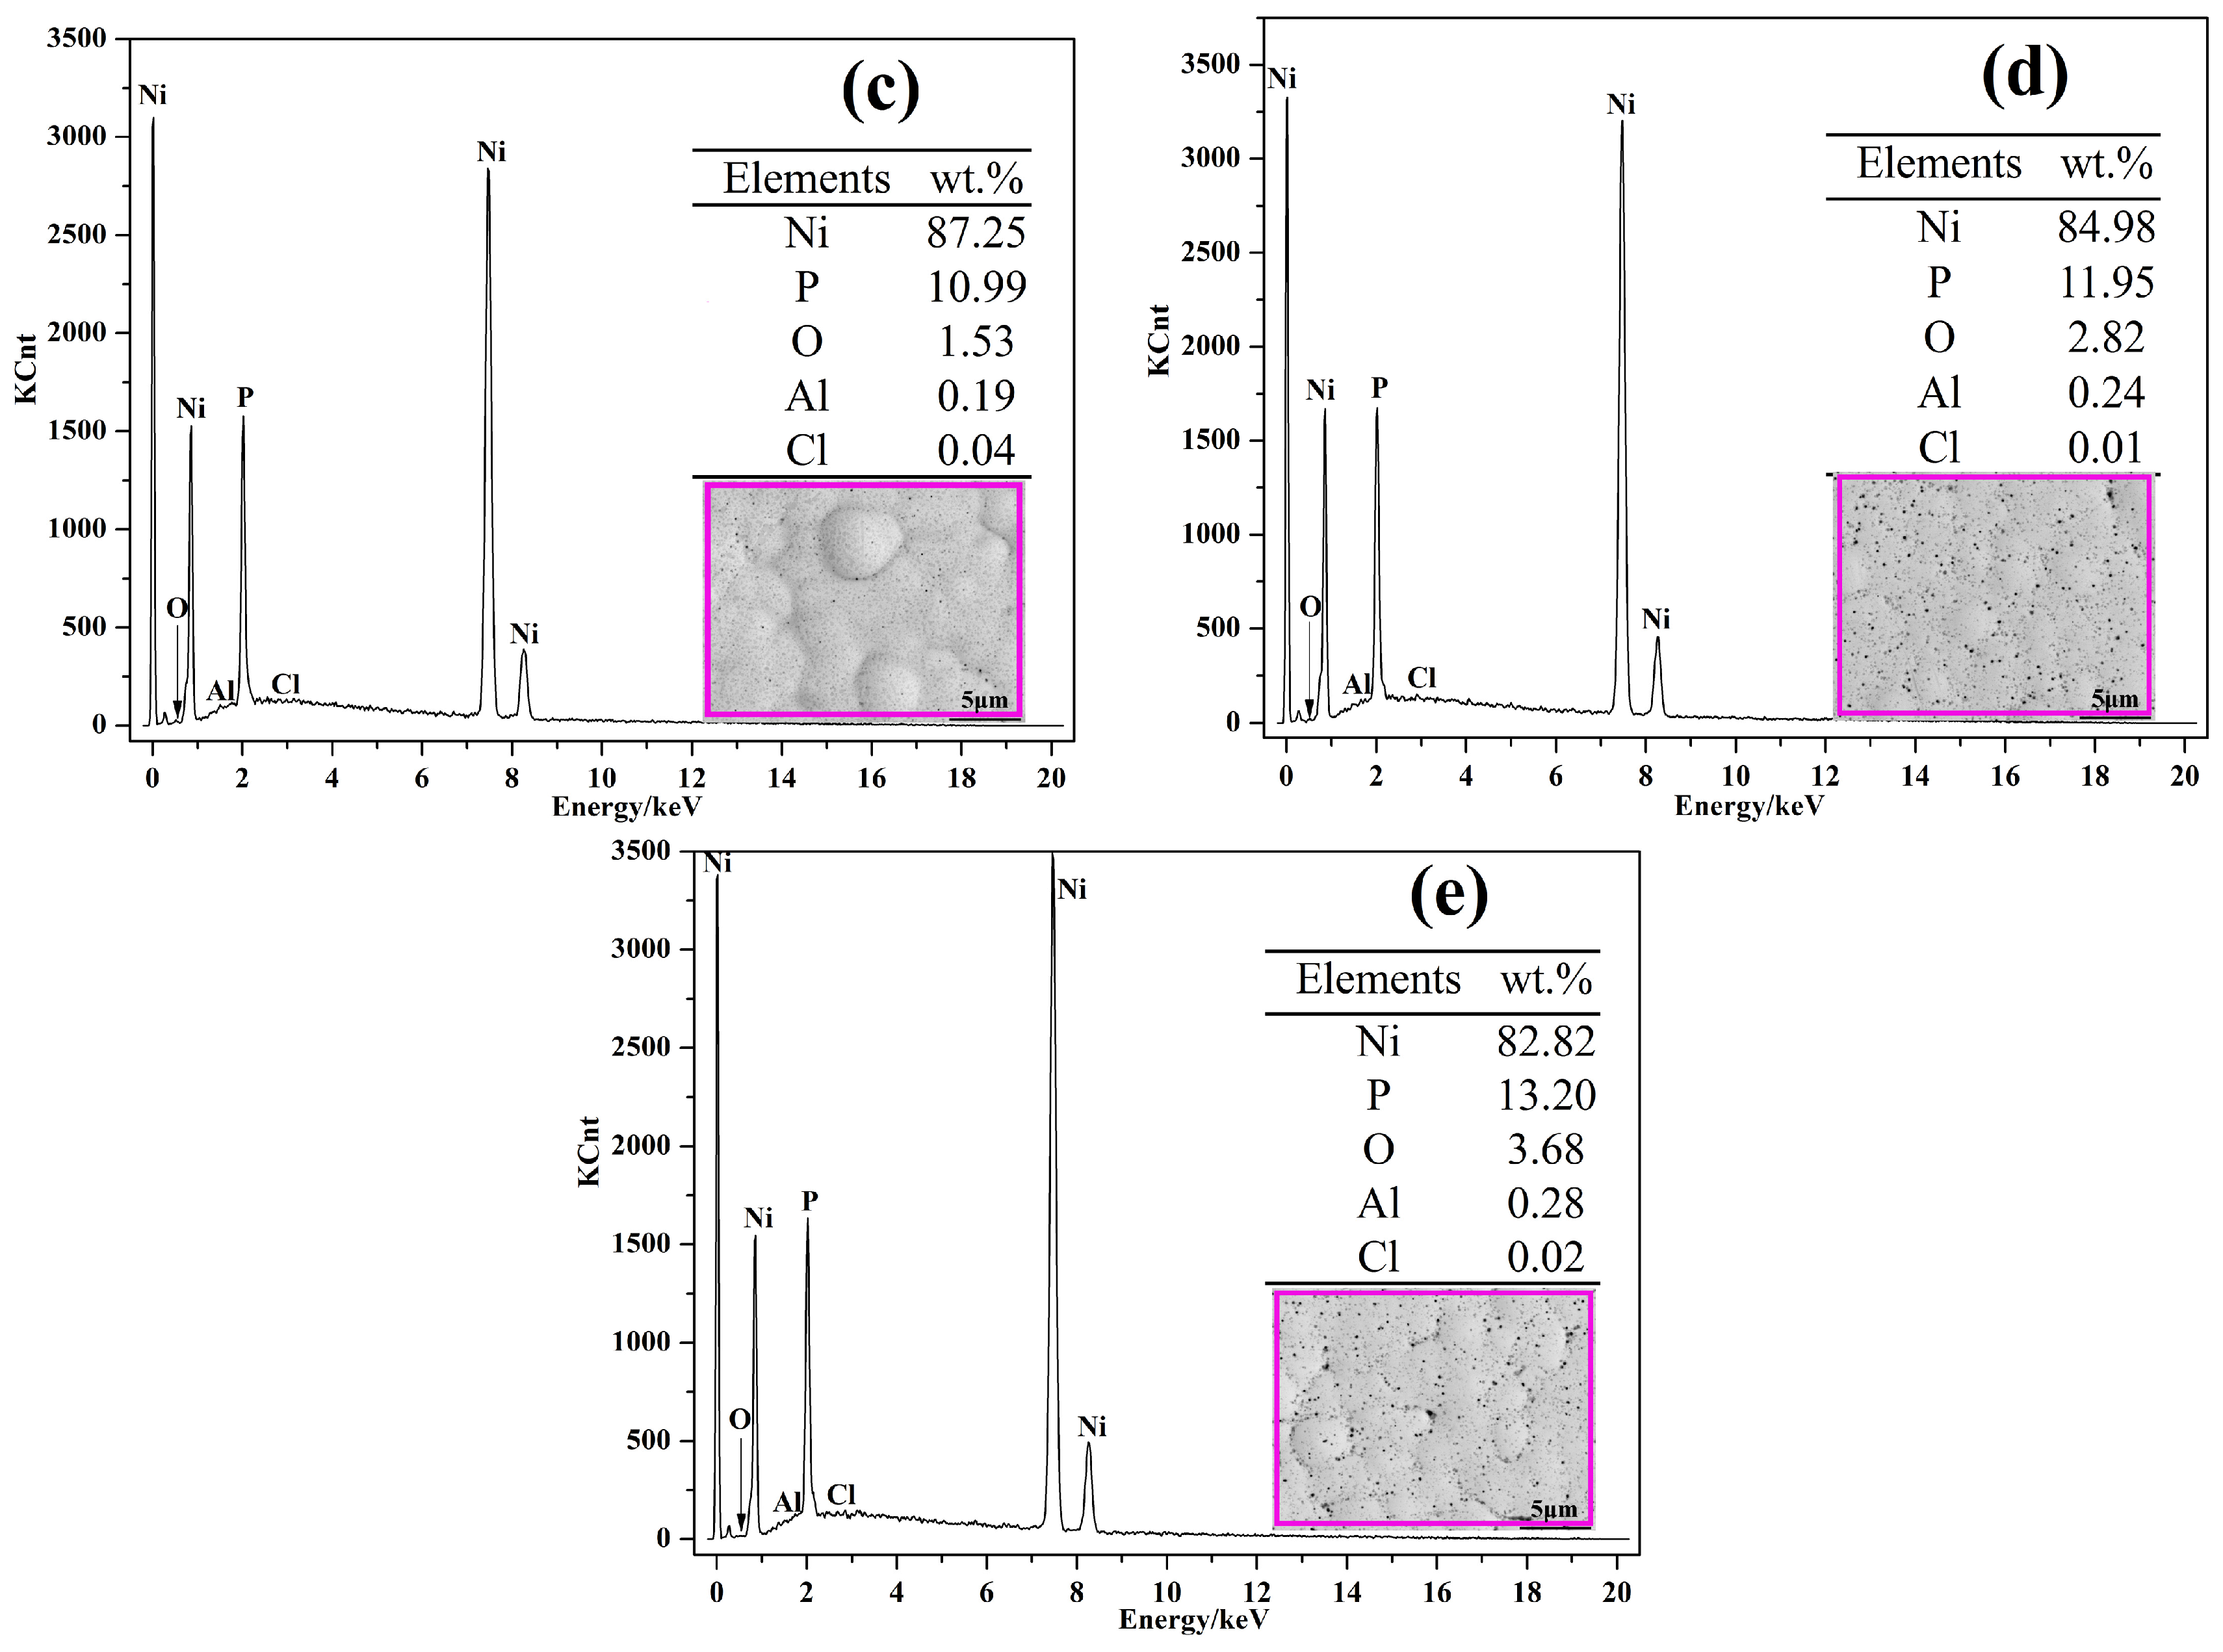
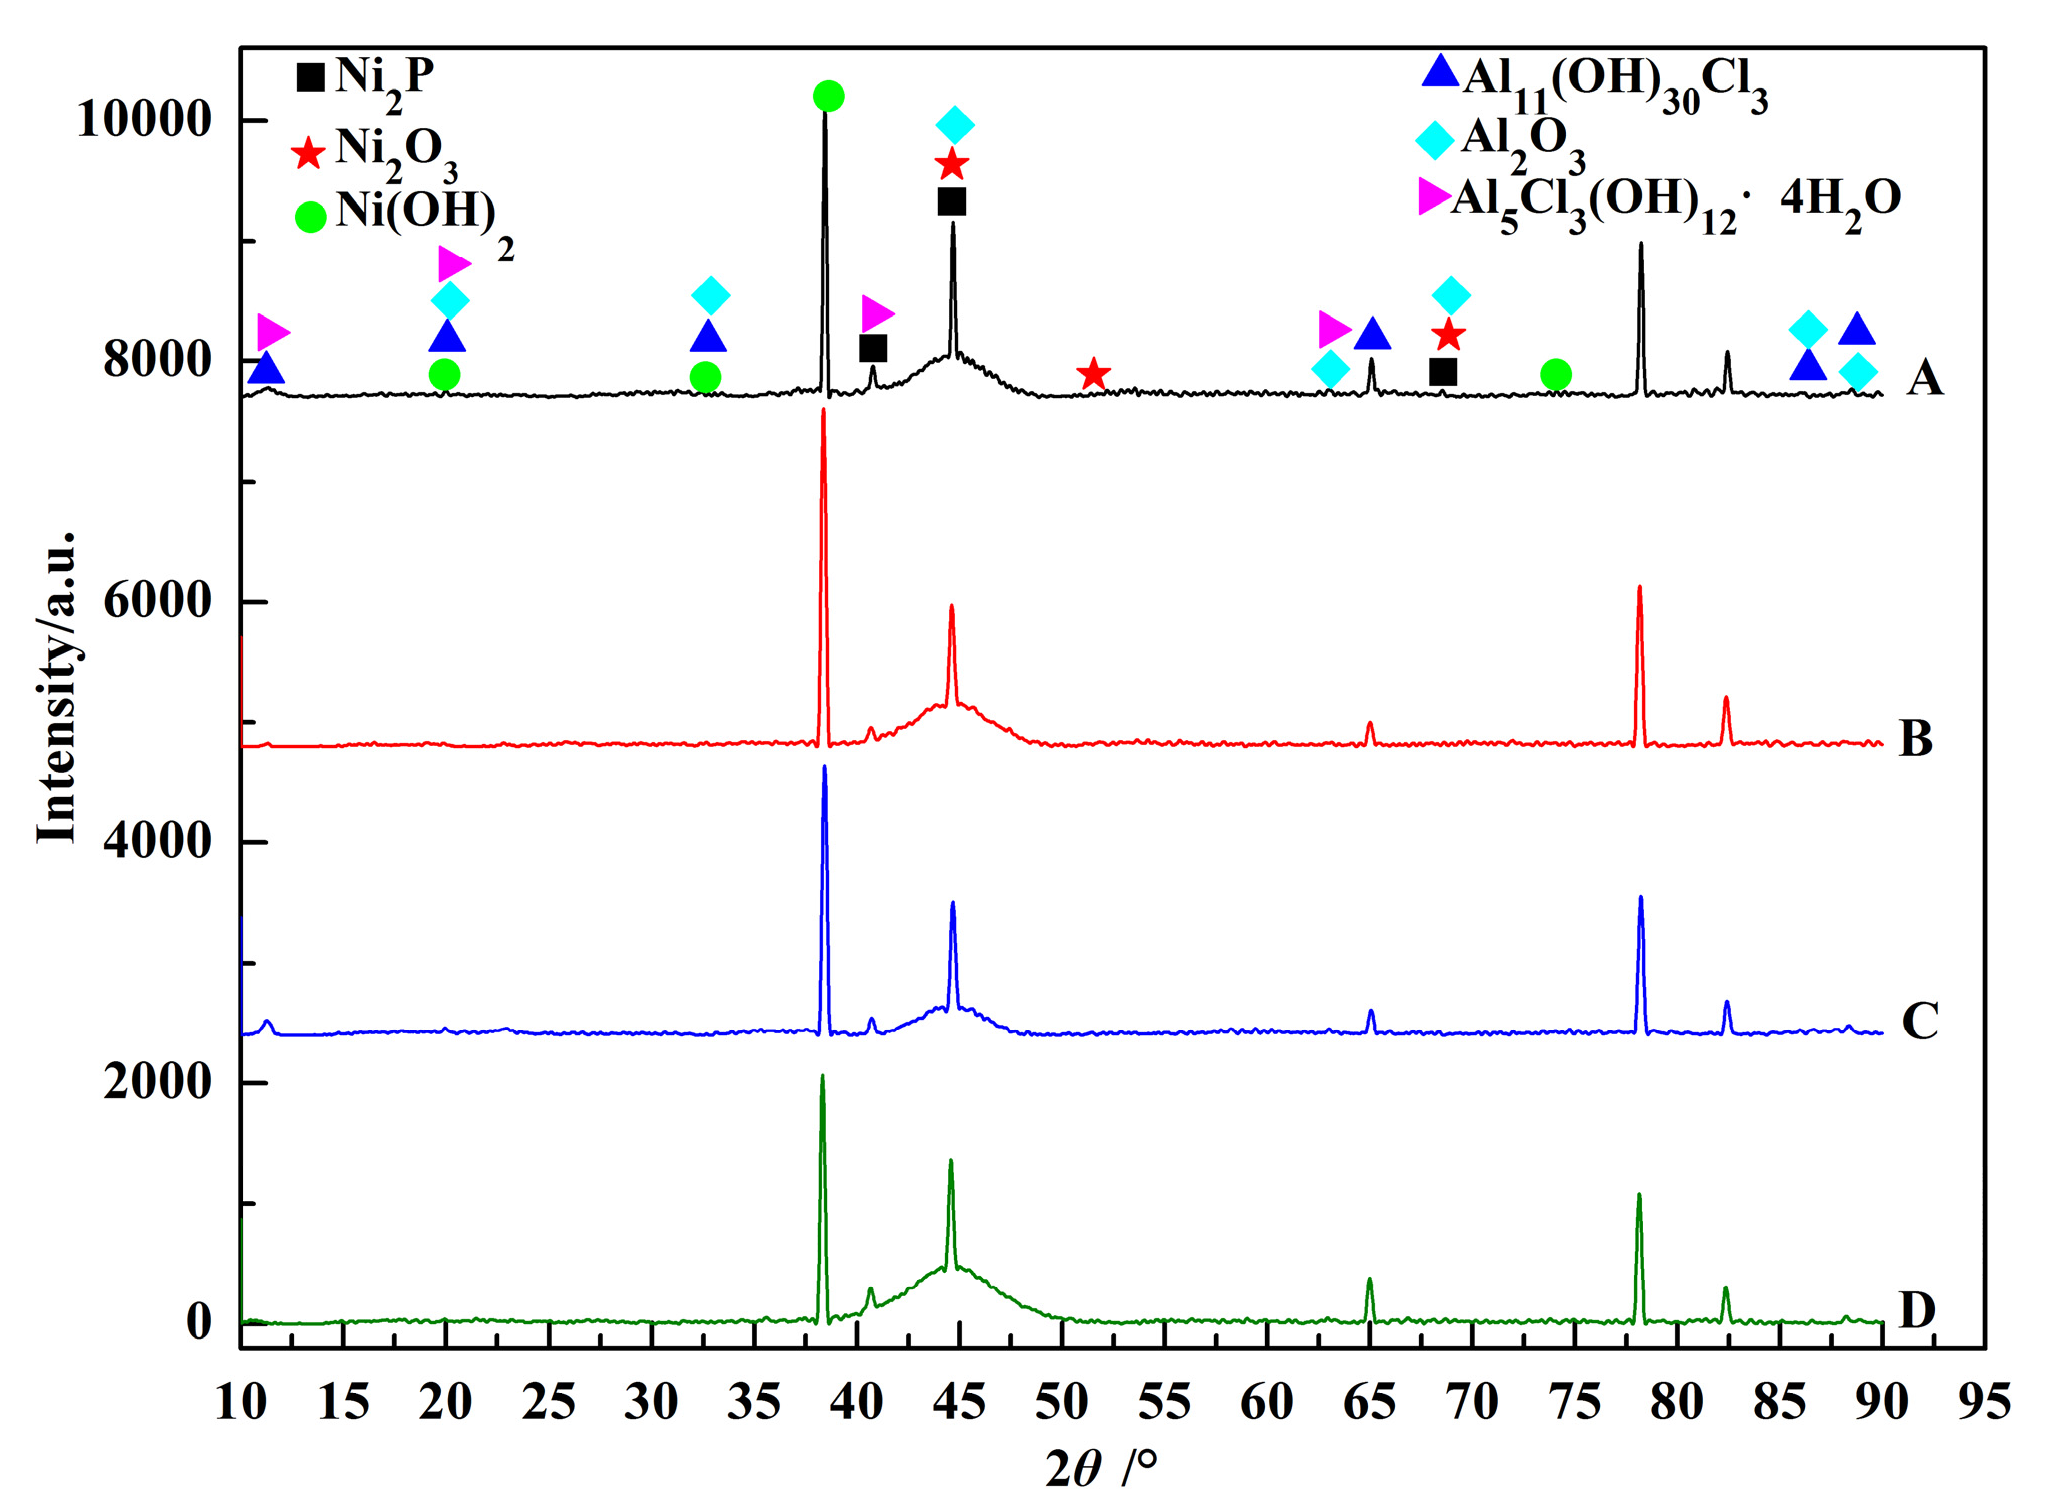
3.1. Morphology Observations and Microstructures Properties

The microstructure of the as-deposited Ni-P coating is displayed in Figure 1. As is observed in this micrograph, the electroless Ni-P coating shows compact and cellular structure. Many micropores were distributed at the intersection of the cellular structure (Figure 1a,b). According to the ASTM B733-04 [19], when the substrate is aluminum alloy, the Alizarin test is used for determining the porosity of Ni-P electroless coatings. The number of coating pores per 10 square microns was about two. The result of the Alizarin test showed that there is one through-hole per 10 square microns. The micropores, especially the through-holes of the Ni-P coating, are vitally important to the corrosion resistance of the substrate. The electrode potential of nickel is more positive than that of aluminum. Therefore, once the corrosive medium infiltrates into the through-holes, galvanic corrosion between nickel (cathode) and aluminum (anode) will occur at the interface of the coating. The anodic area is much larger than the cathodic area, which promotes the corrosion of the aluminum at the interface. This will destroy the bonding interface and accelerate the corrosion failure of the coating.
From the section of the electroless Ni-P coating (Figure 2a), we could deduce that the thickness of the coating was about 17.9 μm. The EDS elements’ distribution along the section is displayed in Figure 2b. The elements’ distribution shows an obvious interface and the elements Ni and P are distributed uniformly through the coating.
The surface morphologies of the Ni-P coatings after polarization measurements are shown in Figure 3. The corrosion pattern was pitting corrosion. Corrosion pits were found to be present for all the relevant Ni-P coatings; however, the number and the size of the pits were somewhat different. The percentages of pore areas for the samples immersed in solutions A, B, C, and D (samples A, B, C, and D) were 2.0%, 0.2%, 1.2%, and 1.4%, respectively. The corrosion resistance of sample B was the highest (Figure 3b). The corrosion of sample A was the most serious (Figure 3a), which demonstrates that sulfate elevates the corrosion rate of the Ni-P coating. The corrosion resistance of sample C (Figure 3c) was higher than that of sample A, indicating that nitrate accelerates the corrosion process. The corrosion of sample D was more severe than that of sample C (Figure 3d), showing that nitrite can inhibit the corrosion rate of the Ni-P coating. The corrosion of sample D was slighter than that of sample A, which illustrates that nitrate and nitrite together promote the corrosion of the Ni-P coating. Compositions of these samples after immersion in the four solutions and the as-deposited Ni-P coating were determined by EDS and are listed in Figure 4. The insets in Figure 4 show the locations where EDS spectra were collected. An enrichment in P content was displayed in all instances compared with that of the as-deposited Ni-P coating (10.43%) (Figure 4a). This is consistent with the results in previous studies [20,21]. Besides, the percentages of P in descending order are A (13.76%), D (13.20%), C (11.95%) and B (10.99%) (Figure 4b–e), indicating the various corrosion degree of the samples. The content of Ni presented the opposite trend compared with that of P. The occurrence of O, Al, and Cl was attributed to the formation of corrosion products. The greater the percentages of O, Al, and Cl are, the more severe the samples that are present. Therefore, the corrosion resistance of the samples in descending order was sample B, C, D and A.
Further XRD patterns of the samples after polarization tests in the four solutions are displayed in Figure 5. The XRD spectra suggest that nickel oxide (Ni2O3) and nickel hydroxide (Ni(OH)2) were the main corrosion products for the samples. Al2O3, Al11(OH)30Cl3, and Al5Cl3(OH)·4H2O were formed when the corrosive mediums invaded the substrate through the corrosion pits. The corrosion of nickel resulted in concentrating P and the Ni2P stable intermediate compound was formed in the Ni-P coatings [21].

3.2. OCP Measurements

The typical Ecorr-t curves describing the OCPs of the samples immersed in the four solutions are shown in Figure 6. The OCP versus exposure time is a real function used for ranking the coating performance of different systems. This means that the OCP is a relative value following the changes in the ratio between the available area for the anodic and cathodic reactions in terms of exposure time. One possible origin of various OCPs could be the different barrier properties of the coating with respect to the different electrochemical reactants. The four solutions consisted of various ions and the reactions involved in the formation of the mixed potentials were different. Therefore, the measured OCPs of the four samples were different. The whole measurement duration was divided into three stages according to the changing trends. In the initial stages, the OCP values shifted to more positive potentials very rapidly due to the instability of each system. In the middle stages, the change in potential became much slower. The difference in the change tendency was attributed to a variation of the surface area of the working electrode. At first, the electrode surface was the as-deposited Ni-P coating. As the chemical reactions proceeded, there were some corrosion pits and trace amounts of corrosion products on the surface of the samples. This changed the effective surface area of the samples. The potential change corresponded to the chemical reactions in solutions. The potential change for samples B, C and D was much quicker than that of sample A in the middle stage. This indicates that the corrosion products that formed on the surface of sample A provided less protection. The potentials reached a relatively constant value in the final stage. Besides, samples B, C, and D presented nobler OCPs than A, which indicates that the Ni-P coatings immersed in solutions B, C, and D exhibited better protectiveness for the 3003 aluminum alloy.

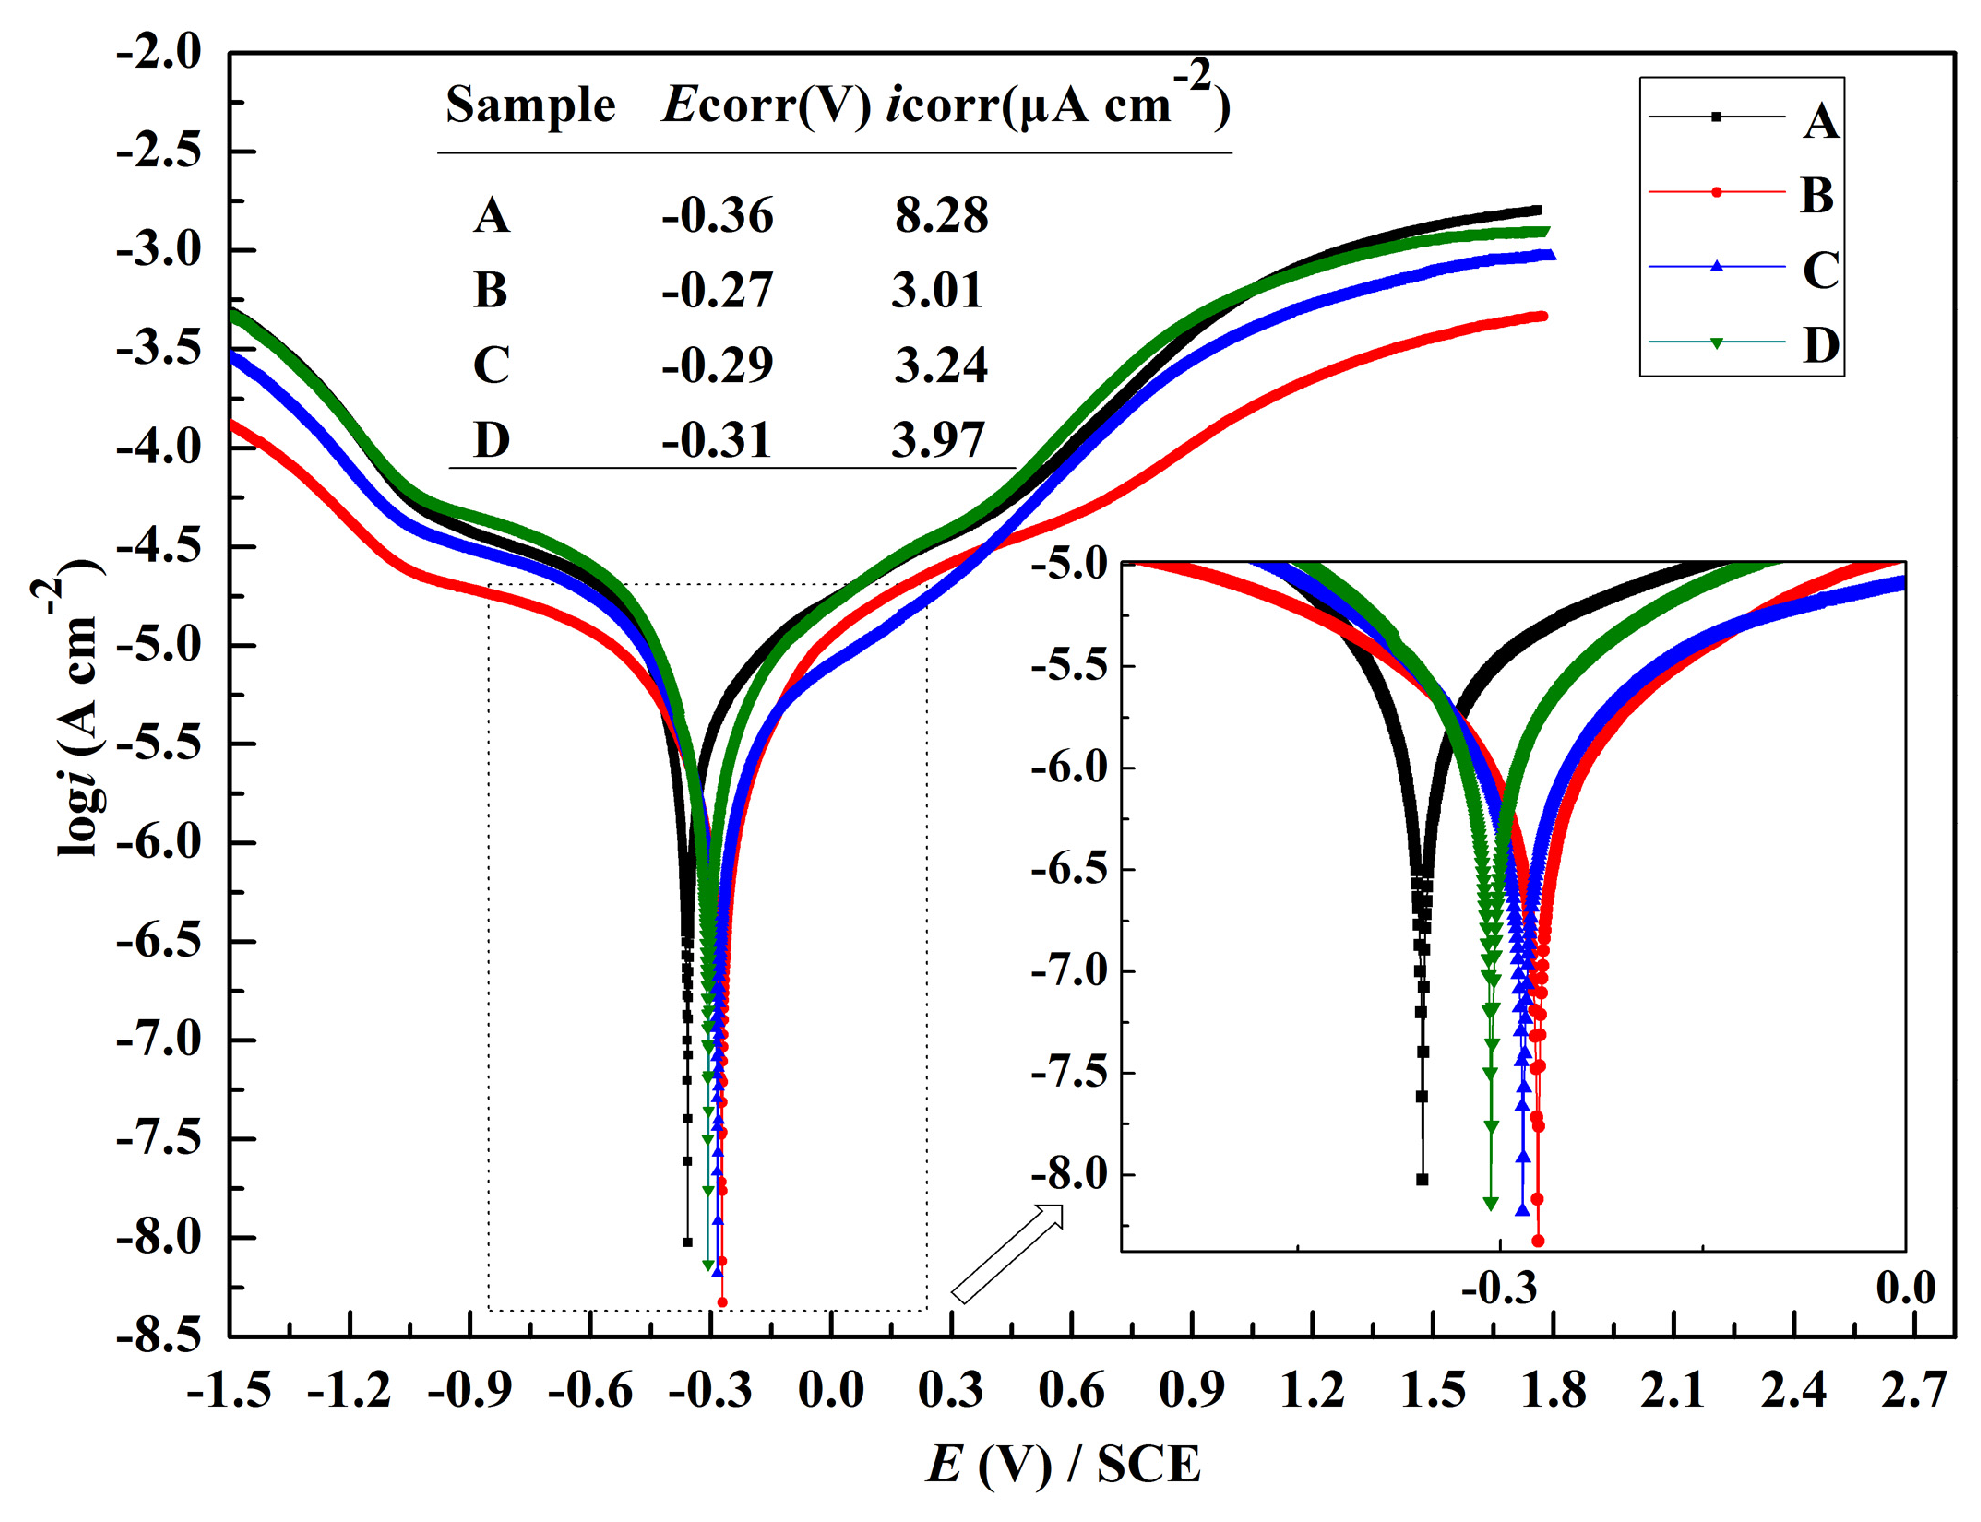
3.3. Potentiodynamic Polarization

Figure 7 shows the potentiodynamic polarization curves for the Ni-P coatings immersed in the four solutions. The relevant parameters were calculated and are listed as the inset in Figure 7. The corrosion current densities of the samples in solutions B, C and D were 3.01 μA·cm−2, 3.24 μA·cm−2 and 3.97 μA·cm−2, respectively. In addition, the corrosion current density of the sample in solution A was 8.28 μA·cm−2, which is nearly three times higher than that of the samples in solutions B, C and D. Besides, the samples displayed corrosion potentials of around −0.3 V. The results derived from the potentiodynamic polarization curves indicated the higher corrosion resistance of Ni-P coatings immersed in solutions B, C and D.

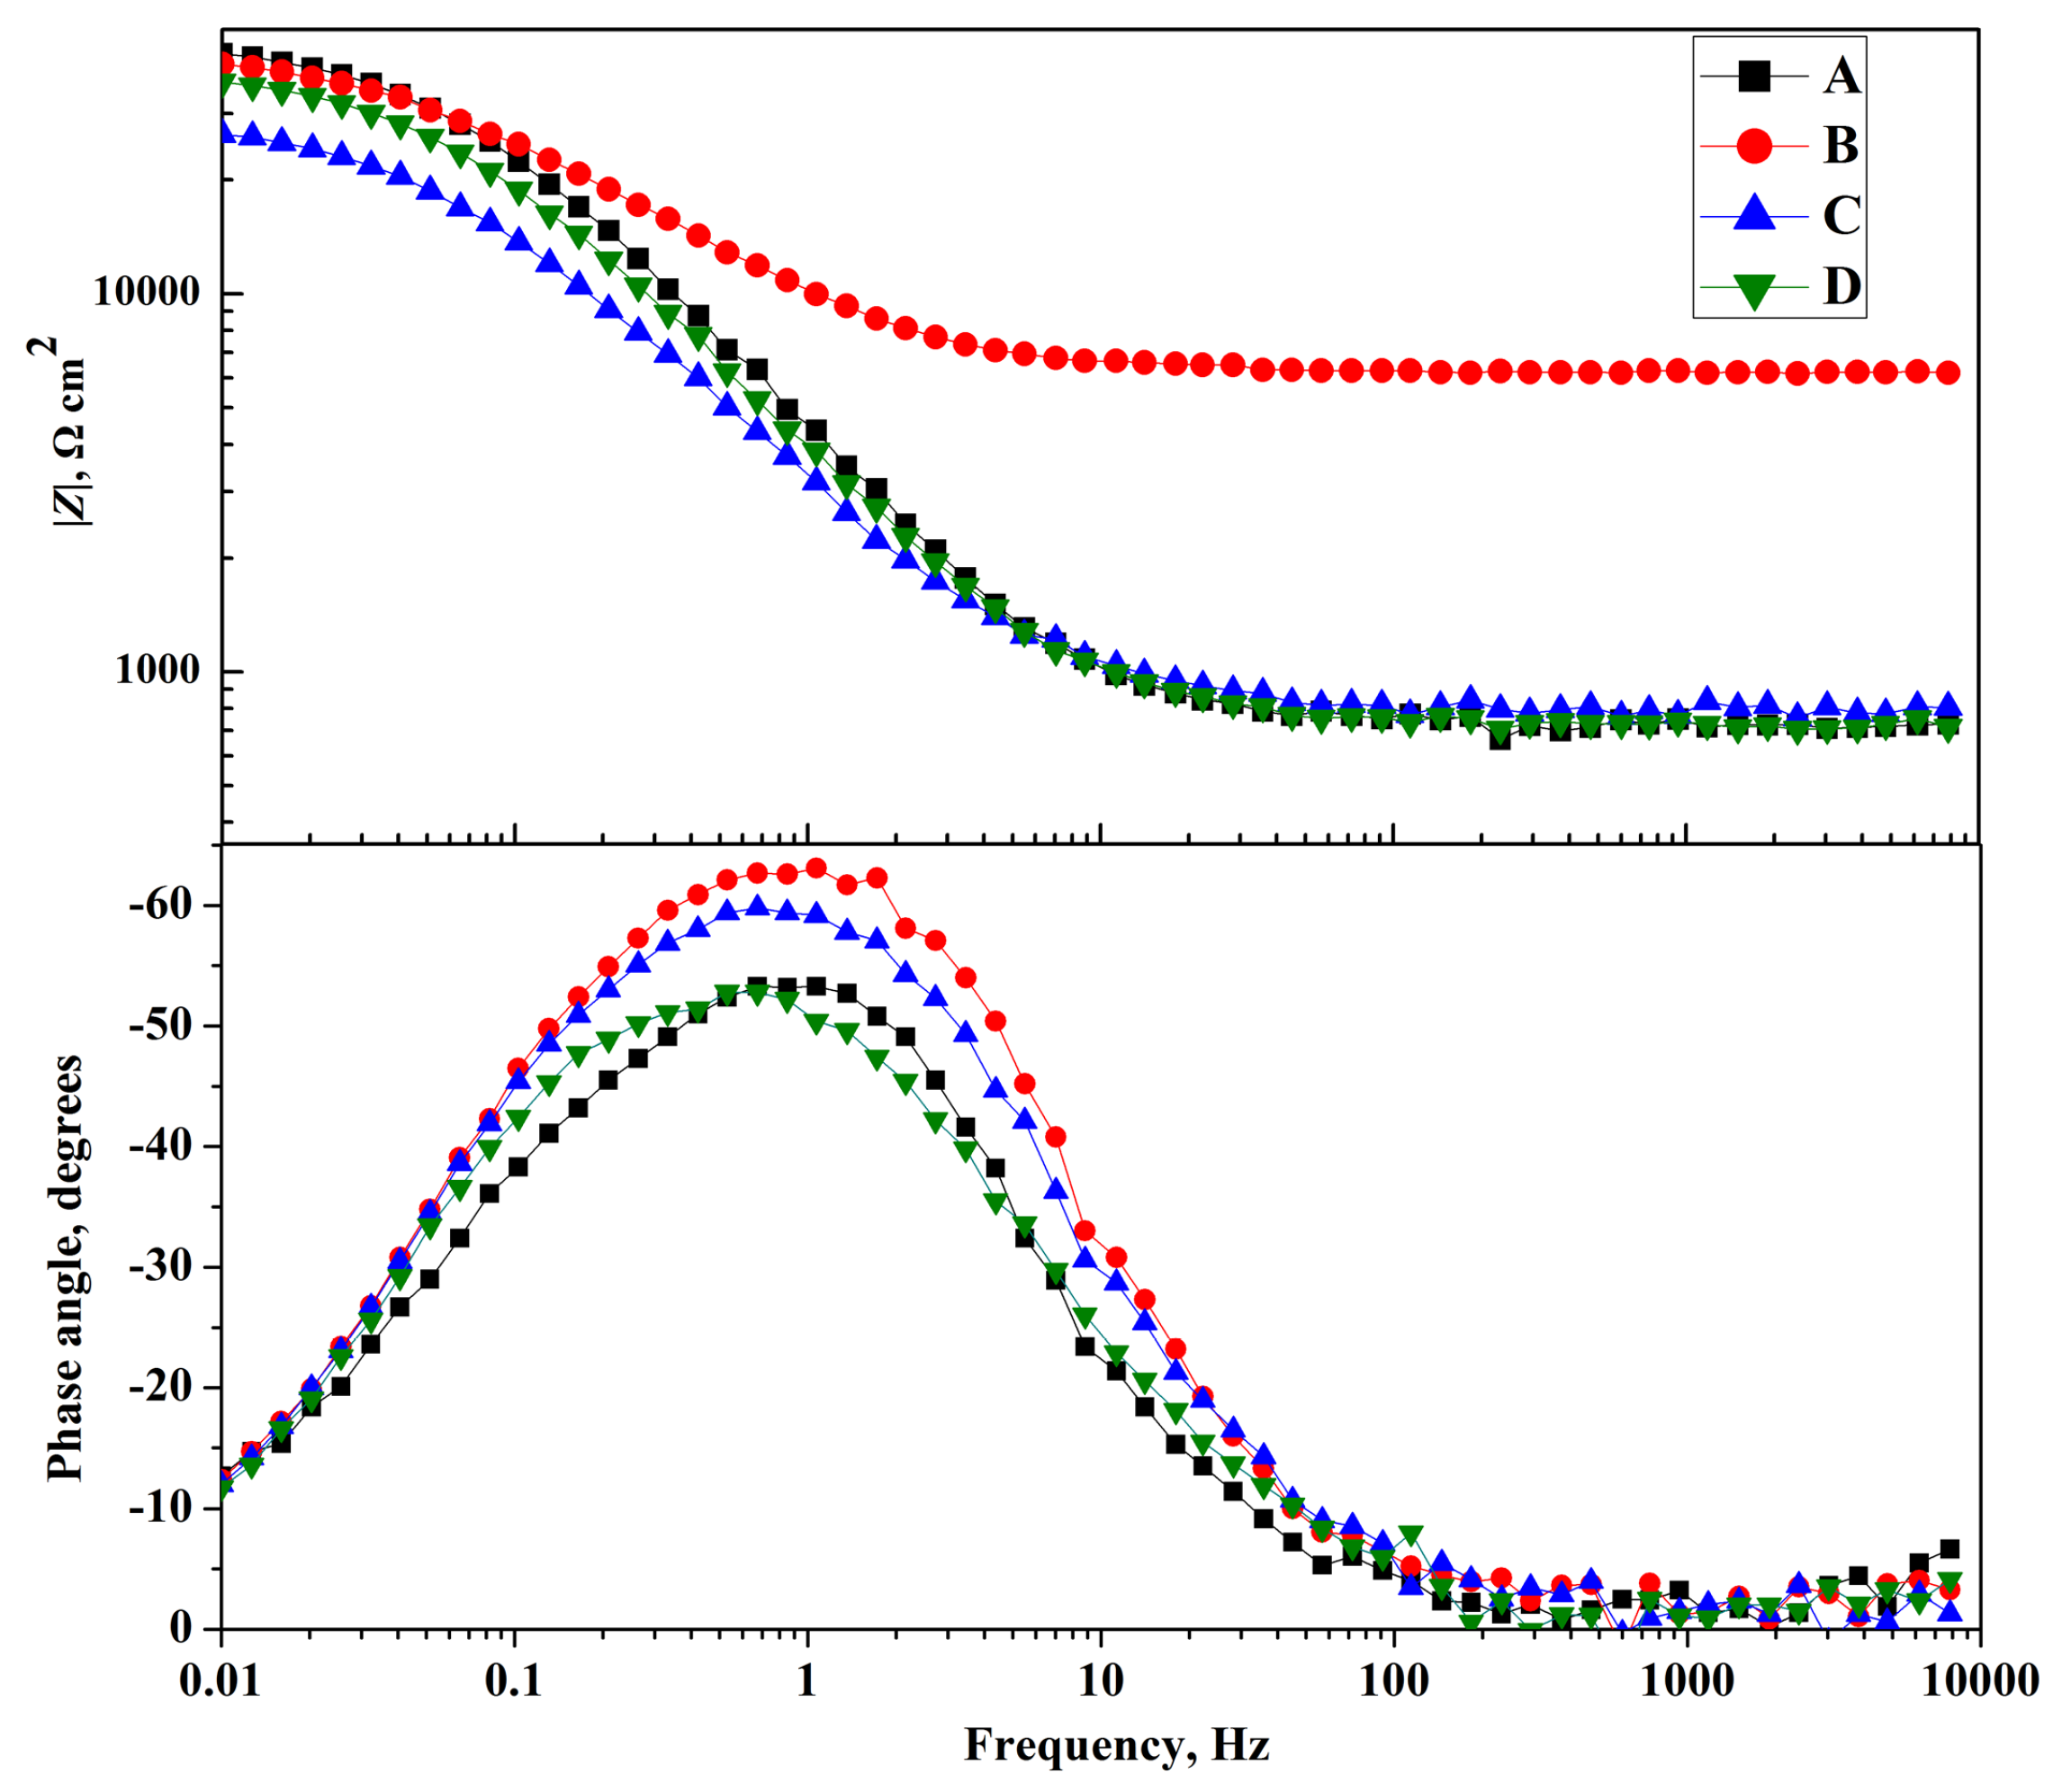
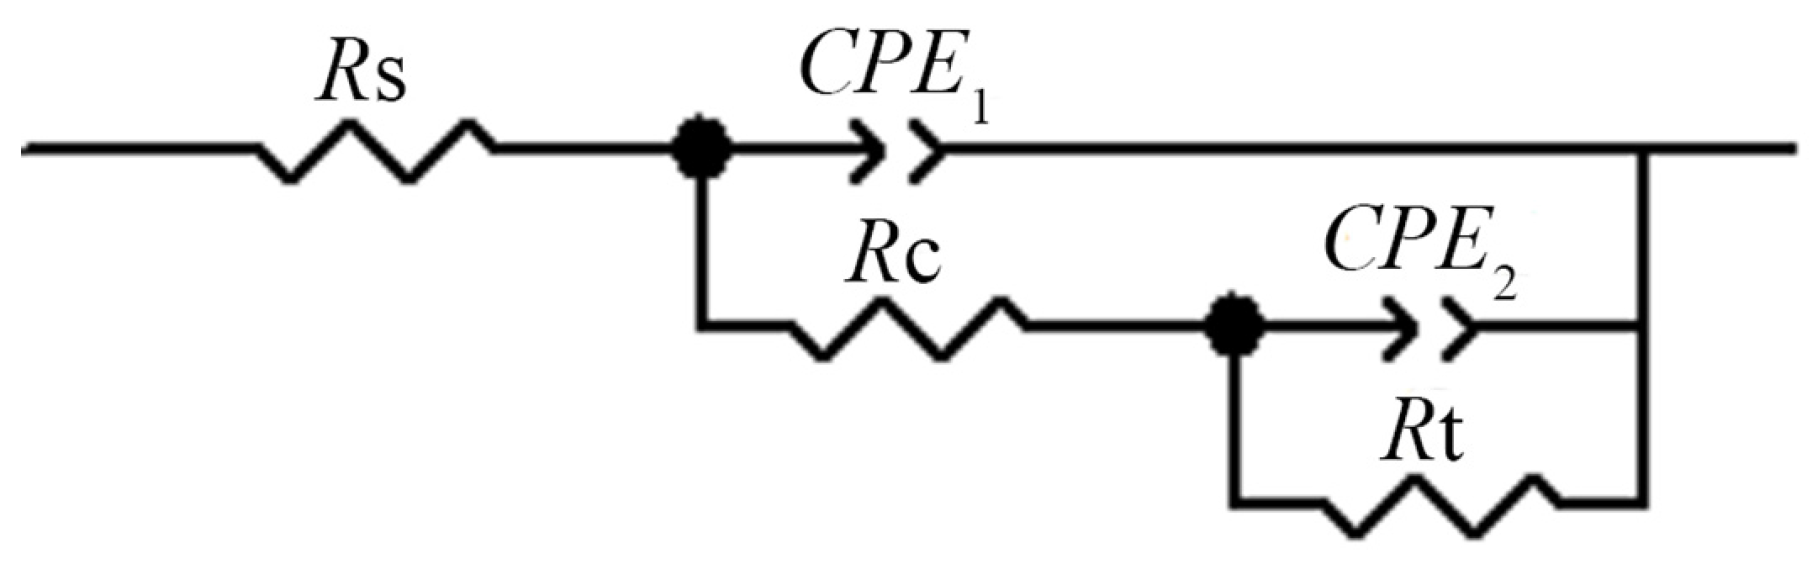
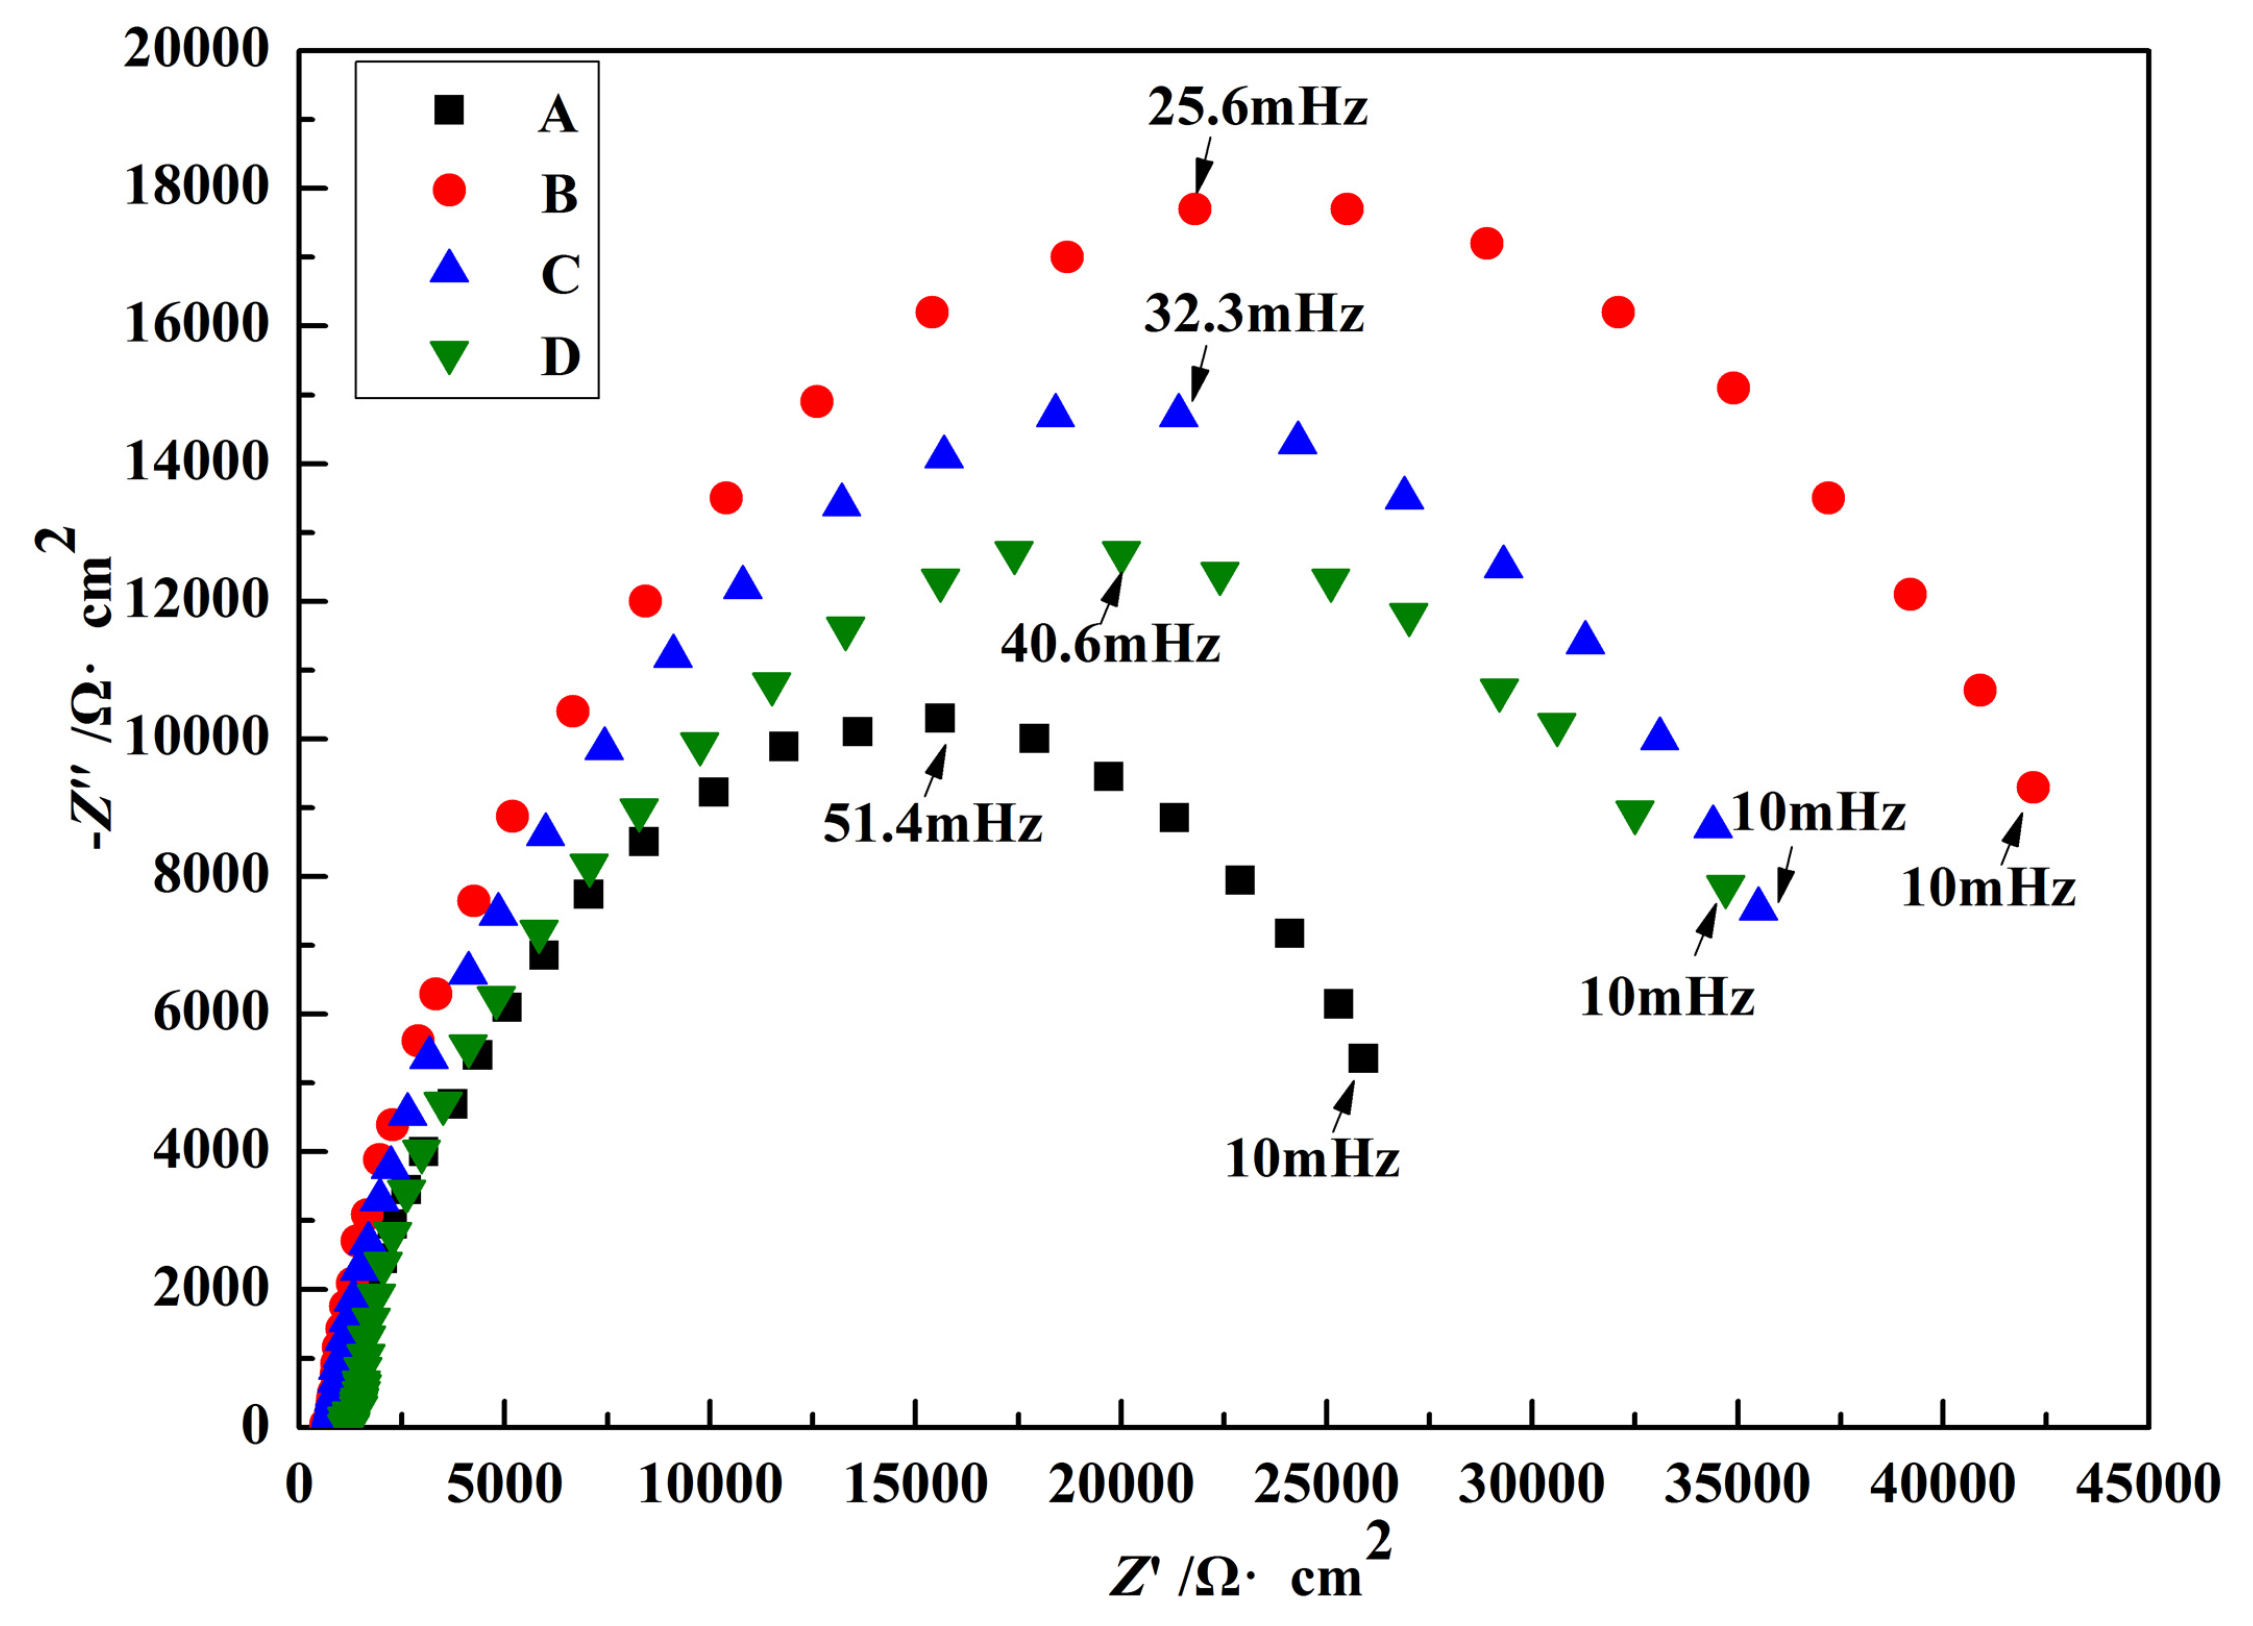
3.4. Electrochemical Impedance

Figure 8 shows typical Bode plots for the samples immersed in the four solutions. The curves for the four samples exhibit a single inflection point, but the curve for sample B is above that of A, C and D (the upper section of Figure 8), which indicates that sample B possessed an obviously higher |Z| compared with the other samples. This means that the sample immersed in solution B presented a better corrosion resistance. Additionally, the diagrams show resistive regions at high frequencies and capacitive properties at intermediate frequencies. In the curves describing the relationship between the phase angle and log f (the lower section of Figure 8), the four samples show a single-phase angle maximum and the phase angle maximum (θmax) does not appear to be much different between them [22]. However, the phase diagram is much broader for sample B. It means that sample B showed better corrosion resistance, higher passivity and a lower corrosion rate than the other samples due to the absence of SO 4 2 in the corrosive medium. Therefore, SO 4 2 in the acidic solution can be identified as a strong corrosive anion for Ni-P coatings. Similarly, we can also deduce that (1) N O 2 acts as an inhibitor; (2) N O 3 and Cl accelerate the corrosion process; (3) and N O 2 and N O 3 together promote the corrosion of samples for the stronger acceleration of N O 3 .
The Nyquist plots for the samples immersed in the four solutions are displayed in Figure 9. The impedance data were simulated to an appropriate equivalent circuit (Figure 10) for two time constants involved in the Bode plots. Rs represents the resistance of the corrosive solution. A first constant phase element (CPE1) in parallel with a surface coating resistance (Rc) represents the properties of the Ni-P coating. The double-layer capacitance (CPE2) and the charge transfer resistance (Rt) are related to the corrosion behavior of the samples. Fitting results of Nyquist plots are shown in Table 3. The diameter of the capacitive loop is in direct proportion to Rc and Rt. The total of Rc and Rt is defined as the polarization resistance (Rp). The Rc and Rt values of the samples arranged in descending order are B, C, D, and A. This shows that the rates of electrochemical degradation of the samples in descending order were A, D, C, and B. These results are consistent with the above corrosion current data.
To analyze the results described above, the corrosion inhibition and promotion efficiency (η(%)) of various ions were calculated as follows [23]:
η = i corr 0 i corr i corr 0 × 100 %
η = R c t R c t 0 R c t × 100 %
where i corr 0 and i corr are the corrosion current densities without and with the inhibitor, respectively. R c t 0 and R c t are the charge transfer resistances without and with the inhibitor, respectively. The results are listed in Table 4. Further, η1 and η2 are the corrosion efficiencies that were calculated via the current densities and charge transfer resistances, respectively. The negative value of η indicates promotion efficiency and the positive one indicates inhibition efficiency.
As is shown in Table 4, the values of η1 and η2 are close to each other. It can be concluded that S O 4 2 is the main aggressive ion, the promotion efficiency of which is as high as 67.5%. The samples immersed in the solutions containing S O 4 2 such as A, C, and D suffered from serious corrosion. Besides, the promotion efficiency of N O 3 is around 61%, which is lower than that of S O 4 2 . The inhibition efficiency of N O 2 is 18.8%. Although the combination of N O 2 and N O 3 accelerated the corrosion process (the corrosion resistance of sample D was higher than that of sample A), the acceleration effect was limited. Hence, sample B suffered the slightest corrosion attack. The corrosion of sample A was the most serious one under the strong acceleration effect of S O 4 2 and the weak acceleration effect of the combination of N O 2 and N O 3 . Considering the inhibiting effect of N O 2 , the corrosion of sample C was slighter than that of sample D. In conclusion, the corrosion rate of the samples in increasing order was sample B, C, D and A.
In this study, the influence of the main anions in the flue gas condensate on the corrosion behavior of the Ni-P coating deposited on 3003 aluminum alloy was studied. Sample A presented the highest corrosion current density and the lowest impedance value. This shows that S O 4 2 attacks the Ni-P coating except chloride, which can be attributed to accelerating the corrosion of the sample in the initial immersion period. Sample C presented a better corrosion resistance than sample A, showing that N O 3 at this concentration promotes the corrosion of the Ni-P coating. Comparing sample C with D, we can deduce that N O 2 acts as an inhibitor. Sample D presented a slighter corrosion than sample A, indicating that N O 3 in company with N O 2 accelerates the corrosion process of the sample. The electrochemical mechanism of the samples in aqueous solution includes the following chemical reactions.
N i N i 2 + + 2 e -  (anodic reaction)
2 H + + 2 e - H 2  (cathodic reaction)
In the first reaction, the anodic dissolution of Ni occurs because of its instability at the pH value of 3.12, and this is accompanied by hydrogen evolution. Indeed, hydrogen bubbles were observed during electrochemical tests. Cl, a strong adsorption active cathodic ion, can easily replace oxygen, water molecules and other ions to preferentially adsorb at the special sites of the surface of Ni-P coatings [24]. Then the corrosion nucleus was formed. If the corrosion nucleus grew continuously, macroscopical corrosion pits could be observed on the coatings’ surface. Therefore, Cl is a major cause of pitting formation in Ni-P coatings. The promotion efficiency of S O 4 2 is so high that it can be regarded as the main aggressive ion. Cl and N O 3 are chaotropes [25] and these anions exhibit a much weaker resistance to dehydration. It is favorable for them to initiate pitting on the surface of Ni-P coatings. N O 2 can absorb on the surface of samples and inhibit the aggressive anions from corroding the samples.

4. Conclusions

Effects of chloride, sulfate, nitrate, and nitrite on the corrosion behavior of the Ni-P coatings were investigated in our study.
  • The corrosion resistance of the Ni-P coating is related to the porosity of the coating and the components of the aggressive ions. Reducing the porosity of the Ni-P coating, alleviating the corrosive ions, and developing corrosion inhibitors can decrease the corrosion process.
  • Cl and N O 3 are favorable for the formation of corrosion pits due to their chaotropic nature and the smaller ionic radius of Cl.
  • S O 4 2 accelerates the corrosion process by invading the bottom of the pits in the Ni-P coating and destroying the corrosion product layer.
  • N O 2 acts as an inhibitor by absorbing on the surface of the samples.

Acknowledgments

This work was supported by the National Natural Science Foundation of China (No. 51272207) and the Science and Technology Project of Guangdong Province in China (No. 2015B010122003, No. 2015B090926009).

Author Contributions

Hejie Yang and Yimin Gao conceived and designed the experiments; Hejie Yang and Weichao Qin performed the experiments; Hejie Yang and Yimin Gao analyzed the data; Hejie Yang and Weichao Qin wrote the paper.

Conflicts of Interest

The authors declare no conflict of interest.

References

  1. Finšgar, M.; Jackson, J. Application of corrosion inhibitors for steels in acidic media for the oil and gas industry: A review. Corros. Sci. 2014, 86, 17–41. [Google Scholar] [CrossRef]
  2. Zheng, Y.G.; Liu, G.Q.; Zhang, Y.M.; Hu, H.X.; Song, Q.N. Corrosion failure analysis of a condenser on the top of benzene tower in styrene unit. J. Fail. Anal. Prev. 2014, 14, 286–295. [Google Scholar] [CrossRef]
  3. Zeinalov, E.B.; Abbasov, V.M.; Alieva, L.I. Petroleum acids and corrosion. Petrol. Chem. 2009, 49, 185–192. [Google Scholar] [CrossRef]
  4. Miller, W.S.; Zhuang, L.; Bottema, J.; Wittebrood, A.J.; de Smet, P.; Haszler, A.; Vieregge, A. Recent development in aluminum alloys for the automotive industry. Mater. Sci. Eng. A 2000, 280, 37–49. [Google Scholar] [CrossRef]
  5. Ahmad, Z. A review of corrosion and pitting resistance of Al 6061 and 6013 silicon carbide composites in neutral salt solution and seawater. Corros. Rev. 2001, 19, 119–156. [Google Scholar] [CrossRef]
  6. Jafarzadeh, K.; Shahrabi, T.; Oskouei, A. A Novel approach using EIS to study flow accelerated pitting corrosion of AA5083-H321 aluminum-magnesium alloy in NaCl solution. J. Appl. Electrochem. 2009, 39, 1725–1731. [Google Scholar] [CrossRef]
  7. Sakairi, M.; Sasaki, R.; Kaneko, A.; Seki, Y.; Nagasawa, D. Evaluation of metal cation effects on galvanic corrosion behavior of the A5052 aluminum alloy in low chloride ion containing solutions by electrochemical noise impedance. Electrochim. Acta 2014, 131, 123–129. [Google Scholar] [CrossRef]
  8. Shahidi, M.; Gholamhosseinzadeh, M.R. Electrochemical evaluation of AA6061 aluminum alloy corrosion in citric acid solution without and with chloride ions. J. Electroanal. Chem. 2015, 757, 8–17. [Google Scholar] [CrossRef]
  9. Wang, C.Y.; Wen, G.W.; Wu, G.H. Improving corrosion resistance of aluminum metal matrix composites using cerium sealed electroless Ni-P coatings. Corros. Eng. Sci. Technol. 2011, 46, 471–476. [Google Scholar] [CrossRef]
  10. Sadreddini, S.; Afshar, A. Corrosion resistance enhancement of Ni-P-nano SiO2 composite coatings on aluminum. Appl. Surf. Sci. 2014, 303, 125–130. [Google Scholar] [CrossRef]
  11. Qin, W. Microstructure and corrosion behavior of electroless Ni-P coatings on 6061 aluminum alloys. J. Coat. Technol. Res. 2011, 8, 135–139. [Google Scholar] [CrossRef]
  12. Sridhar, N.; Udaya Bhat, K. Effect of deposition time on the morphological features and corrosion resistance of electroless Ni-high P coatings on aluminum. J. Mater. 2013, 2013, 1–7. [Google Scholar] [CrossRef]
  13. Fetohi, A.E.; Hameed, R.M.A.; El-Khatib, K.M. Development of electroless Ni-P modified aluminum substrates in a simulated fuel cell environment. J. Ind. Eng. Chem. 2015, 30, 239–248. [Google Scholar] [CrossRef]
  14. Yang, H.; Gao, Y.; Qin, W.; Li, Y. Microstructure and corrosion behavior of electroless Ni-P on sprayed Al-Ce coating of 3003 aluminum alloy. Surf. Coat. Technol. 2015, 281, 176–183. [Google Scholar] [CrossRef]
  15. Elsener, B.; Crobu, M.; Scorciapino, M.A.; Rossi, A. Electroless deposited Ni-P alloys: Corrosion resistance mechanism. J. Appl. Electrochem. 2008, 38, 1053–1060. [Google Scholar] [CrossRef]
  16. Li, X.W.; Chen, Z.L.; Hou, H.B.; Hao, L. Corrosion behaviour of electroless Ni-P coatings in simulated acid rain. Corros. Eng. Sci. Technol. 2010, 45, 277–281. [Google Scholar] [CrossRef]
  17. Liu, G.; Yang, L.; Wang, L.; Wang, S.; Chongyang, L.; Wang, J. Corrosion behavior of electroless deposited Ni-Cu-P coating in flue gas condensate. Surf. Coat. Technol. 2010, 204, 3382–3386. [Google Scholar] [CrossRef]
  18. Yang, H.J.; Gao, Y.M.; Qin, W.C.; Ma, S.Q.; Wei, Y.K. Investigation of corrosion behavior of 3003 aluminum alloy in flue gas condensate. Mater. Corros. 2016. [Google Scholar] [CrossRef]
  19. Standard Specification for Autocatalytic (Electroless) Nickel-Phosphorus Coatings on Metal; ASTM International: West Conshohocken, PA, USA, 2004.
  20. Flis, J.; Duquette, D.J. Effect of Phosphorus on anodic dissolution and passivation of nickel in near-neutral solutions. Corrosion 1985, 41, 700–706. [Google Scholar] [CrossRef]
  21. Balaraju, J.N.; Selvi, V.E.; Grips, V.K.W.; Rajam, K.S. Electrochemical studies on electroless ternary and quaternary Ni-P based alloys. Electrochim. Acta 2006, 52, 1064–1074. [Google Scholar] [CrossRef]
  22. Abdel Hameed, R.M.; Fekry, A.M. Electrochemical impedance studies of modified Ni-P and Ni-Cu-P deposits in alkaline medium. Electrochim. Acta 2010, 55, 5922–5929. [Google Scholar] [CrossRef]
  23. Mishra, A.K.; Balasubramaniam, R. Corrosion inhibition of aluminium by rare earth chlorides. Mater. Chem. Phys. 2007, 103, 385–393. [Google Scholar] [CrossRef]
  24. Song, Y.W.; Shan, D.Y.; Han, E.H. Corrosion behaviors of electroless plating Ni-P coatings deposited on magnesium alloys in artificial sweat solution. Electrochim. Acta 2007, 53, 2009–2015. [Google Scholar] [CrossRef]
  25. Leontidis, E. Hofmeister anion effects on surfactant self-assembly and the formation of mesoporous solids. Curr. Opin. Colloid 2002, 7, 81–91. [Google Scholar] [CrossRef]
Figure 1. (a) Low-magnification and (b) high-magnification SEM images of as-deposited Ni-P coating.
Coatings 07 00016 g001
Figure 2. (a) Cross-section morphology and (b) its elemental distribution of as-deposited Ni-P coating.
Coatings 07 00016 g002
Figure 3. Surface morphologies of Ni-P coatings after electrochemical tests in the four solutions: (a) solution A; (b) solution B; (c) solution C; and (d) solution D.
Coatings 07 00016 g003
Figure 4. (a) EDS spectrum of as-deposited Ni-P coating; EDS spectra of the Ni-P coatings after electrochemical tests in the four solutions: (b) solution A, (c) solution B, (d) solution C, and (e) solution D.
Coatings 07 00016 g004aCoatings 07 00016 g004b
Figure 5. XRD patterns of the samples after electrochemical tests.
Coatings 07 00016 g005
Figure 6. Open circuit potential evolution of the samples immersed in the four solutions as a function of exposure time.
Coatings 07 00016 g006
Figure 7. The potentiodynamic polarization curves for the samples immersed in the four solutions.
Coatings 07 00016 g007
Figure 8. Bode plots for the samples in contact with the four solutions.
Coatings 07 00016 g008
Figure 9. Nyquist plots of the samples immersed in the four solutions.
Coatings 07 00016 g009
Figure 10. Electrical equivalent circuit diagrams to fit the obtained impedance spectra in Figure 9.
Coatings 07 00016 g010
Table 1. Chemical compositions of 3003 aluminum alloy.
Elementswt %Elementswt %
Mn1.04Cu0.057
Fe0.56Zn0.0094
Si0.042AlBalance
Table 2. Chemical compositions of four solutions (mg/L).
SolutionsCl SO 4 2 NO 3 NO 2 H2OpH
A10204.072.98Balance3.12
B104.072.98Balance3.12
C10202.98Balance3.12
D1020Balance3.12
Table 3. The parameters of the equivalent circuit for Ni-P coatings in different solutions.
SolutionsRs/Ω·cm2CPE1/μF·cm−2Rt/Ω·cm2
A720.057.473248
B601.045.6710,001
C698.146.778414
D710.350.206830
Table 4. The values of corrosion efficiency (η).
Ionsη1/%η2/%
S O 4 2 −63.6−67.5
N O 3 −60.9−61.4
N O 2 18.418.8

