The Effect of Electrolytic Solution Composition on the Structure, Corrosion, and Wear Resistance of PEO Coatings on AZ31 Magnesium Alloy

 ,
,  ,
,
Abstract
:
1. Introduction
2. Materials and Methods
2.1. Preparation of Specimens, Electrolyte Solutions, and Coatings
2.2. Characterization, Electrochemical, and Tribological Evaluations
3. Results and Discussions
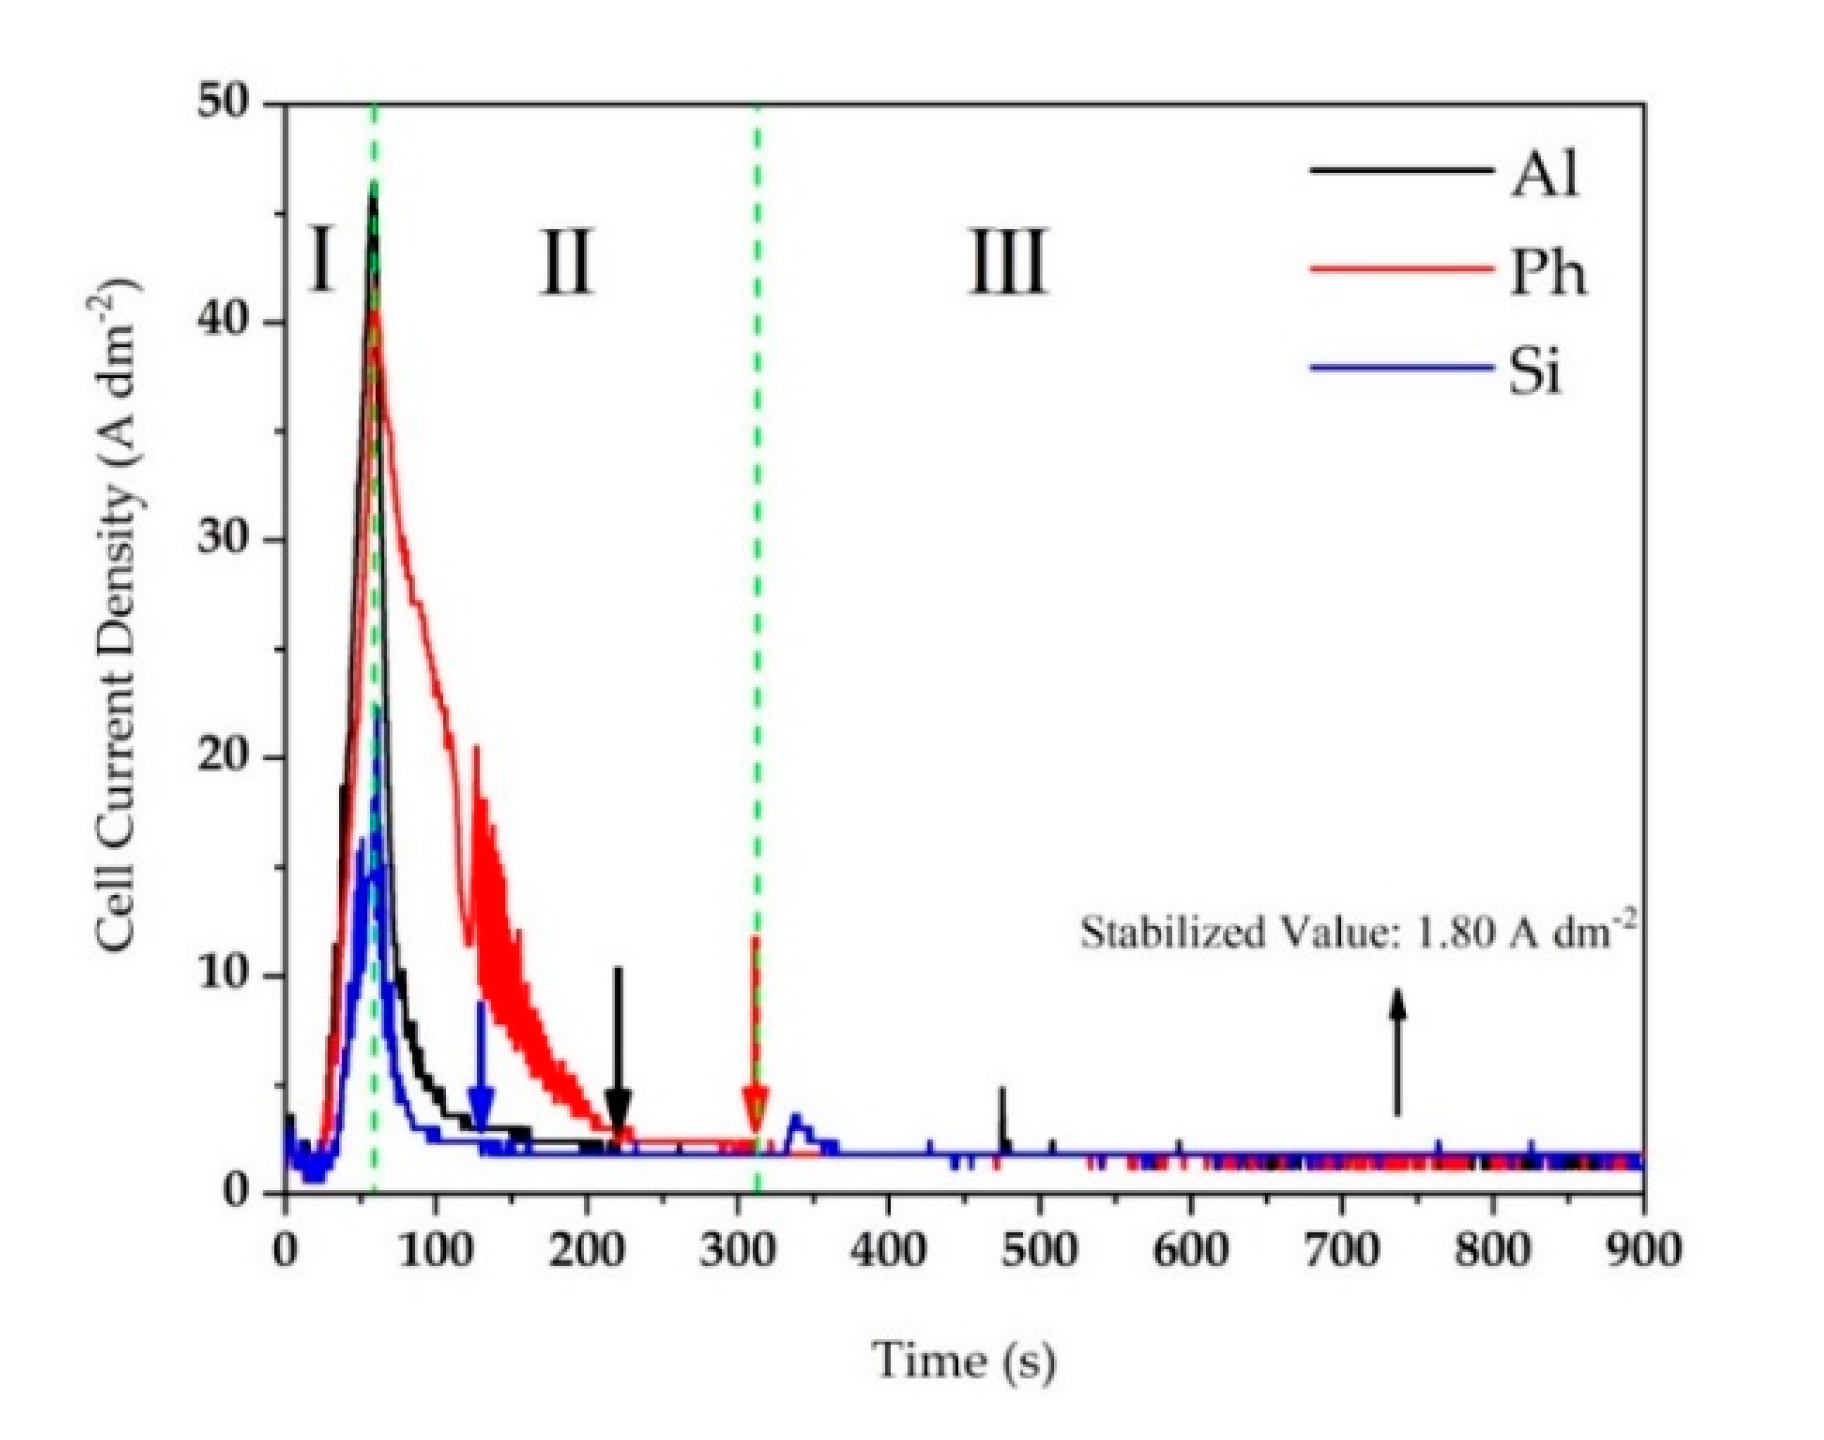
3.1. Cell Current Response Evolution during Peo Treatment
3.2. Structural Features of the Coatings
3.2.1. Surface Morphology and Cross-Sectional Observations
3.2.2. Phase Analysis and Chemical Composition
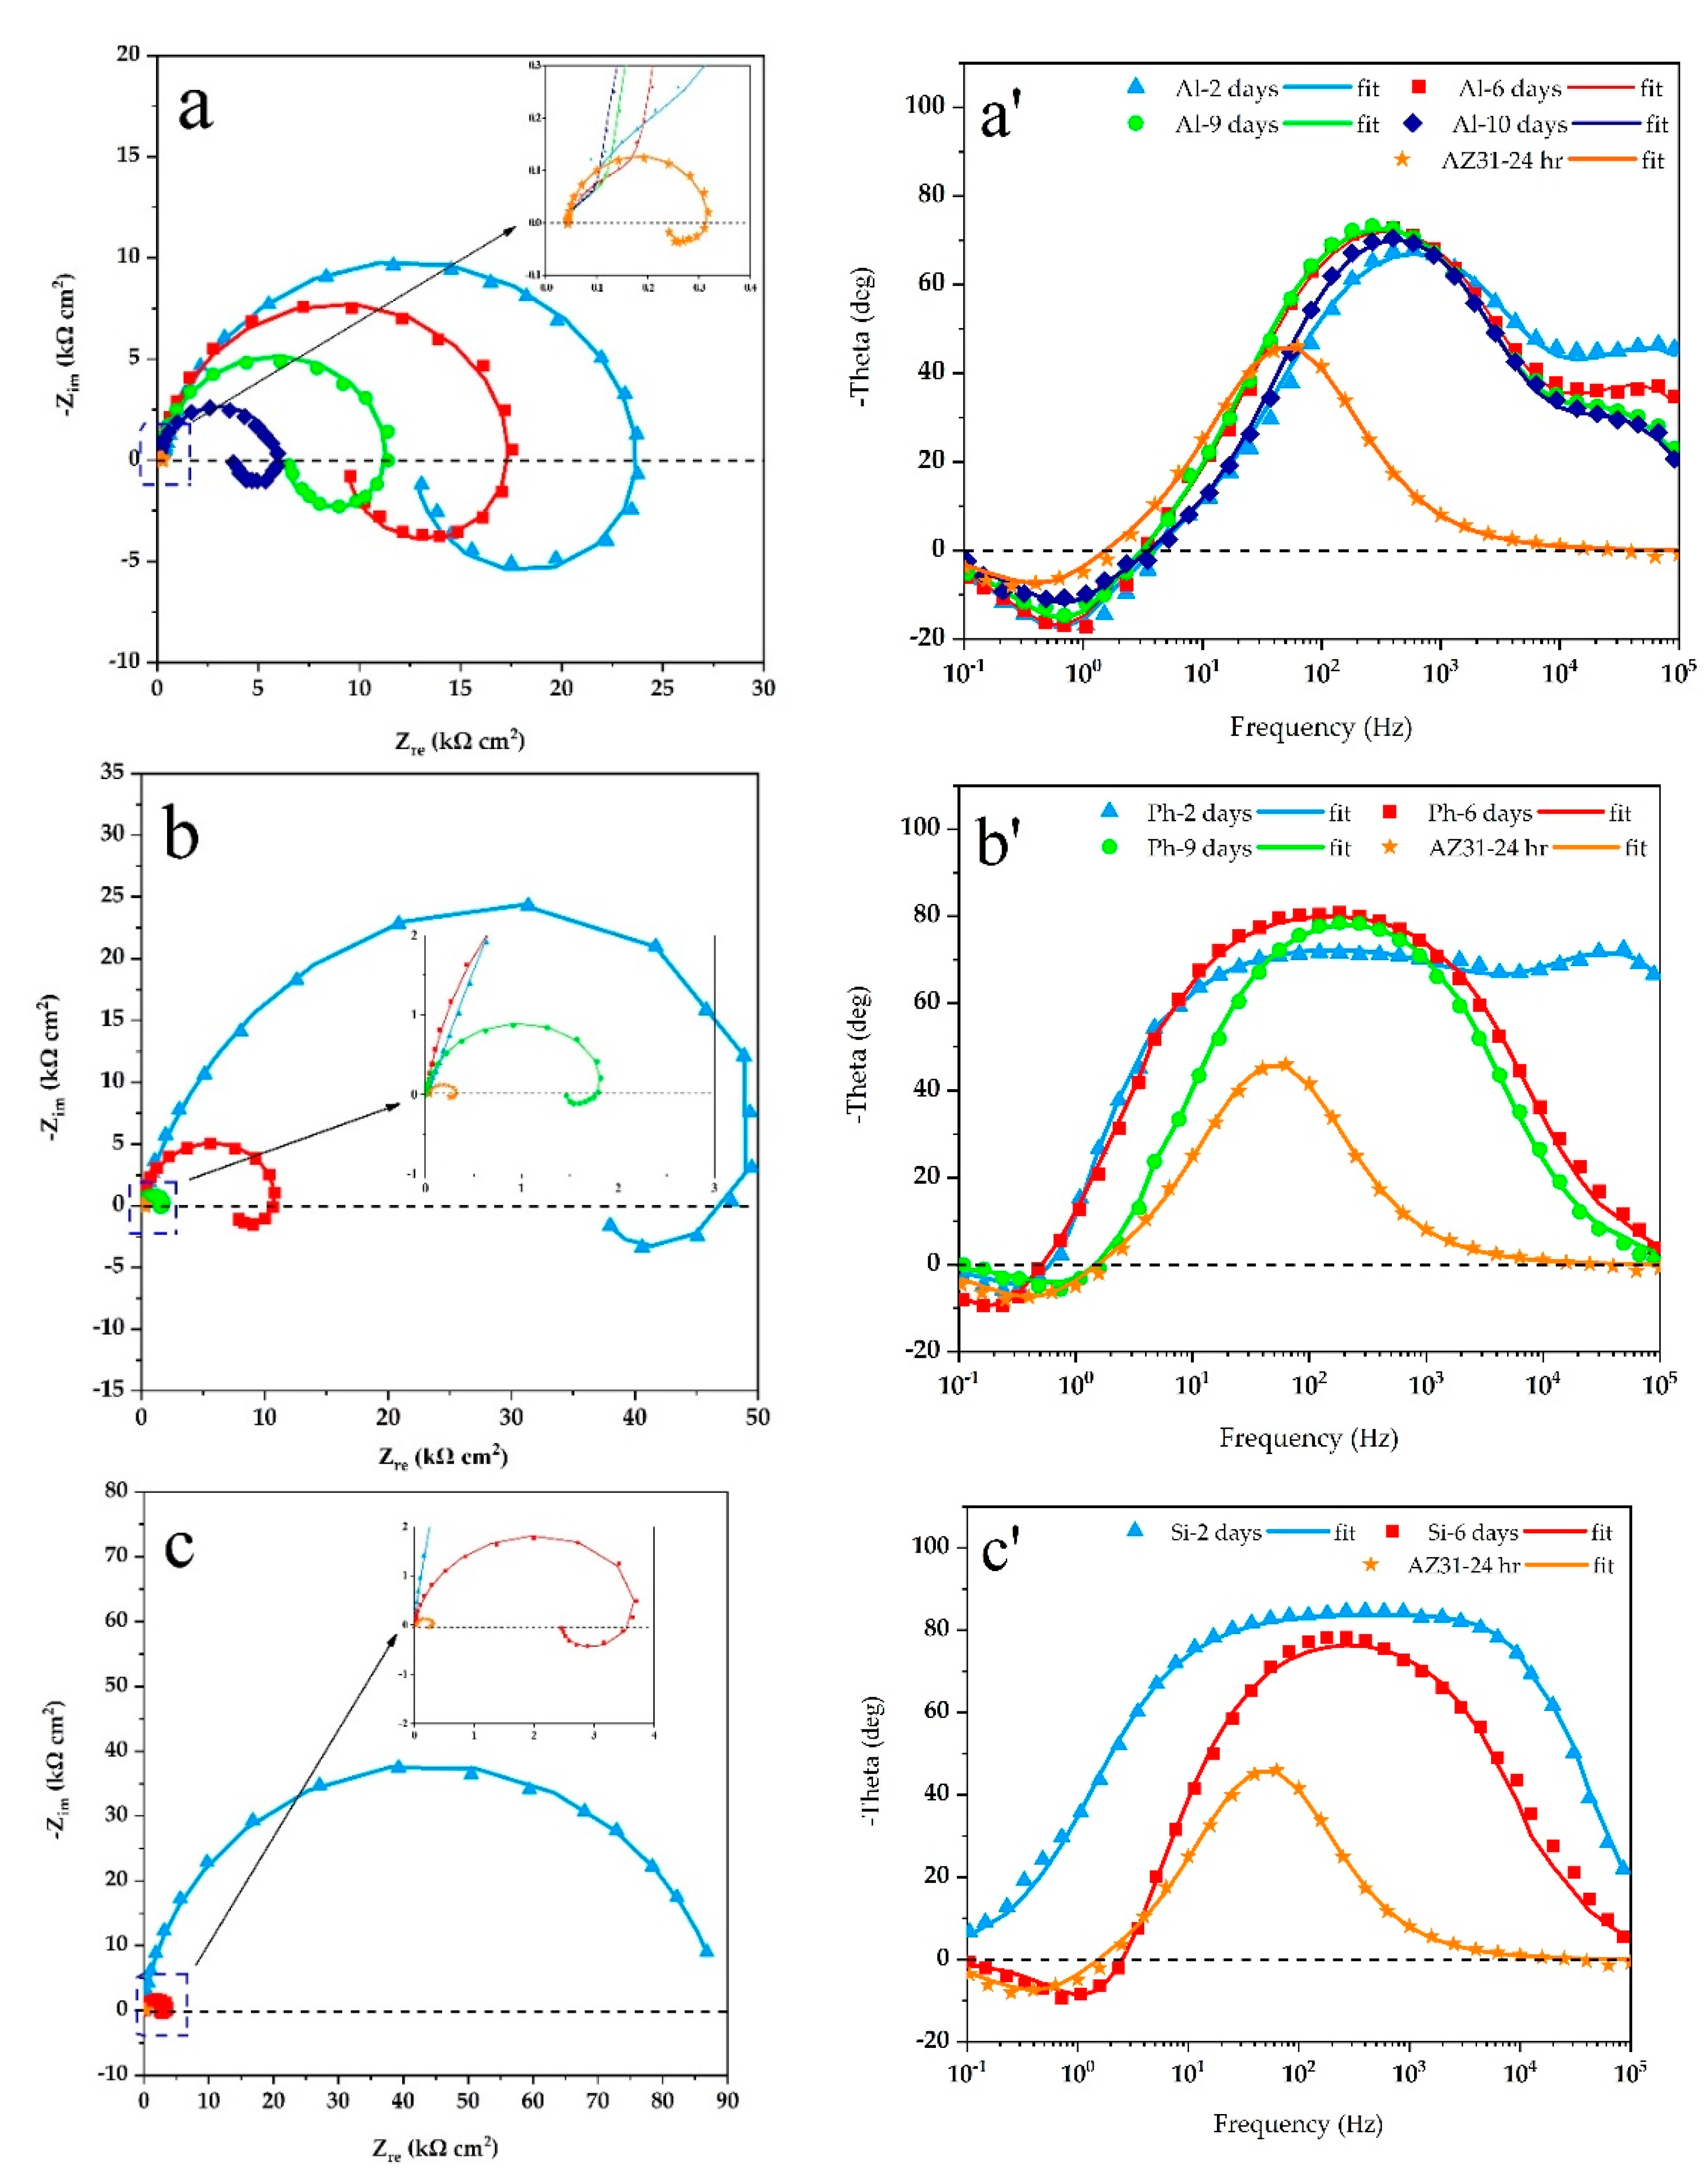
3.3. Corrosion Resistance of the Coatings
3.4. Wear Resistance of the Coatings
4. Conclusions
- (1)
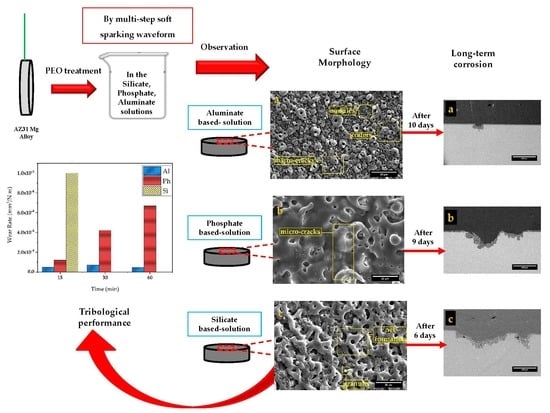
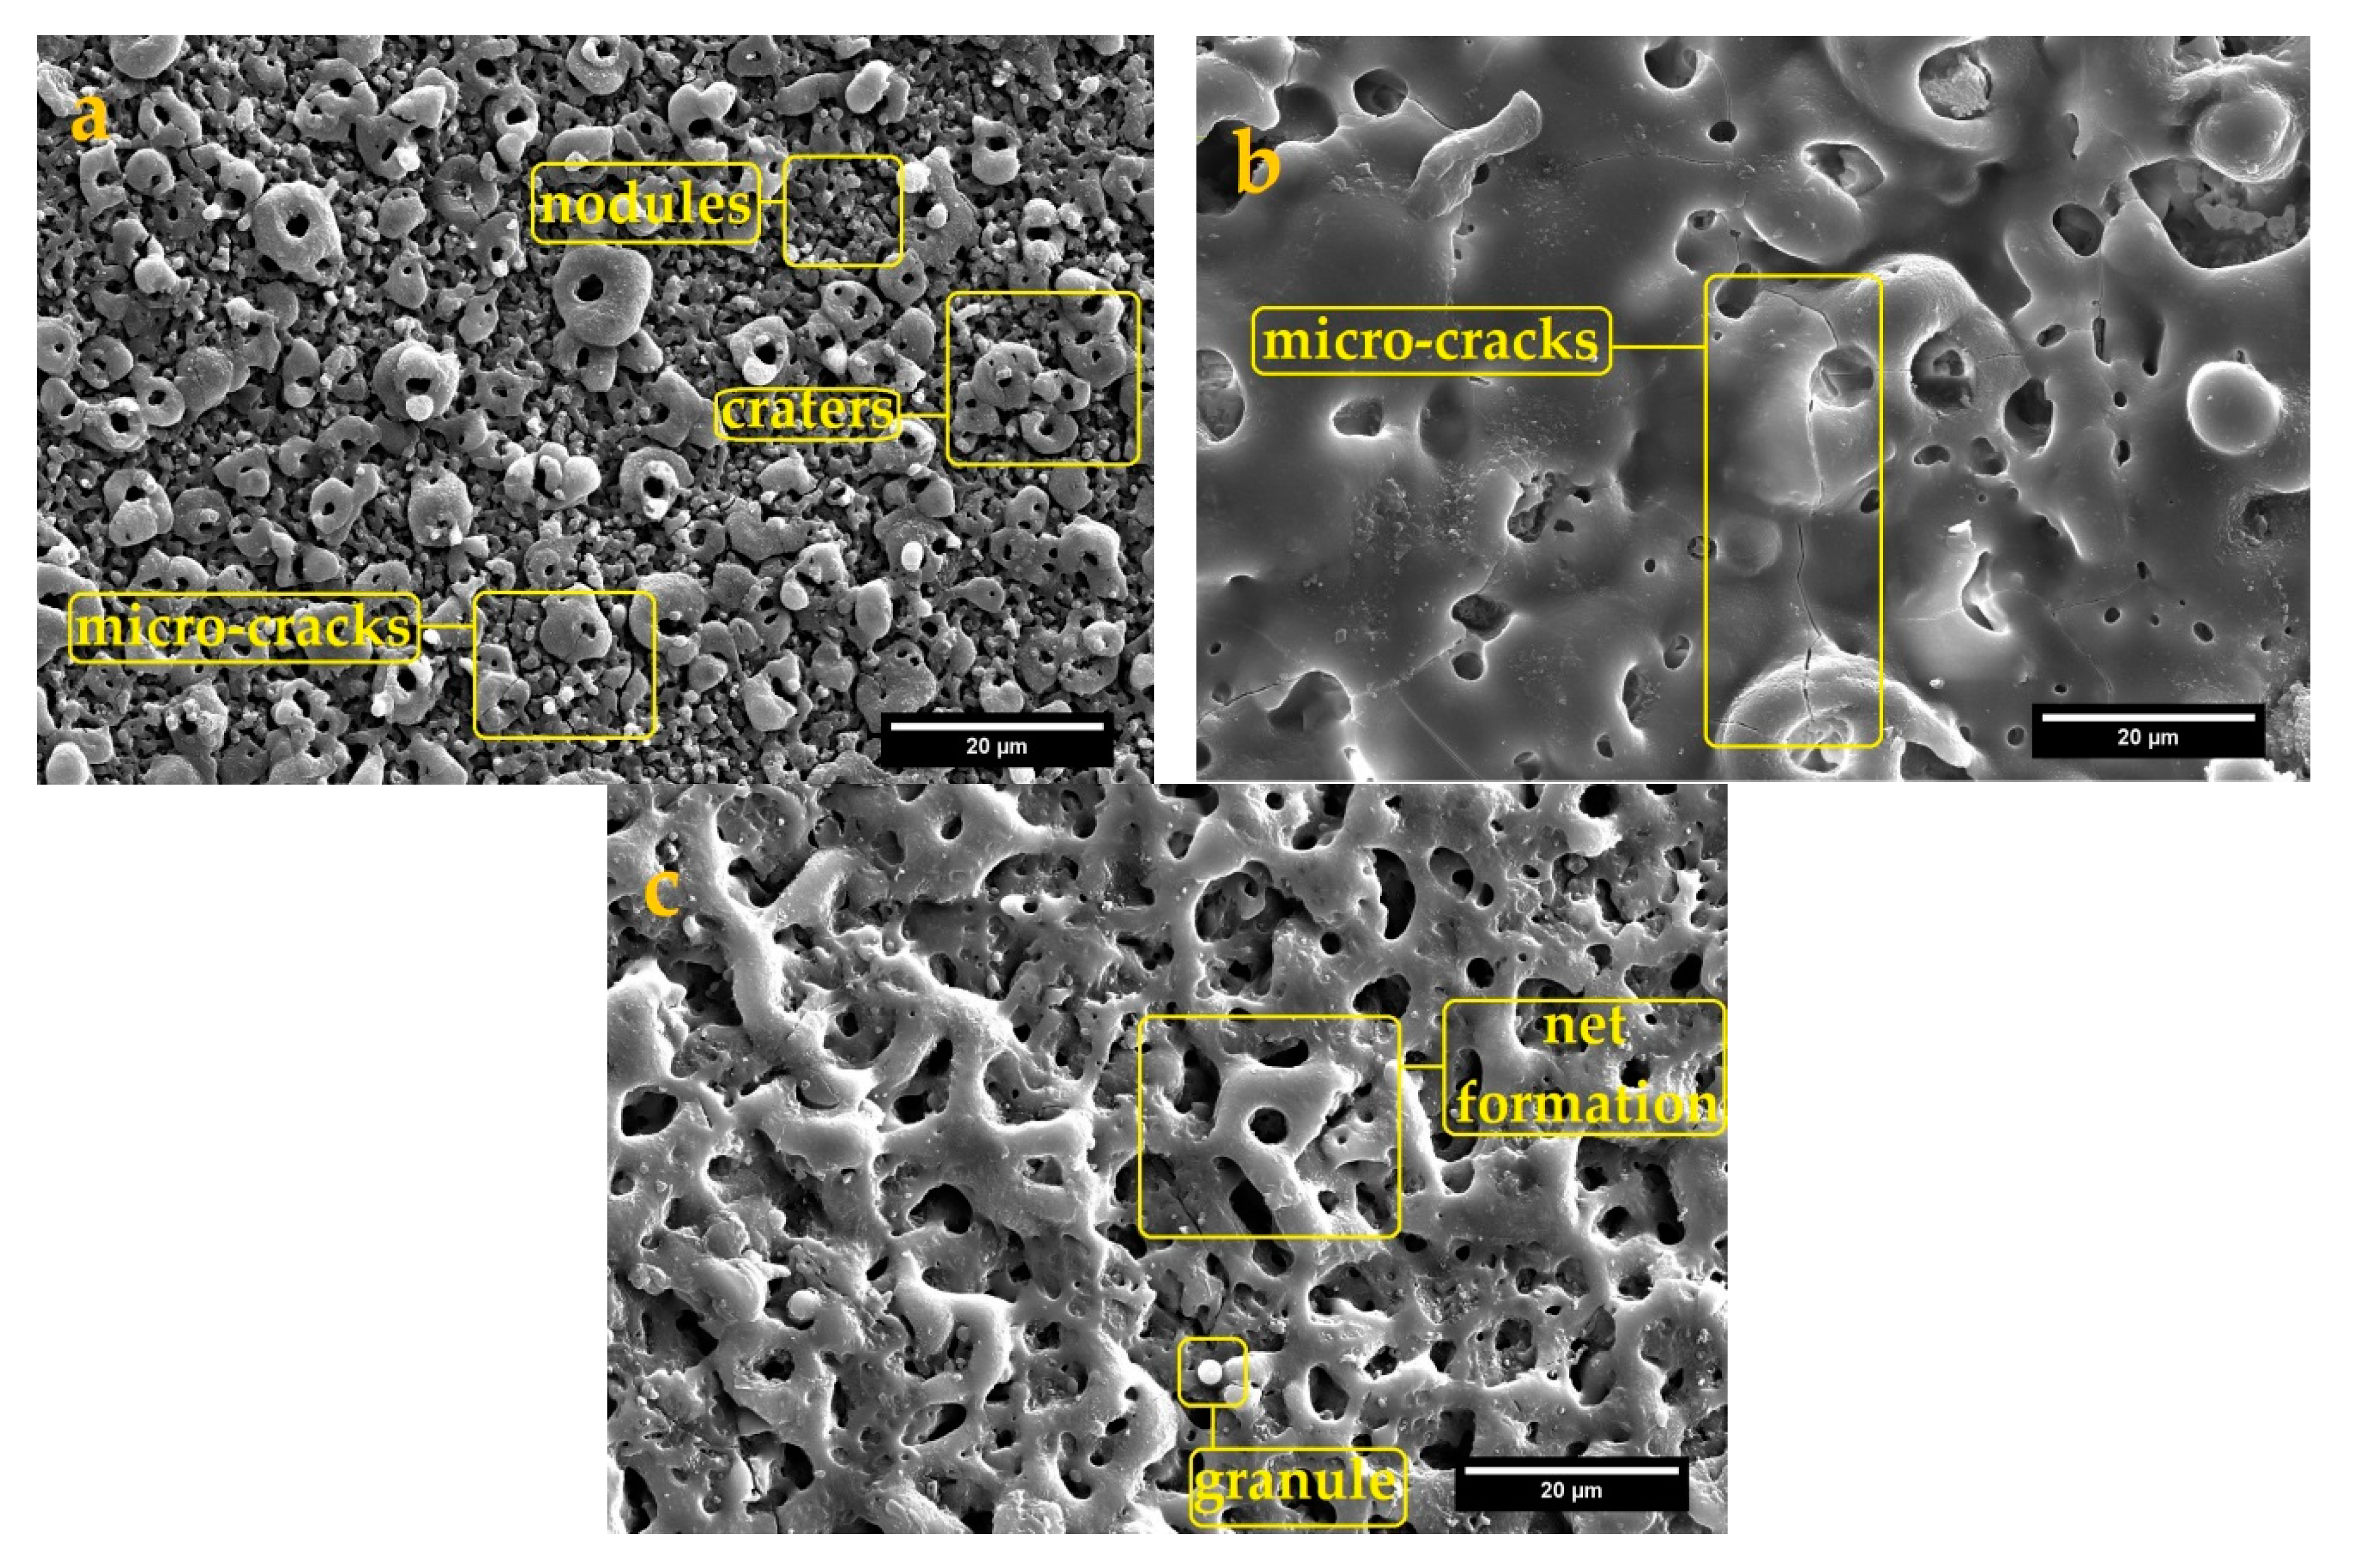
- The surface morphology of obtained coatings is strongly affected by the electrolyte composition. Aluminate containing coating showed a volcano-like morphology with a combination of nodular particles and craters distributed over the surface. Phosphate comprising coating exhibited a sintering-crater structure, with non-uniform distribution of micro-pores and micro-cracks connected and to porosities. Silicate containing coating illustrated a highly porous scaffold surface formed by a network of micro-pores and oxide granules.
- (2)
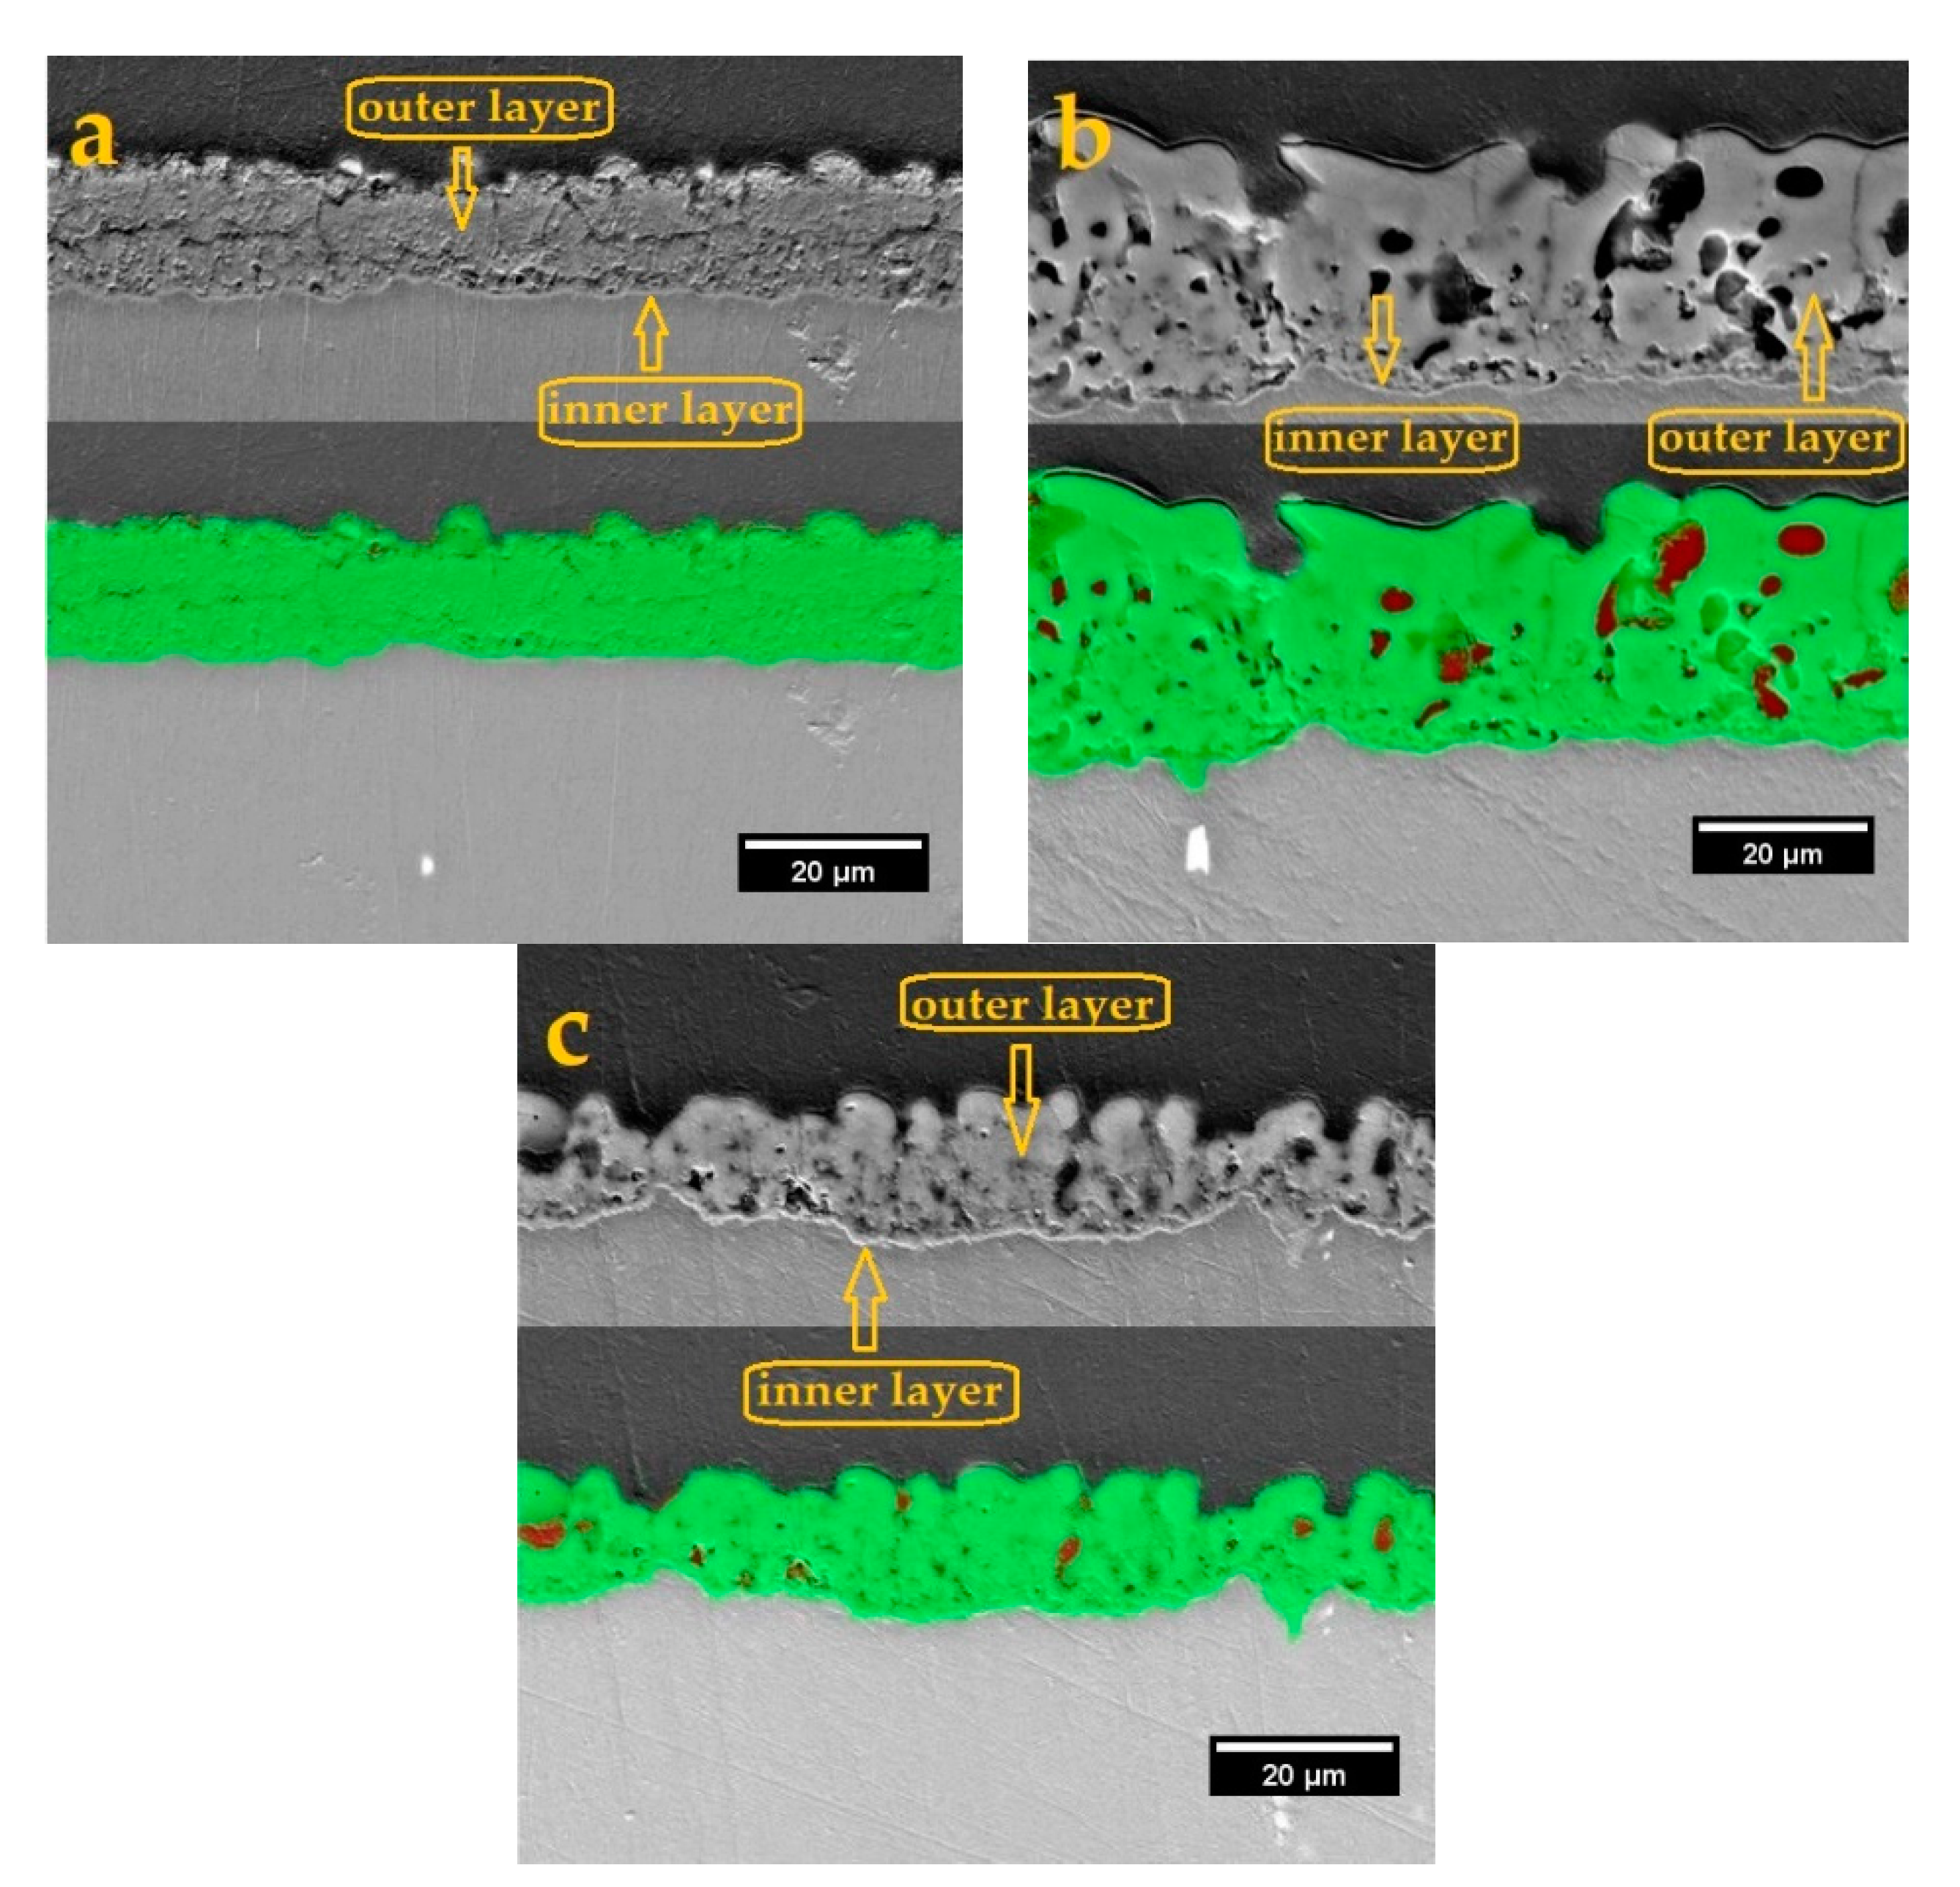
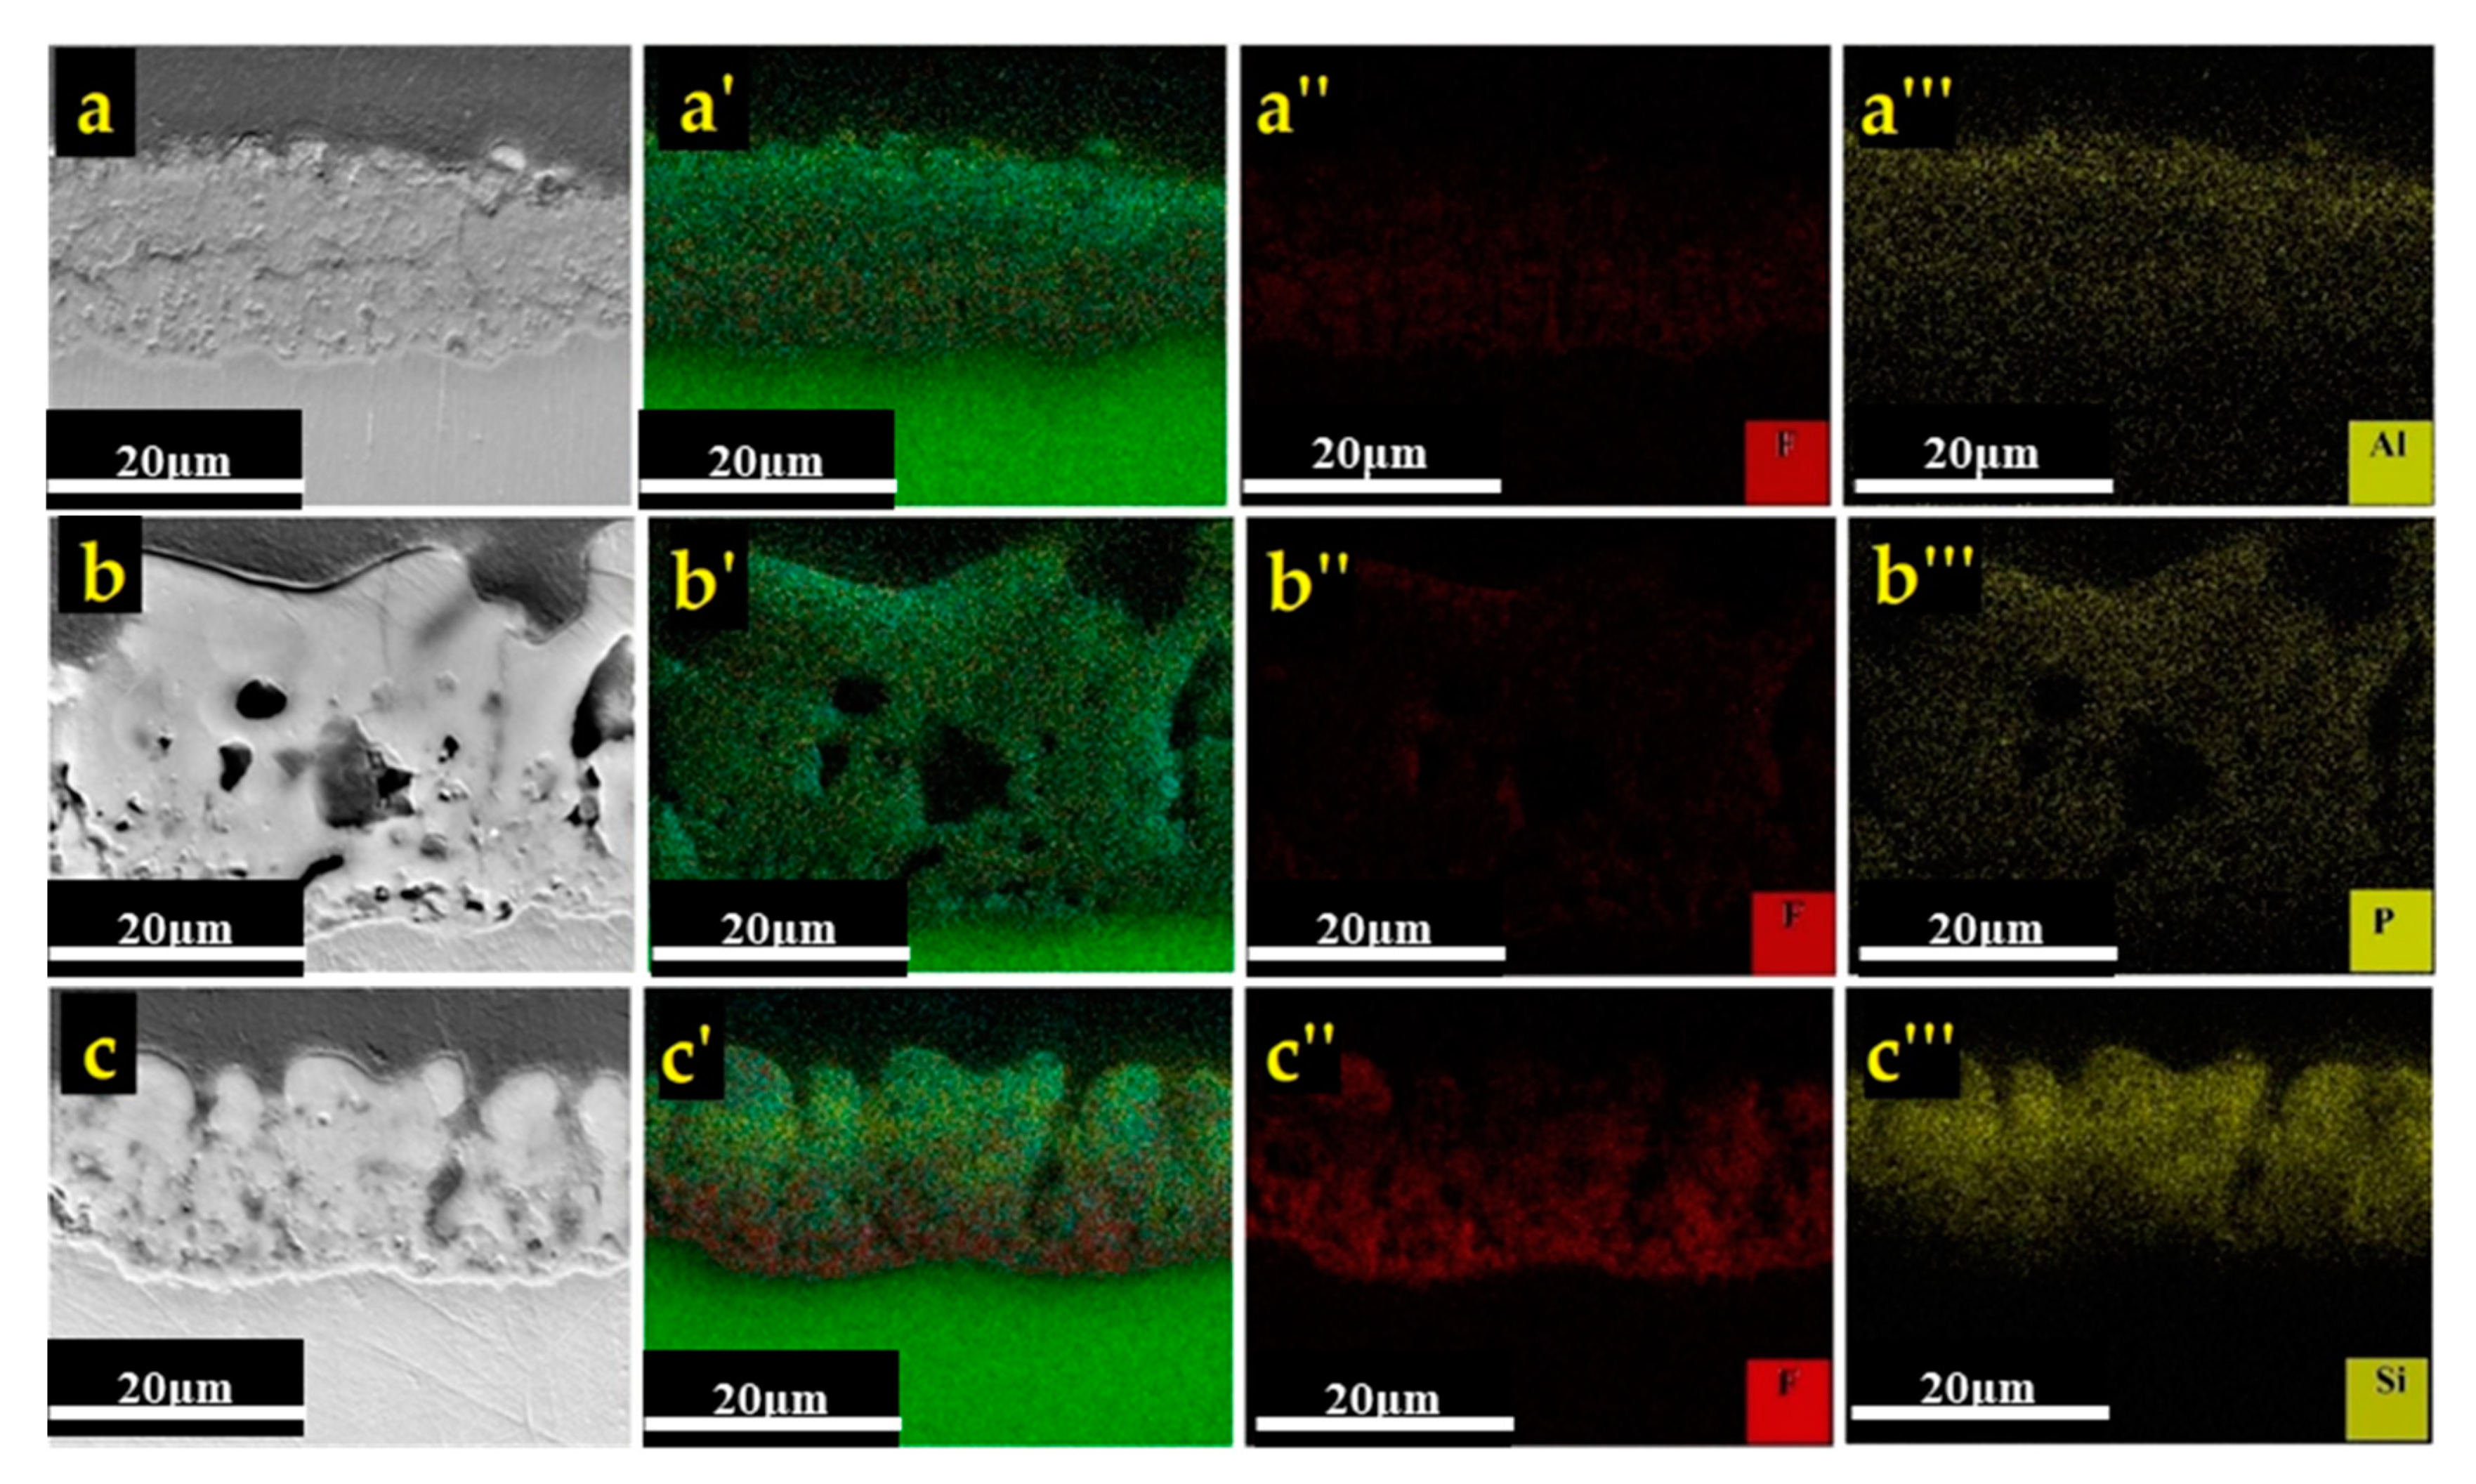
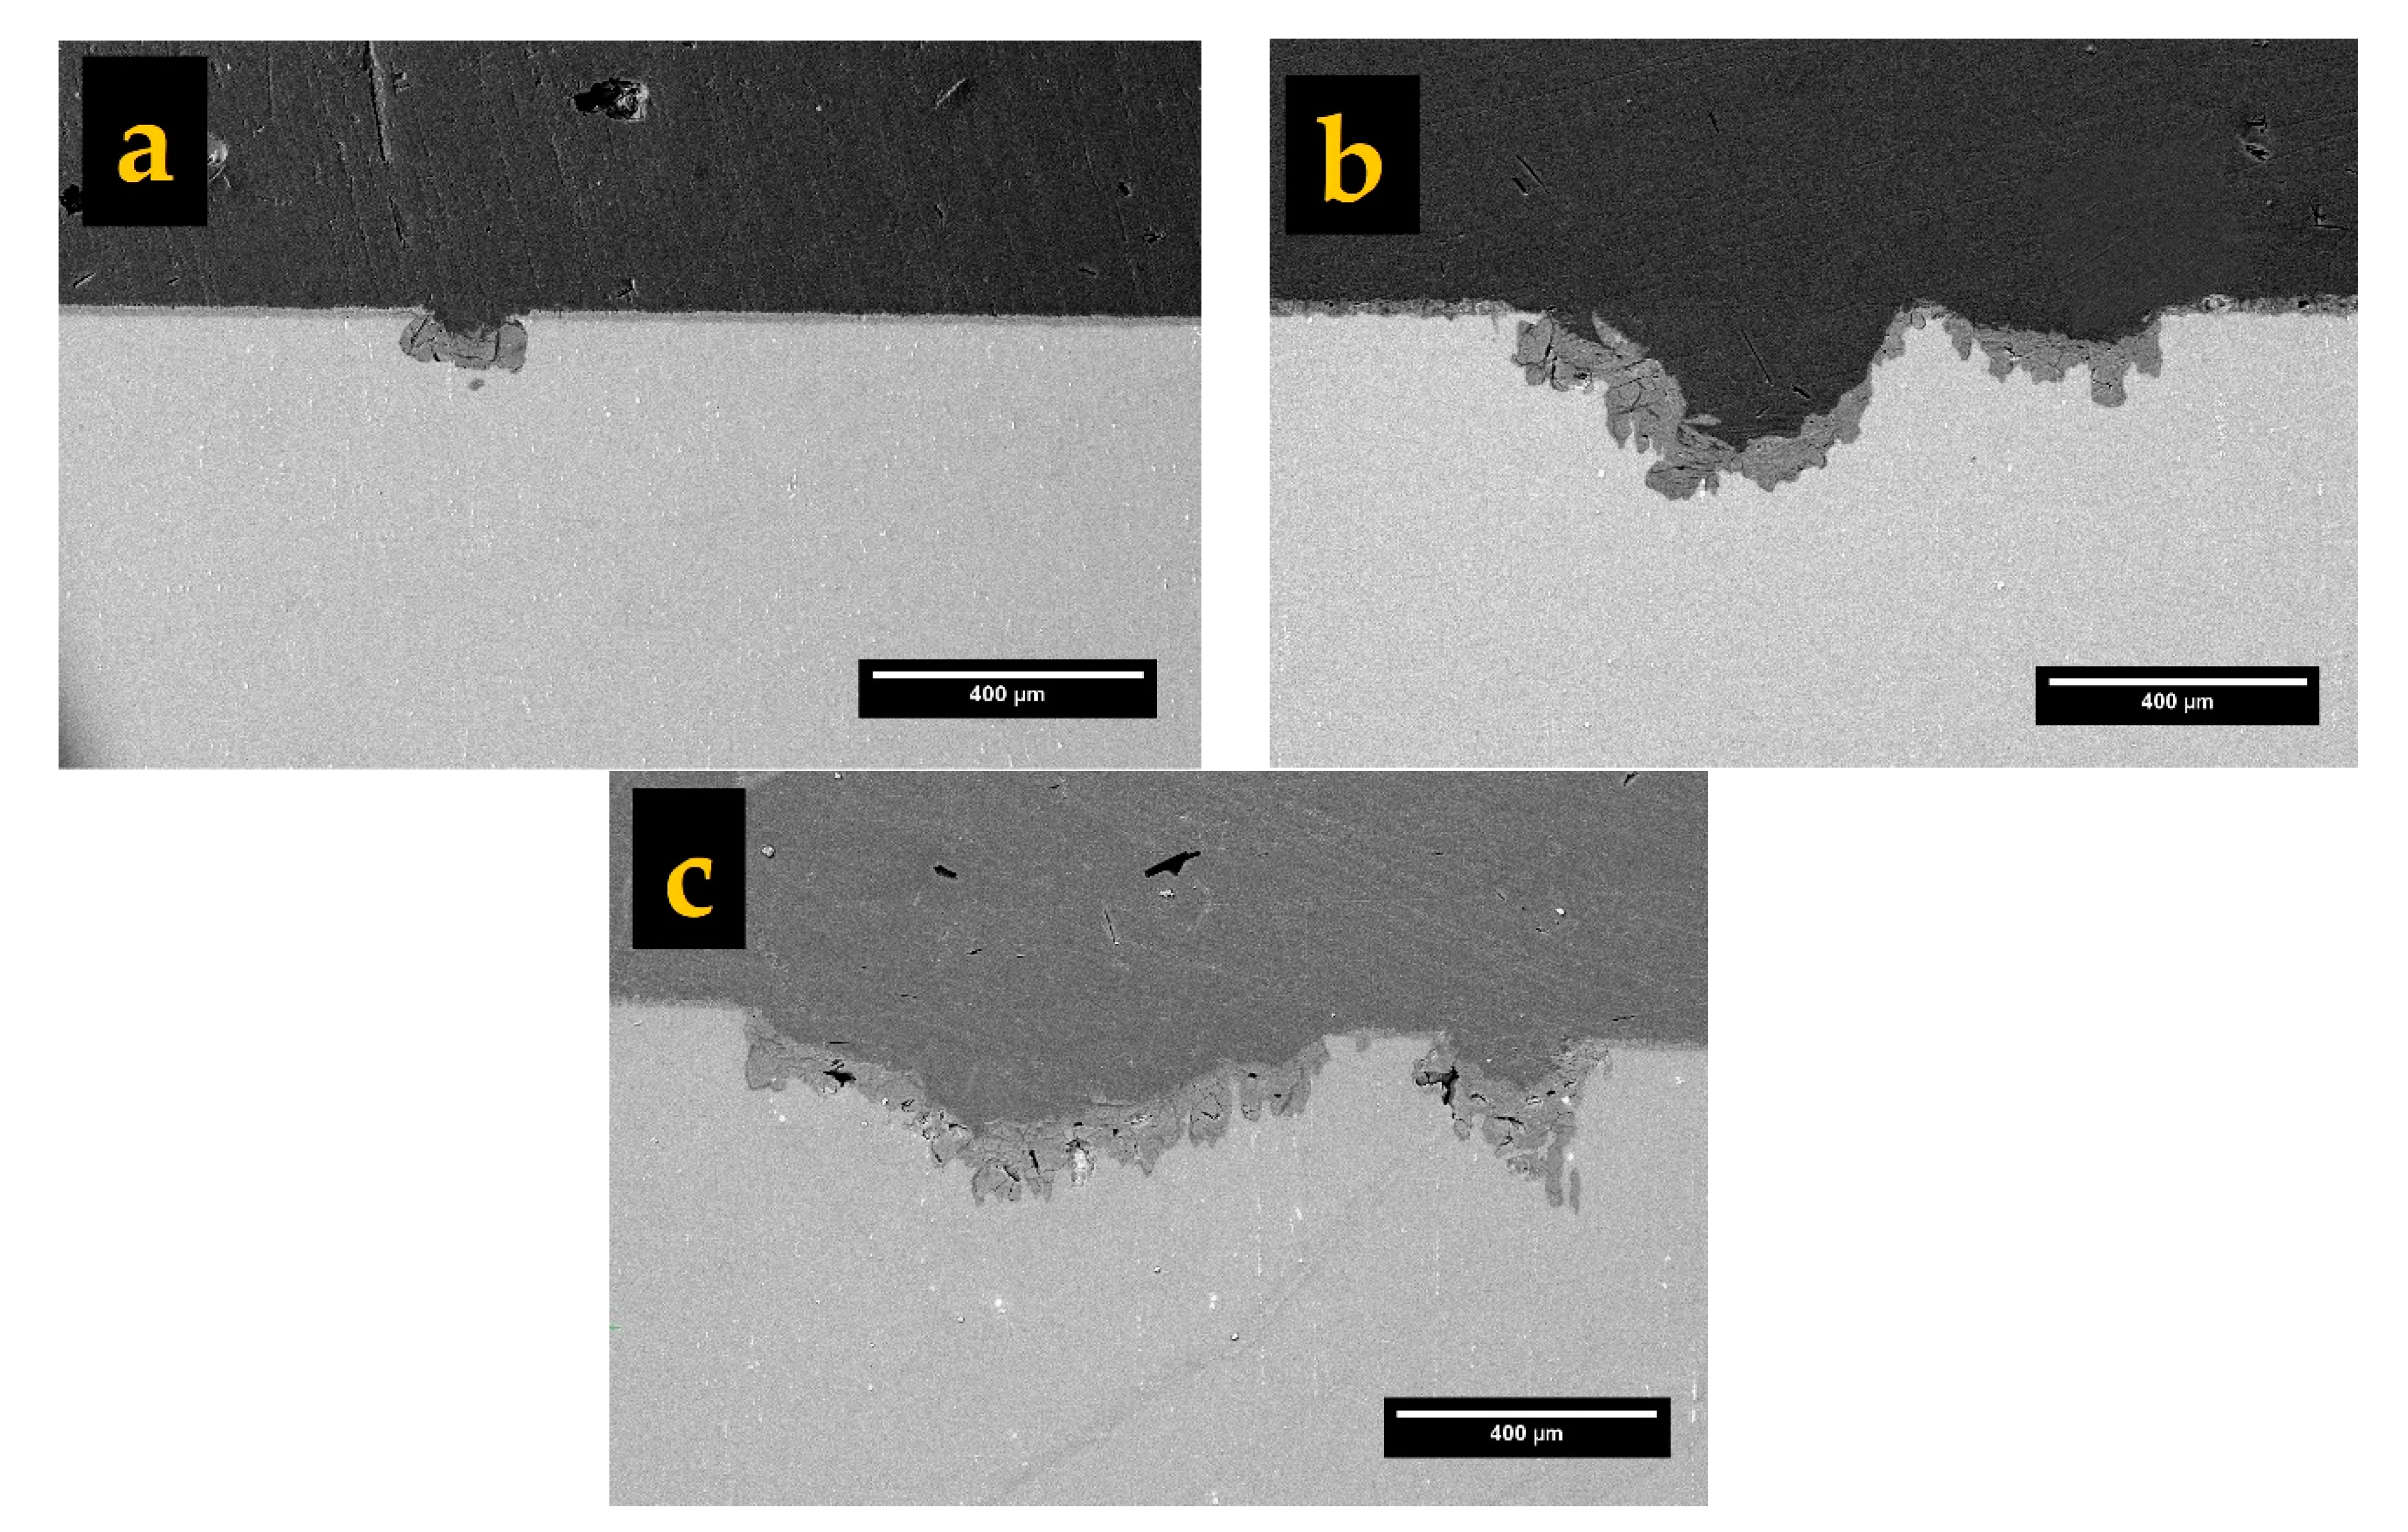
- The cross-sectional image obtained in aluminate-based electrolyte included tiny pores due to occurrence of A and C-type discharges and formed more compact coating. The B, D, and E-type discharges were responsible for deep channels and open pores (pancakes) in phosphate and silicate containing coatings. Hence, a larger porosity percentage was related to phosphate and silicate containing coatings.
- (3)
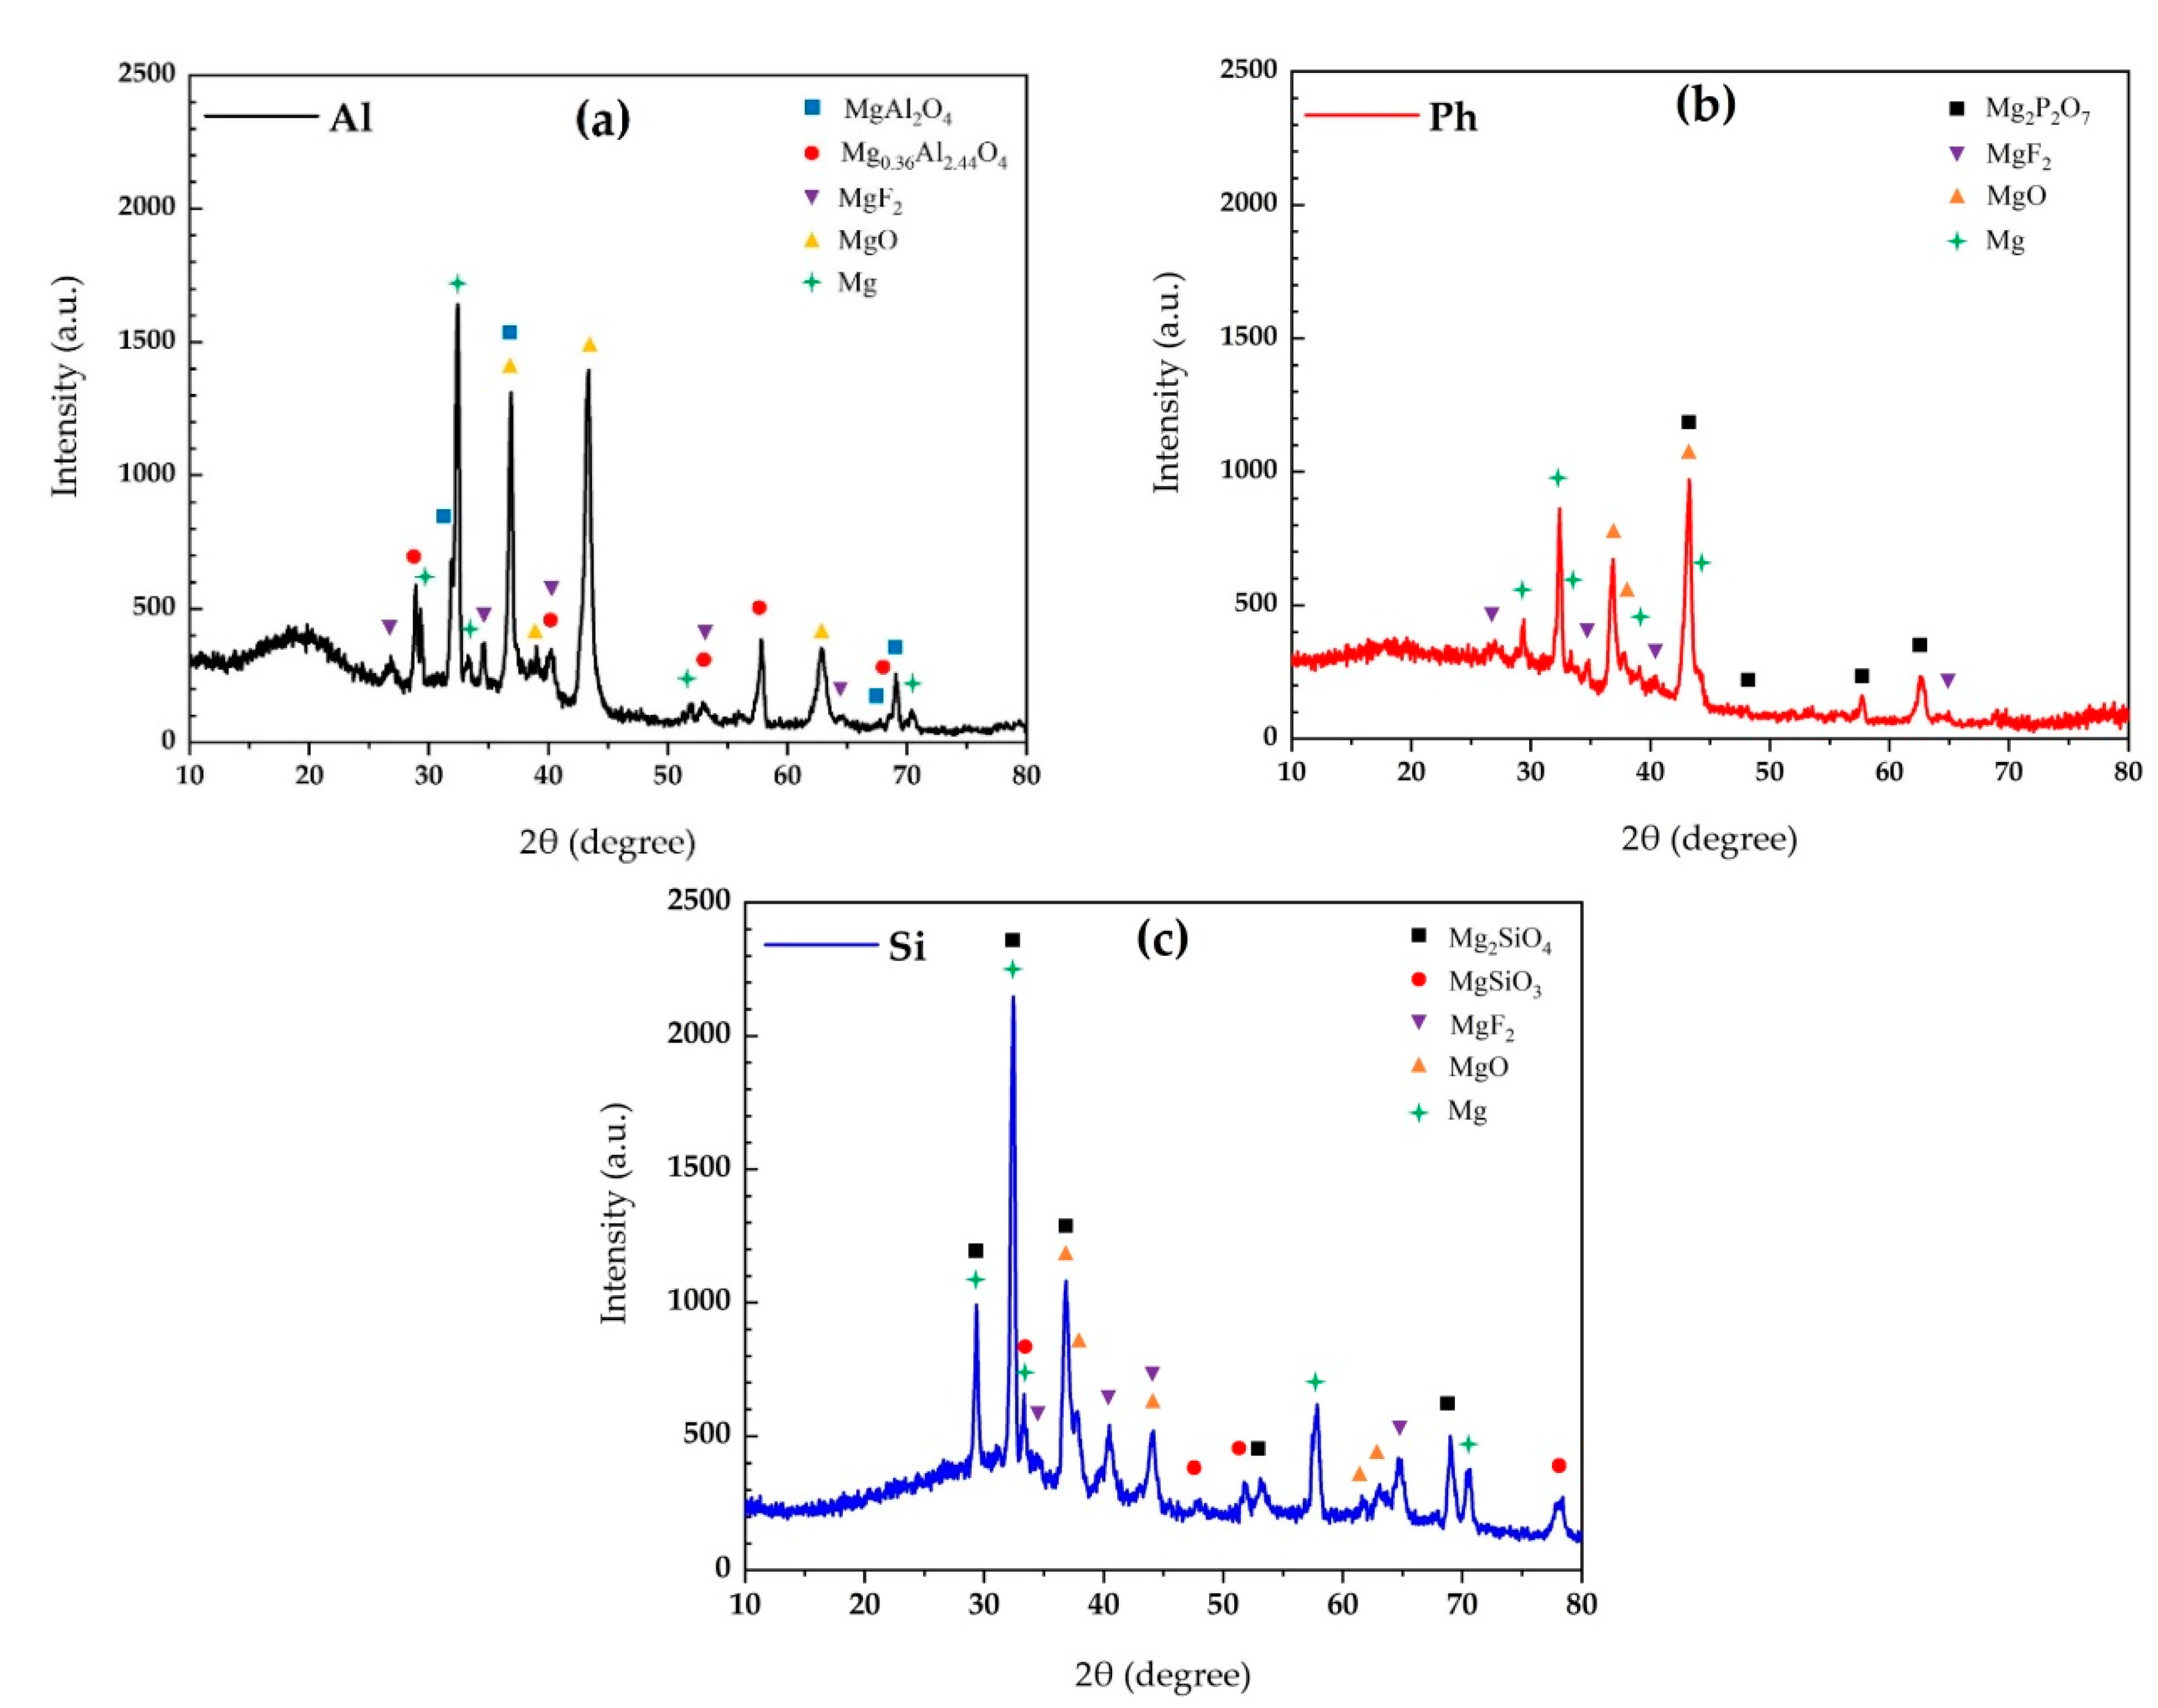
- The coatings contained MgO and MgF2 phases, along with stoichiometric and non-stoichiometric MgAl2O4, Mg2SiO4, MgSiO3, and Mg2P2O7 in aluminate, silicate, phosphate, electrolytes, respectively.
- (4)
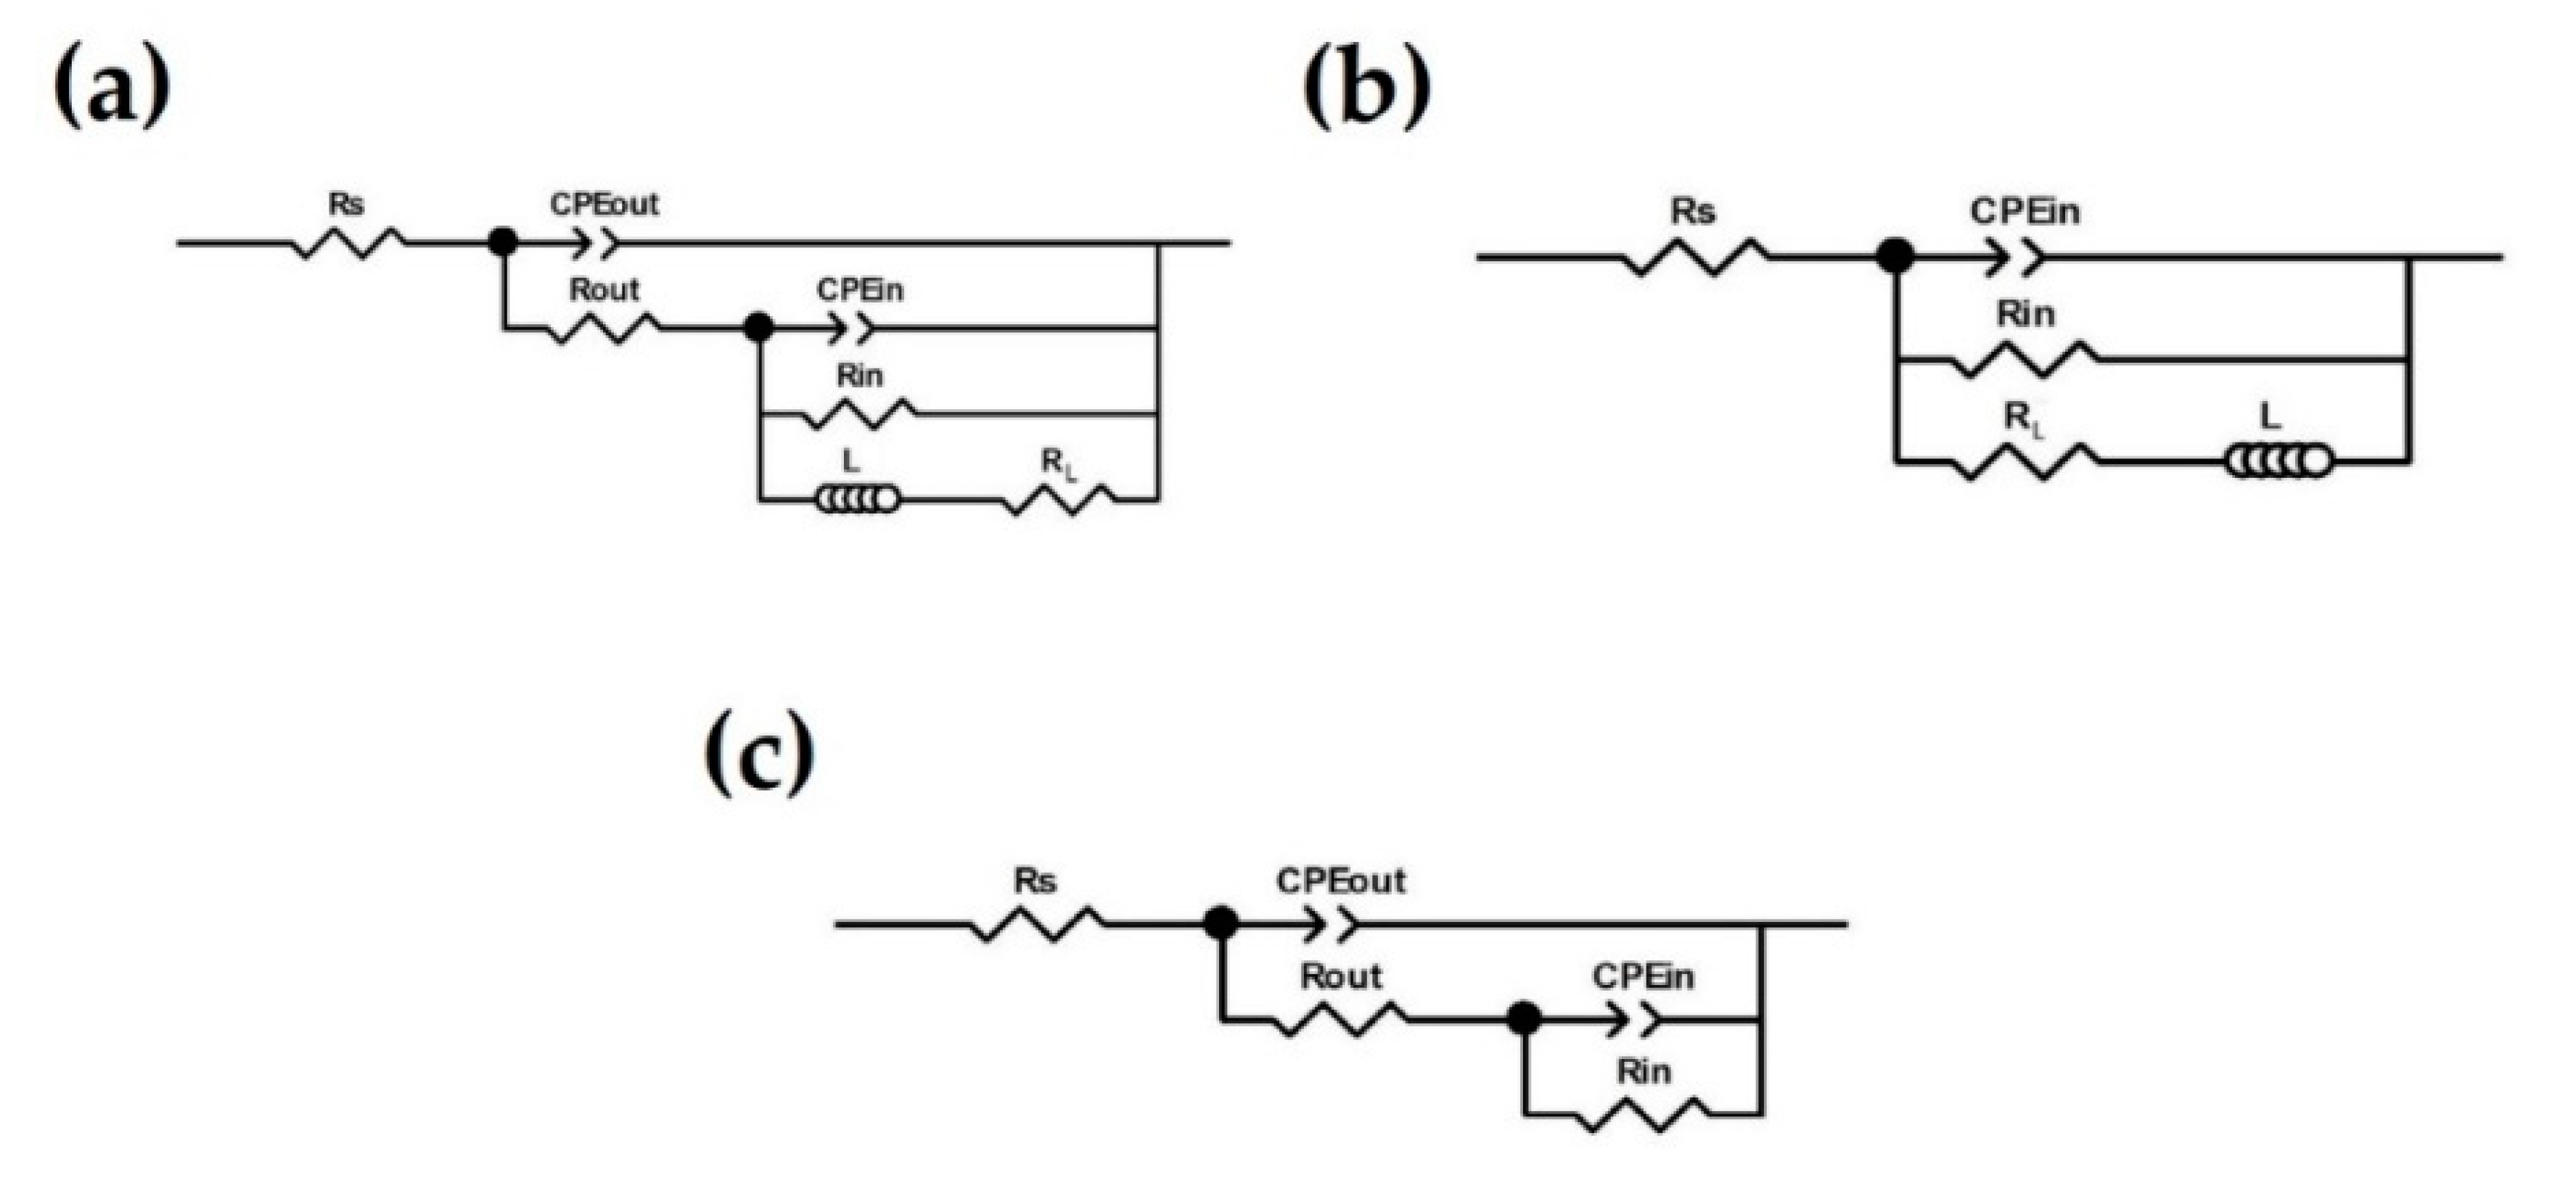
- After 2 days of exposure to 3.5 wt.% NaCl solution, the silicate specimen showed the highest corrosion resistance, due to the presence of the most MgF2 amount in the inner barrier layer. However, after 6 days, the substrate was intensively attacked, which stemmed from the low thickness and its porous structure. For the phosphate-containing coating, the substrate was exposed to the corrosive solution after 9 days of exposure. Aluminate-containing coating endured 10 days of exposure, despite exhibiting an inductive loop after 2 days of exposure. Therefore, the highest corrosion resistance at short-immersion time is shown by the silicate-containing coating, while at long-immersion time, this was provided by the aluminate-containing coating.
- (5)
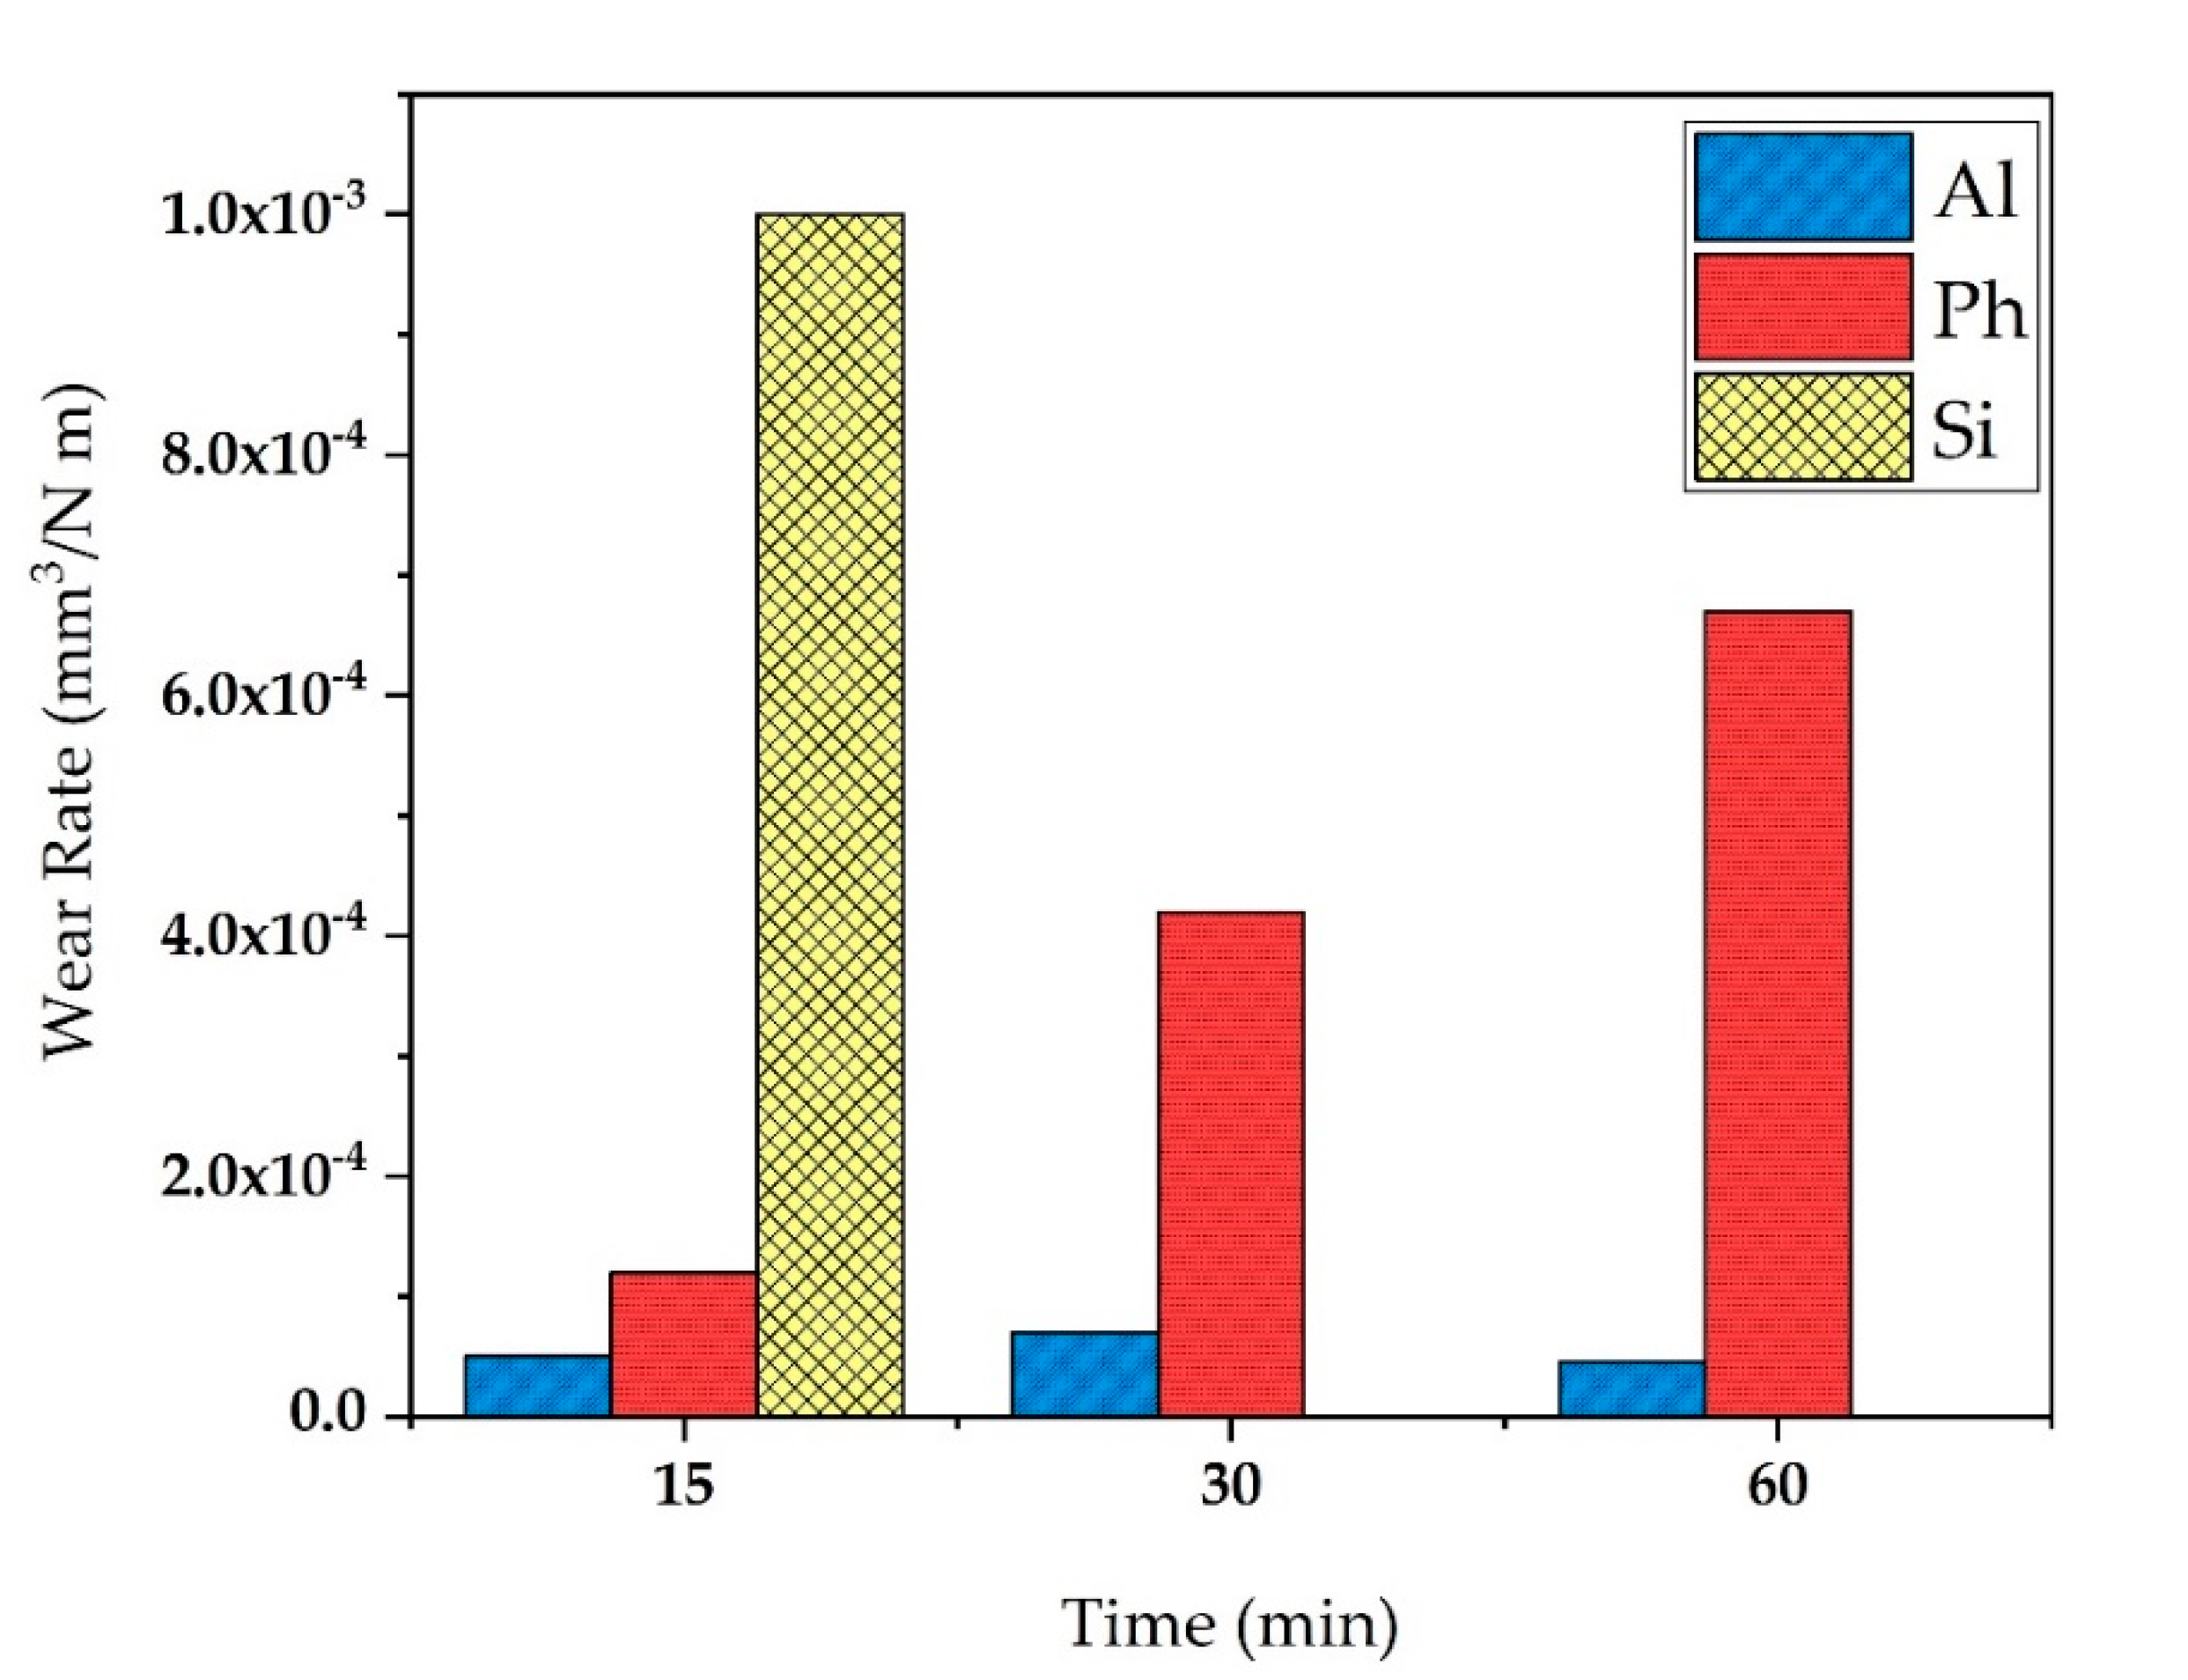
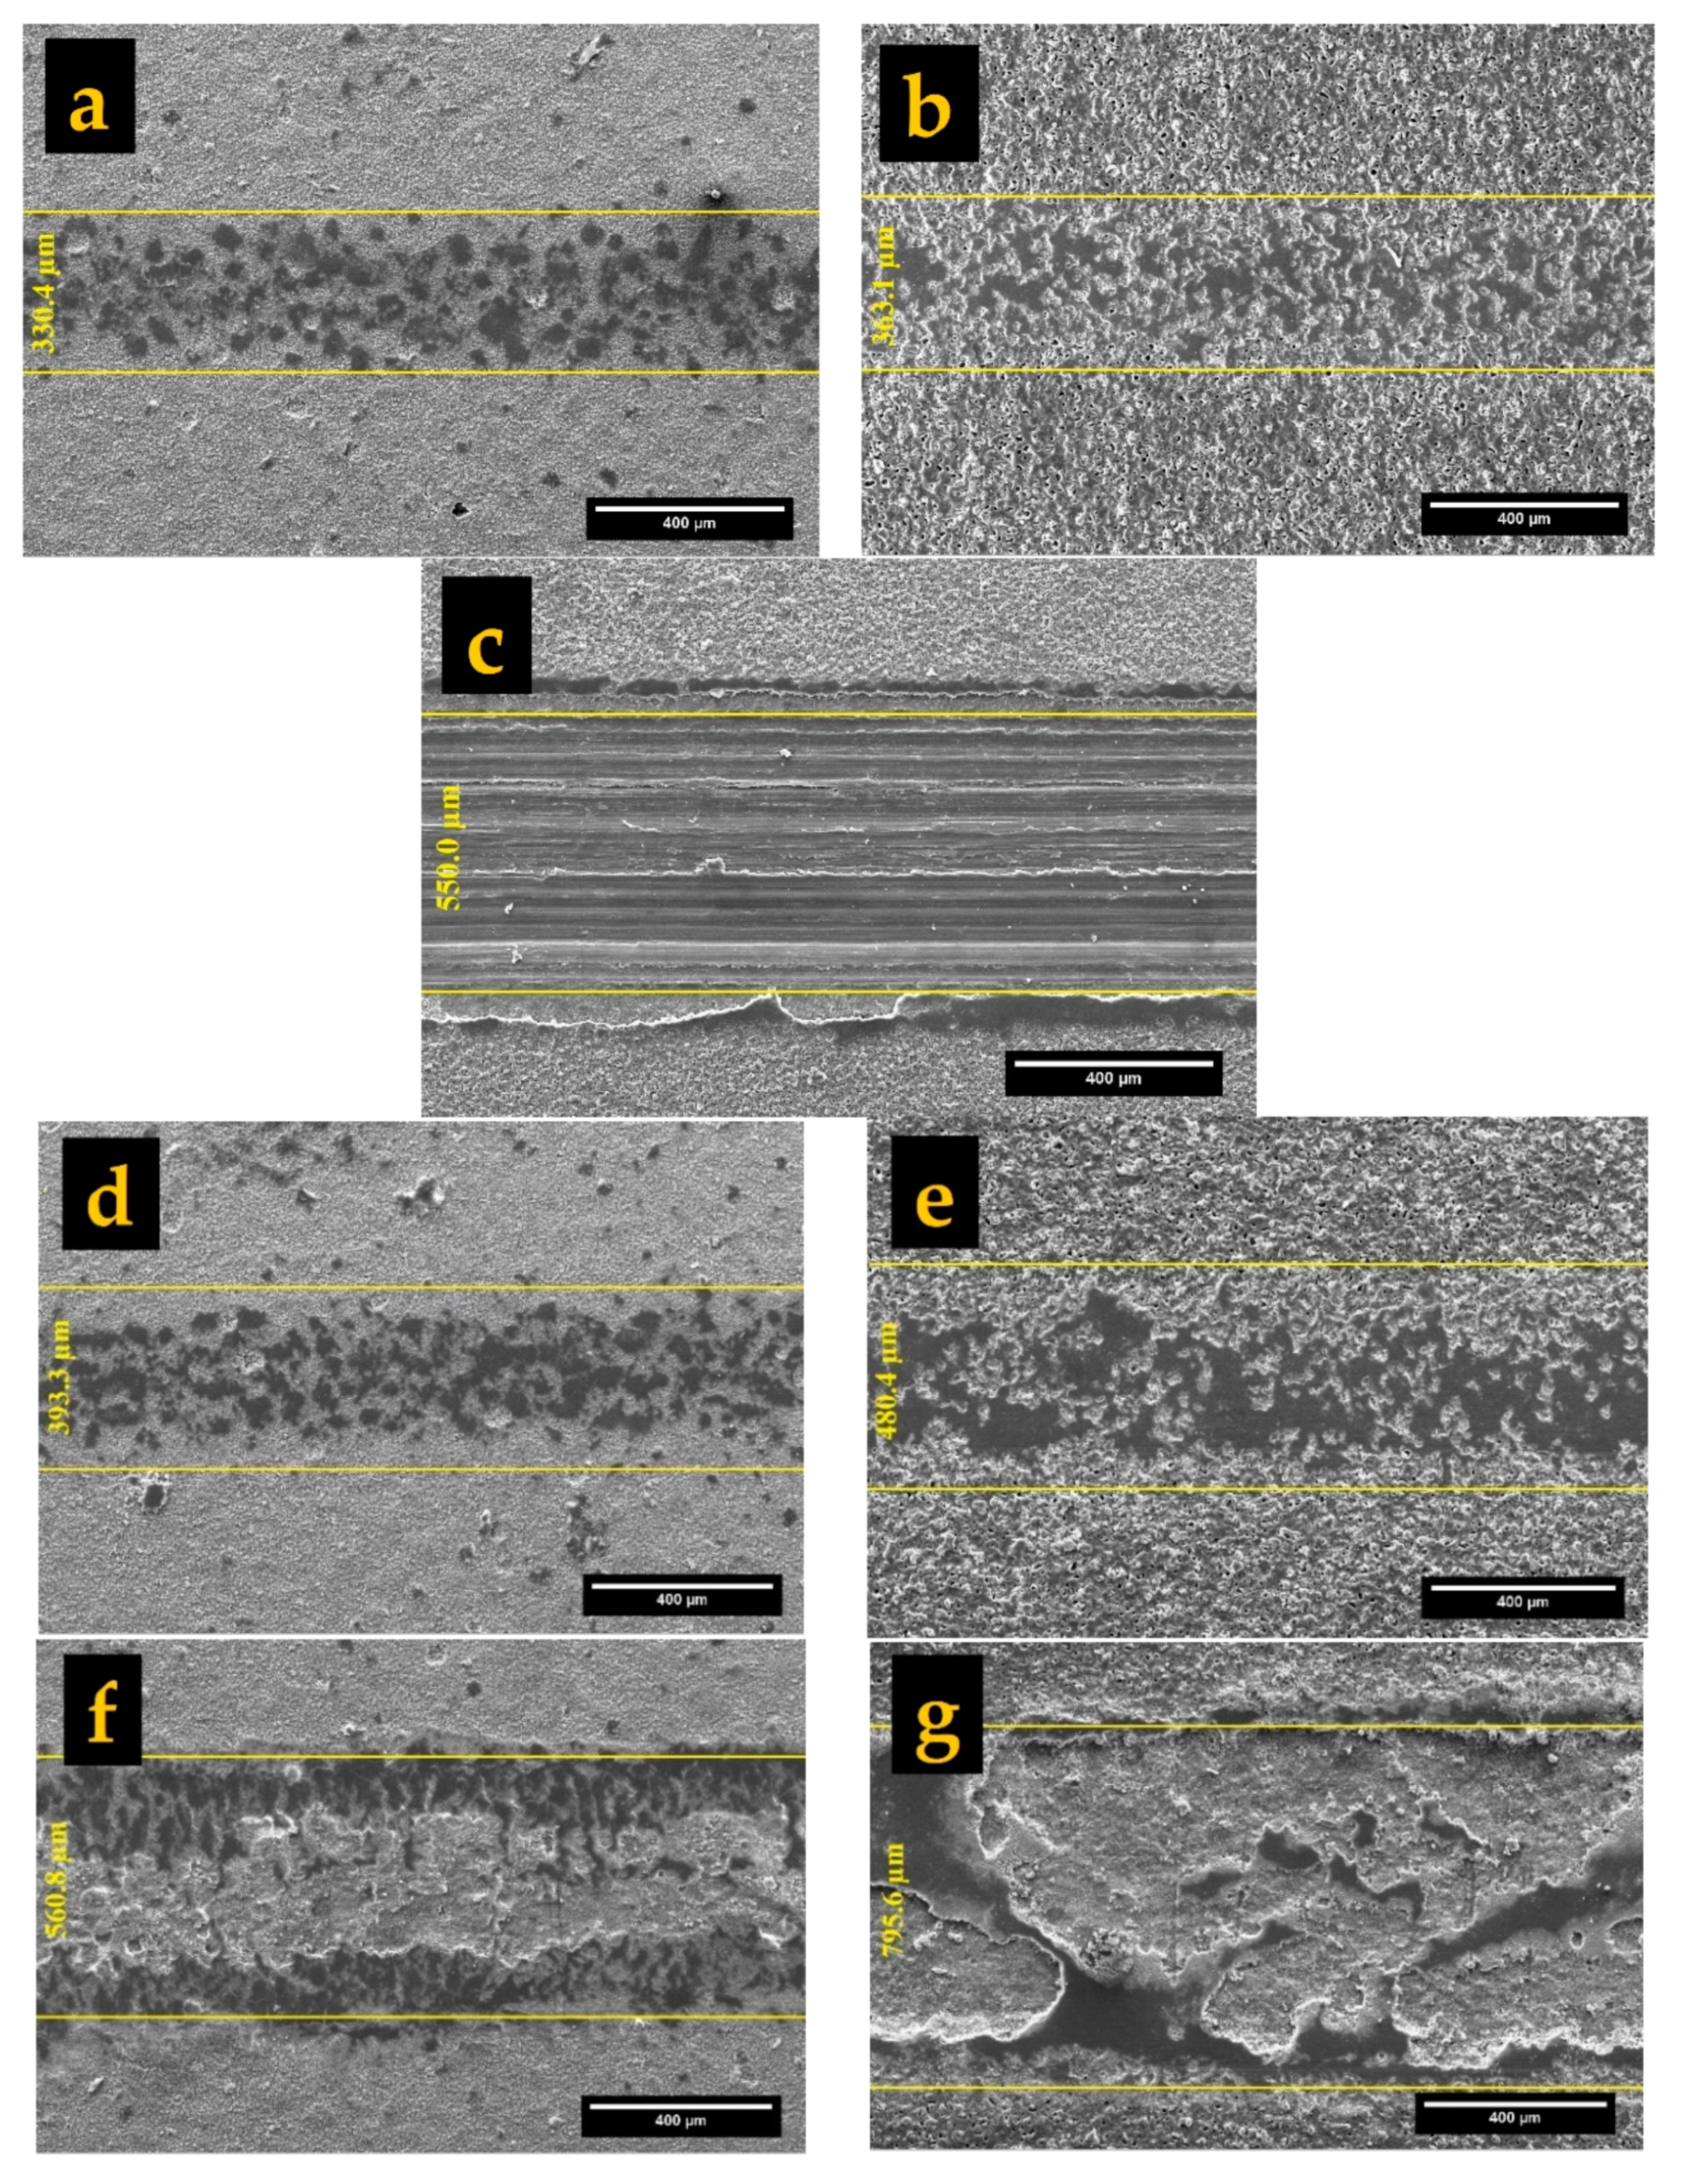
- The highest wear resistance was given by the coating produced in aluminate solution, with revealing a much lower track width and volume loss in all evaluations. The lowest wear resistance was shown by the silicate-containing coating with the highest volume loss, track width and depth before 15 min. At the same time, the phosphate-containing coating with higher thickness delayed the degradation process, but as the sliding continued to 60 min, generated debris filled the larger-sized flaws, and the rest of the spalling particles engaged in the wear process as third-bodies, which increased the wear rate over time.
Author Contributions
Funding
Acknowledgments
Conflicts of Interest
References
- Mordike, B.L.; Ebert, T. Magnesium properties—Applications—Potential. Mater. Sci. Eng. A 2001, 302, 37–45. [Google Scholar] [CrossRef]
- Li, N.; Zheng, Y. Novel Magnesium Alloys Developed for Biomedical Application: A Review. J. Mater. Sci. Technol. 2013, 29, 489–502. [Google Scholar] [CrossRef]
- Song, G.L.; Xu, Z. Effect of microstructure evolution on corrosion of different crystal surfaces of AZ31 Mg alloy in a chloride containing solution. Corros. Sci. 2012, 54, 97–105. [Google Scholar] [CrossRef]
- Ghali, E.; Dietzel, W.; Kainer, K.U. General and localized corrosion of magnesium alloys: A critical review. J. Mater. Eng. Perform. 2004, 13, 7–23. [Google Scholar] [CrossRef]
- Esmaily, M.; Svensson, J.E.; Fajardo, S.; Birbilis, N.; Frankel, G.S.; Virtanen, S.; Arrabal, R.; Thomas, S.; Johansson, L.G. Fundamentals and advances in magnesium alloy corrosion. Prog. Mater. Sci. 2017, 89, 92–193. [Google Scholar] [CrossRef]
- Mehta, D.S.; Masood, S.H.; Song, W.Q. Investigation of wear properties of magnesium and aluminum alloys for automotive applications. J. Mater. Process. Technol. 2004, 155–156, 1526–1531. [Google Scholar] [CrossRef]
- Clyne, T.W.; Troughton, S.C. A review of recent work on discharge characteristics during plasma electrolytic oxidation of various metals. Int. Mater. Rev. 2018, 64, 127–162. [Google Scholar] [CrossRef] [Green Version]
- Hryniewicz, T. Plasma electrolytic oxidation of metals and alloys. Metals 2018, 8, 1058. [Google Scholar] [CrossRef] [Green Version]
- Yerokhin, A.L.; Nie, X.; Leyland, A.; Matthews, A.; Dowey, S.J. Plasma electrolysis for surface engineering. Surf. Coat. Technol. 1999, 122, 73–93. [Google Scholar] [CrossRef]
- Ma, Y.; Nie, X.; Northwood, D.O.; Hu, H. Systematic study of the electrolytic plasma oxidation process on a Mg alloy for corrosion protection. Thin Solid Films 2006, 494, 296–301. [Google Scholar] [CrossRef]
- Tsai, D.; Chou, C. Review of the Soft Sparking Issues in Plasma Electrolytic Oxidation. Metals 2018, 8, 105. [Google Scholar] [CrossRef] [Green Version]
- Curran, J.A.; Clyne, T.W. Porosity in plasma electrolytic oxide coatings. Acta Mater. 2006, 54, 1985–1993. [Google Scholar] [CrossRef]
- Darband, G.B.; Aliofkhazraei, M.; Hamghalam, P.; Valizade, N. Plasma electrolytic oxidation of magnesium and its alloys: Mechanism, properties and applications. J. Magnes. Alloys 2017, 5, 74–132. [Google Scholar] [CrossRef]
- Lee, J.H.; Kim, S.J. Influence of pulse parameters on the microstructure of ceramic oxide coatings produced on al alloy by pulsed dc plasma electrolytic oxidation. Nanosci. Nanotechnol. Lett. 2016, 8, 94–99. [Google Scholar] [CrossRef]
- Jiang, Y.; Yu, Z.; Xia, Q.; Zhang, Y.; Jiang, Z.; Yao, Z.; Wu, Z. Structure and corrosion resistance of peo ceramic coatings on az91d mg alloy under three kinds of power modes. Int. J. Appl. Ceram. Technol. 2013, 10, 310–317. [Google Scholar] [CrossRef]
- Nominé, A.; Martin, J.; Henrion, G.; Belmonte, T. Effect of cathodic micro-discharges on oxide growth during plasma electrolytic oxidation (PEO). Surf. Coat. Technol. 2015, 269, 131–137. [Google Scholar] [CrossRef]
- Sidorova, M.V.; Sinebrukhov, S.L.; Khrisanfova, O.A.; Gnedenkov, S.V. Effect of PEO-modes on the electrochemical and mechanical properties of coatings on MA8 magnesium alloy. Phys. Procedia 2012, 23, 90–93. [Google Scholar] [CrossRef] [Green Version]
- Lv, G.H.; Chen, H.; Gu, W.C.; Li, L.; Niu, E.W.; Zhang, X.H.; Yang, S.Z. Effects of current frequency on the structural characteristics and corrosion property of ceramic coatings formed on magnesium alloy by PEO technology. J. Mater. Process. Technol. 2008, 208, 9–13. [Google Scholar] [CrossRef]
- Bala Srinivasan, P.; Liang, J.; Balajeee, R.G.; Blawert, C.; Störmer, M.; Dietzel, W. Effect of pulse frequency on the microstructure, phase composition and corrosion performance of a phosphate-based plasma electrolytic oxidation coated AM50 magnesium alloy. Appl. Surf. Sci. 2010, 256, 3928–3935. [Google Scholar] [CrossRef] [Green Version]
- Cai, J.; Cao, F.; Chang, L.; Zheng, J.; Zhang, J.; Cao, C. The preparation and corrosion behaviors of MAO coating on AZ91D with rare earth conversion precursor film. Appl. Surf. Sci. 2011, 257, 3804–3811. [Google Scholar] [CrossRef]
- Chen, Y.; Yang, Y.; Zhang, T.; Zhang, W.; Wang, F.; Lu, X.; Blawert, C.; Zheludkevich, M.L. Interaction effect between different constituents in silicate-containing electrolyte on PEO coatings on Mg alloy. Surf. Coat. Technol. 2016, 307, 825–836. [Google Scholar] [CrossRef]
- Sah, S.P.; Aoki, Y.; Habazaki, H. Influence of Phosphate Concentration on Plasma Electrolytic Oxidation of AZ80 Magnesium Alloy in Alkaline Aluminate Solution. Mater. Trans. 2010, 51, 94–102. [Google Scholar] [CrossRef] [Green Version]
- Durdu, S.; Usta, M. Characterization and mechanical properties of coatings on magnesium by micro arc oxidation. Appl. Surf. Sci. 2012, 261, 774–782. [Google Scholar] [CrossRef]
- Durdu, S.; Aytaç, A.; Usta, M. Characterization and corrosion behavior of ceramic coating on magnesium by micro-arc oxidation. J. Alloys Compd. 2011, 509, 8601–8606. [Google Scholar] [CrossRef]
- Zhang, R.F.; Xiong, G.Y.; Hu, C.Y. Comparison of coating properties obtained by MAO on magnesium alloys in silicate and phytic acid electrolytes. Curr. Appl. Phys. 2010, 10, 255–259. [Google Scholar] [CrossRef]
- Seyfoori, A.; Mirdamadi, S.; Khavandi, A.; Raufi, Z.S. Biodegradation behavior of micro-arc oxidized AZ31 magnesium alloys formed in two different electrolytes. Appl. Surf. Sci. 2012, 261, 92–100. [Google Scholar] [CrossRef]
- Li, X.; Liu, X.; Luan, B.L. Corrosion and wear properties of PEO coatings formed on AM60B alloy in NaAlO2 electrolytes. Appl. Surf. Sci. 2011, 257, 9135–9141. [Google Scholar] [CrossRef]
- Tekin, K.C.; Malayoglu, U.; Shrestha, S. Tribological behaviour of plasma electrolytic oxide coatings on Ti6Al4V and cp-Ti alloys. Surf. Eng. 2016, 32, 435–442. [Google Scholar] [CrossRef]
- Toulabifard, A.; Hakimizad, A.; Di Franco, F.; Raeissi, K.; Santamaria, M. Synergistic effect of W incorporation and pulsed current mode on wear and tribocorrosion resistance of coatings grown by plasma electrolytic oxidation on 7075 Al alloy. Mater. Res. Express 2019, 6, 106502–106511. [Google Scholar] [CrossRef]
- Rahmati, M.; Raeissi, K.; Toroghinejad, M.R.; Hakimizad, A. Effect of Pulse Current Mode on Microstructure, Composition and Corrosion Performance of the Coatings Produced by Plasma Electrolytic Oxidation. Coatings 2019, 9, 688. [Google Scholar] [CrossRef] [Green Version]
- Dong, H.; Blawert, C.; Srinivasan, P.B. Plasma electrolytic oxidation treatment of magnesium alloys. In Surface Engineering of Light Alloys; Woodhead Publishing: New York, NY, USA, 2010; pp. 155–183. [Google Scholar]
- Muhaffel, F.; Cimenoglu, H. Development of corrosion and wear resistant micro-arc oxidation coating on a magnesium alloy. Surf. Coat. Technol. 2019, 357, 822–832. [Google Scholar] [CrossRef]
- Lu, X.; Chen, Y.; Blawert, C.; Li, Y.; Zhang, T.; Wang, F.; Kainer, K.U.; Zheludkevich, M. Influence of SiO2 particles on the corrosion and wear resistance of plasma electrolytic oxidation-coated AM50 Mg alloy. Coatings 2018, 8, 306. [Google Scholar] [CrossRef] [Green Version]
- Dehnavi, V.; Binns, W.J.; Noël, J.J.; Shoesmith, D.W.; Luan, B.L. Growth behaviour of low-energy plasma electrolytic oxidation coatings on a magnesium alloy. J. Magnes. Alloys 2018, 6, 229–237. [Google Scholar] [CrossRef]
- Hussein, R.O.; Nie, X.; Northwood, D.O.; Yerokhin, A.; Matthews, A. Spectroscopic study of electrolytic plasma and discharging behaviour during the plasma electrolytic oxidation (PEO) process. J. Phys. D Appl. Phys. 2010, 43, 105203–105216. [Google Scholar] [CrossRef]
- Jalota, S.; Bhaduri, S.B.; Tas, A.C. Using a synthetic body fluid (SBF) solution of 27 mM HCO3− to make bone substitutes more osteointegrative. Mater. Sci. Eng. C 2008, 28, 129–140. [Google Scholar] [CrossRef]
- Duan, H.; Yan, C.; Wang, F. Growth process of plasma electrolytic oxidation films formed on magnesium alloy AZ91D in silicate solution. Electrochim. Acta 2007, 52, 5002–5009. [Google Scholar] [CrossRef]
- Cheng, Y.; Xue, Z.; Wang, Q.; Wu, X.Q.; Matykina, E.; Skeldon, P.; Thompson, G.E. New findings on properties of plasma electrolytic oxidation coatings from study of an Al–Cu–Li alloy. Electrochim. Acta 2013, 107, 358–378. [Google Scholar] [CrossRef]
- Ma, X.; Blawert, C.; Höche, D.; Zheludkevich, M.L.; Kainer, K.U. Investigation of electrode distance impact on PEO coating formation assisted by simulation. Appl. Surf. Sci. 2016, 388, 304–312. [Google Scholar] [CrossRef] [Green Version]
- Mori, Y.; Koshi, A.; Liao, J.; Asoh, H.; Ono, S. Characteristics and corrosion resistance of plasma electrolytic oxidation coatings on AZ31B Mg alloy formed in phosphate—Silicate mixture electrolytes. Corros. Sci. 2014, 88, 254–262. [Google Scholar] [CrossRef]
- Zhang, D.; Ge, Y.; Liu, G.; Gao, F.; Li, P. Investigation of tribological properties of micro-arc oxidation ceramic coating on Mg alloy under dry sliding condition. Ceram. Int. 2018, 44, 16164–16172. [Google Scholar] [CrossRef]
- Soliman, H.; Hamdy, A.S. Effect of fluoride ions modifier and ceramic Al2O3 particles additives on plasma electrolytic oxidation of AZ31. Surf. Eng. 2017, 33, 767–772. [Google Scholar] [CrossRef]
- Zhu, Z.; Tu, W.; Cheng, Y.; Cheng, Y. The formation of metallic W and amorphous phase in the plasma electrolytic oxidation coatings on an Al alloy from tungstate-containing electrolyte. Surf. Coat. Technol. 2019, 361, 176–187. [Google Scholar] [CrossRef]
- Ao, N.; Liu, D.; Zhang, X.; He, G. Microstructural characteristics of PEO coating: Effect of surface nanocrystallization. J. Alloys Compd. 2020, 823, 153823–153833. [Google Scholar] [CrossRef]
- Zhang, W.; Tian, B.; Du, K.Q.; Zhang, H.X.; Wang, F.H. Preparation and corrosion performance of PEO coating with low porosity on magnesium alloy AZ91D in acidic KF system. Int. J. Electrochem. Sci. 2011, 6, 5228–5248. [Google Scholar]
- Habazaki, H.; Fushimi, K.; Shimizu, K.; Skeldon, P.; Thompson, G.E. Fast migration of fluoride ions in growing anodic titanium oxide. Electrochem. Commun. 2007, 9, 1222–1227. [Google Scholar] [CrossRef] [Green Version]
- Wang, H.M.; Chen, Z.H.; Li, L.L. Corrosion resistance and microstructure characteristics of plasma electrolytic oxidation coatings formed on AZ31 magnesium alloy. Surf. Eng. 2010, 26, 385–392. [Google Scholar] [CrossRef]
- Curioni, M.; Salamone, L.; Scenini, F.; Santamaria, M. A mathematical description accounting for the superfluous hydrogen evolution and the inductive behaviour observed during electrochemical measurements on magnesium. Electrochim. Acta 2018, 274, 343–352. [Google Scholar] [CrossRef]
- Ma, Y.; Nie, X.; Northwood, D.O.; Hu, H. Corrosion and erosion properties of silicate and phosphate coatings on magnesium. Thin Solid Films 2004, 469–470, 472–477. [Google Scholar] [CrossRef]
- Zhang, Y.; Chen, F.; Zhang, Y.; Du, C. Influence of graphene oxide additive on the tribological and electrochemical corrosion properties of a PEO coating prepared on AZ31 magnesium alloy. Tribol. Int. 2020, 146, 106135–106147. [Google Scholar] [CrossRef]
- Lou, B.; Lin, Y.; Tseng, C.; Lu, Y.; Duh, J.; Lee, J. Plasma electrolytic oxidation coatings on AZ31 magnesium alloys with Si 3 N 4 nanoparticle additives. Surf. Coat. Technol. 2017, 332, 358–367. [Google Scholar] [CrossRef]
- Rehman, Z.U.; Ahn, B.H.; Jeong, Y.S.; Song, J.I.; Koo, B.H. The influence of various additives on the properties of PEO coatings formed on AZ31 Mg Alloy. Surf. Rev. Lett. 2016, 23, 1650006–16500013. [Google Scholar] [CrossRef]


| Sample Code | Electrolyte | Voltage Waveforms | |||
|---|---|---|---|---|---|
| Composition (g L−1) | pH | Conductivity (mS cm−1) | First Half at 1 kHz | Second Half at 2 kHz | |
| Al | 10 NaAlO2 + 8 NaF + 1 KOH | 12.96 | 20.45 |  | 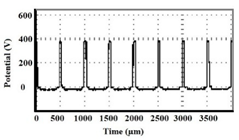 |
| Ph | 10 Na3PO4 + 8 NaF + 1 KOH | 12.50 | 14.28 | ||
| Si | 6 Na2SiO3 (liquid glass, 37%) + 8 KF + 8 KOH | 10.58 | 11.94 | ||
| Sample | Thickness | Roughness | Porosity Percentage (%) | |||
|---|---|---|---|---|---|---|
| Measured by Eddy Current (µm) | Measured by Cross-Sectional Analysis (µm) | Ra (µm) | Rz (µm) | Surface | Cross-Section | |
| Al | 16.50 ± 1.10 | 15.04 ± 0.61 | 0.84 ± 0.01 | 5.98 ± 0.20 | 7.03 ± 1.15 | 1.75 |
| Ph | 30.90 ± 3.90 | 30.40 ± 4.75 | 1.92 ± 0.15 | 12.49 ± 0.33 | 3.87 ± 0.49 | 7.25 |
| Si | 16.70 ± 1.90 | 14.07 ± 2.69 | 1.10 ± 0.02 | 7.29 ± 0.23 | 14.07 ± 2.19 | 4.86 |
| Sample | Mg | O | F | Al | P | Si | ||
|---|---|---|---|---|---|---|---|---|
| Al | Cross-section | Close to substrate | 60.38 | 16.29 | 12.44 | 10.90 | - | - |
| Close to the surface | 60.66 | 22.70 | 2.77 | 13.87 | - | - | ||
| Ph | Cross-section | Close to substrate | 54.17 | 19.86 | 15.03 | - | 9.13 | - |
| Close to the surface | 44.96 | 25.49 | 14.27 | - | 9.79 | - | ||
| Si | Cross-section | Close to substrate | 46.82 | 17.93 | 23.96 | - | - | 11.04 |
| Close to the surface | 32.77 | 32.25 | 9.62 | - | - | 23.03 | ||
| Specimen | Immersion Time (EC Model) | Outer Layer | Inner Layer | Substrate | |||||
|---|---|---|---|---|---|---|---|---|---|
| CPE (μF cm−2 Sn−1) | n | Rout (kΩ cm2) | CPE (μF cm−2 Sn−1) | n | Rin (kΩ cm2) | RL (kΩ cm2 | L (kH cm2) | ||
| Al | 2 days (a) | 0.21 ± 0.01 | 0.79 ± 0.02 | 0.62 ± 0.05 | 0.11 ± 0.02 | 0.92 ± 0.06 | 23.99 ± 1.62 | 24.37 ± 1.21 | 8.15 ± 0.51 |
| 6 days (a) | 0.33 ± 0.01 | 0.82 ± 0.02 | 0.24 ± 0.03 | 0.24 ± 0.02 | 0.96 ± 0.07 | 17.84 ± 0.43 | 18.64 ± 0.95 | 6.02 ± 0.14 | |
| 9 days (a) | 0.41 ± 0.02 | 0.86 ± 0.03 | 0.14 ± 0.01 | 0.41 ± 0.04 | 0.96 ± 0.07 | 11.56 ± 0.22 | 13.68 ± 0.37 | 4.00 ± 0.10 | |
| 10 days (a) | 0.48 ± 0.04 | 0.86 ± 0.03 | 0.11 ± 0.01 | 0.46 ± 0.03 | 0.96 ± 0.06 | 5.90 ± 0.01 | 9.89 ± 0.12 | 2.64 ± 0.04 | |
| Ph | 2 days (a) | 0.48 ± 0.02 | 0.91 ± 0.03 | 0.20 ± 0.01 | 1.67 ± 0.02 | 0.77 ± 0.03 | 71.11 ± 3.22 | 80.27 ± 3.88 | 24.49 ± 1.58 |
| 6 days (b) | - | - | - | 5.44 ± 0.07 | 0.92 ± 0.02 | 11.65 ± 0.34 | 20.07 ± 1.07 | 17.17 ± 0.64 | |
| Si | 9 days (b) | - | - | - | 10.20 ± 0.09 | 0.93 ± 0.03 | 1.96 ± 0.03 | 5.56 ± 0.23 | 0.92 ± 0.01 |
| 2 days (c) | 0.81 ± 0.04 | 0.99 ± 0.03 | 0.88 ± 0.02 | 1.01 ± 0.02 | 0.72 ± 0.03 | 89.01 ± 6.32 | - | - | |
| 6 days (b) | - | - | - | 5.84 ± 0.16 | 0.90 ± 0.03 | 4.31 ± 0.61 | 5.72 ± 0.19 | 0.68 ± 0.02 | |
| Sample Code | Worn Volume (×10−3 mm3) | Track Width (µm) | Maximum Depth (µm) |
|---|---|---|---|
| Al-15 min | 3.1 ± 0.4 | 322.04 ± 16.57 | 3.13 ± 0.29 |
| Ph-15 min | 7.5 ± 1.1 | 398.52 ± 35.81 | 6.44 ± 0.52 |
| Si-15 min | 63.4 ± 5.1 | 579.80 ± 47.11 | 33.17 ± 2.01 |
| Al-30 min | 7.6 ± 0.8 | 413.72 ± 21.33 | 8.84 ± 0.32 |
| Ph-30 min | 33.9 ± 2.9 | 514.05 ± 28.50 | 13.83 ± 0.50 |
| Al-60 min | 13.4 ± 2.4 | 503.84 ± 33.31 | 12.43 ± 0.48 |
| Ph-60 min | 117.9 ± 12.6 | 842.19 ± 46.21 | 31.42 ± 1.33 |
© 2020 by the authors. Licensee MDPI, Basel, Switzerland. This article is an open access article distributed under the terms and conditions of the Creative Commons Attribution (CC BY) license (http://creativecommons.org/licenses/by/4.0/).
Share and Cite
Toulabifard, A.; Rahmati, M.; Raeissi, K.; Hakimizad, A.; Santamaria, M. The Effect of Electrolytic Solution Composition on the Structure, Corrosion, and Wear Resistance of PEO Coatings on AZ31 Magnesium Alloy. Coatings 2020, 10, 937. https://doi.org/10.3390/coatings10100937
Toulabifard A, Rahmati M, Raeissi K, Hakimizad A, Santamaria M. The Effect of Electrolytic Solution Composition on the Structure, Corrosion, and Wear Resistance of PEO Coatings on AZ31 Magnesium Alloy. Coatings. 2020; 10(10):937. https://doi.org/10.3390/coatings10100937
Chicago/Turabian StyleToulabifard, Amirhossein, Maryam Rahmati, Keyvan Raeissi, Amin Hakimizad, and Monica Santamaria. 2020. "The Effect of Electrolytic Solution Composition on the Structure, Corrosion, and Wear Resistance of PEO Coatings on AZ31 Magnesium Alloy" Coatings 10, no. 10: 937. https://doi.org/10.3390/coatings10100937