Article

Pressure-Induced Deformation of Pillar-Type Profiled Membranes and Its Effects on Flow and Mass Transfer

1
Dipartimento di Ingegneria, Università degli Studi di Palermo, viale delle Scienze Ed. 6, 90128 Palermo, Italy
2
Department of Mathematical Sciences, University of Liverpool, Liverpool L69 7ZL, UK
*
Author to whom correspondence should be addressed.
Computation 2019, 7(2), 32; https://doi.org/10.3390/computation7020032
Submission received: 29 May 2019 / Revised: 14 June 2019 / Accepted: 17 June 2019 / Published: 19 June 2019

Abstract

:
In electro-membrane processes, a pressure difference may arise between solutions flowing in alternate channels. This transmembrane pressure (TMP) causes a deformation of the membranes and of the fluid compartments. This, in turn, affects pressure losses and mass transfer rates with respect to undeformed conditions and may result in uneven flow rate and mass flux distributions. These phenomena were analyzed here for round pillar-type profiled membranes by integrated mechanical and fluid dynamics simulations. The analysis involved three steps: (1) A conservatively large value of TMP was imposed, and mechanical simulations were performed to identify the geometry with the minimum pillar density still able to withstand this TMP without collapsing (i.e., without exhibiting contacts between opposite membranes); (2) the geometry thus identified was subject to expansion and compression conditions in a TMP interval including the values expected in practical applications, and for each TMP, the corresponding deformed configuration was predicted; and (3) for each computed deformed configuration, flow and mass transfer were predicted by computational fluid dynamics. Membrane deformation was found to have important effects; friction and mass transfer coefficients generally increased in compressed channels and decreased in expanded channels, while a more complex behavior was obtained for mass transfer coefficients.

Graphical Abstract

1. Introduction

In electro-membrane processes such as electrodialysis (ED) [1] and reverse electrodialysis (RED) [2], performance predictions are usually based on simulation models or empirical correlations in which the geometric configurations of the solution-filled channels and of the ion exchange membranes are assumed to be the nominal (undeformed) one [3,4,5].
However, since ion exchange membranes are usually thin (~102 µm) and have a low stiffness (Young modulus 101–103 MPa), they may undergo significant deformations if even small transmembrane pressures (TMP) of the order of 10−1 bar are applied. Such values of TMP commonly arise in real stacks due to different frictional pressure drops in the two channels or to other causes, depending also on the flow arrangement selected (e.g., parallel flow yields the lowest TMP and counter flow the highest). In fact, a review of the literature on different membrane-based processes shows that the effects of membrane/channel deformation and their relevance have been detected in the context of different processes: forward osmosis and pressure assisted osmosis [6], pressure retarded osmosis [7], reverse osmosis [8], liquid-to-air membrane energy exchanger [9], proton exchange membrane fuel cells [10,11], and membrane microcontactors [12]. Time-dependent membrane deformation has recently been considered as a possible means to improve process performances in the “breathing cell” concept for reverse electrodialysis systems [13]. Nevertheless, experiments, models, and simulations concerning fluid–structure interactions and its effects are still few, especially for electro-membrane processes such as ED and RED.
Recently, several research groups have addressed self-distancing profiled membranes, which are a promising alternative to conventional flat membranes supported by net spacers [14,15,16,17,18,19].
In a recent paper [20], we presented integrated mechanical and fluid dynamics simulations of an electro-membrane system representative of electrodialysis or reverse electrodialysis, aimed at assessing the influence of transmembrane pressures on membrane/channel deformation and thus on pressure drop and mass transfer. The study was focused on profiled membranes of the “overlapped crossed filaments” (OCF) type, which bear on both sides straight ridges of a semicircular cross section and are piled on top of one another at a right angle.
In the present work, we extend the study to profiled membranes of the “round pillar” (RP) type, which bear on one side flat cylindrical protrusions. As shown in Figure 1, the pillars were assumed to be arranged in a regular hexagonal lattice (α = 60°) with a pitch (normal distance between adjacent pillar rows) P. The pillar diameter was fixed to five times the channel thickness H, while the P/H ratio was made to vary. Of course, other configurations, e.g., a square lattice one, are possible.

2. Materials and Methods

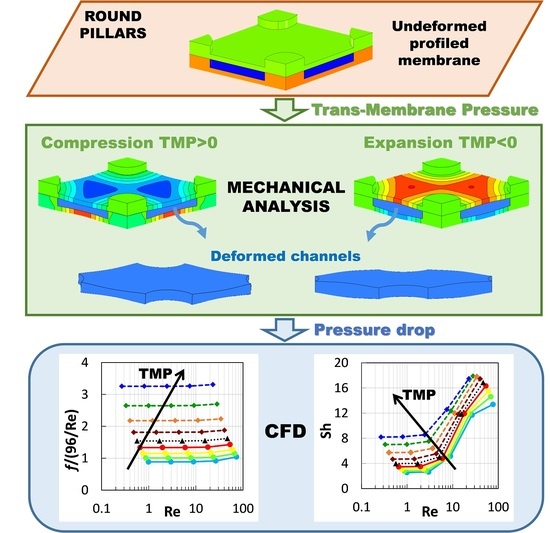
2.1. Computational Strategy

In this study, as in our previous work on OCF membranes, the first step was to identify the maximum P/H ratio above which a given (TMP)max causes the first contact between opposite membranes. The value of 0.8 bar was chosen for (TMP)max as conservatively larger than the highest TMP realistically expected in real RED-ED applications. Note that actual electro-membrane systems will operate at lower trans-membrane pressures (0.05–0.2 bar), since, at a higher TMP, leakage and partial mixing of the solutions may occur.
For the geometry which was identified by the above criterion (characterized by P/H = 10 for the chosen values of geometric and mechanical parameters), a deformation was predicted for TMP varying in steps from −0.4 bar (expansion) to +0.4 bar (compression). This range includes most of the conditions which are likely to occur in ED-RED applications.
Finally, for each expanded or compressed configuration of the selected geometry (P/H = 10), fluid flow and mass transfer in the channels were numerically simulated by computational fluid dynamics (CFD). In particular, quantities such as the friction coefficient, the Sherwood number, and the wall concentration distribution were computed as functions of the Reynolds number.

2.2. Mechanical Model

The computational domain for the mechanical simulations was the unit cell shown in the central inset of Figure 1 and enlarged in Figure 2. The geometric and mechanical parameters are summarized in Table 1.
Cation and anion exchange membranes were treated as identical linearly elastic, homogeneous, and isotropic media. The values reported in Table 1 for the membranes’ Young modulus (E) and Poisson ratio (ν) are intermediate among literature data for ion exchange membranes, which range broadly from 10 to 1000 MPa for E and from 0.25 to 0.4 for ν [21,22,23,24,25,26]. The linearly elastic hypothesis is acceptable under the moderate load conditions considered here: for TMP = ±0.4 bar, the maximum computed von Mises stress is ~2 MPa, below the limiting stress for a linearly elastic behavior as indicated by uniaxial tensile tests (see the Supplementary Material in Reference [20]). Also, the geometric parameters are representative of advanced membrane–channel configurations currently being considered for ED and RED applications [27,28]. The channel thickness H ranges usually from ~0.1 to ~0.4 mm in RED applications [28], while a larger thickness is typically adopted in ED units, i.e., from ~0.3 to ~2 mm, especially in commercial stacks [1]. However, several recent researches on ED modelling and experiments have been focused on the use of thin spacers [29,30,31]. Therefore, the value of 200 μm adopted in the present study can be considered representative of both RED and ED applications. Profiles of adjacent membranes were assumed to be aligned on top of one another. In practice, this arrangement may not be precisely achieved since, in operation, shifts would likely occur.
We stress once again that all the values reported above for the geometrical parameters and the mechanical properties are realistic, representative values, rather than actual measured, exact properties of specific commercial membranes. All these properties are assumed to hold for swollen membranes because this is the actual condition under which membranes find themselves in a real operating ED/RED stack.
Equilibrium, compatibility, and constitutive equations were numerically solved by using an FE method in order to find the deformed configuration of the body [20]. The small deformation approximation was not used. With reference to Figure 2, the mechanical boundary conditions were the following:
  • The four external vertical edges of the domain were clamped, i.e., zero displacement and zero rotation were imposed.
  • The four side faces of the domain were imposed zero normal displacement so that the computational domain was representative of a periodic array of repetitive units.
  • The transmembrane pressure relative to that of the internal fluid channel (and thus >0 for compression and <0 for expansion) was applied to the whole outer surface of the domain.
The simulations were conducted by the Finite Element code Ansys-Mechanical®. A detail of the FE mesh, which was completely hexahedral and block-structured, is shown in Figure 2.
A grid dependence study was preliminarily conducted by comparing the maximum displacement at the outer surface of the domain for TMP = 0.8 bar and P/H = 10 (Table 2).
From these results, the computational mesh of 6 × 10⁴ elements (RP-II) was chosen as a compromise between accuracy and computational effort. The same element size was adopted in all following simulations.
In our previous work [20], FE simulations were validated by a comparison with the authors’ own bulge test results, obtained for 10 × 10 cm2 samples of real ion exchange membranes, and with analytical solutions presented by Iyengar and Naqvi [32] for the deformation of a square elastic body loaded with a uniform pressure and having all the edges clamped. A good agreement was demonstrated, with discrepancies of only a few percent in the maximum displacement.

2.3. CFD Model

The generic fluid channel was simulated by CFD in different deformation conditions. The “unit cell” approach, described in detail in previous papers [20,33], was adopted in order to predict fluid dynamics and mass transfer. Thus, the steady-state continuity, momentum, and mass transport equations for a Newtonian fluid were written as
u i x i = 0
ρ u j u i x j = p ˜ x i + x j μ u i x j + K p s i
u j c ˜ x j = x j D c ˜ x j K c u s
where ui is the ith velocity component, p ˜ is the periodic component of pressure, Kp = |dp/ds| is the pressure loss per unit length, c ˜ is the periodic component of concentration, Kc is the bulk concentration variation per unit length, si is the ith component of the unit vector s directed along the main flow direction, and us = u·s is the local velocity component along the same direction.
The (constant) values chosen for the physical properties of the fluid, representative of an aqueous solution of NaCl at a bulk concentration of 500 mol/m3 (i.e., seawater), are reported in Table 3.
As in previous works on undeformed spacer-filled channels or profiled membranes [5,20,33], the bulk Reynolds number Re was defined on the basis of the approach or superficial velocity U and of the hydraulic diameter 2H of a void plane channel of thickness H and indefinite width:
Re = ρ U 2 H μ
Consistently, the Darcy friction coefficient f was defined as follows:
f = K p 4 H ρ U 2
The driving pressure gradient Kp in Equation (2) was imposed in the simulations, while U and Re were computed as parts of the solution. Note that Kp is related to the friction velocity Reynolds number:
Re τ = u τ ρ μ H 2
where uτ is the friction velocity:
u τ = H 2 ρ | d p d s |
In order to highlight the effects of channel deformation, the Darcy friction coefficient was normalized by that holding for parallel flow in a void plane channel of indefinite width, 96/Re, thus obtaining the dimensionless quantity (F-ratio):
F = f 96 / Re
The local concentration polarization coefficient θ was defined as
θ = c b c w
where cb is the molar bulk concentration and cw is the local molar concentration at the membrane surface. In the present simulations, the electrolyte flux is supposed to be into the fluid (i.e., the channel represents either a concentrate channel in ED or a dilute channel in RED); therefore, the average polarization coefficient is lower than 1 [5,33]. Finally, the Sherwood number was defined as
S h = k 2 H D = j A ( c b c w ) A p r o j 2 H D
where k is the mass transfer coefficient, j is the molar salt flux at walls (imposed in the simulations), A is the membrane surface active area, Aproj is the projected membrane surface area, and 〈cw〉 is the area average of cw on the same membrane. In the present geometry, the distributions of wall concentration and, therefore, the Sherwood numbers, are practically identical on the upper and lower walls of a channel.
As required by the “unit cell” approach, translational periodicity was imposed for u, p, and c between opposite inlet–outlet boundaries. No slip conditions were assumed for velocity at the membrane surfaces. A uniform value of 2.6 × 10⁻⁴ mol/(m2s) was imposed for the molar salt flux j entering the fluid, corresponding to an electrical current density of 50 A/m2. The molar flux was imposed to be null at the cylindrical side surfaces of the round pillars; mass transfer results do not significantly change if these surfaces are imposed the same molar flux as in the rest of the membranes. Note that the values adopted for bulk concentration, solution properties, and salt flux affect the values computed for the polarization coefficient (Equation (9)) while the Sherwood numbers depend only on geometry, Re, and Sc.
For the flow attack angle γ, shown in Figure 1, the three values 0° (flow parallel to the longer diagonal), 30° (flow parallel to two of the sides), and 90° (flow parallel to the shorter diagonal) were analysed, changing the direction s of the applied pressure gradient Kp.
Almost completely hexahedral meshes were adopted in the CFD simulations. Only a minimal fraction (~0.23%) of the volumes were wedges. Grid dependence was evaluated for P/H = 10 in the undeformed configuration at Reτ ≈ 5, corresponding to a bulk Reynolds number of ~30, well above the creeping flow range and close to the highest Reynolds numbers investigated. The results are shown in Table 4, where the computed values of f and Sh are reported as functions of the number of finite volumes.
The mesh selected for the final simulations (RP-B) consisted of ~4 million volumes and 40 divisions along the channel height H. Details of the mesh are shown in Figure 3. Further computational options are basically identical to those adopted for our previous study on OCF profiles [20]. The CFD model was implemented by the finite volume code Ansys-CFX®.

3. Results and Discussion

3.1. Mechanical Simulations

3.1.1. Influence of Pitch to Height ratio (P/H) and Limiting Value

The computational results for the deformation of RP-type cells under TMP = +0.8 bar are presented in Figure 4, in which three values of P/H are considered (9, 10, and 11). The first contact between the two membranes approximately occurs for P/H = 11 at two points located on the long diagonal of the unit diamond somewhere in between the central point and the pillars, symmetrically with respect to the short diagonal. The immediately lower value of P/H = 10 was thus selected as the largest admissible one.

3.1.2. Membrane and Channel Deformation for the Selected Geometry (P/H = 10)

The RP geometry with the maximum admissible P/H ratio (10) was now investigated under TMP varying in steps of 0.1 bar from −0.4 bar (expansion) to +0.4 bar (compression). For example, Figure 5 presents the deformed configurations calculated for TMP = ±0.4 bar.
Under compression, the minimum clearance occurs at two points with the maximum displacement located on the long diagonal of the unit diamond symmetrically with respect to the short diagonal. It amounts to ~128 μm, corresponding to a vertical displacement of ~36 μm for each membrane. Under expansion, the maximum intermembrane distance increases to ~268 μm (vertical displacement ≈34 μm for each membrane).
Figure 6 presents the dependence of the fluid volume (normalized by its undeformed value) upon TMP. A slight deviation from a perfectly symmetric behavior can be observed: The volume decreases by 22.7% for TMP = +0.4 bar and increases by 21% for TMP = −0.4 bar.

3.2. CFD Simulations for the Selected Geometry (P/H = 10)

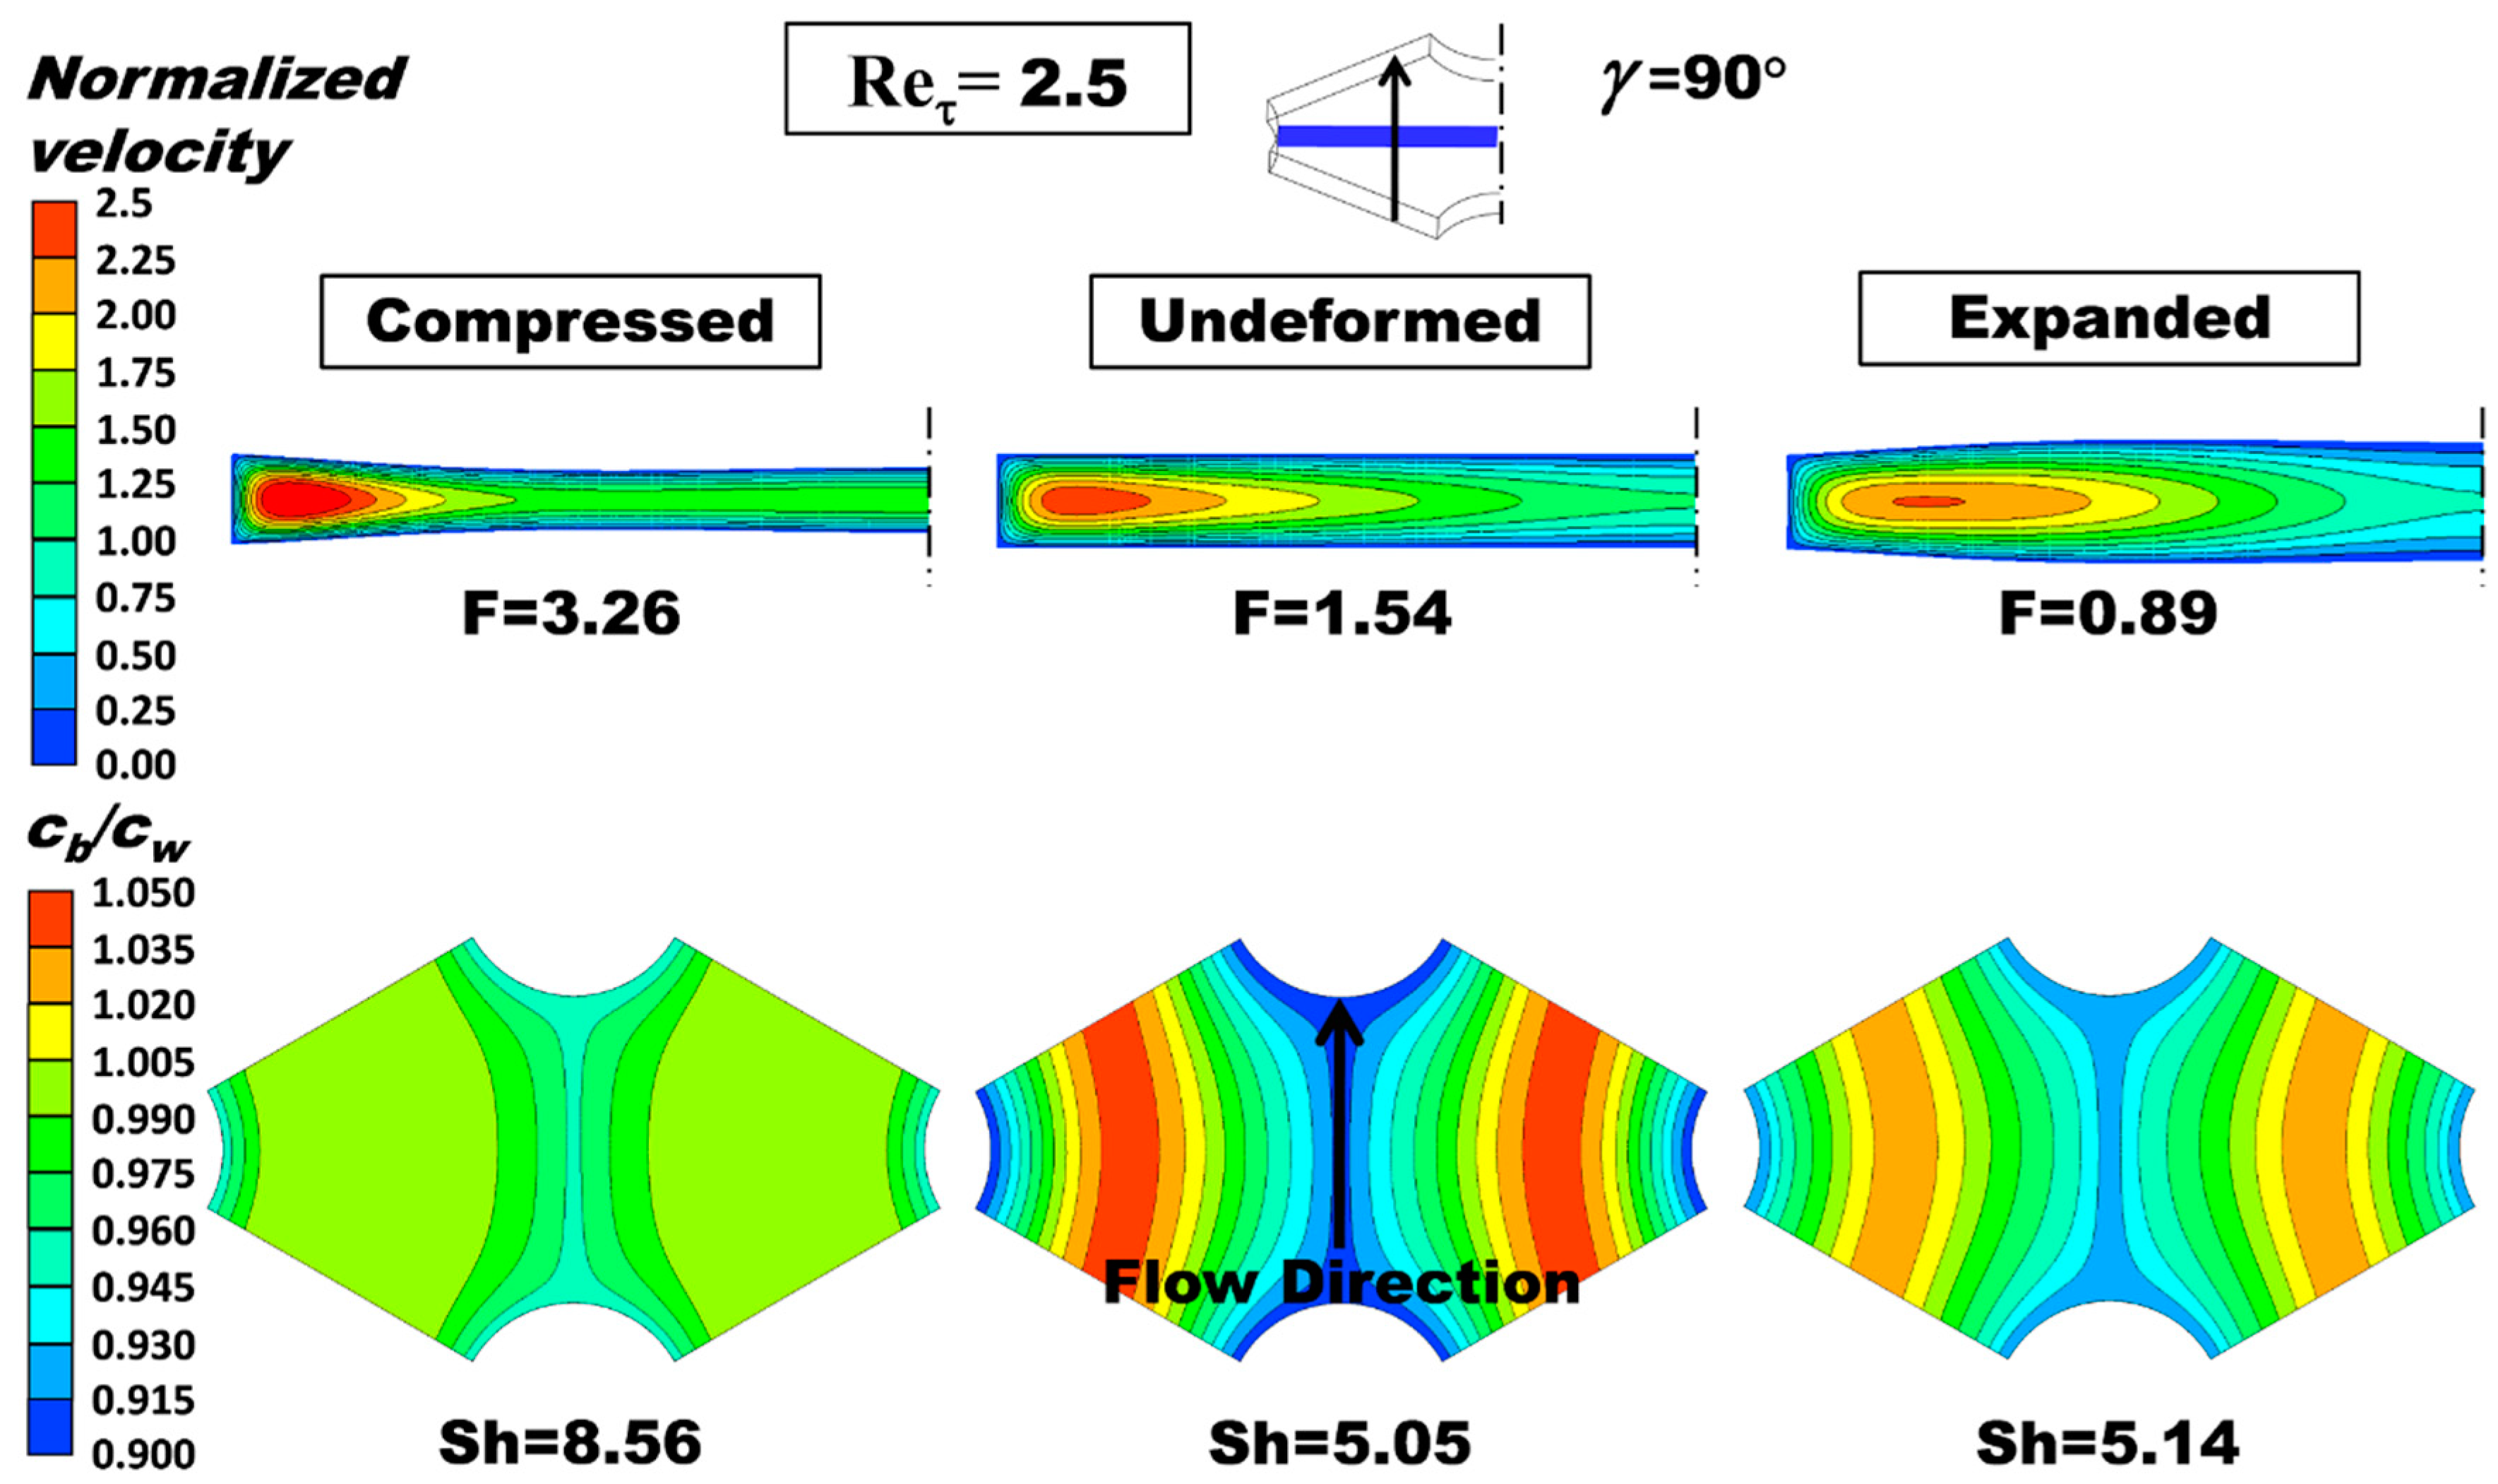
3.2.1. Local Quantities

Figure 7 shows 3-D streamlines and distributions of the polarization coefficient θ for the P/H = 10 undeformed configuration at a friction velocity Reynolds number of 2.5 (the resulting bulk Reynolds number was Re = 5.1) and all three flow attack angles investigated (γ = 0°, 30°, and 90°). The flow direction is shown in the top row.
The streamlines show that the flow is regular at this low value of Re. In the cases γ = 0° and γ = 90°, the streamlines were shown in different colors according to the face from which they entered the fluid domain; the graphs show that there is essentially no mixing between the two inlet streams, as expected. In regard to the maps of θ = cb/cw (bottom row), it should be observed that the distributions of all quantities on the upper and lower walls are identical due to symmetry reasons and to the boundary conditions adopted. The comparison of the θ maps relevant to the three angles investigated shows that the case of γ = 0° provides a fairly uniform distribution of the wall salt concentration while, for γ = 90°, the wall concentration is strongly nonuniform in the lateral (spanwise) direction and becomes lower than the bulk concentration in two curved regions, symmetrically located about the flow direction, despite the net overall salt flux being into the channel. The case of γ = 30° exhibits a nonuniform distribution, with one S-shaped central region characterized by large values of θ. The significant nonuniformity of the polarization coefficient maps exhibited by the cases with flow attack angles of γ = 30° and γ = 90° are associated to inhomogeneous distributions of the fluid velocity. The occurrence of marked stagnant regions and restricted zones with a high fluid velocity results in uneven θ distributions.
Figure 8 illustrates an example of the effect of the deformation on flow and mass transfer. The cases at Reτ = 2.5 and γ = 90° (flow parallel to the shorter diagonal of the unit rhombus) are shown, as evidenced in the inset. Only the undeformed (middle column, Re = 5.1), the most compressed (TMP = +0.4 bar, left column, Re = 2.4), and the most expanded (TMP = −0.4 bar, right column, Re = 8.9) configurations are examined.
The top row reports contour plots of the velocity component along the main flow direction in the central cross section of the channel (for symmetry reasons, only the left half of this section is shown), while the bottom row reports contour plots of the polarization coefficient θ = cb/cw on either of the walls of the fluid-filled channel (see the above discussion on the symmetry between the upper and lower walls). The corresponding values of the normalized Darcy friction coefficient (F ratio) and of the Sherwood number are also indicated.
In the central cross section, the maximum values of the normalized axial velocity component occur approximatively in the same region in all the three configurations examined, close to the lateral pillars, but exhibit larger values going from the expanded channel to the undeformed and the compressed ones. It can be observed that the F ratio increases more than twice (from ~1.54 to ~3.26) with compression and decreases but less markedly (from ~1.54 to ~0.89) with expansion. The Sherwood number increases by 70% (from ~5.05 to ~8.56) with compression and increases slightly (from ~5.05 to ~5.14) with expansion. Distributions of θ become much more uniform with compression and only slightly more uniform with expansion.

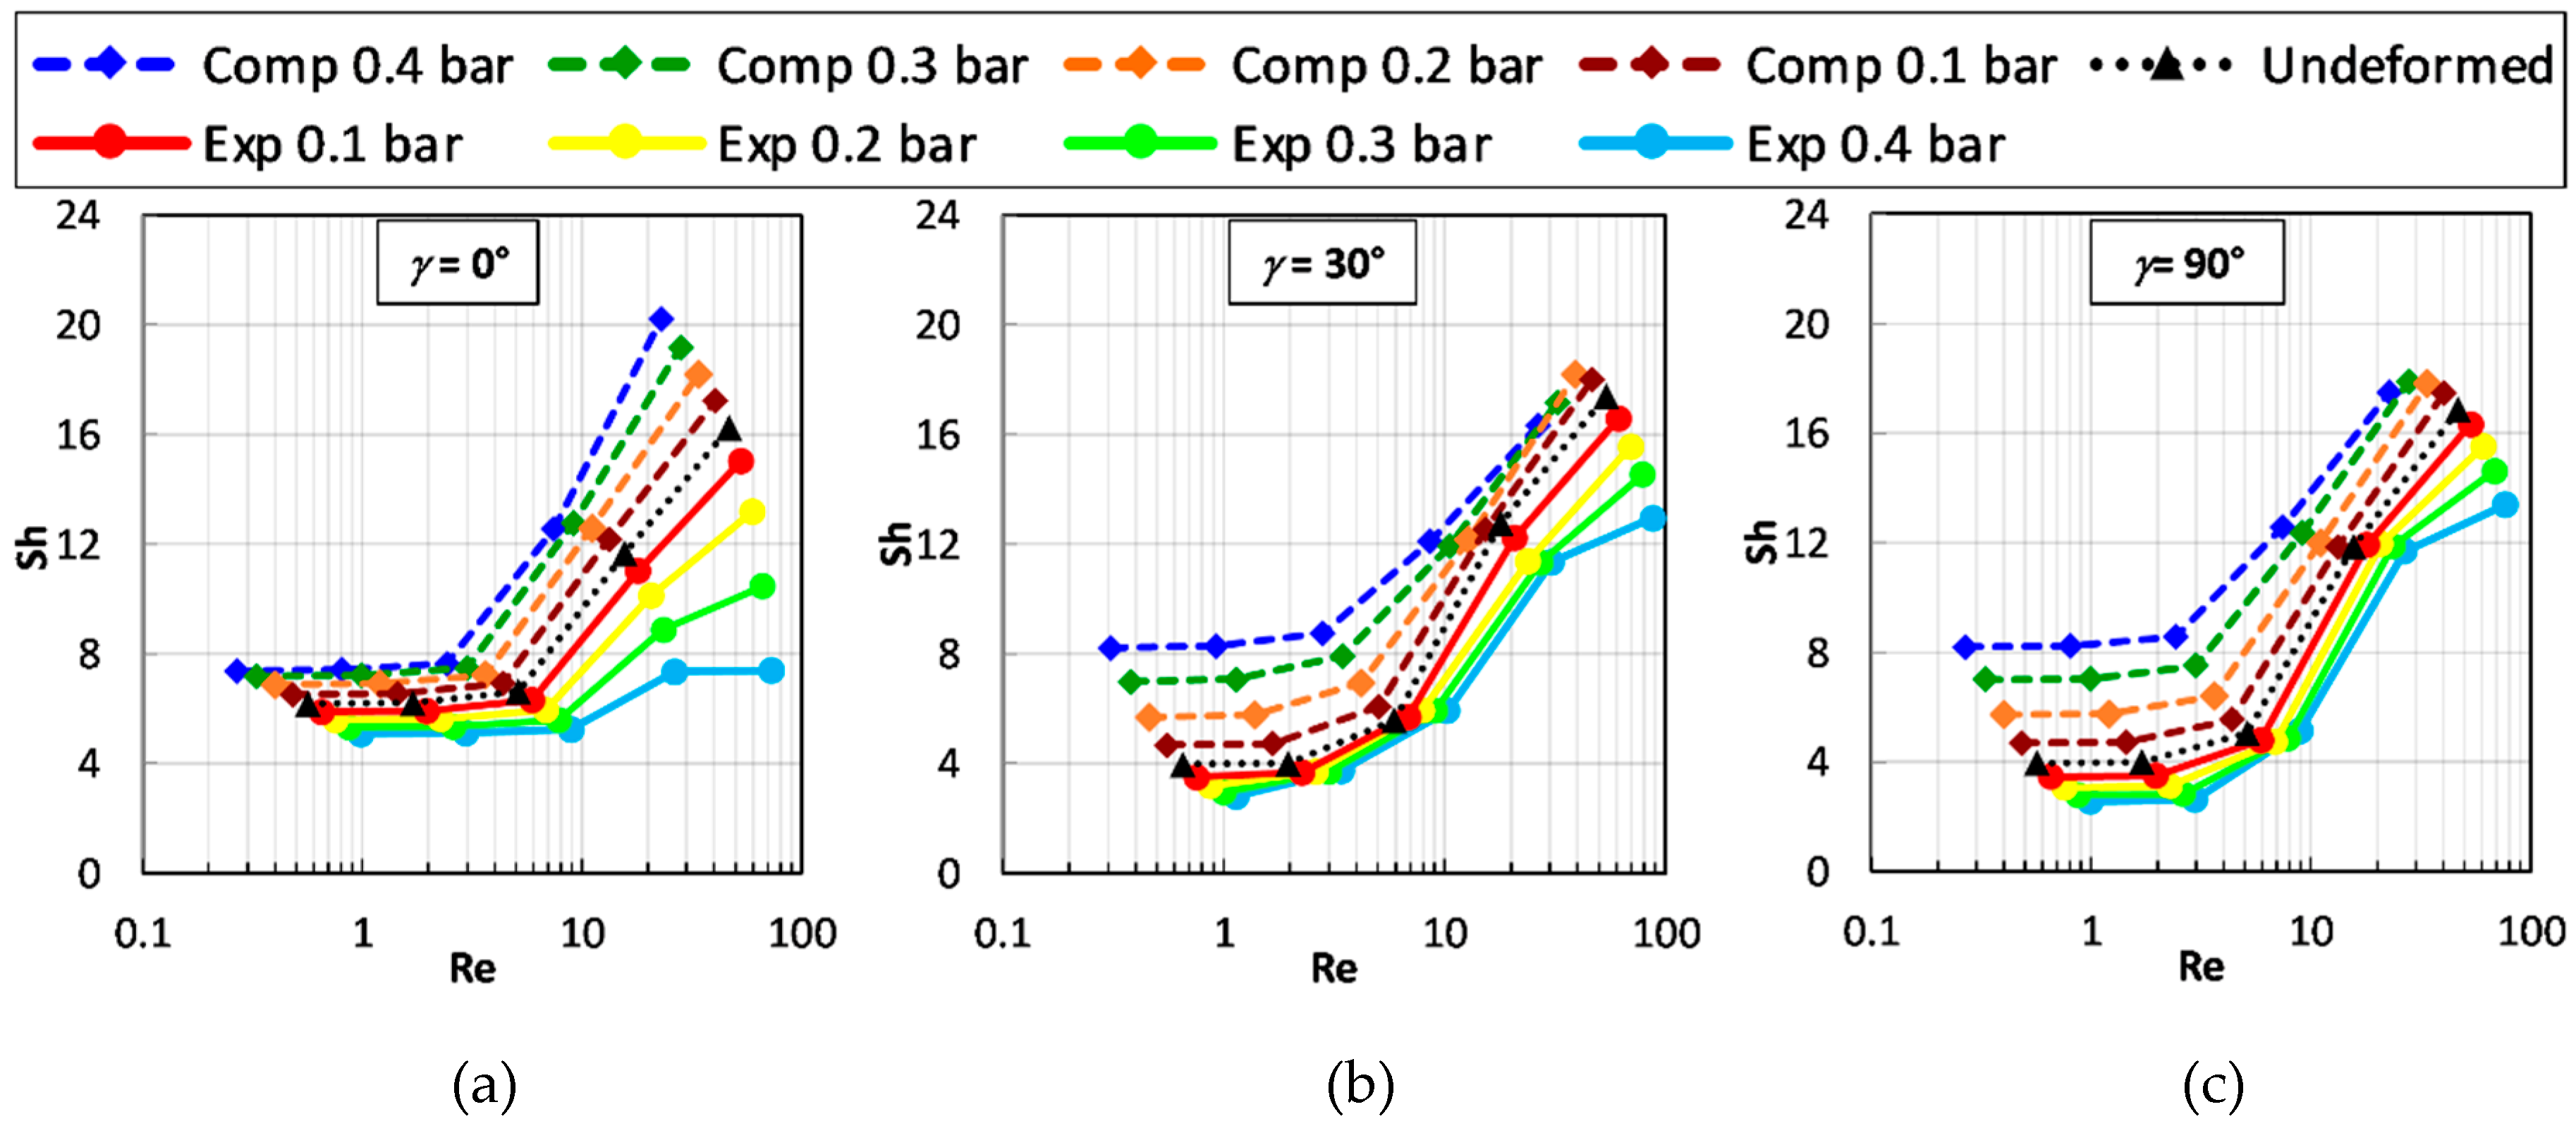
3.2.2. Global Quantities

The normalized Darcy friction coefficient, i.e., the F ratio as defined by Equation (8), is reported as a function of the Reynolds number for different values of TMP in Figure 9. The graph of Figure 9a is for a flow attack angle γ of 0°, that of Figure 9b is for γ = 30°, and that of Figure 9c is for γ = 90° (see Figure 1 for the definition of γ). Note that the results of the simulations conducted at a given Reτ are aligned along a curved row since they correspond to different values of Re.
For any applied TMP and γ, F remains practically constant with Re up to Re ≈ 10–20, which indicates that, in this range, inertial effects are negligible and that the flow is self-similar. A marked departure from the void channel behavior occurs only for Re > 20. The influence of trans-membrane pressure is to enhance friction under compression conditions and to reduce it (but to a lesser extent) under expansion conditions. For example, a value of TMP of +0.4 bar leads to a more than twofold increase in F, while a value of −0.4 bar leads only to a 40% decrease. In the range of Re investigated, the flow attack angle does not influence the hydraulic friction (i.e., the graphs of Figure 9a–c are practically identical), indicating a substantially isotropic behavior of the profiled membrane lattice for the pressure drop.
Figure 10 reports the Sherwood number on either of the channel walls, defined by Equation (10), as a function of the Reynolds number for different values of TMP. The graphs of Figure 10a–c are for flow attack angles γ of 0°, 30°, and 90°, respectively. As already stated, the Sherwood numbers on the upper and lower walls are practically identical for symmetry reasons.
At the left end of the Re interval investigated (up to a few units), Sh changes little with Re and ranges between ~3 and ~8, thus being lower than the theoretical Sh for a void plane channel of indefinite width (~8.24 under uniform mass flux conditions). These results suggest that, in this low Re range, the “shadow” effect of the profiles hinders mass transfer. On the other hand, for a Re larger than a few units, Sh increases significantly. Only in the most expanded configurations (TMP = −0.3 and −0.4 bar), the increase of Sh with Re is less marked, especially for γ = 0°.
In regard to the influence of the transmembrane pressure, for all flow attack angles, Sh increases with compression and decreases with expansion; the influence of compression is larger than the influence of expansion at low Reynolds numbers, while the opposite is true at a higher Re. For γ = 0°, the reduction of Sh caused by expansion at a high Re is particularly significant. The behaviours of Sh for γ = 30° and 90° are less sensitive to TMP and are similar to each other. Unlike the case of the F ratio, the flow attack angle affects the Sherwood number at any Re.

3.2.3. Comparison with OCF Profiled Membranes

As it has been widely debated in the literature, spacer or built-in profile features markedly affect the RED and ED processes’ performances. In this regard, a comparison of the influence of TMP on the present RP profiled membranes and on the Overlapped Cross Filament (OCF) profiled membranes studied in our previous work [20] is reported in Table 5. The approach velocity, Darcy friction factor, and mass transport coefficient for both the upper and lower walls are listed for a flow attack angle of γ = 90° and Reτ = 2.5. The definition of γ for the two geometries is reported in Figure 1 of the present work and of Reference [20]. Note that, for each configuration, the P/H ratio considered is the largest admissible, i.e., withstanding the TMP value of 0.8 bar without collapsing.
In the undeformed configuration, the RP arrangement exhibits lower friction coefficients than the OCF one. As TMP varies, the friction coefficient varies slightly less than in the OCF arrangement.
In regard to the mass transport properties, in the undeformed configuration, the RP arrangement exhibits mass transport coefficients k similar to the OCF. Under compression, the k coefficients increase more than in the OCF; under expansion, they remain almost unchanged while in the OCF k varies in a complex way (increasing on the upper wall and decreasing on the lower one).

4. Conclusions

Integrated mechanical and fluid dynamics simulations were performed for channels bounded by “round pillar” (RP) profiled membranes, characterized by the presence of round pillar protrusions arranged in a regular hexagonal lattice.
The membranes were treated as linearly elastic, homogeneous, and isotropic, and representative values of the Young modulus and of the Poisson ratio (E = 150 MPa, ν = 0.4) were adopted. Characteristics values of real electrodialysis or reverse electrodialysis stacks were also adopted for channel (i.e., profile) thickness, membrane thickness, and other relevant quantities. Under these assumptions, the largest value of the pitch-to-height ratio withstanding a transmembrane pressure of 0.8 bar without collapsing was found to be P/H = 10.
CFD simulations showed that the transmembrane pressure enhances friction under compression conditions and reduces it (but to a lesser extent) under expansion conditions and that the flow attack angle has negligible effects. For all flow attack angles, Sh increases with compression and decreases with expansion; the influence of compression is larger than the influence of expansion at a low Reynolds number, while the opposite is true at a higher Re. For a flow attack angle of 0° (flow parallel to the longer diagonal of the unit rhombus), the reduction of Sh caused by expansion at a high Re is particularly significant. The behaviors of Sh for γ = 30° and 90° are less sensitive to TMP and are similar to each other.
As mentioned in Section 2.2, the values chosen for the geometrical parameters and the mechanical properties of the membranes are representative values rather than measured properties of specific commercial membranes. These properties are supposed to hold under swollen conditions, as occurring in a real ED/RED stack. In the future, we propose to investigate how the solution concentrations may affect both the dimensional parameters and the mechanical properties of real membranes and to what extent the presence of two solutions at different concentrations on the opposite faces of each membrane may weaken the present homogeneity assumption.
A further extension of the present study will regard the passage from a unit-cell scale to stack scale. In a real ED/RED stack, a spatially nonuniform deformation of the membrane/channel assembly may cause flow maldistribution, which in turn may affect the stack performance. From the present study, correlations for the dependence of deformations on transmembrane pressure and for the dependence of friction coefficients and Sherwood numbers on deformation can be derived. In a study currently in progress, they will be implemented into higher-scale (stack-level) models in order to characterize the amount and effects of maldistribution phenomena.

Author Contributions

Conceptualization, A.C., G.M., and M.C.; methodology, G.B., L.G., G.A.F., and M.C.; software, G.B., L.G., G.A.F., and M.C.; validation, G.B. and A.P.; formal analysis, G.B., L.G., G.A.F., and M.C.; investigation, G.B., L.G., and G.A.F.; resources, A.C., A.P., and G.M.; data curation, G.B. and L.G.; writing—original draft preparation, G.B., L.G., and M.C.; writing—review and editing, G.B., L.G., A.C., and M.C.; visualization, G.B., L.G., and G.A.F.; supervision, A.C., A.P., G.M., and M.C.; project administration, A.C., G.M. and M.C.; funding acquisition, A.C., A.P., and G.M.

Funding

This research was funded by the RED-Heat-to-Power (Conversion of Low-Grade Heat to Power through closed loop Reverse Electro-Dialysis) and REvivED water (Low energy solutions for drinking water production by a REvival of ElectroDialysis systems) projects. These projects have received funding from the European Union’s Horizon 2020 research and innovation programme under Grant Agreements no. 640667 and 685579 (www.red-heat-to-power.eu and www.revivedwater.eu).

Conflicts of Interest

The authors declare no conflict of interest.

References

  1. Campione, A.; Gurreri, L.; Ciofalo, M.; Micale, G.; Tamburini, A.; Cipollina, A. Electrodialysis for water desalination: A critical assessment of recent developments on process fundamentals, models and applications. Desalination 2018, 434, 121–160. [Google Scholar] [CrossRef]
  2. Cipollina, A.; Micale, G.; Tamburini, A.; Tedesco, M.; Gurreri, L.; Veerman, J.; Grasman, S. Reverse electrodialysis: Applications. In Sustainable Energy from Salinity Gradients; Cipollina, A., Micale, G., Eds.; Woodhead Publishing, Elsevier: Amsterdam, The Netherlands, 2016; pp. 135–180. [Google Scholar]
  3. Pawlowski, S.; Geraldes, V.; Crespo, J.G.; Velizarov, S. Computational fluid dynamics (CFD) assisted analysis of profiled membranes performance in reverse electrodialysis. J. Membr. Sci. 2016, 502, 179–190. [Google Scholar] [CrossRef] [Green Version]
  4. Gurreri, L.; Battaglia, G.; Tamburini, A.; Cipollina, A.; Micale, G.; Ciofalo, M. Multi-physical modelling of reverse electrodialysis. Desalination 2017, 423, 52–64. [Google Scholar] [CrossRef] [Green Version]
  5. La Cerva, M.L.; Di Liberto, M.; Gurreri, L.; Tamburini, A.; Cipollina, A.; Micale, G.; Ciofalo, M. Coupling CFD with a one-dimensional model to predict the performance of reverse electrodialysis stacks. J. Membr. Sci. 2017, 541, 595–610. [Google Scholar] [CrossRef] [Green Version]
  6. Lian, B.; Blandin, G.; Leslie, G.; Le-Clech, P. Impact of module design in forward osmosis and pressure assisted osmosis: An experimental and numerical study. Desalination 2017, 426, 108–117. [Google Scholar] [CrossRef]
  7. She, Q.; Hou, D.; Liu, J.; Tan, K.H.; Tang, C.Y. Effect of feed spacer induced membrane deformation on the performance of pressure retarded osmosis (PRO): Implications for PRO process operation. J. Membr. Sci. 2013, 445, 170–182. [Google Scholar] [CrossRef]
  8. Karabelas, A.J.; Koutsou, C.P.; Sioutopoulos, D.C. Comprehensive performance assessment of spacers in spiral-wound membrane modules accounting for compressibility effects. J. Membr. Sci. 2018, 549, 602–615. [Google Scholar] [CrossRef]
  9. Huang, S.M. Laminar flow and heat transfer in plate membrane channels: Effects of the deformation heights. Int. J. Therm. Sci. 2016, 109, 44–53. [Google Scholar] [CrossRef]
  10. Shi, Z.; Wang, X. A numerical study of flow crossover between adjacent flow channels in a proton exchange membrane fuel cell with serpentine flow field. J. Power Sour. 2008, 185, 985–992. [Google Scholar] [CrossRef]
  11. Zhou, Y.; Jiao, K.; Du, Q.; Yin, Y.; Li, X. Gas diffusion layer deformation and its effect on the transport characteristics and performance of proton exchange membrane fuel cell. Int. J. Hydrog. Energy 2013, 38, 12891–12903. [Google Scholar] [CrossRef]
  12. Hereijgers, J.; Ottevaere, H.; Breugelmans, T.; De Malsche, W. Membrane deflection in a flat membrane microcontactor: Experimental study of spacer features. J. Membr. Sci. 2016, 504, 153–161. [Google Scholar] [CrossRef]
  13. Moreno, J.; Slouwerhof, E.; Vermaas, D.A.; Saakes, M.; Nijmeijer, K. The breathing cell: Cyclic intermembrane distance variation in reverse electrodialysis. Environ. Sci. Technol. 2016, 50, 11386–11393. [Google Scholar] [CrossRef] [PubMed]
  14. Tadimeti, J.G.D.; Kurian, V.; Chandra, A.; Chattopadhyay, S. Corrugated membrane surfaces for effective ion transport in electrodialysis. J. Membr. Sci. 2016, 499, 418–428. [Google Scholar] [CrossRef]
  15. Vermaas, D.A.; Saakes, M.; Nijmeijer, K. Power generation using profiled membranes in reverse electrodialysis. J. Membr. Sci. 2011, 385, 234–242. [Google Scholar] [CrossRef]
  16. Vermaas, D.A.; Saakes, M.; Nijmeijer, K. Enhanced mixing in the diffusive boundary layer for energy generation in reverse electrodialysis. J. Membr. Sci. 2014, 453, 312–319. [Google Scholar] [CrossRef]
  17. Güler, E.; Elizen, R.; Saakes, M.; Nijmeijer, K. Micro-structured membranes for electricity generation by reverse electrodialysis. J. Membr. Sci. 2014, 458, 136–148. [Google Scholar] [CrossRef]
  18. Pawlowski, S.; Rijnaarts, T.; Saakes, M.; Nijmeijer, K.; Crespo, J.G.; Velizarov, S. Improved fluid mixing and power density in reverse electrodialysis stacks with chevron-profiled membranes. J. Membr. Sci. 2017, 531, 111–121. [Google Scholar] [CrossRef]
  19. Larchet, C.; Zabolotsky, V.I.; Pismenskaya, N.; Nikonenko, V.V.; Tskhay, A.; Tastanov, K.; Pourcelly, G. Comparison of different ED stack conceptions when applied for drinking water production from brackish waters. Desalination 2008, 222, 489–496. [Google Scholar] [CrossRef]
  20. Battaglia, G.; Gurreri, L.; Airò Farulla, G.; Cipollina, A.; Pirrotta, A.; Micale, G.; Ciofalo, M. Membrane deformation and its effects on flow and mass transfer in the electromembrane processes. Int. J. Mol. Sci. 2019, 20, 1840. [Google Scholar] [CrossRef] [PubMed]
  21. Bdiri, M.; Dammak, L.; Larchet, C.; Hellal, F.; Porozhnyy, M.; Nevakshenova, E.; Pismenskaya, N.; Nikonenko, V. Characterization and cleaning of anion-exchange membranes used in electrodialysis of polyphenol-containing food industry solutions; comparison with cation-exchange membranes. Sep. Purif. Technol. 2019, 210, 636–650. [Google Scholar] [CrossRef]
  22. Garcia-Vasquez, W.; Dammak, L.; Larchet, C.; Nikonenko, V.; Grande, D. Effects of acid-base cleaning procedure on structure and properties of anion-exchange membranes used in electrodialysis. J. Membr. Sci. 2016, 507, 12–23. [Google Scholar] [CrossRef]
  23. Safronova, E.Y.; Golubenko, D.V.; Shevlyakova, N.V.; D’yakova, M.G.; Tverskoi, V.A.; Dammak, L.; Grande, D.; Yaroslavtsev, A.B. New cation-exchange membranes based on cross-linked sulfonated polystyrene and polyethylene for power generation systems. J. Membr. Sci. 2016, 515, 196–203. [Google Scholar] [CrossRef]
  24. Vandiver, M.A.; Caire, B.R.; Carver, J.R.; Waldrop, K.; Hibbs, M.R.; Varcoe, J.R.; Herring, A.M.; Liberatore, M.W. Mechanical characterization of anion exchange membranes by extensional rheology under controlled hydration. J. Electrochem. Soc. 2014, 161, H677–H683. [Google Scholar] [CrossRef]
  25. Solasi, R.; Zou, Y.; Huang, X.; Reifsnider, K. A time and hydration dependent viscoplastic model for polyelectrolyte membranes in fuel cells. Mech. Time Depend. Mater. 2008, 12, 15–30. [Google Scholar] [CrossRef]
  26. Kusoglu, A.; Karlsson, A.M.; Santare, M.H.; Cleghorn, S.; Johnson, W.B. Mechanical behavior of fuel cell membranes under humidity cycles and effect of swelling anisotropy on the fatigue stresses. J. Power Sour. 2007, 170, 345–358. [Google Scholar] [CrossRef] [Green Version]
  27. Pawlowski, S.; Crespo, J.; Velizarov, S. Profiled ion exchange membranes: A comprehensible review. Int. J. Mol. Sci. 2019, 20, 165. [Google Scholar] [CrossRef] [PubMed]
  28. Tufa, R.A.; Pawlowski, S.; Veerman, J.; Bouzek, K.; Fontananova, E.; di Profio, G.; Velizarov, S.; Goulão Crespo, J.; Nijmeijer, K.; Curcio, E. Progress and prospects in reverse electrodialysis for salinity gradient energy conversion and storage. Appl. Energy 2018, 225, 290–331. [Google Scholar] [CrossRef]
  29. La Cerva, M.; Gurreri, L.; Tedesco, M.; Cipollina, A.; Ciofalo, M.; Tamburini, A.; Micale, G. Determination of limiting current density and current efficiency in electrodialysis units. Desalination 2018, 445, 138–148. [Google Scholar] [CrossRef]
  30. Campione, A.; Cipollina, A.; Bogle, I.D.L.; Gurreri, L.; Tamburini, A.; Tedesco, M.; Micale, G. A hierarchical model for novel schemes of electrodialysis desalination. Desalination 2019, 465, 79–93. [Google Scholar] [CrossRef]
  31. Doornbusch, G.J.; Tedesco, M.; Post, J.W.; Borneman, Z.; Nijmeijer, K. Experimental investigation of multistage electrodialysis for seawater desalination. Desalination 2019, 464, 105–114. [Google Scholar] [CrossRef]
  32. Iyengar, K.T.S.R.; Naqvi, M.M. Large deflections of rectangular plates. Int. J. Non Linear Mech. 1966, 1, 109–122. [Google Scholar] [CrossRef]
  33. Gurreri, L.; Ciofalo, M.; Cipollina, A.; Tamburini, A.; Van Baak, W.; Micale, G. CFD modelling of profiled-membrane channels for reverse electrodialysis. Desalin. Water Treat. 2015, 55, 3404–3423. [Google Scholar] [CrossRef]
Figure 1. Round pillar (RP) profiled membranes: The repetitive unit (periodic cell) of a stack is highlighted on the left and is shown enlarged in the central inset. The geometric parameters H (channel thickness), P (pitch), α (intrinsic angle), and γ (flow attack angle) are indicated.
Computation 07 00032 g001
Figure 2. Computational domain: A detailed image of the Finite Element computational mesh is also shown.
Computation 07 00032 g002
Figure 3. Of the mesh chosen for the final simulations (undeformed domain, P/H = 10).
Computation 07 00032 g003
Figure 4. Deformations for different P/H ratios under TMP = +0.8 bar. The quantity shown is the displacement in the direction orthogonal to the undeformed membranes. Top: external view; bottom: view after sectioning by a diagonal plane AA.
Computation 07 00032 g004
Figure 5. Deformations for P/H = 10 in both the compressed and the expanded cases at TMP = ±0.4 bar. The quantity shown is the displacement in the direction orthogonal to the undeformed membranes. The corresponding deformed configuration of the fluid volume is shown in the insets on the right.
Computation 07 00032 g005
Figure 6. Volume (normalized by the undeformed value) as a function of the transmembrane pressure for P/H=10.
Computation 07 00032 g006
Figure 7. Illustrating the flow direction (top row), 3-D streamlines (middle row), and maps of the concentration polarization coefficient θ = cb/cw on either of the walls (bottom row) for the P/H = 10 undeformed configuration and a friction velocity Reynolds number of 2.5 (Re = 5.1). cb = 500 mol/m3, flux corresponding to a current density of 50 A/m2 entering the fluid domain (dilute channel of a reverse electrodialysis (RED) or concentrate channel of an electrodialysis (ED)).
Computation 07 00032 g007
Figure 8. Influence of deformation on flow and mass transfer for P/H = 10, γ = 90°, and Reτ = 2.5. Left column: compressed (TMP = +0.4 bar, Re = 2.4); middle column: undeformed (Re = 5.1); right column: expanded (TMP = −0.4 bar, Re = 8.9). Top row: distribution of the streamwise velocity component in the central cross section of the channel (for symmetry reasons, only half map is shown); bottom row: distribution of the polarization coefficient on either of the walls. cb = 500 mol/m3, flux corresponding to a current density of 50 A/m2 entering the fluid domain (dilute channel of RED or a concentrate channel of ED). The F ratio and Sherwood number are also reported.
Computation 07 00032 g008
Figure 9. Darcy friction coefficients (F ratio) for P/H = 10 as a function of the Reynolds number for different values of transmembrane pressure and three values of flow attack angle γ. (a) γ = 0°; (b) γ = 30°; (c) γ = 90°.
Computation 07 00032 g009
Figure 10. Sherwood numbers on either of the walls as a function of the Reynolds number for P/H = 10 at different transmembrane pressures and flow attack angles. (a) γ = 0°; (b) γ = 30°; (c) γ = 90°.
Computation 07 00032 g010
Table 1. Geometrical and mechanical quantities (both sides).
QuantityValueUnits
Membrane Young modulus, E150MPa
Membrane Poisson ratio, ν0.4-
Channel thickness, H 200μm
Membrane thickness, δ120μm
Pitch-to-height ratio, P/H 9–11-
Pillar diameter, d1mm
Intrinsic angle of pillar lattice, α 60deg
Table 2. Grid dependence results for the mechanical simulations (transmembrane pressure (TMP) = +0.8 bar, P/H = 10).
FE MeshNo. ElementsMaximum Displacement (μm)
RP-I21 × 10367.69
RP-II60 × 10367.97
RP-III180 × 10368.06
Table 3. Physical properties of the simulated solution (500 mol/m3 NaCl at 25 °C).
PropertyValueUnits
Density, ρ1017kg m−3
Viscosity, µ0.931 × 10⁻³N s m−2
Salt diffusivity, D1.47 × 10−9m2 s−1
Schmidt number, Sc = µ/(ρD)622-
Table 4. Grid dependence results in CFD (P/H = 10, Reτ = 5, and γ = 90°).
FV MeshNo. Elements fSh
RP-A2.576 × 1066.94113.769
RP-B4.142 × 1066.96513.719
RP-C6.091 × 1066.97613.689
Table 5. Approach velocity, Darcy friction factor, and mass transfer coefficients for the undeformed, +0.4 bar compressed and −0.4 bar expanded configurations for an RP with P/H = 10 and OCF with P/H = 8 [20] geometries with γ = 90° and Reτ = 2.5.
QuantitiesCompressed +0.4 BarUndeformedExpanded −0.4 Bar
RPOCFRPOCFRPOCF
U (cm/s)0.50.41.11.02.02.0
F129.0260.528.943.29.510.3
k (m/s), upper wall 3.2 × 10−52.6 × 10−51.9 × 10−51.9 × 10−51.9 × 10−52.2 × 10−5
k (m/s), lower wall 3.2 × 10−52.6 × 10−51.9 × 10−51.4 × 10−51.9 × 10−51.1 × 10−5

