Aspects of Digitalization and Related Impact on Green Tourism in European Countries
by
 and
and
Andreea Simona Saseanu
1,*, 
Simona Ioana Ghita
2,3,
Irina Albastroiu
1 and
and
Carmen-Alexandra Stoian
4 1
Department of Business, Consumer Sciences and Quality Management, Faculty of Business and Tourism, The Bucharest University of Economic Studies, 010404 Bucharest, Romania
2
Department of Statistics and Econometrics, Faculty of Cybernetics, Statistics and Informatics, The Bucharest University of Economic Studies, 010552 Bucharest, Romania
3
Institute of National Economy, 050711 Bucharest, Romania
4
Accounting Doctoral School, Faculty of Accounting and Management Information Systems, The Bucharest University of Economic Studies, 010404 Bucharest, Romania
*
Author to whom correspondence should be addressed.
Information 2020, 11(11), 507; https://doi.org/10.3390/info11110507
Submission received: 28 September 2020
/
Revised: 27 October 2020
/
Accepted: 27 October 2020
/
Published: 29 October 2020
(This article belongs to the Special Issue Green Marketing)
Abstract
:The digital world requires the implementation of new technologies and customer-driven business transformation. As the tourism sector may experience unanticipated ways of developing new technologies due to the current global health crisis, the standard travel experience could be changed. The main aim of this study was to analyze the influence of digitalization and tourists’ preferences in terms of accommodation and economic well-being implying sustainability. This paper applied a regression analysis and principal component analysis to achieve the above objective. Research exposed the fact that tourists’ preferences towards green destinations and ecological accommodation establishments, as well as Internet use in travel planning, may have a significant influence on the sustainability of tourism. This study identified behavioral models of 30 European countries from the sustainable tourism and digitalization perspective and made recommendations on economic and social policy measures to ensure the sustainable nature of tourism activity.
1. Introduction
Following other sectors of the economy, the tourism industry consists of two main components: the information and the physical part. Currently, the information component capitalizes the highest degree of exploitation in the industry, which has led to greater use of information technologies in this sector—from the internal organization to external communication with third parties [1].
Due to structural reasons, tourism represents a kind of information-based business constituted by the differences of time and space implying the fact that tourists have to travel to the “place of consumption” without being able to test the product in advance; moreover, they have to agree upon the contract before “consuming the product” [2]. Thus, decision-making and consumption are separated in time and space and this can only be overcome by information. Tourism is based on social interaction between supplier and consumer and the quality of this service is mainly defined by it [2]. Nowadays, communication and interaction are facilitated by digital technologies and take place mostly through the Internet. Most travelers often use the Internet for destination-related information to make a decision [3]. Moreover, social media platforms are playing an increasingly important role in the consumer’s decision-making process [4].
The relationship between access to information regarding tourism services, the impact of information technologies, and their online sale-purchase process influenced the digitalization of tourism. Travel agencies, airlines, hotels, and other components of tourism tend to focus their efforts more on building a competitive advantage through the online component of travel services and less on elements related to attributes of physical location and service delivery.
The importance of investing in digitalization is globally recognized. Having technology as a key resource to innovate the business model is becoming more popular in the digital era. Trends in the field of information technology (IT) are forcing companies to become agile and to implement new innovative business models and processes [5], followed by challenges that need to be understood and adjusted based on business strategy and market demand [6].
The purpose of investing in innovative tools or processes is to develop sustainable business, creativity, and prepare for market changes that are going to impact the business [7]. Therefore, tourism companies are beginning to realize their importance and consider it necessary to invest in digital tools as a long-term partnership [8]. Several researchers have reported significant contributions related to digital services as a key tool to improve ongoing operations in tourism [9,10]. Moreover, studies have shown the importance of innovation deployment and the way new technologies enhance the development of new products or services in the tourism sector [11,12,13,14,15,16].
Digital transformation has facilitated the transition to green tourism [17]. In broad terms, green tourism means a tourist’s friendly attitude to the environment or providing tourist-friendly services for the environment. [18]. Digital tools (for example social media, chatbots, and digital assistants) facilitate the prevalence of information on the dimensions of sustainable development in tourism, dissemination of good practices in the field, and promotion of sustainable development objectives within the tourism and hospitality sector.
Although digitalization and sustainability represent critical challenges that have been researched individually or addressed simultaneously within the context of the tourism sector, the generality of much-published research on these issues is controversial, since studies do not have applicability on a specific region. Therefore, this study makes a major contribution to existing research by analyzing the European tourism context. Furthermore, taking into consideration that digital technologies are also relevant in the field of tourism marketing through facilitating the dissemination of information, bringing awareness of sustainability issues, and developing sustainable tourism behavior [19], the authors focused their attention on the interplay between green tourism and digital marketing.
Therefore, the main aim of this study was to clarify several aspects regarding the influence of IT technologies use in planning tourist trips, tourists’ preferences in terms of accommodation, and economic well-being on the sustainable component of tourism. Moreover, this study identified behavioral models of European countries from a sustainable tourism and digitalization perspective and outlines recommendations on economic and social policy measures to ensure the sustainable nature of tourism.
The study contains six chapters, including this introductory part. The first section of this paper examines the importance of the digitization process and its role in the transition to green tourism.
The second part begins by reviewing the main results of specialized studies regarding the interaction of tourism with the digitization process and the natural environment, as well as other factors that have influenced the sustainability of tourism. The literature review section outlines the importance of sustainability within the tourism industry by presenting relevant definitions of sustainable tourism and related concepts. Furthermore, significant previous findings, research gaps, and measurement approaches are introduced within our discussion. In addition, characteristics of relevant indicators for measuring sustainable development in the tourism industry are presented. These represent useful insight for developing the research indicators in the methodology section.
The third chapter concerns the methodology used for this study; therefore, it includes a description of the main data set and the statistical and econometric methods applied.
The fourth section presents the results of research, focusing on two key themes that evaluate the impact of digitalization on the sustainable component of tourism and identify behavioral patterns of European countries from a tourism sustainability, digitalization, and environment perspective.
The fifth and sixth sections of the article include a summary of the findings and discussions on the implication of results to future research in this area.
2. Literature Review
Sustainability has become a central subject of interest of various stakeholders from different business sectors, in the current global economy. The rise of the sustainable business model has emerged. Companies nowadays consider customers, stakeholders, and shareholders when designing their sustainable business model, focusing on generating value for various stakeholders as well as for the environment and society [20].
Tourism, an industry involving complex interactions with the natural system, has shown a high interest in recent decades to ensure sustainable development that minimizes the negative impact on the natural environment. The tourism sector represents a complex ecosystem; it comprises many participants: from physical tourist offices to online service providers: digital platforms, travel agents, tour operators, accommodation suppliers, destination managing organizations, visitor attractions, transport activities, etc. Moreover, this sector has an important place in the EU economy, and it represents an important source of employment [21]. Companies operating in this field should consider its environmental resources as a key aspect of business development to conserve socio-cultural authenticity. Therefore, the tourism sector is constantly looking to update and change how its actors create, capture, and disseminate value. Therefore, defining the business model as a system of interconnected activities is highly relevant for service industries, and in a particular way for the tourism sector, as the companies usually co-produce value with customers through collaborative effort within a business network [22].
According to the United Nations World Tourism Organization [23], three dimensions guarantee long-term sustainability in tourism development: environmental, economic, and socio-cultural sustainability. These dimensions have been the subject of interest in the literature as well [18,24,25,26,27,28]. Likewise, the Global Sustainable Tourism Council (GSTC)—an international body that focuses on developing a broad understanding of sustainable tourism practices and demand for sustainable travel—has developed global criteria for sustainability, for public policy-makers and destination managers, as well as for hotels and tour operators. The group works for identifying opportunities and solutions for the alignment of a greater market potential based on sustainable management and socio-economic, cultural, and environmental impacts [29].
Businesses have generally adopted a broader meaning for green tourism: describing it as a tourism activity operating in an environmentally friendly manner [24], while international organizations have defined the notion in line with the concept of sustainable tourism. In fact, for the World Tourism Organization, green tourism is a form of sustainable tourism characterized by the fact that it involves conservation and protection of nature, the use of local human resources, and the minimization of the negative impact on the natural, cultural, and social environment [23].
In terms of the scientific literature approach, there is evidence of a constant increase of publications related to the sustainable tourism concept, as shown in the bibliometric analysis of tourism research on sustainability conducted between 1987 and 2018 [30]. This subject has been perceived differently over time. For example, Wall [31] perceived it as ‘an instigator of change’, that ‘will involve the forging of new relationships between people and environment’, while Buckley [32] emphasized the importance of sustainability improvements: ‘to improve social and environmental performance across the entire tourism sector, both innovation and adoption are critical’.
The concept of sustainable tourism has been widely debated in the literature. Sarfaraz et al. [33] present 14 different subject areas in which sustainability has been the key point of interest of several studies: paradigm, sustainable business development, market research and economics, policy-making, infrastructure, modeling and planning, rural tourism, environment and crises management, ecosystem and eco-tourism, climate change, ecology, culture and heritage, human resource management, and energy and material saving. Research related to sustainable tourism development has been conducted with the main aim of analyzing practical challenges in specific areas [34,35,36]. Moreover, a large and growing body of literature has investigated sustainable tourism from the policy-making perspective [37,38]. Furthermore, over the last decade, most research in sustainable tourism has emphasized the importance of climate change and many studies have been conducted around this topic [39,40]. Although some research has been carried out on various areas of sustainable tourism, there have been few investigations into Internet use in travel planning and tourists’ preferences towards green destinations. However, there is evidence that using the Internet depends on demographic trends and the level of technology deployment [41].
Due to the multidimensional nature of the sustainable tourism concept, it is recommended for future studies to take into account specific areas and segmented markets [42]. Moreover, previous research suggests there is a need for future studies to focus on the influence of individual perceptions in addressing sustainability concerns [32].
In terms of methodology, various methods have been developed and introduced to measure the sustainability dimension of tourism. On the one hand, surveys have helped authors to examine various aspects of internet use for tourism purposes [43,44]. On the other hand, the use of quantitative methods is a well-established approach, where descriptive statistics are used to illustrate the tourist’s perception of sustainability [41,45,46,47]. Several authors have tried other methods such as developing analytical frameworks based on multicriteria analysis to address climate change mitigation initiatives [48] or the case-study approach [41].
Characteristics of a good indicator for research in sustainable development may be related to its measurability, accessibility, usability and interpretation, verifiability, and replicability. Moreover, the research indicators need to meet the needs and interests of the target audience and to show trends over time. Finally, it should demonstrate its relevance for national or regional policy [49]. White et al. [49] also present a checklist for selecting indicators of sustainability, which can be used as a tool for reviewing indicators as they are developed. The indicators must measure links between the economy, environment, and society and address the carrying capacity of natural, manufactured, social, or human capital.
Factors found to be influencing sustainable business models have been explored in tourism literature. On the one hand, certain studies [24,25,26,27,28] address the issue of green dimensions of tourism, especially in terms of adopting ecological practices and highlight that industry can make an important contribution by improving the quality of the environment. Therefore, several attempts have been made to integrate sustainability in the business model design [50,51,52,53] while others [54,55] have been trying to integrate innovation dimensions within a sustainable business model generating new research opportunities within this literature stream.
On the other hand, other studies [56] indicate there are business organizations in this field that continue to neglect their obligations related to the environment, possibly due to a misunderstanding of the benefits they might obtain or a lack of good practice examples. Tourism is mentioned in literature [57,58,59,60] as a source of environmental damage and pollution, a heavy consumer of scarce resources, and a cause of negative impacts in society. However, due to the digital information revolution, the tourism industry needs to deal with these challenges by applying the principles of sustainable development and adopting emerging digital technologies.
Marketing is one of the tools that can be used in taking active steps to overcome these challenges. Nowadays, people are becoming aware of environmental issues and understand very well that tourism can have a major impact on the ecosystem and natural environment. Comprehensive and reasonable knowledge must be available to all actors in the tourism sector, in particular for tourists, as this may lead to increased respect for the natural and cultural environment of visited areas. Furthermore, they need to concur for a better understanding, appreciation, and joy of discovering and protecting nature and traditional local culture, to ensure the minimum negative impact on local communities.
Regarding the above-mentioned reasons, it is imperative to embrace the principles of green marketing in tourism. The behavior, which is focused on the preference for sustainable and/or green products or services, is certainly influenced by the way those products/services are promoted and can serve as a precondition for developing the loyalty of the consumers [61]. Greater sustainability would be achieved if consumers could be encouraged to adopt more responsible lifestyles and behaviors [62]. Sustainability communication aims to make consumers aware of the availability of sustainable travel products and services, to inform them about how these offerings meet their needs and comply with sustainability criteria, and to stimulate pro-sustainable purchases [63]. For many organizations in the tourism sector, digital channels like websites, social media platforms, or portals are the first point of contact with potential clients/tourists, providing information regarding their facilities and services. Digital marketing has evolved into an umbrella concept, which describes the process of using these digital channels to acquire and retain clients and, thereby, increase sales, and is often used interchangeably with the terms of Internet marketing, online marketing, or electronic marketing. As shown in the literature [64,65], the concept of digital marketing has been evolving from the communication means, which involved the collection of data through market research, to an important source of revenue, and further as an important business function, which can now develop business relationships with distinct parties within the market. As marketing always ensures an understanding of audiences, the digital nature of marketing is providing a detailed and insightful overview of the characteristics of consumers and their behavior in digital space. This certainly influenced the decision-making process and how companies create value.
Also, in sustainable tourism literature [25,66,67,68] the importance of digital marketing has been considerably debated. The use of digital services in tourism marketing has been in continuous development stage within the digital era: from the promotion of tourist destinations to trip planning. Digital marketing, as well as information and communication technology, can make sustainability relevant to the decision-making process and consumer buying behavior. [19,46] Digitalization may continue to propel travel experience to a high-quality level in such a manner that it may contribute to the sustainable development goals by using innovative technologies. Technological advancements presented in the literature as innovations with deep impact on the tourism sector range from business management technologies (e.g., mobile technologies, cloud computing, automation and advanced robotics, blockchain, and data analytics) [5,69,70] to technologies that produce innovative tourism products, services and experiences (e.g., virtual and augmented reality, and the Internet-of-Things) [71,72] and technologies that assist, understand, and connect with markets (e.g., data analytics and artificial intelligence) [73,74].
Different authors have measured the use of digital technologies in a variety of ways. The interview has been used across different studies that investigated distinct ways of adopting digital technologies in tourism services [69,70,75,76], while other studies focused on technology acceptance models to investigate user behavior and adoption of new technology applications [76,77,78,79].
Research on sustainable tourism has shown that some common characteristics and behaviors of millennials drive creative tourism, promote alternative accommodation, and value digital tourism the most [80]. This generation that is reshaping the business environment and is emphasizing more on sustainability and green business, millennials, represent the generation that travels the most. Even if there is previous evidence that individuals show a high rate of Internet usage for tourism purposes no matter what generation they belong to, there may be significant differences related to search purposes, trip planning or online platforms visited [43]. Also, studies [81,82,83] indicate that Millennials (aged between 24 and 35) and Gen Z (aged between 18 and 23) form the largest cohort of today’s new travelers and the most dynamic component of the green tourism market in the next decade. The social personality of this generation has been shaped by two major events related to technology, namely: The Internet and the smartphone revolution [84]. Millennials generate advances in technology by encouraging innovation, knowing their preferences and consumption habits—as online bookings, interacting with other travelers through social networks, using mobile devices and applications for planning and running the trip, etc. Last but not least, they contribute to the development of a specific infrastructure for sustainable tourism and their contribution to economies and communities is significant [83,85,86,87,88].
Now, tourism needs to keep going even through difficult times with social distancing rules all over the globe. This has a big impact on the value creation process within the tourism sector. Millennials are now the generation that supports local or smaller businesses after the pandemic, but at the same time, it is the generation that ‘won’t hesitate to penalize companies whose stated and practiced values conflict with their own’ [89].
During the past ten years, much more information has become available on tourist preferences, motivations, and tourism experience. Researchers have recognized several indicators from the tourism industry that determine tourist’s behavior. For example, Passafaro et al. [90] aimed to determine the profile of ‘sustainable tourist’ by analyzing personal values or habits from the perspective of environmental psychology. The awareness of a pro-sustainable behavior that leads to economic consequences has been subject to many studies from the tourism field and authors used both qualitative and quantitative methods to measure tourists’ preferences. For instance, Pulido-Fernández and López-Sánchez [91] used a regression model to estimate the price tourists are willing to pay to visit a sustainable destination. Furthermore, studies that focus on tourist preferences cover many geographical areas. From the European context, a study that set out to determine the characteristics of green tourists reveals that when a sustainable destination is considered, it depends to a great extent on a diverse set of socio-demographic criteria, where the most significant factor is the country of residence [47].
As the world is currently facing a healthcare crisis and global travel restrictions have been introduced, it is important to analyze and observe how the tourism sector will look like. The tourism ecosystem has been drastically affected by the COVID-19 crisis, as the World Tourism Organization [92] anticipates a decline in international tourism of 60% to 80% in comparison with last year (2019). In the European context, the tourism business is experiencing a severe financial crisis. Revenue losses have reached 85% for hotels and restaurants, tour operators, and travel companies, while a 90% loss has been recorded for the cruise and airline businesses [93].
Globally, the industry is now at a pivotal point in its history. Therefore, more than ever, the business environment seeks to overcome this challenge by developing recovery strategies, based on technology. Digital transformation is playing a great role in the revival of tourism. The European Commission will develop a special platform that includes a real-time map with specific information related to tourism. Moreover, artificial intelligence and robotics are some types of technology that are highly supported by public institutions to help tourism businesses recover [93]. Particularly, the use of data analytics may generate and foresee tourist profile segments and enable a deeper understanding of the traveler’s expectations, trends, needs, and interests. Business analytics may be an effective instrument that enables tourism to accommodate changing customer demands. Therefore, tourism may largely benefit from the digital transformation, enabling better tourism management and more efficient use of the existing resources.
3. Methodology and Data
In order to analyze the potential impact that digitalization might have on the sustainability of tourism, 18 statistical variables were selected to characterize the following four areas: tourism, Information and Communication Technology (ICT), environment, and overall economic development, based on the results of specialized studies. The data were provided by the EUROSTAT database [94], covering 30 European countries (27 EU member states, plus United Kingdom, Norway, and Switzerland) and referring mainly to 2017 and 2018 (the last available year was considered). The sample includes 540 observations. Table 1 shows the description of all variables included in the analysis.
The variables in the tourism field capture tourist trips made in less polluting and ecological destinations, which, however, can be strongly affected by tourist activities, especially since they hold an important share of protected areas and natural parks. Also, these variables refer to the degree to which tourists choose non-invasive accommodation establishments to the environment or the extent to which tourists use ICT services to plan travel for tourism purposes. Variables in the information technology field reflect the importance of the ICT sector in terms of human resources employed, Internet access of households, the degree of Internet use depending on individuals’ age, education, income, or digital skills. The variables in the environmental field aim at the pollution degree and air quality, on the one hand, but also at the environmental protection activities, on the other hand, as many studies relate climate change to sustainable tourism [39,40]. The economy state and development level of countries are revealed by GDP per capita, compared to the average level of the indicator for EU as a whole.
In the spirit of the classic definition of sustainable development, sustainable tourism is seen as a combination of environmental, economic, and socio-cultural elements. [95] In addition to this classical approach, studies have gradually begun to focus on the behavior and preferences of tourism consumer, as a potential factor favoring sustainable/green component of tourism [19] Specifically, the research focused on a series of behavioral elements, such as awareness of responsibility the tourist has for maintaining the appropriate quality of the environment, the existence of motivational factors that determine a responsible attitude for tourism consumer in relation to the environment, personal experiences in choosing ecological, less invasive destinations, the degree of attractiveness, and satisfaction offered by green destinations [96,97,98]. At the same time, few studies have analyzed the influence of digital use technologies in travel planning on tourists’ preferences to green destinations. In general, research has focused on the relationship between the digitalization and tourism sector, and few of them have particularized its influence on green tourism.
In this context, this paper aims at studying the link between digitalization and the sustainable (“green”) side of tourism, verifying the following hypotheses:
Hypothesis 1 (H1).
The tourists’ preferences towards green destinations and ecological accommodation establishments may have a significant impact on the sustainability of tourism.
Hypothesis 2 (H2).
The Internet use in travel planning may have a significant influence on the sustainability of tourism.
Hypothesis 3 (H3).
Tourism sustainability may be significantly influenced by economic well-being.
In order to characterize the current state and evolution of the digitization process and tourism activity in European countries, descriptive statistics methods were applied, for a set of statistical variables in the tourism field, ICT, and environment. The initial data set, comprising 18 statistical variables, was summarized, which was concentrated in four complex main components, using principal component analysis, so they retain an important part of the initial information energy. To analyze the correlation between the sustainable component of the tourism and digitization process, as well as to quantify the impact of the latter on green tourism, the multiple linear regression method was applied. The variation of the endogenous variable that characterizes the quality of the environment is studied with dependence on three factors, quantifying the use of information technology in tourist services, the economic well-being, and the inclination of tourists towards ecological accommodation forms. The model has the following general form:
where:
- i stands for the country, N = 30 (the sample size);
- represents the value of the explained, response variable for country i;
- represents the value of the explanatory variable j for country i;
- β0, β1,…, βk, are the regression model parameters (β0 is the intercept parameter, while β1 − βk are the slope parameters);
- k is the number of explanatory variables included in the model;
- ɛi represents the value of the residual variable for country i.
The 30 countries included in the analysis were clustered by the four main components obtained following the application of the principal component analysis, identifying four clusters of European countries. The multicriteria hierarchical clustering method aiming at maximizing homogeneity within the clusters and the variability between clusters helped to identify the common behavioral features of countries in each cluster, in terms of tourism activities, digitization, quality, and environmental protection. Thus, the strengths and weaknesses of each behavior model can be identified, and some recommendations can be made regarding the economic and social policy measures targeted on tourism sustainability.
4. Analysis of the Relationship between Digitalization and Sustainable Component of Tourism. Main Results
The size of the tourism industry in the EU is comprised of 2.3 million businesses and 12.3 million employees, which contribute to its success [99]. In almost all EU countries, in the period 2012–2018, there was an increase in the number of trips (one night over, rented accommodation).
The country with the highest number of trips in rented accommodation is Germany (with over 187.75 million trips in 2018), followed by France (with 120.54 million trips in the same year). Higher increases are observed in Estonia, Malta, Portugal (by 155%, 90%, respectively by 71%). Regarding the preference for non-invasive, more environmentally friendly rented accommodation establishments, such as campsites, caravans, or trailer parks, the country behavior followed a different pattern: in 50% of countries this type of tourism has increased (in the number of travelers) and in 50%, this decreased. At the EU level, the value of the indicator decreased in the period 2012–2017, but in 2018 there was an increase in the tourists’ preferences for this type of accommodation (Figure 1). Comparing the dynamic rate of the total number of trips (in rented accommodation establishments) with that of the number of trips in rented campsites, caravan, or trailer park, we noticed higher growth rates of trips with non-invasive accommodation in Belgium, Germany, Ireland, Luxembourg, Romania, and Finland (in Romania, the increase is 16% on average per year, the highest in the EU). In 2018 the share of trips in rented green accommodation establishments varies between 1.42% (Slovakia) and 13.17% (Latvia).
The percentage of trips with Internet booking as the main means of accommodation in the total number of trips varies between 3.27% (Romania) and 54.85% (Malta) in 2017. Among the countries with the highest share of trips for which the booking of accommodation was made via the Internet, one can mention Belgium (45.19%), Germany (45.08%), Austria (44.51%), and Ireland (41.2%). At the opposite pole, there is Bulgaria (5.49%), Croatia (12.26%), and Portugal (13.04%). In the dynamics, in 2017 compared to 2014, the highest increases were registered in Malta (+17.55%) and Sweden (+13.55%).
Analyzing the distribution of tourist arrivals by types of accommodation units, in 2018 only 7.84% of arrivals were made in green tourism accommodation establishments, such as camping grounds, recreational vehicle parks, and trailer parks, at the EU-27 level. The countries with the highest share of arrivals in this type of accommodation, less polluting, less invasive to the environment were Norway (22.79% of total arrivals), Sweden (19.15%), and Denmark (17.55%). On the opposite side, there were countries with extremely low shares, some close to 0 (Malta, Cyprus, or Bulgaria).
The digitalization process has taken important steps in EU countries. The share of households with Internet access registered a sustained growth, from 68% (2010) to 90% (2019), with an average annual rate of over 3%, with a maximum value of 98% (Iceland, Norway) and a minimum of 75% (Bulgaria). The share of individuals who have used the Internet in the last three months has increased at the EU level from 67% in 2010 to 86% in 2019. The values of the indicator varied in territorial profile between 68% (Bulgaria) and 98% (in northern European countries, such as Sweden and Norway), in 2019. An important factor in using the Internet for different purposes is the level of digital skills. Thus, the share of individuals with above basic overall digital skills increased in the period 2015–2019 by almost 1% on average per year. In Norway, more than 50% of individuals have above basic overall digital skills (2019), while in Romania the share barely reaches 10%. In general, countries with high shares of population with digital knowledge above the elementary level are the Northern countries (Netherlands, Finland—50%), while low shares are found in the former socialist countries (Bulgaria, Poland).
For the present analysis, increased importance is presented by the degree to which the population uses the Internet for planning tourist trips. Thus, between 2010 and 2017, at the entire European Union level, the share of individuals who planned their trips for tourism purposes with the help of the Internet increased from 35% to 40%. In 2017, the countries with the highest shares were Luxembourg and Switzerland (71% and 62%, respectively), while on the opposite side, Bulgaria (11%) and Romania (12%) had the lowest shares.
Following the negotiation of the Kyoto Protocol, the need to reduce the negative impact of human actions on the environment has become more widely known and measures have been taken to reduce greenhouse gas emissions, which are primarily responsible for global warming. Thus, greenhouse gas emissions decreased continuously after 1990, so that in 2018 they represented 79.26% of those of 1990. Among these, greenhouse gas emissions in accommodation and food service activities followed the same decreasing trend, from 44.43 kg per capita in 2008 to 36.48 kg per capita in 2018 (Figure 1 and Figure 2).
4.1. Analysis of Digitalization’s Influence on Green Tourism
In the following pages, this study examines how digital transformation shaped the sustainable dimension of tourism activity through 18 statistical variables that describe the level of economic development, tourism activity, ICT, and the environment, variables that are measured on a continuous scale (ratio scale).
A descriptive analysis of these variables reveals low variations in relation to means for the variables referring to population households with Internet access and typology of Internet users by age, education, and income, but also large variations in territorial profile in terms of environmental protection investments, environmental taxes, and average expenditure per trip or GDP per capita. The correlation matrix applied to the data set reveals quite strong, direct relationships between the share of trips with Internet booking of the main means of transport and accommodation, on the one hand, and the average expenditure per trip, on the other hand, between the share of households with Internet access and the percentage of individuals using the Internet for travel and accommodation services and between the latest and the level of individuals’ digital skills. We can assume then that these variables contain some common information. Therefore, the initial data set could be restricted and synthesized, retaining a sufficient amount of initial information. For this, the opportunity to apply the principal component analysis was verified, the Kaizer–Meyer–Olkin (KMO) measure of sampling adequacy (with a value of 0.617, higher than 0.6) confirming the relevance of applying the method (Table 2). Bartlett’s test of Sphericity shows that the null hypothesis (according to which the correlation matrix is an identity matrix) should be rejected, for a significance value lower than 0.05.
In the next table (Table 3), the Eigenvalues—measuring the variances of principal components—are higher than 1 for five components (6.509 for the first component, 2.284 for the second, 1.994 for the third, 1.520 for the fourth, and 1.312 for the fifth component). They account for 75.66% of the total data variance (of which 36.16% is explained by the first component, 12.68%, by the second component, 11.08%, by the third component, 8.44%, by the fourth component, and 7.29% by the fifth component), the share in the total variance explained decreasing from the first to the last component. The rest of the components (from the sixth to the last component) have Eigenvalues lower than 1 (from 0.878 to 0.032). Following the application of Varimax rotation, the total variance corresponding to the five main components was redistributed among them (35.05% went to the first component, 11.36% to the second one, 10.48% to the third, 9.59% to the fourth, and 9.16% to the fifth component). However, in order to better summarize the initial data set, for greater clarity and ease of interpretation, we retain only the first four principal components (Figure 3).
Thus, the first main component retains 35.05%, the second main component retains 11.36%, the third main component retains 10.48%, and the fourth main component retains 9.59% of the total variance (Table 3).
Analyzing rotated component matrix (Table 4) and component plot in rotated space (Figure 4), it can be observed the best represented variable on positive side of the first axis is the percentage of individuals who have above basic overall digital skills (correlation coefficient 0.924), followed by the percentage of individuals using the Internet for travel and accommodation services (correlation coefficient = 0.918), share of households with Internet access (correlation coefficient = 0.868), GDP per capita (correlation coefficient = 0.850), percentage of trips in rented green accommodation establishments (correlation coefficient = 0.774), percentage of individuals with high formal education using Internet (correlation coefficient = 0.712), average expenditure per trip (correlation coefficient = 0.708), percentage of individuals living in household with income in fourth quartile who use the Internet (correlation coefficient = 0.663), and percentage of young individuals (aged 25–34) using the Internet (correlation coefficient = 0.642). On the second axis, the two most representative variables on the positive side are greenhouse gas emissions (correlation coefficient = 0.824) and greenhouse gas emissions in accommodation and food activities (correlation coefficient = 0.767), while on the negative side of the axis, there is the percentage of ICT personnel in total employment (correlation coefficient = −0.664). The third component is best represented by the variables environmental protection investments and environmental taxes in accommodation and food service activities, to which it corresponds correlation coefficients of 0.669 and 0.901, respectively. The fourth component is best represented by the percentage of trips in rented green accommodation establishments (campsites, caravan, or trailer parks) and by the percentage of arrivals at green tourism accommodation establishments (both on its positive side, having correlation coefficients of 0.792 and 0.626, respectively) (Table 4).
Variables included in the first component characterize four aspects: the use of Internet services in planning tourism activities, the individuals’ digital skills, and the share of individuals using the Internet by age, education or income, and the economic welfare level. This component is further analyzed under the name of “Tourism and digitalization”. The second component includes variables referring to environmental quality, characterized by greenhouse gas emissions (total and in accommodation and food activities), therefore, this component is described as “Tourism pollution”. The variables included in the third component refer to human action to protect the environment, and thus this component is identified as the “Environment protection” component. Finally, the fourth component expresses the degree to which tourists prefer renting green accommodation establishments, environmentally friendly, which have a smaller negative impact on environmental quality. Consequently, this component is named “Green tourism” (Table 5).
Multiple linear regression method was used in order to explore the sustainable, “green” side of tourism and to identify how a country’s development, the use of ICT services, and the tourist preferences can contribute to reducing the negative impact of human activities on the environment. To capture all these aspects, the regression model connected variables included in the main complex components previously identified: “Tourism & Digitalization”, “Tourism pollution”, and “Green Tourism”. Following the analysis of the correlation matrix between the statistical variables from the initial data set, the following variables were selected: Greenhouse gas emissions in accommodation and food activities (GHG_tourism)—explained variable, which expresses the negative pressure exerted on the environment through human activities in tourism field; GDP per capita (GDP)—as an exogenous variable that expresses the well-being and development level of economy; percentage of individuals using the Internet for travel and accommodation services (E_tourism)—as an exogenous variable that reflects the use of ICT, digital services in planning and documenting tourism activities; percentage of arrivals at green tourism accommodation establishments (campsites, caravan, or trailer parks) (Arrivals)—as explanatory variable that reflects the sustainable preferences of tourists oriented towards more environmentally friendly types of accommodation and that do not produce such a negative pressure on it.
The identified model has the following form:
After testing the model’s validity, we found that it has a statistically significant explanatory power on the variation of the endogenous variable, respectively it explains 87% of the variation of greenhouse gas emissions resulting from tourism activities, being a statistically valid model, for a significance value less than 0.05. Student’s test confirmed statistical significance of the regression model parameters, for significance levels below the 0.05 threshold (Sig.1 = 0.028, Sig.2 = 0.001, Sig.3 = 0.043, Sig.4 = 0.014). (Table 6).
Table 6 shows explanatory variables reflecting the use of Internet services in purchasing tourism products and services (E_tourism), and the level of economic development of countries (GDP) have positive coefficients. At the same time, the variable referring to arrivals of tourists in non-invasive, accommodation units, which are friendly to the environment, (Arrivals) has a negative coefficient. Following the analysis of magnitude and the sign of the estimators of each model parameter, the statistical significance of all parameters being given, it can be observed the use of digital services in travel planning and the economic well-being of a nation exerts a direct influence on greenhouse gases emissions in the sphere of tourism activities. On the contrary, the tourists’ preferences for environmentally friendly accommodation, which is less harmful and polluting, have an inverse influence on the variation of the dependent variable.
The quality of the linear regression model was investigated by testing the following hypotheses: linear functional form, residuals hypotheses (errors normal distribution, residuals homoscedasticity, residuals non-autocorrelation), non-correlation of explanatory variables with residuals, non-existence of multicollinearity of exogenous variables; these hypotheses were validated, following the application of statistical tests (Figure 5 and Figure 6).
In conclusion, following the application of statistical and econometric methods of multidimensional analysis, the three hypotheses were validated. They refer to the factors that can influence differently, but significantly, the sustainability of tourism.
4.2. Identifying the Main Behavior Patterns of European Countries Regarding Digitalization and Tourism
European countries present various manifestations in terms of tourism, its green component, and digitalization, being defined by both the domestic economic reality and international context. However, despite this variety, some common behavioral characteristics can be revealed, allowing us to identify the trends, future developments, strengths, and weaknesses, as well as the ways to fix them. Therefore, a classification of the 30 studied European countries was carried out, using as classification criteria the four main components identified, following the application of the main component analysis, which incorporates 16 statistical variables. With the help of Ward’s method, which aims to maximize the dispersion between clusters and homogeneity within the clusters, a multi-criteria hierarchical clustering was performed, forming four clusters (Figure 7), whose structure is shown in Table 7.
In addition to the four clusters, Luxembourg and Switzerland were also placed, two countries whose positioning was due to the extreme values of some variables, compared to the more compact group of other countries. Thus, both Luxembourg and Switzerland have the highest values of GDP per capita (over three times, respectively over two times higher than the EU-average market prices in 2017). The average expenditure per trip is over two times higher than the EU average, reaching over 800 EUR/trip, in the case of both countries. For each classification criterion, their average levels were calculated, corresponding to each main component (Table 8).
By comparing average levels of classification criteria for each cluster with an overall mean level (Table 8), the characterization of clusters was performed through the prism of four main components previously identified, as follows:
Clusters 1 and 2—composed mainly of countries with a high economic development level and rich tourist activity, compete for the first positions of all grouping criteria in digitalization and tourism. Thus, countries in these clusters have the highest degree in the use of digital services for planning the population tourist and travel activities (76.86% and 51.40%, respectively), but also the highest level of GDP per capita, relative to the EU average (127.38% and 131.84%, respectively). A large percentage of the young population (25–35 years old) and of those highly educated who use the Internet can be found in these clusters, the share of individuals with medium and high-level digital skills are the highest of all clusters (31.7% and 38.5%, respectively). These countries have been able to attract tourists, making them spend larger amounts of money during a tourist trip. Thus, cluster 1 stands out with the highest level of average expenditure per trip (approximately EUR 570, on average), followed by the second cluster (with approximately EUR 370 on average) (Table 8).
Clusters 3 and 4 occupy the last two places in terms of digitalization and tourism. However, cluster 3, which is generally composed of former socialist countries, with centralized economies, is characterized by the least favorable level at almost all indicators. On average, in this cluster, less than one-quarter of individuals use the Internet for accommodation and travel arrangements, and around one-fifth of individuals have above overall digital skills. Tourists pay the least for a trip of one night or over, on average (EUR 140.44). Therefore, we may assume there are reduced shares of young individuals and highly educated people who use Internet services, compared to the other clusters. Most countries in this cluster are developing countries, whose GDP/capita is well below the EU average (less than 50% of the EU-average) (Table 8).
Considering “environmental quality”, the situation is quite opposite in the identified clusters, compared to digitalization and tourism component. Thus, on the one hand, the first two clusters mainly include developed countries, with considerable resources that can support the digitalization of tourism activities. On the other hand, developed countries are also major polluters, responsible for the highest level of greenhouse gas emissions, including in accommodation and food service activities. They invest large amounts of money in environment protection (4.91%–6.13% of GDP, on average) and charge high environmental taxes, in accommodation and food service domains (2.58%–8.266% of GDP, on average). At the opposite pole, there are less developed countries in clusters 3 and 4, with a smaller scale of economic activity that makes them less polluting and therefore they are characterized by lower levels of greenhouse gas emissions, including in the tourism area. These countries are characterized by a low level of investments for environmental protection (0.9%–1.54% of GDP), but also by reduced environmental taxes charged in accommodation and food services (0.5%–1.58% of GDP) (Table 8).
Although in all four clusters the percentage of trips in rented “green” accommodation establishments (like campsites, caravan, or trailer parks) is relatively low, ranging between 4.15% and 6.14% (on average); there is no large variation between clusters: cluster 3 is characterized by the highest level of the indicator, while the lowest values can be found in cluster 4. Nevertheless, if we look at tourists’ arrivals, the largest share of these arrivals in green accommodation establishments is revealed in the countries belonging to the second cluster (almost 12%), while the lowest one belongs to the first cluster (more than four times lower) (Table 8). This situation could be explained by the structure of existing accommodation establishments in the respective countries, by offered services and their quality, as well as by the rates charged or transport infrastructure.
5. Discussion
The relation between digitalization and tourism is customized in our research by studying the impact of using digital services and technologies in sustainable, eco-friendly tourism side. This influence was not studied unilaterally, singularly, but by associating digital factors with tourists’ preferences oriented towards green accommodation units and with the well-being of the economy. The selected factors are quantified by statistical indicators that address the economy as a whole (macroeconomic indicator GDP), tourism (Arrivals), or factors found meeting several sectors—digitalization and tourism (E_tourism). On the other hand, the explained variable reflects the close connection that exists between the environment and tourism, reflecting the need to protect the environment and maintain its quality, by reducing pollution generated by tourism activities (GHG_tourism).
Thus, research results show that an increase in using of ICT services for planning tourism activities does not necessarily lead to a significant decrease of pollution in the tourism field, but, on the contrary, to a rise of environmental degradation by increasing greenhouse gas emissions, which are largely responsible for the decrease in the quality and integrity of the environment. This conclusion is in line with the results of other specialized studies, which mentioned the two-way influence of technology and communication sector: it is, on the one hand, a source of increasing greenhouse gas emissions into the atmosphere in the energy sector and manufacturing, but also a potential source of reducing these emissions in other sectors, by its way of usage [100,101]. A possible explanation for these results may be related to tourists’ behavior and the use of digital services, as potential tourists, do not necessarily orient their searches on the Internet to rural, natural, low-polluting destinations, and thus their action may not lead to a significant decrease in the negative impact on the environment through tourist actions. The positive estimator of the parameter corresponding to the GDP per capita variable certified the results of numerous studies that attest to the direct correlation between the development level of a country (expressed by GDP) and environment quality (reflected by greenhouse gas emissions) [102]. However, even if there have been some encouraging developments in terms of GDP level and air pollution, studies indicated there has been no full decoupling of economic growth from greenhouse gas emissions. There are still many developed economies, with a high level of GDP, but which are also pollutants and large emitters of greenhouse gases. Instead, tourists’ preferences for less polluting destinations, which are at the same time more friendly towards environment and accommodation establishments can induce a decrease in greenhouse gas emissions in the sphere of tourist activities, a decrease of small magnitude but statistically significant, thus contributing to environmental protection and increased quality. Given the current global health crisis, this orientation of tourists towards accommodation establishments closer to nature may be even more significant in the coming years and its positive effect on the quality of the environment will be more visible. The results are consistent with those of other studies, which attested that tourism behavior and tourism levels can have an impact on GHG emissions and that intense tourism activity can be associated with lower GHG emissions and better environmental performance [103]. Also, previous studies address the issue of green dimensions of tourism, especially in terms of adopting ecological practices, and highlight that the industry can make an important contribution through improving the quality of the environment [24,25,26,27,28]. At the same time, the tourism sector can be a promoter of development and economic growth, but it can also be associated with negative pressures on the environment and its degradation [104,105]. Due to the multidimensional nature of both the sustainable tourism and digitalization concept, it is recommended for future studies to focus on specific, particular areas of these domains, to consider reliable statistical indicators in order to find new determinants and new ways of improving the sustainable side of tourism by using modern technologies.
6. Conclusions
The role of tourism as a catalyst for economic growth cannot be questioned, and digitalization can bring an increase in tourism efficiency. Many studies confirm the favorable impact of digitalization on tourism in general, but fewer studies that focus on the particularization of this influence on the sustainable, green side of tourism. The use of the Internet makes tourism gain a larger share of the online trade market [102]. But will this also encourage a more sustainable consumer behavior? Will this result in emphasizing the "green", sustainable character of tourism? To meet this challenge, three working hypotheses have been formulated in this paper, aiming at a potential influence of three factors on the green character of tourism: the use of digital technologies in purchasing tourism products and services, the “eco-friendly” preferences of tourism consumers regarding the typology of tourist accommodation services, and the development level of a country. Our analysis indicated the existence of significant influences of the three factors on sustainability of tourism, but not all influences proved to be favorable: thus, results show the inclination of tourists to opt for non-invasive forms of accommodation for the environment may be a support in reducing pollution in tourism, but the use of IT services in planning tourism travel and the development level of a country have negative, inverse influence, on the sustainability of tourism, as an increase in the level of the two factors does not induce a decrease in pollution for the tourism sector. Hojeghan and Esfangareh [106] pointed out that “much attention should be paid to the negative implications of Internet on tourism industry”.
The authors intend to continue the analysis by identifying other variables in order to capture the essence of digitalization–tourism correlation and by studying other geographical regions so that new behavioral patterns can be identified.
An added value of the present study is generated by the multicriteria analysis of European countries in order to identify their behavior patterns through four dimensions: tourism and digitalization, tourism pollution, environment protection, and green tourism. Thus, four types of behavior were outlined, associated with four clusters of countries. The countries in the first cluster have the advantage of using digital technologies to a greater extent in planning tourist trips. These countries are recommended to increase the share of employees in IT sector and to take measures for reducing pollution, which is too high. Countries in the second cluster (mostly developed countries) are notable for the largest share of households with Internet access and a high percentage of individuals with digital skills above the elementary level, which explains the high degree of Internet use in documenting and booking tourist trips. These countries have the necessary resources to invest in environmental protection, charging high taxes for environmental protection. Moreover, tourism consumers have well-defined preferences in choosing ecological destinations that are less invasive to the environment. Countries in the third and fourth clusters—mainly developing countries with limited resources—are recommended to improve the efficiency of the ICT sector, a better training of individuals in this field, improving digital marketing in order to influence the decision to participate in tourist activity, or to influence tourists’ preferences for non-polluted destinations and services. Although these countries have a lower level of pollution, the quality of the environment is frequently affected by the overexploitation of natural resources. As the countries in this cluster do not have enough resources for environmental protection actions, they can choose penalties, higher taxes for environmental destruction, or attracting other funds in order to restore the quality of the environment, imposing a clearer discipline in this regard.
The development and usage of digital technologies are vital for the sustainable transformation of tourism. It can help us obtain statistical data from multiple tourism-related fields, improve strategies, and make wiser choices when planning our travels, because they affect our health and well-being, as individuals and as exponents of society.
Author Contributions
Conceptualization, A.S.S., S.I.G., I.A., and C.-A.S.; methodology, A.S.S. and S.I.G.; software, S.I.G.; validation, A.S.S. and S.I.G.; formal analysis, A.S.S. and S.I.G.; investigation, S.I.G., I.A., and C.-A.S.; resources, S.I.G., I.A., and C.-A.S.; data curation, S.I.G.; writing—original draft preparation, I.A.; writing—review and editing, I.A. and C.-A.S.; visualization, I.A.; supervision, A.S.S.; project administration, A.S.S. All authors have read and agreed to the published version of the manuscript.
Funding
This research received no external funding.
Conflicts of Interest
The authors declare no conflict of interest.
References
- Dinu, M. Geografia Turismului; Didactic and Pedagogical Publishing House: Bucharest, Romania, 2006. [Google Scholar]
- Sevrani, K.; Elmazi, L. ICT and the changing landscape of tourism distribution—A new dimension of tourism in the global condition. Tour. J. 2008, 6, 22–29. [Google Scholar]
- Liburd, J.J. Tourism Research 2.0. Ann. Tour. Res. 2012, 39, 883–907. [Google Scholar] [CrossRef]
- Lange-Faria, W.; Elliot, S. Understanding the role of social media in destination marketing. Tourismos 2012, 7, 193–211. [Google Scholar]
- Lambert, J.; Nieuwenhuis, M.L.; Ehrenhard, L.P. The shift to Cloud Computing: The impact of disruptive technology on the enterprise software business ecosystem. Technol. Forecast. Soc. Change 2018, 129, 308–313. [Google Scholar]
- Tohanean, D.; Toma, S.G.; Dumitru, I. Organizational Performance and Digitalization in Industry 4.0. J. Emerg. Trends Mark. Manag. 2018, 1, 282–293. [Google Scholar]
- Tohanean, D.; Buzatu, A.I.; Baba, A.; Georgescu, B. Business Model Innovation Through the Use of Digital Technologies: Managing Risks and Creating Sustainability. Amfiteatru Econ. 2020, 22, 758–774. [Google Scholar]
- Sahut, J.M.; Peris-Ortiz, M. Small business, innovation, and entrepreneurship. Small Bus. Econ. 2014, 42, 663–668. [Google Scholar] [CrossRef]
- Margherita, A.; Petti, C. E-Business Adoption. A Readiness and Process Study of the Italian Tourism Distribution. Int. J. E-Bus. Manag. 2009, 3, 3–19. [Google Scholar] [CrossRef]
- Koukopoulos, D.; Styliaras, G. Design of trustworthy smartphonebased multimedia services in cultural environment. Electron. Commer. Res. 2013, 13, 129–150. [Google Scholar] [CrossRef]
- Huang, T.; Lee, T.J.; Lee, K.H. Innovative e-commerce model for food tourism product. Int. J. Tour. Res. 2009, 11, 595–600. [Google Scholar] [CrossRef]
- Souto, J.E. Business model innovation and business concept innovation as the context of incremental innovation and radical innovation. Tour. Manag. 2015, 51, 142–155. [Google Scholar] [CrossRef]
- Rusu, B. The Impact of Innovations on the Business Model: Exploratory Analysis of a Small Travel Agency. Procedia Soc. Behav. Sci. 2016, 221, 166–175. [Google Scholar] [CrossRef] [Green Version]
- Williams, A.M.; Shaw, G. Internationalization and innovation in tourism. Ann. Tour. Res. 2011, 38, 27–51. [Google Scholar] [CrossRef] [Green Version]
- Bigné, E.; Decrop, A. Paradoxes of Postmodern Tourists and Innovation in Tourism Marketing. In The Future of Tourism; Fayos-Solà, E., Cooper, C., Eds.; Springer: Cham, Switzerland, 2019; pp. 131–154. [Google Scholar]
- Dredge, D.; Phi, G.; Mahadevan, R.; Meehan, E.; Popescu, E.S. Digitalization in Tourism: In-Depth Analysis of Challenges and Opportunitie Low Value Procedure GRO-SME-17-C-091-A for Executive Agency for Small and Medium-Sized Enterprises (EASME) Virtual Tourism Observatory; Aalborg University: Copenhagen, Demark, 2018. [Google Scholar]
- Liu, Y.Y.; Mačerinskienė, A. Managing the Digital Campaign Process for Sustainable Tourism Destination. WIT Trans. Ecol. Environ. 2016, 201, 139–153. [Google Scholar]
- Furqan, A.; Mat, S.; Ahmad, P.; Hussin, R. Promoting Green tourism for future sustainability. Theor. Empir. Res. Urban. Manag. 2010, 5, 64–74. [Google Scholar]
- Budeanu, A. Sustainable tourist behavior—A discussion of opportunities for change. Int. J. Consum. Stud. 2007, 31, 499–508. [Google Scholar] [CrossRef]
- Baldassarre, B.; Calabretta, G.; Bocken, N.M.P.; Jaskiewicz, T. Bridging sustainable business model innovation and user-driven innovation: A process for sustainable value proposition design. J. Clean Prod. 2017, 147, 175–186. [Google Scholar] [CrossRef] [Green Version]
- Eurostat. Tourism in the EU—What a Normal Summer Season Looks Like—Before Covid-19. 2020. Available online: https://ec.europa.eu/eurostat/statistics-explained/index.php?title=Tourism_in_the_EU_-_what_a_normal_summer_season_looks_like_-_before_Covid-19 (accessed on 15 July 2020).
- Reinhold, S.; Zach, F.J.; Krizaj, D. Business models in tourism: A review and research agenda. Tour. Rev. 2017, 72, 462–482. [Google Scholar] [CrossRef]
- UNWTO. EU Guidebook on Sustainable Tourism for Development. 2020. Available online: https://www.unwtorg/EU-guidebook-on-sustainable-tourism-for-development (accessed on 8 August 2020).
- Pintassilgo, P. Green Tourism. In Encyclopedia of Tourism; Jafari, J., Xiao, H., Eds.; Springer: Cham, Switzerland, 2016; Chapter 264. [Google Scholar]
- Marin-Pantelescu, A.; Tachiciu, L.; Capusneanu, S.; Topor, D.I. Role of Tour Operators and Travel Agencies in Promoting Sustainable Tourism. Amfiteatru Econ. 2019, 21, 654–669. [Google Scholar] [CrossRef]
- Leonidou, L.; Leonidou, N.; Fotiadis, T.A.; Zeriti, A. Resources and capabilities as drivers of hotel environmental marketing strategy: Implications for competitive advantage and performance. Tour. Manag. 2013, 35, 94–110. [Google Scholar] [CrossRef]
- Han, H.; Hsu, L.J.; Lee, J.S.; Sheu, C. Are lodging customers ready to go green? An examination of attitudes, demographics, and eco-friendly intention. Int. J. Hosp. Manag. 2011, 30, 345–355. [Google Scholar] [CrossRef]
- Knowles, T.; Macmillan, S.; Palmer, J.; Grabowski, P.; Hashimoto, A. The development of environmental initiatives in tourism: Responses from the London hotel sector. Int. J. Tour. Res. 1999, 1, 255–265. [Google Scholar] [CrossRef]
- The Global Sustainable Tourism Council. GSTC Industry Criteria. 2016. Available online: https://www.gstcouncil.org/gstc-criteria/ (accessed on 10 August 2020).
- Niñerola, A.; Sánchez-Rebull, M.-V.; Hernández-Lara, A.-B. Tourism Research on Sustainability: A Bibliometric Analysi. Sustainability 2019, 11, 1377. [Google Scholar] [CrossRef] [Green Version]
- Wall, G. Is Ecotourism Sustainable? Environ. Manag. 1997, 21, 483–491. [Google Scholar] [CrossRef] [PubMed]
- Buckley, R. Sustainable Tourism: Research and Reality. Ann. Tour. Res. 2012, 39, 528–546. [Google Scholar] [CrossRef] [Green Version]
- Zolfani, S.H.; Sedaghat, M.; Maknoon, R.; Zavadskas, E.K. Sustainable Tourism: A Comprehensive Literature Review on Frameworks and Application. Econ. Res. 2015, 28, 1–30. [Google Scholar]
- Tosun, C. Challenges of Sustainable Tourism Development in the Developing World: The Case of Turkey. Tour. Manag. 2001, 22, 289–303. [Google Scholar] [CrossRef]
- Harrison, L.; Jayawardena, C.; Clayton, A. Sustainable Tourism Development in the Caribbean: Practical Challenge. Int. J. Contemp. Hosp. Manag. 2003, 15, 294–298. [Google Scholar] [CrossRef]
- Mbaiwa, J.E. The Problems and Prospects of Sustainable Tourism Development in the Okavango Delta, Botswana. J. Sustain. Tour. 2005, 13, 203–227. [Google Scholar] [CrossRef]
- Koutsouris, A. Social Learning and Sustainable Tourism Development; Local Quality Conventions in Tourism: A Greek Case Study. J. Sustain. Tour. 2009, 17, 567–581. [Google Scholar] [CrossRef]
- Castellani, V.; Sala, S. Sustainable Performance Index for Tourism Policy Development. Tour. Manag. 2010, 31, 871–880. [Google Scholar] [CrossRef]
- Turton, S.; Dickson, T.; Hadwen, W.; Jorgensen, B.; Pham, T.; Simmons, D.; Wilson, C. Developing an Approach for Tourism Climate Change Assessment: Evidence from Four Contrasting Australian Case Studie. J. Sustain. Tour. 2010, 18, 429–447. [Google Scholar] [CrossRef] [Green Version]
- Kaján, E.; Saarinen, J. Tourism, Climate Change and Adaptation: A Review. Curr. Issues Tour. 2013, 16, 167–195. [Google Scholar] [CrossRef]
- Garín-Muñoz, T.; Perez, A.T. Internet Usage for Travel and Tourism. The Case of Spain. Tour. Econ. 2010, 17, 1071–1085. [Google Scholar] [CrossRef] [Green Version]
- Huang, R.-Y.; Chang, W.-J.; Chung, Y.-C.; Yin, Y.-S.; Yen, J. A Literature Review of Sustainable Tourism (1990–2016): Development Trajectory and Framework. Int. J. Tour. Res. 2019, 6, 20–49. [Google Scholar]
- Kim, H.; Xiang, Z.; Fesenmaier, D. Use of the Internet for Trip Planning: A Generational Analysi. J. Travel. Tour. Mark. 2015, 32, 276–289. [Google Scholar] [CrossRef]
- Xiang, Z.; Dan, W.; O’Leary, J.; Fesenmaier, D. Adapting to the Internet: Trends in Travelers’ Use of the Web for Trip Planning. J. Travel. Res. 2014, 54, 511–527. [Google Scholar] [CrossRef]
- Vajčnerová, I.; Šácha, J.; Ryglova, K. Using the Principal Component Analysis for Evaluating the Quality of a Tourist Destination. Acta Univ. Agric. et Silvic. Mendelianae Brun. 2012, 60, 449–458. [Google Scholar] [CrossRef] [Green Version]
- Muresan, I.; Oroian, C.; Harun, R.; Arion, F.; Porutiu, A.; Chiciudean, G.; Todea, A.; Lile, R. Local Residents’ Attitude toward Sustainable Rural Tourism Development. Sustainability 2016, 8, 100. [Google Scholar] [CrossRef] [Green Version]
- Falk, M.; Hagsten, E. Ways of the Green Tourist in Europ. J. Clean Prod. 2019, 225, 1033–1043. [Google Scholar] [CrossRef]
- Michailidou, A.V.; Vlachokostas, C.; Moussiopoulos, N. Interactions between Climate Change and the Tourism Sector: Multiple-Criteria Decision Analysis to Assess Mitigation and Adaptation Options in Tourism Area. Tour. Manag. 2016, 55, 1–26. [Google Scholar] [CrossRef]
- White, V.; McCrum, G.; Blackstock, K.L.; Scott, A. Indicators and Sustainable Tourism: Literature Review; The Macaulay Institute: Aberdeen, UK, 2006; Available online: https://citeseerx.ist.psu.edu/viewdoc/download?doi=10.1.1.468.246&rep=rep1&type=pdf (accessed on 20 September 2020).
- Scheepens, A.E.; Vogtländer, J.G.; Brezet, J. Two Life Cycle Assessment (LCA) based Methods to Analyse and Design Complex (Regional) Circular Economy System Case: Making Water Tourism More Sustainable. J. Clean Prod. 2016, 114, 257–268. [Google Scholar] [CrossRef]
- Genovese, D.; Culasso, F.; Giacosa, E.; Battaglini, L.M. Can Livestock Farming and Tourism Coexist in Mountain Regions? A New Business Model for Sustainability. Sustainability 2017, 9, 2021. [Google Scholar]
- Ionescu, G.; Firoiu, D.; Pîrvu, R.; Bădîrcea, R.; Drăgan, C. Implementation of Integrated Management Systems and Corporate Social Responsibility Initiatives—A Romanian Hospitality Industry Perspectiv. Sustainability 2018, 10, 3684. [Google Scholar] [CrossRef] [Green Version]
- Del Vecchio, P.; Mele, G.; Ndou, V.; Secundo, G. Open Innovation and Social Big Data for Sustainability: Evidence from the Tourism Industry. Sustainability 2018, 10, 3215. [Google Scholar] [CrossRef] [Green Version]
- Mihalič, T.; Žabkar, V.; Cvelbar, L.K. A hotel sustainability business model: Evidence from Slovenia. J. Sustain. Tour 2012, 20, 701–719. [Google Scholar]
- Høgevold, N.M.; Svensson, G.; Wagner, B.; Petzer, D.J.; Klopper, H.B.; Varela, J.S.; Padin, C.; Ferro, C. Sustainable business models: Corporate reasons, economic effects, social boundaries, environmental actions and organizational challenges in sustainable business practice. Balt. J. Manag. 2014, 9, 357–380. [Google Scholar] [CrossRef]
- Hudson, S.; Miller, G.A. The responsible marketing of tourism: The case of Canadian mountain holiday. Tour. Manag. 2005, 26, 133–142. [Google Scholar] [CrossRef] [Green Version]
- GhulamRabbany, M.; Afrin, S.; Rahman, A.; Islam, F.; Hoque, F. Environmental Effects of Tourism. Am. Energy Environ. Power Res. 2013, 1, 117–130. [Google Scholar]
- Paramati, S.; Shahbaz, M.; Alam, M.S. Does tourism degrade environmental quality? A comparative study of eastern and Western European Union. Transp. Res. D 2017, 50, 1–13. [Google Scholar]
- Paramati, S.; Alam, M.S.; Chen, F. The effects of tourism on economic growth and CO2 emissions a comparison between developed and developing economie. J. Travel. Res. 2017, 56, 712–724. [Google Scholar] [CrossRef] [Green Version]
- Mikayilov, J.I.; Mukhtarov, S.; Mammadov, J. Correction to: Re-evaluating the environmental impacts of tourism: Does EKC exist? Environ. Sci. Pollut. Res. 2019, 26, 32674. [Google Scholar] [CrossRef] [PubMed] [Green Version]
- Dabija, D.; Bejan, B.; Grant, D. The impact of consumer green behaviour on green loyalty among retailformats: A romanian case study. Morav. Geogr. Rep. 2018, 26, 173–185. [Google Scholar]
- Sheth, J.N.; Sethia, N.K.; Srinivas, S. Mindful consumption: A customer-centric approach to sustainability. J. Acad. Mark. Sci. 2011, 39, 21–39. [Google Scholar] [CrossRef]
- Tölkes, C. Sustainability communication in tourism—A literature review. Tour. Manag. Perspect. 2018, 27, 10–21. [Google Scholar] [CrossRef]
- Verma, D.; Bala, M.A. Critical Review of Digital Marketing. Int. J. Ind. Eng. Manag. Sci. 2018, 8, 321–339. [Google Scholar]
- Andronie, M.; Gârdan, D.A.; Dumitru, I.; Gârdan, I.P.; Andronie, I.E.; Uță, C. Integrating the Principles of Green Marketing by Using Big Data. Good Practice. Amfiteatru Econ. 2019, 21, 258–269. [Google Scholar] [CrossRef]
- Font, X.; McCabe, S. Sustainability and marketing in tourism: Its contexts, paradoxes, approaches, challenges and potential. J. Sustain. Tour. 2017, 25, 869–883. [Google Scholar] [CrossRef] [Green Version]
- Yeh, T.; Chen, S.; Chen, T. The Relationships among Experiential Marketing, Service Innovation, and Customer Satisfaction—A Case Study of Tourism Factories in Taiwan. Sustainability 2019, 11, 1041. [Google Scholar] [CrossRef] [Green Version]
- Jones, P.; Clarke-Hill, C.; Comfort, D.; Hillier, D. Marketing and sustainability. Mark. Intell. Plan. 2008, 26, 123–130. [Google Scholar] [CrossRef]
- Okazaki, S.; Hirose, M. Does gender affect media choice in travel information search? On the use of mobile Internet. Tour. Manag. 2009, 30, 794–804. [Google Scholar] [CrossRef] [Green Version]
- Lai, I.K.W. Travelers’ acceptance of an App-based mobile tour guid. J. Hosp. Tour. Res. 2015, 39, 401–432. [Google Scholar] [CrossRef]
- Guttentag, D.A. Virtual reality: Applications and implications for tourism. Tour. Manag. 2010, 31, 637–651. [Google Scholar] [CrossRef]
- Huang, Y.-C.; Backman, K.F.; Backman, S.J.; Chang, L.L. Exploring the Implications of Virtual Reality Technology in Tourism Marketing: An Integrated Research Framework. Int. J. Tour. Res. 2016, 18, 116–128. [Google Scholar] [CrossRef]
- Murphy, J.; Hofacker, C.; Gretzel, U. Dawning of the age of robots in hospitality and tourism: Challenges for teaching and research. Eur. J. Tour. Res. 2017, 15, 104–111. [Google Scholar]
- Yang, L.; Henthorne, T.L.; Babu, G. Artificial Intelligence and Robotics Technology in the Hospitality Industry: Current Applications and Future Trend Digital Transformation in Business and Society; Palgrave Macmillan: Cham, Germany, 2020; pp. 211–228. [Google Scholar]
- Lee, H.; Cranage, D.A. Personalization—Privacy paradox: The effects of personalization and privacy assurance on customer responses to travel Web site. Tour. Manag. 2011, 32, 987–994. [Google Scholar] [CrossRef]
- Parra-López, E.; Bulchand-Gidumal, J.; Gutiérrez-Taño, D.; Díaz-Armas, C. Intentions to use social media in organizing and taking vacation trip. Comput. Hum. Behav. 2011, 27, 640–654. [Google Scholar] [CrossRef]
- Morosan, C. Theoretical and empirical considerations of guests’ perceptions of biometric systems in hotels: Extending the technology acceptance model. J. Hosp. Tour. Res. 2010, 36, 52–84. [Google Scholar] [CrossRef]
- Ayeh, J.K.; Au, N.; Law, R. Predicting the intention to use consumer-generated media for travel planning. Tour. Manag. 2013, 35, 132–143. [Google Scholar] [CrossRef]
- Disztinger, P.; Schlögl, S.; Growth, A. Technology Acceptance of Virtual Reality for Travel Planning. In Information and Communication Technologies in Tourism; Schegg, C., Stangl, B., Eds.; Springer: Cham, Switzerland, 2017; pp. 255–268. [Google Scholar]
- Ketter, E. Millennial travel: Tourism micro-trends of European Generation, Y. J. Tour. Futures 2020. In Press. [Google Scholar] [CrossRef] [Green Version]
- Kim, D.Y.; Park, S. Rethinking millennials: How are they shaping the tourism industry? Asia Pac. J. Tour. Res. 2020, 25, 1–2. [Google Scholar]
- Arora, H. Ecotourism: Repositioning green tourism amongst millennial generation in India. World Review of Entrepreneurship. Manag. Sustain. Dev. 2018, 14, 747. [Google Scholar]
- Șchiopu, A.F.; Pădurean, A.M.; Țală, M.L.; Nica, A.-M. The Influence of New Technologies on Tourism Consumption Behavior of the Millennial. Amfiteatru Econ. 2016, 18, 829–846. [Google Scholar]
- KPMG. Meet the Millennial 2017. Available online: https://homkpmg/content/dam/kpmg/uk/pdf/2017/04/Meet-the-Millennials-Secured.pdf (accessed on 15 July 2020).
- Moisă, C. Turismul de Tineret-Realităţi şi Perspective; Aeternitas: Alba Iulia, Romania, 2015. [Google Scholar]
- Cavagnaro, E.; Staffieri, S.; Postma, A. Understanding millennials’ tourism experience: Values and meaning to travel as a key for identifying target clusters for youth (sustainable) tourism. J. Tour. Futures 2018, 4, 31–42. [Google Scholar]
- Nielsen. Young and Ready to Travel: A Look at Millennial Traveler 2017. Available online: www.nielsen.com/wp-content/uploads/sites/3/2019/04/nielsen-millennial-traveler-study-jan-2017.pdf (accessed on 15 July 2020).
- Skinner, H.; Sarpong, D.; White, G. Meeting the needs of the Millennials and Generation Z: Gamification in tourism through geocaching. J. Tour. Futures 2018, 4, 93–104. [Google Scholar]
- Deloitt the Deloitte Global Millennial Survey. 2020. Available online: https://www2.deloittcom/global/en/pages/about-deloitte/articles/millennialsurvey.html (accessed on 15 July 2020).
- Passafaro, P.; Cini, F.; Boi, L.; D’Angelo, M.; Heering, M.S.; Luchetti, L.; Mancini, A.; Martemucci, V.; Pacella, G.; Patrizi, F.; et al. The “Sustainable Tourist”: Values, Attitudes, and Personality Trait. Tour. Hosp. Res. 2015, 15, 225–239. [Google Scholar]
- Pulido-Fernández, J.; López-Sánchez, Y. Are Tourists Really Willing to Pay More for Sustainable Destinations? Sustainability 2016, 8, 1240. [Google Scholar]
- UNWTO. Tourism in the Green Economy: Background Report; World Tourism Organization: Madrid, Spain, 2013; Available online: https://www.e-unwtorg/doi/pdf/10.18111/9789284414529 (accessed on 8 August 2020).
- European Commission. Communication from the Commission to the European Parliament, the Council, the European Economic and Social Committee and the Committee of the Region. 2020. Available online: https://eur-lex.europa.eu/legal-content/EN/TXT/HTML/?uri=CELEX:52020DC0550&from=EN (accessed on 15 July 2020).
- EUROSTAT. Available online: https://ec.europa.eu/eurostat/data/database (accessed on 10 September 2020).
- Long, J.; Vogelaar, A.; Hale, B.W. Toward sustainable educational travel. J. Sustain. Tour. 2014, 22, 421–439. [Google Scholar]
- Ghaderi, Z.; Henderson, J. Sustainable rural tourism in Iran: A perspective from Hawraman Villag. Tour. Manag. Perspect. 2012, 2, 47–54. [Google Scholar]
- Mustika, P.L.K.; Birtles, A.; Everingham, Y.; Marsh, H. The human dimensions of wildlife tourism in a developing country: Watching spinner dolphins at Lovina, Bali, Indonesia. J. Sustain. Tour. 2013, 21, 229–251. [Google Scholar]
- Liu, H.S.; Horng, J.S.; Chou, S.F. A critical evaluation of sustainable tourism from the integrated perspective: Conducting moderated-mediation analysi. Tour. Manag. Perspect. 2015, 16, 43–50. [Google Scholar]
- European Parliament. Fact Sheets of the European Union. Tourism. Available online: https://www.europarl.europa.eu/factsheets/en/sheet/126/tourism (accessed on 11 September 2020).
- Houston, K.; Reay, D.S. The impact of information and communication technology on GHG emissions: How green are virtual worlds? Carbon Manag. 2014, 2, 629–643. [Google Scholar] [CrossRef]
- Malmodin, J.; Bergmark, P.; Lovehagen, N.; Ercan, M.; Bondesson, A. Considerations for macro-level studies of ICTas enablement potential. In Proceedings of the 2014 Conference ICT for Sustainability, Stockholm, Sweden, 24–27 August 2014; Atlantis Press, B.V.: Amsterdam, The Netherlands, 2014. [Google Scholar]
- Liu, Y.; Kumail, T.; Ali, W.; Sadiq, F. The dynamic relationship between CO2 emission, international tourism and energy consumption in Pakistan: A cointegration approach. Tour. Rev. 2019, 4, 761–779. [Google Scholar] [CrossRef]
- Bojanic, D.; Warnick, R.B. The Relationship between a Country’s Level of Tourism and Environmental Performanc. J. Travel. Res. 2020, 59, 220–230. [Google Scholar]
- Azam, M.; Alam, M.M.; Hafeez, M.H. Effect of tourism on environmental pollution: Further evidence from Malaysia, Singapore and Thailand. J. Clean. Prod. 2018, 190, 330–338. [Google Scholar]
- Aslan, A.; Altinoz, B.; Özsolak, B. The nexus between economic growth, tourism development, energy consumption, and CO2 emissions in Mediterranean countrie. Environ. Sci. Pollut. Res. 2020, 27, 40930–40948. [Google Scholar]
- Hojeghan, S.B.; Esfangareh, A.N. Digital economy and tourism impacts, influences and challenge. Procedia Soc. Behav. Sci. 2011, 19, 308–316. [Google Scholar]
Figure 1.
The number of trips in rented accommodation: campsites, caravan or trailer park, EU-27, 2012–2018 (million trips). Source: Authors’ own contribution, based on data provided by EUROSTAT.
Figure 1.
The number of trips in rented accommodation: campsites, caravan or trailer park, EU-27, 2012–2018 (million trips). Source: Authors’ own contribution, based on data provided by EUROSTAT.
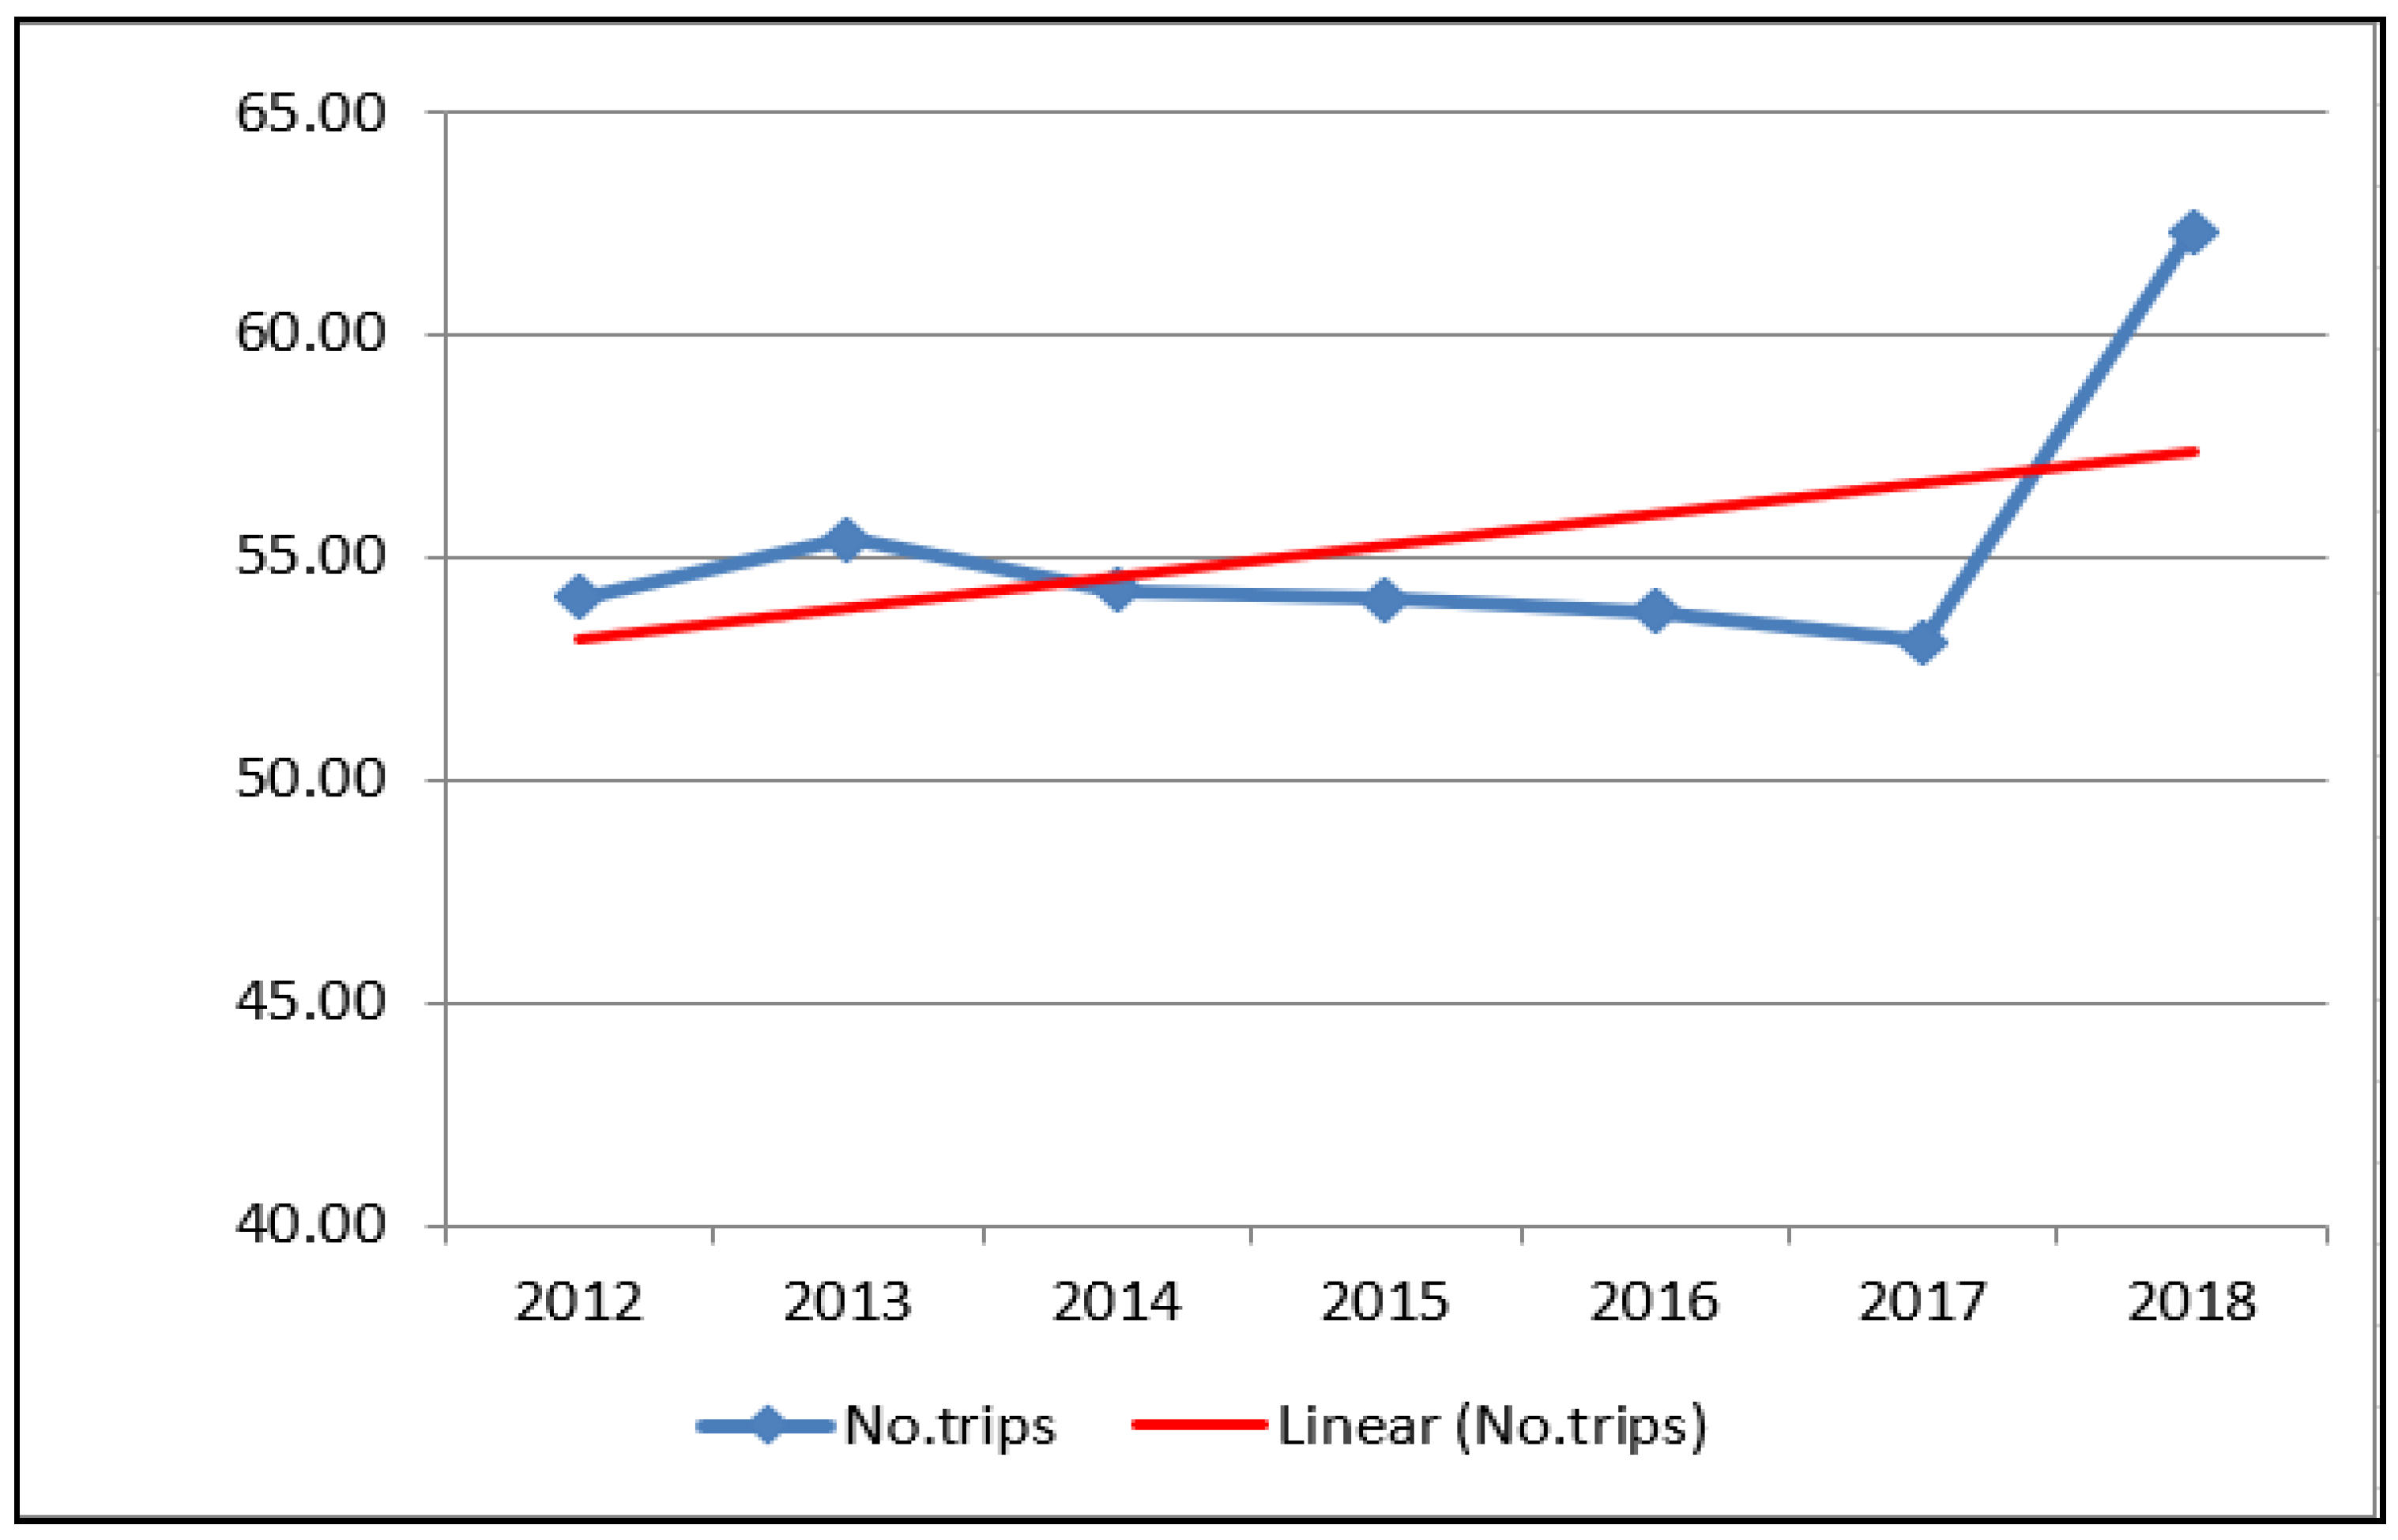
Figure 2.
Greenhouse gas emissions in accommodation and food service activities, EU-27, 2008–2018 (kg per capita). Source: Authors’ own contribution, based on data provided by EUROSTAT.
Figure 2.
Greenhouse gas emissions in accommodation and food service activities, EU-27, 2008–2018 (kg per capita). Source: Authors’ own contribution, based on data provided by EUROSTAT.

Figure 3.
Scree plot. Source: Authors’ own contribution, based on data provided by EUROSTAT.
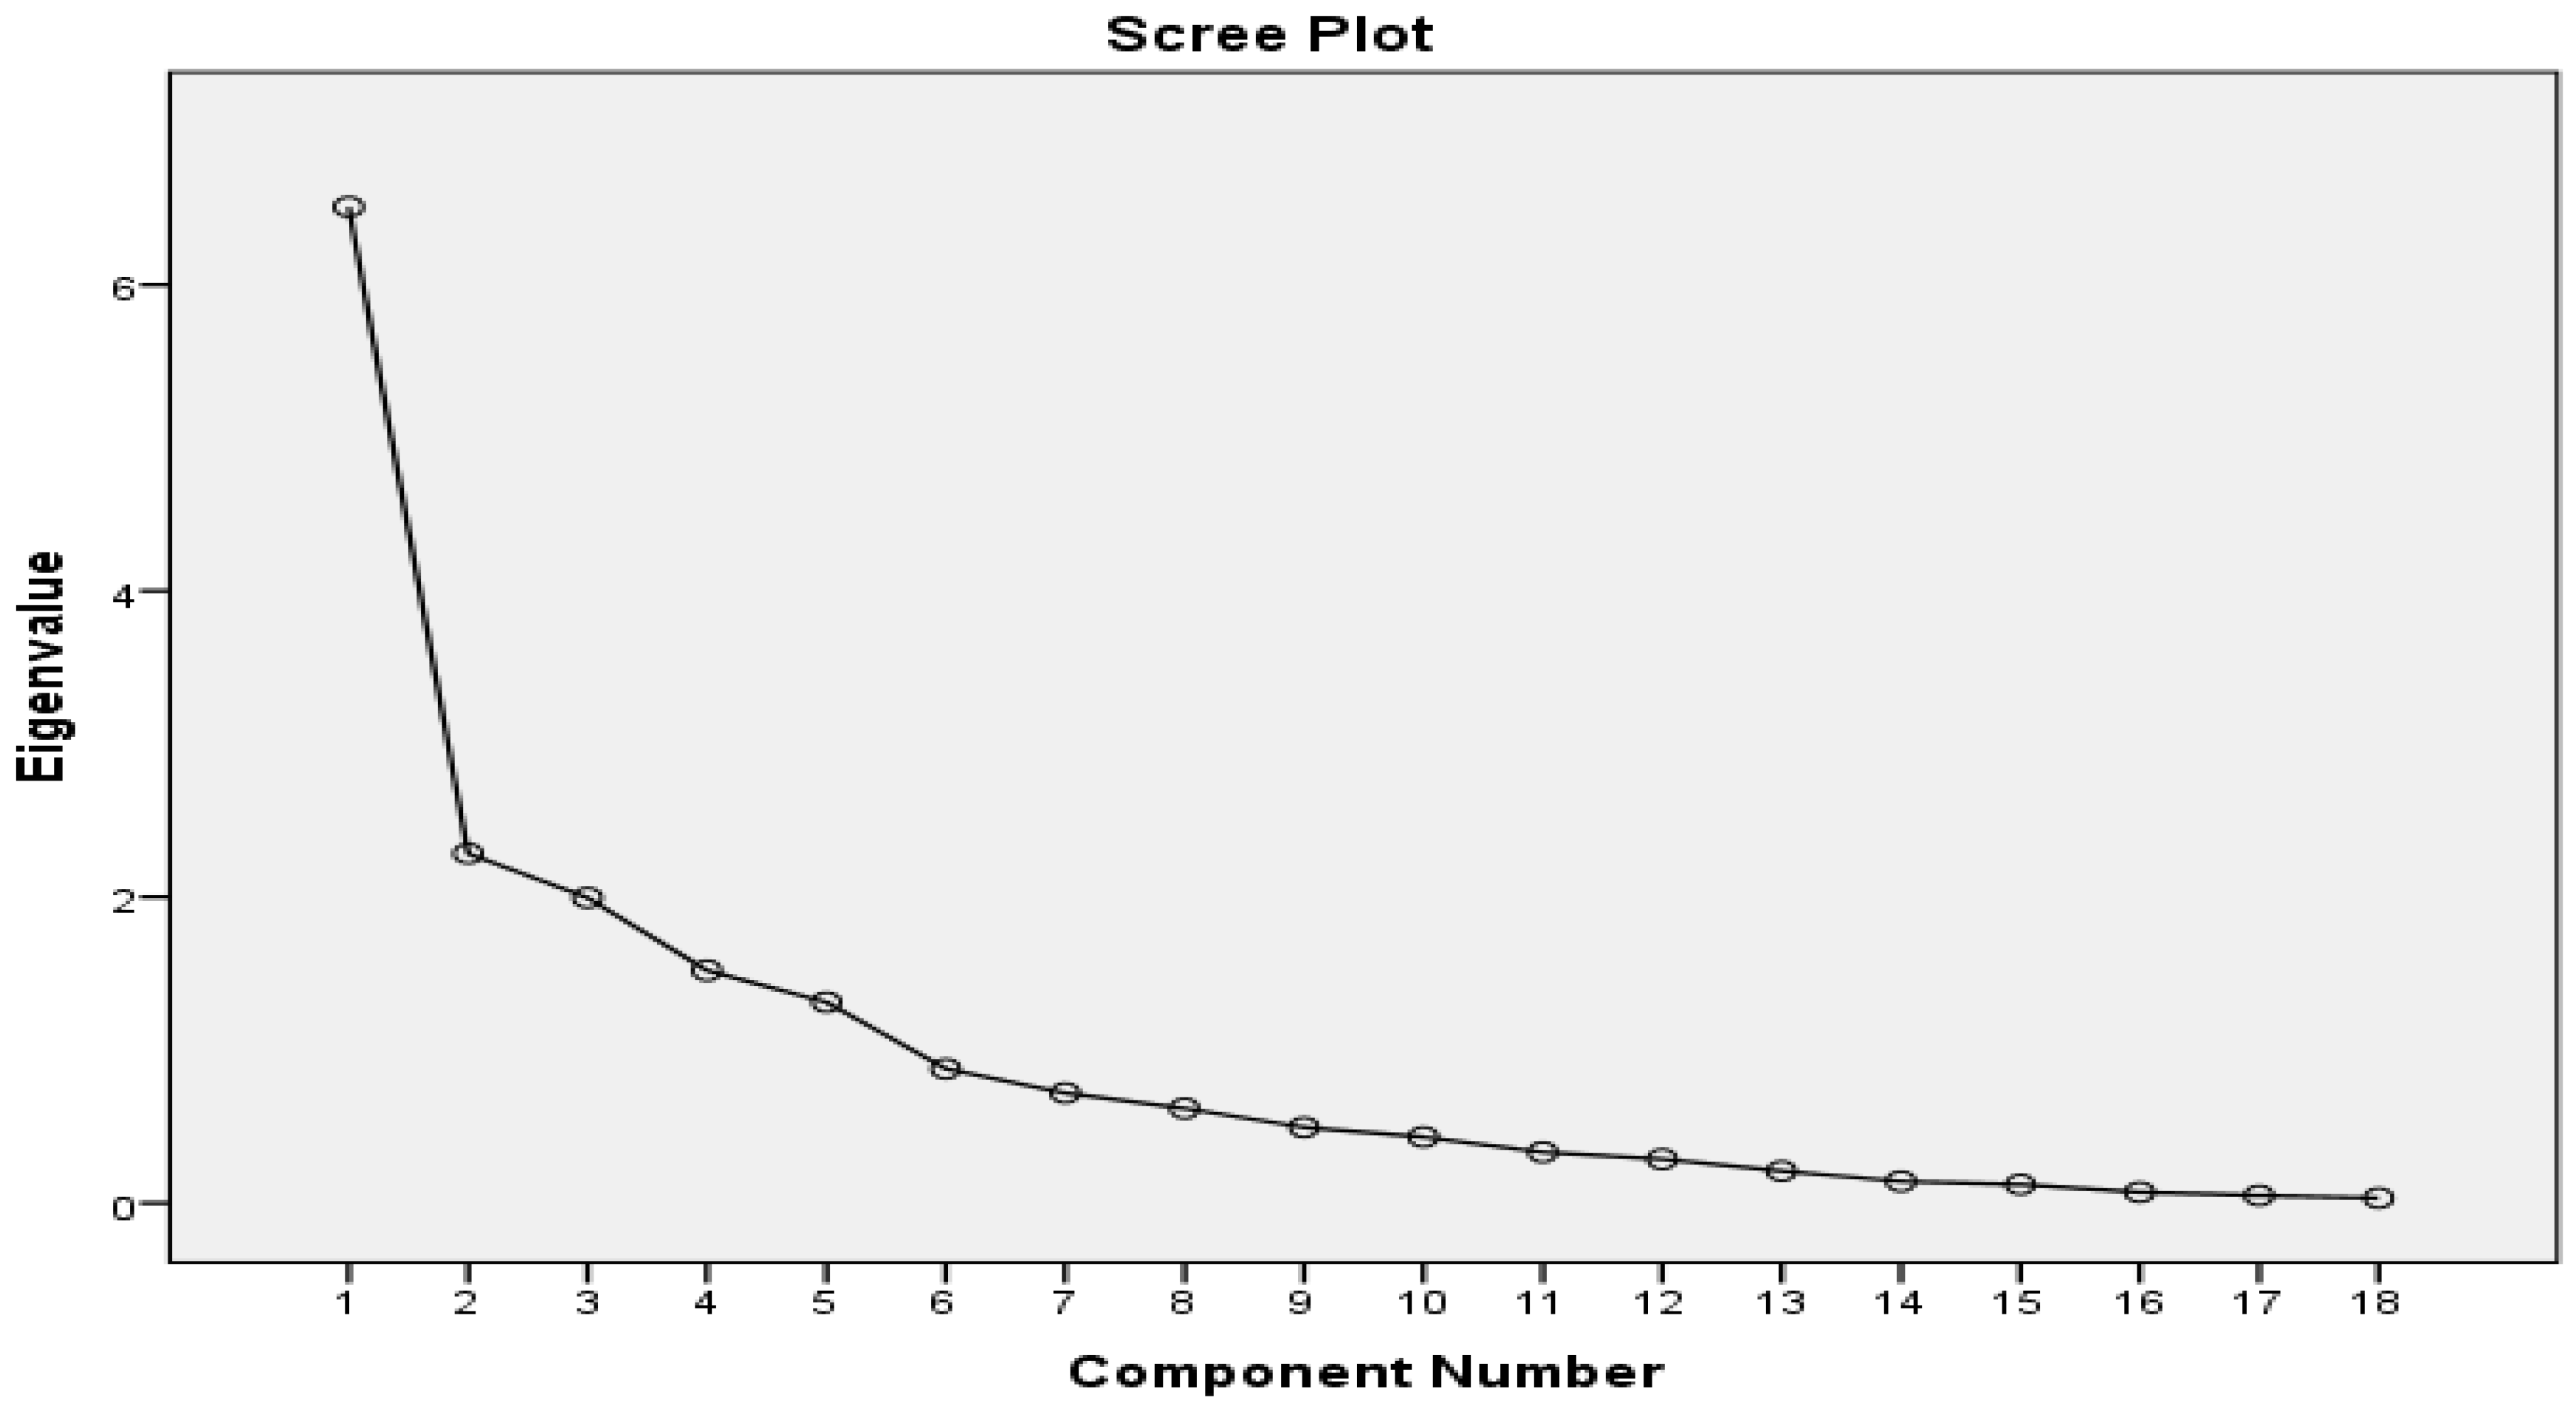
Figure 4.
Component plot in rotated space. Source: Authors’ own contribution, based on data provided by EUROSTAT.
Figure 4.
Component plot in rotated space. Source: Authors’ own contribution, based on data provided by EUROSTAT.
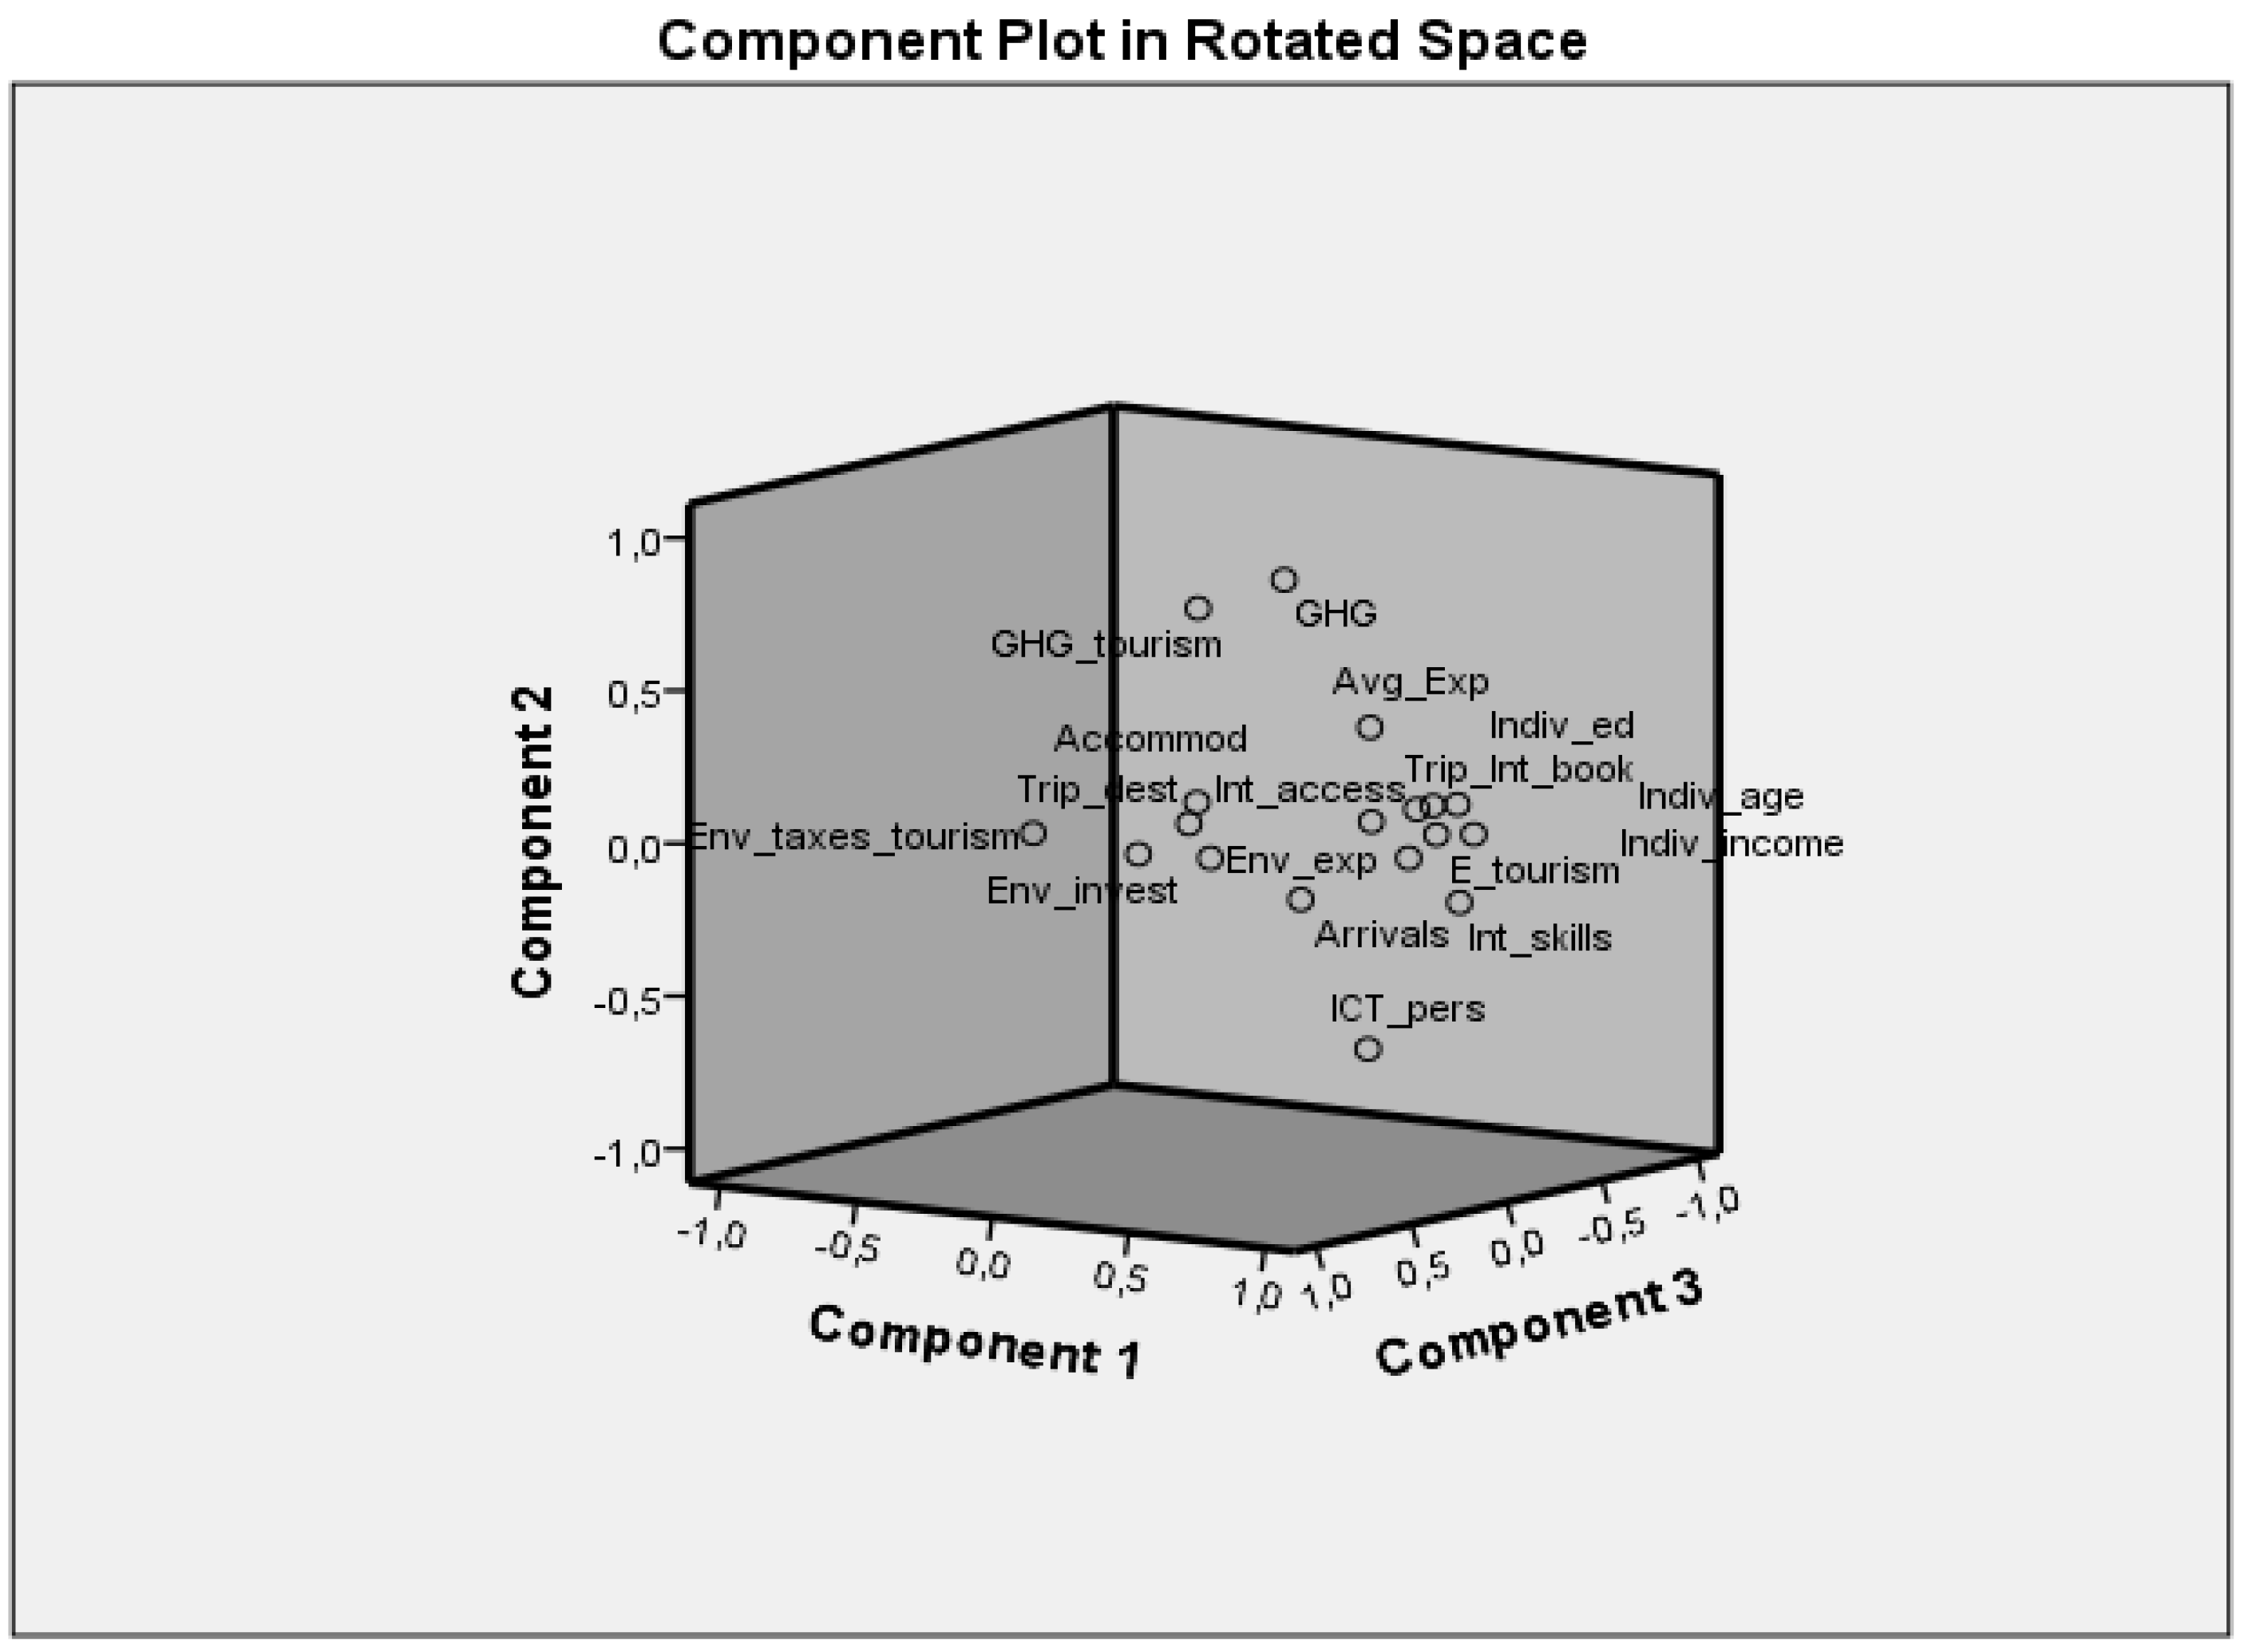
Figure 5.
Histogram of model residuals. Source: Authors’ own contribution, based on data provided by EUROSTAT.
Figure 5.
Histogram of model residuals. Source: Authors’ own contribution, based on data provided by EUROSTAT.

Figure 6.
Normal P-P plot of regression standardized residuals. Source: Authors’ own contribution, based on data provided by EUROSTAT.
Figure 6.
Normal P-P plot of regression standardized residuals. Source: Authors’ own contribution, based on data provided by EUROSTAT.

Figure 7.
Dendrogram based on Ward linkage. Source: Authors’ own contribution, based on data provided by EUROSTAT.
Figure 7.
Dendrogram based on Ward linkage. Source: Authors’ own contribution, based on data provided by EUROSTAT.


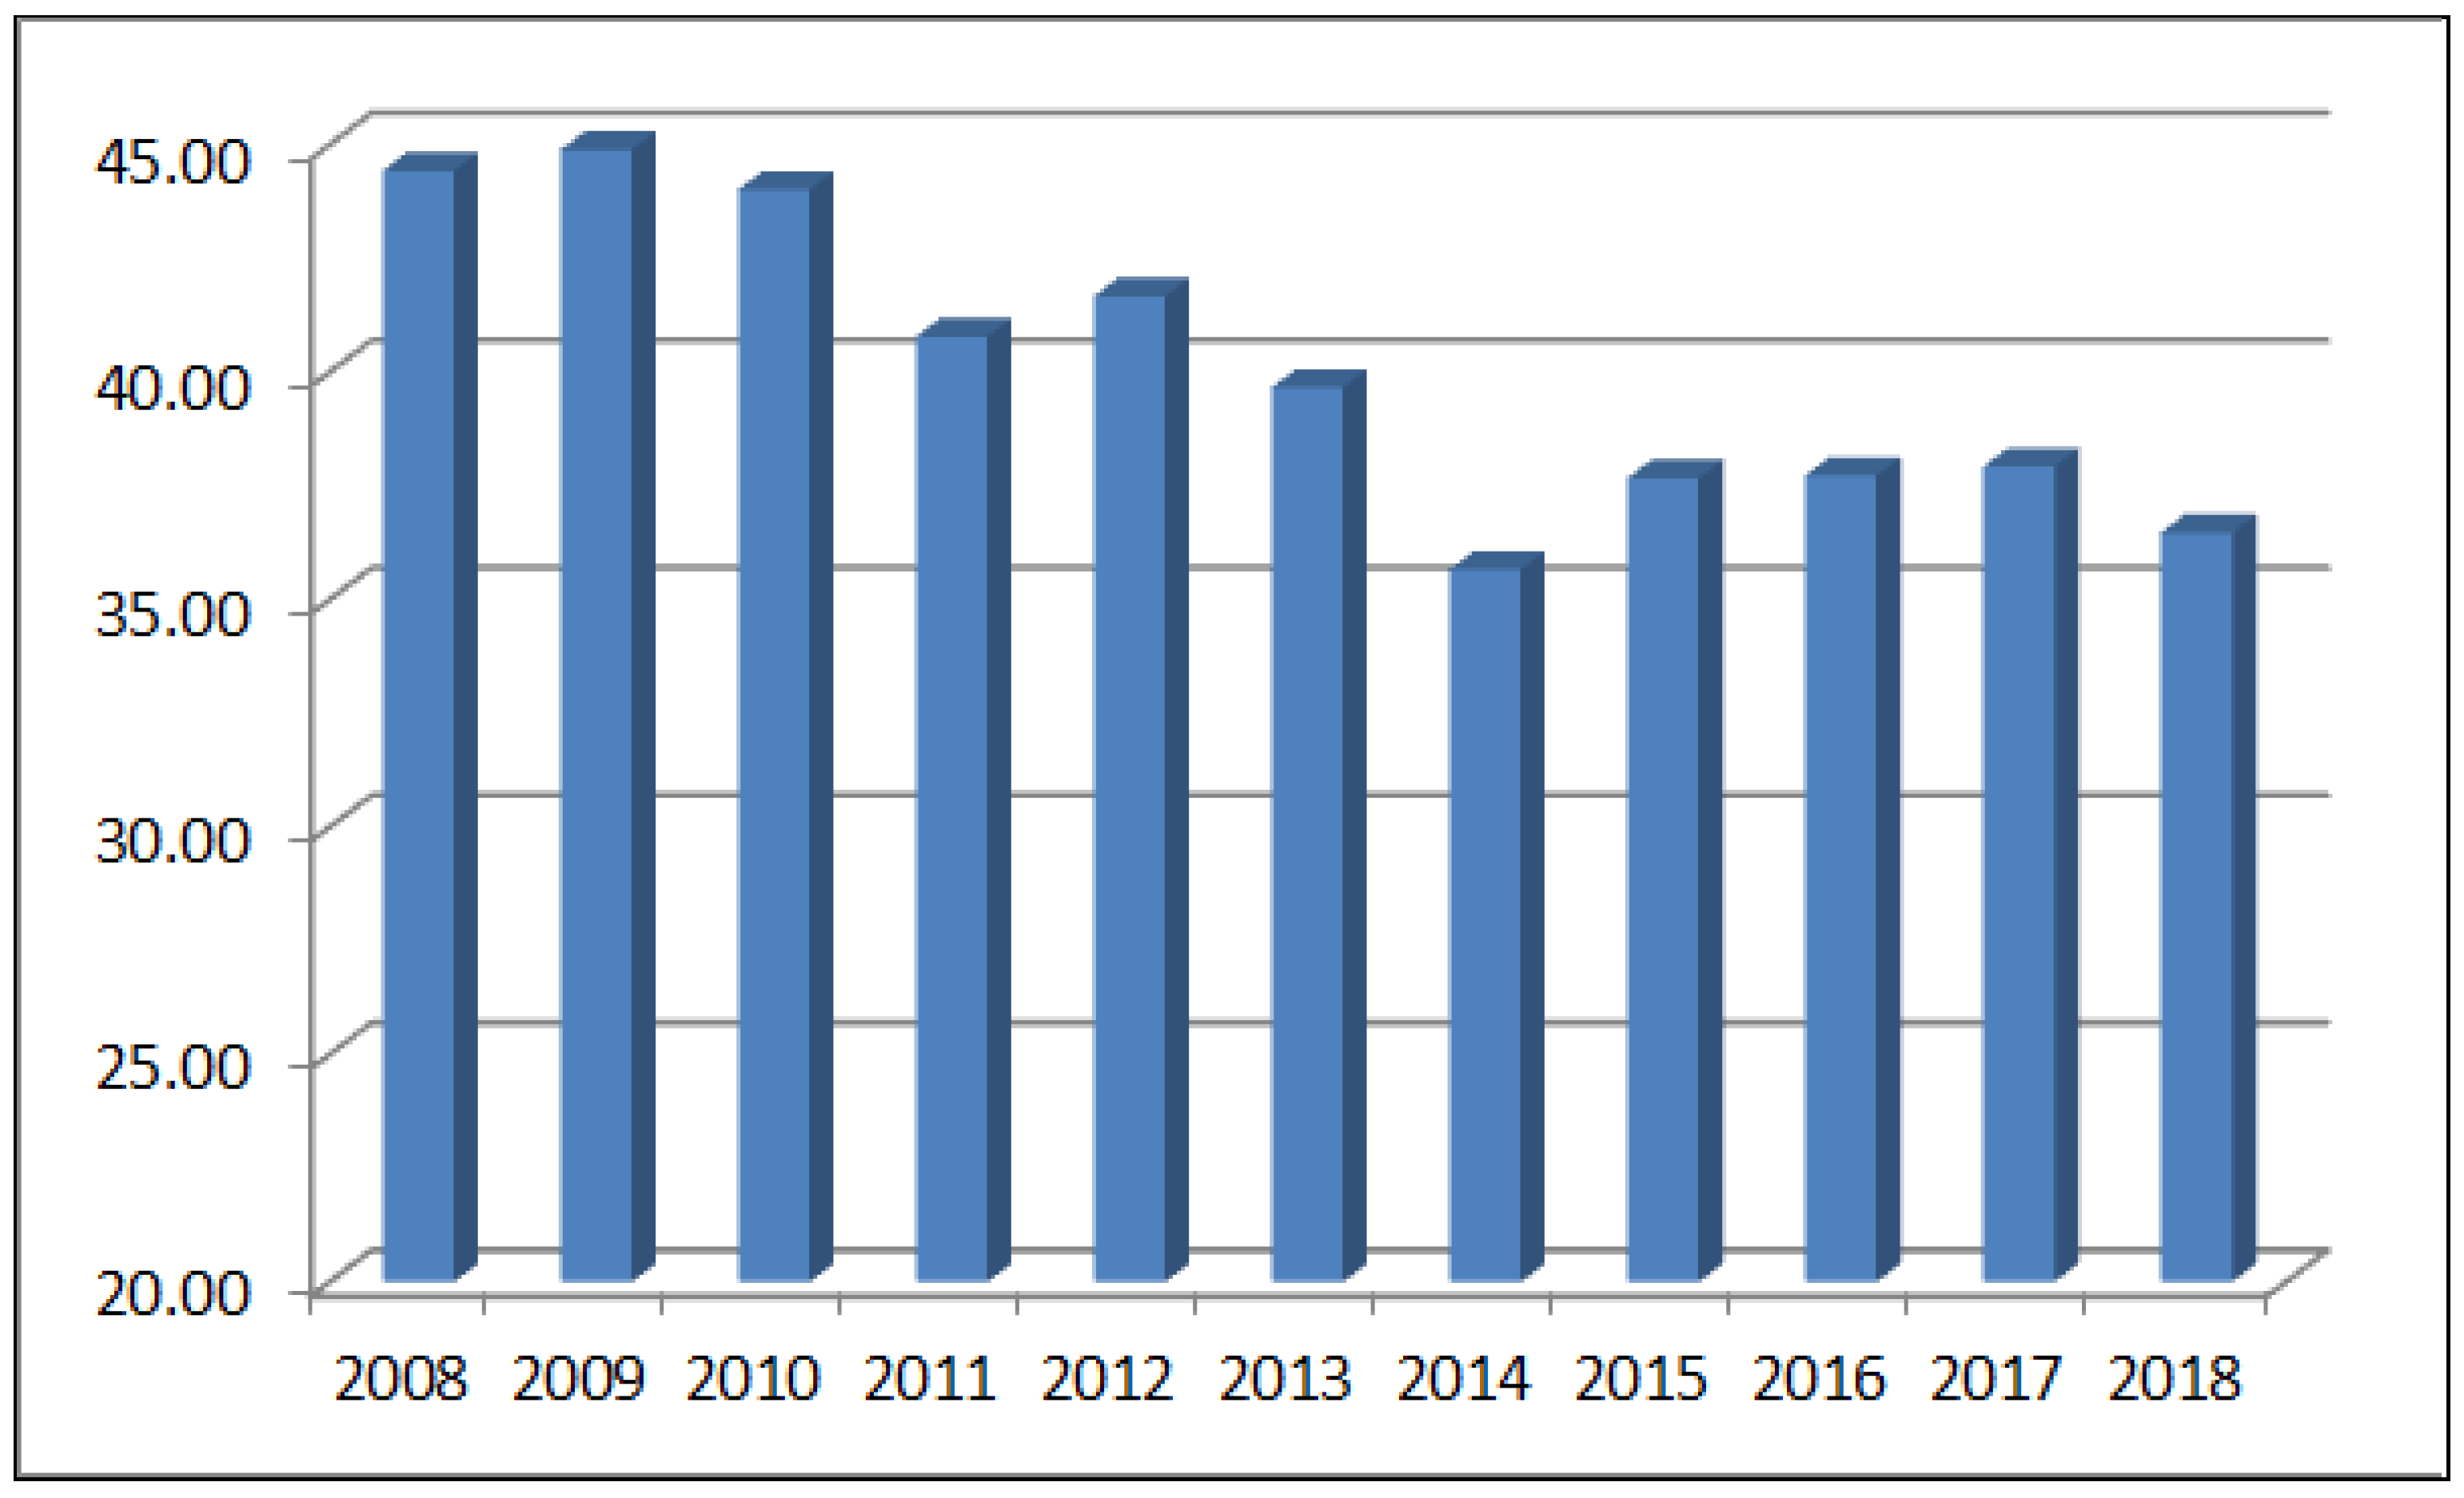
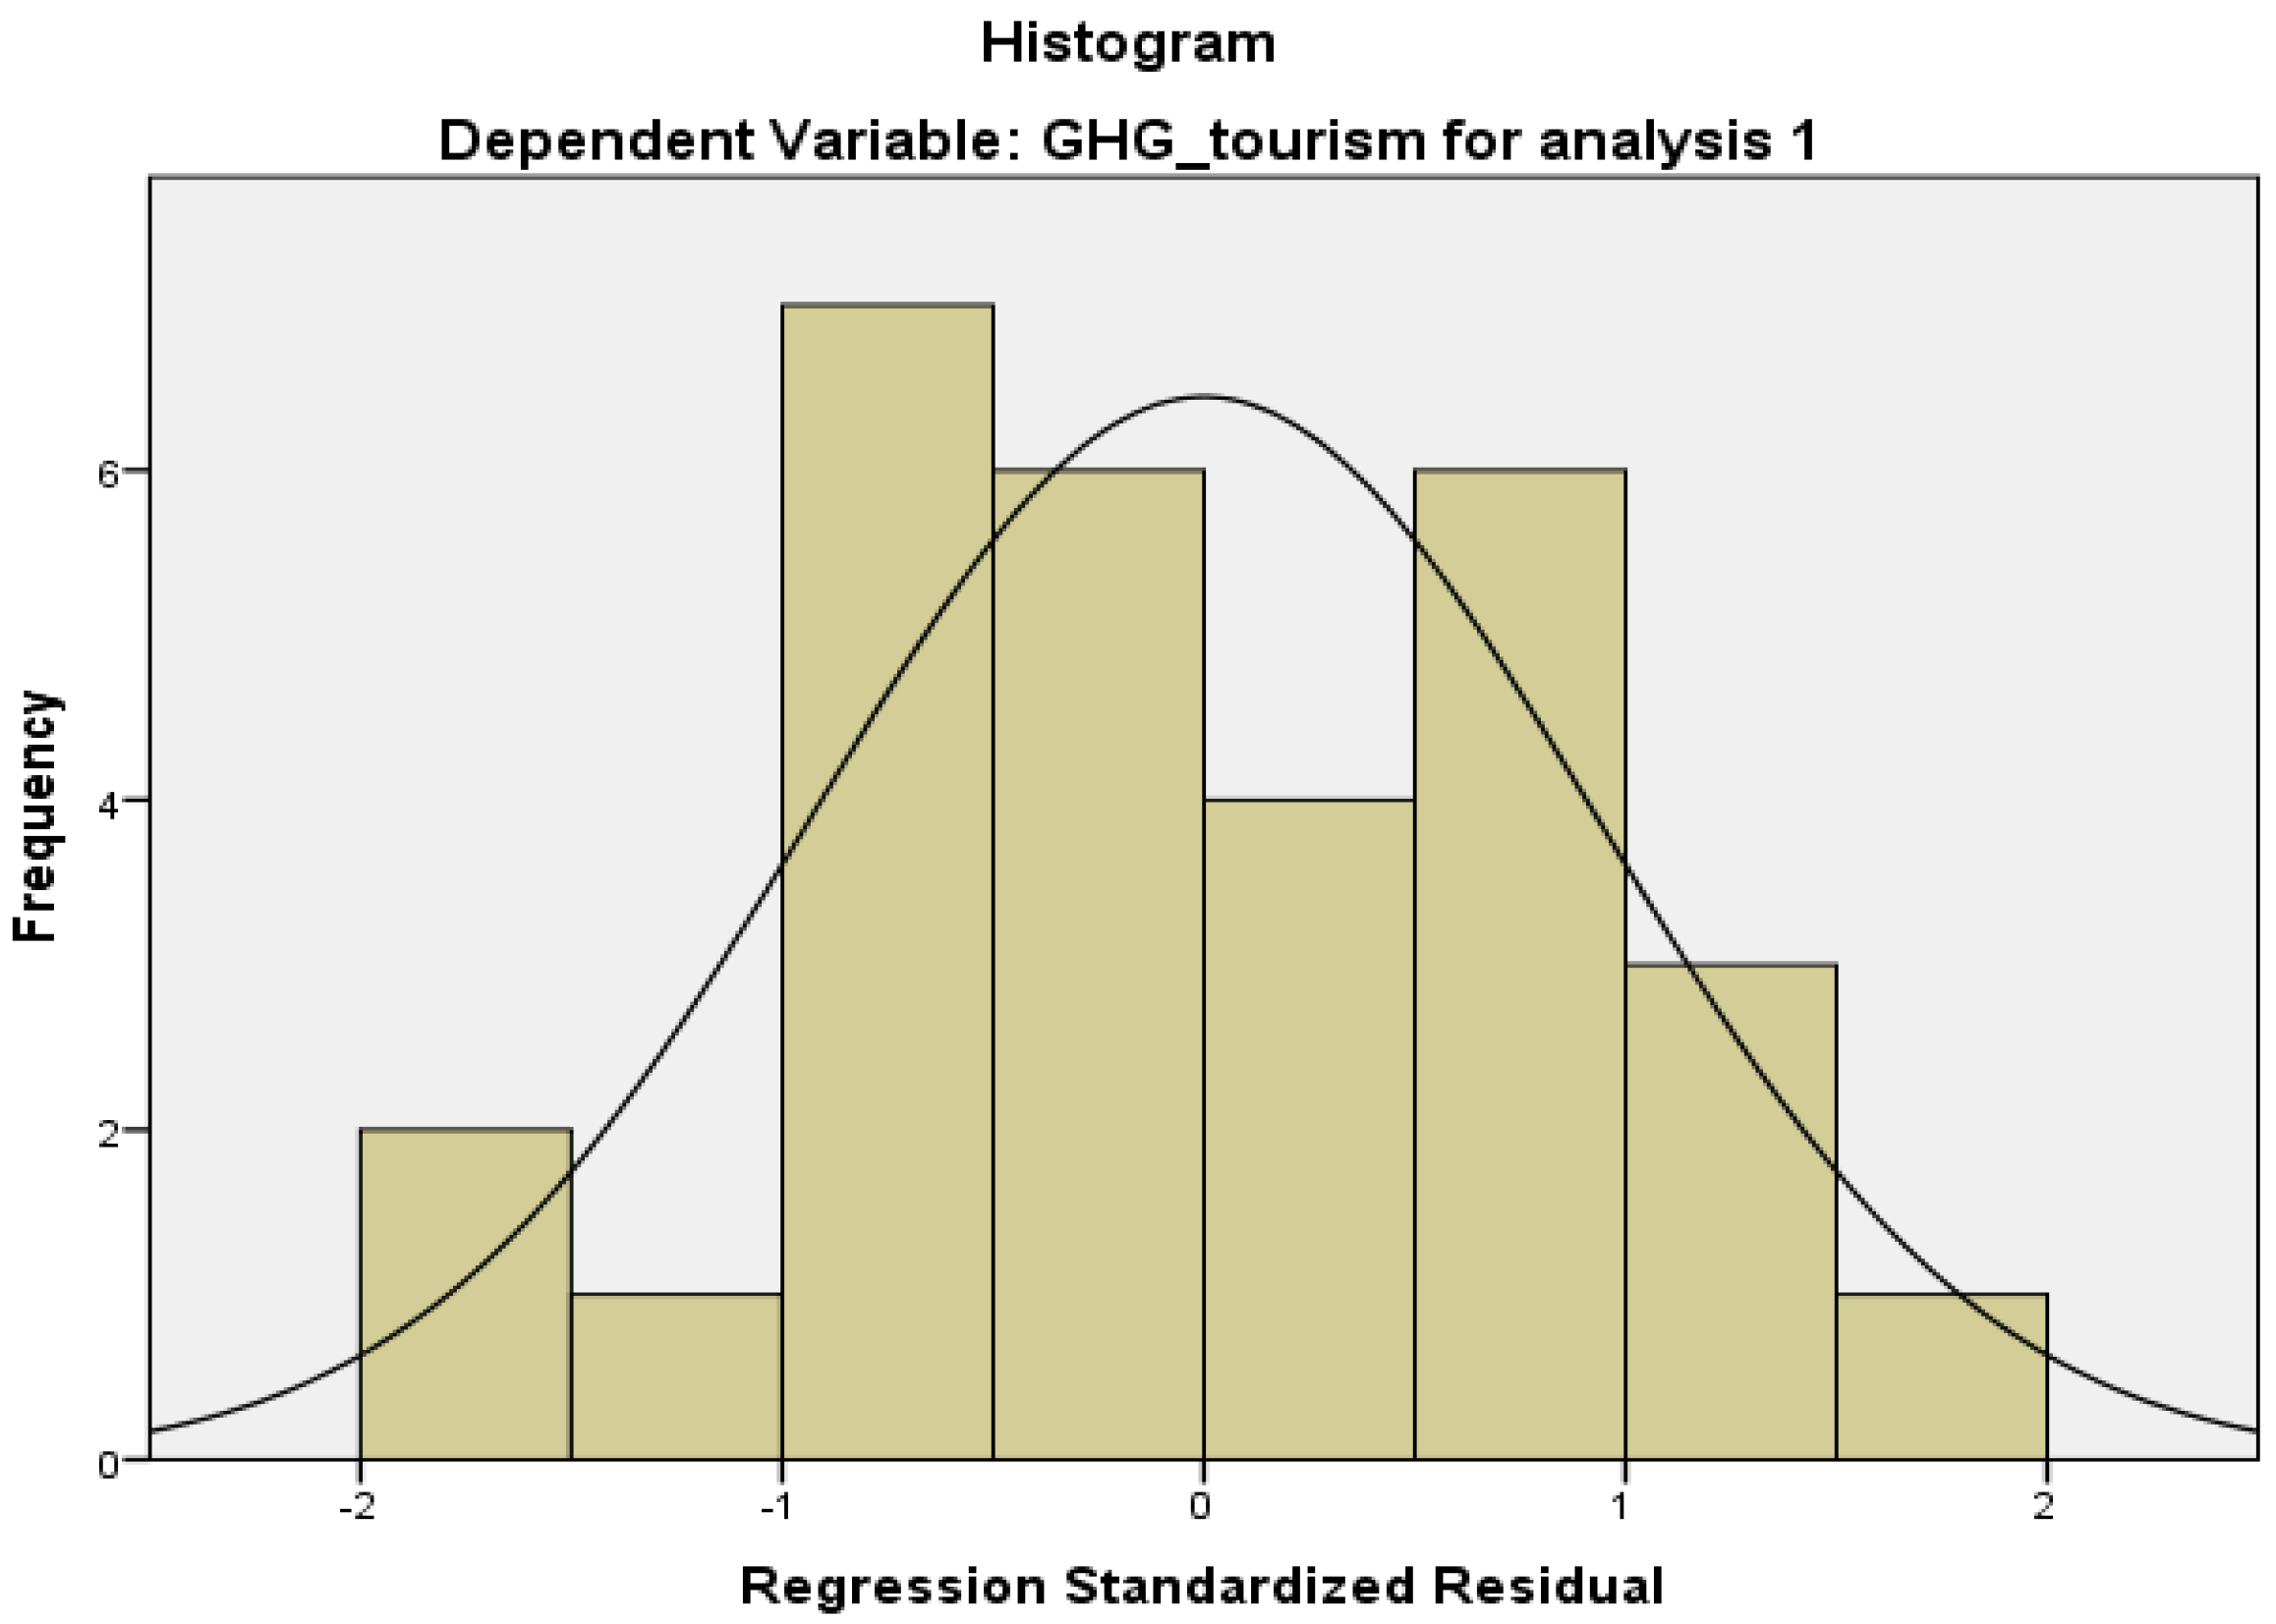
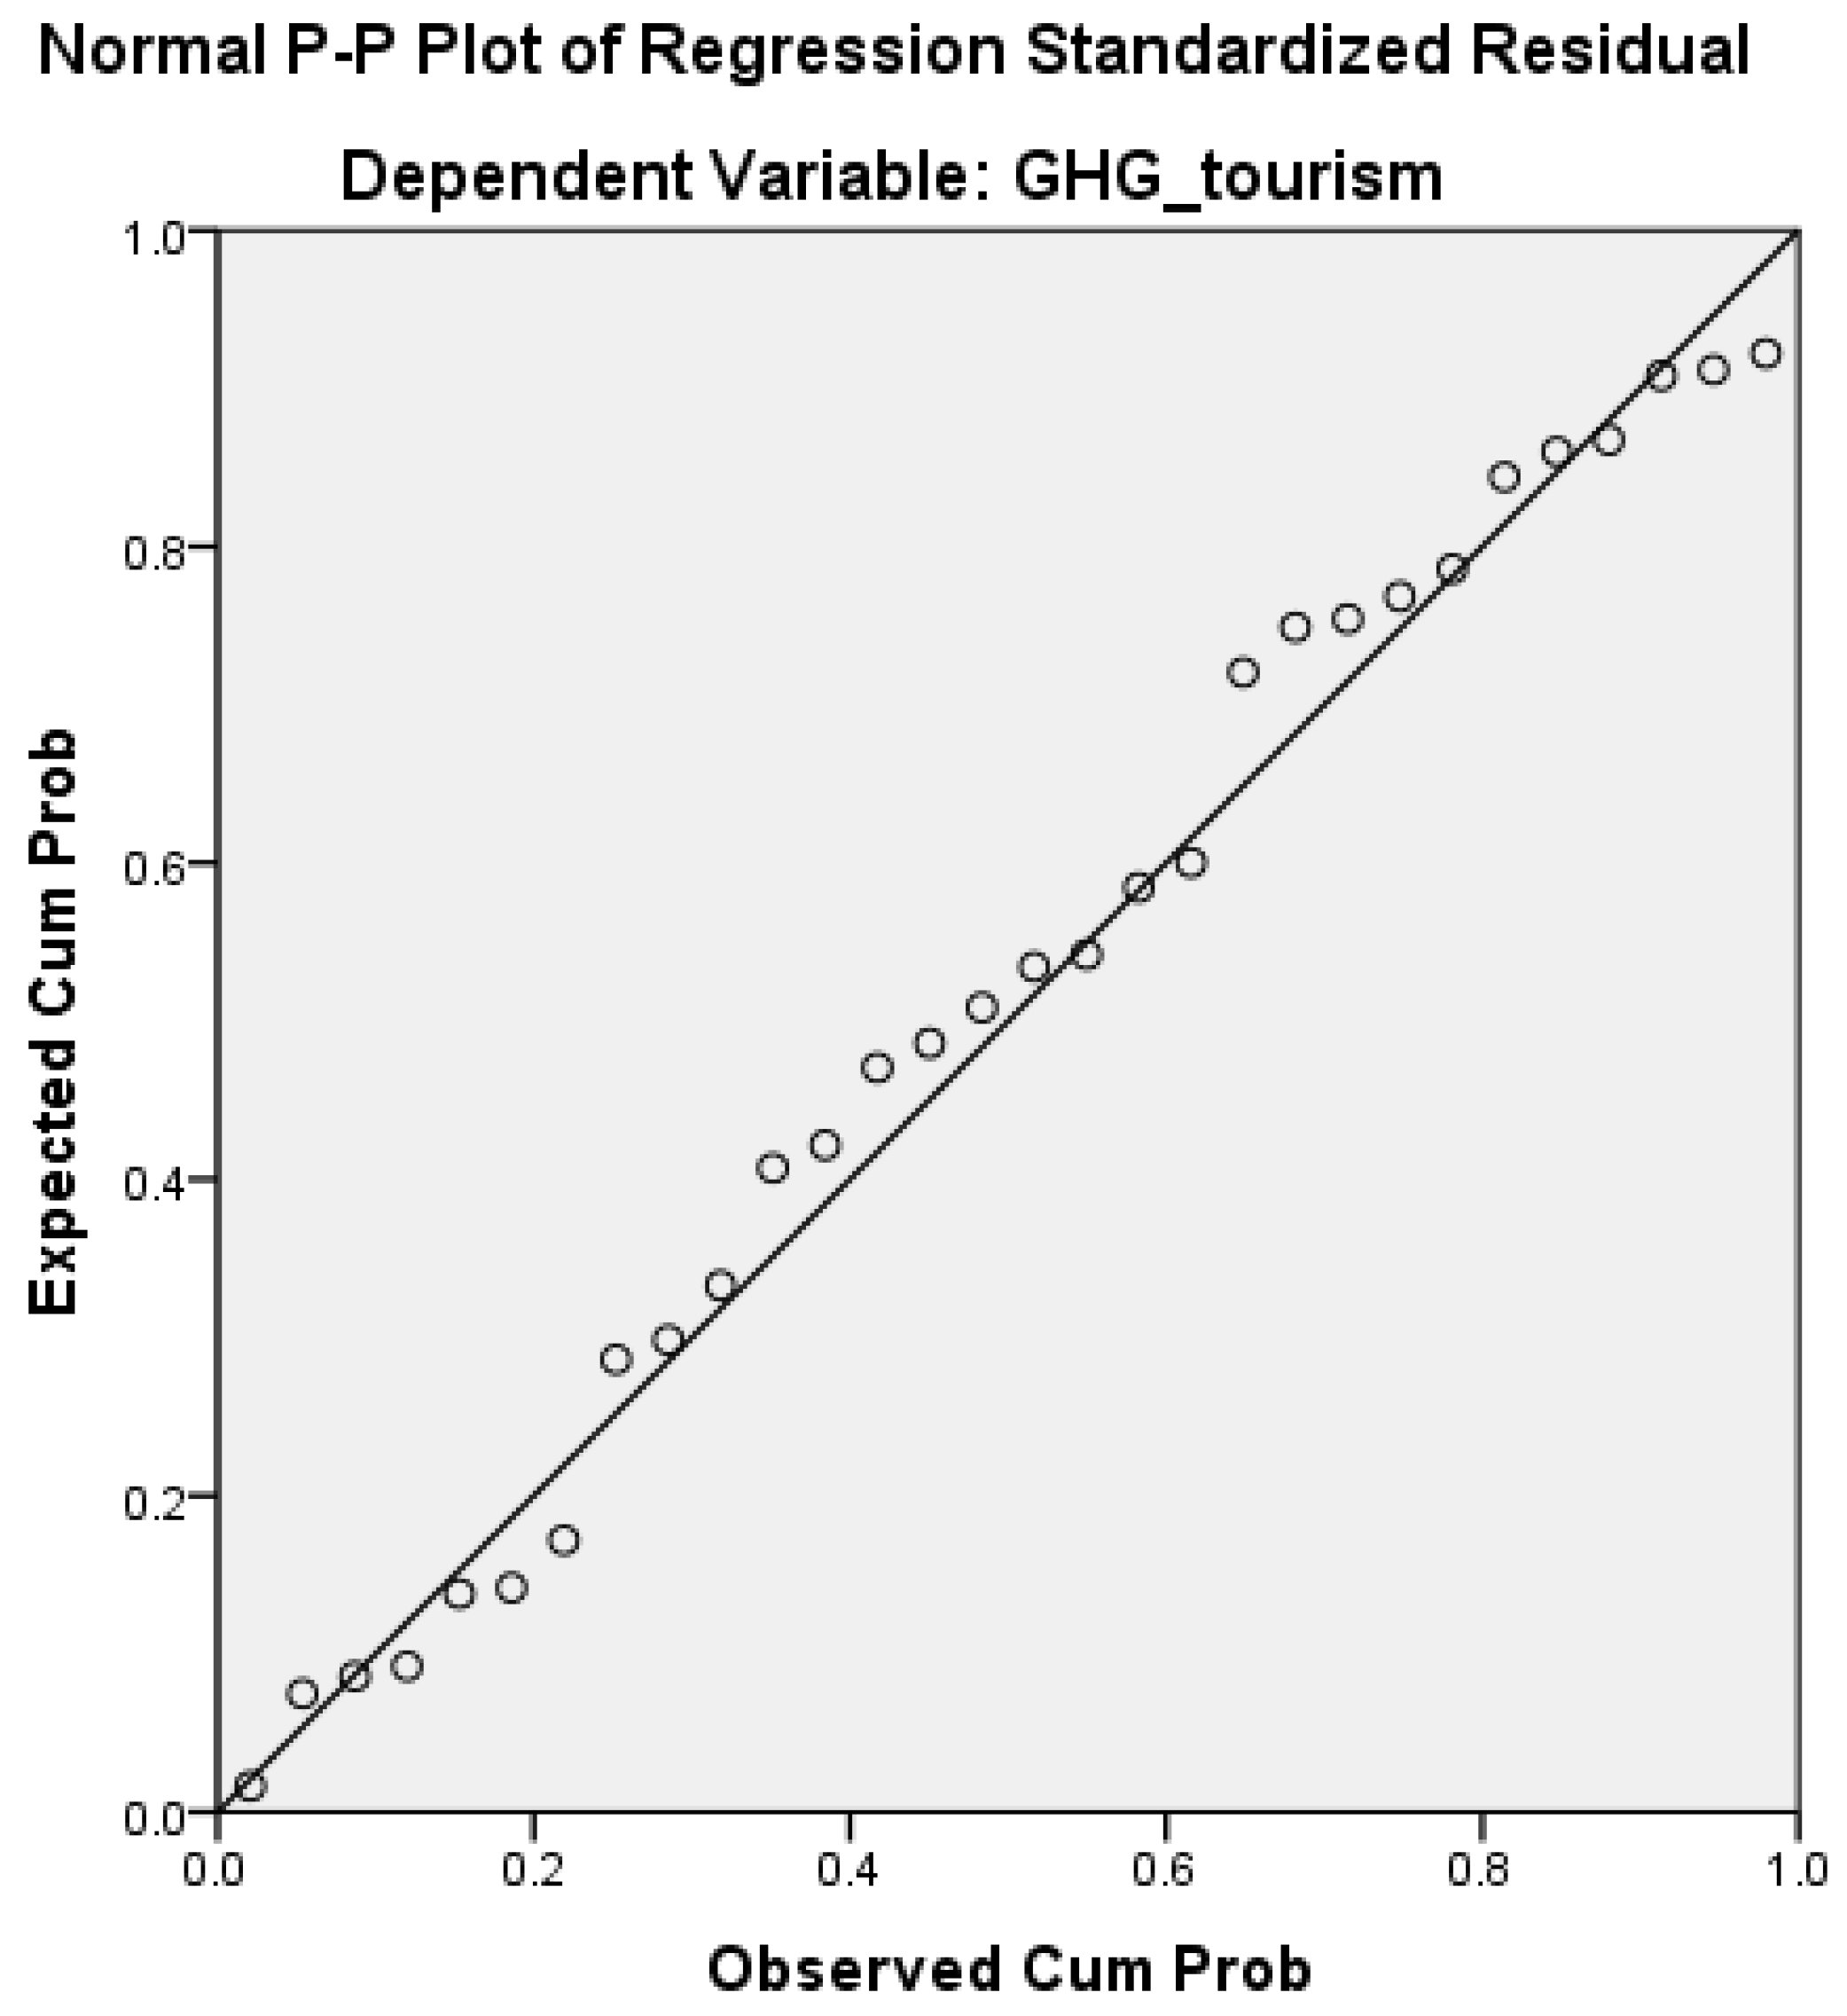
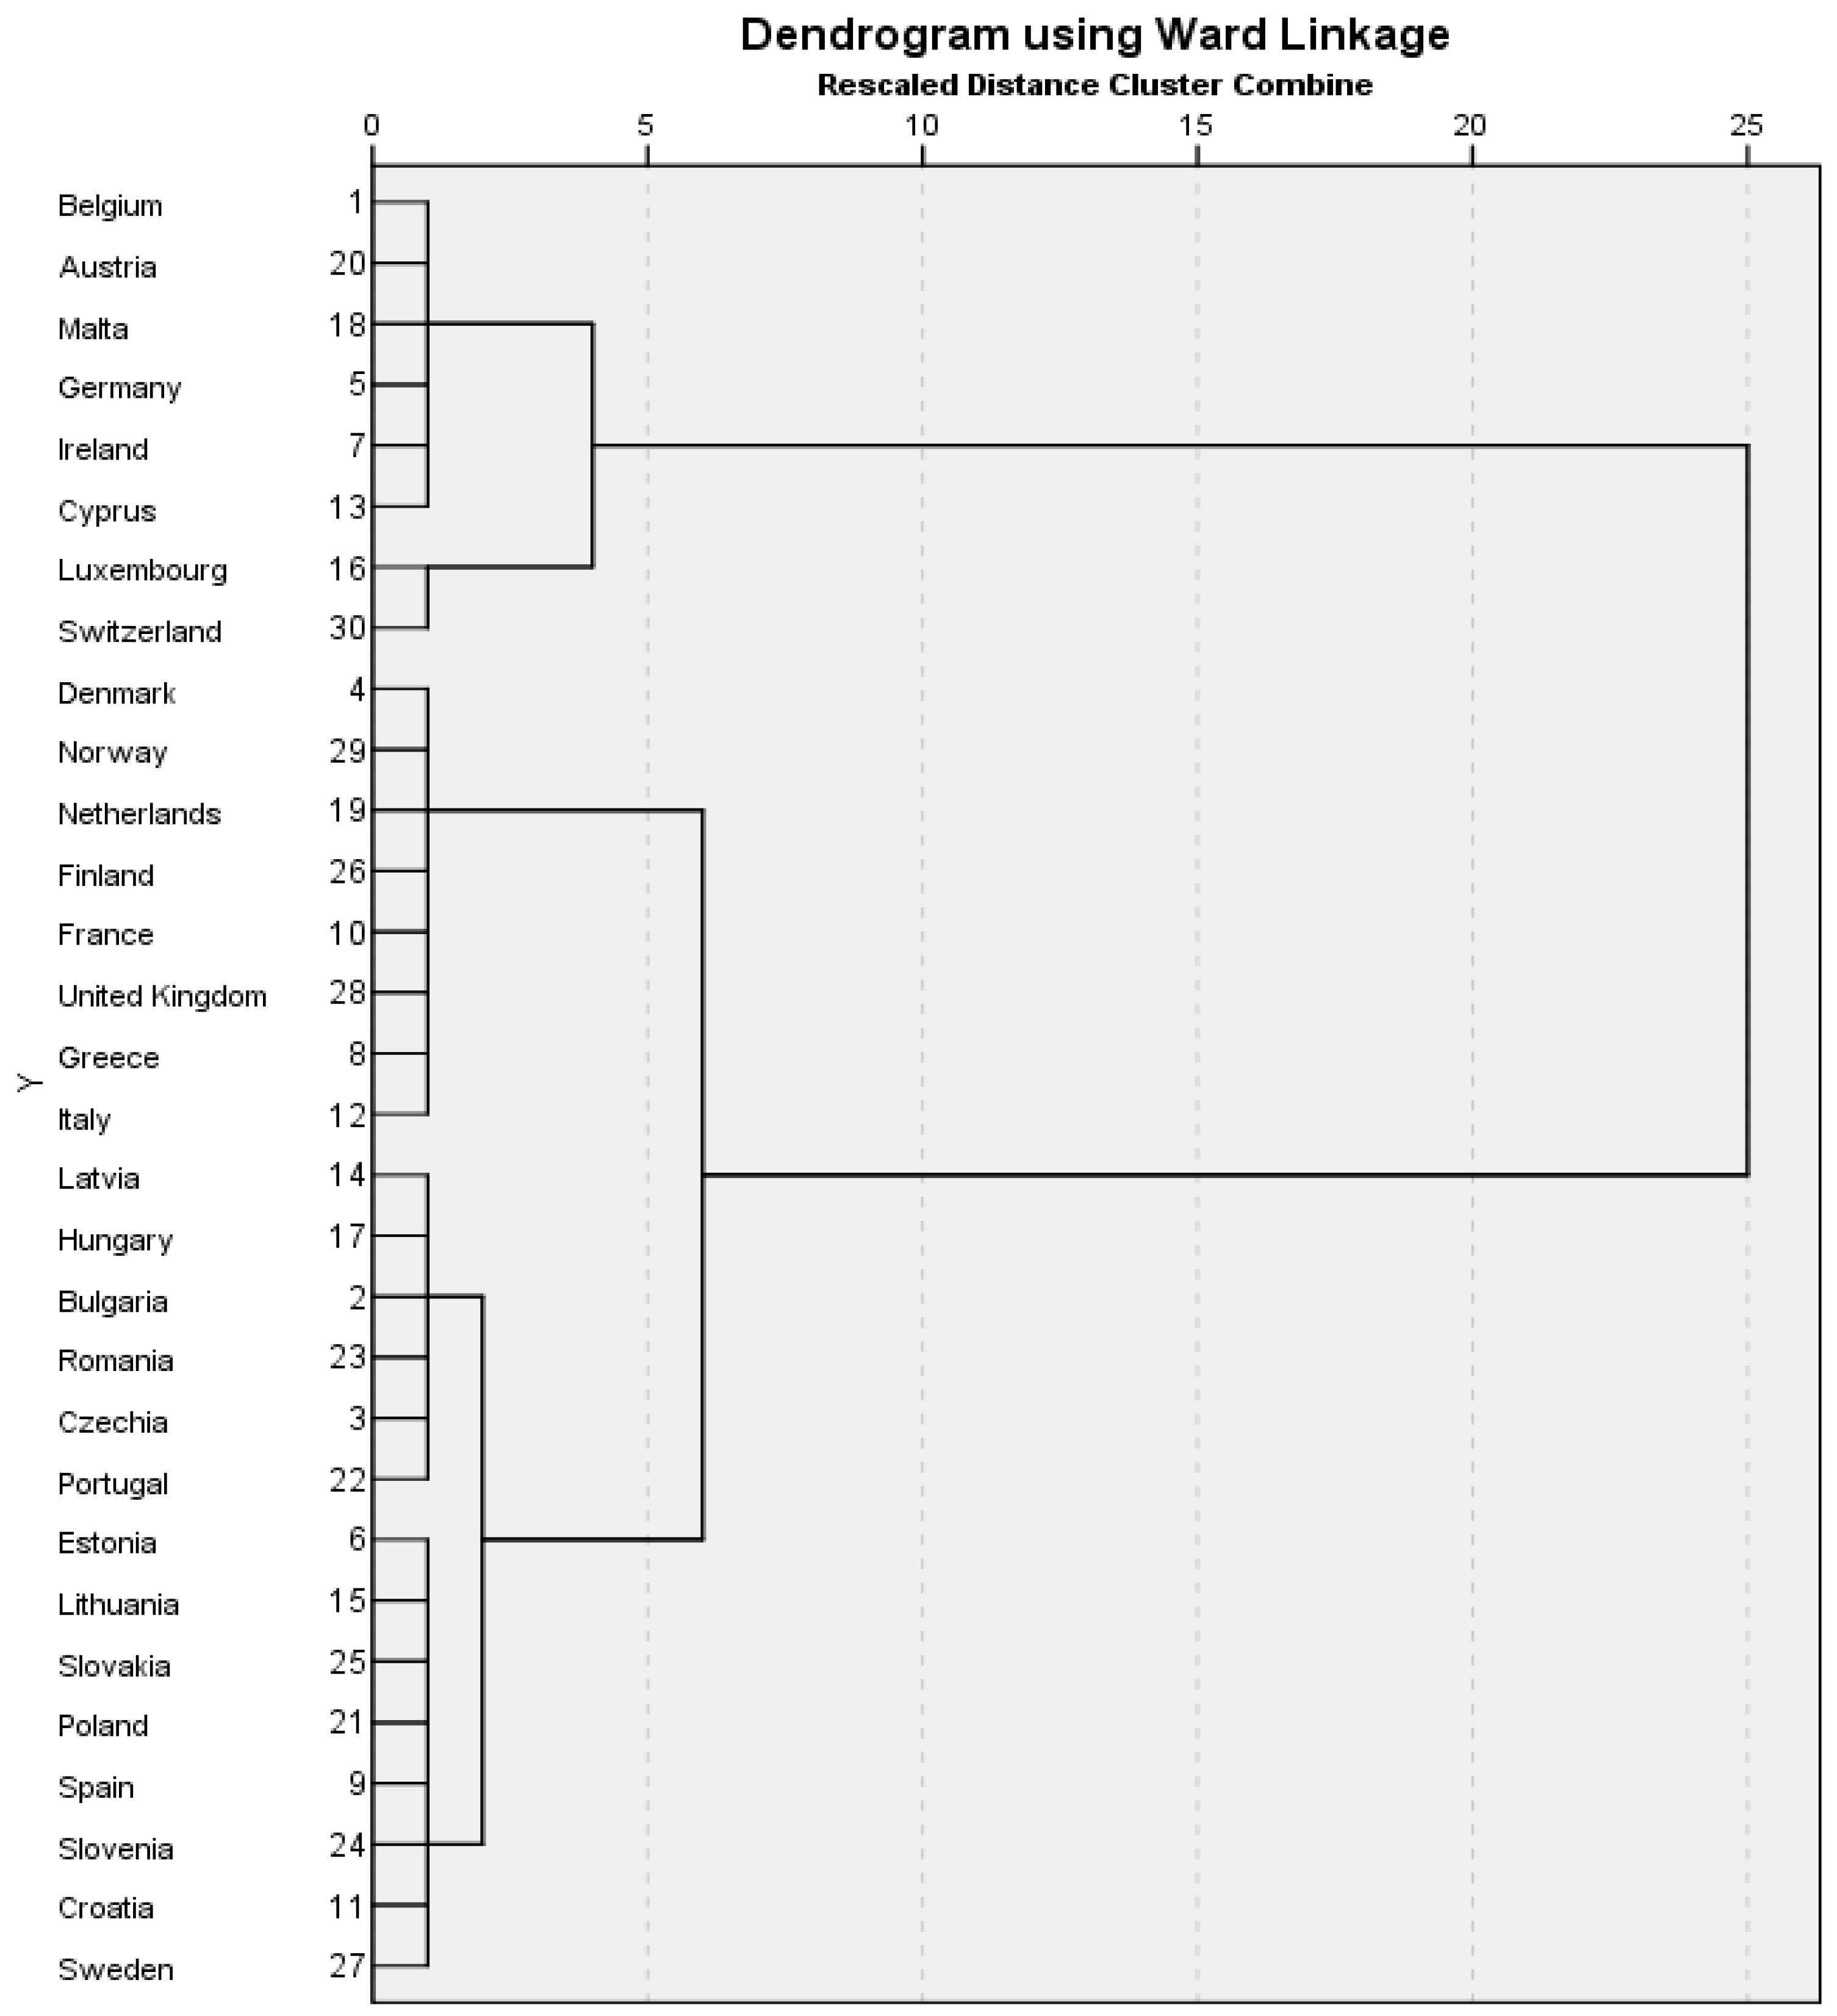
Table 1.
List of variables included in the study.
| Domain | Variable Name | Measurement Unit | Label |
|---|---|---|---|
| Tourism | Number of trips, (1 night or over, countryside and mountain), (% of total number of trips) | % | Trip_dest |
| Number of trips in rented green accommodation establishments (campsites, caravan or trailer parks) (% of total number of trips) | % | Accommod | |
| Number of trips with Internet booking of the main means of transport and accommodation (% of total number of trips) | % | Trip_Int_ book | |
| Average expenditure per trip (1 night or over) | EUR | Avg_Exp | |
| Number of arrivals at green tourism accommodation establishments (campsites, caravan or trailer parks) (% of total number of arrivals) | % | Arrivals | |
| ICT | Percentage of the ICT personnel in total employment | % | ICT_pers |
| Percentage of households with Internet access | % | Int_access | |
| Percentage of individuals aged 25–34 using the Internet | % | Indiv_age | |
| Percentage of individuals with high formal education using the Internet | % | Indiv_ed | |
| Percentage of individuals living in a household with income in fourth quartile using the Internet | % | Indiv_ income | |
| Percentage of individuals using the Internet for travel and accommodation services | % | E_tourism | |
| Percentage of individuals who have above basic overall digital skills | % | Int_skills | |
| Environment | Greenhouse gas emissions (GHG), base year 1990 | % | GHG |
| Greenhouse gas emissions in accommodation and food activities (% in total GHG) | % | GHG_ tourism | |
| Environmental protection investments (% of total) | % | Env_invest | |
| National expenditure on environmental protection (% of GDP) | % | Env_exp | |
| Environmental taxes (accommodation and food service activities, % of total) | % | Env_taxes_ tourism | |
| Economic development | GDP at market prices (Percentage of EU28 (2013–2020) total per capita (based on million euro), current prices) | % | GDP |
Source: Authors’ own selection.
Table 2.
KMO and Bartlett’s test.
| Kaiser-Meyer-Olkin Measure of Sampling Adequacy. | 0.617 | |
| Bartlett’s Test of Sphericity | Approx. Chi-Square | 344.001 |
| df | 153 | |
| Sig. | 000 | |
Source: Authors’ own contribution, based on data provided by EUROSTAT.
Table 3.
Total variance explained.
| Component | Initial Eigenvalues | Extraction Sums of Squared Loadings | Rotation Sums of Squared Loadings | ||||||
|---|---|---|---|---|---|---|---|---|---|
| Total | % of Variance | Cumulative % | Total | % of Variance | Cumulative % | Total | % of Variance | Cumulative % | |
| 1 | 6.509 | 36.160 | 36.160 | 6.509 | 36.160 | 36.160 | 6.309 | 35.051 | 35.051 |
| 2 | 2.284 | 12.686 | 48.846 | 2.284 | 12.686 | 48.846 | 2.045 | 11.363 | 46.414 |
| 3 | 1.994 | 11.080 | 59.927 | 1.994 | 11.080 | 59.927 | 1.887 | 10.485 | 56.899 |
| 4 | 1.520 | 8.443 | 68.369 | 1.520 | 8.443 | 68.369 | 1.727 | 9.596 | 66.495 |
| 5 | 1.312 | 7.292 | 75.661 | 1.312 | 7.292 | 75.661 | 1.650 | 9.166 | 75.661 |
| 6 | 0.878 | 4.876 | 80.537 | ||||||
| 7 | 0.718 | 3.992 | 84.529 | ||||||
| 8 | 0.617 | 3.430 | 87.959 | ||||||
| 9 | 0.495 | 2.748 | 90.707 | ||||||
| 10 | 0.432 | 2.397 | 93.105 | ||||||
| 11 | 0.332 | 1.846 | 94.950 | ||||||
| 12 | 0.287 | 1.597 | 96.548 | ||||||
| 13 | 0.209 | 1.161 | 97.708 | ||||||
| 14 | 0.141 | 0.784 | 98.492 | ||||||
| 15 | 0.121 | 0.669 | 99.162 | ||||||
| 16 | 0.070 | 0.391 | 99.552 | ||||||
| 17 | 0.049 | 0.271 | 99.823 | ||||||
| 18 | 0.032 | 0.177 | 100.000 | ||||||
Note: Extraction Method: Principal Component Analysis. Source: Authors’ own contribution, based on data provided by EUROSTAT.
Table 4.
Rotated component matrix a.
| Component | |||||
|---|---|---|---|---|---|
| 1 | 2 | 3 | 4 | 5 | |
| Trip_Int_book | 0.774 | 0.134 | 0.229 | −0.368 | −0.074 |
| Avg_Exp | 0.708 | 0.423 | 0.141 | −0.374 | −0.009 |
| Int_access | 0.868 | 0.016 | 0.168 | 0.240 | 0.152 |
| Indiv_age | 0.642 | 0.085 | −0.411 | 0.196 | 0.206 |
| Indiv_ed | 0.712 | 0.121 | −0.182 | 0.217 | 0.014 |
| Indiv_income | 0.663 | −0.019 | −0.467 | 0.337 | 0.183 |
| E_tourism | 0.918 | 0.087 | 0.094 | 0.148 | 0.082 |
| Int_skills | 0.924 | −0.151 | −0.020 | 0.126 | −0.065 |
| GDP | 0.850 | 0.164 | 0.099 | 0.041 | −0.204 |
| ICT_pers | 0.592 | −0.664 | −0.013 | −0.024 | −0.019 |
| GHG | 0.227 | 0.824 | −0.095 | −0.055 | −0.114 |
| GHG_tourism | 0.132 | 0.767 | 0.221 | 0.071 | 0.013 |
| Env_invest | 0.227 | 0.036 | 0.669 | 0.347 | 0.323 |
| Env_taxes_tourism | 0.003 | 0.115 | 0.901 | 0.076 | −0.038 |
| Accommod | 0.048 | 0.107 | 0.106 | 0.792 | 0.027 |
| Arrivals | 0.445 | −0.168 | 0.129 | 0.626 | −0.026 |
| Trip_dest | −0.058 | 0.010 | −0.004 | 0.045 | 0.840 |
| Env_exp | 0.056 | −0.084 | 0.048 | −0.018 | 0.816 |
Notes: Extraction Method: Principal Component Analysis. Rotation Method: Varimax with Kaiser Normalization. a Rotation converged in 9 iterations. Source: authors’ own contribution, based on data provided by EUROSTAT.
Table 5.
The four main components.
| Component 1 Tourism & Digitalization | Trip_Int_book |
| Avg_Exp | |
| Int_access | |
| Indiv_age | |
| Indiv_ed | |
| Indiv_income | |
| E_tourism | |
| Int_skills | |
| GDP | |
| Component 2 Tourism Pollution | ICT_pers |
| GHG | |
| GHG_tourism | |
| Component 3 Environment Protection | Env_invest |
| Env_taxes_tourism | |
| Component 4 Green Tourism | Accommod |
| Arrivals |
Table 6.
Model coefficients a.
| Model | Unstandardized Coefficients | Standardized Coefficients | t | Sig. | 95.0% Confidence Interval for B | Collinearity Statistics | ||||
|---|---|---|---|---|---|---|---|---|---|---|
| B | Std. Error | Beta | Lower Bound | Upper Bound | Tolerance | VIF | ||||
| 1 | (Constant) | 35.457 | 15.239 | 2.327 | 0.028 | 4.133 | 66.781 | |||
| Arrivals | −2.072 | 0.522 | −0.490 | −3.971 | 0.001 | −3.145 | −1.000 | 0.306 | 3.263 | |
| E_tourism | 0.582 | 0.273 | 0.280 | 2.130 | 0.043 | 0.020 | 1.144 | 0.271 | 3.690 | |
| GDP | 0.126 | 0.048 | 0.257 | 2.626 | 0.014 | 0.027 | 0.224 | 0.486 | 2.058 | |
Note: a Dependent Variable: GHG_tourism. Source: Authors’ own contribution, based on data provided by EUROSTAT.
Table 7.
Cluster composition.
| Cluster | Composition (Countries) |
|---|---|
| 1 | Belgium, Austria, Malta, Germany, Ireland, Cyprus |
| 2 | Denmark, Norway, Netherlands, Finland, France, United Kingdom, Greece, Italy |
| 3 | Latvia, Hungary, Bulgaria, Romania, Czech Republic, Portugal |
| 4 | Estonia, Lithuania, Slovakia, Poland, Spain, Slovenia, Croatia, Sweden |
Table 8.
Cluster characterization according to hierarchical classification criteria. Source: Authors’ own contribution, based on data provided by EUROSTAT.
Table 8.
Cluster characterization according to hierarchical classification criteria. Source: Authors’ own contribution, based on data provided by EUROSTAT.
| COMPONENT 1—Tourism & Digitalization | |||||||||||
|---|---|---|---|---|---|---|---|---|---|---|---|
| Trip_ Int_Book | Avg_ Exp | Int_ Access | Indiv_ Age | Indiv_ Ed | Indiv_ Income | E_Tourism | Int_ Skills | GDP | |||
| Cluster 1 | 76.86 | 569.62 | 88.17 | 97.50 | 97.67 | 94.83 | 44.67 | 31.7 | 127.38 | ||
| Cluster 2 | 51.40 | 370.95 | 90.63 | 97.25 | 97.63 | 94.25 | 48.25 | 38.5 | 131.84 | ||
| Cluster 3 | 19.63 | 140.44 | 80.50 | 94.67 | 95.50 | 90.50 | 22.67 | 21.50 | 44.77 | ||
| Cluster 4 | 37.29 | 236.28 | 85.13 | 96.88 | 95.50 | 95.38 | 34.25 | 31.25 | 69.03 | ||
| Overall Average | 46.29 | 329.32 | 86.10 | 96.57 | 96.57 | 93.74 | 37.46 | 30.79 | 93.25 | ||
| COMPONENT 2 Tourism Pollution | COMPONENT 3 Environment Protection | COMPONENT 4 Green Tourism | |||||||||
| ICT_Pers | GHG | GHG_ Tourism | Env_ Invest | Env_Taxes _Tourism | Accommod | Arrivals | |||||
| Cluster 1 | 2.98 | 103.22 | 0.66 | 4.91 | 2.58 | 4.77 | 2.80 | ||||
| Cluster 2 | 3.15 | 82.98 | 0.59 | 6.13 | 8.26 | 5.61 | 11.59 | ||||
| Cluster 3 | 2.99 | 66.92 | 0.42 | 0.90 | 0.50 | 6.14 | 3.57 | ||||
| Cluster 4 | 3.12 | 75.48 | 0.35 | 1.54 | 1.58 | 4.15 | 7.20 | ||||
| Overall Average | 3.06 | 82.15 | 0.50 | 3.37 | 3.23 | 5.17 | 6.29 | ||||
| Legend: | |||||||||||
| the most favorable level | |||||||||||
| the most unfavorable level | |||||||||||
Publisher’s Note: MDPI stays neutral with regard to jurisdictional claims in published maps and institutional affiliations. |
© 2020 by the authors. Licensee MDPI, Basel, Switzerland. This article is an open access article distributed under the terms and conditions of the Creative Commons Attribution (CC BY) license (http://creativecommons.org/licenses/by/4.0/).
Share and Cite
MDPI and ACS Style
Saseanu, A.S.; Ghita, S.I.; Albastroiu, I.; Stoian, C.-A. Aspects of Digitalization and Related Impact on Green Tourism in European Countries. Information 2020, 11, 507. https://doi.org/10.3390/info11110507
AMA Style
Saseanu AS, Ghita SI, Albastroiu I, Stoian C-A. Aspects of Digitalization and Related Impact on Green Tourism in European Countries. Information. 2020; 11(11):507. https://doi.org/10.3390/info11110507
Chicago/Turabian StyleSaseanu, Andreea Simona, Simona Ioana Ghita, Irina Albastroiu, and Carmen-Alexandra Stoian. 2020. "Aspects of Digitalization and Related Impact on Green Tourism in European Countries" Information 11, no. 11: 507. https://doi.org/10.3390/info11110507
Note that from the first issue of 2016, this journal uses article numbers instead of page numbers. See further details here.