Early Diagnosis of Carotid Stenosis by Ultrasound Doppler Investigations: A Classification Method for the Hemodynamic Parameter


College of Computer Science, Sichuan University, Chengdu 610065, China
*
Author to whom correspondence should be addressed.
Information 2020, 11(11), 493; https://doi.org/10.3390/info11110493
Submission received: 11 September 2020
/
Revised: 17 October 2020
/
Accepted: 20 October 2020
/
Published: 22 October 2020
(This article belongs to the Special Issue Data Modeling and Predictive Analytics)
Abstract
:Pulsed Wave Doppler (PWD) is a traditional ultrasound technique used for the diagnosis of cardiovascular disease. The conventional diagnostic method is based on hemodynamic parameters obtained from the PW spectrum. However, it relies on the clinical experience of sonographers, and especially focusing on severe carotid stenosis. This paper proposes a classification method for the hemodynamic parameter using the RUSBoost algorithm. The proposed method improves the performance of RUSBoost by setting the empirical weight of each sample. The experimental results show that the proposed method reaches the accuracy of 90.1%, the sensitivity of 70%, and the specificity of 94%, which are 4%, 6%, and 2% higher than the original RUSBoost respectively. In addition, the proposed method is objective, since the empirical weights are computed based on Mahalanobis distance without any expert input. It can be used for the early detection of cardiovascular disease.
1. Introduction
Vascular ultrasound is now widely used in the diagnosis of diseases, including arterial stenosis [1,2], fetal anomalies [3], diabetes and atherosclerosis [4]. The hemodynamic parameters obtained by the Doppler ultrasound technique [5] can be used for evaluating vascular and cardiac. When the angle between the ultrasound scanning beam and the blood flow direction is fixed, there is a positive correlation between the phase shift and blood flow velocity which can be calculated through the spectrum [5]. The PW spectrum shows blood’s movement in vessels, is to assess the location, extent and severity of vascular lesions. In the clinical application of hemodynamic parameters, arterial stenosis is mainly diagnosed by Peak Systolic Velocity (PSV) [6,7,8] and End-diastolic Velocity (EDV) [6,7,8,9], and the fetal anomaly is characterized by abnormal Pulsatility Index (PI) [10], Resistance Index (RI) [11], and Systolic/Diastolic ratio (S/D) [12,13]. The traditional method usually relies on a particular hemodynamic parameter, such as PSV during severe carotid stenosis. However, some of the hemodynamic parameters may already be abnormal in the early stages of the disease and just cannot be detected visually. For the patients, early detection of vascular abnormalities can allow them to seek medical attention before the disease becomes severe.
Some researchers proposed the PSV and EDV index as a diagnostic criterion for the degree of carotid stenosis, such as Carpenter J P [6], Moeta G L [7], Suwanwela N [8]. However, these methods are only based on severe carotid stenosis samples. They meet the challenge when applying to periods of mild carotid stenosis or plaque. Furthermore, as mentioned above, traditional methods focus only on typical parameters such as peak systolic velocity and end-diastolic velocity. They ignore the other parameters and the relationships between them. When stenosis is in the early stage, the PSV or EDV may not change significantly, so it is complicated and inefficient for clinicians to detect and diagnose diseases through hemodynamic parameters.
In summary, traditional methods have the disadvantages: (1) relying on typical parameters; (2) detecting severe carotid stenosis only; (3) not using the relationships between parameters. To solve the above problems, this paper proposes an abnormal carotid hemodynamic parameter detection method using RUSBoost with empirical weights. This method still has high accuracy when the sample has mild stenosis or plaque. Furthermore, we analyze the testing process and the weights of the parameters to assist the physician in making decisions. Our method acquires data easier than the traditional method which requires a large number of severe carotid stenosis patient samples. We collect negative samples randomly in the community, and patients’ samples are required to have plagues or mild stenosis only. The proposed method intends to detect abnormalities in the early stages of carotid artery stenosis. It is based on not only a typical parameter, but also the correlations between different parameters.
In terms of the original RUSBoost, the initial weight of each sample is equal. Limited samples with high-specificity probably make the classifier over-fitted. Thus, we calculate empirical weight by Mahalanobis Distance [14] for each sample. Because of the reciprocal of distance is considered as the weight of the samples, we increase intra-cluster similarity and reduce the weight of samples that are further away from the cluster center. With decreasing intra-class distance, the accuracy of the algorithm increases accordingly. On the one hand, the proposed method achieves an accuracy of 90.1%, sensitivity of 70%, and specificity of 94%, which are higher than the original RUSBoost, respectively. On the other hand, the proposed method requires only fewer weak learners and maximum splits of decision trees to reach high accuracy. Compared to the original RUSBoost, the proposed method improves accuracy while reducing the time and space complexity of the algorithm.
Decision Trees, Support Vector Machine (SVM), and Logistic Regression are common methods of disease prediction. For example, Mathan K [15] predicts heart disease, Olanow CW [16] predicts Parkinson’s disease. Both methods use Decision Trees. Qinghua Jiang [17] predicts microRNA-disease using SVM. Norman E Breslow [18] uses Logistic Regression to analyze survival proportions for children treated for neuroblastoma. In this paper, we compare the proposed RUSBoost with empirical weights with the traditional classification method, Decision Trees [16], SVM [19], RUSBoostd Trees [20] and Logistic Regression [21]. Experimental results show that the accuracy of the proposed method is 90.1%, which is 1.5% higher compared to the best performing Gaussian SVM in the traditional methods. Moreover, the sensitivity of our method improves at least 36% compared to Gaussian SVM. In general, our method has the advantage of maintaining the highest accuracy and significantly increased sensitivity, also has the highest Area Under Curve (AUC) value. Compare to traditional diagnostic methods, our method has the advantages of high accuracy, highest sensitivity, combining the relevant parameters, and suiting for screening in the early carotid stenosis.
This paper is organized as follows. In the Methodology section, the theoretical part of the proposed RUSBoost with empirical weights is explained in detail. In the Experimental section, we present the details of the data collection algorithm implementation, and the experimental results compared with traditional statistical analysis methods. Finally, the conclusion is drawn in the Conclusions section.
2. Algorithm Description
The changes in hemodynamic parameters of cardiovascular disease are gradual, so it is more clinically valuable to detect them in the early stages of the disease. However, the traditional method relies on the clinical experience of sonographers, and especially focusing on severe carotid stenosis. This paper proposes an abnormal detection method for hemodynamic parameters of carotid ultrasound by using the RUSBoost algorithm. The proposed method improves the performance of RUSBoost by setting the empirical weight based on Mahalanobis distance.
2.1. Neighborhood Components Analysis (NCA) for Dimension Reduction
The dataset needs to be pre-processed before classification. Firstly, Neighborhood Components Analysis (NCA) [22] is used for feature selection. NCA is a non-parametric method for selecting features with the goal of maximizing the prediction accuracy of the classification algorithm. Feature selection reduces the dimensionality of data by selecting only a subset of measured features so as to improve prediction performance, and to provide a faster and more effective classifier.
2.2. RUSBoost with Empirical Weights
2.2.1. Empirical Weight
Before proceeding with the boosted tree algorithm, we consider finding samples that are far away from the cluster center. Hadi, A.S [14] proposes a method for detecting outliers based on Mahalanobis Distance (MD). The Mahalanobis distance is defined as:
If the samples are assumed to form a multivariate normal distribution with p degrees of freedom, then the can be regarded as the sum of normalized normally distributed variables, which fall into a Chi-squared distribution with p degrees of freedom. The Quantile-Quantile Plot (QQ-plot) will appear linear if the distribution of samples is the same as the specified distribution [23].
Chi-squared distribution is defined as:
where is a gamma function, .
The empirical weights for the samples of is defined as
where is the number of samples of class , and is the number of total samples.
where denotes the initial weight of individual .
2.2.2. RUS
The imbalanced datasets will influence the classification method, for example, samples from minority class will be partially or completely ignored [24]. The sRandom Under-sampling (RUS) method [20] is used to address the problem of class imbalance by deleting samples from the majority class. The number of samples for positive and negative after RUS processing is close to 50%.
2.2.3. Boosted Tree
The Boosted Tree algorithm takes a greedy approach in each iteration to find a decision tree that is optimal to the objective function. The generated weak classifier is then used to calculate the weight of the samples in the next iteration, where the weight of the misclassified samples will be increased. Appendix A, step 2 demonstrates this process. The split criteria for the decision tree is the Gini Impurity [24].
The deeper the tree, the higher the accuracy of the result, but correspondingly, a tree with high complexity may lead to overfitting. Similarly, the number of weak learners also affects the final result. The number of iterations and the maximum number of splits are determined experimentally.
In the original RUSBoost algorithm, the initial weights are set to equal. In the proposed method, they are replaced with the empirical weights expressed in Equation (4), in order to reduce the impact of outliers. The complete workflow is denoted in Algorithm A1.
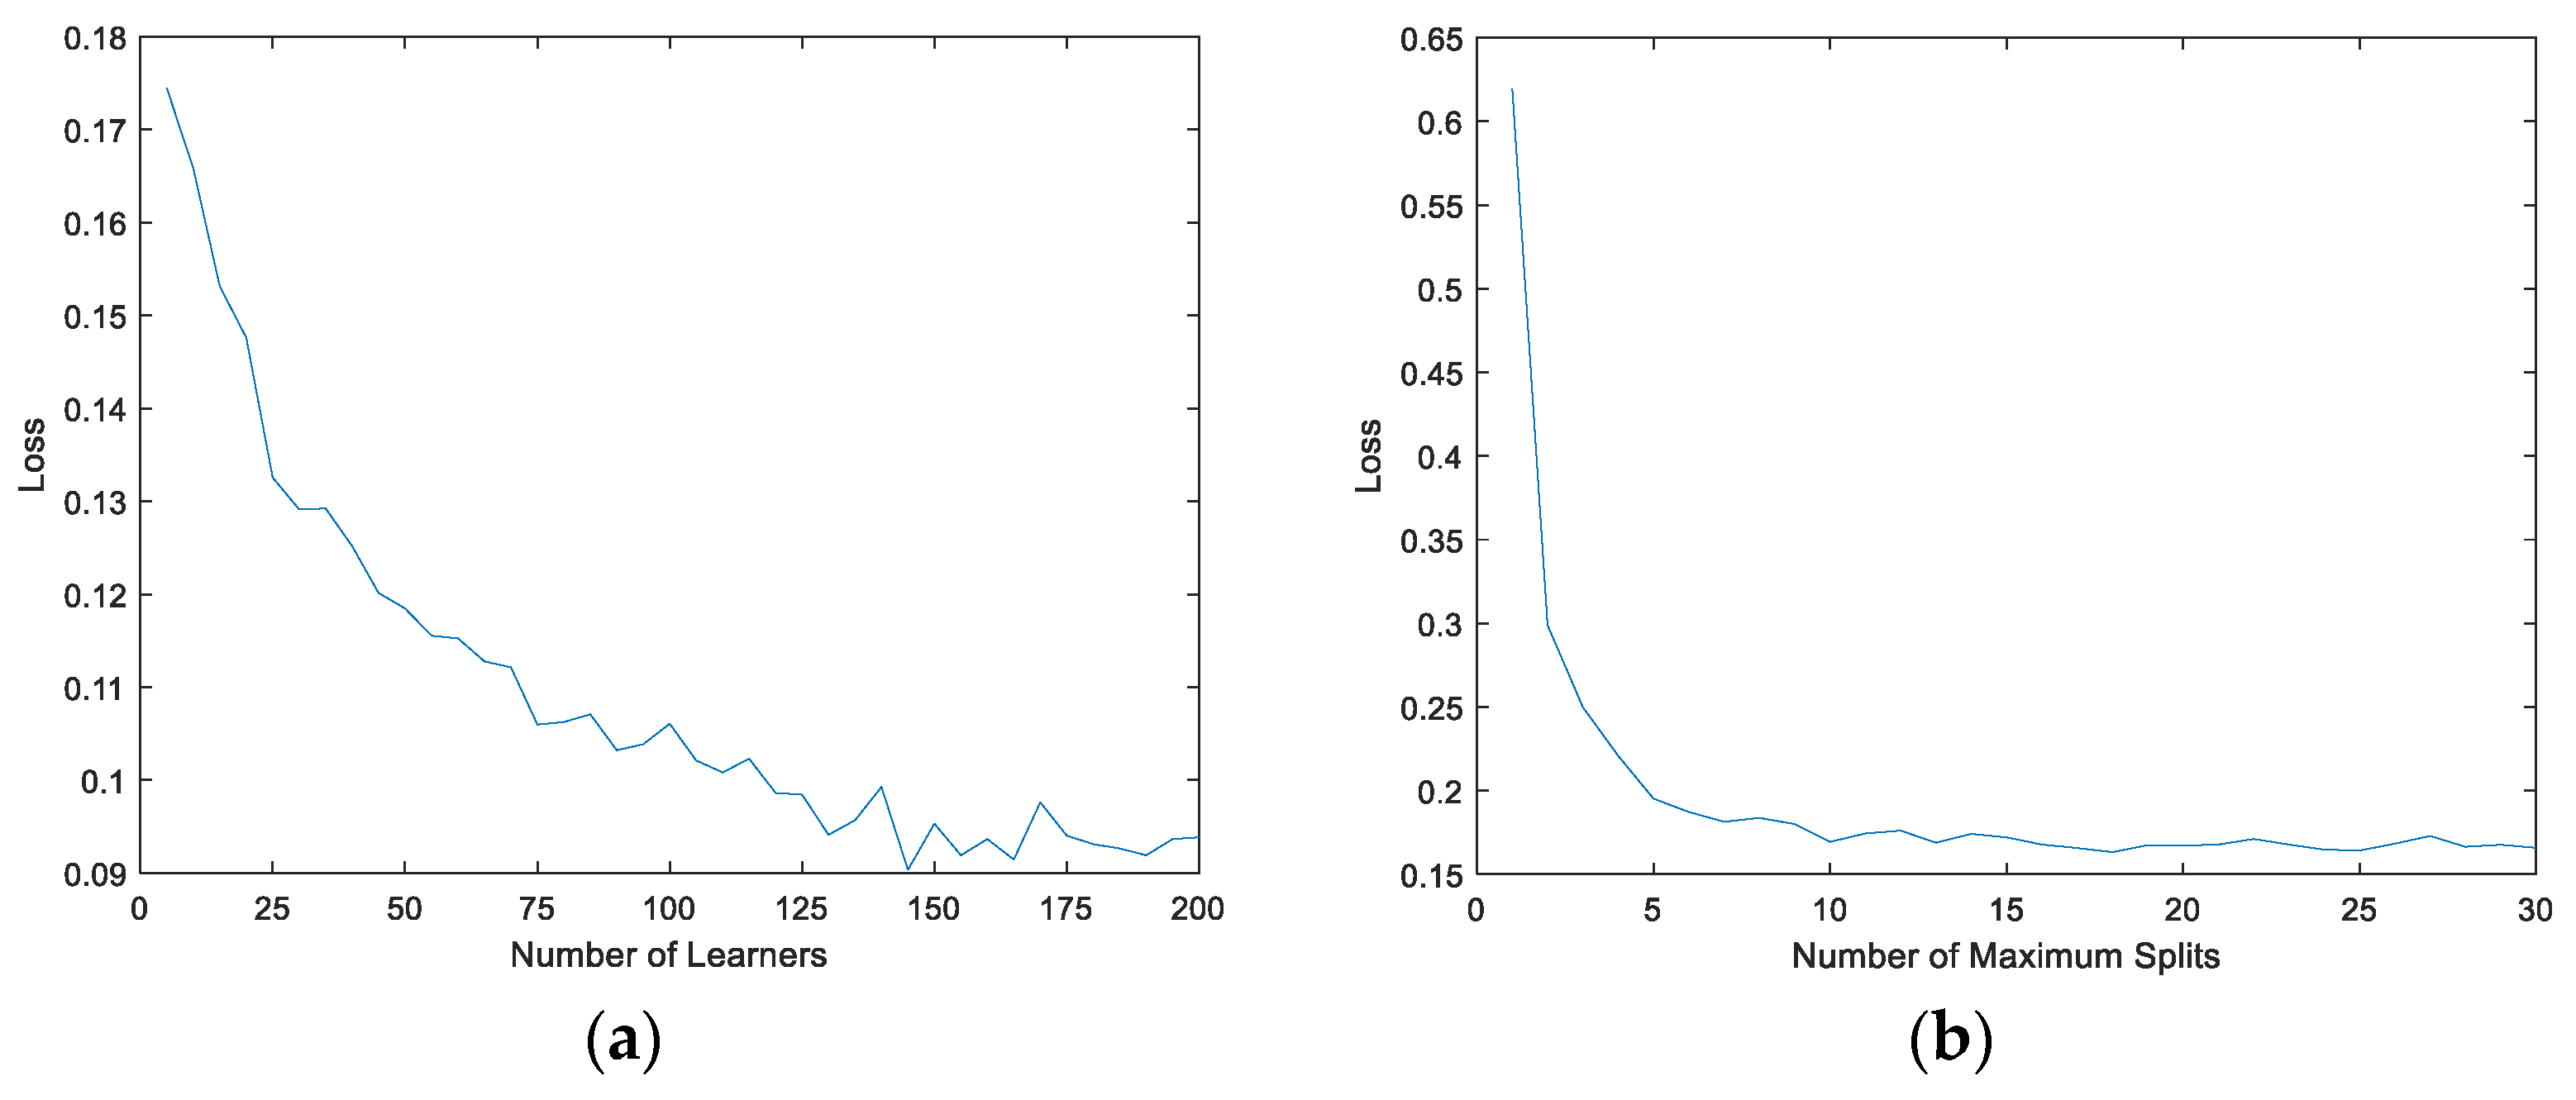
In the training stage of the RUSBoost tree, the adjustable parameters include the number of weak learners and the number of maximum splits. If the number of weak learners or maximum splits is too large, the accuracy of the classifier for the training set data will increase, but it will cause overfitting and unnecessary computational cost. On the other hand, if the number of weak learners or maximum splits is too small, the classification model is under-fitted and the performance is poor. Therefore, the optimal parameters can be obtained by the 2D loss function with the number of weak learners and the number of maximum splits as the independent variables. A five-fold cross-validation is used to ensure the stability and reliability of the model. Both the values of and are traversed within a predefined range of values, and then the loss function is averaged along each dimension to search for the minimization. The variables take a wide range during the experiment for algorithmic convergence, where is from 5 to 200 and is from 1 to 30.
where denotes the label predicted with the number of weak learners and the maximum number of splits . is defined in Appendix A.
2.3. Positive Sample Analysis
After obtaining the classifier model, we are concerned with the features that are classified as positive samples. The features of each learner are first counted at the splitting point through which the sample passes in each learner. Then, the number of each feature in all learners is added together by its weight. As shown in
where denotes the occurrence frequency of feature which is passed by the sample in the weak learner .
Finally, each sample judged to be positive has its own typical characteristics, thus aiding the physician’s diagnosis.
3. Experiments and Results
3.1. Data Acquisition and Processing
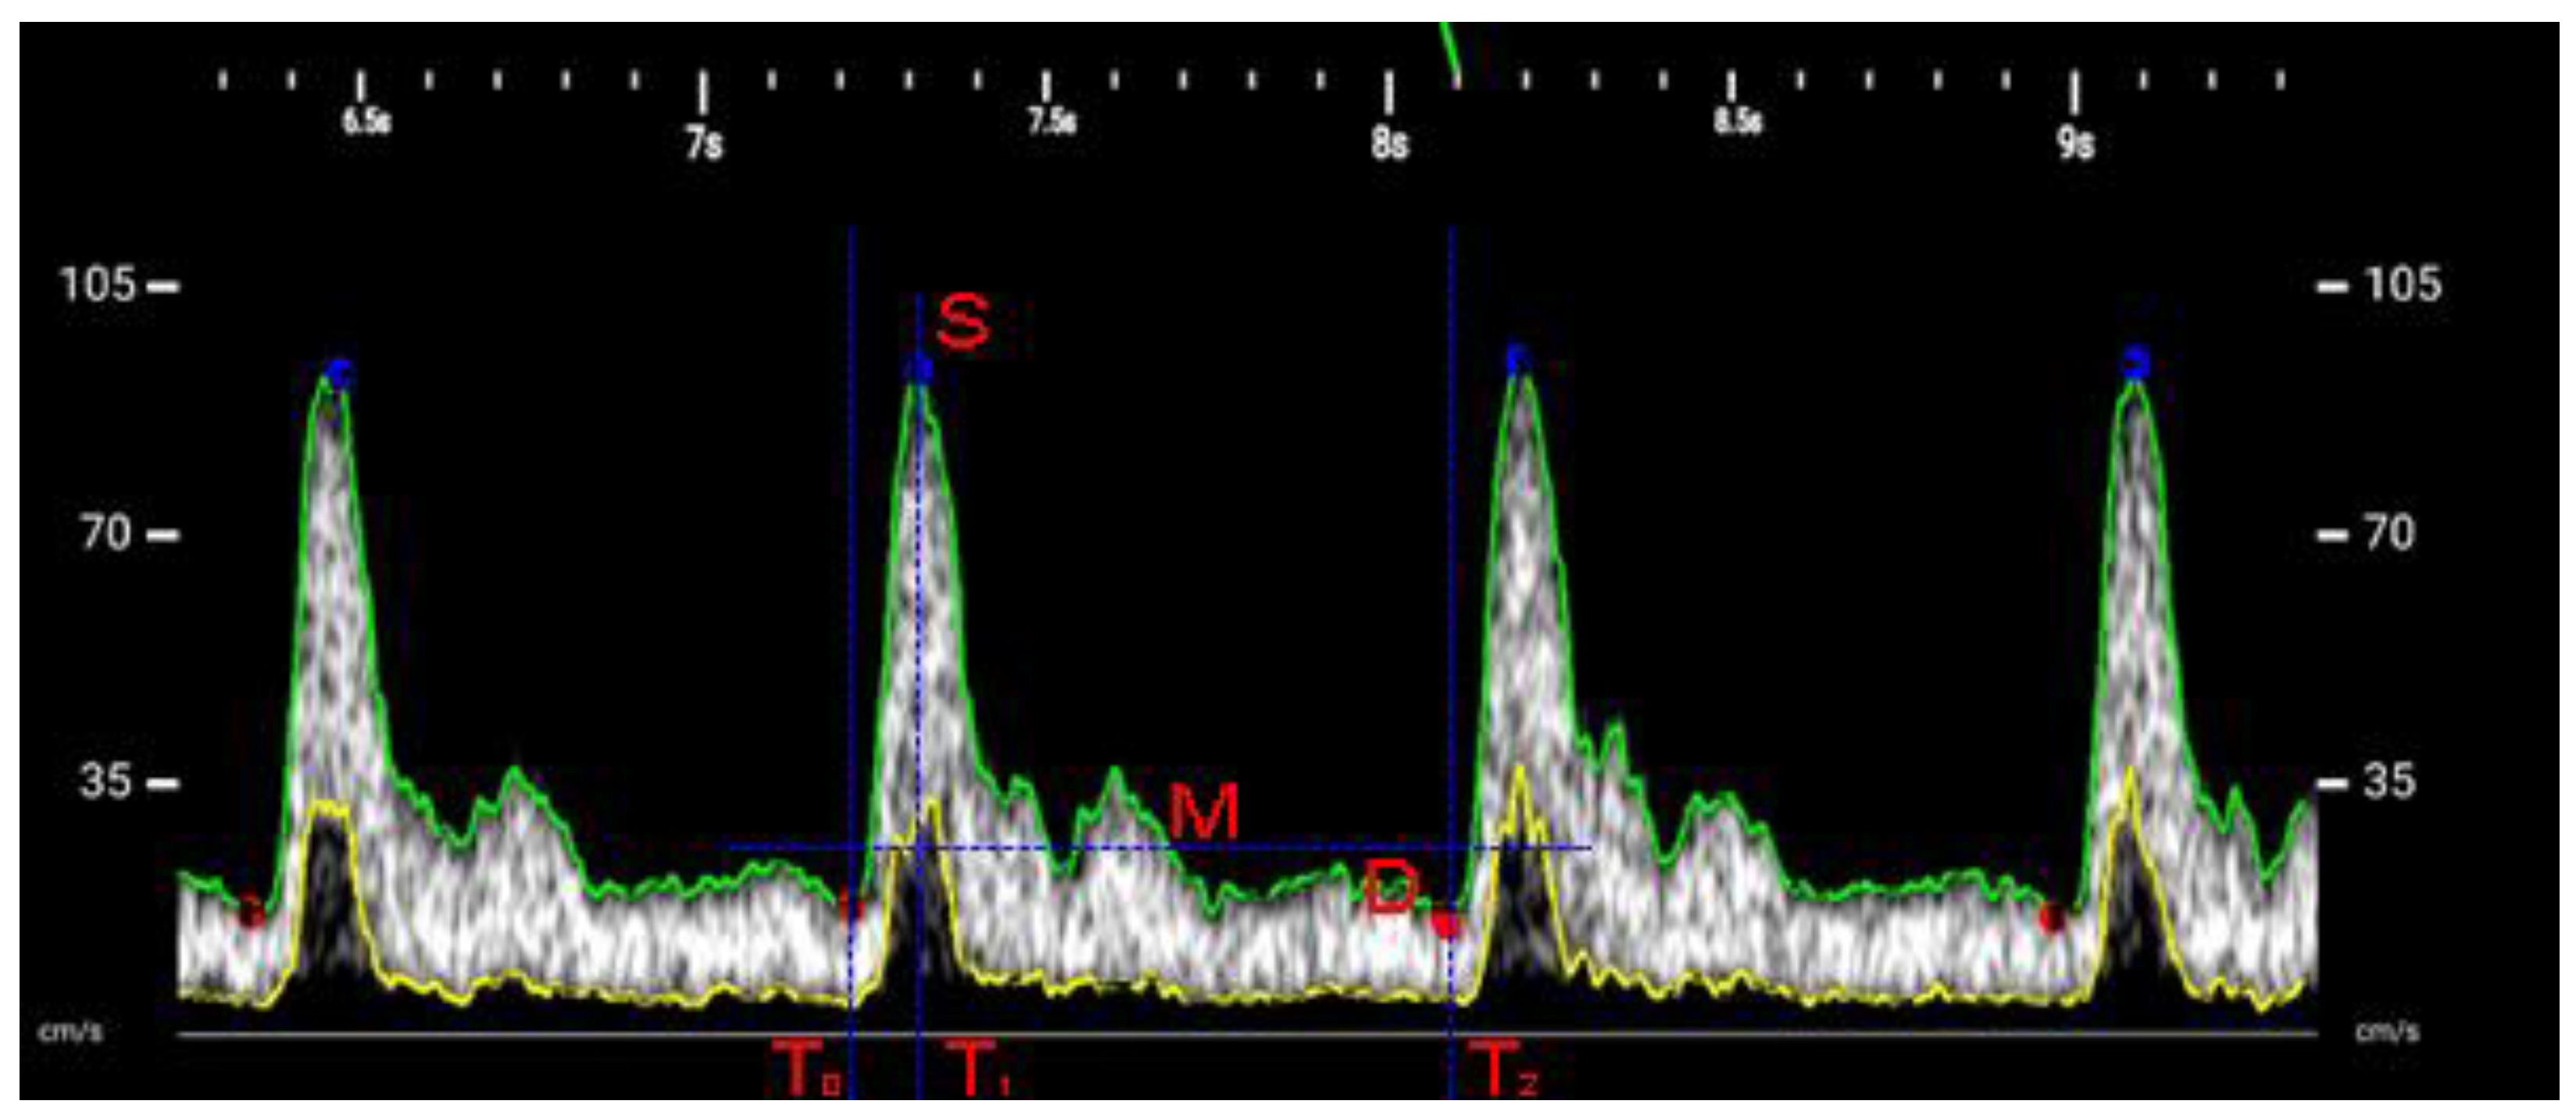
The number of hemodynamic parameters [25,26] calculated from the PW spectrum is 13, and the parameters are obtained by averaging the measurements of several cardiac cycles. The measurable hemodynamic parameters are shown in Figure 1 and Table 1, where is the maximum velocity of time , is the minimum velocity of time , indicates peak systolic velocity, indicates end-diastolic velocity, and indicates time-averaged velocity. The systolic period is to , and the diastolic period is to .
Our dataset consists of 279 common carotid artery samples, collected from university, community and Hi-tech South China Hospital in Chengdu. Moreover, the ultrasonographer assessed the individual’s carotid artery status. In this study, we consider 50 patient samples with plaque or stenosis from the hospital as positive samples and the remaining samples as negative samples.
Before data collection, we informed subjects in detail about the study, the risks of ultrasound, our affiliation, assured the data would be used only for scientific research, and sought their consent. Only sex, age, and spectral data were stored for each acquisition, and no other data were collected. We acquired raw spectral images and calculated hemodynamic parameters based on Table 1.
In this research, the used scanner was Stork’s wireless handheld ultrasound equipment, H31L. The sampling location was at a distance of 2 to 3 cm from the bifurcation of the common carotid artery, the Doppler angle was fixed at about 60°, and a sampling gate was placed in the center of the vessel, the acquisition time was ten cardiac cycles.
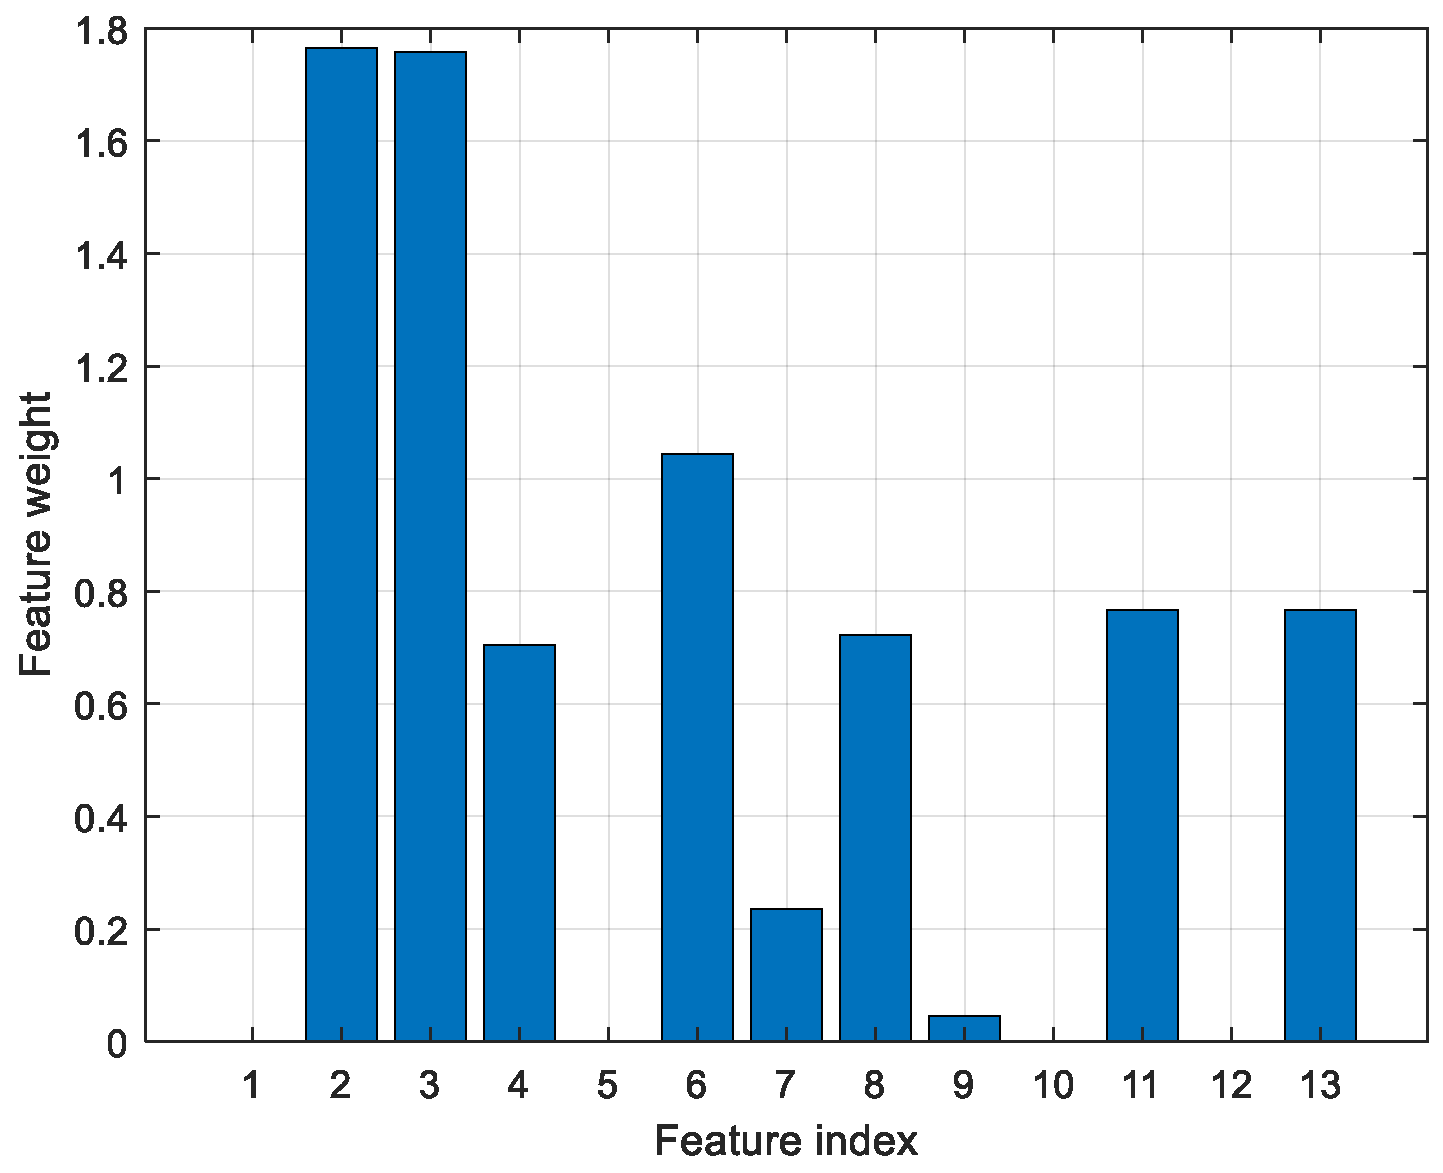
The features obtained after NCA selecting were ACCT, EDV, HR, PSV, RI, SB, S/D, VFC and VTI, as shown in Figure 2. As mentioned above, PSV and EDV are the clinically adopted diagnostic criteria for stenosis, and SB implies the presence of turbulence, which is an early sign of vascular stenosis [26].
3.2. Training Process
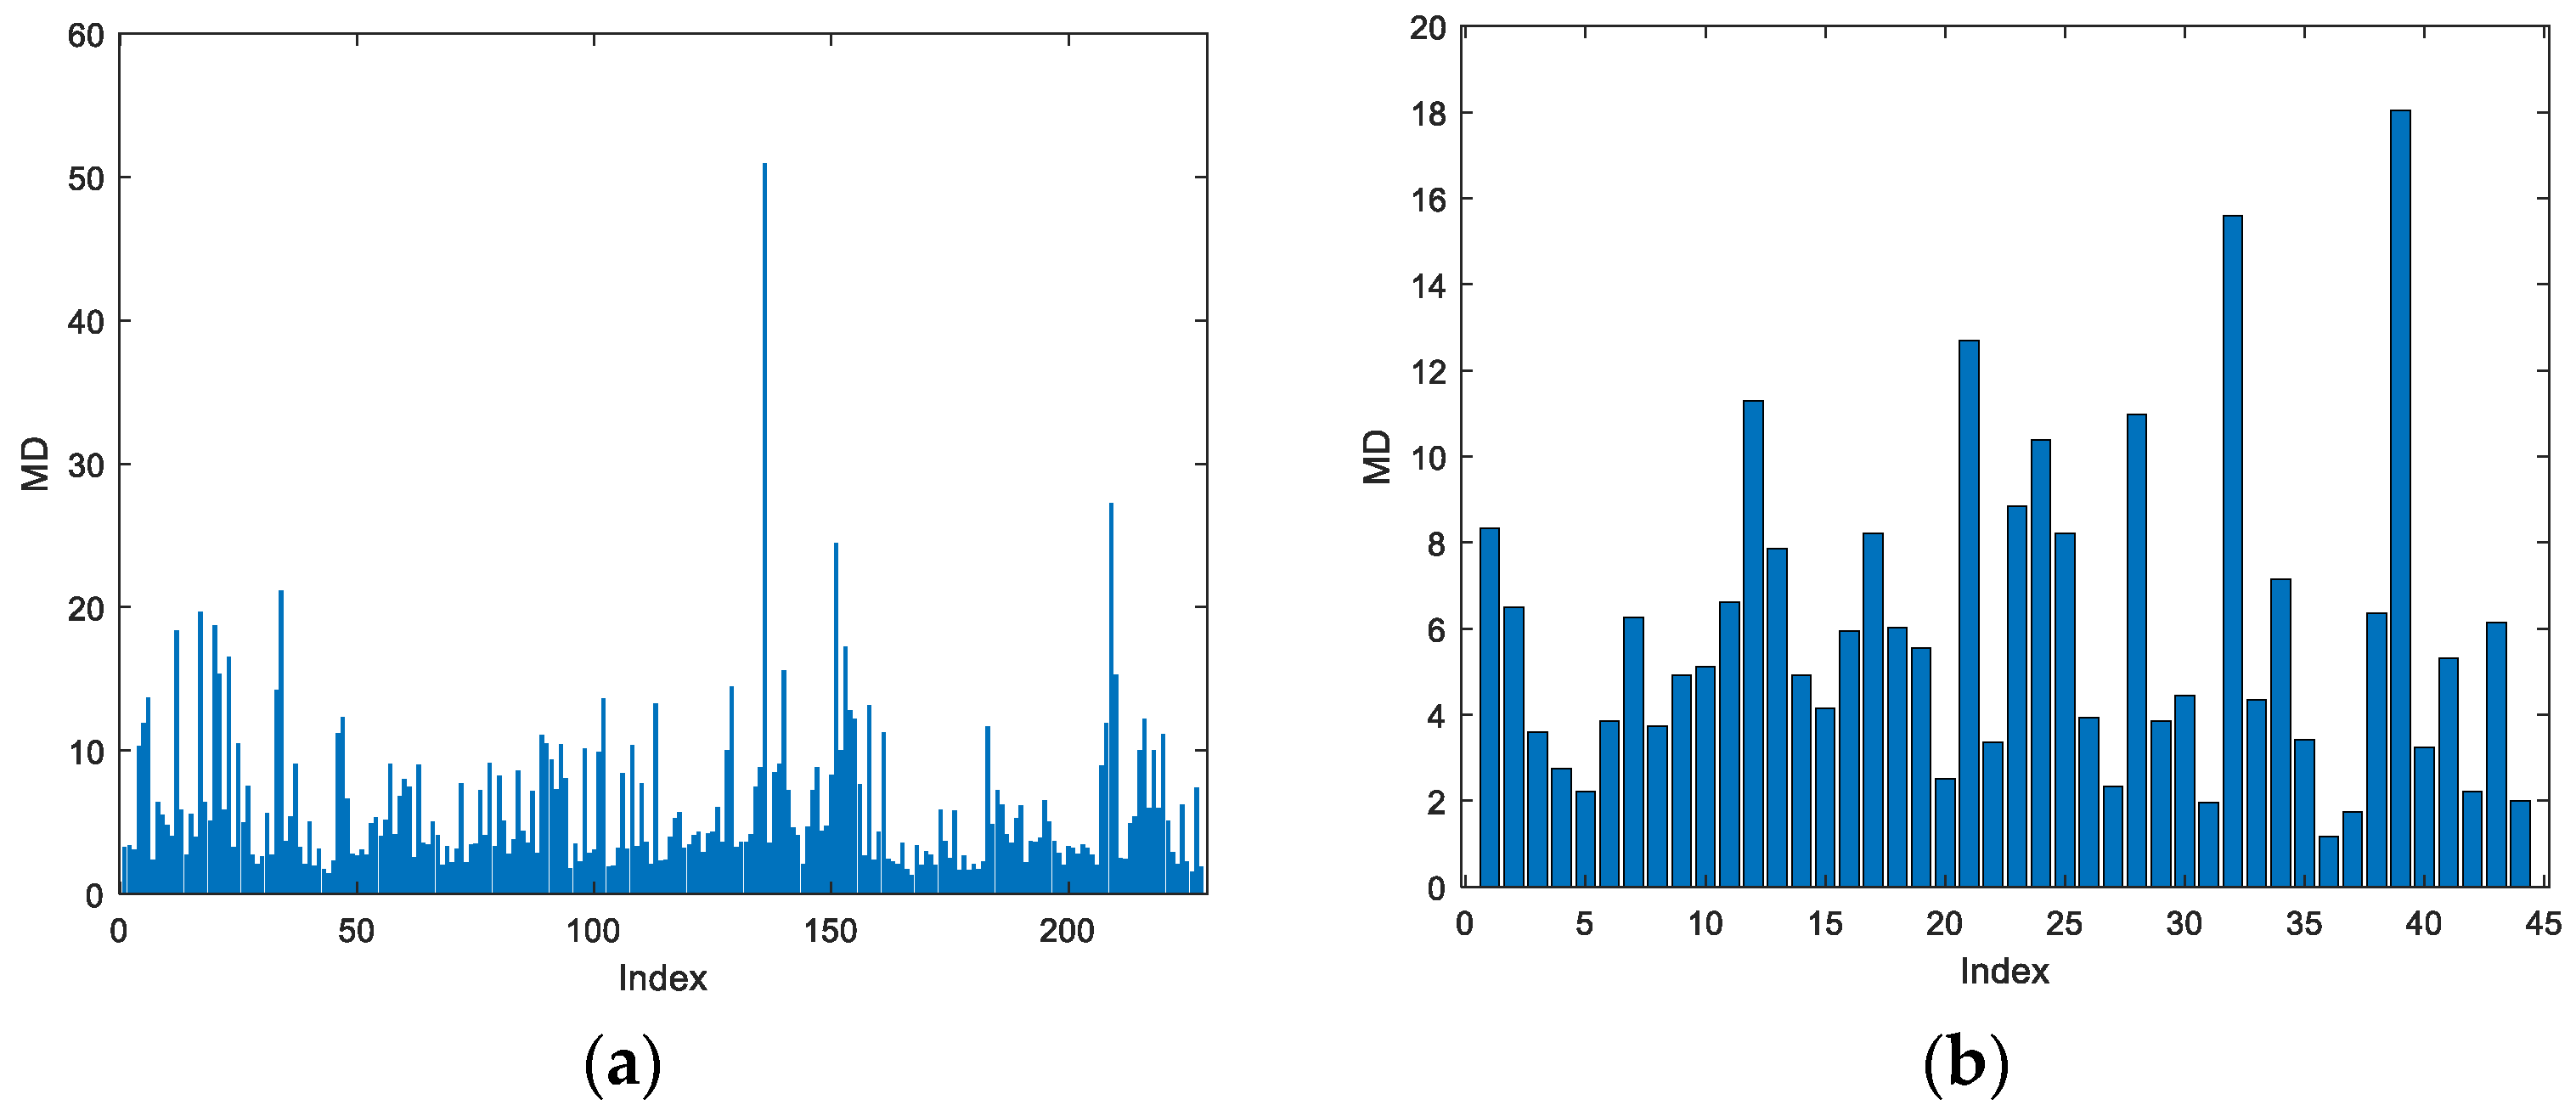
This paper calculates the MD for the downscaled dataset, then make QQ-plot separately with a distribution with 9 degrees of freedom. The MD for positive and negative samples is shown in Figure 3.
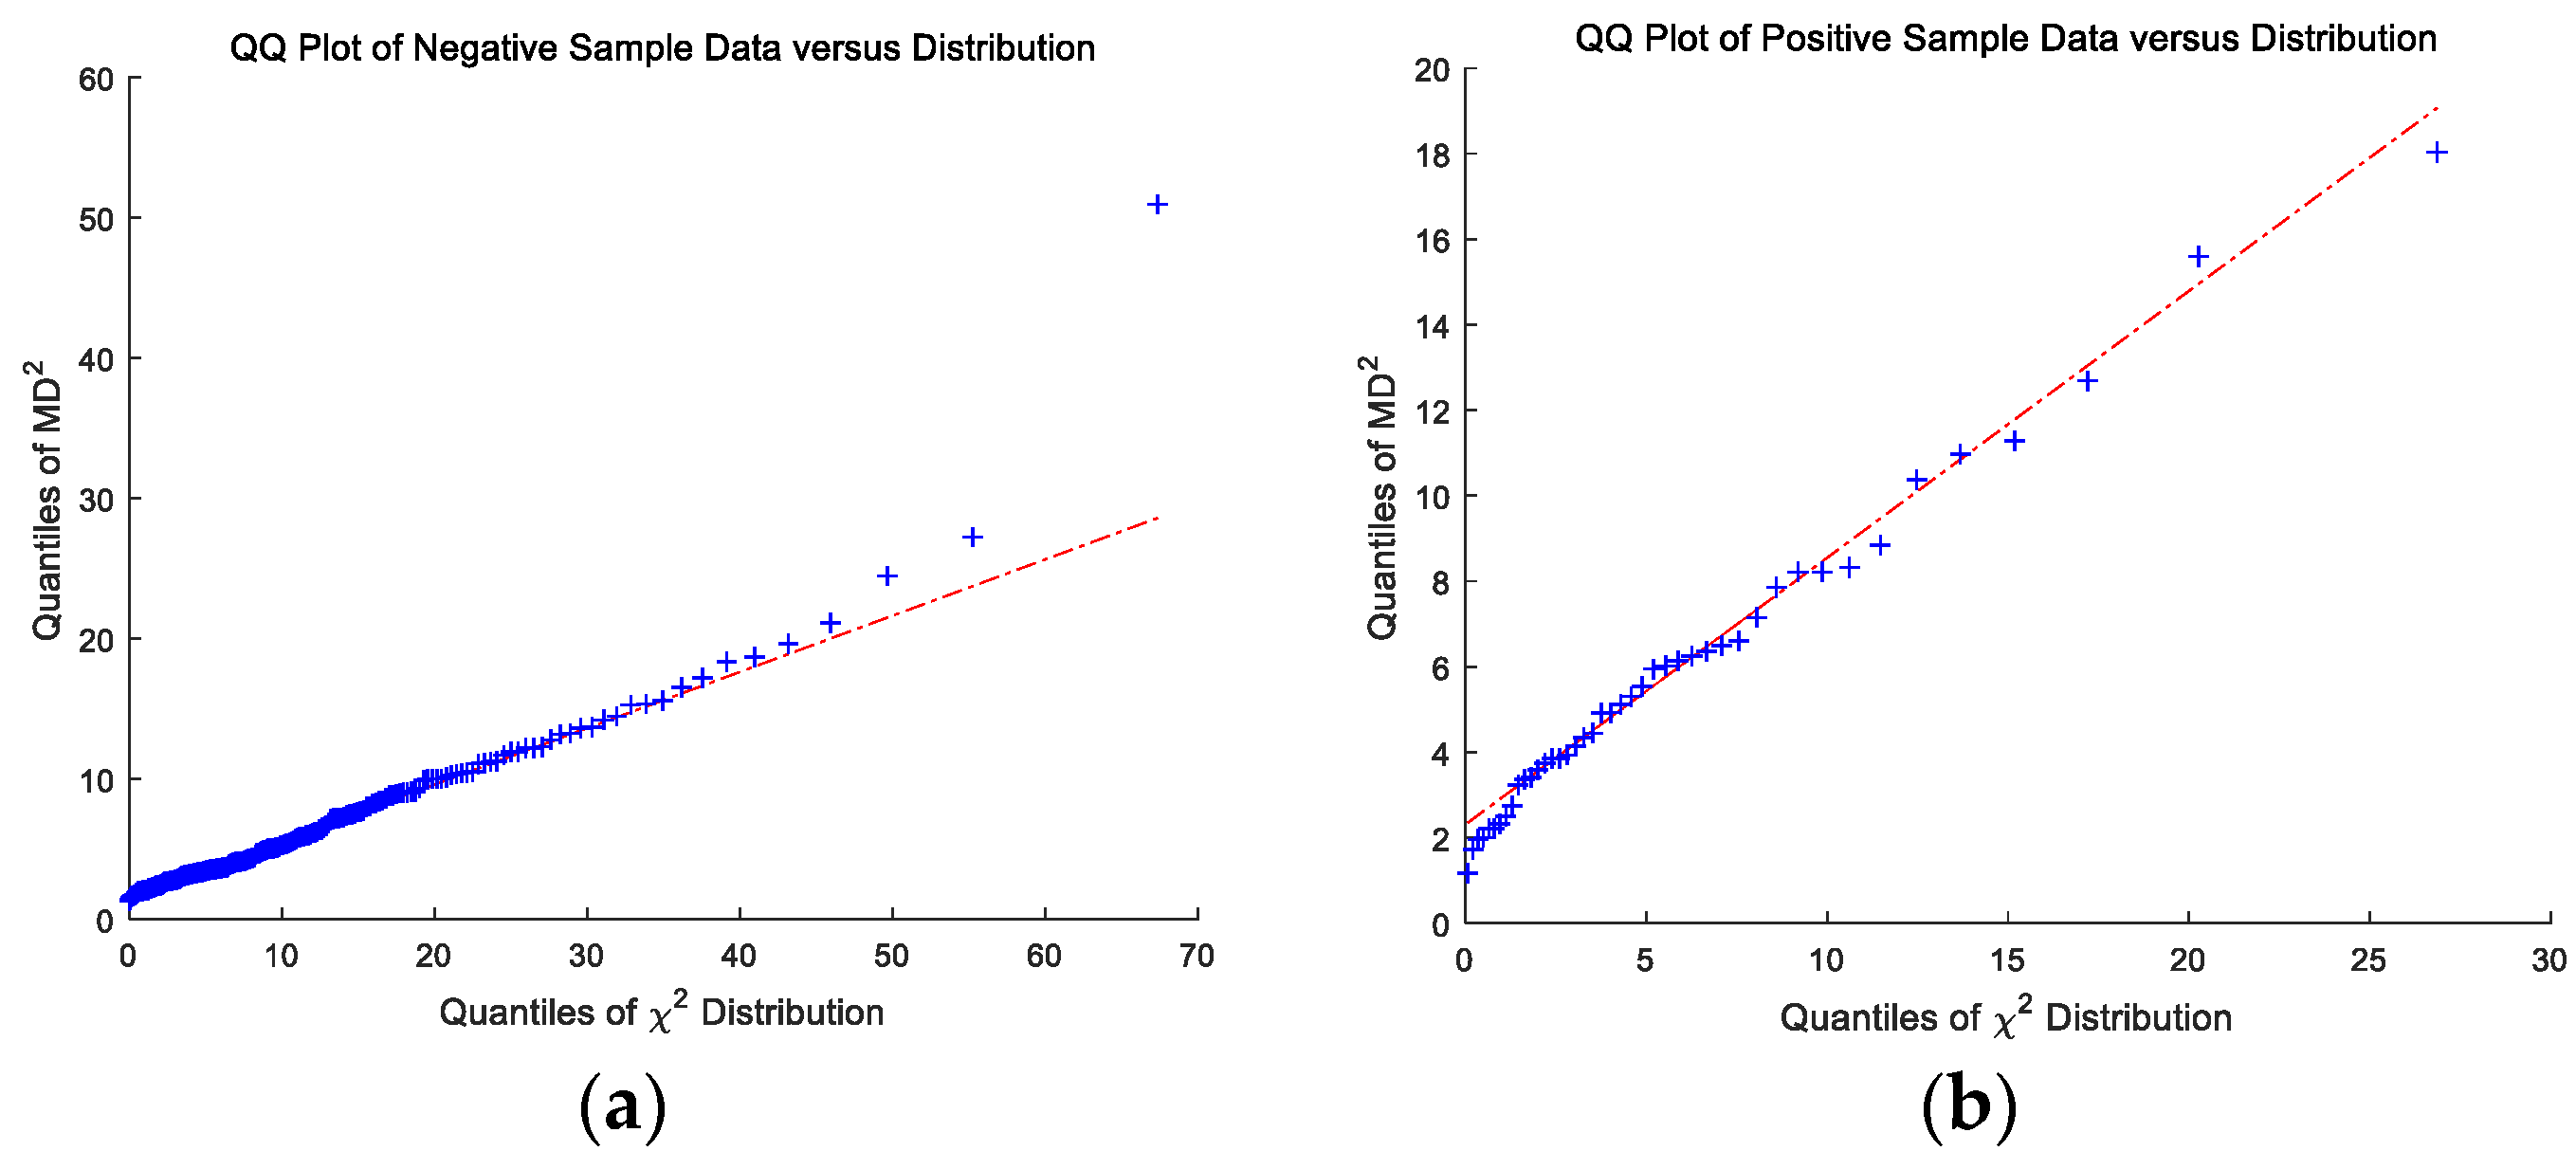
As shown in Figure 4, we compare the distribution of positive or negative samples’ to the chi-square distribution through QQ plots. The of both positive and negative samples are falling into chi-square distribution, which proves the assumption that the sample obeys a multivariate Gaussian distribution.
In the RUSBoost Trees training process, the parameters are the number of weak learners and the maximum number of split points. Respectively, we regard them as variables to find the lowest point of loss. According to Figure 5, with the increase in the number of weak learners and the maximum number of splits, the lowest point is taken as the optimal parameter for training. That is, the number of weak learners is 145, and the maximum number of splits is 10.
3.3. Comparison of Methods
This paper compared RUSBoost with empirical weights to the original RUSBoost and other common classification methods, such as SVM, Decision Trees, and Logistic Regression.
We used the previous NCA to select nine features, so the feature vector of the raw data is nine-dimensional. The validation method is cross-validation, in which we divide the raw data into five parts, and one part is the validation set in turn, while the remaining four parts are the training set. The final results are averaged over the five experiments.
Since other classification methods also have problems with parameter selection, we take the same approach as RUSBoost and find the parameter with the best performance of the results by five-fold cross-validation with different parameters. The final parameter selection is (1) the split criterion is Gini’s diversity index, and the maximum number of splits is 20 for the Decision Trees, (2) the kernel function is Gaussian Radial Basis Function with scaling factor 3.6 for Gaussian SVM.
Table 2 shows that RUSBoost with Empirical Weights has a significant improvement in sensitivity. It maintains the recognition of positive samples while keeping the classifier unbiased towards the majority class. The overall accuracy of each method is around 87.5%, with fluctuations of no more than 2.6%. No one method shows an excellent advantage for accuracy, so we compare the sensitivity and specificity of the methods. In the traditional method, the Gaussian kernel SVM has the highest accuracy among these methods, but its sensitivity is only 34%. Our method’s accuracy is only 1.5% higher than the Gaussian SVM’s, but it has a sensitivity of 70%. Compared to the original RUSBoostd Trees, the proposed method’s accuracy, sensitivity, and specificity are improved by 4%, 6%, and 2% respectively. Moreover, its AUC is also the highest among these methods at 0.89. The highest accuracy, highest sensitivity and highest AUC prove that RUSBoost with Empirical Weights achieves better performance in the experiments presented in this paper.
This paper also compares our method with traditional clinical diagnostic methods for carotid stenosis, focusing on the accuracy, sensitivity and specificity of PSV diagnostic criteria. The comparative papers proposed different diagnostic criteria such as 170 cm/s (Carpenter et al., 1995 [6]), 180 cm/s (Heijenbrok-Kal et al.1, 2006 [27]), 213 cm/s (Ali et al., 2011 [28]), 152 cm/s (Scissons et al., 2012 [29]), and 130 cm/s (Tokunaga K et al.1, 2016 [30]). We calculate the accuracy, sensitivity and specificity of these criteria with the collected data in our study.
Table 3 indicates the low sensitivity of traditional methods for the identification of mild stenosis or plaque in the carotid artery. From this, it can be seen that these methods are not suitable for the early detection of carotid stenosis.
3.4. Positive Sample Analysis
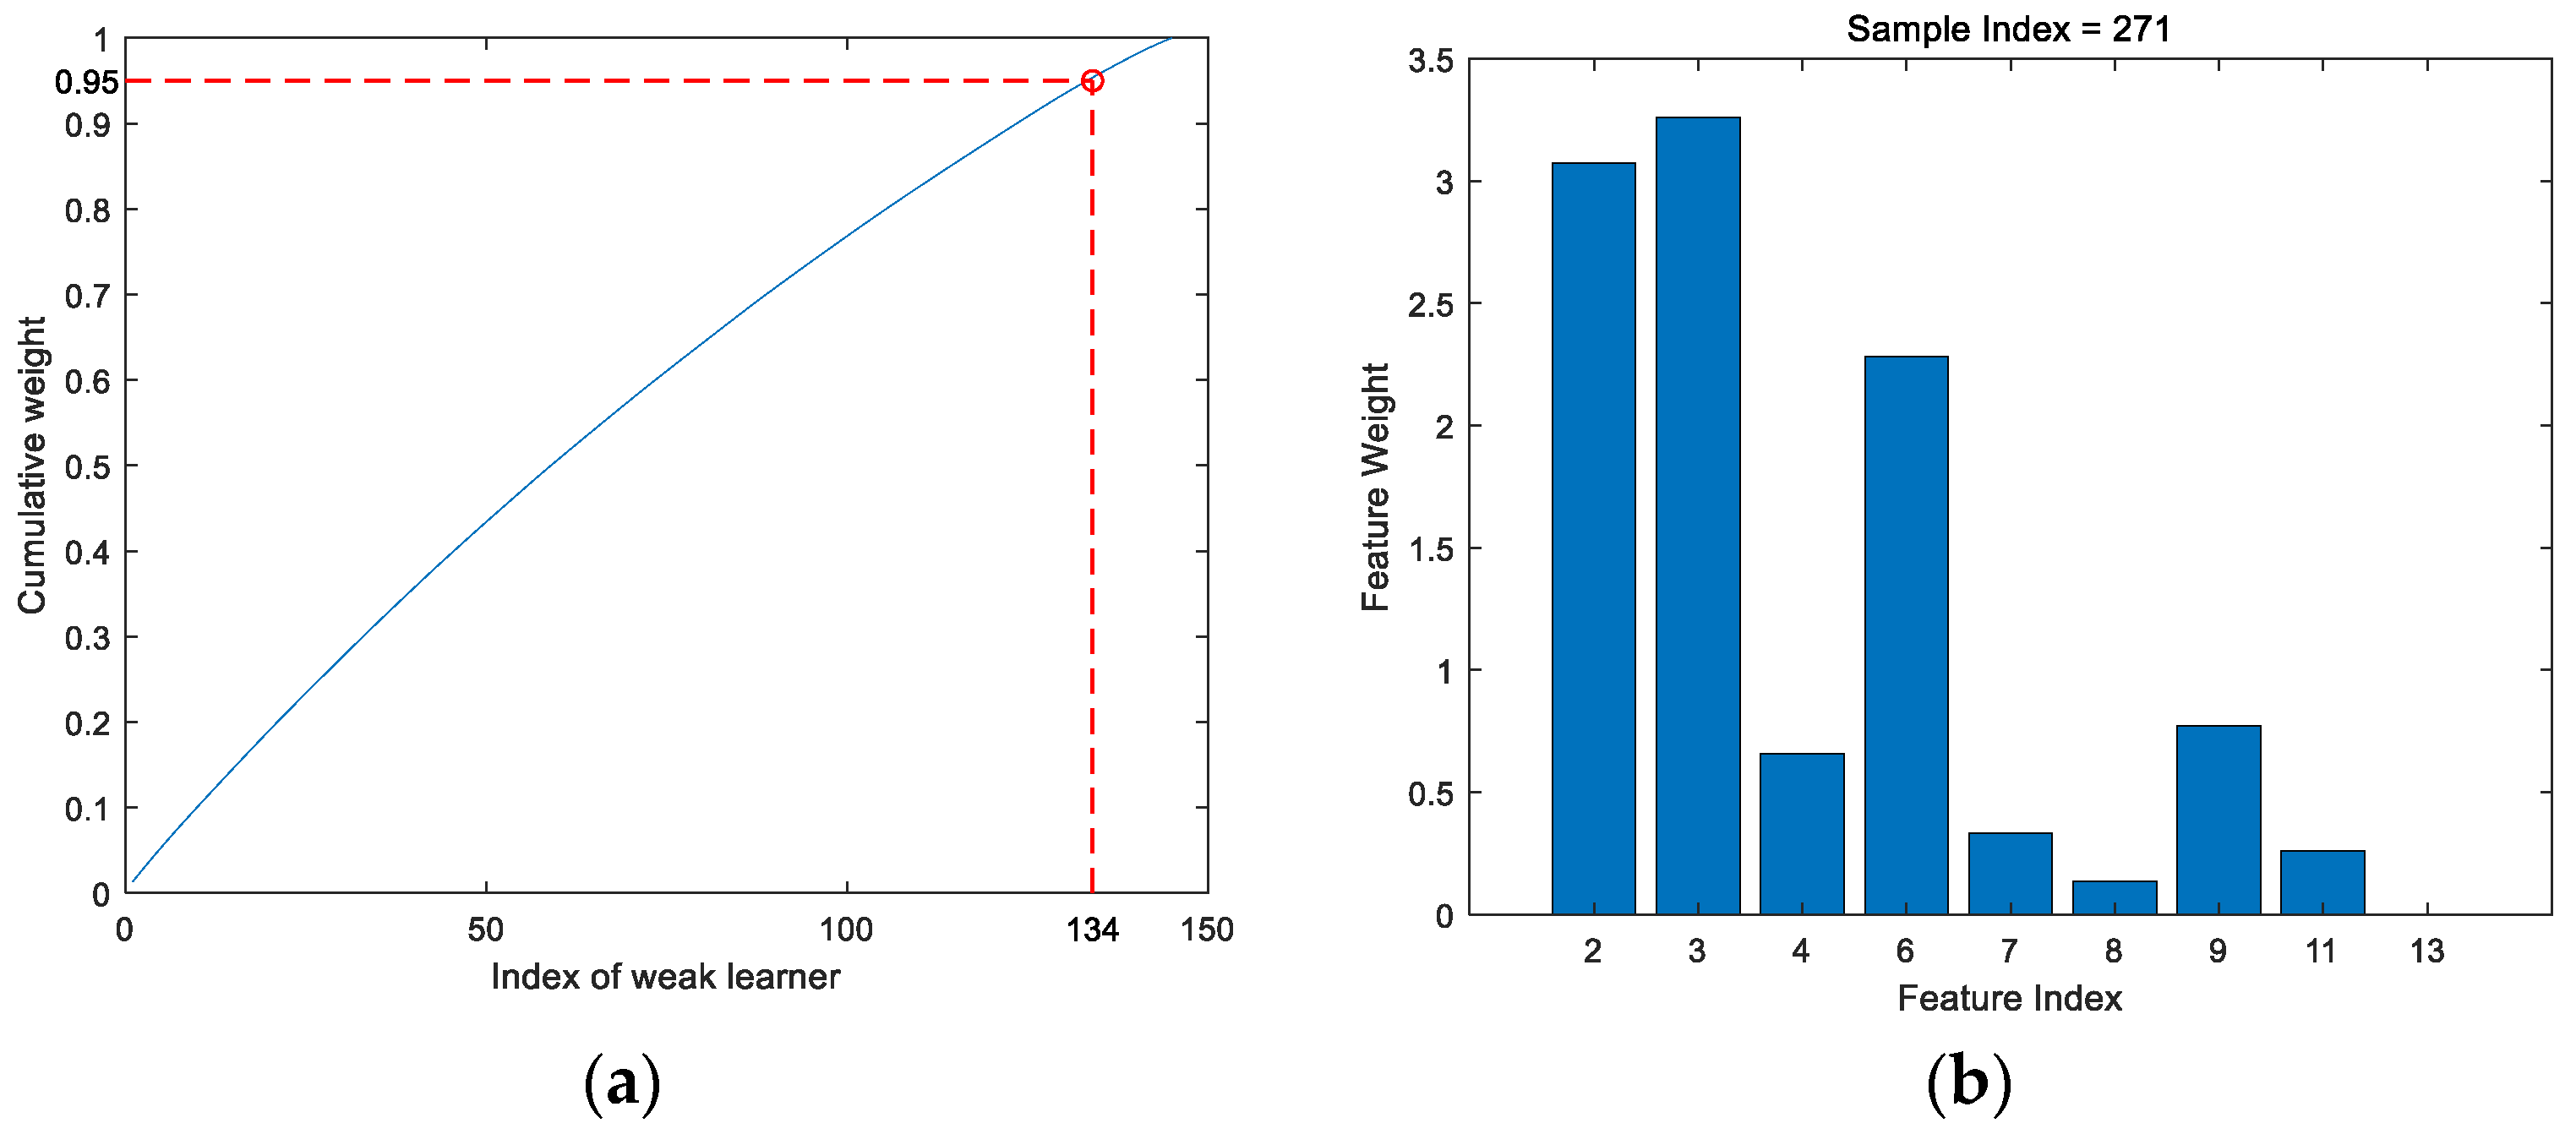
After obtaining the prediction model, all the weak learners were ranked in descending order of weight. We take the top 95% of weak classifiers with cumulative weights as Figure 6a. When a new test sample enters the model, the decision-making path is calculated and the final feature weights are shown in Figure 6b.
4. Discussion
Hemodynamic parameters can be used to diagnose vascular disease, but since the traditional diagnostic criteria are only applicable to severe stenosis patients with few parameters. In this paper, we propose a classification method for the hemodynamic parameter to detect early carotid stenosis. On the one hand, it is able to combine different hemodynamic parameters. On the other hand, the detection of early stenosis and plaque has greatly improved compared to traditional methods.
From Figure 4, the of both positive and negative samples are falling into chi-square distribution, which proves the assumption that the sample obeys multivariate Gaussian distribution. From Figure 4a, there are only limited samples that do not fall into the multivariate Gaussian distribution, so the weights of these samples are reduced. In future work, the collection of more samples may obtain more accurate final results.
In the comparison experiment, the accuracy rate of the proposed method is as high as 90.1% compared to other traditional classification methods. Other methods, while also achieving an accuracy of more than 80%, sacrifice sensitivity and lead to missed diagnoses.
Traditional clinical methods have a reasonable detection rate only for severe stenosis. However, our method is able to achieve 90.1% accuracy in the period of mild stenosis and plaque. Therefore, our method is able to find potential relationships between parameters and act as a warning in the early stages of stenosis relative to traditional methods.
In the analysis of the positive sample, the first four features are similarly weighted to the NCA downscaling analysis, but the last five features are weighted lower, and this phenomenon can be analyzed in the next work.
From the above experimental results, it has been demonstrated that the proposed method is effective and accurate in classifying early carotid stenosis for hemodynamic parameters.
5. Conclusions
This paper proposes a classification method for a hemodynamic parameter using RUSBoost with Empirical Weights. In the early stages of carotid stenosis, abnormalities in PSV and EDV are not apparent, but in other parameters, they may already be presented. This article identifies individuals in the early stages of stenosis based on the correlation between hemodynamic parameters. Moreover, the proposed method calculates weights for abnormal parameters to assist physicians in detecting and diagnosing disease. In the clinical treatment of cardiovascular disease, the earlier the disease is detected, the more likely it is to be cured, which is why our abnormal carotid hemodynamic parameters detection method can guide patients to seek further medical checking and consultation.
Author Contributions
Conceptualization, H.X.; methodology, H.X and H.Y.; software, H.X.; validation, H.X. and H.Y.; resources, P.L.; data curation, H.X.; writing—original draft preparation, H.X.; writing—review and editing, Y.Z., H.Y.; visualization, H.X.; supervision, H.Y. and D.C.L.; funding acquisition, H.Y. All authors have read and agreed to the published version of the manuscript.
Funding
This research was funded by the Department of Science and Technology of Sichuan Province (Grant No. 2019YFS0126).
Acknowledgments
The authors would like to thank the engineers at Chengdu Stork Healthcare Co., Ltd. who contributed to the experimental works done in Stork’s wireless handheld ultrasound equipment, H31L. Thanks to Xin Liu), Yi Zhang, Jinkai Li, Bowen Wu, Lin Zhang and Youling Shi for their efforts in data collection, also special thanks to Hao Yin, Xin Liu, Yi Zhang, Linn Jiang, Shijie Zhai, Danyu Wang and Yu Yang for their help in writing the paper.
Conflicts of Interest
The authors declare no conflict of interest.
Appendix A
| Algorithm A1. Training procedure of the proposed approach |
| Input: Set of examples ,…,. Number of iterations T |
| Output: The final hypothesis . |
| 1: Initialize for sample . |
| 2: Do for . |
| a. Create temporary training dataset with distribution using random undersampling. b. Calculate weak learner based on examples and their weights . c. Calculate the classification error rate for : e. Update the weight of samples: |
| 3: Return . |
References
- Olin, J.W.; Piedmonte, M.R.; Young, J.R.; DeAnna, S.; Grubb, M.; Childs, M.B. The Utility of Duplex Ultrasound Scanning of the Renal Arteries for Diagnosing Significant Renal Artery Stenosis. Ann. Intern. Med. 1995, 122, 833–838. [Google Scholar] [CrossRef]
- Hirsch, A.T.; Haskal, Z.J.; Hertzer, N.R.; Bakal, C.W.; Creager, M.A.; Halperin, J.L.; Rosenfield, K.A. ACC/AHA 2005 Practice Guidelines for the Management of Patients with Peripheral Arterial Disease (Lower Extremity, Renal, Mesenteric, and Abdominal Aortic). Circulation 2006, 113. [Google Scholar] [CrossRef] [Green Version]
- Morin, L.; Den Hof Van, M.C. SOGC clinical practice guidelines. Ultrasound evaluation of first trimester pregnancy complications. Int. J. Gynecol. Obstet. 2006, 93, 77–81. [Google Scholar]
- Reneman, R.S.; Meinders, J.M.; Hoeks, A.P. Non-invasive ultrasound in arterial wall dynamics in humans: What have we learned and what remains to be solved. Eur. Heart J. 2005, 26, 960–966. [Google Scholar] [CrossRef] [PubMed] [Green Version]
- Grant, E.G.; Benson, C.B.; Moneta, G.L.; Alexandrov, A.V.; Baker, J.D.; Bluth, E.I.; Katanick, S. Carotid Artery Stenosis: Gray-Scale and Doppler US Diagnosis—Society of Radiologists in Ultrasound Consensus Conference. Radiology 2003, 229, 340–346. [Google Scholar] [CrossRef] [PubMed]
- Carpenter, J.P.; Lexa, F.J.; Davis, J.T. Determination of sixty percent or greater carotid artery stenosis by duplex Doppler ultrasonography. J. Vasc. Surg. 1995, 22, 697–705. [Google Scholar] [CrossRef] [Green Version]
- Moneta, G.L.; Edwards, J.M.; Chitwood, R.W.; Taylor, L.M., Jr.; Lee, R.W.; Cummings, C.A.; Porter, J.M. Correlation of North American Symptomatic Carotid Endarterectomy Trial (NASCET) angiographic definition of 70% to 99% internal carotid artery stenosis with duplex scanning. J. Vasc. Surg. 1993, 17, 152–159. [Google Scholar] [CrossRef] [Green Version]
- Suwanwela, N.; Can, U.; Furie, K.L.; Southern, J.F.; Macdonald, N.R.; Ogilvy, C.S.; Kistler, J.P. Carotid Doppler Ultrasound Criteria for Internal Carotid Artery Stenosis Based on Residual Lumen Diameter Calculated from En Bloc Carotid Endarterectomy Specimens. Stroke 1996, 27, 1965–1969. [Google Scholar] [CrossRef]
- Rochelson, B.; Schulman, H.; Farmakides, G.; Bracero, L.; Ducey, J.; Fleischer, A.; Winter, D. The significance of absent end-diastolic velocity in umbilical artery velocity waveforms. Am. J. Obstet. Gynecol. 1987, 156, 1213–1218. [Google Scholar] [CrossRef]
- Wladimiroff, J.W.; Tonge, H.M.; Stewart, P.A. Doppler ultrasound assessment of cerebral blood flow in the human fetus. Br. J. Obstet. Gynaecol. 1986, 93, 471–475. [Google Scholar] [CrossRef]
- Bitó, T.; Vajda, G.; Hajdu, J.; Pál, A. Cerebral and umbilical arterial blood flow velocity wave-form measurements in growth-retarded fetuses. J. Perinat. Med. 1992, 20, 267. [Google Scholar]
- Gaziano, E.P.; Knox, G.E.; Wager, G.P.; Bendel, R.P.; Olson, J.D. Pulsed Doppler umbilical artery waveforms: Significance of elevated umbilical artery systolic/diastolic ratios in the normally grown fetus. Obstet. Gynecol. 1990, 75, 189–193. [Google Scholar] [PubMed]
- Wladimiroff, J.W.; Degani, S.; Noordam, M.J.; Tonge, H.M. Cerebral and umbilical arterial blood flow velocity waveforms in normal and growth-retarded pregnancies. Obstet. Gynecol. 1987, 69, 705–709. [Google Scholar] [PubMed]
- Hadi, A.S. Identifying multiple outliers in multivariate data. J. R. Stat. Soc. Ser. B. 1992, 54, 761–771. [Google Scholar] [CrossRef]
- Mathan, K.; Kumar, P.M.; Panchatcharam, P.; Manogaran, G.; Varadharajan, R. A novel Gini index decision tree data mining method with neural network classifiers for prediction of heart disease. Des. Autom. Embed. Syst. 2018, 22, 225–242. [Google Scholar] [CrossRef]
- Olanow, C.W.; Koller, W.C. An algorithm (decision tree) for the management of Parkinson’s disease: Treatment guidelines. Neurology 1998, 50, S1–S88. [Google Scholar] [CrossRef] [PubMed]
- Jiang, Q.; Wang, G.; Jin, S.; Li, Y.; Wang, Y. Predicting human microRNA-disease associations based on support vector machine. Data Min. Bioinform. 2013, 8, 282–293. [Google Scholar] [CrossRef]
- Breslow, N.E.; Mccann, B. Statistical Estimation of Prognosis for Children with Neuroblastoma. Cancer Res. 1971, 31, 2098–2103. [Google Scholar]
- Lloyd, B.G.R. Support Vector Machines for classification and regression. Analyst 2010, 135, 230–267. [Google Scholar]
- Seiffert, C.; Khoshgoftaar, T.M.; Van Hulse, J.; Napolitano, A. RUSBoost: A Hybrid Approach to Alleviating Class Imbalance. Syst. Man Cybern. 2010, 40, 185–197. [Google Scholar] [CrossRef]
- Hosmer, D.W.; Lemeshow, S. Applied Logistic Regression; John Wiley & Sons: Hoboken, NJ, USA, 2013. [Google Scholar]
- Goldberger, J.; Hinton, G.E.; Roweis, S.T.; Salakhutdinov, R.R. Neighbourhood Components Analysis. In Advances in Neural Information Processing Systems; The MIT Press: Cambridge, MA, USA, 2005; pp. 513–520. [Google Scholar]
- Đurovic, Ž.; Kovacevic, B. QQ-plot approach to robust Kalman filtering. Int. J. Control 1995, 61, 837–857. [Google Scholar] [CrossRef]
- Cieslak, D.A.; Chawla, N.V. Learning decision trees for unbalanced data. In Joint European Conference on Machine Learning and Knowledge Discovery in Databases; Springer: Berlin/Heidelberg, Germany, 2008; pp. 241–256. [Google Scholar]
- Oates, C. Vascular Ultrasound: How, Why and When, 3rd ed. Ultrasound 2010, 18, 99. [Google Scholar] [CrossRef]
- Chavhan, G.B.; Parra, D.A.; Mann, A.; Navarro, O.M. Normal Doppler spectral waveforms of major pediatric vessels: Specific patterns. Radiographics 2008, 28, 691–706. [Google Scholar] [CrossRef] [PubMed] [Green Version]
- Heijenbrok-Kal, M.H.; Buskens, E.; Nederkoorn, P.J.; Van der Graaf, Y.; Hunink, M.M. Optimal Peak Systolic Velocity Threshold at Duplex US for Determining the Need for Carotid Endarterectomy: A Decision Analytic Approach 1. Radiology 2006, 238, 480–488. [Google Scholar] [CrossRef]
- Ali, F.A. Duplex criteria for determining ≥50% and ≥80% internal carotid artery stenosis following carotid endarterectomy with patch angioplasty. Vascular 2011. [Google Scholar] [CrossRef]
- Scissons, R.P. Should Carotid Duplex Velocity Thresholds Be Modified for Patients Undergoing Computed Tomographic Angiography? J. Vasc. Ultrasound 2012. [Google Scholar] [CrossRef]
- Tokunaga, K.; Koga, M.; Yoshimura, S.; Arihiro, S.; Suzuki, R.; Nagatsuka, K.; Toyoda, K. Optimal Peak Systolic Velocity Thresholds for Predicting Internal Carotid Artery Stenosis Greater than or Equal to 50%, 60%, 70%, and 80%. J. Stroke Cerebrovasc. Dis. Off. J. Natl. Stroke Assoc. 2016, 25, 921–926. [Google Scholar] [CrossRef] [PubMed]
Figure 1.
Spectrum and envelope curves.

Figure 2.
The feature weights calculated by Neighborhood Components Analysis (NCA).

Figure 3.
(a) Mahalanobis Distance (MD) for positive samples; (b) MD for negative samples.

Figure 4.
(a) QQ-plots of and distribution for the negative sample; (b) QQ-plots of and distribution for the positive sample.
Figure 4.
(a) QQ-plots of and distribution for the negative sample; (b) QQ-plots of and distribution for the positive sample.

Figure 5.
(a) Loss varies with the number of weak learners; (b) loss varies with the maximum number of splits.
Figure 5.
(a) Loss varies with the number of weak learners; (b) loss varies with the maximum number of splits.

Figure 6.
(a) Weight cumulative curve for ranked weak learners; (b) feature weight of the sample index of 271.
Figure 6.
(a) Weight cumulative curve for ranked weak learners; (b) feature weight of the sample index of 271.


Table 1.
List of hemodynamic parameters.
| Item | Parameter | Description |
|---|---|---|
| 1 | Acceleration (ACCL) | |
| 2 | Acceleration Time (ACCT) | − |
| 3 | End-diastolic Velocity (EDV) | |
| 4 | Heart Rate (HR) | |
| 5 | Pulsatility Index (PI) | ( |
| 6 | Peak Systolic Velocity (PSV) | |
| 7 | Resistance Index (RI) | |
| 8 | Spectral Broadening (SB) | |
| 9 | Systolic/Diastolic Ratio (S/D) | |
| 10 | Time Average Velocity (TAV) | |
| 11 | Volume Flow per Cycle (VFC) | , A indicates cross-sectional area of vessel. |
| 12 | Volume Flow per Minute (VFM) | |
| 13 | Velocity Time Integral (VTI) |
Table 2.
Comparison of classifier performance.
| Method | Accuracy | Sensitivity | Specificity | AUC |
|---|---|---|---|---|
| Linear SVM | 87.9% | 27% | 100% | 0.82 |
| Gaussian SVM | 88.6% | 34% | 99% | 0.88 |
| Logistic Regression | 86.4% | 41% | 95% | 0.80 |
| Decision Trees | 87.5% | 57% | 93% | 0.83 |
| RUSBoostd Trees | 87.1% | 64% | 92% | 0.83 |
| RUSBoost with Empirical Weights | 90.1% | 70% | 94% | 0.89 |
Table 3.
Accuracy of traditional methods for carotid stenosis.
| Study, Year | PSV, cm/s | Accuracy | Sensitivity | Specificity |
|---|---|---|---|---|
| Carpenter et al., 1995 | >170 | 83.5% | 4% | 100% |
| Heijenbrok-Kal et al.1, 2006 | >180 | 83.5% | 4% | 100% |
| Ali et al., 2011 | >213 | 82.1% | 0% | 100% |
| Scissons et al., 2012 | >152 | 82.1% | 4% | 99% |
| Tokunaga et al., 2016 | >130 | 79.6% | 12% | 95% |
Publisher’s Note: MDPI stays neutral with regard to jurisdictional claims in published maps and institutional affiliations. |
© 2020 by the authors. Licensee MDPI, Basel, Switzerland. This article is an open access article distributed under the terms and conditions of the Creative Commons Attribution (CC BY) license (http://creativecommons.org/licenses/by/4.0/).
Share and Cite
MDPI and ACS Style
Xiao, H.; Zhang, Y.; Yin, H.; Liu, P.; Liu, D.C. Early Diagnosis of Carotid Stenosis by Ultrasound Doppler Investigations: A Classification Method for the Hemodynamic Parameter. Information 2020, 11, 493. https://doi.org/10.3390/info11110493
AMA Style
Xiao H, Zhang Y, Yin H, Liu P, Liu DC. Early Diagnosis of Carotid Stenosis by Ultrasound Doppler Investigations: A Classification Method for the Hemodynamic Parameter. Information. 2020; 11(11):493. https://doi.org/10.3390/info11110493
Chicago/Turabian StyleXiao, Huiyue, Yi Zhang, Hao Yin, Paul Liu, and Dong Chyuan Liu. 2020. "Early Diagnosis of Carotid Stenosis by Ultrasound Doppler Investigations: A Classification Method for the Hemodynamic Parameter" Information 11, no. 11: 493. https://doi.org/10.3390/info11110493
Note that from the first issue of 2016, this journal uses article numbers instead of page numbers. See further details here.