Article

Migration and Diffusion of Heavy Metal Cu from the Interior of Sediment during Wave-Induced Sediment Liquefaction Process

1
Shandong Provincial Key Laboratory of Marine Environment and Geological Engineering, Ocean University of China, Qingdao 266100, China
2
Laboratory for Marine Geology, Qingdao National Laboratory for Marine Science and Technology, Qingdao 266000, China
3
Key Laboratory of Marine Environment and Ecology, Ministry of Education, Qingdao 266100, China
4
Key Laboratory of Marine Sedimentology and Environmental Geology, First Institute of Oceanography, MNR, Qingdao 266061, China
*
Authors to whom correspondence should be addressed.
J. Mar. Sci. Eng. 2019, 7(12), 449; https://doi.org/10.3390/jmse7120449
Submission received: 6 November 2019 / Revised: 21 November 2019 / Accepted: 27 November 2019 / Published: 8 December 2019
(This article belongs to the Special Issue New Advances in Marine Engineering Geology)

Abstract

:
Sediments are an important sink for heavy metal pollutants on account of their strong adsorption capacity. Elevated content of Cu was observed in the Chengdao area of the Yellow River Delta, where the surface sediment is mainly silt and is prone to be liquefied under hydrodynamic forces. The vertical transport of fine particles, along with pore water seepage, during the liquefaction process could promote the migration and diffusion of Cu from the interior of sediment. The present study involved a series of wave flume experiments to simulate the migration and diffusion of Cu from the interior of sediment in the subaqueous Yellow River Delta area under wave actions. The results indicated that sediment liquefaction significantly promoted the release of Cu from internal sediment to overlying water. The variations of Cu concentrations in the overlying water were opposite to the suspended sediment concentrations (SSCs). The sediment liquefaction caused high initial rises of SSCs, but led to a rapid decline of dissolved Cu concentration at the initial period of sediment liquefaction due to the adsorption by fine particles. Afterwards, the SSCs slightly increased and then gradually decreased. Meanwhile, the dissolved Cu concentration generally kept increasing under combined effects of intensively mix of sediment and overlying water, pore water seepage, and desorption. The dissolved Cu concentration in the overlying water during sediment liquefaction phase was 1.5–2.2 times that during the consolidation phase. Sediment liquefaction also caused vertical diffusion of Cu in sediment and the diffusion depth was in accordance with the liquefaction depth. The results of the present study may provide reference for the environmental management in the study area.

1. Introduction

Heavy metal pollution in soils or sediments is a serious problem for biota and has been extensively studied worldwide because of its excellent ecological transference potential and manifest adverse effects on ecosystems and human health [1,2]. Heavy metals in soils or sediments can be derived through natural sources, such as weathering of rocks, or by pollution generated by human activities. Many efforts have been done to distinguish between the natural background values and anthropogenic inputs, and to evaluate the possible enrichment of heavy metals due to human activities [3,4,5,6,7,8]. Sediments in rivers, estuaries, bays, and in the seabed of some offshore oil fields are often contaminated by heavy metals on account of sewage discharge, surface runoff, and the industrial activities and oil spillage of offshore oil fields [9,10,11,12,13]. It is widely recognized that sediments are an important sink for most pollutants because of their strong adsorption capacity. The heavy metal pollutants discharged into the marine water are easily adsorbed on the fine particles and organic matter, migrating and settling into seafloor sediments [14,15]. These settled heavy metals might migrate into marine water during sediment resuspension and cause harm to marine ecosystems.
Sediment resuspension can be caused by physical processes such as tidal, wind-driven currents, and wind waves [16]. In a shallow water environment, waves have been found to dominate the sediment resuspension process due to wave orbital shear stresses [17,18,19,20] or wave pumping of sediments [21]. Moreover, wave-induced pore pressure build-ups significantly promote the resuspension of sediment particles [22] and sediment liquefaction under extreme wave loads will lead to massive resuspension of particles, which is remarkably more than that under non-liquefaction conditions in quantity [23]. Meanwhile, a large quantity of fine particles, which have complex physicochemical properties, resuspended from the interior of sediment into the overlying water along with pore water seepage in the liquefaction process [24,25]. These factors would have a combined influence on the release of heavy metals accumulated in sediments.
The Chengdao area of the Yellow River Delta has a complex sedimentary environment that formed by the historical course variation of the Yellow River. The surface sediment in this area contains a high silt content, which is prone to resuspension, even liquefaction, under wave loads [26]. Moreover, elevated concentration of heavy metals, especially Cu, in sediment were reported in this area [11,13]. Under hydrodynamic disturbance, such as wind waves, the accumulated heavy metals in sediment could release into the overlying water body along with the sediment resuspension process.
Many efforts have been done to investigate the release of heavy metals during sediment resuspension processes. Numerical models coupling laboratory flume experiments were applied to study the remobilization during resuspension events of contaminated sediments. Wang et al. [27] explored the Cd release from sediment in Jinshan Lake during the post-dredging period by combining field surveys, laboratory experiments, and numerical simulations, the magnitude of Cd release was observed to be larger in high-water year and under higher bottom shear stress induced by the tidal flow. The exchange kinetics of lead between water and contaminated sediments in reservoirs were explored by a chemical speciation model, which was calibrated with laboratory resuspension experiments [28].
In-situ monitoring techniques are also extensively used in analyzing sediment resuspension and pollutants release process. A scientific instrument platform carrying sensors that measured suspended solids, current, wind velocity, and pressure was deployed to support the analysis of the mechanisms of sediment resuspension [18]. A 49-day field observation data set including temperature, suspended sediment concentration, chlorophyll concentration, and currents were collected by an in-situ monitoring platform to analyze the impact of typhoon on the sediment dynamics [29]. High-frequency on-line monitoring were performed to identify the daily variations of resuspension of heavy metals [30].
Laboratory flume experiments, which have advantages that the variables are controllable, were also extensively applied in studies about heavy metals remobilization during sediment resuspension, including particle entrainment simulator (PES) [31], annular flume [27,32,33], wave flume experiments [34], etc.. Nevertheless, the simulation with PES or annular flume only considered the hydrodynamic disturbance of surface sediment, and few studies focused on the heavy metal release during wave-induced sediment liquefaction process [34].
In view of this, the objective of the present study was to investigate the remobilization of heavy metal Cu under wave actions, especially during sediment liquefaction, through a series of controlled wave flume experiments using the sandy silts collected from the Yellow River Delta. Two sequential phases, i.e., consolidation phase and liquefaction phase, were included in the study to identify the variation of the concentration of resuspended particles, and the concentration of Cu in the overlying water and within the sediment. The study provides a reference for understanding changes of the marine ecological environment in the subaqueous Yellow River Delta.

2. Materials and Methods
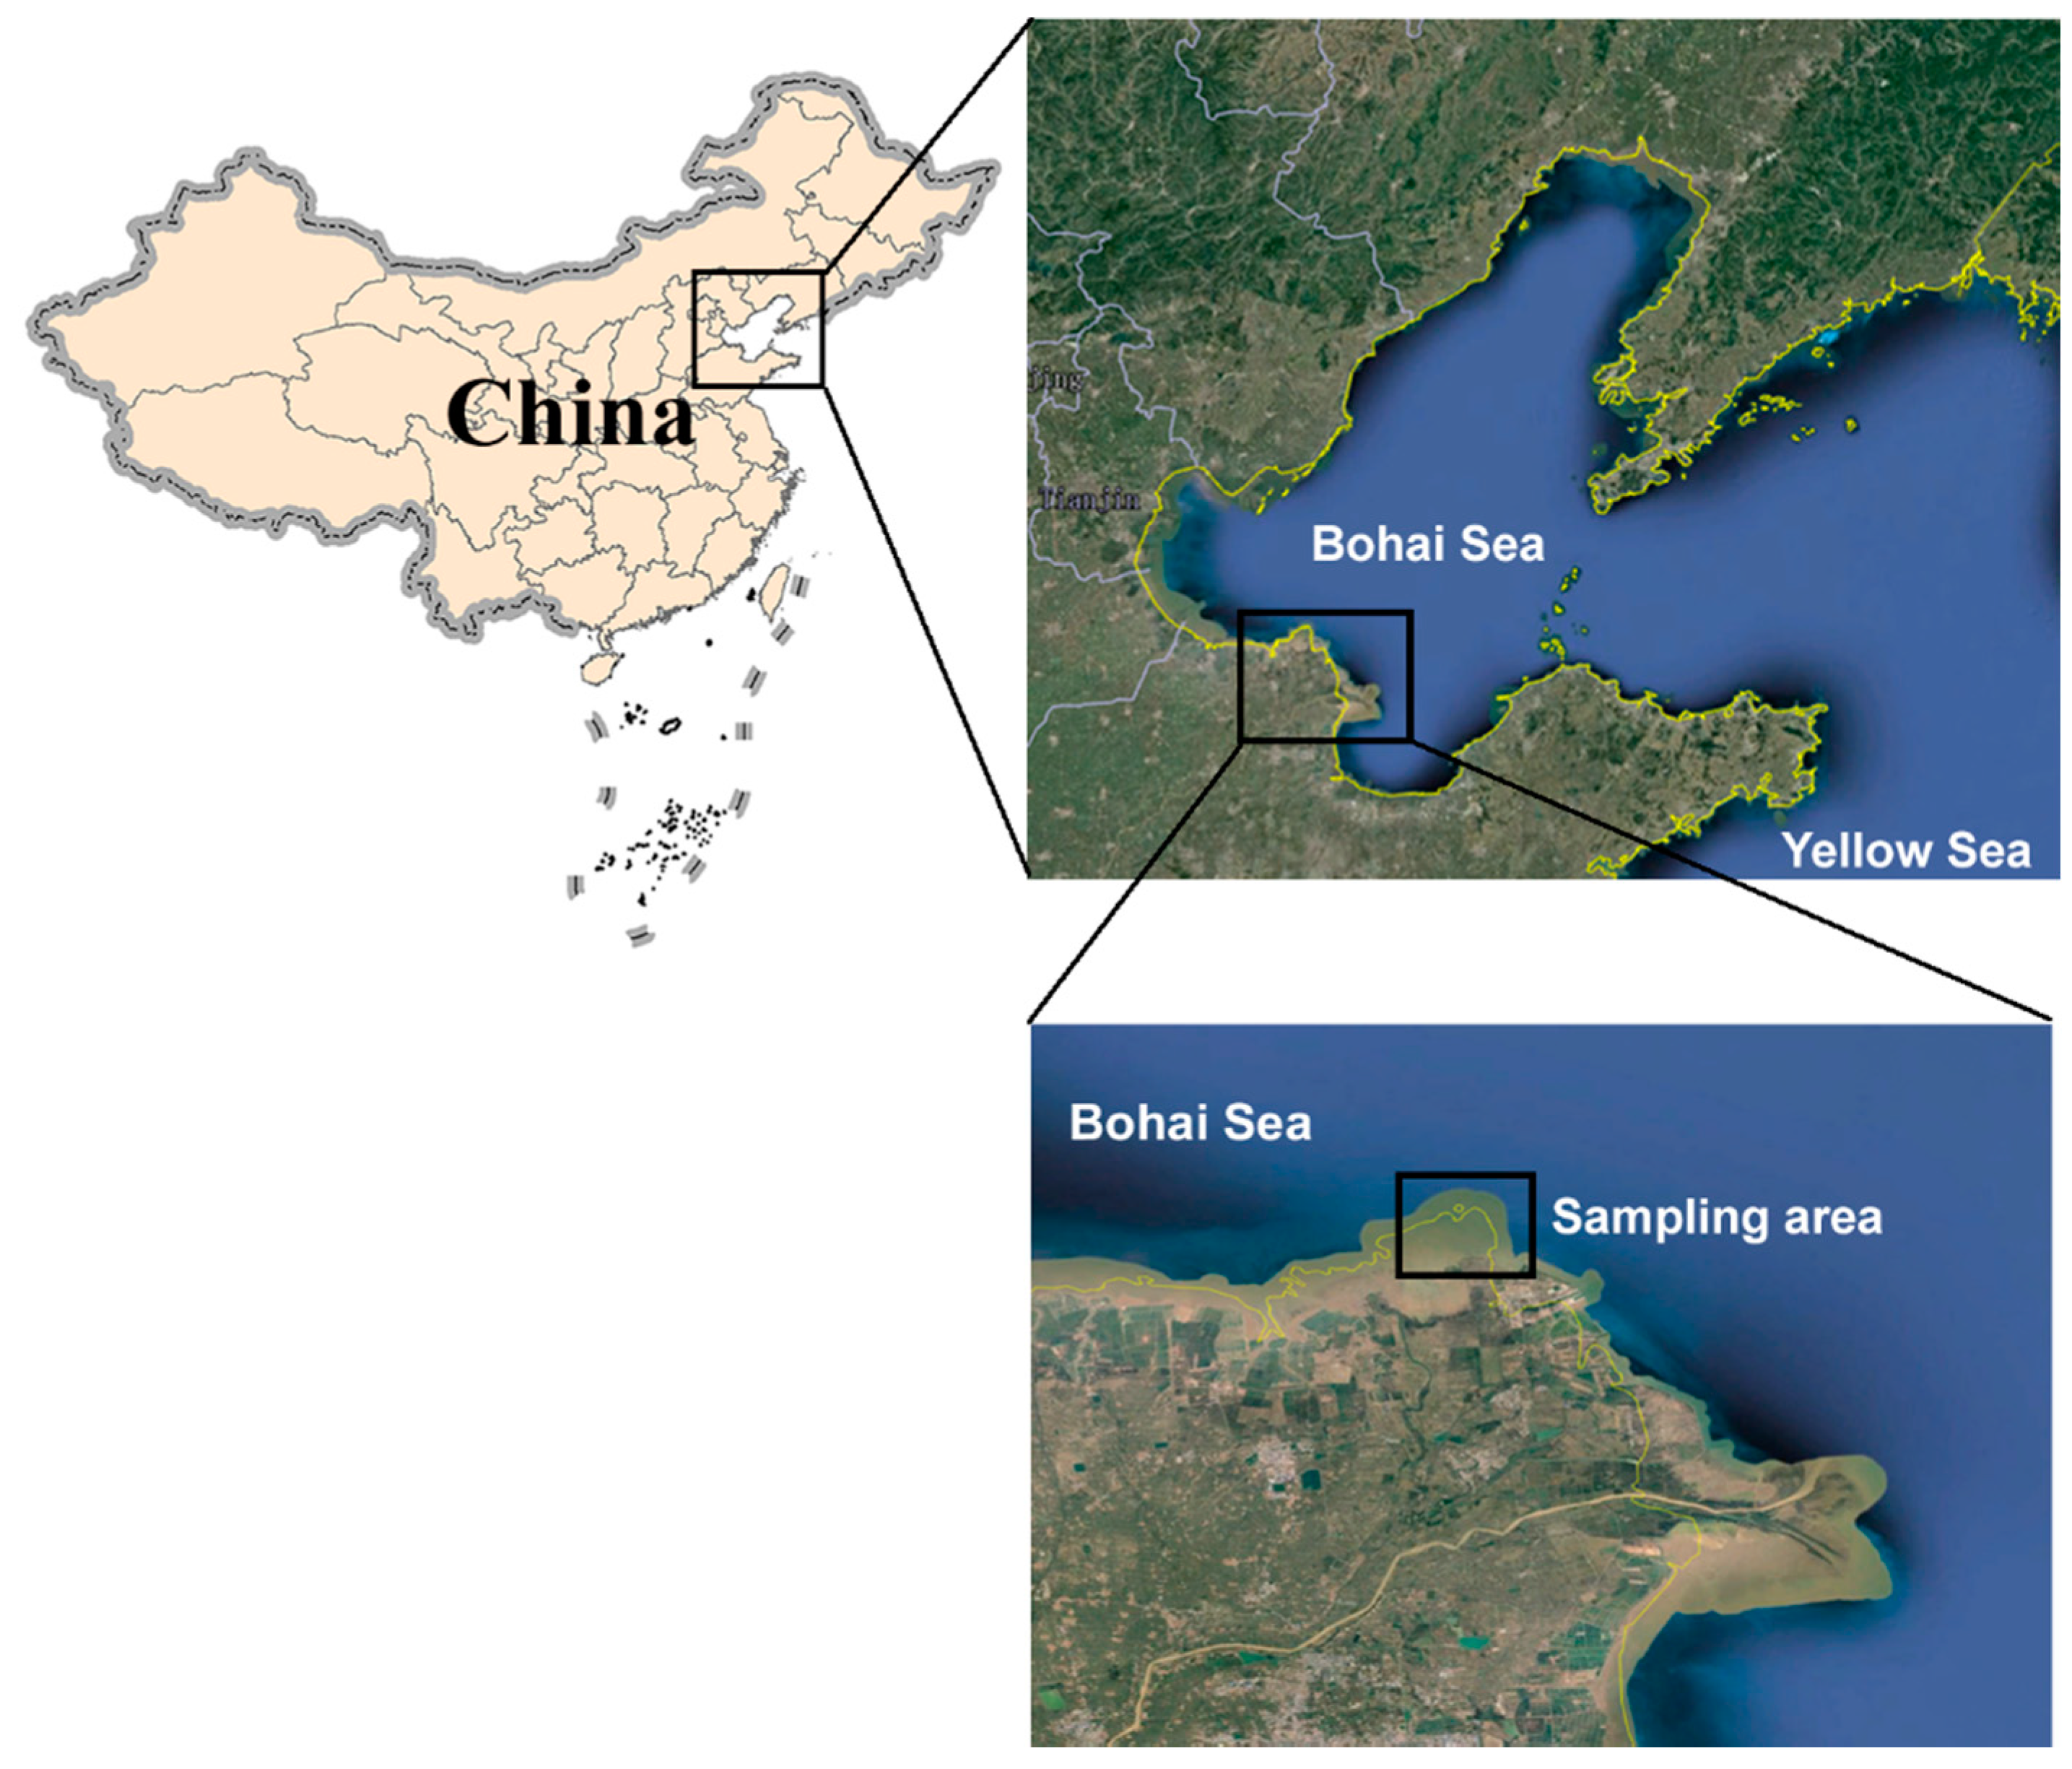
2.1. Study Area

The study area was located in the offshore area of the subaqueous Yellow River Delta in China, as shown in Figure 1. The surface sediment of the subaqueous Yellow River Delta consists mainly fine particulate silty clay [18], which is prone to liquefaction. The waves in this sea area are mainly stormy waves, with the annual strongest wind direction from the northeast, an average wind velocity of 6.8 m/s, and a maximum wind velocity of 20.9 m/s. Storm surges occur easily under these conditions.

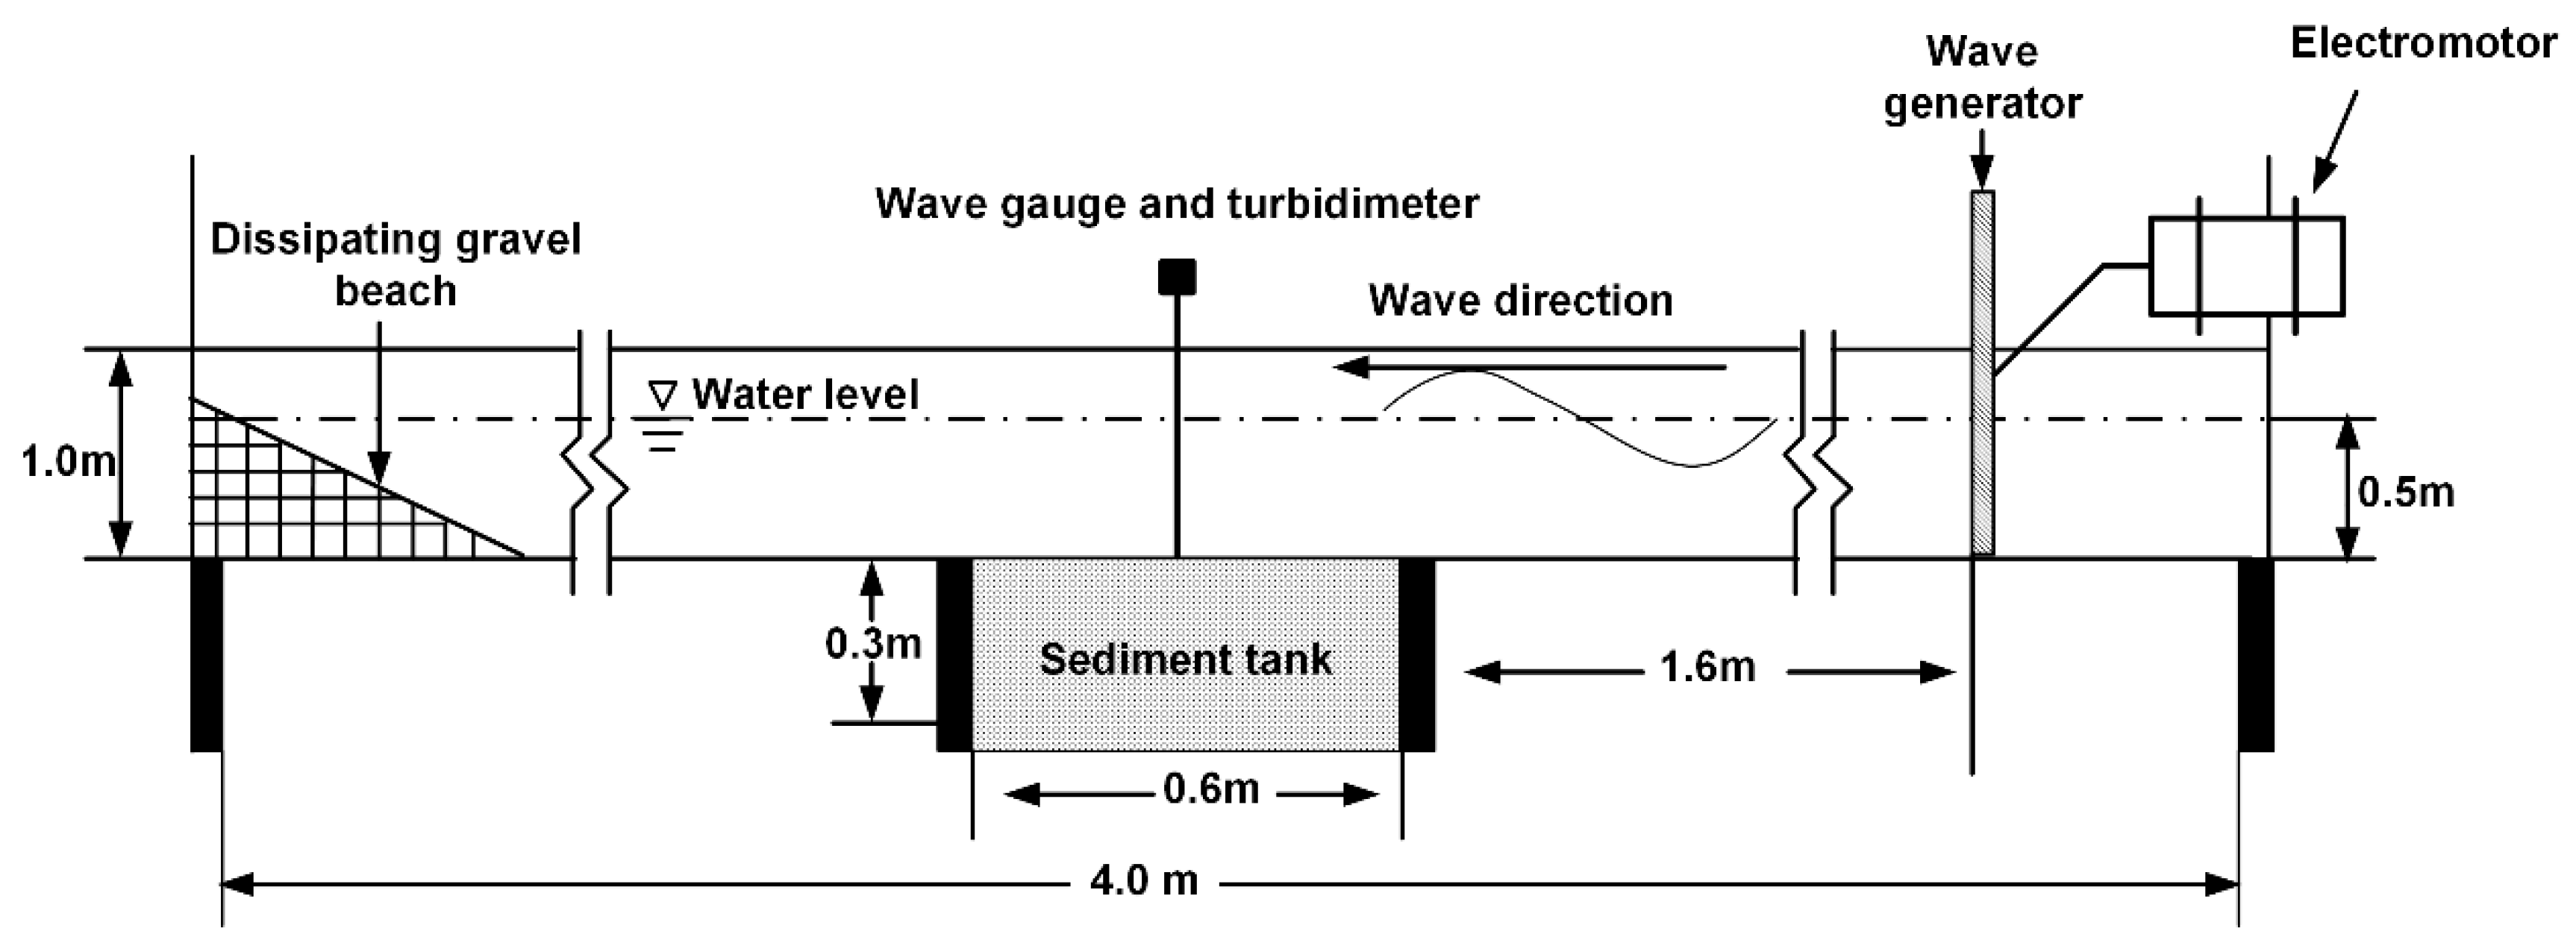
2.2. Experimental Facilities

Experiments were conducted in a “T” shape wave flume (3.5 m × 0.4 m × 1.0 m), which consists of a water flume and a sediment tank (Figure 2). The flume was equipped with a wave generator at the right end and a dissipating gravel beach at the other.
As shown in Figure 2, a capacitive wave gauge and a turbidimeter was fixed along the central of the water flume to collect the wave height, wave period, and the turbidity in the overlying water during the experiments, respectively. The turbidimeter (RBR, Canada) was fixed with a self-design bracket on the top of the flume. Two turbidity probes of the turbidimeter were fixed at 5 cm and 20 cm above the sediment surface (Figure 3), which were the same as the water sampling points, to record the variation of suspended sediment concentrations. Before the experiment, the turbidimeter was calibrated with suspended sediment solutions configured at setting concentrations of 0.2, 0.4, 0.6, 0.8, 1.0, and 1.2 g/L. Turbidity data was collected once per second, and the suspended sediment concentration in the overlying water was calculated as the average value of the 60 values collected every minute. The sediment tank (0.6 m × 0.4 m × 0.3 m) is located in the middle of the flume bottom and the right side of the tank is 1.6 m from the wave generator plate (Figure 2).

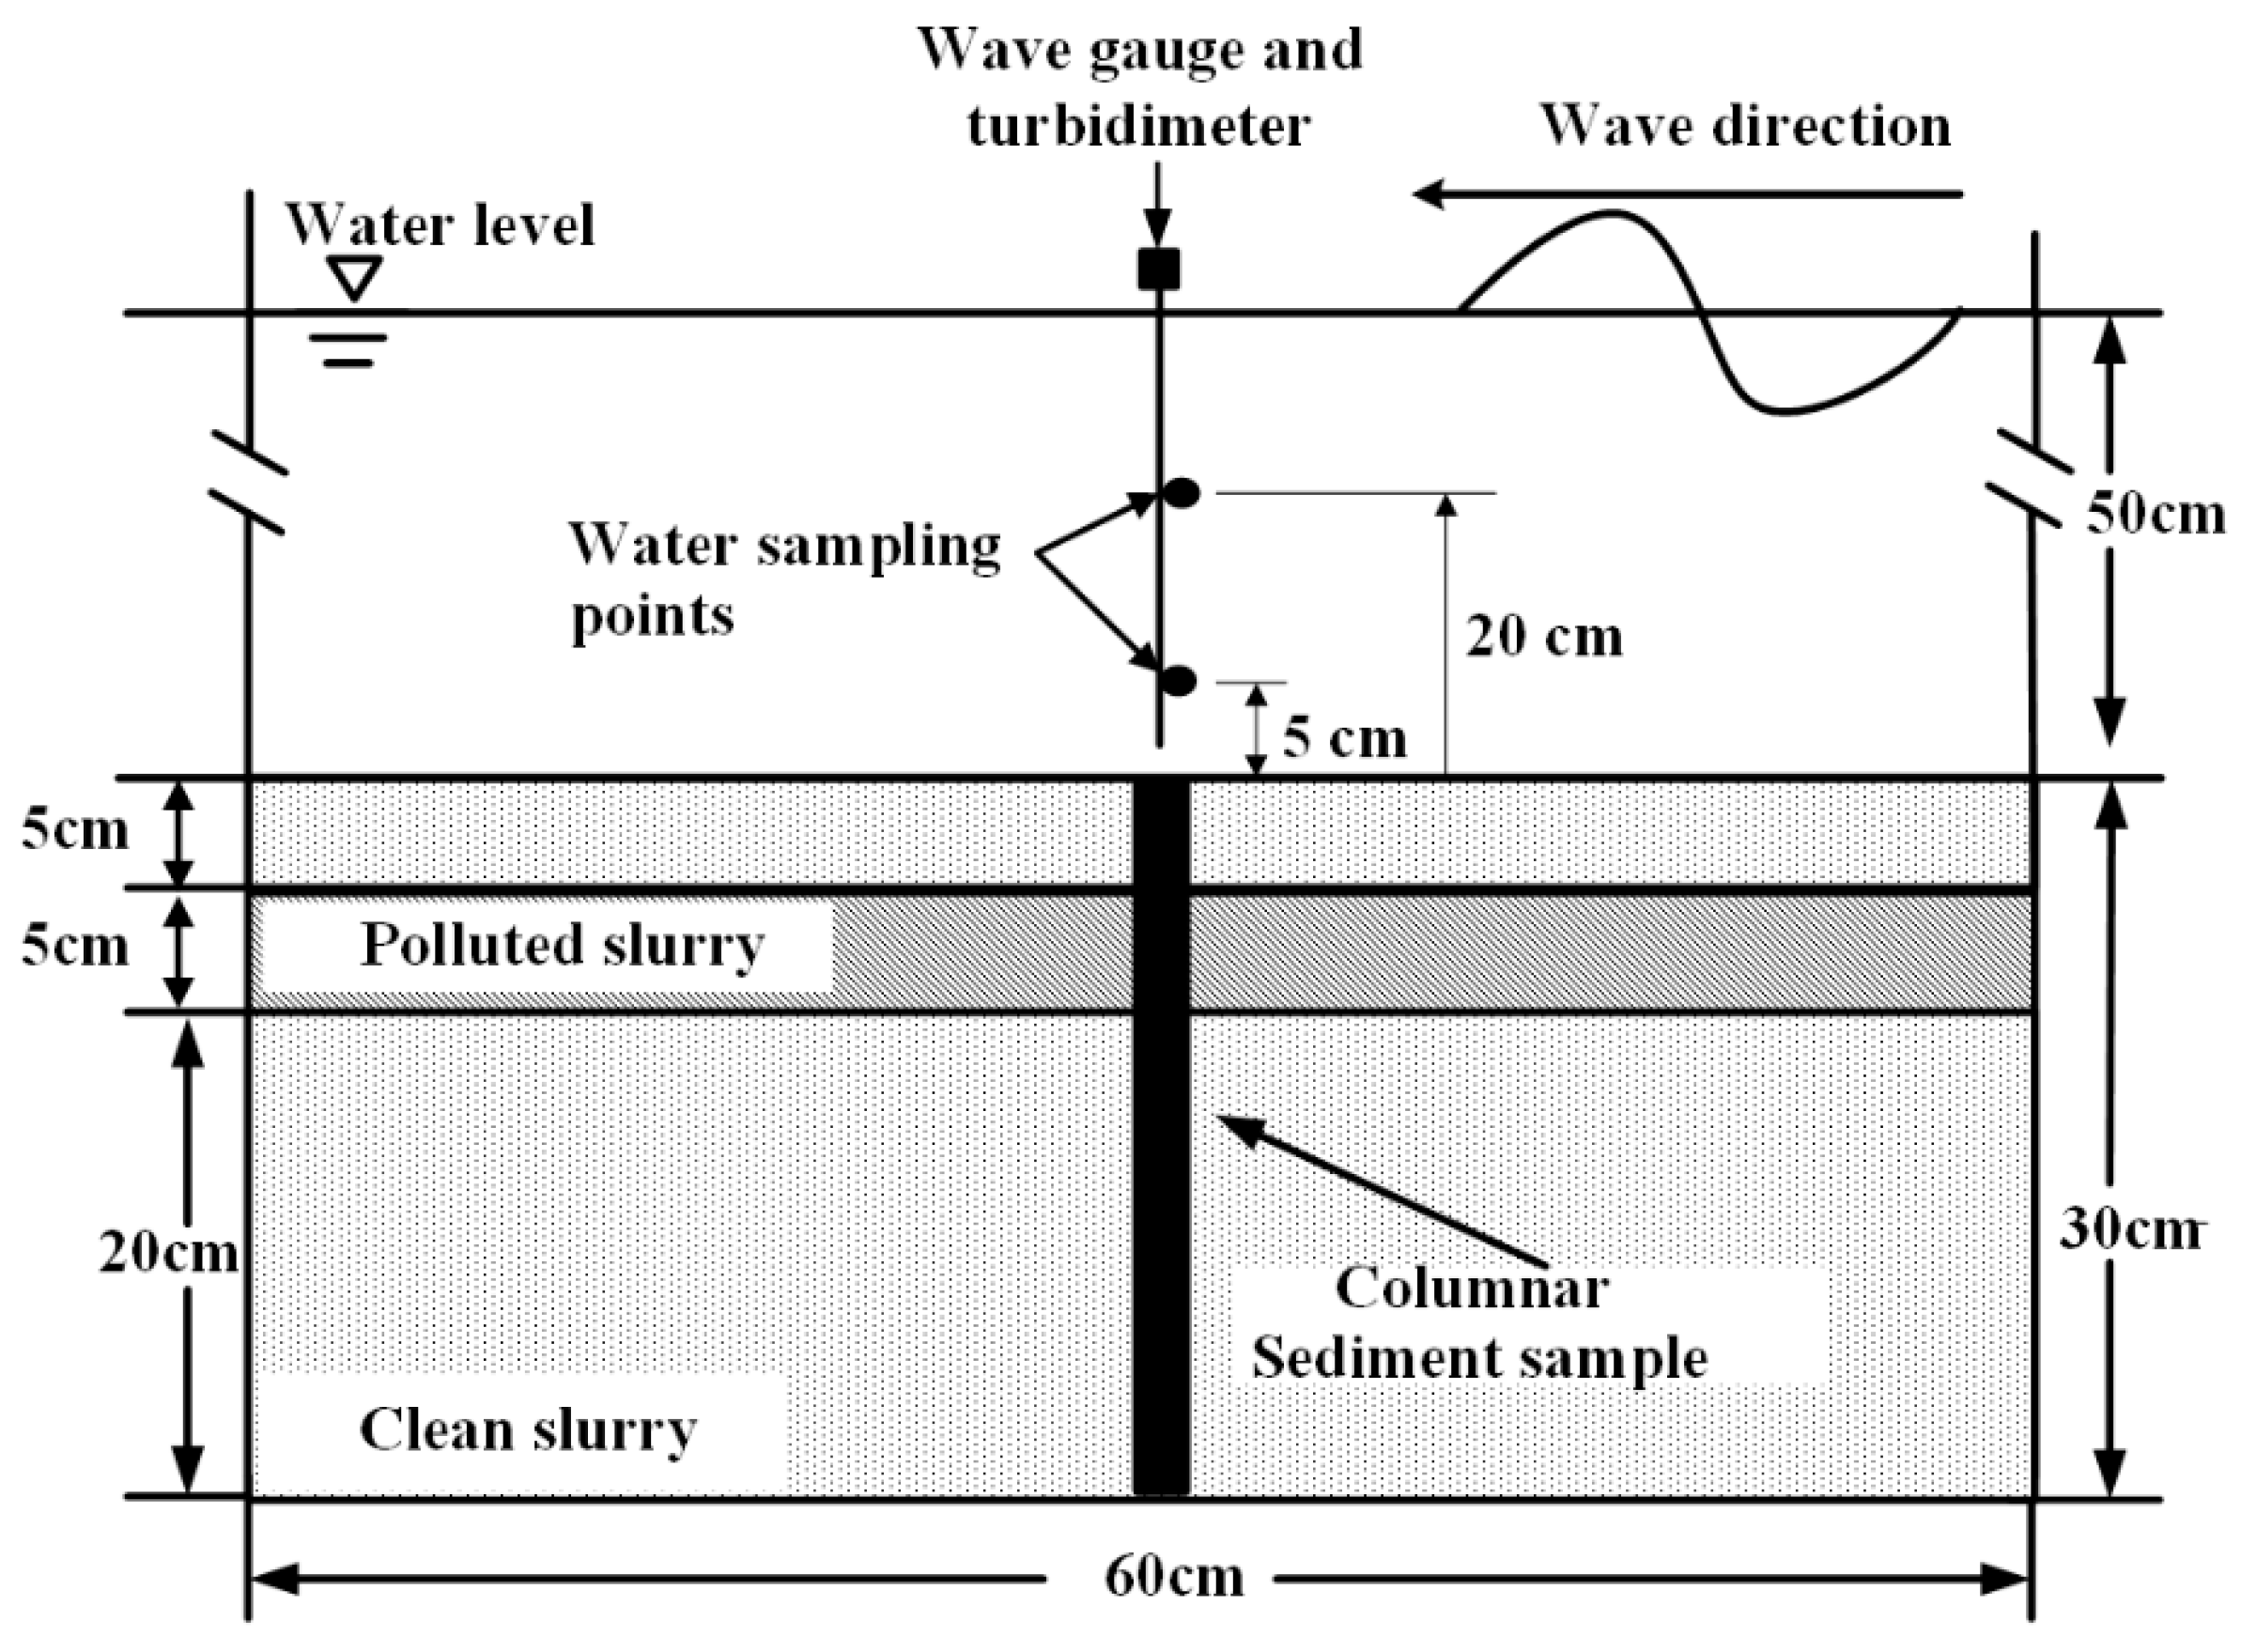
2.3. Experimental Preparation and Procedures

2.3.1. Sediment Preparation

Sediments used in the experiments in the present study were collected from a lobate tidal flat area near the Diaokou flow route of the Yellow River Delta. The soil was classified as sandy silt with a median particle size of 44 μm. The soil has a fine sand content of 29.57%, a silt content of 62.97%, and a clay content of 7.8%. To ensure the homogeneity of the experimental sediment, the soil was air dried and sieved to remove gravel. Artificial seawater with salinity of 35‰ (which was called standard seawater hereinafter) was used as overlying water in the wave flume and to mix the heavy meatal solution with soil in the experiments.
A total of 567 g Cu (NO3)2·3H2O was dissolved into 8.5 kg of standard sea water to produce a heavy metal solution, which was subsequently well mixed with 30.0 kg of sieved dry soil to form a uniform polluted slurry with a water content of 30%. The slurry was sealed in darkness for seven days to the ensure Cu reached a stable state. Clean slurry was prepared with sieved dry soil and standard seawater. In order to eliminate the effect of wave orbital shear stress on the resuspension of polluted sediment particles, the polluted slurry was designed to be covered by a layer of clean slurry. The clean slurry was first backfilled into the soil tank until a depth of 20 cm. Then, a uniform 5 cm thick layer of polluted slurry was deposited above the clean slurry. Another 5 cm thick layer of clean slurry was finally laid on the top. Standard seawater was then gradually added into the wave flume up to a depth of 50 cm above the soil surface (Figure 3).

2.3.2. Wave Flume Experiment Processes

The wave flume experiment included three sequential stages, namely static diffusion stage (Stage I), 7 cm wave height (Stage II), and 13.5 cm wave height (Stage III). Table 1 shows the wave parameters and sampling intervals in the experiments.
In Stage I, the overlying water was left still for 40 h and the sediments remained in a consolidation state. Stages II and III were the wave action stages, with the wave actions lasted for 180 min in each stage.
In Stage I, water samples were collected every 8 h using self-design water sampling devices at 5 cm and 20 cm above the center line of sediments, namely at water depths of 30 cm and 45 cm (Figure 3). Each water sample was 50 mL in volume. Since the volume of water samples were relatively small, standard seawater was not replenished into the wave flume. Three parallel samples were collected at each sampling point. Nitric acid was added to the samples, which were stored at low temperatures (4 °C) for analysis of dissolved Cu concentrations. During Stages II and III, after the wave height was steady, water samples were collected every 10 min for the first 60 min and every 20 min for the last 120 min. The sampling points and method were the same as that in Stage I.
At the end of each stage, a polyvinyl chloride (PVC) tube was inserted in the sediment at the central position of the sediment tank to collect columnar samples of sediments (Figure 3). These PVC tubes were remained in the sediment tank until the end of Stage III. All sediment columnar samples were incised into 2 cm segments for the analysis of Cu concentrations at different depths of the sediments.

2.4. Analytical Methods of Cu Concentrations in Water and Sediment Samples

The collected water samples were immediately filtered through 0.45 μm cellulose acetate membranes. The filtrate was then digested by nitric acid followed by Inductively Coupled Plasma – Mass Spectrometry (ICP-MS). The dissolved Cu in sediment samples was pretreated following the instructions in the pretreatment guideline of heavy metals analysis in the marine sediments and organisms-Microwave assisted acid digestion [35] followed by Fire Atomic Absorption Spectroscopy (FAAS).

2.5. Quality Control

All reagents used in the analysis were guaranteed reagents, and freshly prepared deionized water was used in the analysis and to rinse all the sampling instruments. Detection limits of FAAS for Cu was 0.0045 mg/L. To guarantee the data accuracy, a blank sample was set and all the samples were determined in triplicate. Average values of these three tests were applied in the present study. Offshore marine sediment (GBW07314) was used as the reference material in the analysis. The recovery rates of heavy metals were above 90%.

3. Results

On account of the quality of samples for particulate Cu analysis in overlying water failed to meet the minimum level for digestion analysis, only the dissolved Cu in the overlying water were discussed in this paper.

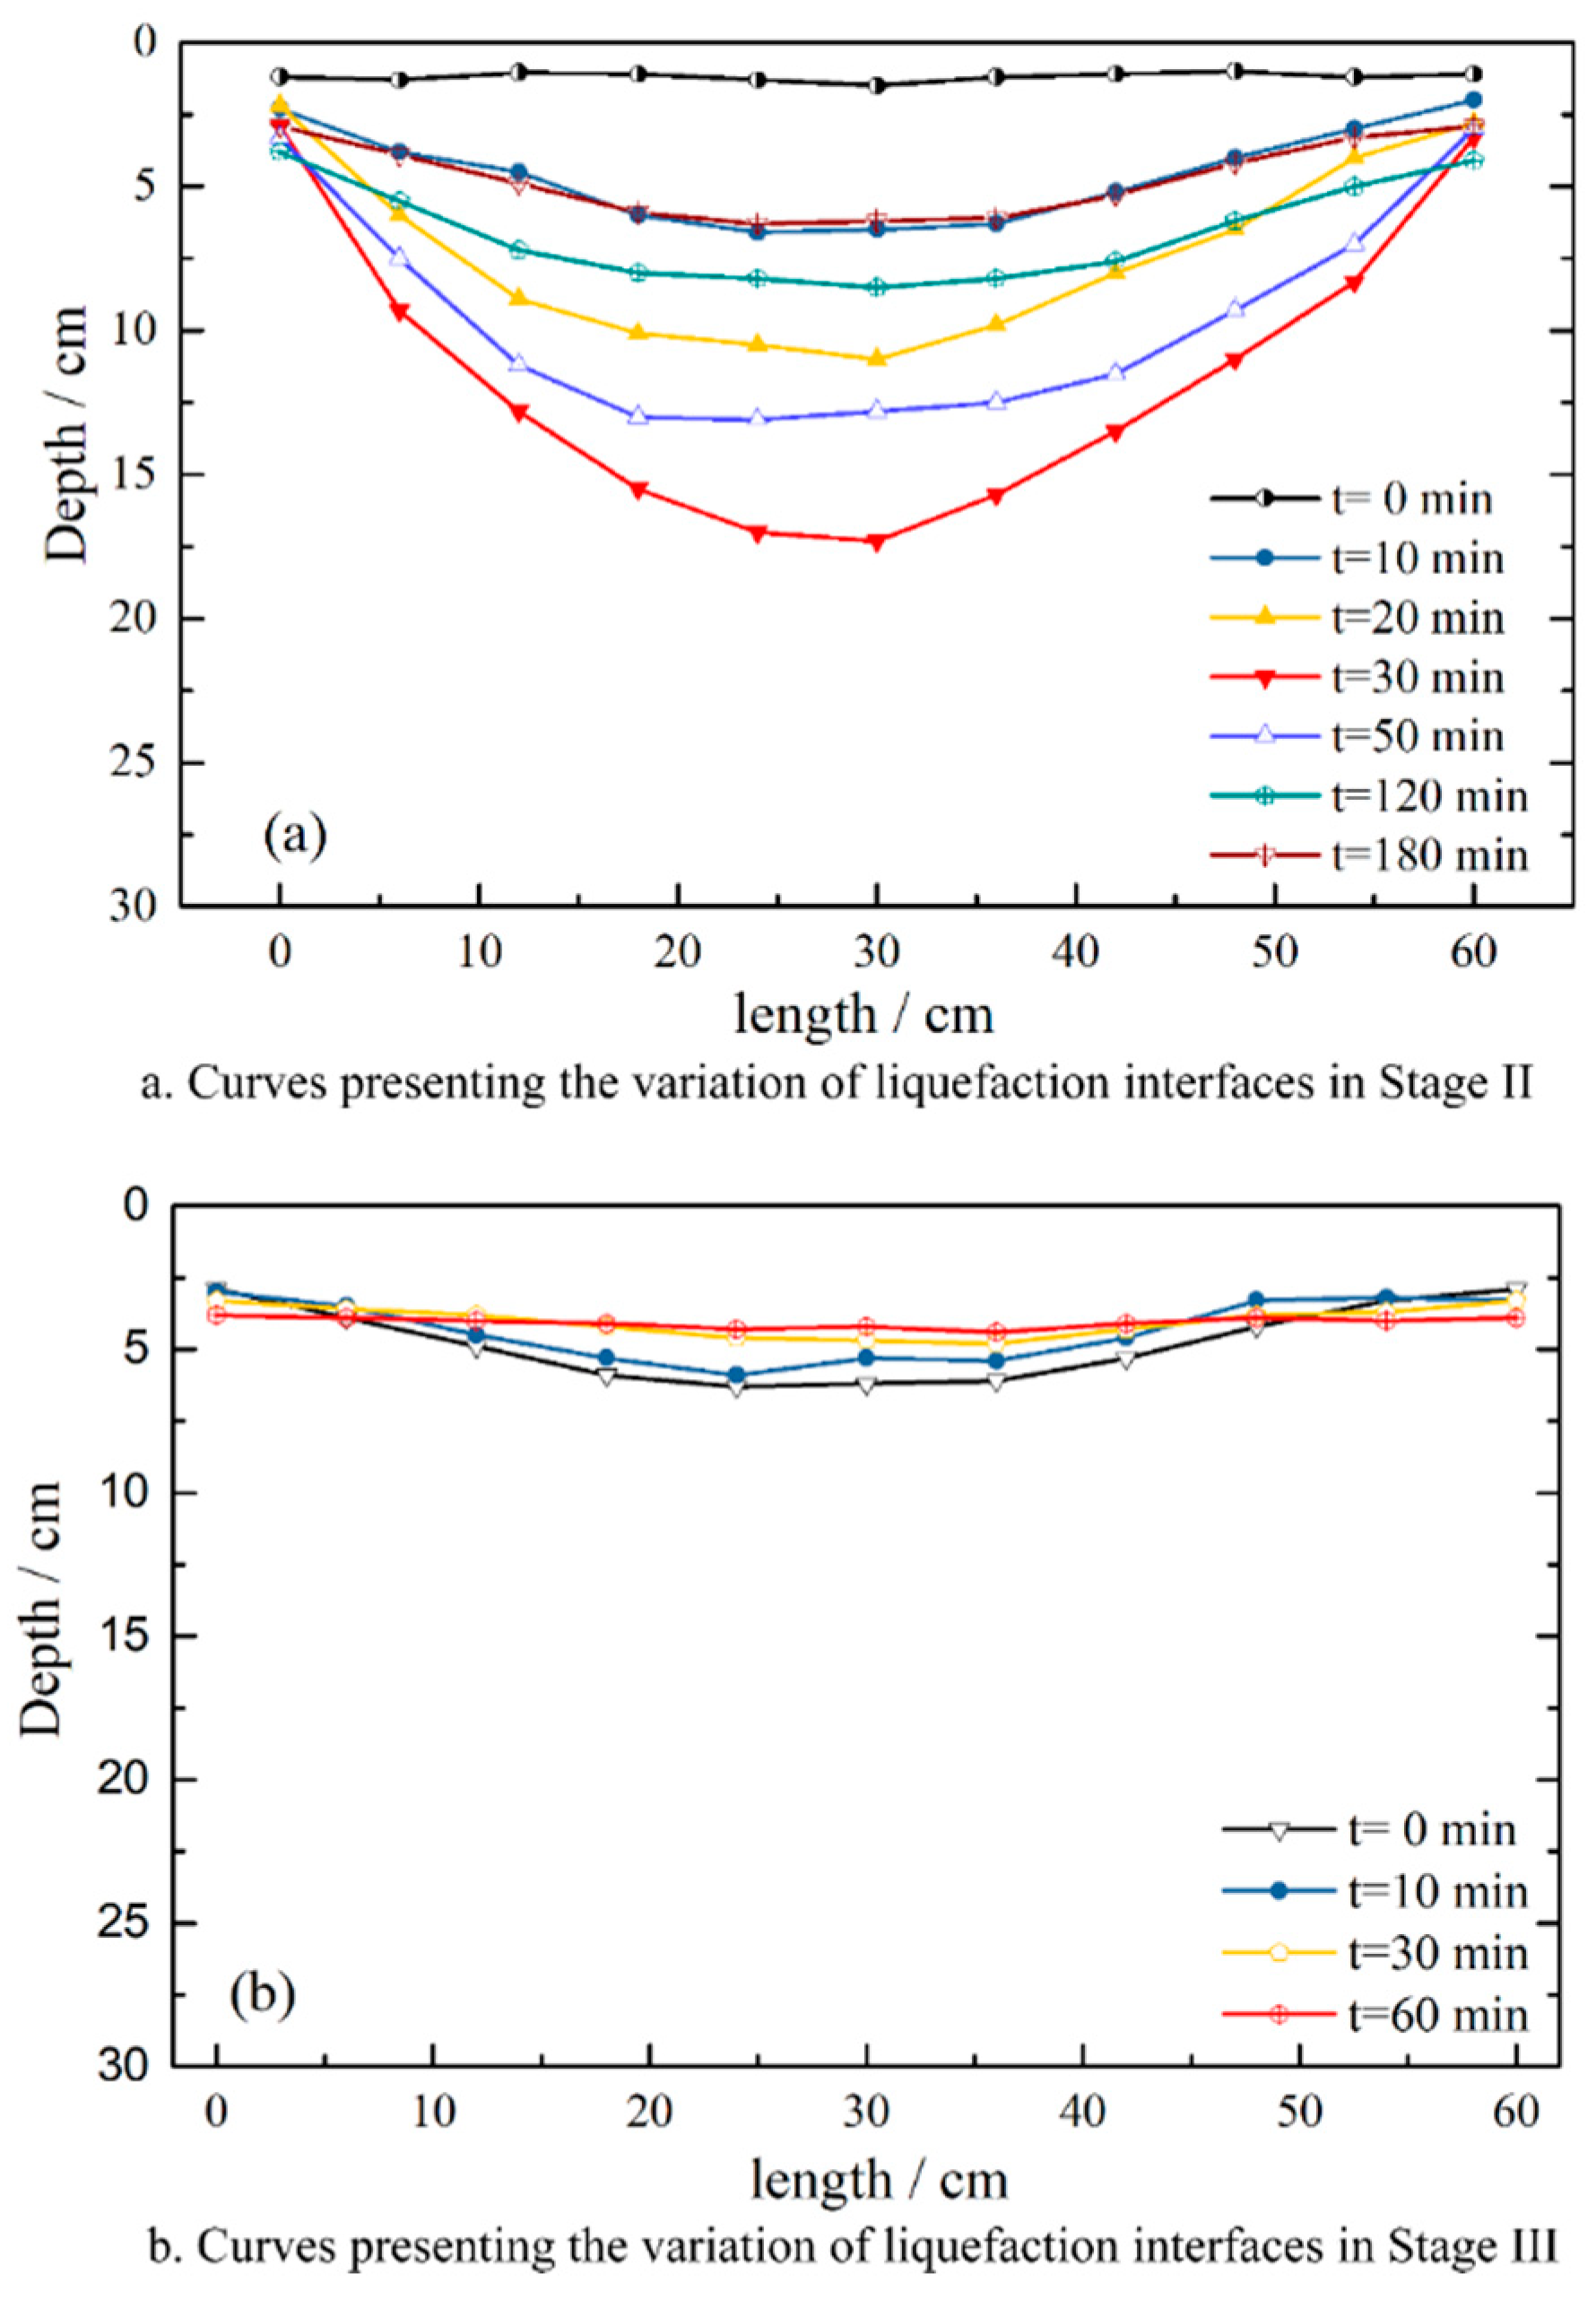
3.1. Sediment Liquefaction Process under Wave Action

A layer of electrostatic transparent membrane, on which the liquefaction interfaces were marked, was pasted on the side wall of the sediment tank. The photos of marked interfaces were also taking simultaneously. The marked interfaces were measured every 6 cm at horizontal direction, and a series of curves presenting the variation of liquefaction interfaces was presented in Figure 4.
The curve of t = 0 min in Figure 4a represents the initial sediment surface after 40 h consolidation. Fluid oscillation from left to right was observed in the surface layer of sediment immediately after the 7 cm height wave was loaded in the flume, indicating that sediment was liquefied. The liquefaction interface presented an arc shape, and the sediment particles above the interface showed a periodic oscillation along the interface with the same period as the wave, while the particles below the interface stayed still. This phenomenon is considered as the criterion for determining the liquefaction of sediment caused by waves [22]. After 30 min of wave action, the liquefaction depth reached its maximum of about 17 cm. Then the liquefaction interface began to move upwards under continuous wave action, and the range of liquefied sediments retracted until re-stabilization. Obvious coarsening and stratification were observed along the edge of the oscillation area.

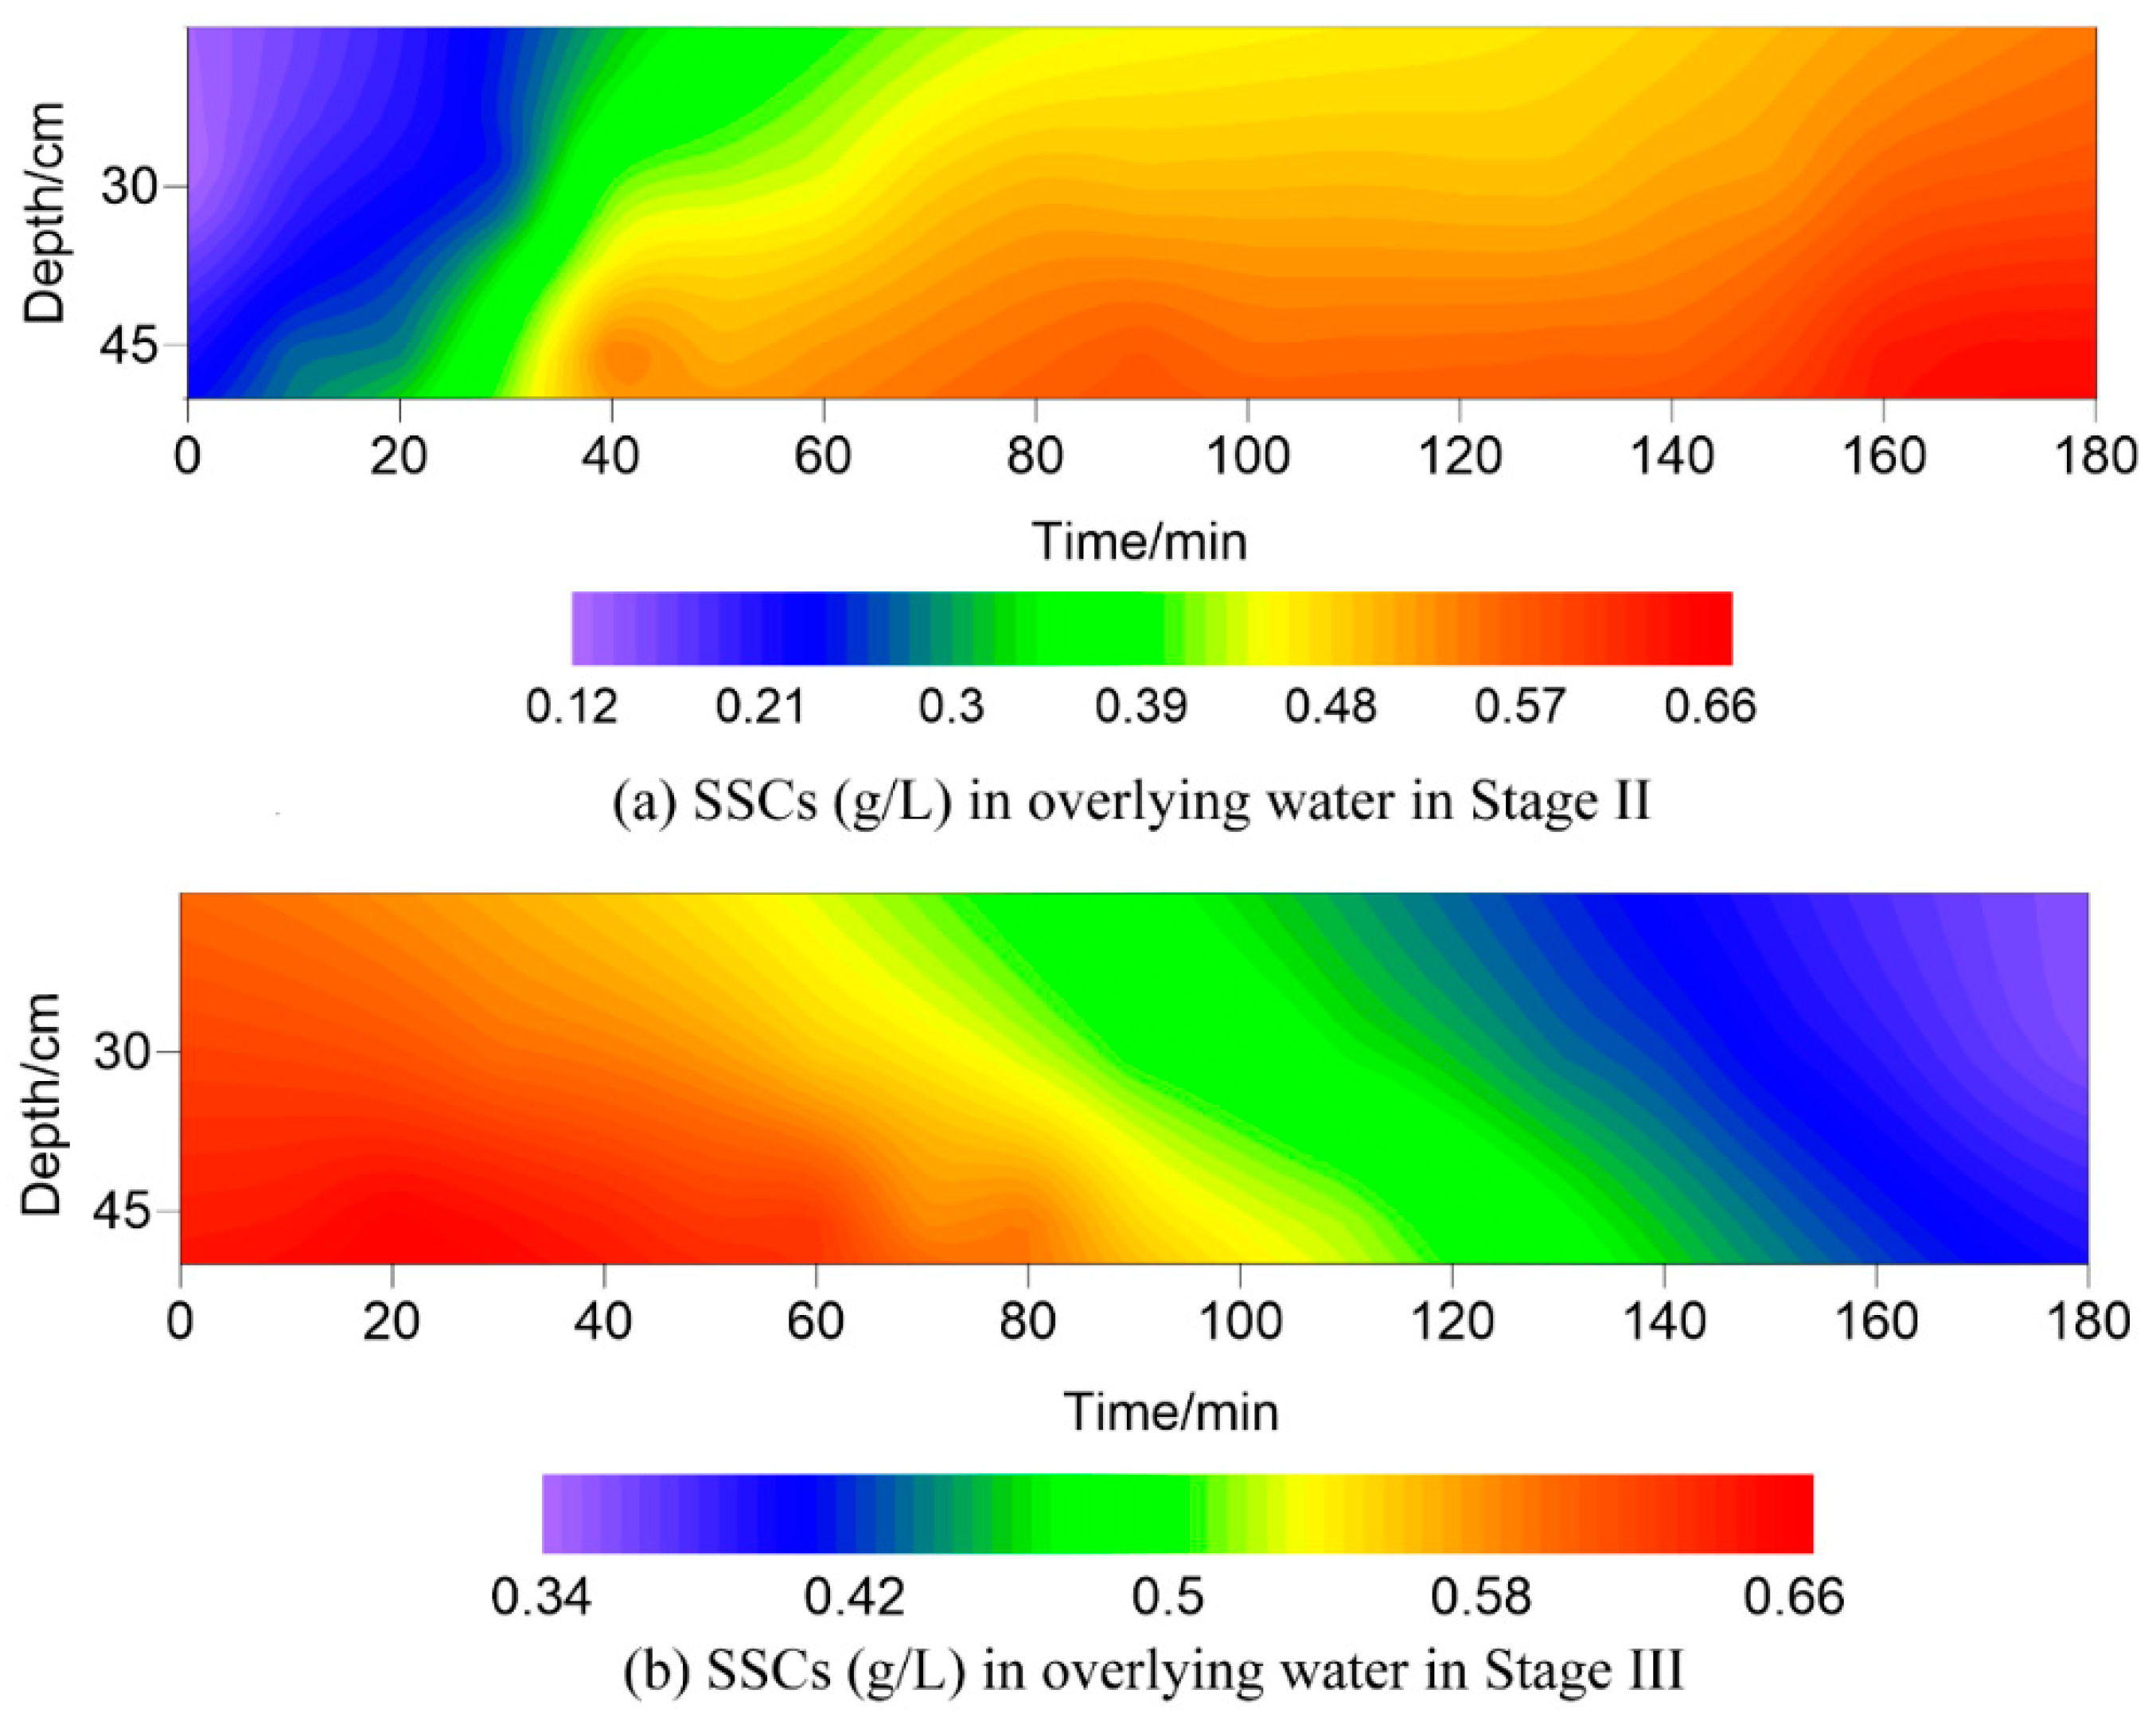
3.2. Variation of Suspended Sediments Concentrations (SSCs) in Overlying Water

The SSCs in the overlying water under wave actions in Stage II and Stage III were presented in Figure 5. There was a rapid increase in the SSC after loading the 7 cm height wave, and the SSC reached a relatively stable state after approximately 60 min of wave action. During Stage II, the SSC increased significantly, the variation range was 0.118–0.643 g/L. While in Stage III, the SSC first increased slightly, then gradually decreased, and the variation range was 0.357–0.656 g/L. The SSCs at 5 cm above the sediment surface were higher than those at 20 cm above the sediment surface, this agreed well with results in the study of Kong and Zhu [36], which found that SSC increased with water depth under wave action in a wave flume experiment. Moreover, the SSCs at the two sampling points showed similar variation trend.

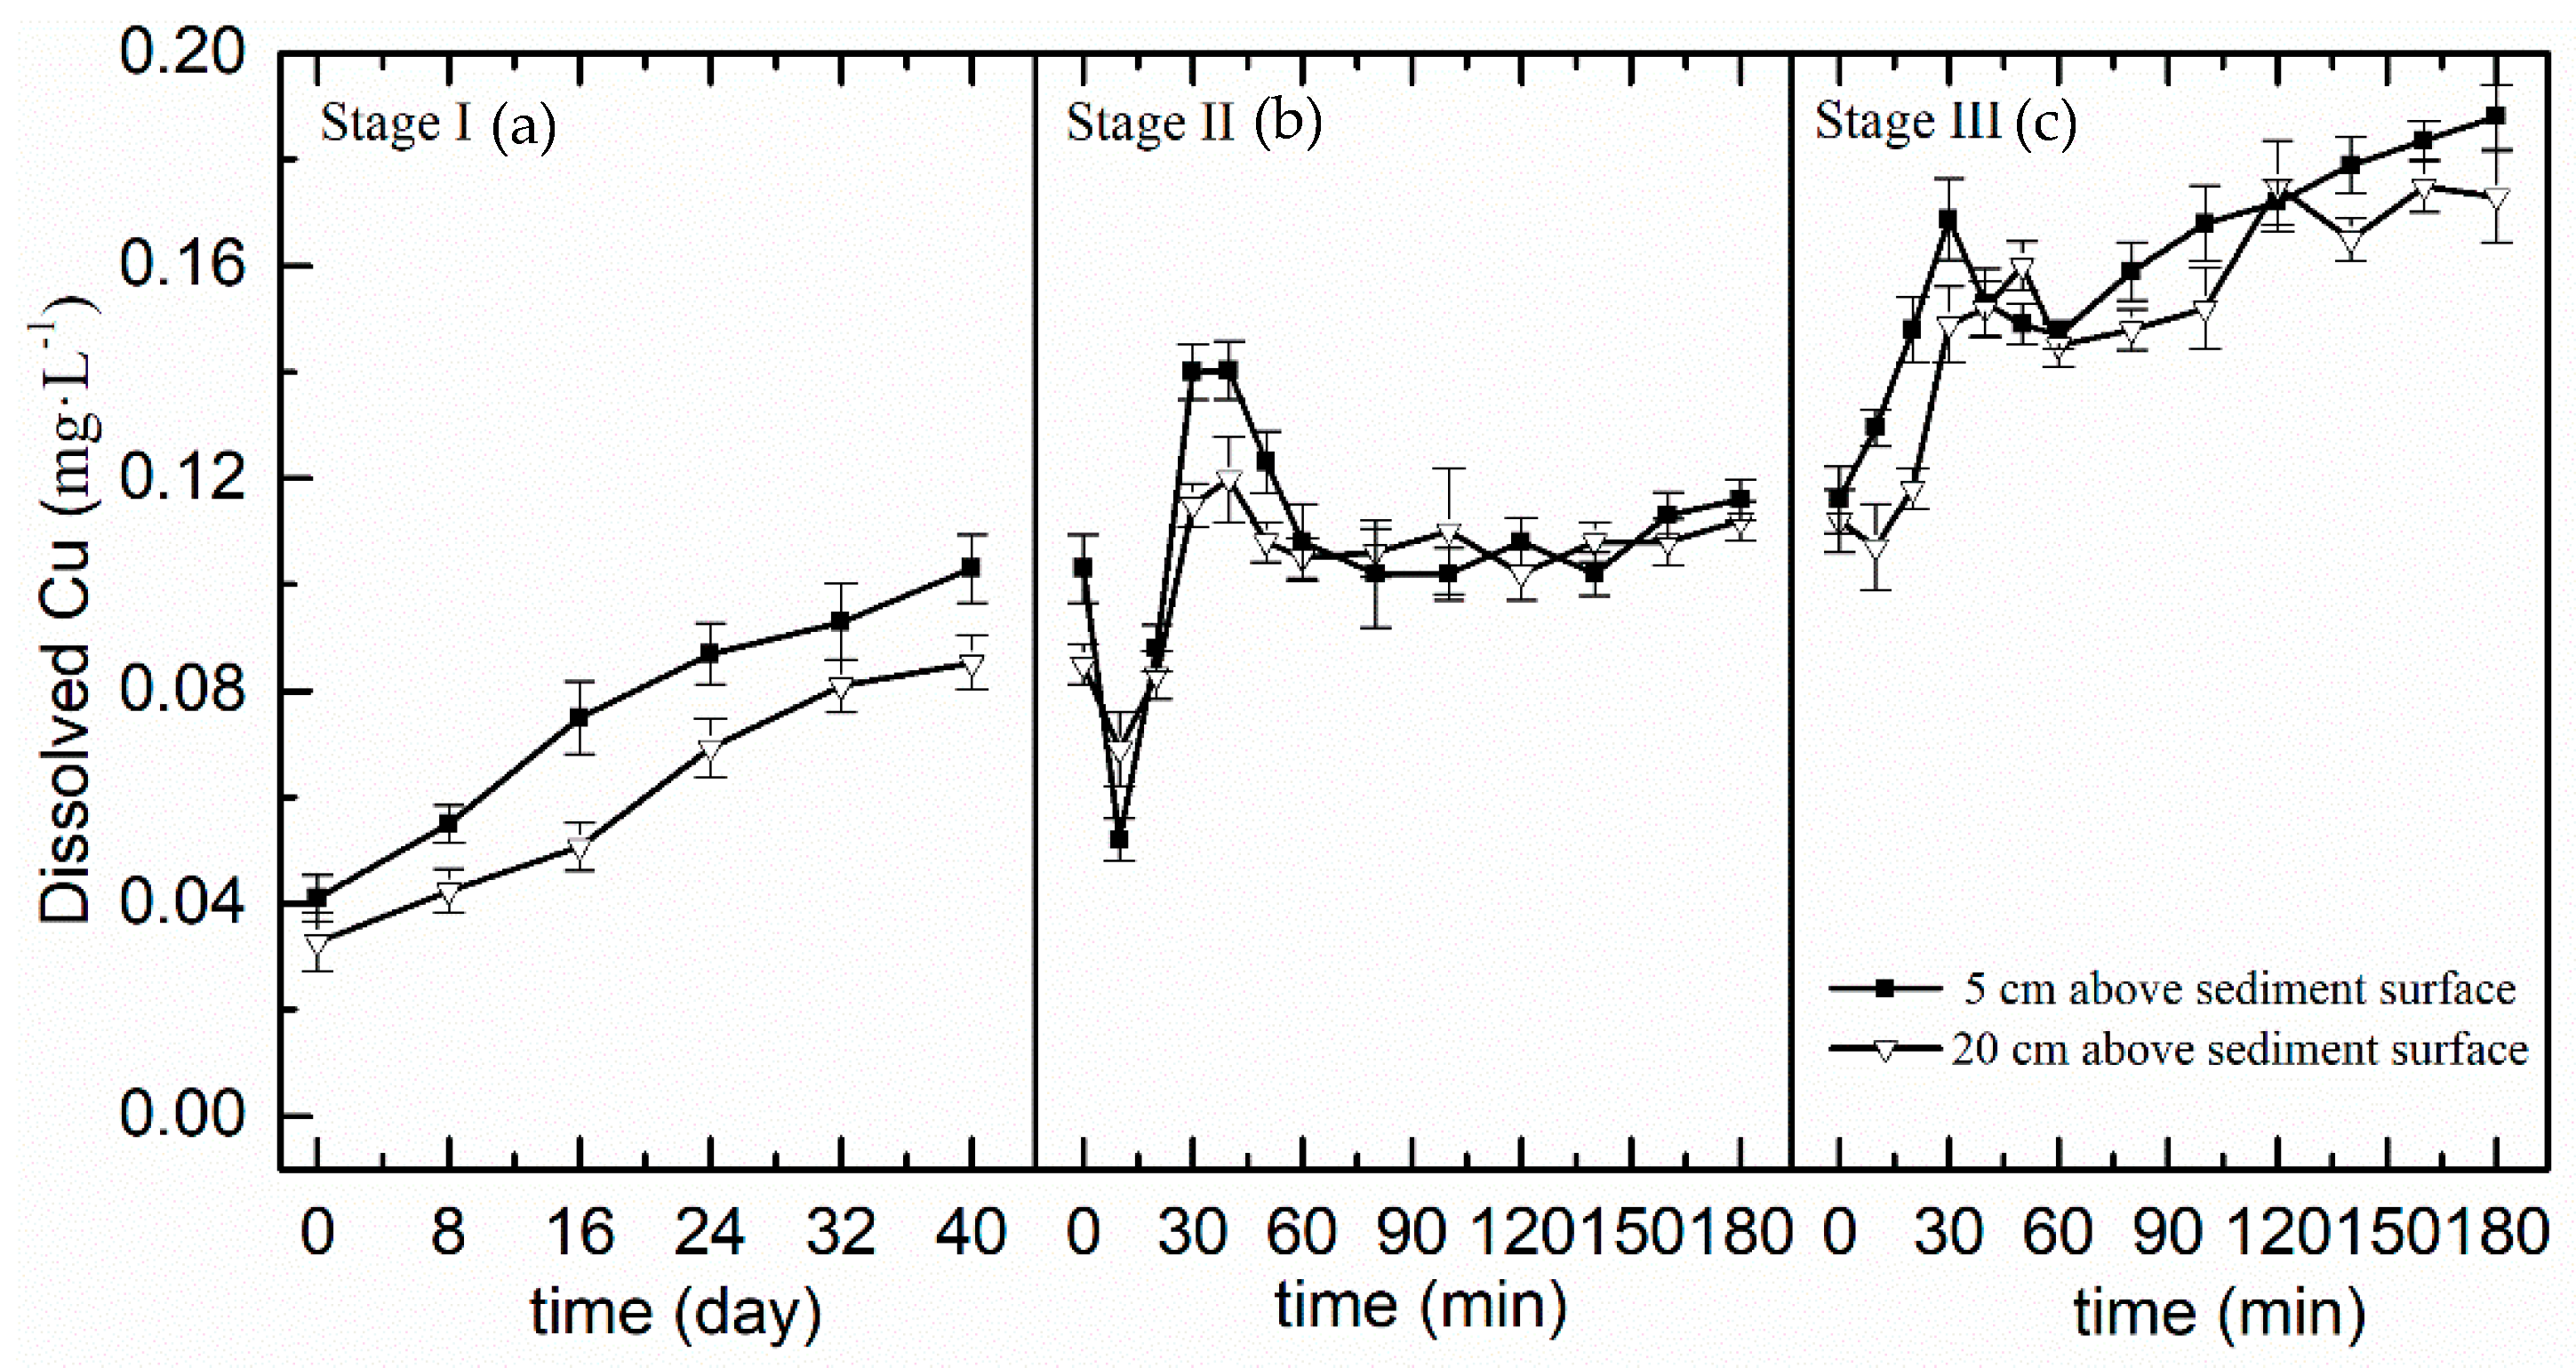
3.3. Variation of Dissolved Cu Concentration in the Overlying Water

The variations of dissolved Cu concentrations in overlying water in the three stages were presented in Figure 6.
In Stage I, there was no wave loaded and the sediment was under a consolidation phase for 40 h. The dissolved Cu concentration in the overlying water increased with consolidation time.
In Stage II, the Cu concentration increased at the beginning of this stage and reached a peak value after 30 min of wave action. A decrease trend was observed afterwards. After 60 min of wave action, the dissolved Cu concentration reached a relatively stable state. The dissolved Cu concentration in overlying water variation range of dissolved Cu in overlying water was 0.052–0.146 mg/L.
In Stage III, a rapid increase was observed in the dissolved Cu concentration after the wave was loaded, and the concentration kept increasing till the end of the experiment. The variation range was 0.107–0.188 mg/L.

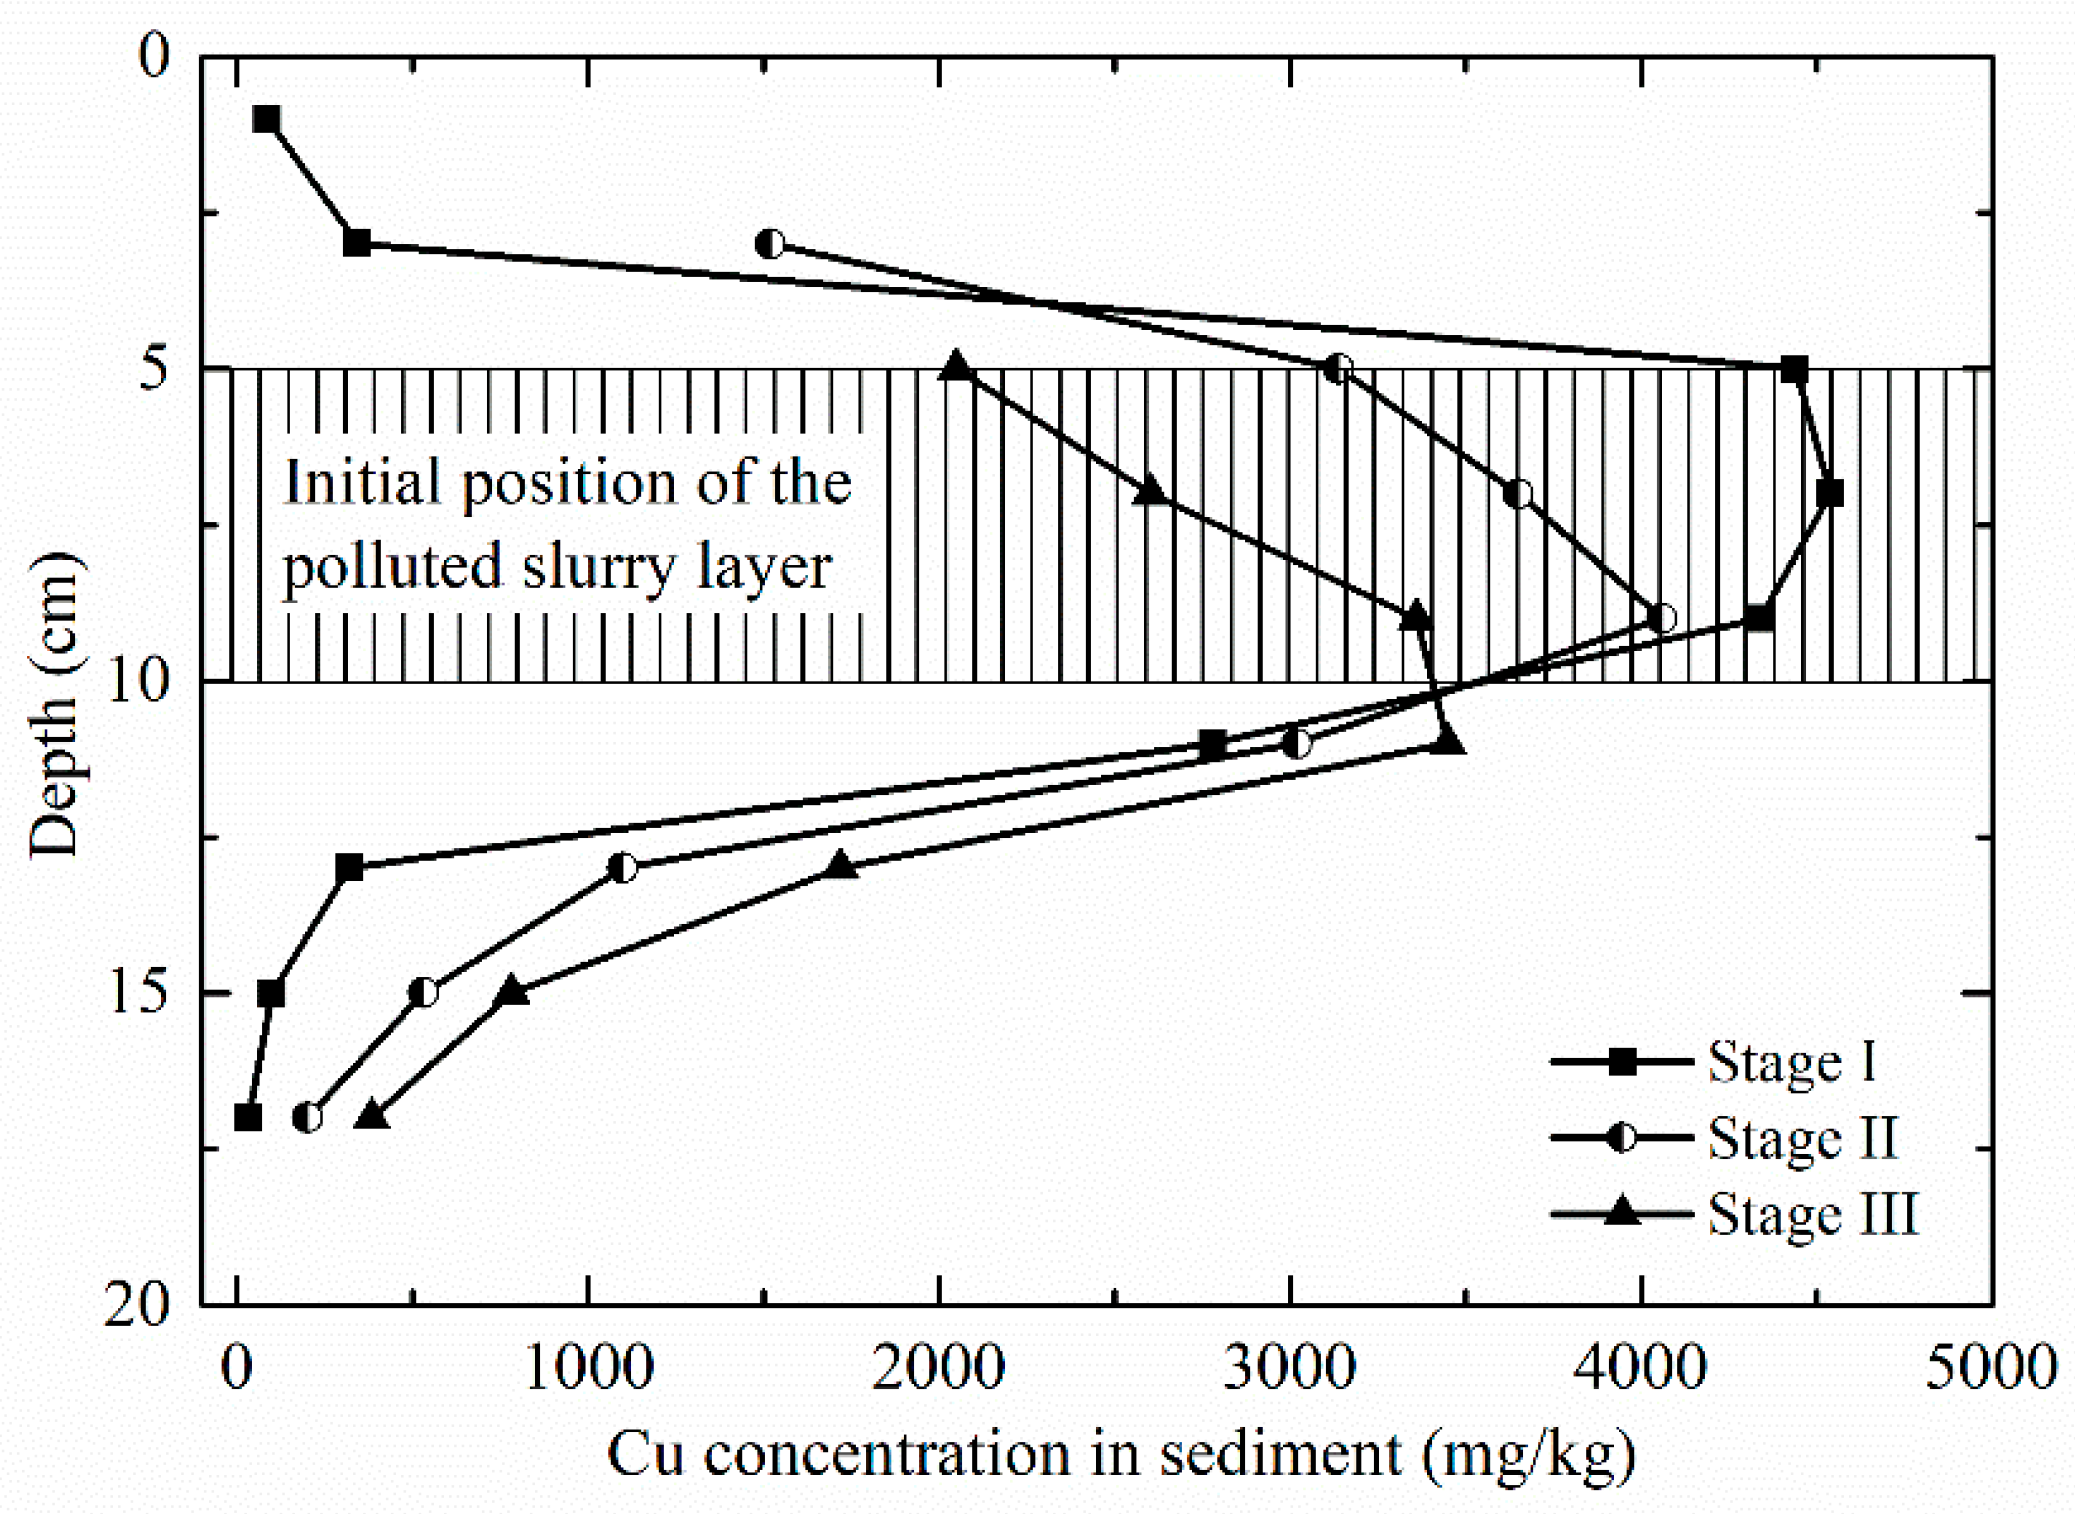
3.4. Vertical Distribution and Change of Cu Concentration in Sediment

In Stage I, the sediment was consolidated for 40 h under hydrostatic pressure. The depth of sediment surface descended by approximately 1 cm during this period. In Stage II, the sediment was liquefied under wave action, and the height of the sediment surface measured from the bottom of the soil tank descended by another 2 cm at the end of this stage. During Stage III, under the 13.5 cm wave action, the height of sediment surface was relatively stable and the it descended by approximately 1 cm comparing with that at the end of stage II. The Cu concentration in the columnar samples were analyzed, and the vertical profiles of Cu contents in the sediment were presented in Figure 7.
At the end of Stage I, the Cu concentrations in the sediment at a depth of 5–10 cm, where the polluted slurry was initially paved, were higher than other parts of the sediment, and the range of Cu concentration was 32–4540 mg/kg. At the end of Stages II and stage III, the layers with higher Cu concentration moved downward. The ranges of Cu concentration at the end of these two stages were 201–4060 mg/kg and 284–3450 mg/kg, respectively. As presented in Figure 7, Cu in the polluted layer diffused into the upper and lower layers, and the amount of upward diffusion was larger than that of downward diffusion.

4. Discussion

4.1. Variations of SSCs in the Overlying Water

During the initial period of the 7 cm height wave loading, the initial SSCs increased rapidly due to wave disturbance. This was similar with the SSC variation in the wave flume experiment conducted by Tzang et al. (2009). Under wave loads, the vertical distribution of pore pressure had depth gradients with a maximum value at a certain depth in sediment [37,38]. Once the sediment liquefaction initiated, pore pressure generally amplified in both shallow fluidized soil layers and near below the fluidized layer [23]. Thus, fine particles and pore water at this depth transported upwards from the interior of sediment under the “pumping” effect of pore water pressure [22,39], and caused higher initial rises of SSCs. After 30 min of wave loads, the depth of liquefaction interface reached a maximum value and began to move upwards (Figure 4a). Meanwhile, the SSCs increased slightly afterwards.
During Stage III, the sediment liquefaction interface essentially remained at a stable level. In this stage, the structure of the sediment was continuously strengthened as a result of gravitational consolidation and drainage of pore water in sediments, and the sediment particles became more compact [25]. Thus, liquefaction was not observed in this post-liquefied sediment [40]. Since the upward transport of fine particles from the liquefied soil layer gradually decreased and sediment deposition rate was larger than the resuspension rate [39], the SSCs in the overlying water gradually reduced.

4.2. Dissolved Cu Concentration Variations in the Overlying Water

In Stage I (the consolidation stage), the dissolved Cu concentration in the overlying water gradually increased. The dissolved Cu released from the sediments into overlying water through mainly two pathways. One was static diffusion [41]. On account of the dissolved Cu concentration in the sediments were much higher than that in the overlying water, the dissolved Cu was diffused into the overlying water through pore water. The other pathway was consolidation drainage. As the pore spaces between sediment particles were squeezed during consolidation, which induced the pore water seepage in sediment, dissolved Cu in sediment migrated into the overlying water along with the seepage.
In Stage II, sediment liquefaction was observed, and the initial SSCs in the overlying water increased rapidly (Figure 5a) in a short time after the wave load. However, the initial dissolved Cu concentration rapidly declined (Figure 6b). This agreed well with a previous study reported that the heavy metals concentrations in the overlying water and suspended sediments were negatively correlated [42]. The rapid decline in the dissolved Cu concentration at the initial period of this stage may be related to the adsorption process by the increased quality of suspended particles [34,43]. Moreover, as the change of hydrodynamic condition of the overlying water, namely from a static state to a disturbed state, the dissolved Cu above the sediment tank diffused into the surrounding water under wave disturbance. Afterwards, the dissolved Cu concentration then began to increase and reached its peak at approximately 30 min, which was corresponding to the sediment liquefaction process. The sediment and overlying water were intensively mixed during the liquefaction process [34,43], which facilitated the release of Cu from the sediment into the overlying water. The liquefaction interface gradually moved upwards under the subsequent wave actions. Meanwhile, fine particles in the sediment were resuspended into the overlying water during the liquefaction process [22]. These fine particles, which are relatively small in particle size and have larger specific surface area, would strongly adsorb the dissolved Cu and lead to a decrease of dissolved Cu concentration in the overlying water [44].
After 90 min of wave action, the SSCs in the overlying water remained relatively stable. However, the dissolved Cu in the overlying water kept increasing, which might be induced by the following reasons: (1) As the sediment liquefaction interface gradually moved upwards, the sediment structure below the liquefaction layer was strengthened [25]. The sediment particles were compacted and the pore water was squeezed out and caused seepage flow, along with which the dissolved Cu in sediment diffused into the overlying water; (2) The pressure difference between the wave crest and trough also caused the diffusion of Cu in the sediment into the overlying water along with the pore water [21,45].
In Stage III, the liquefied sediment layer was about 2–3 cm thick on the surface. During the initial period of wave action, both the SSCs and the dissolved Cu concentration increased (Figure 5b and Figure 6c). The sediment particles settled on the surface were resuspended as a result of the increased wave height. The strong disturbance in overlying water induced desorption of Cu that previously adsorbed on particles [34]. This led to an increase in the dissolved Cu in the overlying water. After 60 min of wave action, an opposite change tendency of the SSCs and the dissolved Cu concentration was observed, namely the SSCs in overlying water declined (Figure 5b), while the dissolved Cu concentration had an increasing tendency (Figure 6c). The possible reasons for the increase of dissolved Cu concentrations in the overlying water were as follows. First, the dissolved Cu diffused into the overlying water along with the upwards pore water seepages from the sediment under the wave loads [25], leading to a slow increase in the dissolved Cu concentration in water. Second, the sediment particles that adsorbed Cu were resuspended into the overlying water and exposed in water disturbance arise from wave movements, which could resulted in desorption of the adsorbed Cu on sediment particles [46], and in consequence increased the dissolved Cu concentration in the overlying water. Moreover, re-suspension of the sediment caused the sediments at reduced state to be exposed in an aerobic environment. The organically-bound Cu on the particles were released due to oxidization and degradation of organic matter, and thus increased the concentration of dissolved Cu in the overlying water. In addition, the re-adsorption of dissolved Cu by iron manganese oxide was weakened on account of the combination of dissolved Cu and dissolved organic matter, which also increased the concentration of dissolved Cu in water.

4.3. Cu Concentration Profile in the Sediment after Each Wave Load

At the end of Stage I, there was little change in the Cu concentrations in the sediment. As presented in Figure 7, slight increase of Cu content was observed in the sediment above the polluted layer, while a relatively larger increase was found below the polluted layer. Since there was a concentration gradient between the polluted slurry and the clean slurry, Cu in the polluted layer diffused into the surrounding layers through pore water [41]. Furthermore, the downward diffusion amount was larger under the effect of gravity.
After wave actions in Stage II, liquefaction occurred in the seafloor sediments. Within the liquefaction range, sediment particles and pore water mixed intensively, leading to a clear migration and diffusion of Cu in sediments. As presented in Figure 7, Cu in the polluted layer diffused into the surrounding sediment at the end of Stage II, and the upward diffusion amount of Cu in the polluted layer was larger than the downward diffusion amount.
At the end of Stage III, the position of high concentration of Cu in the sediment moved downward comparing to that at the end of Stage II. Since fine particles were separated from the soil skeleton during the sediment liquefaction, the particles below the liquefaction interface became coarser [40], which largen the spaces between sediment particles. This intensified downward permeation of Cu into deeper sediments.
The maximum liquefaction depth of the sediment was approximately 17 cm and increased concentration of Cu was also observed near this depth. This was attributed to the vertical diffusion of Cu in sediments on account of the intensive mix of sediment particles and pore water.

5. Conclusions

Sediment in the subaqueous Yellow River Delta, classified as sandy silt, is prone to liquefaction under wave actions. Experimental investigations of the release of dissolved metals from the interior of sediment due to wave-induced sediment liquefaction has shown that variation trends of SSCs and dissolved Cu concentration in the overlying water were different. Moreover, the mechanisms of migration and diffusion of dissolved Cu in static diffusion stage and liquefaction stage were analyzed.
In the static diffusion stage, the dissolved Cu concentration increased slightly due to the static diffusion and the consolidation and drainage of seafloor sediments. In the liquefaction stage, the arc shaped liquefaction interface moved downward during the initial period of wave loads and reached the maximum depth of about 17 cm after 30 min of 7 cm height wave actions. During the rest period of wave actions, the liquefaction interface gradually moved upward and then remained at a relatively stable depth. The dissolved Cu concentration declined at the initial period of liquefaction due to the adsorption by the increased quality of suspended particles, which are fine sandy silts with large specific surface area. On account of the intensively mix of sediment and overlying water during the liquefaction process, the dissolved Cu concentration increased to a peak value as the liquefaction interface reached its maximum depth. Sediment liquefaction greatly facilitated Cu release from interior of sediments to the overlying water. The concentrations of dissolved Cu in the overlying water during the liquefaction phase were much higher than that in the consolidation phase. Moreover, the dissolved Cu concentrations kept increasing as the wave height increased under the comprehensive function of many factors, including the diffusion of dissolved Cu with pore water seepage, desorption of the adsorbed Cu on sediment particles, and weakened re-adsorption of dissolved Cu due to its combination with dissolved organic matter.
The migration and diffusion of Cu in the sediment were also intensified during the liquefaction phase. In the initial process of sediment liquefaction, the upward diffusion quantity of Cu was significantly higher than the downward diffusion quantity. As the liquefaction interface gradually became stable, the downward diffusion quantity increased due to the change of skeleton of sediment below the liquefaction interface. Overall, the diffusion range of Cu in sediment was generally consistent with the liquefaction range, indicating that the sediment liquefaction expanded the range of heavy metal pollution in sediment.
Heavy metal release amount due to sediment resuspension or liquefaction was found to be significant and should be considered in the long-term management of contaminated sediments in the study area. Control measures, such as pollutant discharge management and site remediation, may be performed to reduce the release quantity of contaminants. The understanding of heavy metal release mechanisms from liquefied sediments and its impact on the coastal environment could be improved by further laboratory and filed studies.

Author Contributions

Conceptualization, F.L. and Y.J.; methodology, F.L.; formal analysis, H.Z., W.L., and H.W.; investigation, F.L., H.Z., and H.W.; data curation, F.L.; writing—original draft preparation, F.L. and W.L.; writing—review and editing, F.L.; visualization, F.L., H.Z., and W.L.; supervision, F.L.; project administration, F.L.; funding acquisition, F.L.

Funding

This research was supported by the National Natural Science Foundation of China (grant number 41807247, and grant number 41807229), and the Special Fund for Shandong Post-doctoral Innovation Project.

Acknowledgments

The authors appreciate the assistant of our group members in the experiments.

Conflicts of Interest

The authors declare no conflict of interest.

References

  1. Hu, C.; Dong, J.; Gao, L.; Yang, X.; Wang, Z.; Zhang, X. Macrobenthos functional trait responses to heavy metal pollution gradients in a temperate lagoon. Environ. Pollut. 2019, 253, 1107–1116. [Google Scholar] [CrossRef] [PubMed]
  2. Wu, W.; Wu, P.; Yang, F.; Sun, D.-L.; Zhang, D.-X.; Zhou, Y.-K. Assessment of heavy metal pollution and human health risks in urban soils around an electronics manufacturing facility. Sci. Total Environ. 2018, 630, 53–61. [Google Scholar] [CrossRef] [PubMed]
  3. Xia, P.; Meng, X.; Feng, A.; Yin, P.; Zhang, J.; Wang, X. Geochemical characteristics of heavy metals in coastal sediments from the northern Beibu Gulf (SW China): The background levels and recent contamination. Environ. Earth Sci. 2012, 66, 1337–1344. [Google Scholar] [CrossRef]
  4. Barbieri, M.; Sappa, G.; Nigro, A. Soil pollution: Anthropogenic versus geogenic contributions over large areas of the Lazio region. J. Geochem. Explor. 2018, 195, 78–86. [Google Scholar] [CrossRef]
  5. Barbieri, M.; Sappa, G.; Vitale, S.; Parisse, B.; Battistel, M. Soil control of trace metals concentrations in landfills: A case study of the largest landfill in Europe, Malagrotta, Rome. J. Geochem. Explor. 2014, 143, 146–154. [Google Scholar] [CrossRef]
  6. Xia, P.; Meng, X.; Feng, A.; Yin, P.; Wang, X.; Zhang, J. 210Pb chronology and trace metal geochemistry in the intertidal sediment of Qinjiang River estuary, China. J. Ocean Univ. China 2012, 11, 165–173. [Google Scholar] [CrossRef]
  7. Surricchio, G.; Pompilio, L.; Arizzi Novelli, A.; Scamosci, E.; Marinangeli, L.; Tonucci, L.; d’Alessandro, N.; Tangari, A.C. Evaluation of heavy metals background in the Adriatic Sea sediments of Abruzzo region, Italy. Sci. Total Environ. 2019, 684, 445–457. [Google Scholar] [CrossRef]
  8. Valdés, J.; Tapia, J.S. Spatial monitoring of metals and as in coastal sediments of northern Chile: An evaluation of background values for the analysis of local environmental conditions. Mar. Pollut. Bull. 2019, 145, 624–640. [Google Scholar] [CrossRef]
  9. Ruiz-Fernández, A.C.; Sanchez-Cabeza, J.A.; Pérez-Bernal, L.H.; Gracia, A. Spatial and temporal distribution of heavy metal concentrations and enrichment in the southern Gulf of Mexico. Sci. Total Environ. 2019, 651, 3174–3186. [Google Scholar] [CrossRef]
  10. Wang, J.; Ye, S.; Laws, E.A.; Yuan, H.; Ding, X.; Zhao, G. Surface sediment properties and heavy metal pollution assessment in the Shallow Sea Wetland of the Liaodong Bay, China. Mar. Pollut. Bull. 2017, 120, 347–354. [Google Scholar] [CrossRef]
  11. Zhuang, Q.; Li, G.; Liu, Z. Distribution, source and pollution level of heavy metals in river sediments from South China. CATENA 2018, 170, 386–396. [Google Scholar] [CrossRef]
  12. Ogunlaja, A.; Ogunlaja, O.O.; Okewole, D.M.; Morenikeji, O.A. Risk assessment and source identification of heavy metal contamination by multivariate and hazard index analyses of a pipeline vandalised area in Lagos State, Nigeria. Sci. Total Environ. 2019, 651, 2943–2952. [Google Scholar] [CrossRef] [PubMed]
  13. Lu, F. Eco-Environmental Impact of Shengli Chengdao Offshore Oil Exploration and Development. Master’s Thesis, Ocean University of China, Qingdao, China, 2010. [Google Scholar]
  14. Dou, Y.; Li, J.; Zhao, J.; Hu, B.; Yang, S. Distribution, enrichment and source of heavy metals in surface sediments of the eastern Beibu Bay, South China Sea. Mar. Pollut. Bull. 2013, 67, 137–145. [Google Scholar] [CrossRef] [PubMed]
  15. Unda-Calvo, J.; Ruiz-Romera, E.; Fdez-Ortiz de Vallejuelo, S.; Martínez-Santos, M.; Gredilla, A. Evaluating the role of particle size on urban environmental geochemistry of metals in surface sediments. Sci. Total Environ. 2019, 646, 121–133. [Google Scholar] [CrossRef] [PubMed]
  16. Whipple, A.C.; Luettich, R.A.; Reynolds-Fleming, J.V.; Neve, R.H. Spatial differences in wind-driven sediment resuspension in a shallow, coastal estuary. Estuar. Coast. Shelf Sci. 2018, 213, 49–60. [Google Scholar] [CrossRef]
  17. Jalil, A.; Li, Y.; Zhang, K.; Gao, X.; Wang, W.; Khan, H.O.S.; Pan, B.; Ali, S.; Acharya, K. Wind-induced hydrodynamic changes impact on sediment resuspension for large, shallow Lake Taihu, China. Int. J. Sediment Res. 2019, 34, 205–215. [Google Scholar] [CrossRef]
  18. Schoellhamer, D.H. Sediment Resuspension Mechanisms in Old Tampa Bay, Florida. Estuar. Coast. Shelf Sci. 1995, 40, 603–620. [Google Scholar] [CrossRef]
  19. Zheng, S.-S.; Wang, P.-F.; Wang, C.; Hou, J. Sediment resuspension under action of wind in Taihu Lake, China. Int. J. Sediment Res. 2015, 30, 48–62. [Google Scholar] [CrossRef]
  20. Bolaños, R.; Thorne, P.D.; Wolf, J. Comparison of measurements and models of bed stress, bedforms and suspended sediments under combined currents and waves. Coast. Eng. 2012, 62, 19–30. [Google Scholar] [CrossRef] [Green Version]
  21. Wolanski, E.; Spagnol, S. Dynamics of the turbidity maximum in King Sound, tropical Western Australia. Estuar. Coast. Shelf Sci. 2003, 56, 877–890. [Google Scholar] [CrossRef]
  22. Jia, Y.; Zhang, L.; Zheng, J.; Liu, X.; Jeng, D.-S.; Shan, H. Effects of wave-induced seabed liquefaction on sediment re-suspension in the Yellow River Delta. Ocean Eng. 2014, 89, 146–156. [Google Scholar] [CrossRef]
  23. Tzang, S.-Y.; Ou, S.-H.; Hsu, T.-W. Laboratory flume studies on monochromatic wave-fine sandy bed interactions Part 2. Sediment suspensions. Coast. Eng. 2009, 56, 230–243. [Google Scholar] [CrossRef]
  24. Zhang, S.T.; Jia, Y.G.; Wang, Z.H.; Wen, M.Z.; Lu, F.; Zhang, Y.Q.; Liu, X.L.; Shan, H.X. Wave flume experiments on the contribution of seabed fluidization to sediment resuspension. Acta Oceanol. Sin. 2018, 37, 80–87. [Google Scholar] [CrossRef]
  25. Liu, X.-L.; Jia, Y.-G.; Zheng, J.-W.; Hou, W.; Zhang, L.; Zhang, L.-P.; Shan, H.-X. Experimental evidence of wave-induced inhomogeneity in the strength of silty seabed sediments: Yellow River Delta, China. Ocean Eng. 2013, 59, 120–128. [Google Scholar] [CrossRef]
  26. Song, Y.; Sun, Y.; Du, X.; Cao, C.; Shuling, L. Monitoring of silt pore pressure responding precess to wave action. Mar. Geol. Quat. Geol. 2018, 38, 208–214. [Google Scholar]
  27. Wang, H.; Zhao, Y.; Wang, X.; Liang, D. Fluctuations in Cd release from surface-deposited sediment in a river-connected lake following dredging. J. Geochem. Explor. 2017, 172, 184–194. [Google Scholar] [CrossRef]
  28. Ciffroy, P.; Monnin, L.; Garnier, J.-M.; Ambrosi, J.-P.; Radakovitch, O. Modelling geochemical and kinetic processes involved in lead (Pb) remobilization during resuspension events of contaminated sediments. Sci. Total Environ. 2019, 679, 159–171. [Google Scholar] [CrossRef]
  29. Lu, J.; Jiang, J.; Li, A.; Ma, X. Impact of Typhoon Chan-hom on the marine environment and sediment dynamics on the inner shelf of the East China Sea: In-situ seafloor observations. Mar. Geol. 2018, 406, 72–83. [Google Scholar] [CrossRef]
  30. Superville, P.-J.; Prygiel, E.; Magnier, A.; Lesven, L.; Gao, Y.; Baeyens, W.; Ouddane, B.; Dumoulin, D.; Billon, G. Daily variations of Zn and Pb concentrations in the Deûle River in relation to the resuspension of heavily polluted sediments. Sci. Total Environ. 2014, 470–471, 600–607. [Google Scholar] [CrossRef]
  31. Cantwell, M.G.; Burgess, R.M.; King, J.W. Resuspension of contaminated field and formulated reference sediments Part I: Evaluation of metal release under controlled laboratory conditions. Chemosphere 2008, 73, 1824–1831. [Google Scholar] [CrossRef]
  32. Zheng, S.; Wang, P.; Wang, C.; Hou, J.; Qian, J. Distribution of metals in water and suspended particulate matter during the resuspension processes in Taihu Lake sediment, China. Quat. Int. 2013, 286, 94–102. [Google Scholar] [CrossRef]
  33. Huang, J.; Ge, X.; Wang, D. Distribution of heavy metals in the water column, suspended particulate matters and the sediment under hydrodynamic conditions using an annular flume. J. Environ. Sci. 2012, 24, 2051–2059. [Google Scholar] [CrossRef]
  34. Sun, Z.; Xu, G.; Hao, T.; Huang, Z.; Fang, H.; Wang, G. Release of heavy metals from sediment bed under wave-induced liquefaction. Mar. Pollut. Bull. 2015, 97, 209–216. [Google Scholar] [CrossRef] [PubMed]
  35. State Oceanic Administration. Pretreatment Guideline of Heavy Metals Analysis in the Marine Sediments and Organisms-Microwave Assisted Acid Digestion (HY/T 132-2010); China Standards Press: Beijing, China, 2010.
  36. Kong, Y.-Z.; Zhu, C.-F. Experimental study on vertical sediment mixing coefficient under waves. J. East China Norm. Univ. (Nat. Sci.) 2008, 6, 9–13. (In Chinese) [Google Scholar]
  37. Liu, X.-L.; Cui, H.-N.; Jeng, D.-S.; Zhao, H.-Y. A coupled mathematical model for accumulation of wave-induced pore water pressure and its application. Coast. Eng. 2019, 154, 103577. [Google Scholar] [CrossRef]
  38. Sumer, B.M.; Kirca, V.S.O.; Fredsøe, J. Experimental Validation of a Mathematical Model for Seabed Liquefaction under Waves. Int. J. Offshore Polar Eng. 2011, 22, 133–141. [Google Scholar] [CrossRef]
  39. Zhang, S.T.; Jia, Y.G.; Zhang, Y.Q.; Liu, X.L.; Shan, H.X. In situ observations of wave pumping of sediments in the Yellow River Delta with a newly developed benthic chamber. Mar. Geophys. Res. 2018, 39, 463–474. [Google Scholar] [CrossRef]
  40. Tzang, S.-Y.; Ou, S.-H. Laboratory flume studies on monochromatic wave-fine sandy bed interactions: Part 1. Soil fluidization. Coast. Eng. 2006, 53, 965–982. [Google Scholar] [CrossRef]
  41. Dang, D.H.; Lenoble, V.; Durrieu, G.; Omanović, D.; Mullot, J.U.; Mounier, S.; Garnier, C. Seasonal variations of coastal sedimentary trace metals cycling: Insight on the effect of manganese and iron (oxy)hydroxides, sulphide and organic matter. Mar. Pollut. Bull. 2015, 92, 113–124. [Google Scholar] [CrossRef]
  42. Bi, C.-J.; Chen, Z.-L.; Shen, J.; Sun, W.-W. Transfer and release of Hg from the Yangtze Estuarine Sediment during Sediment Resuspension Event. Environ. Sci. 2009, 30, 3256–3261. (In Chinese) [Google Scholar]
  43. Hao, T.; Guo-Hui, X.U.; Wang, G.; Zhang, C.Y. Laboratory Flume Study on Heavy Metal Release from Liquefied Bed Sediments. Period. Ocean Univ. China 2013, 8, 92–98. [Google Scholar]
  44. Villaescusa-Celaya, J.A.; Gutiérrez-Galindo, E.A.; Flores-Muñoz, G. Heavy metals in the fine fraction of coastal sediments from Baja California (Mexico) and California (USA). Environ. Pollut. 2000, 108, 453–462. [Google Scholar] [CrossRef]
  45. Xu, G.H.; Sun, Y.F.; Yu, Y.Q.; Lin, L.; Hu, G.H.; Zhao, Q.P.; Guo, X.J. Discussion on storm-induced liquefaction of the superficial stratum in the Yellow River subaqueous delta. Mar. Sci. Bull. 2012, 1, 80–89. [Google Scholar]
  46. Li, M.; Bi, C.; Zhang, J.; Lv, J.; Chen, Z. Laboratory simulation study on the influence of resuspension on the release of Mercury from Yangtze Estuarine Tidal Flat. Environ. Sci. 2011, 32, 3318–3326. [Google Scholar] [CrossRef]
Figure 1. Location of the study area.
Jmse 07 00449 g001
Figure 2. Sketch of the wave flume used in the present study.
Jmse 07 00449 g002
Figure 3. Layout of the sediment tank and sampling points.
Jmse 07 00449 g003
Figure 4. Curves presenting the variation of liquefaction interfaces in Stage II (a) and Stage III (b).
Jmse 07 00449 g004
Figure 5. Suspended sediments concentration (SSC) variation in the overlying water under wave actions in: (a) Stage II and (b) Stage III.
Jmse 07 00449 g005
Figure 6. Variation of Cu concentration in water during different stages ((a): Stage I; (b): Stage II; (c): Stage III).
Jmse 07 00449 g006
Figure 7. Vertical profiles of Cu concentration in the columnar sediment samples at the end of each stage.
Jmse 07 00449 g007
Table 1. Wave parameters and sampling intervals in the wave flume experiments.
StagesWave Height/cmWave Period/sDurationSampling Intervals
Static diffusion
(Stage I)
--40 h8 h
7 cm wave height
(Stage II)
7.02.3180 minevery 10 min for the first 60 min and every 20 min for the last 120 min
13.5 cm wave height
(Stage III)
13.51.2180 min

