1. Introduction
The maritime industry is under increasing pressure to enhance operational efficiency and reduce its environmental footprint [
1]. Global regulations from the International Maritime Organization (IMO), such as the Energy Efficiency Existing Ship Index (EEXI) and the Carbon Intensity Indicator (CII), mandate significant improvements in the energy consumption of the global fleet [
2]. While much of the focus has been on commercial shipping, the luxury yacht sector faces similar challenges, augmented by unique owner-driven demands for performance, comfort, and operational excellence. For motor yachts, fuel consumption is a major operational cost, and hydrodynamic efficiency is directly linked to the vessel’s speed, range, and environmental impact [
3].
Furthermore, onboard comfort, defined by low levels of noise and vibration, is a paramount concern in yacht design. These vibrations often originate from hydrodynamic phenomena at the stern [
4], such as unsteady propeller forces and cavitation [
5]. As noted in the analysis for the subject vessel of this study, a 45 m motor yacht, existing propellers can suffer from issues like cavitation erosion and geometric imbalances, leading to degraded performance and increased vibrations. This highlights a clear need for advanced hydrodynamic analysis and targeted solutions that can simultaneously improve efficiency and enhance onboard comfort, providing a direct motivation for the retrofitting of performance-enhancing technologies.
To meet efficiency mandates, a wide array of Energy Saving Devices (ESDs) has been developed, offering a straightforward path to improve performance [
6,
7]. These devices are broadly classified as pre-swirl or post-swirl solutions [
8]. The concept of using a pre-propeller duct to improve propulsion traces back to the work of Schneekluth [
9], who pioneered this energy saving device and saw thousands fitted to vessels. For pre-swirl devices, designs have been adapted for specific hull forms, such as the compact ‘ring stator’ developed for slender sterns [
10]. Studies like that of Ok Jil-Pyo [
11] on similar concepts have demonstrated the complexity of these interactions, noting that while the duct successfully decreases the inflow speed to the propeller—a fundamental flow physics observation consistent with this study—it may, depending on the design, lead to an increase in required propulsion power.
Post-swirl devices (e.g., Propeller Boss Cap Fins, Grim Vane Wheel) are positioned downstream to recover rotational energy from the propeller’s slipstream and convert it into additional thrust. Conversely, pre-swirl devices like stator fins and ducts are installed upstream. These ducts, also known as Wake Equalizing Ducts (WEDs), are designed to accelerate and homogenize the propeller inflow, improving propulsive efficiency [
12] and potentially reducing bare hull resistance [
6]. While effective, pre-swirl devices often require significant hull integration, making the development of easily retrofittable solutions a key practical interest.
The design and assessment of both hull forms and ESDs have been revolutionized by Computational Fluid Dynamics (CFD). By numerically solving the Reynolds-Averaged Navier–Stokes (RANS) equations, often with a Volume of Fluid (VOF) method to capture the free surface, CFD allows for detailed investigation of complex flow physics [
13]. It serves as a virtual towing tank [
14] to evaluate designs and analyze the intricate interactions between the hull, propeller, and ESDs. This analysis is crucial as even standard appendages can influence performance, with studies showing that the rudder’s interaction with the propeller can contribute to a slight improvement in overall propulsive efficiency [
15].
Predicting the performance of motor yachts is challenging due to their semi-planing or planing hydrodynamics and the non-linearities of transom stern flows. These factors create uncertainties when extrapolating from model-scale tests. Validating CFD models directly against full-scale sea trial data is therefore the most reliable approach [
16]. Furthermore, an ESD’s performance can change dramatically between towed and self-propelled states. Therefore, an accurate assessment of real-world power savings requires a holistic analysis that includes the hull–propeller interaction. This study addresses this challenge directly by employing full-scale self-propulsion CFD simulations, validated against sea trial data, to provide a high-fidelity performance prediction.
The benefits of Energy Saving Devices (ESDs) are well-documented for new ship designs, where they can be integrated into the hull and propulsion system for optimal performance. However, for the vast number of existing vessels, including motor yachts, a different challenge arises: how to improve efficiency and reduce fuel consumption quickly, simply, and cost-effectively. This is a critical need for the maritime industry, which faces increasing pressure to meet global efficiency regulations. This study is motivated by the direct interest from the industry to explore the possibilities and benefits of retrofitting ESDs onto existing vessels. Therefore, our analysis focuses on a bespoke, retrofittable solution, and it employs a practical CFD approach that balances computational cost with predictive accuracy, making it suitable for rapid design and assessment.
The unique contribution and engineering science value of this paper is stated in
Table 1, which provides a direct comparison with related Energy Saving Device (ESD) research. Existing work typically falls short by focusing on model-scale tank tests or numerical simulations of massive commercial vessels, introducing inherent scaling uncertainties. This study tackles this challenge head-on. This research is distinct because a bespoke ESD design is developed along with a workflow that applies it to a complex motor yacht hull form, utilizing a full-scale CFD model, which is validated directly against dedicated sea trial data. This high-fidelity approach moves the entire analysis past speculation, providing a definitive, confident answer for a solution that is both practical and immediately retrofittable.
This study presents a hydrodynamic assessment of a 45 m motor yacht. The primary objectives are as follows:
- 1.
Develop a full-scale self-propulsion CFD model capable of simulating the vessel’s propulsive performance and validate its predictive capabilities directly against data from a dedicated sea trial campaign.
- 2.
Utilize the validated model to analyze the complex hull–propeller interaction phenomena, calculating key propulsive coefficients such as the wake fraction (w), thrust deduction (t), and hull efficiency () across the vessel’s speed range.
- 3.
Use the validated model to design a bespoke pre-propeller duct system and numerically quantify its effectiveness through a direct comparison of self-propelled performance, providing a direct calculation of power savings.
2. Subject Vessel and Sea Trial Campaign
The foundation of this study is a validation process that directly compares numerical predictions with full-scale performance data. This chapter describes the subject vessel and outlines the methodology and conditions of the sea trial campaign from which the validation data were sourced. The use of an operational yacht for this analysis provides a valuable opportunity for direct full-scale validation, overcoming the scaling uncertainties often encountered in studies that rely solely on benchmark models and towing tank experiments.
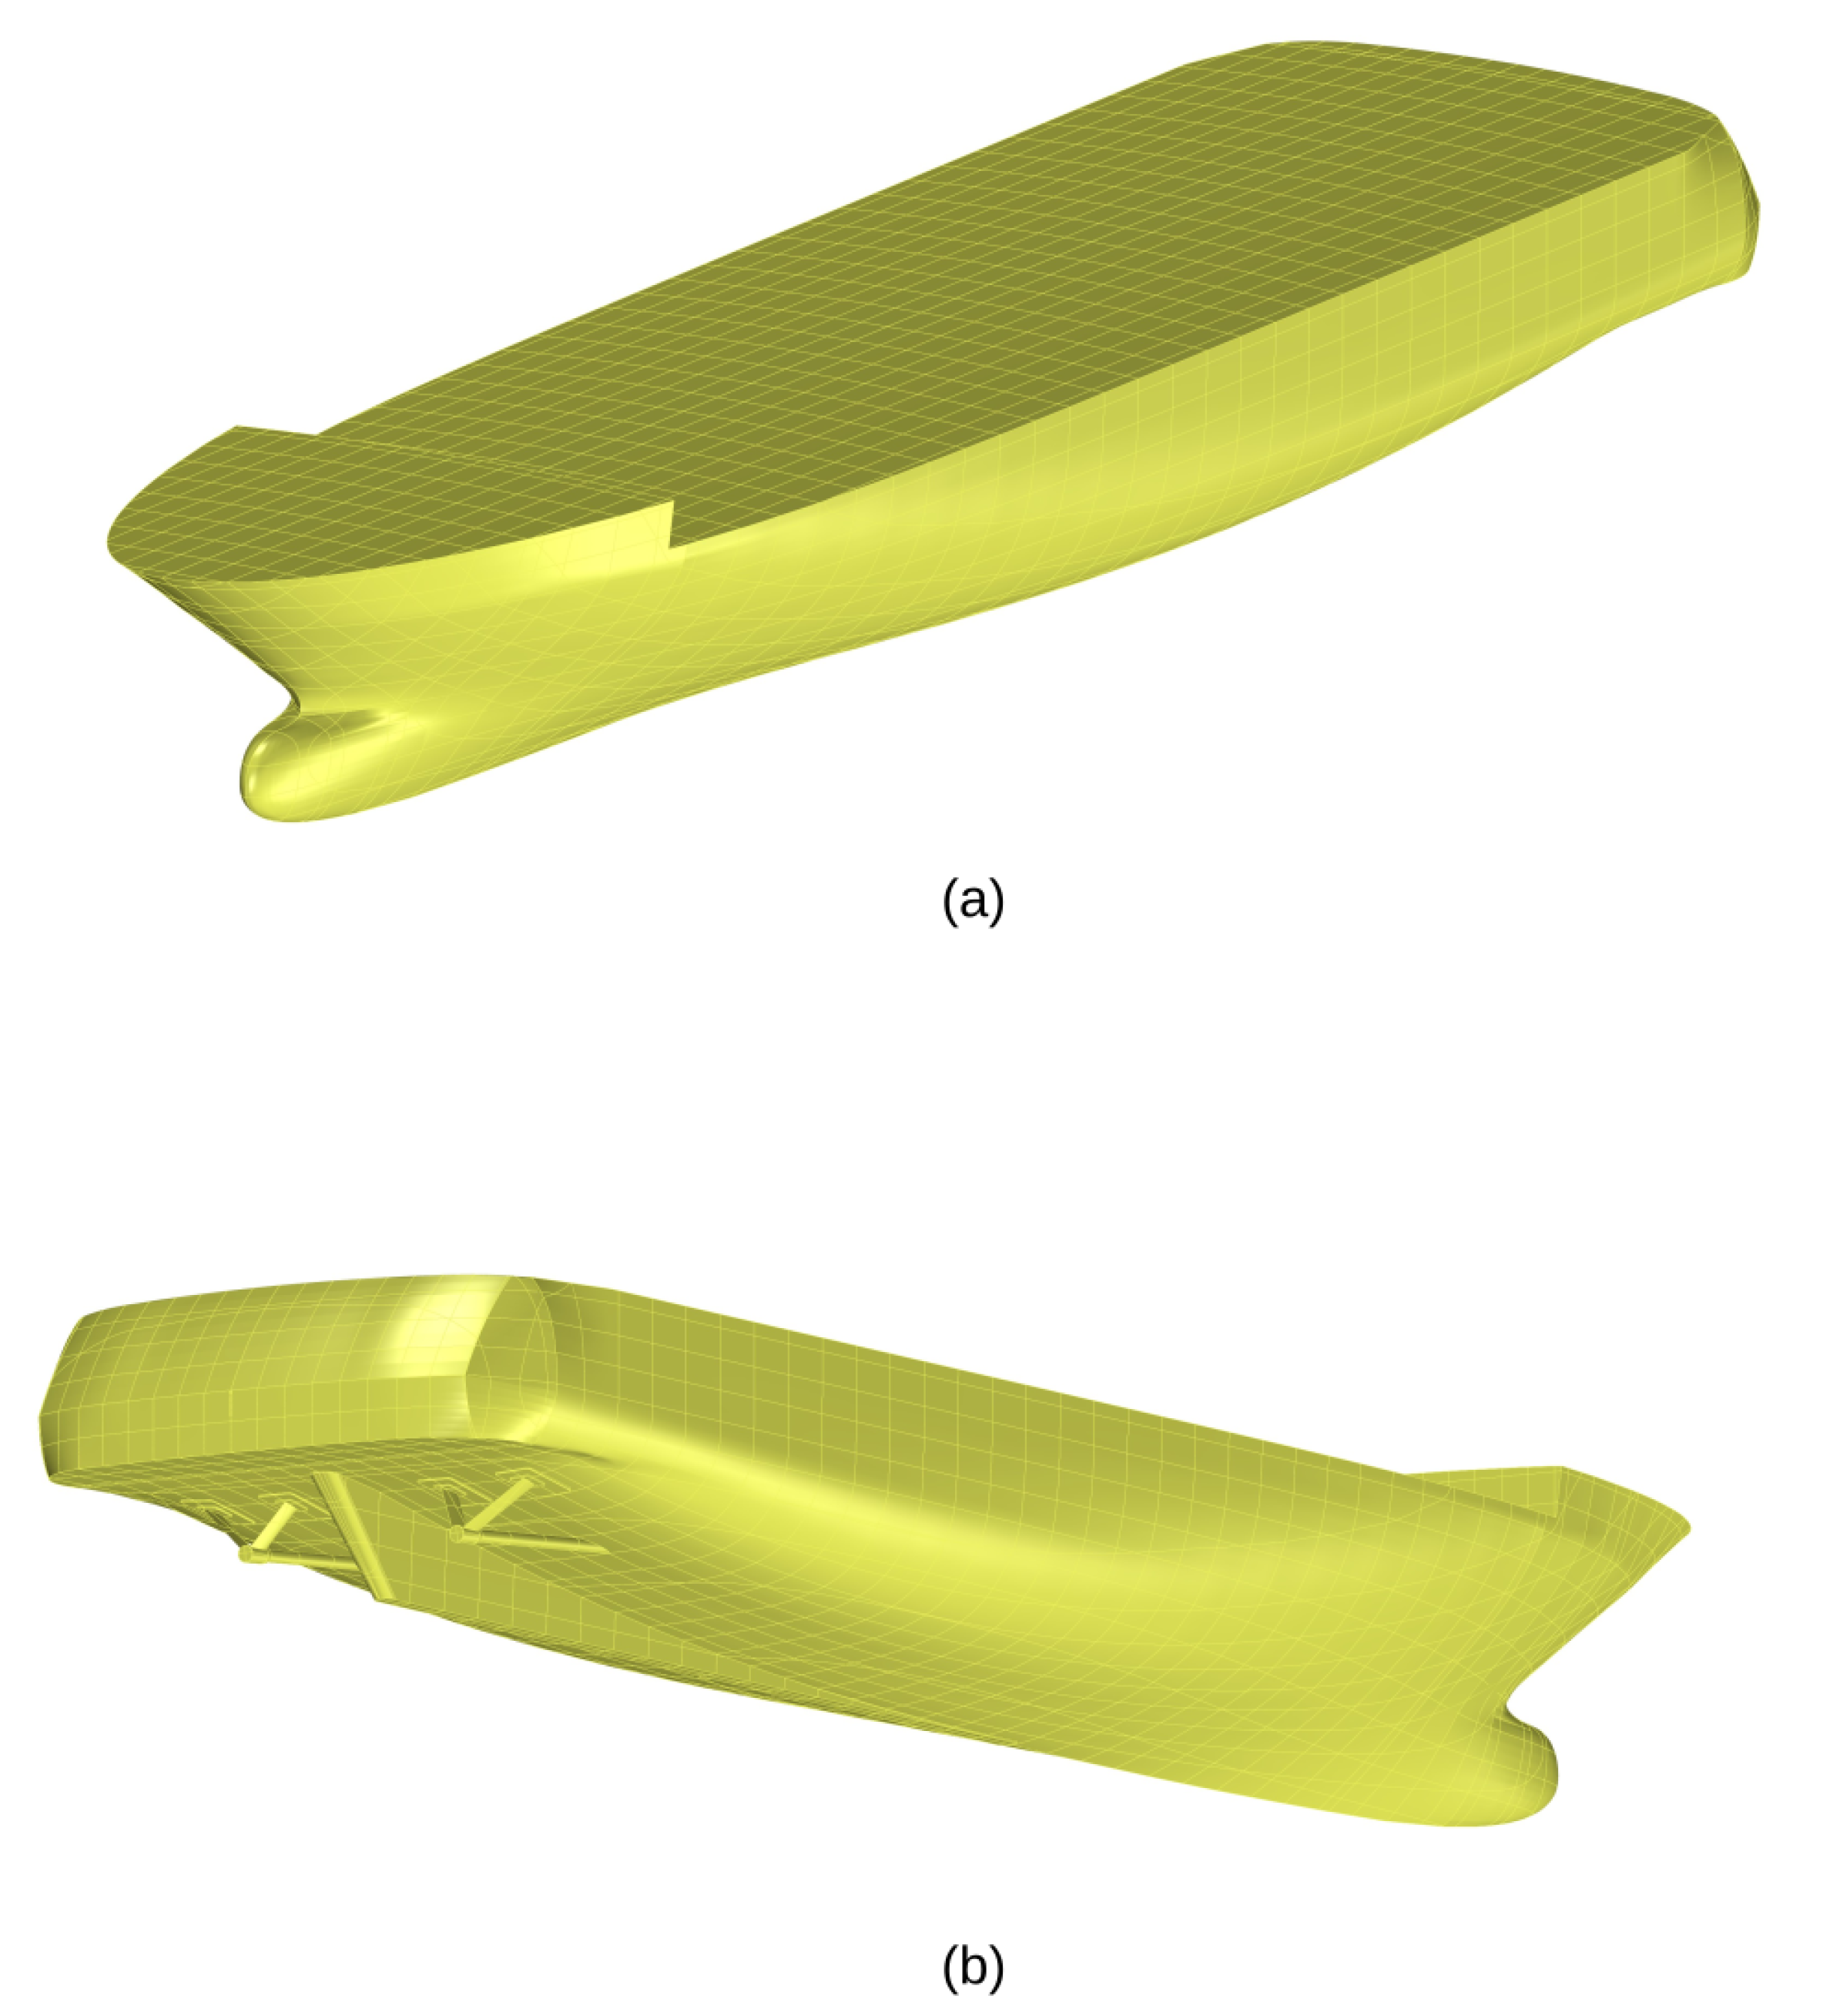
The vessel of interest is a 45 m semi-displacement motor yacht (
Figure 1), powered by a twin-screw propulsion system, featuring two 969.5 kW @ 1800 RPM marine diesel engines, each driving a five-bladed, fixed-pitch propeller. The principal particulars of the vessel are summarized in
Table 2.
A dedicated sea trial was conducted to record the vessel’s performance data. The primary objective of the trial was to obtain stabilized measurements of vessel speed, engine speed (RPM), and power output across a range of operating points. At each set point, the vessel was allowed sufficient time to reach a constant speed, at which point the relevant data were recorded. The ship model is shown in
Figure 2.
While specific quantitative data for sea state and wind conditions were not logged, the trial was conducted in suitable conditions for performance measurements, adhering to the principles outlined in ITTC Recommended Procedures and Guidelines for Sea Trials (International Towing Tank Conference [
21]). Environmental factors, typical for full-scale sea trials, may contribute to ±15% power measurement uncertainty and potentially more in non-ideal calm conditions. The key trial conditions are summarized in
Table 3. It is acknowledged that inherent uncertainties exist in full-scale trial data collection, as discussed in guidelines such as ITTC Recommended Procedures and Guidelines for Sea Trials [
21] on full-scale trial limitations.
Performance data were acquired directly from the vessel’s onboard systems. The key parameters used for the subsequent CFD validation were sourced as follows:
Vessel Speed: Recorded in knots from the bridge navigation system (DGPS).
Engine Speed (RPM): Recorded directly from the engine’s Electronic Control Module (ECM).
Delivered Power: The brake power (bkW) delivered by the engines was estimated based on real-time ECM readouts of engine load factor and fuel burn rate, referenced against the manufacturer’s engine performance data.
The data were recorded for both the port and starboard engines simultaneously. For this study, the values from both propulsion lines were averaged at each speed setting to create a single, representative delivered power curve. This processed sea trial data provides the crucial real-world benchmark against which the results of the bare hull and self-propulsion CFD simulations are validated in
Section 4, a fundamental step in ensuring the reliability of a numerical method.
3. Numerical Methodology
The hydrodynamic performance of the yacht was simulated by solving the governing equations of fluid dynamics using the commercial CFD software Simcenter STAR-CCM+ 2502 [
22]. The numerical approach was tailored to address the specific challenges of full-scale marine simulations in a self-propelled condition, where the complex interactions between the hull, propellers, and the free surface are fully captured.
The fluid flow is governed by the Reynolds-Averaged Navier–Stokes (RANS) equations, which express the conservation of mass and momentum for a viscous, incompressible fluid. In tensor form, these are given as
Momentum:
where
represents the time-averaged velocity components,
p is the pressure,
is the fluid density,
is the kinematic viscosity,
represents body forces, and
is the Reynolds stress tensor, which requires a turbulence model.
Turbulence: The Reynolds stresses are modeled using Menter’s Shear Stress Transport (SST) k-
turbulence model [
23]. This two-equation model is the industry standard for external hydrodynamic simulations due to its accuracy in predicting boundary layer flows under adverse pressure gradients, which are prevalent at the stern of the yacht. The model blends the robust formulation of the k-
model in the near-wall region with the free-stream independence of the k-
model in the far-field region.
Free Surface: The sharp interface between water and air is captured using the Volume of Fluid (VoF) method [
24]. This approach solves an additional transport equation for the volume fraction of water in each cell, allowing the free surface to deform naturally in response to the vessel’s movement and wave generation. To prevent non-physical wave reflections from the domain boundaries, a variable wave damping method is employed.
To accurately predict propulsive power, the propellers were modelled using a body force method. This technique simulates the propeller’s effect without resolving its exact geometry in the mesh, offering a balance between accuracy and computational cost. This balance is crucial for a practical retrofit workflow, where a rapid and repeatable assessment of design changes is more valuable than a computationally expensive, highly detailed propeller-resolving simulation.
The virtual disk approximation neglects blade-resolved vortex shedding and duct–blade interaction. The literature suggests that this introduces 1–3% uncertainty in absolute power predictions [
25,
26], but parametric trends (e.g., angle-of-attack optimization) remain reliable because interaction effects scale similarly across configurations.
In this approach, the propeller is represented by a virtual disk at the correct location. The forces (thrust and torque) generated by the propeller are calculated based on its open water performance curves (, ) and distributed as body forces onto the fluid cells within the virtual disk’s volume.
The simulation seeks the self-propulsion point for a given ship speed. It does this by iteratively adjusting the propeller’s rotational speed (RPM) until the thrust produced by the virtual disk precisely balances the total resistance of the vessel. This method correctly captures the key hull–propeller interaction effects, including the propeller’s influence on the flow around the stern (wake induction) and the resulting impact on hull resistance (thrust deduction).
Simulating at full scale requires specific considerations to ensure accuracy:
Wall Treatment: The high Reynolds number of the flow necessitates the use of wall functions to model the near-wall velocity profile. The mesh was generated to achieve a target wall value in the range of 30–300, consistent with the requirements of the SST k- model’s wall treatment.
Hull Roughness: To account for the condition of the real vessel’s hull surface (paint, minor fouling, etc.), a hull roughness value of 150 μm, a standard value for in-service vessels, was incorporated into the wall boundary condition. This ensures a more realistic prediction of frictional resistance compared to a perfectly smooth surface.
Dynamic Motion: The yacht was allowed to move freely in heave (vertical motion) and pitch (rotation about the transverse axis). The workflow used a Dynamic Fluid Body Interaction (DFBI) model to calculate these motions. An equilibrium motion method was employed to quickly achieve a quasi-steady-state equilibrium position, allowing the simulation to find the yacht’s natural running attitude at each speed.
4. CFD Model Setup and Validation
A robust and accurate CFD model is essential for reliable performance prediction. This chapter details the setup of the numerical model and presents the comprehensive validation of the self-propulsion simulations against the full-scale sea trial data for the M/Y Incal. Achieving a strong correlation is a fundamental step in ensuring the reliability of the numerical method for subsequent design analysis.
The computational domain represents a virtual towing tank configured following Hull Performance Workflow (HPW) automated procedures [
22] and ITTC guidelines for ship CFD applications [
16]. Domain sizing is velocity-dependent, calculated based on the Froude number and wake wave characteristics to minimize boundary interference while preventing wave reflection. For the initial baseline resistance calculations, we employed a symmetry plane at
, modeling only a half-hull. This simple step reduced the computational cost by roughly 50%. The ducted configurations, however, demanded full-hull modeling. This necessity arose directly from the asymmetric flow patterns induced by the propellers (left-handed on port, right-handed on starboard), which eliminated the possibility of using a symmetry assumption.
The computational domain extents adapt automatically to ship speed through Froude number-dependent formulations, shown in
Table 4. This velocity-dependent approach ensures adequate capture of wake wave patterns at higher speeds while maintaining computational efficiency at lower speeds where wavelengths are shorter.
In the previous table, L
pp = 37.30 m (length between perpendiculars,
Table 2); L
WL = waterline length (geometry-dependent); V
s = ship speed (variable: 7.7–12.8 knots in validation range); g = 9.81 m/s
2 (gravitational acceleration); and F
n,max = 0.4 (maximum Froude number in HPW).
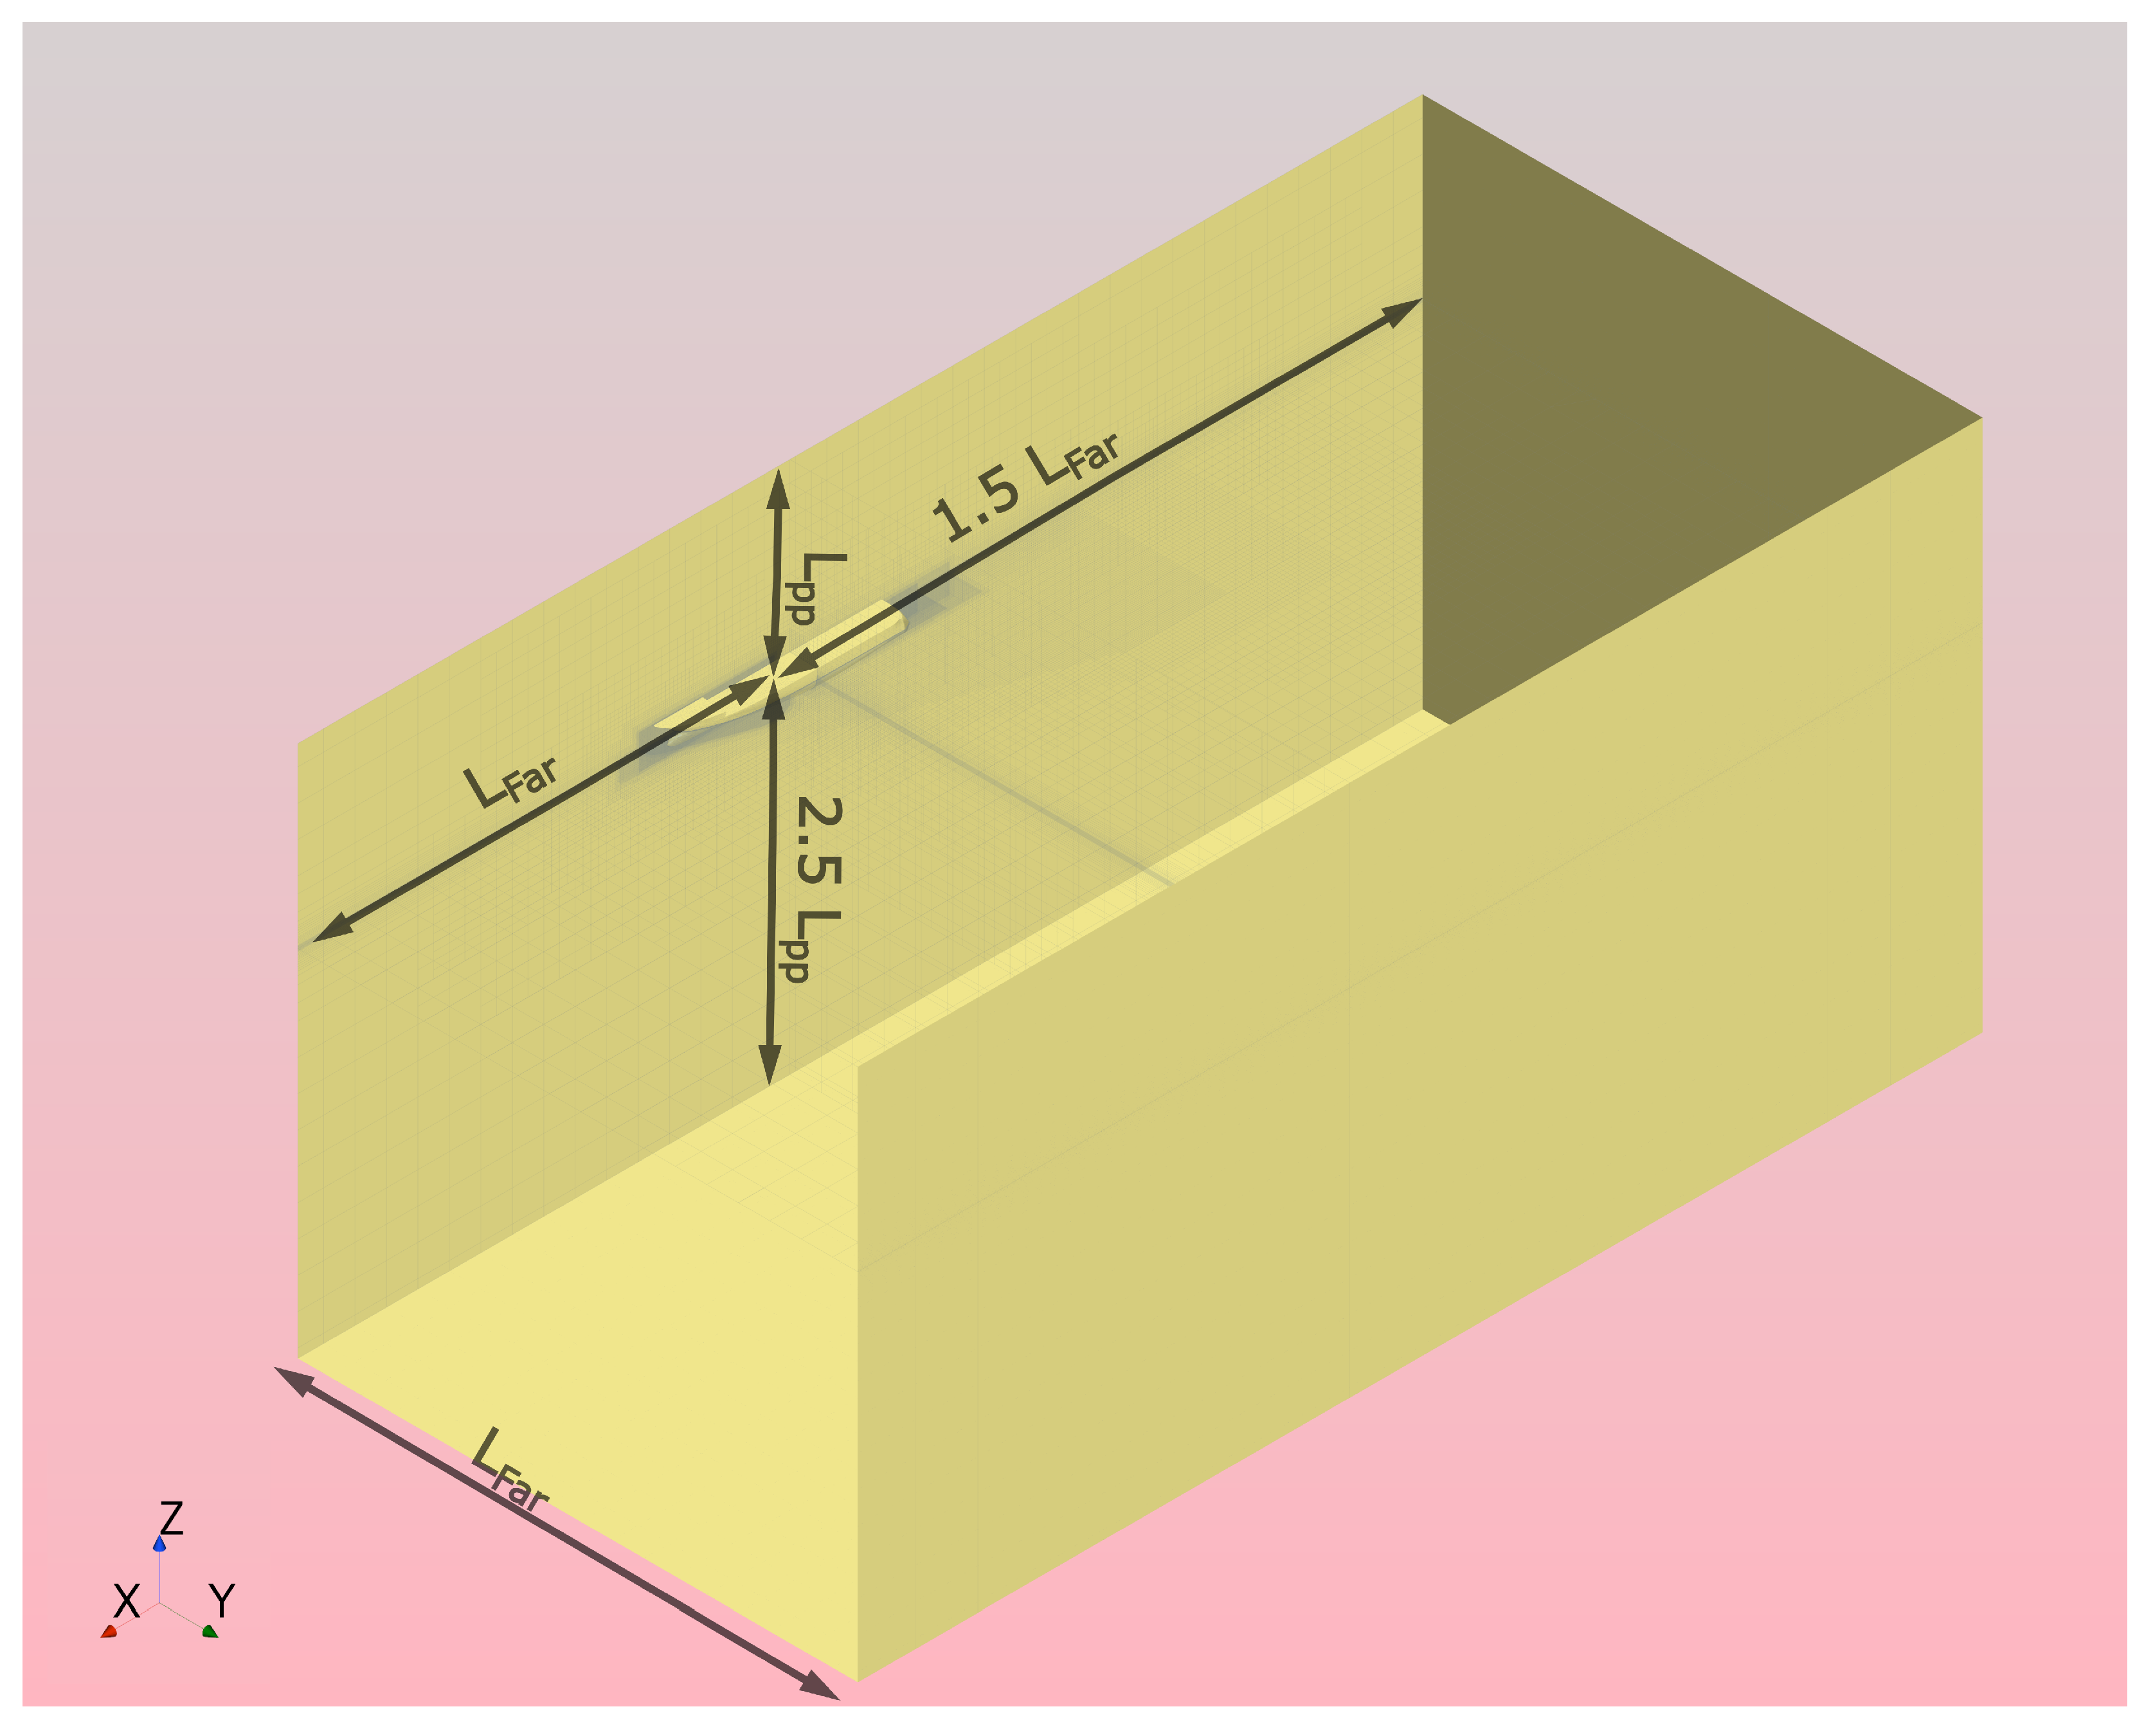
At the 12.3-knot cruise speed (Fn = 0.33), the calculated domain extents are inlet at x = −56 m (LFar forward of FP); outlet at x = +112 m (3.0 Lpp aft of AP); and lateral boundaries at y = ±56 m (1.5 Lpp from centerline). The resulting cross-sectional blockage ratio is approximately 0.26%, well below the 1% threshold for negligible blockage effects.
Computational domain configuration is shown in
Figure 3. Domain sizing follows velocity-dependent HPW methodology with the inlet at 1.5 L
pp forward, outlet at 3.0 L
pp aft, and lateral boundaries at ±1.5 L
pp from centerline. The far-field distance L
Far is calculated as a function of the Froude number and wake wavelength, ensuring adequate wave propagation distance while maintaining computational efficiency. Variable wave damping zones extend from buffer length LB to each boundary (except the top), preventing non-physical wave reflection. For baseline resistance, the symmetry plane at y = 0 (half-hull model shown). For ducted configurations, the full domain
was employed.
Table 5 provides comprehensive boundary condition specifications for all domain surfaces. The boundary treatment follows established marine CFD best practices, balancing computational efficiency with physical accuracy.
The computational domain size is in length (from to ), in width, and in height. The domain boundaries are defined as follows:
Inlet and Top Boundaries: A Velocity Inlet condition is applied at and (Top). The velocity is set to the ship speed, , aligned with the +x axis.
- –
For the Inlet, turbulence is specified as and . The pressure is set to Hydrostatic, . The VOF fraction is 1 for water and 0 for air .
- –
The Top Boundary acts as the atmosphere, utilizing a moving reference frame for velocity, , and an air VOF fraction of 1.
Outlet Boundary: A Pressure Outlet condition is applied at . The pressure is set to Hydrostatic. Velocity and VOF are treated with a zero-gradient condition, . A backflow velocity of is specified if recirculation occurs.
Sides and Bottom Boundaries: The Side () and Bottom () boundaries are defined as Slip Walls. This implies a free-slip condition () for tangential velocity and a zero normal velocity (). Pressure is treated with a zero-gradient condition normal to the boundary.
Symmetry Plane: The plane uses a Symmetry Plane condition, requiring zero normal velocity () and zero gradients for all scalars (). This is valid for straight-line motion only; a full hull is used for duct cases.
Wave Damping: A variable-length damping zone
(as defined in (
3)) is applied to the Outlet, Sides, and Bottom Boundaries to prevent wave reflection. No damping is applied at the Inlet or Top.
Hull Surface: The physical hull is a No-Slip Wall ( in the body-fixed frame). A uniform roughness (in-service condition) is applied.
The wall treatment uses all wall functions, targeting a range of 30–300 (SST requirement). The near-wall mesh consists of 10 prism layers with a growth ratio of 1.3, resulting in a first cell height mm.
The hull motion is governed by Dynamic Fluid Body Interaction (DFBI), allowing motion to be solved using the equilibrium motion method.
Virtual Disk: The propeller is modeled as an Actuator Disk (Body Force Propeller) located at . Key parameters are D = 1.246 m, Wageningen B-series performance, and self-propulsion (iterative RPM) thrust.
The variable wave damping methodology prevents non-physical wave reflection at domain boundaries without requiring manual tuning. The damping length varies with the Froude number and wake wavelength according to the following:
where the convective time scale
represents the time for flow to traverse the hull length. During the initial startup phase (t < 10 ts), the damping length smoothly transitions from
(no damping) to its steady-state value
using a cosine-squared ramp function. This gradual introduction prevents numerical shock from abrupt damping activation. Physical mechanism: A resistance force is applied to vertical fluid velocity components within the damping zone, progressively increasing from zero (at distance
from hull) to maximum (at boundary). The exponential damping function
ensures smooth wave energy absorption. The damping force is applied as a source term in the momentum equation for the z-velocity component:
where
is the fluid density and
is the vertical velocity component;
is the damping coefficient [s
−1] ramped spatially with
and temporally with wave growth time. Typical
1–5 s
−1 based on calibration to suppress wave reflection at the outlet.
Application zones:
Outlet Boundary: Full variable damping (primary wave dissipation zone)
Side Boundaries: Variable damping on vertical velocity component
Bottom Boundary: Variable damping (minimal effect due to depth)
Top Boundary: No damping (atmospheric pressure boundary)
Inlet Boundary: No damping (undisturbed inflow requirement)
At the 12.3-knot cruise speed (Fn = 0.33), the calculated damping parameters are wake wavelength m, buffer length m, damping length m, and far-field distance m. The variable damping length automatically adjusts across the tested speed range (Fn = 0.21–0.35), ensuring consistent numerical stability.
Table 6 summarizes the temporal discretization approach employed by the Hull Performance Workflow. The time-step size is automatically calculated to balance temporal accuracy with computational efficiency.
The time-step of ensures approximately 200 time-steps per hull passage, providing adequate temporal resolution for wave development and DFBI motion response. The implicit unsteady solver maintains numerical stability even at Courant numbers approaching unity, though typical values remain below in the refined regions.
Physical runtime is determined automatically through convergence monitoring. For each speed, the Hull Performance Workflow monitors the sliding-window average of total resistance over the last 500 time-steps. When the resistance oscillates by less than 0.5%, the simulation is considered converged and stops. Maximum runtime limits prevent excessive computation if convergence is not achieved: 7500 time-steps for the first speed (to handle startup transients) and 3500 time-steps for subsequent speeds (where the previous solution provides a good initial condition).
Justification for domain and temporal specifications: The computational setup employs industry-standard best practices automated within the Hull Performance Workflow, validated across numerous commercial and research applications. The velocity-dependent domain sizing adapts to the Froude number and wake characteristics, the variable wave damping prevents non-physical reflections without manual tuning, the boundary layer resolution (y+ = 30–300) suits wall-function treatment with the SST model, and the time-step size maintains temporal accuracy while achieving computational efficiency. This configuration provides the foundation for reliable self-propulsion predictions.
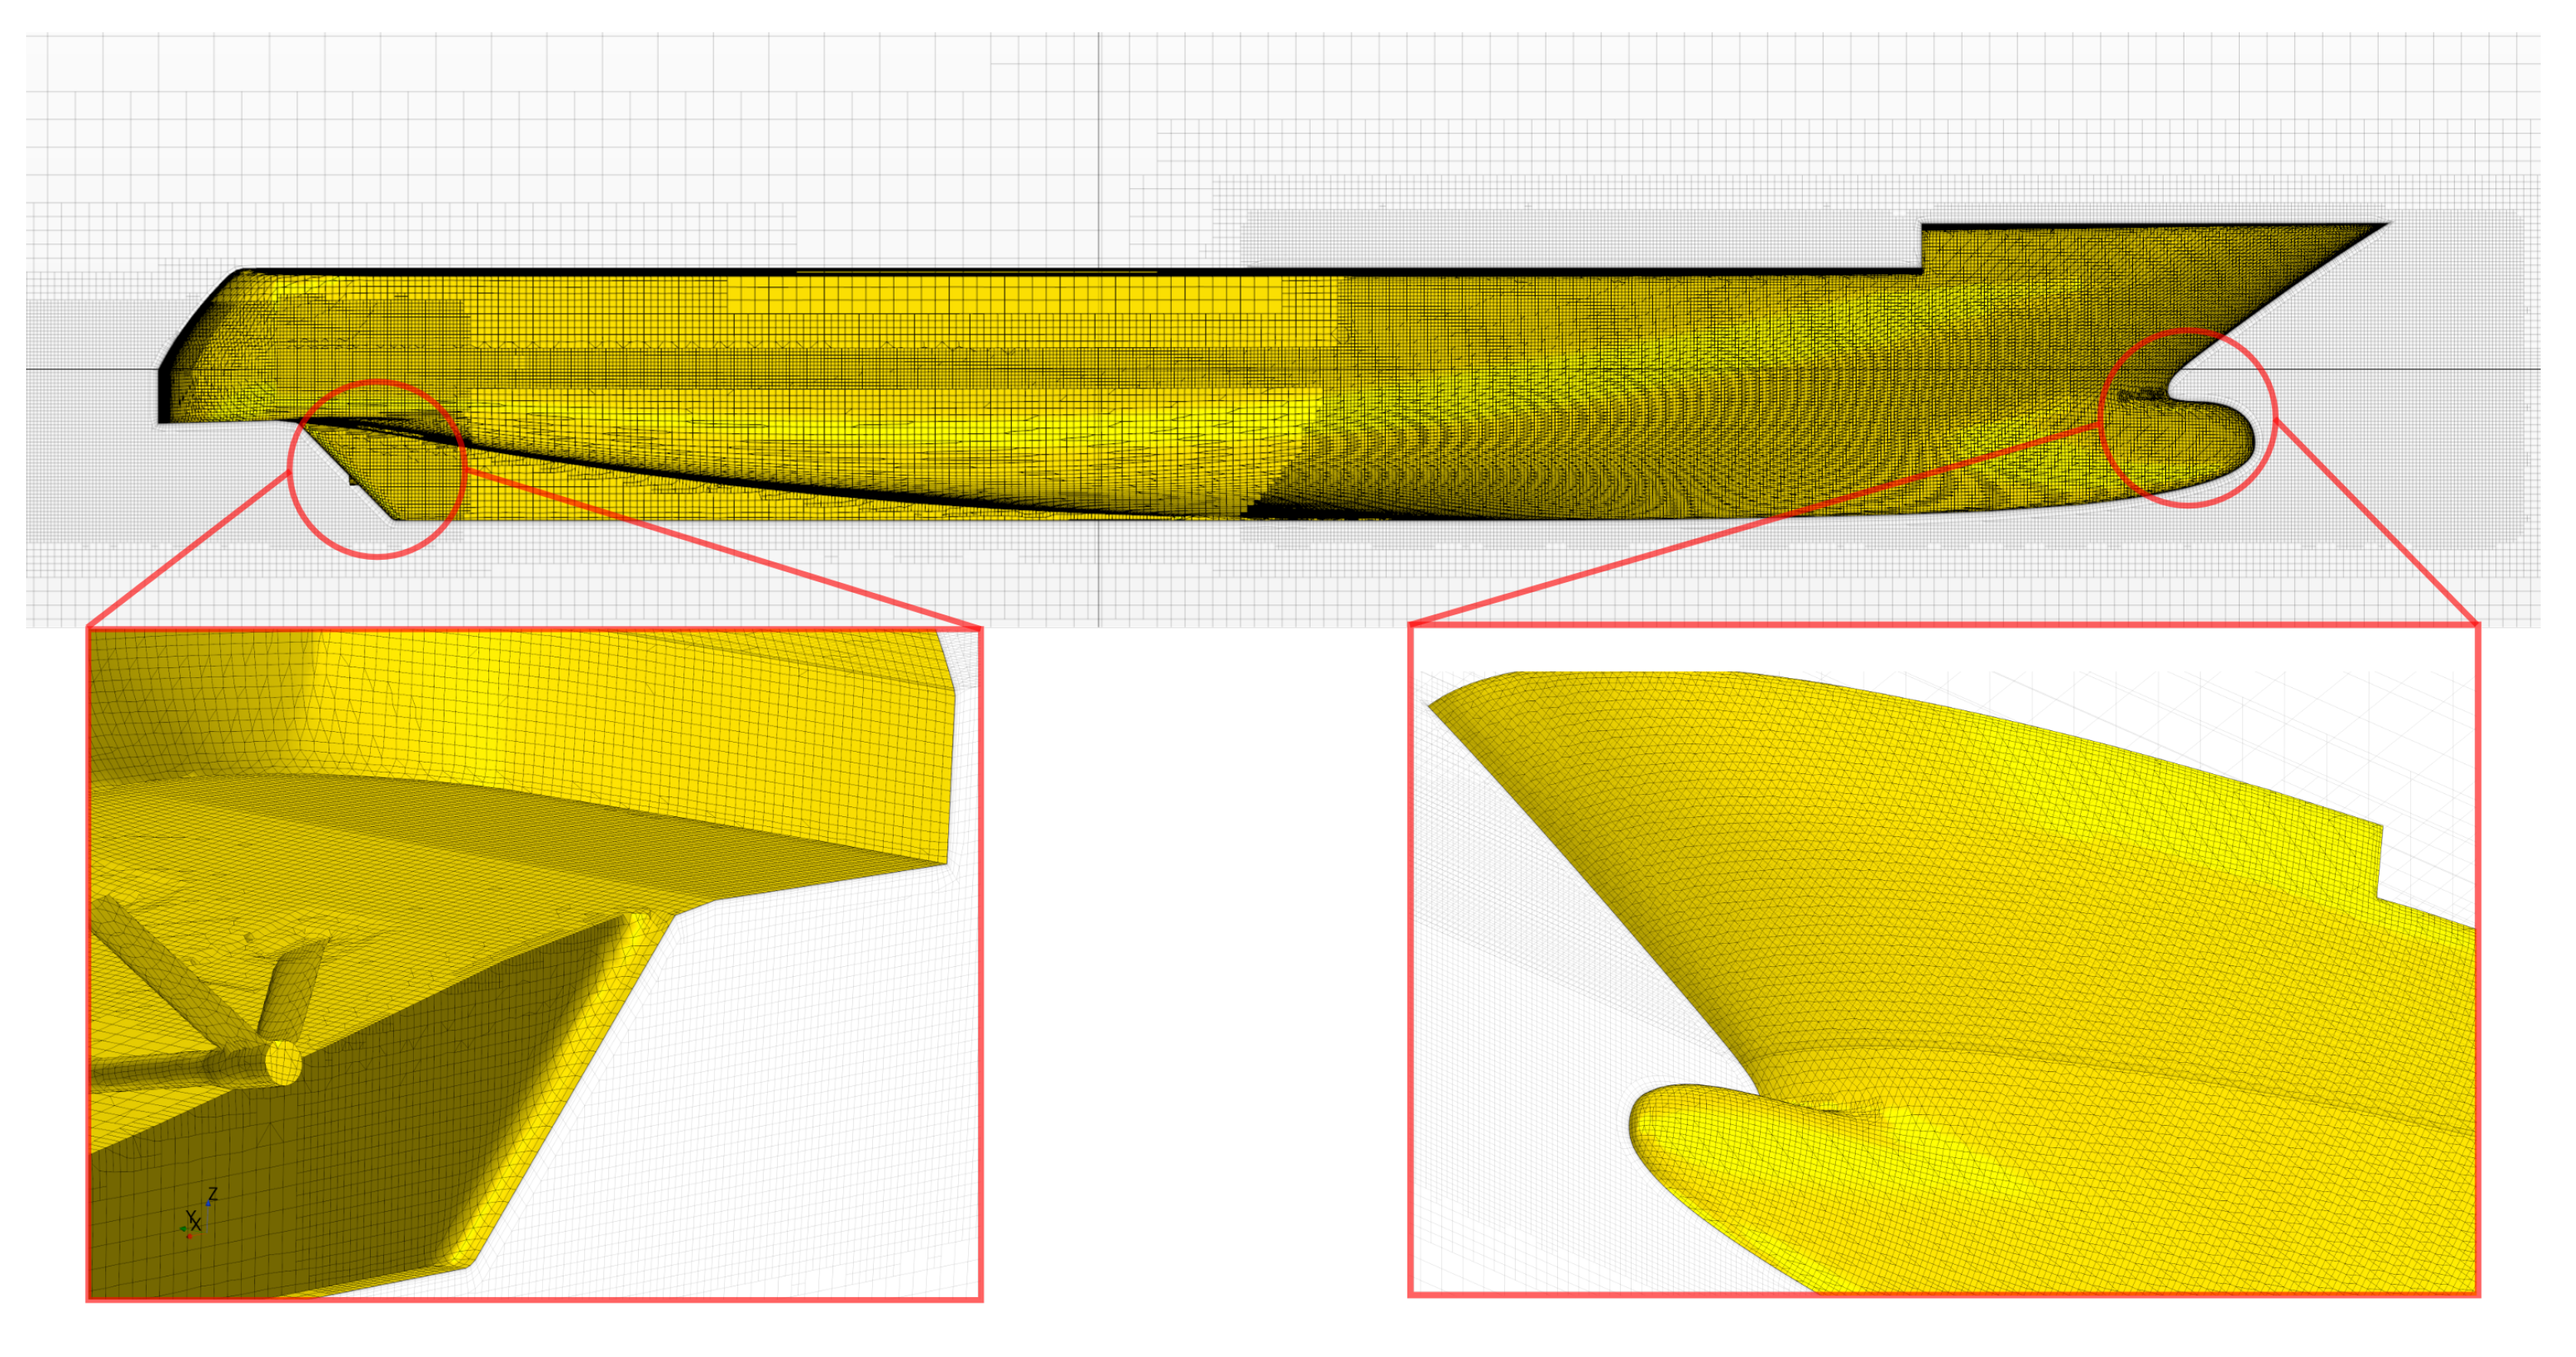
A high-quality finite volume mesh is fundamental to achieving accurate CFD results. The mesh was generated using the trimmed cell mesher in STAR-CCM+. A series of volumetric refinements were created to ensure high resolution in key areas: around the hull, at the stern, in the region of the free surface, and in the wake region downstream of the yacht. Crucially, a dedicated refinement zone was applied to the cylindrical volume representing the body-force propeller model to accurately resolve the flow acceleration and induced swirl. To resolve the boundary layer, a prism layer mesh consisting of 10 layers with a growth rate of 1.3 was generated on the hull surface. A grid verification study, following ITTC procedures, was performed to quantify the numerical uncertainty and ensure that the discretization error was well-controlled. Based on these results, a Medium mesh of approximately 3.5 million cells (
Figure 4) was selected for all simulations, providing an optimal balance between computational cost and accuracy. The results of the grid convergence study, presented in
Table 7, show that the discretization error is well-controlled.
Grid convergence parameters:
Convergence ratio: —Monotonic convergence
Apparent order:
Richardson extrapolation: kN
Grid Convergence Index (Fine):
The Grid Convergence Index (GCI) for the Fine mesh is 0.8%, which is well below the typically accepted values (<2%) for this type of analysis, demonstrating that the chosen mesh size provides reliable and accurate results. The apparent order
p = 4.35 exceeds the scheme’s theoretical order (2.0), indicating the grid study operates in the asymptotic convergence range where solution error decays faster than the formal discretization order [
16]. This behavior is typical for well-resolved marine CFD studies and validates the adequacy of the Fine mesh. Based on these results, the Medium mesh of approximately 3.5 million cells was selected for all simulations, providing an optimal balance between computational cost and accuracy (
).
Mesh quality metrics for the selected Medium mesh:
Total cell count: 3.5 million cells (half-hull model)
Base cell size: 200 mm (reference dimension)
Hull surface cell size: 28.6 mm (denominator = 7)
Free surface refinement: 4 mm vertical resolution (±0.15 m zone)
Propeller zone refinement: 6 mm cell size (62 cells across diameter)
Prism layer total thickness: 45 mm (10 layers, growth rate 1.3)
First prism cell height: y1 ≈ 0.5 mm (target y+≈ 50 at cruise speed)
Maximum aspect ratio: 18:1 (acceptable for trimmed cells)
Minimum orthogonality angle: 28° (excellent, <45° threshold)
Prism layer coverage: 93% of hull surface achieves target y+ range (30–300)
The propellers are five-bladed Wageningen B-series fixed-pitch propellers with geometric characteristics listed in
Table 2. The performance characteristics (KT-KQ-J curves) required for the body-force model were derived from the standard Wageningen B-series systematic data [
27], calculated using the polynomial regression equations for the specific propeller geometry.
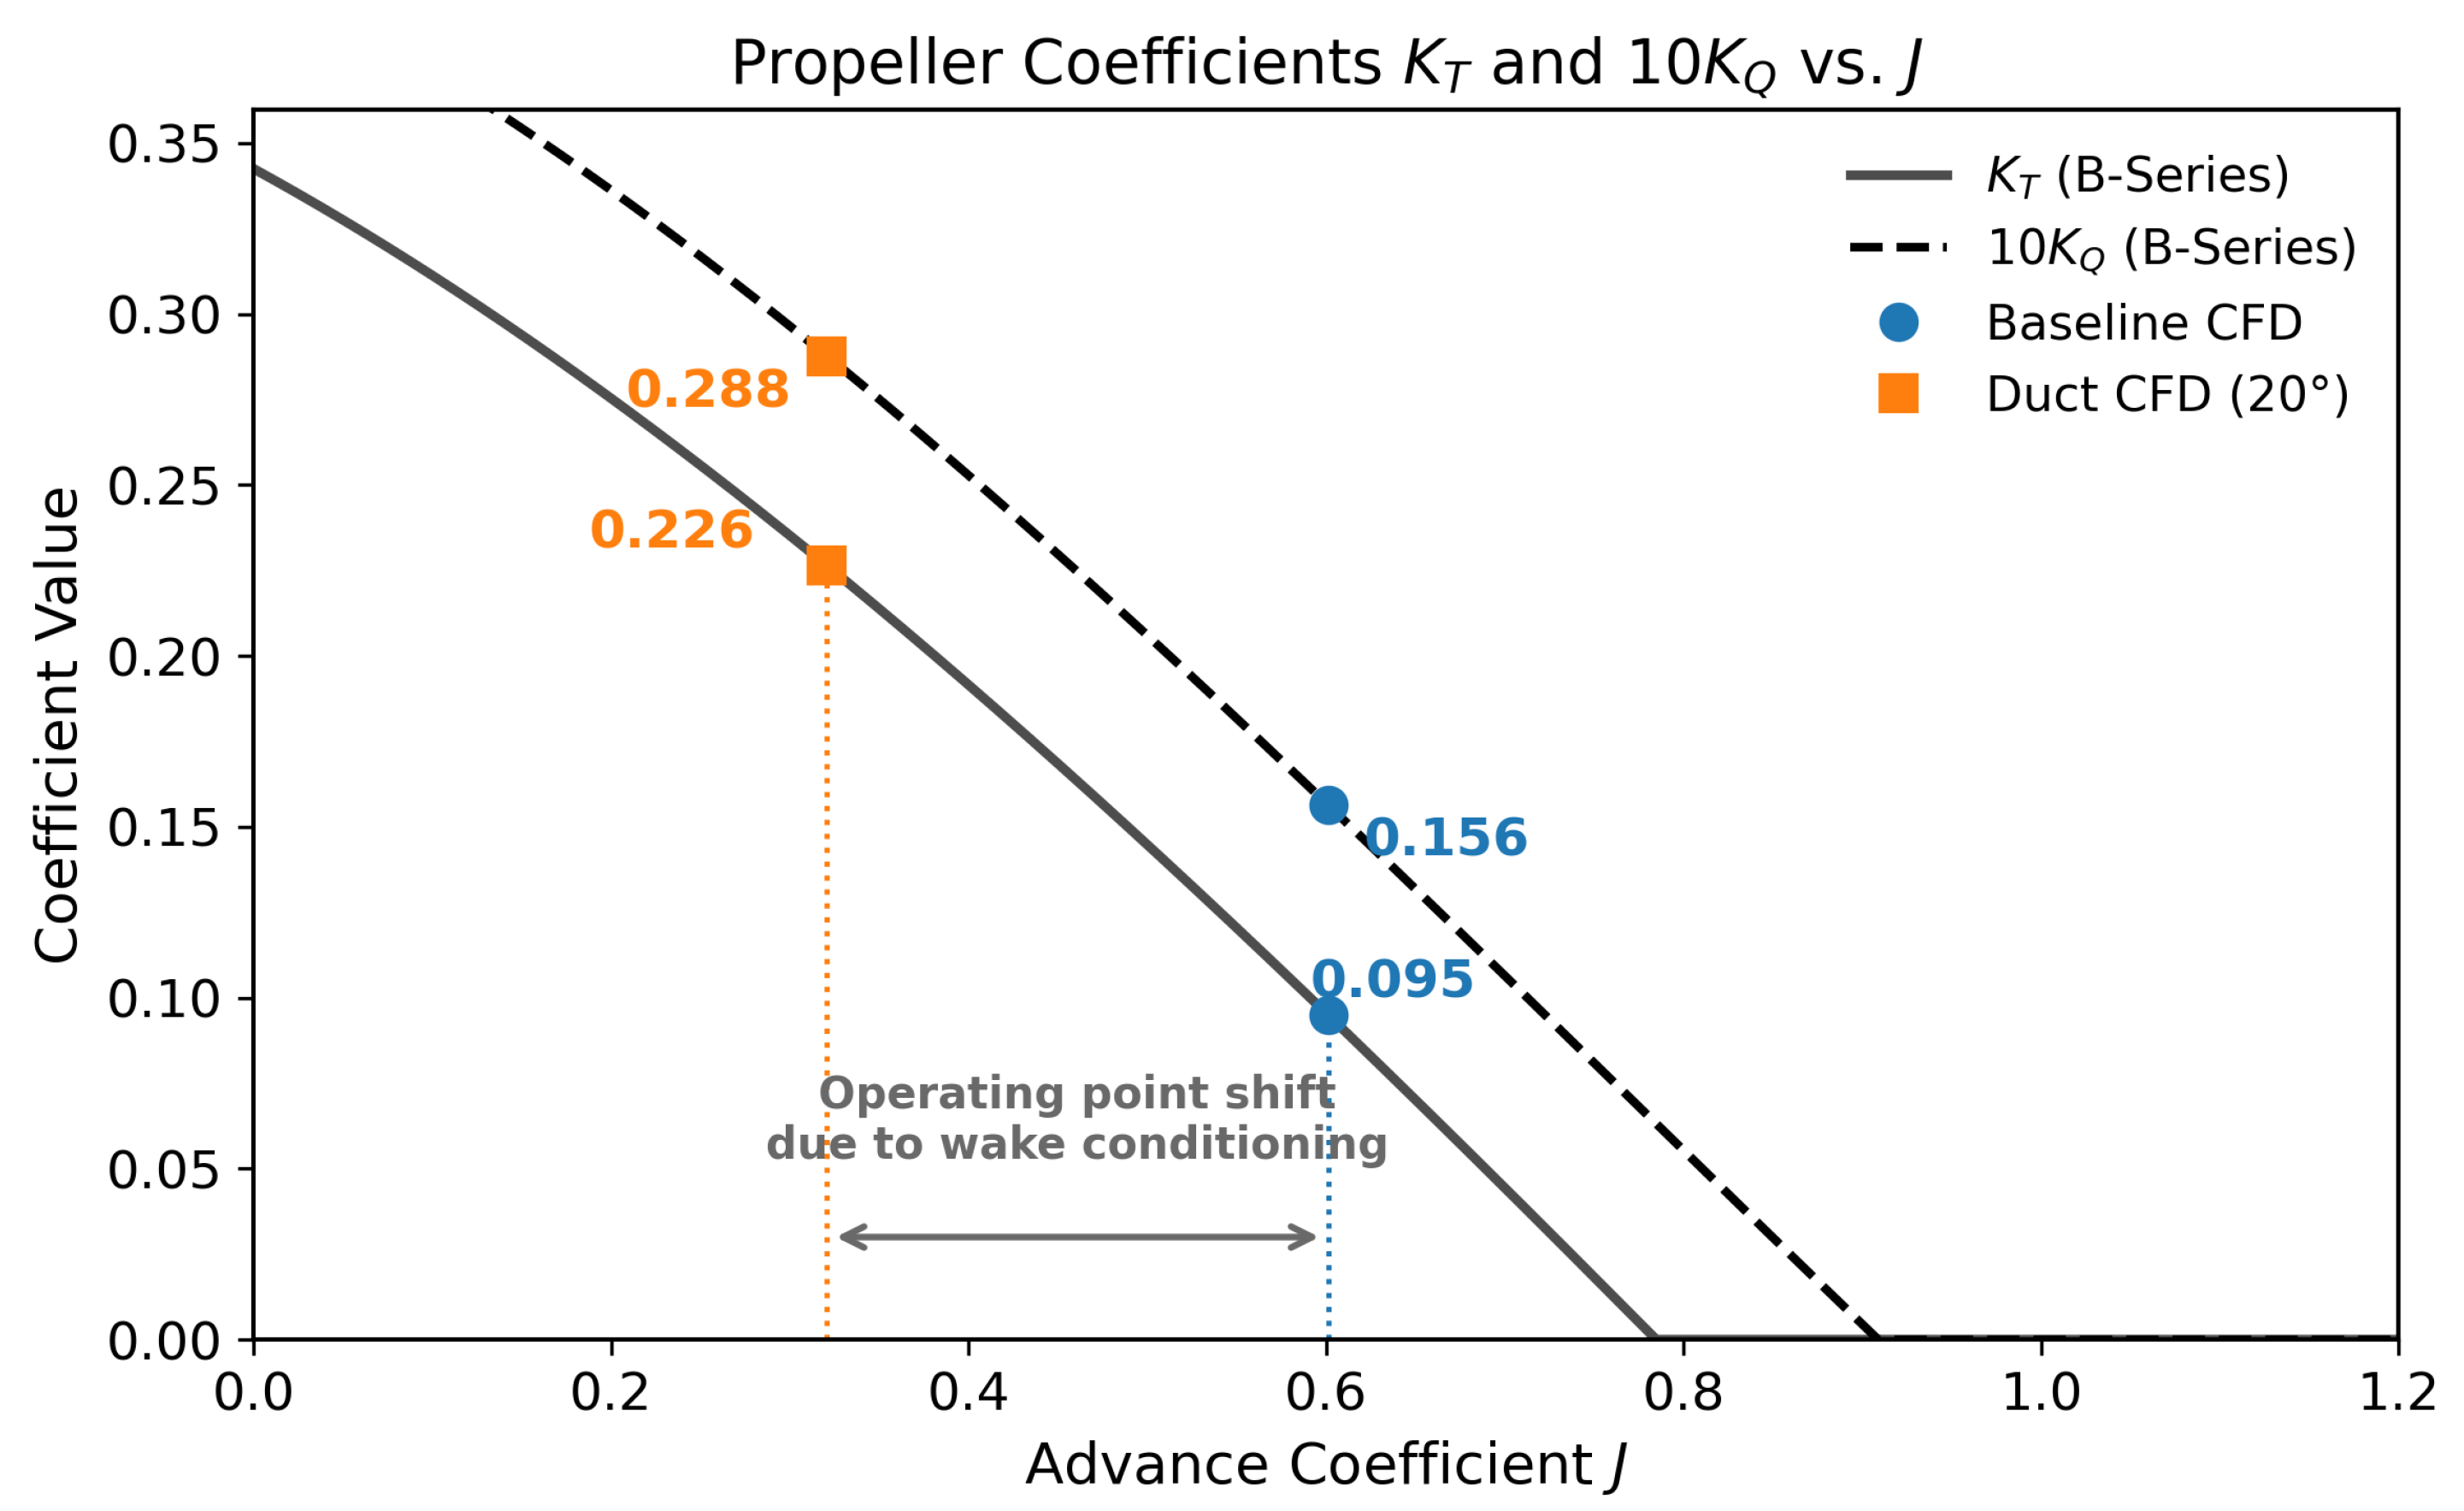
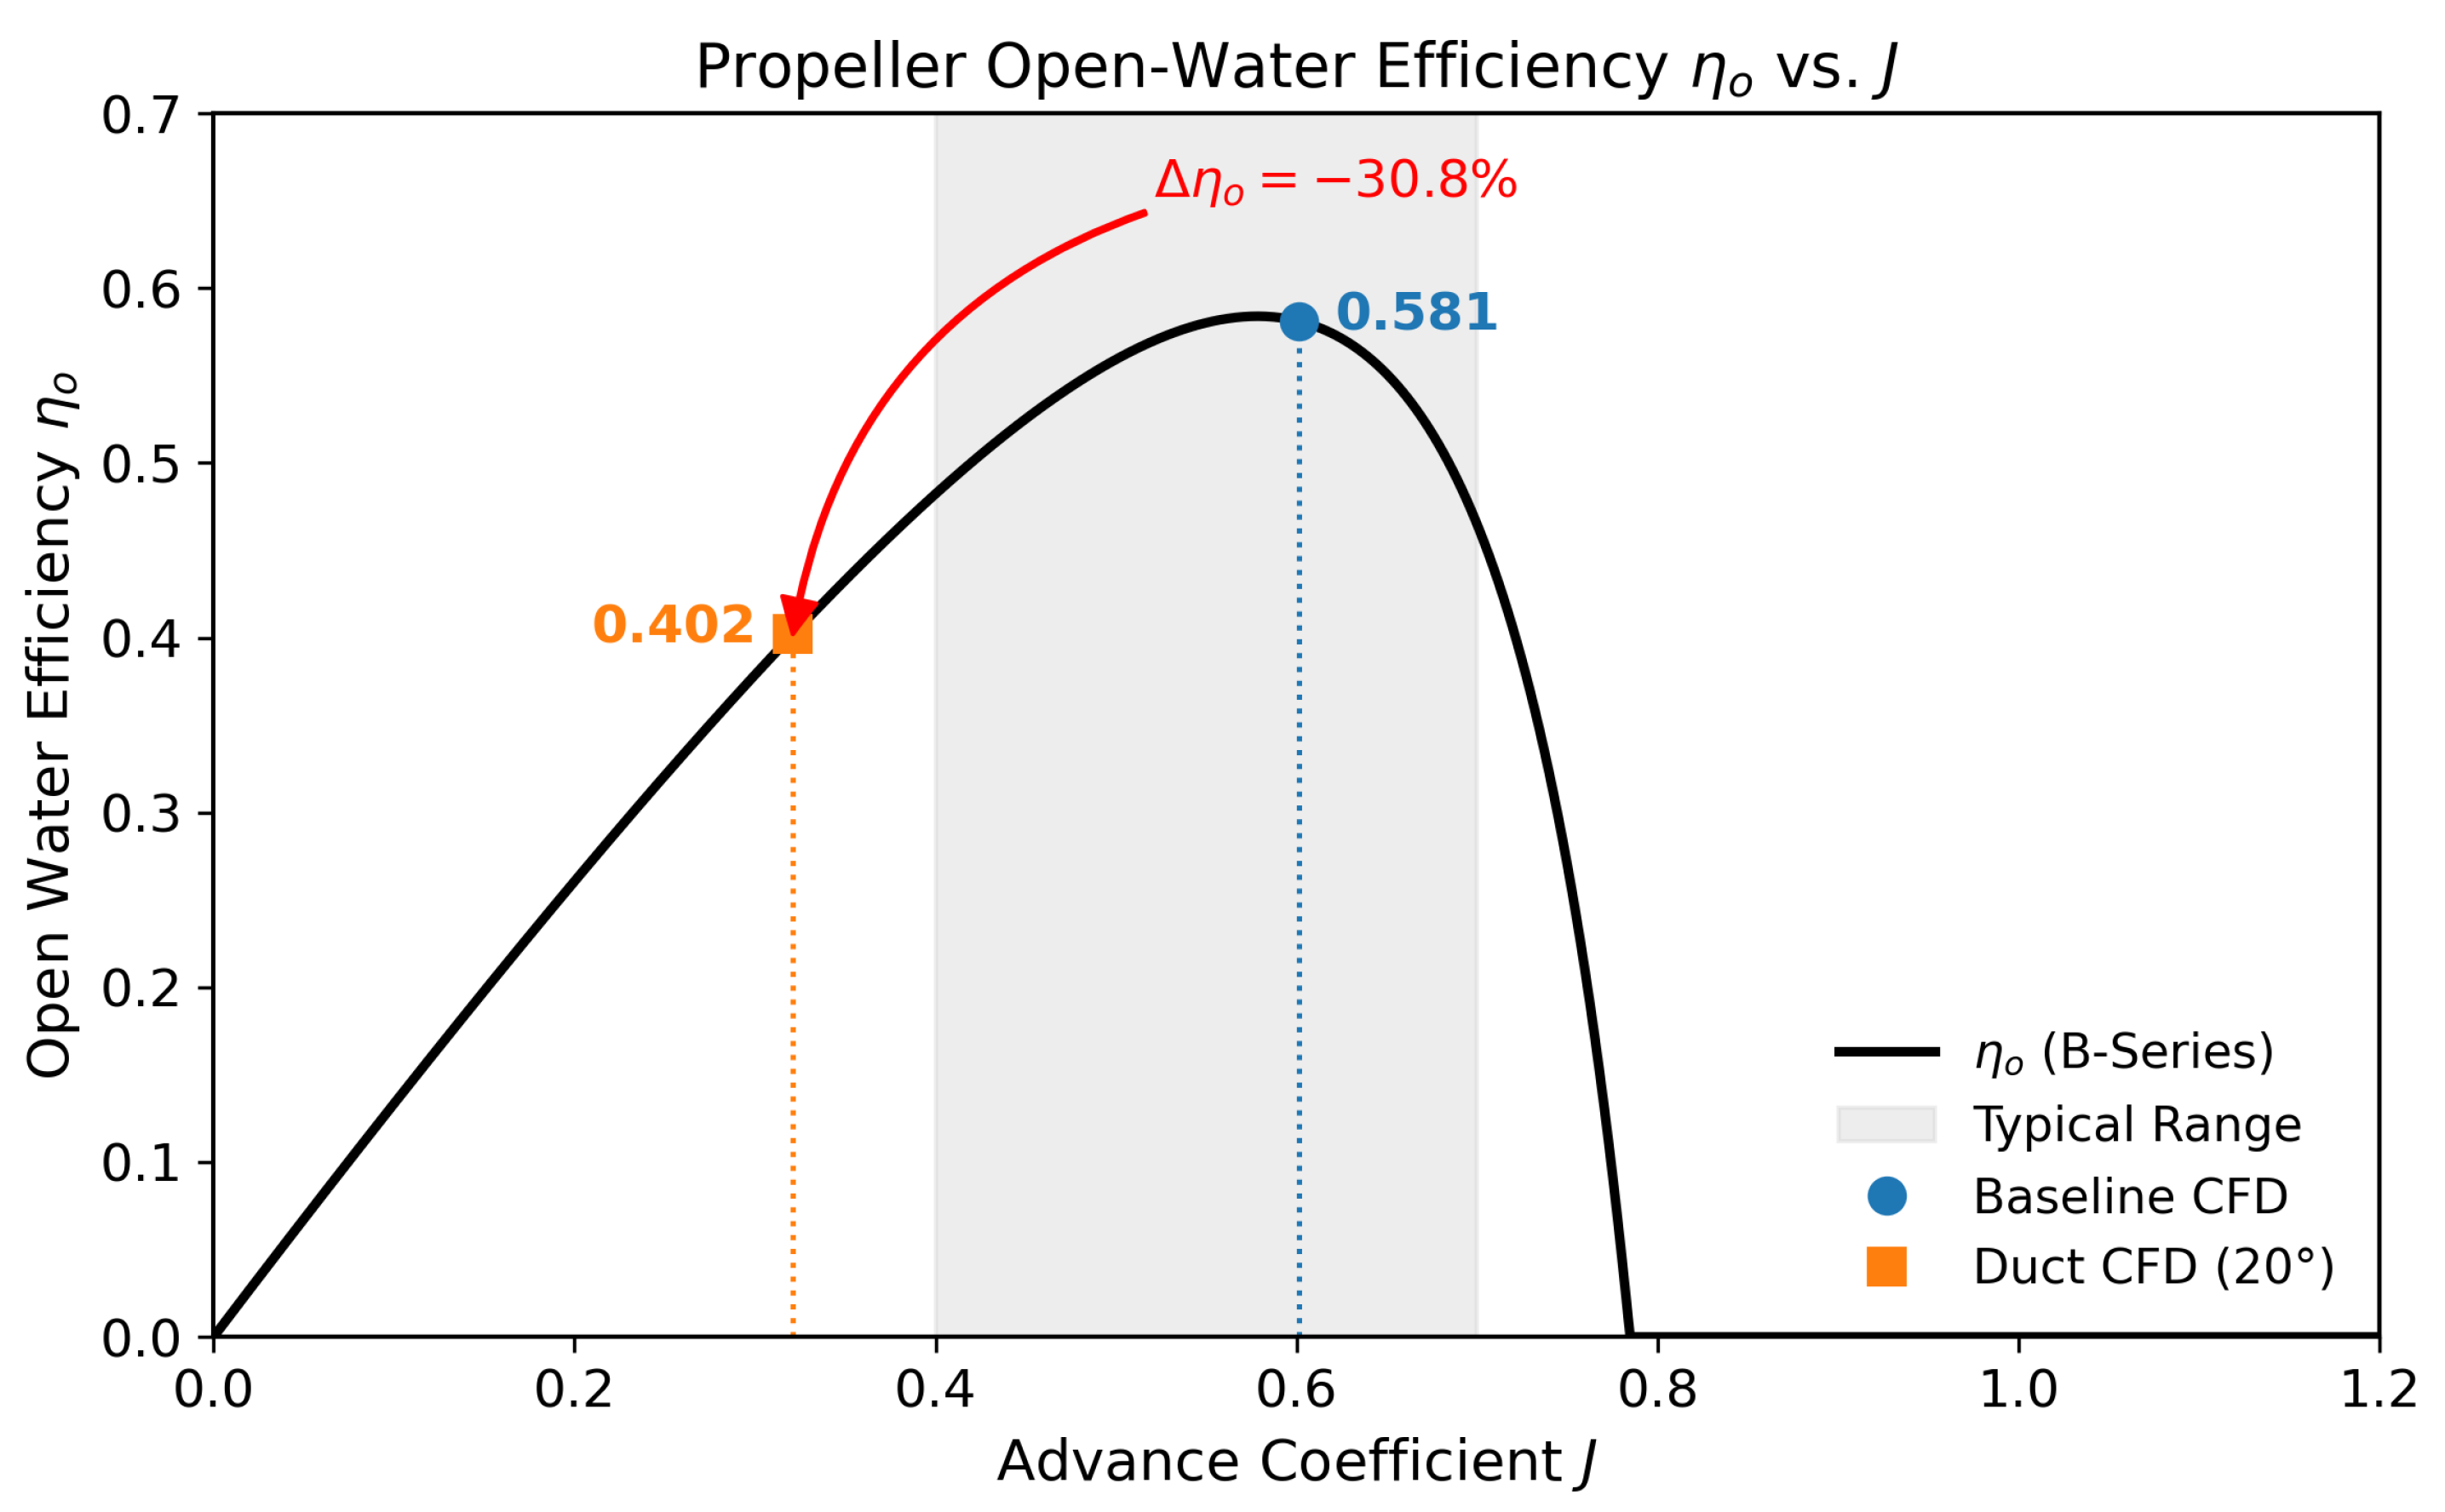
The body-force propeller model demonstrates excellent agreement with the Wageningen B-series systematic data across the relevant advance coefficient range (J = 0.3–0.7). The model accurately reproduces the thrust coefficient (KT), torque coefficient (KQ), and open-water efficiency () relationships defined by the standard polynomial regressions. Operating points extracted from both baseline and ducted self-propulsion simulations fall precisely on these validated curves, confirming that the CFD model correctly predicts propeller loading conditions under varying inflow conditions.
The use of well-established Wageningen B-series data ensures that the body-force model captures the correct thrust–torque–efficiency relationships for the specific propeller geometry. Self-propulsion operating points extracted from CFD simulations fall precisely on these validated curves, confirming correct propeller loading predictions. This rigorous validation is essential for the comparative ESD assessment in
Section 5, where operating point migration drives the observed performance differences.
The primary validation metric for the self-propulsion model is the delivered power ({sub}“). The validation process involves a direct, like-for-like comparison between the power predicted by CFD and the power measured during the full-scale sea trial.
The validation employed the standard 12.5% sea margin recommended by ITTC [
21] for full-scale power prediction, which accounts for hull roughness, wind resistance, and operational variability.
Table 8 shows that the CFD predictions with this margin agree with measured sea-trial power within ±15% uncertainty (typical for yacht trials). The close agreement validates the CFD methodology for parametric ESD studies, where relative power changes between configurations are more critical than absolute power magnitude. The CFD model already accounts for the change in propeller coefficients (
) and performance (
) due to the inhomogeneous inflow speed by matching the computed operating point to the corresponding Wageningen B-series curve (
Figure 5 and
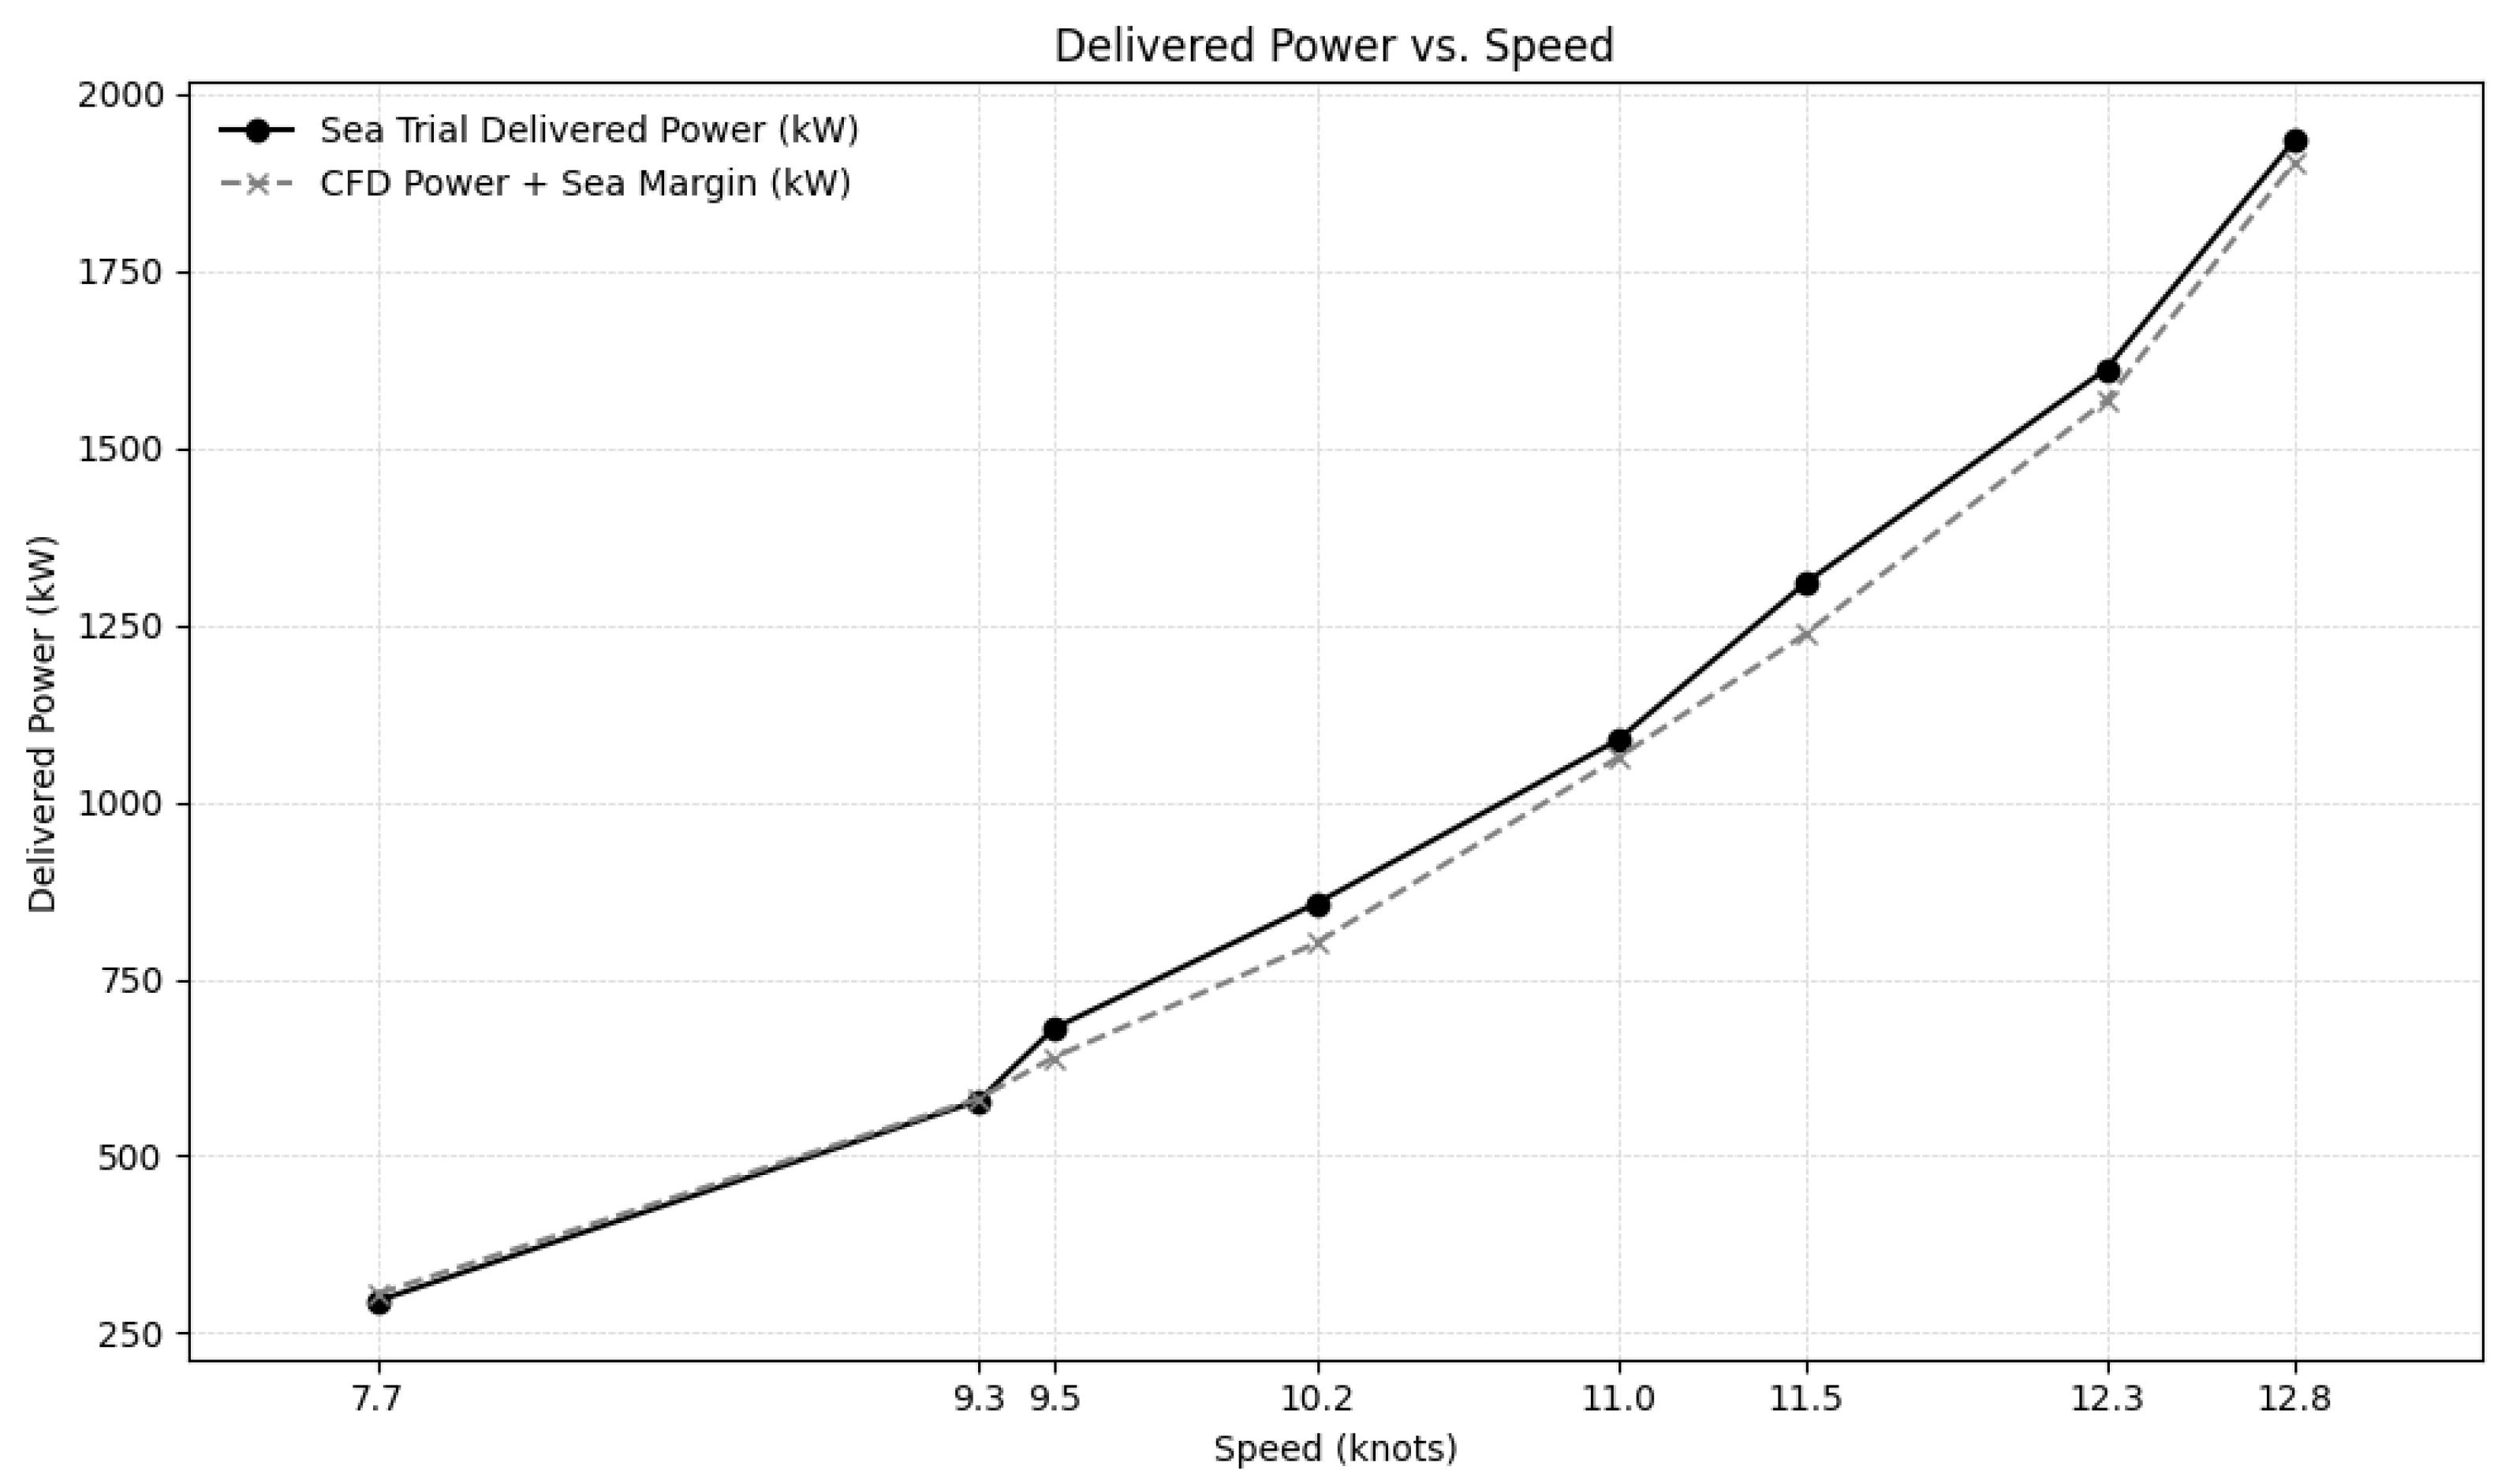
Figure 6); thus, the added sea margin is independent of this hydrodynamic effect. The final validation compares the CFD Predicted Power + Sea Margin against the Sea Trial Delivered Power.
The validation results are presented in
Table 8 and visualized in
Figure 7. The comparison shows a strong correlation between the numerical predictions (including the sea margin) and the real-world trial data.
6. Discussion
The results presented in the preceding chapters provide a comprehensive validation of a full-scale self-propulsion CFD model and demonstrate a directly calculated performance improvement from a bespoke Energy Saving Device. Considering the ±15% sea-trial uncertainty and ±0.8% CFD discretization error (
Table 7), the 4.7% power saving at 12.3 kn is statistically significant and robust within a combined uncertainty of approximately ±2% (propagated from trial and numerical sources).
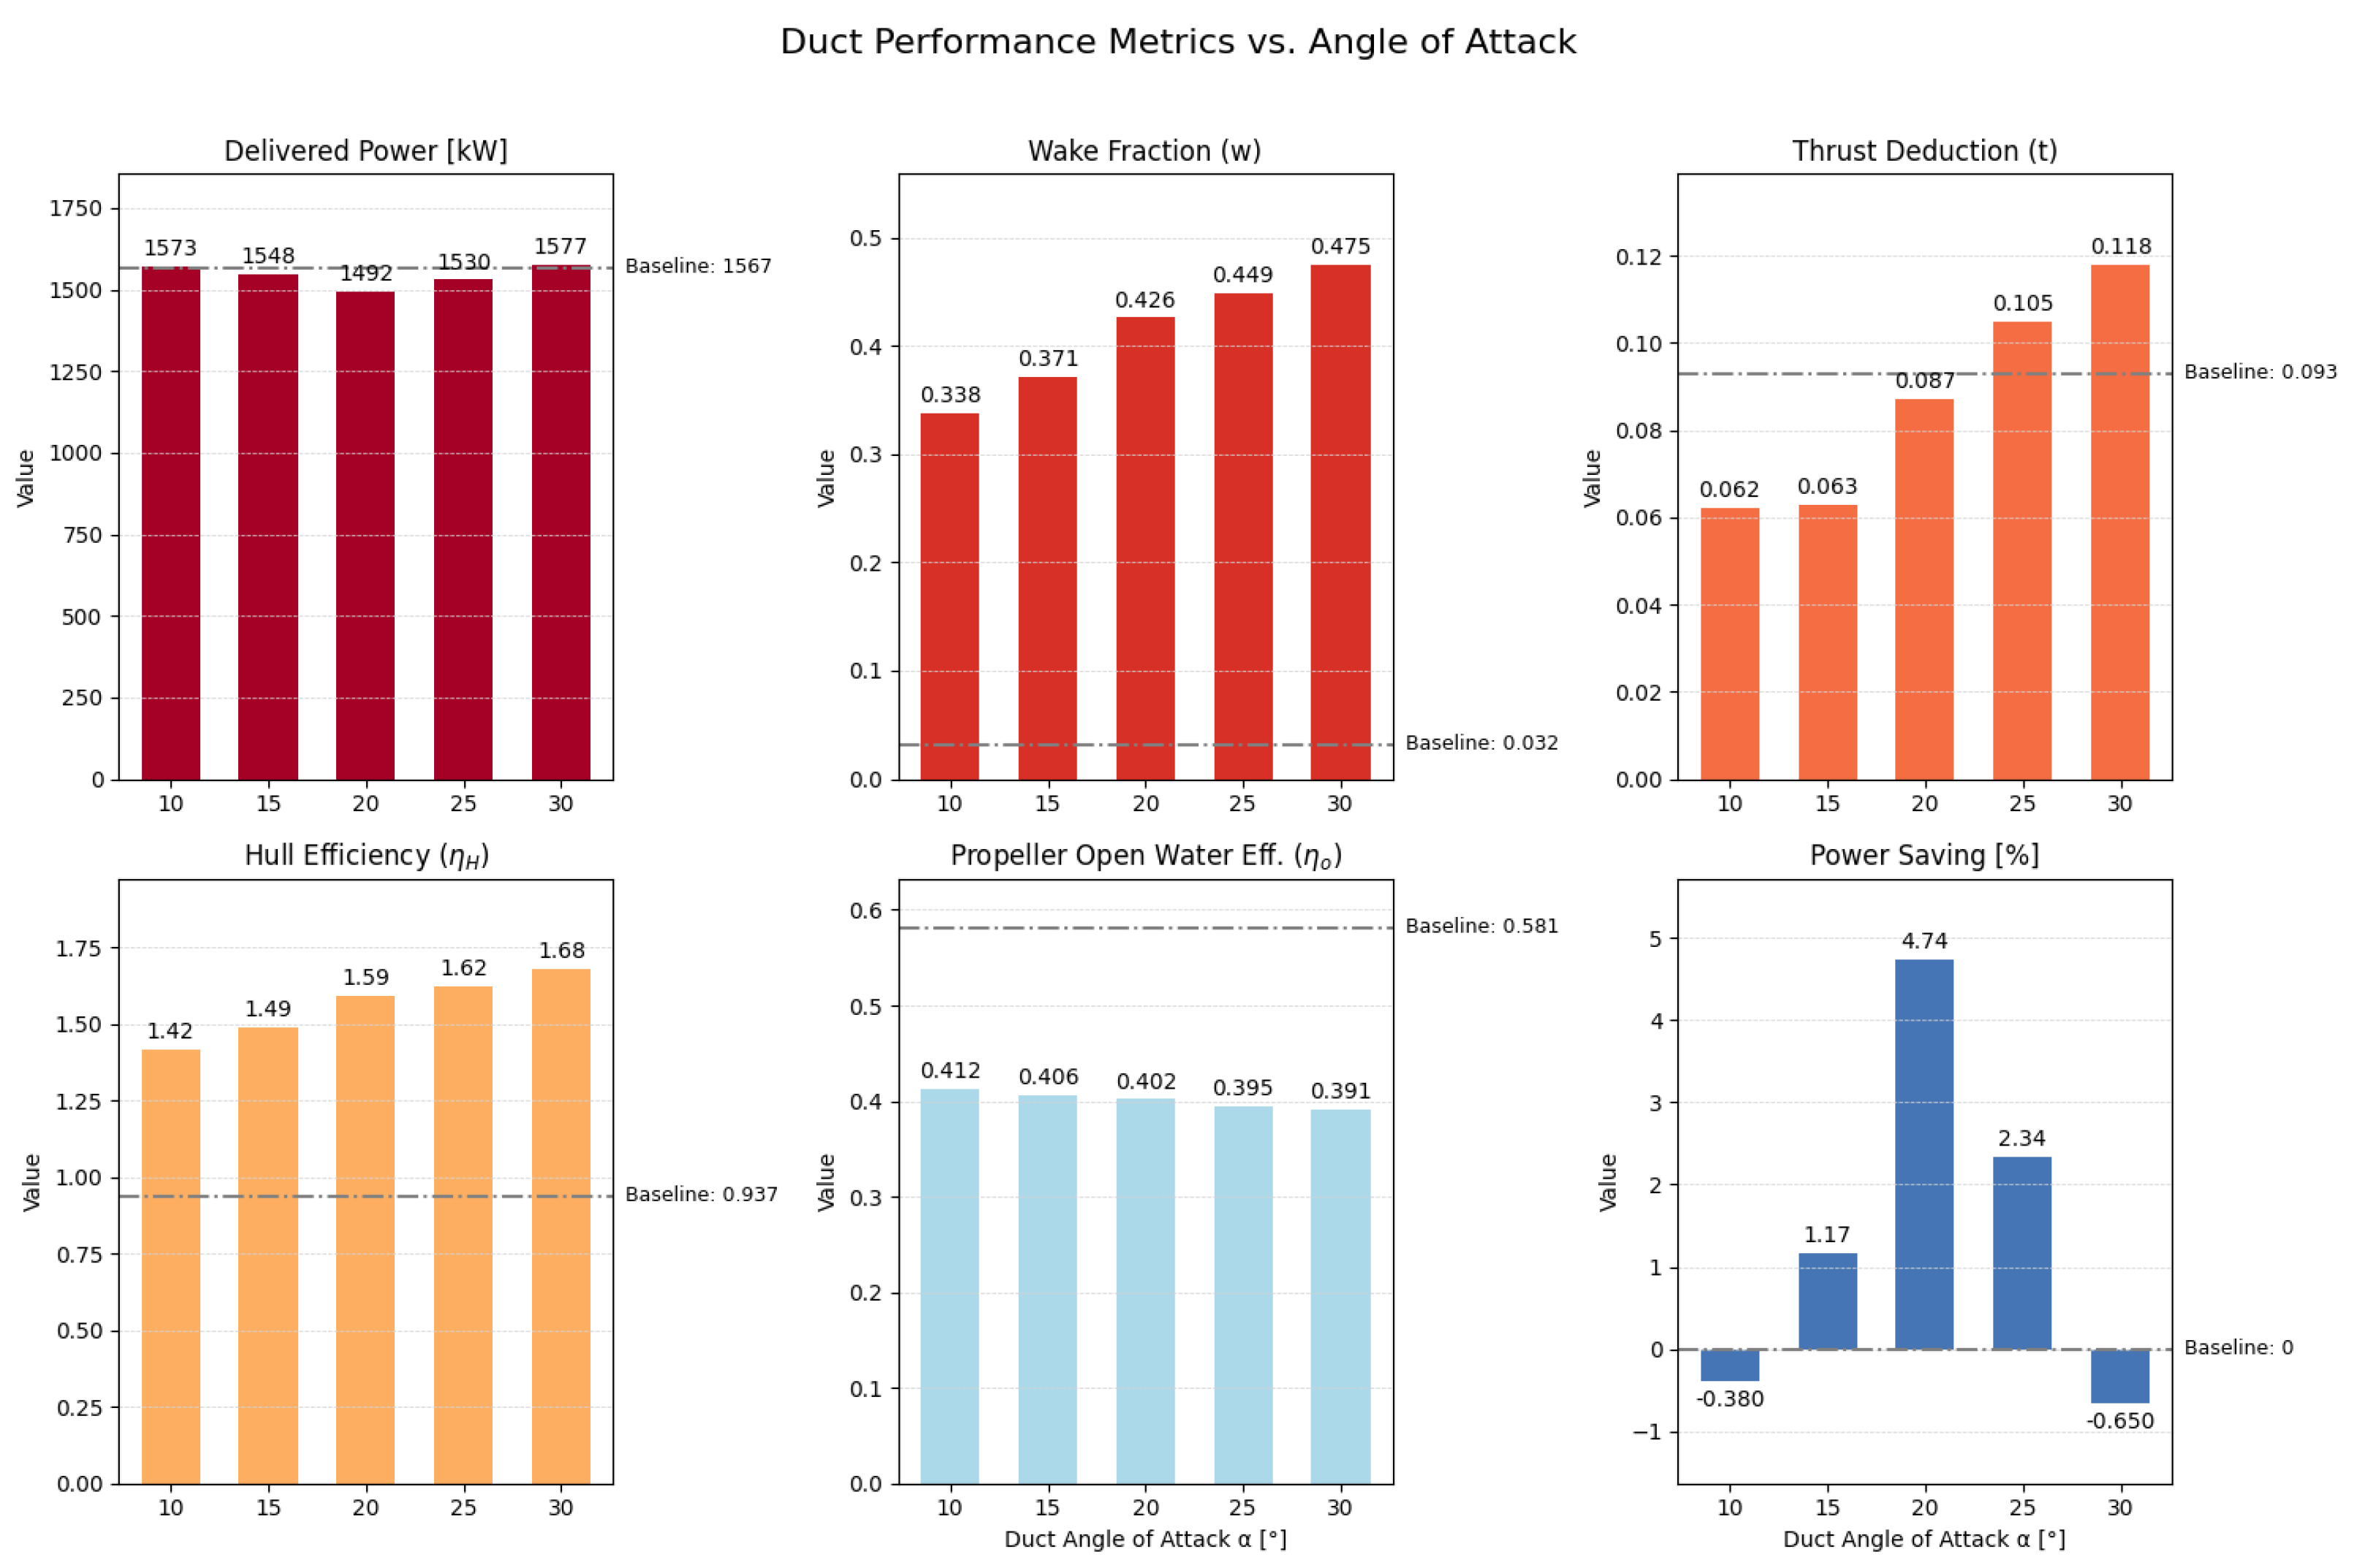
This section aims to interpret these findings, place them in a broader scientific and industrial context, and discuss the limitations and future directions of the work. The primary contribution of this work is the successful design and optimization of the pre-propeller ducts using the validated, high-fidelity model. The self-propulsion analysis shows a peak power saving of 4.7% at the 12.3-knot cruise speed, achieved with a
duct angle of attack. This is not an estimation based on resistance but a definitive result reflecting the improved propulsive efficiency of the entire system. This level of improvement is highly competitive with similar Wake-Equalizing Ducts (WEDs) reported to achieve 2–5% savings on bulk carriers [
17] and other pre-swirl devices offering gains of up to 6% [
18]. Other recent numerical studies show similar gains, including approximately 4% power savings reported by Koushan et al. [
19] and up to 4% reduction with optimized pre-swirl ducts and fins in [
20]. Further supporting these efficiency gains, Trimulyono et al. [
32] found a PSS could increase propeller thrust by 4.7%.
The analysis of the propulsion factors in
Section 5 explains this gain. The primary mechanism is the duct’s ability to condition the stern wake, which leads to a higher effective wake fraction (
w). This, in turn, produces a substantial increase in hull efficiency (
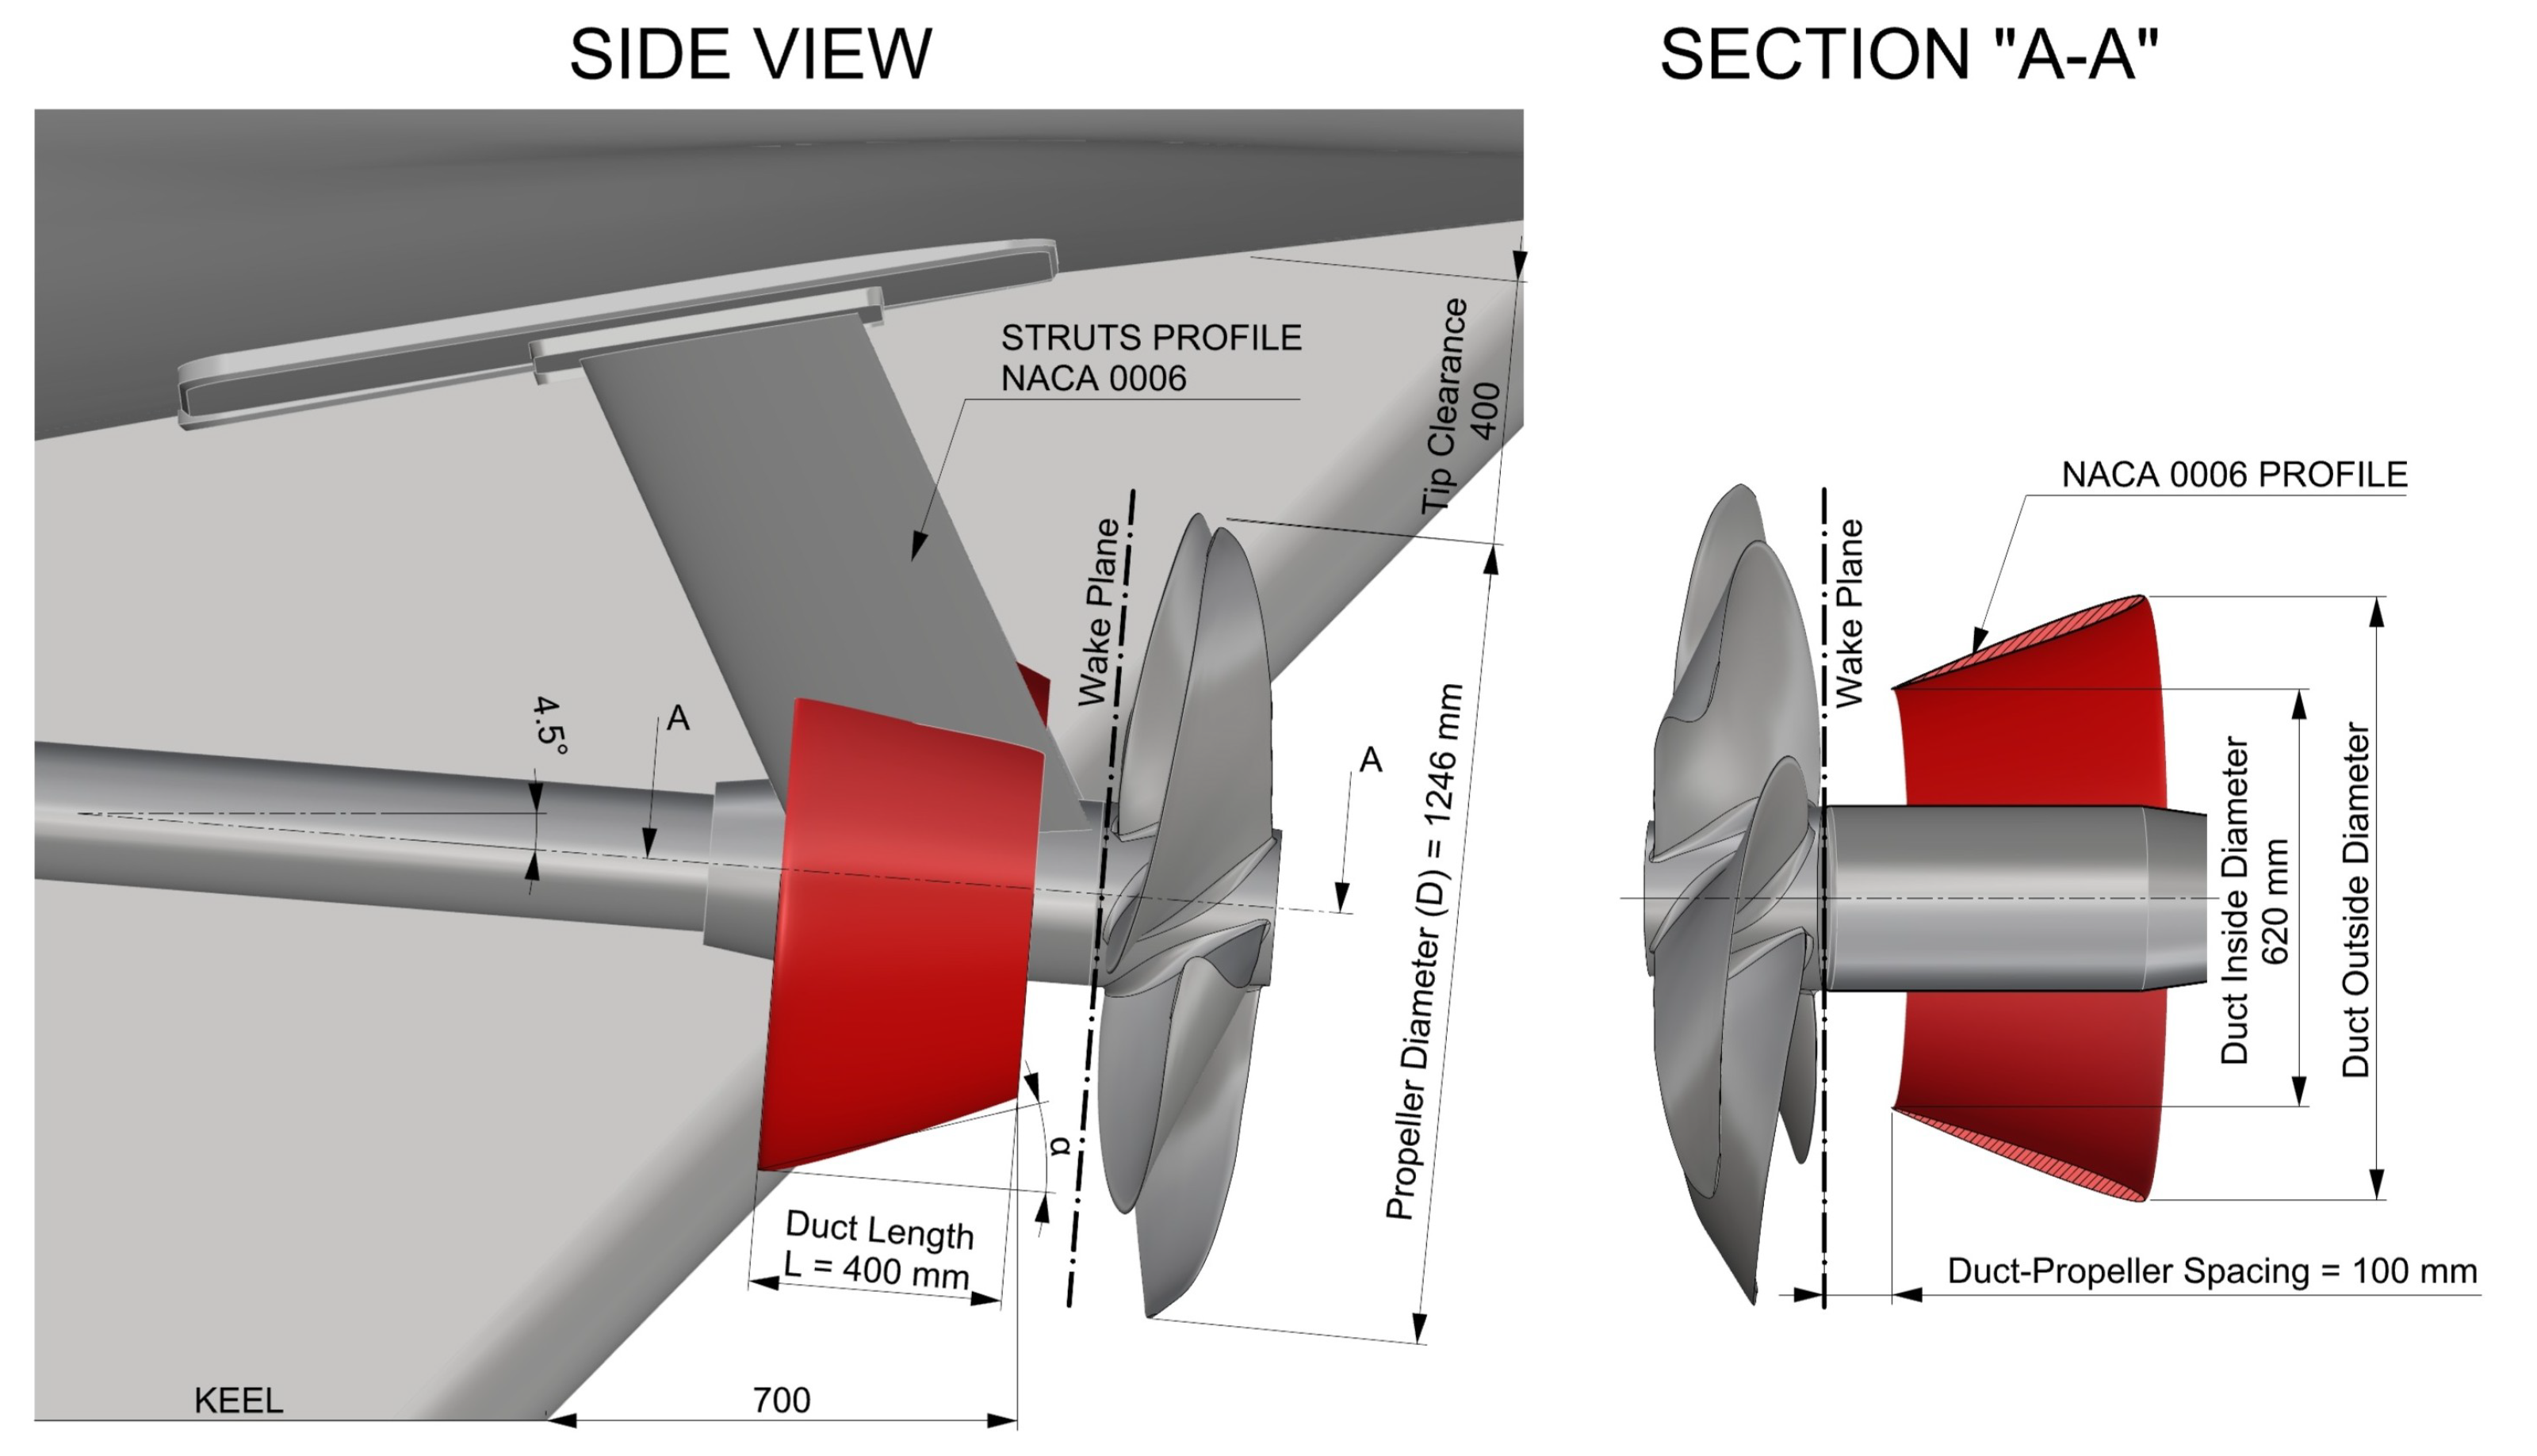
). This finding is consistent with recent CFD studies on pre-ducts, which conclude that these devices tend to increase hull efficiency at the expense of open-water efficiency. The gain in hull efficiency is the dominant factor in the power saving, supported by secondary benefits from pre-swirl generation and direct thrust from the foil-shaped duct profile. This demonstrates the potential of a custom-designed device tailored specifically to the yacht’s unique hull form and flow characteristics.
While this study successfully achieved its objectives, it is important to recognize its limitations, which suggest clear directions for future research.
Operational Profile Analysis: While the duct shows significant benefits in the high-speed cruise range, the performance drop recorded at lower speeds (e.g.,
power increase at 5.0 knots,
Table 11) necessitates a full operational assessment. Future work must extend the analysis across the entire speed envelope to precisely quantify the benefits at low-speed maneuvering and high-speed sprint conditions, providing the owner with a complete trade-off assessment for the duct’s utilization.
Variable Sea Margin: A uniform 12.5% sea margin is applied across all speeds, consistent with preliminary full-scale prediction practice. Future work could refine this using speed-dependent corrections, though the 12.3 kn operating point—where optimization and validation are focused—remains well-characterized.
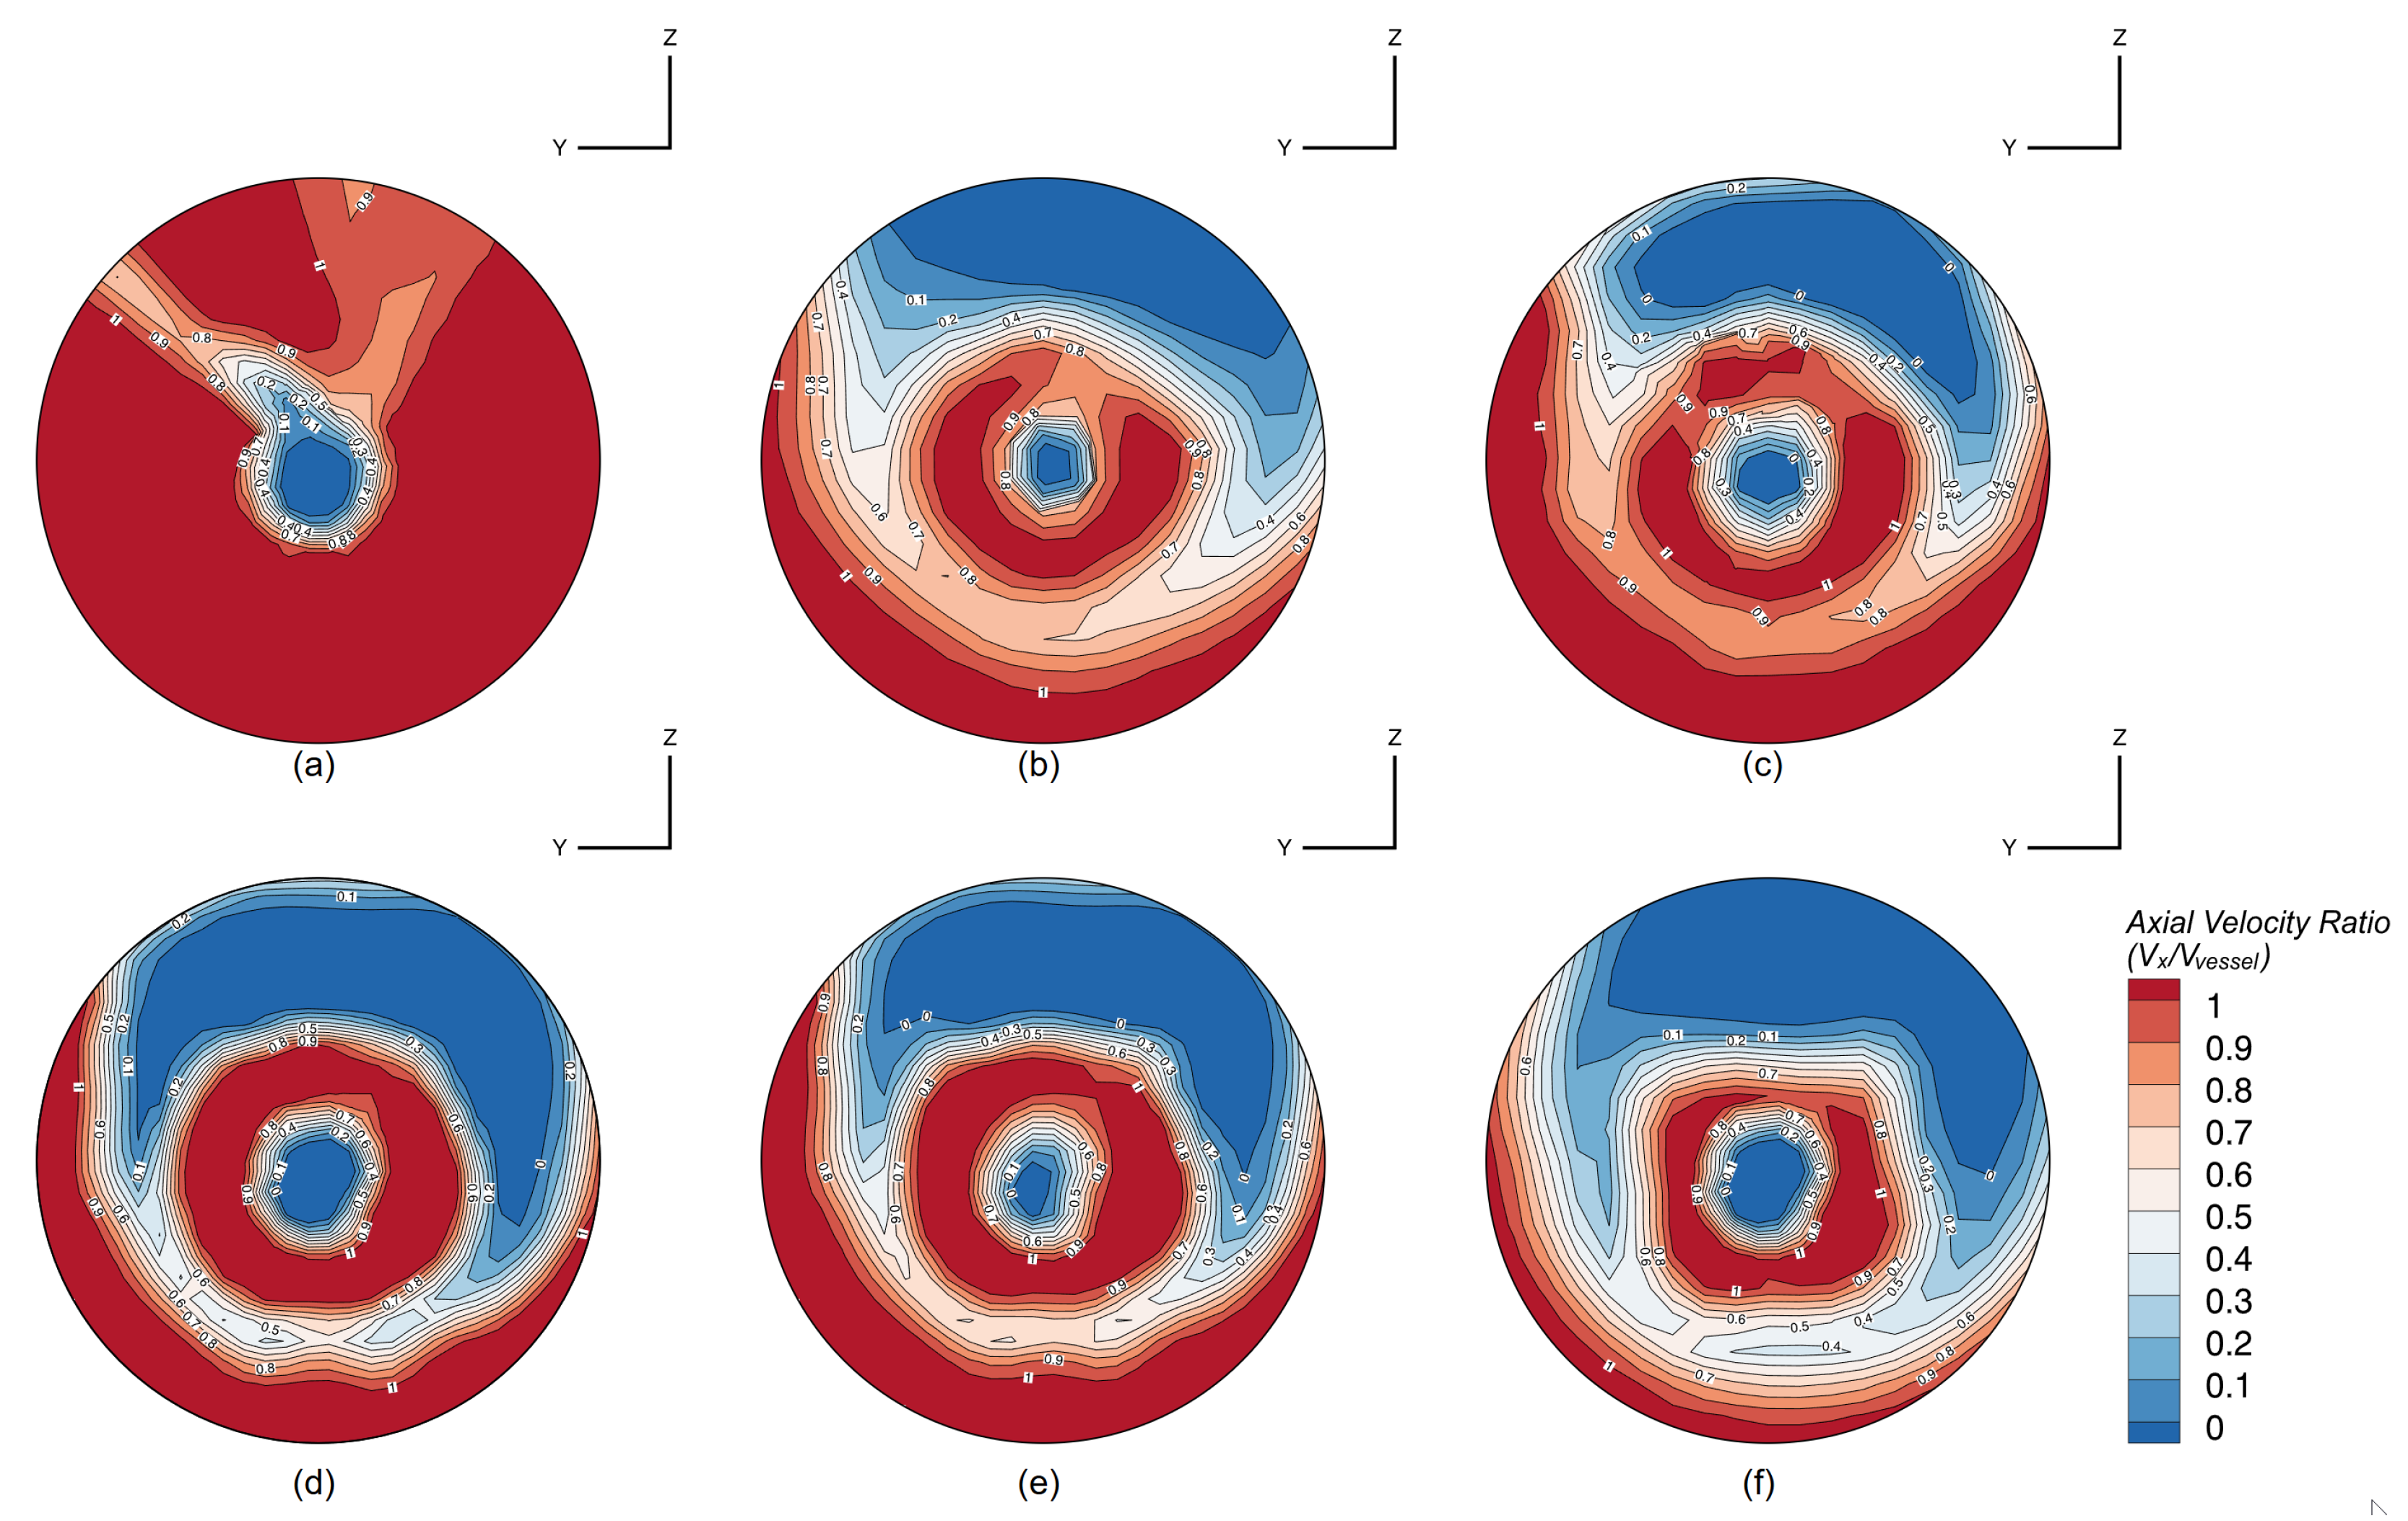
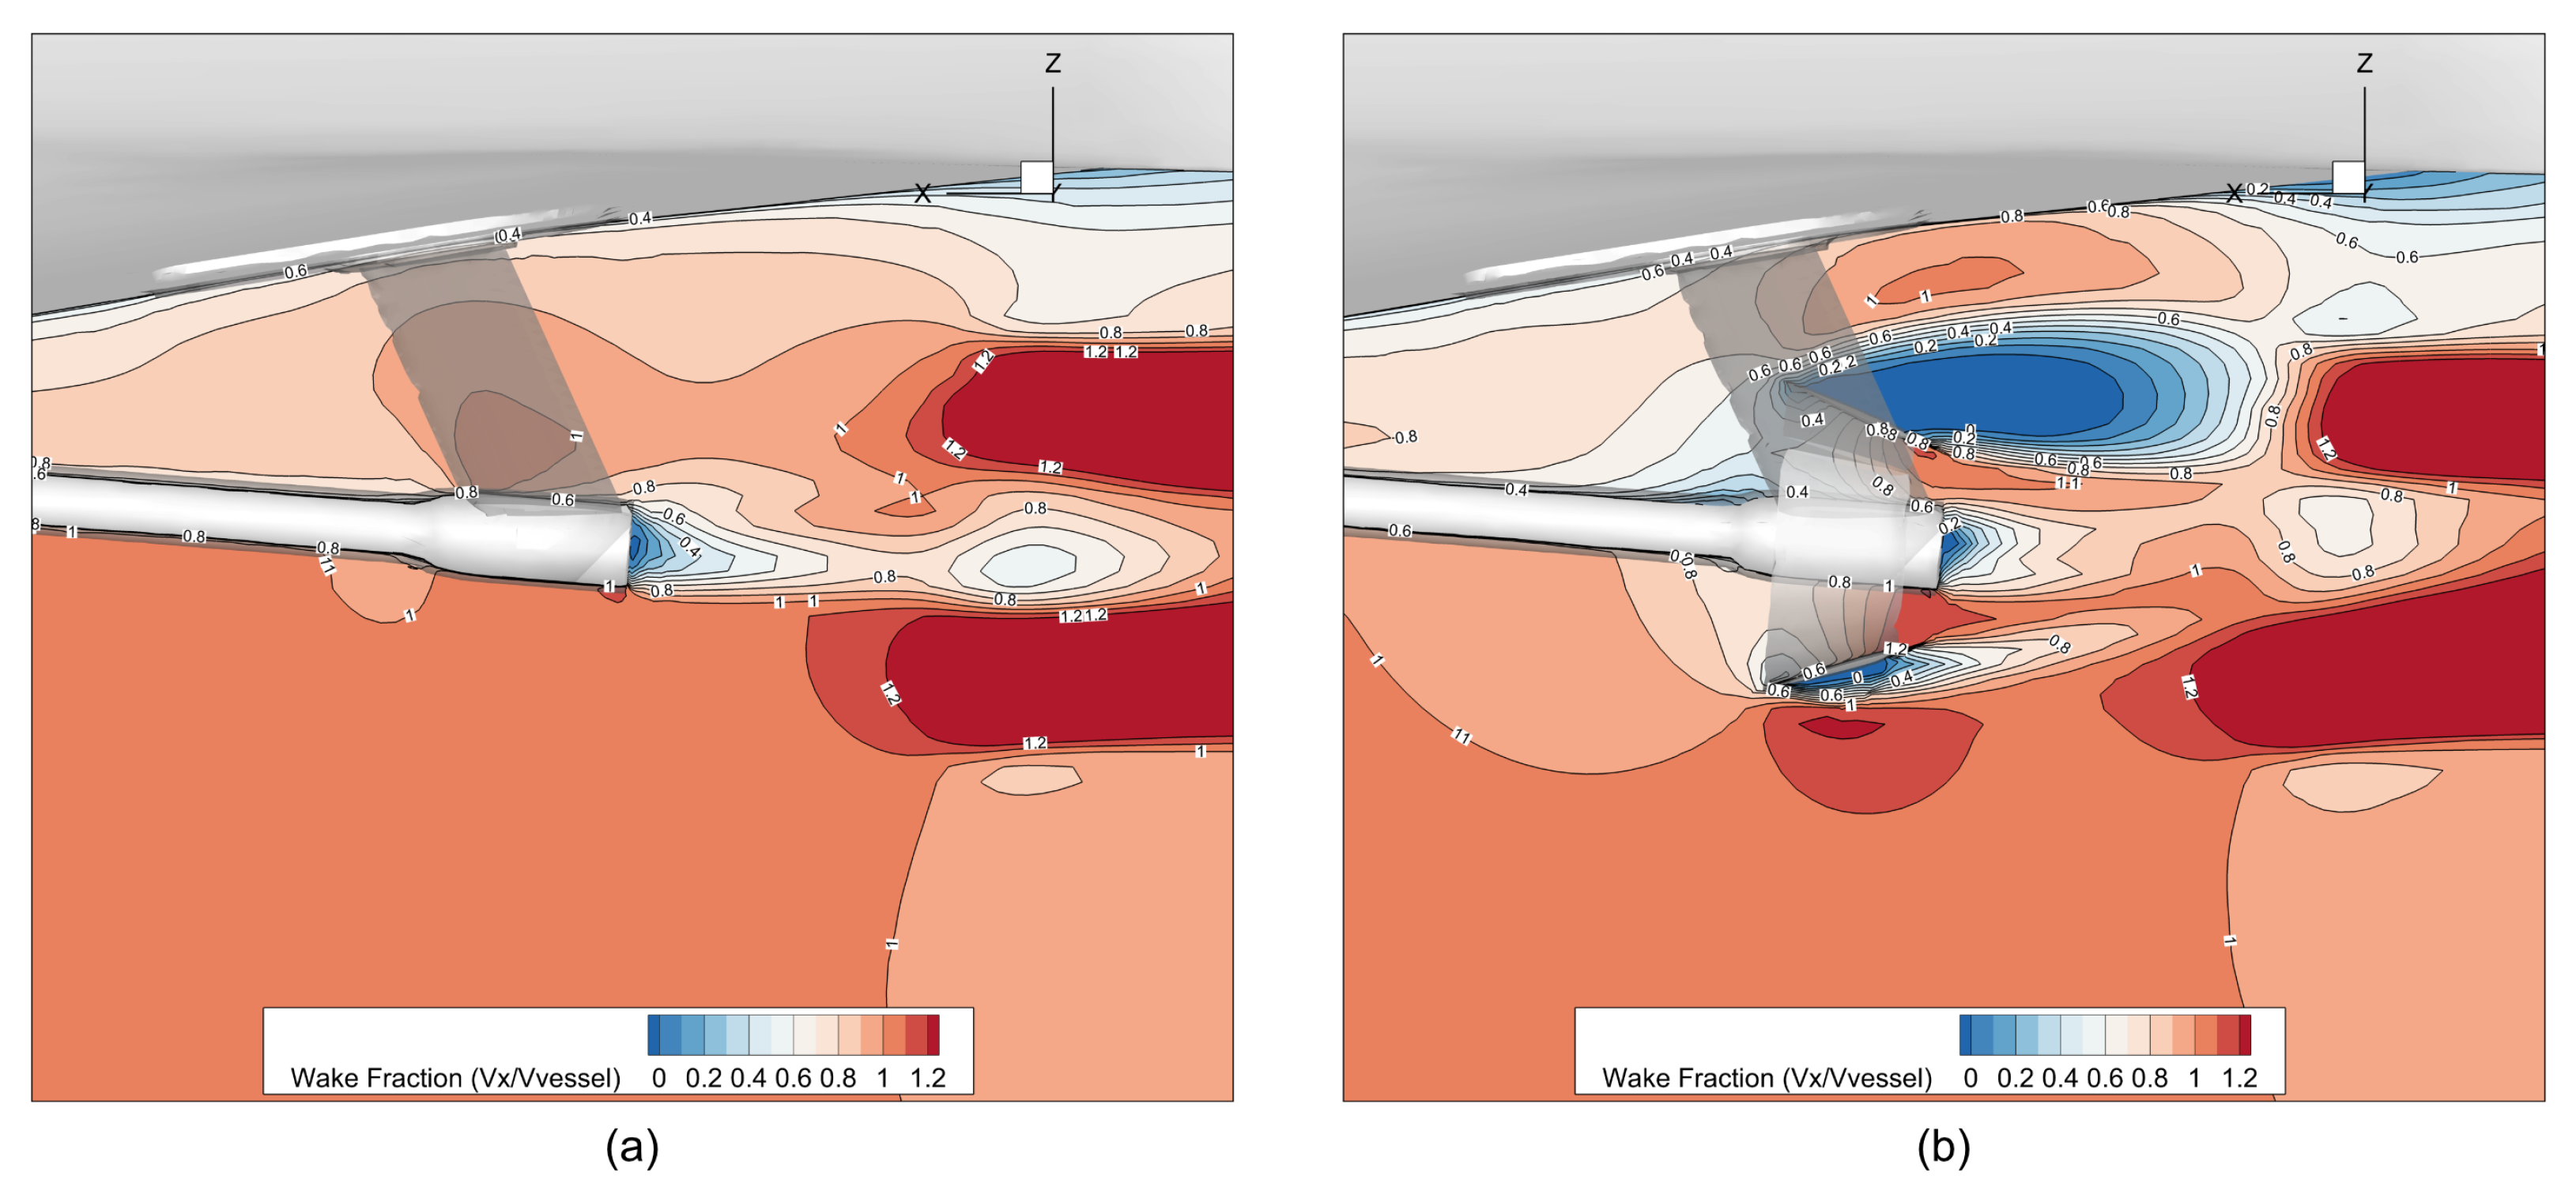
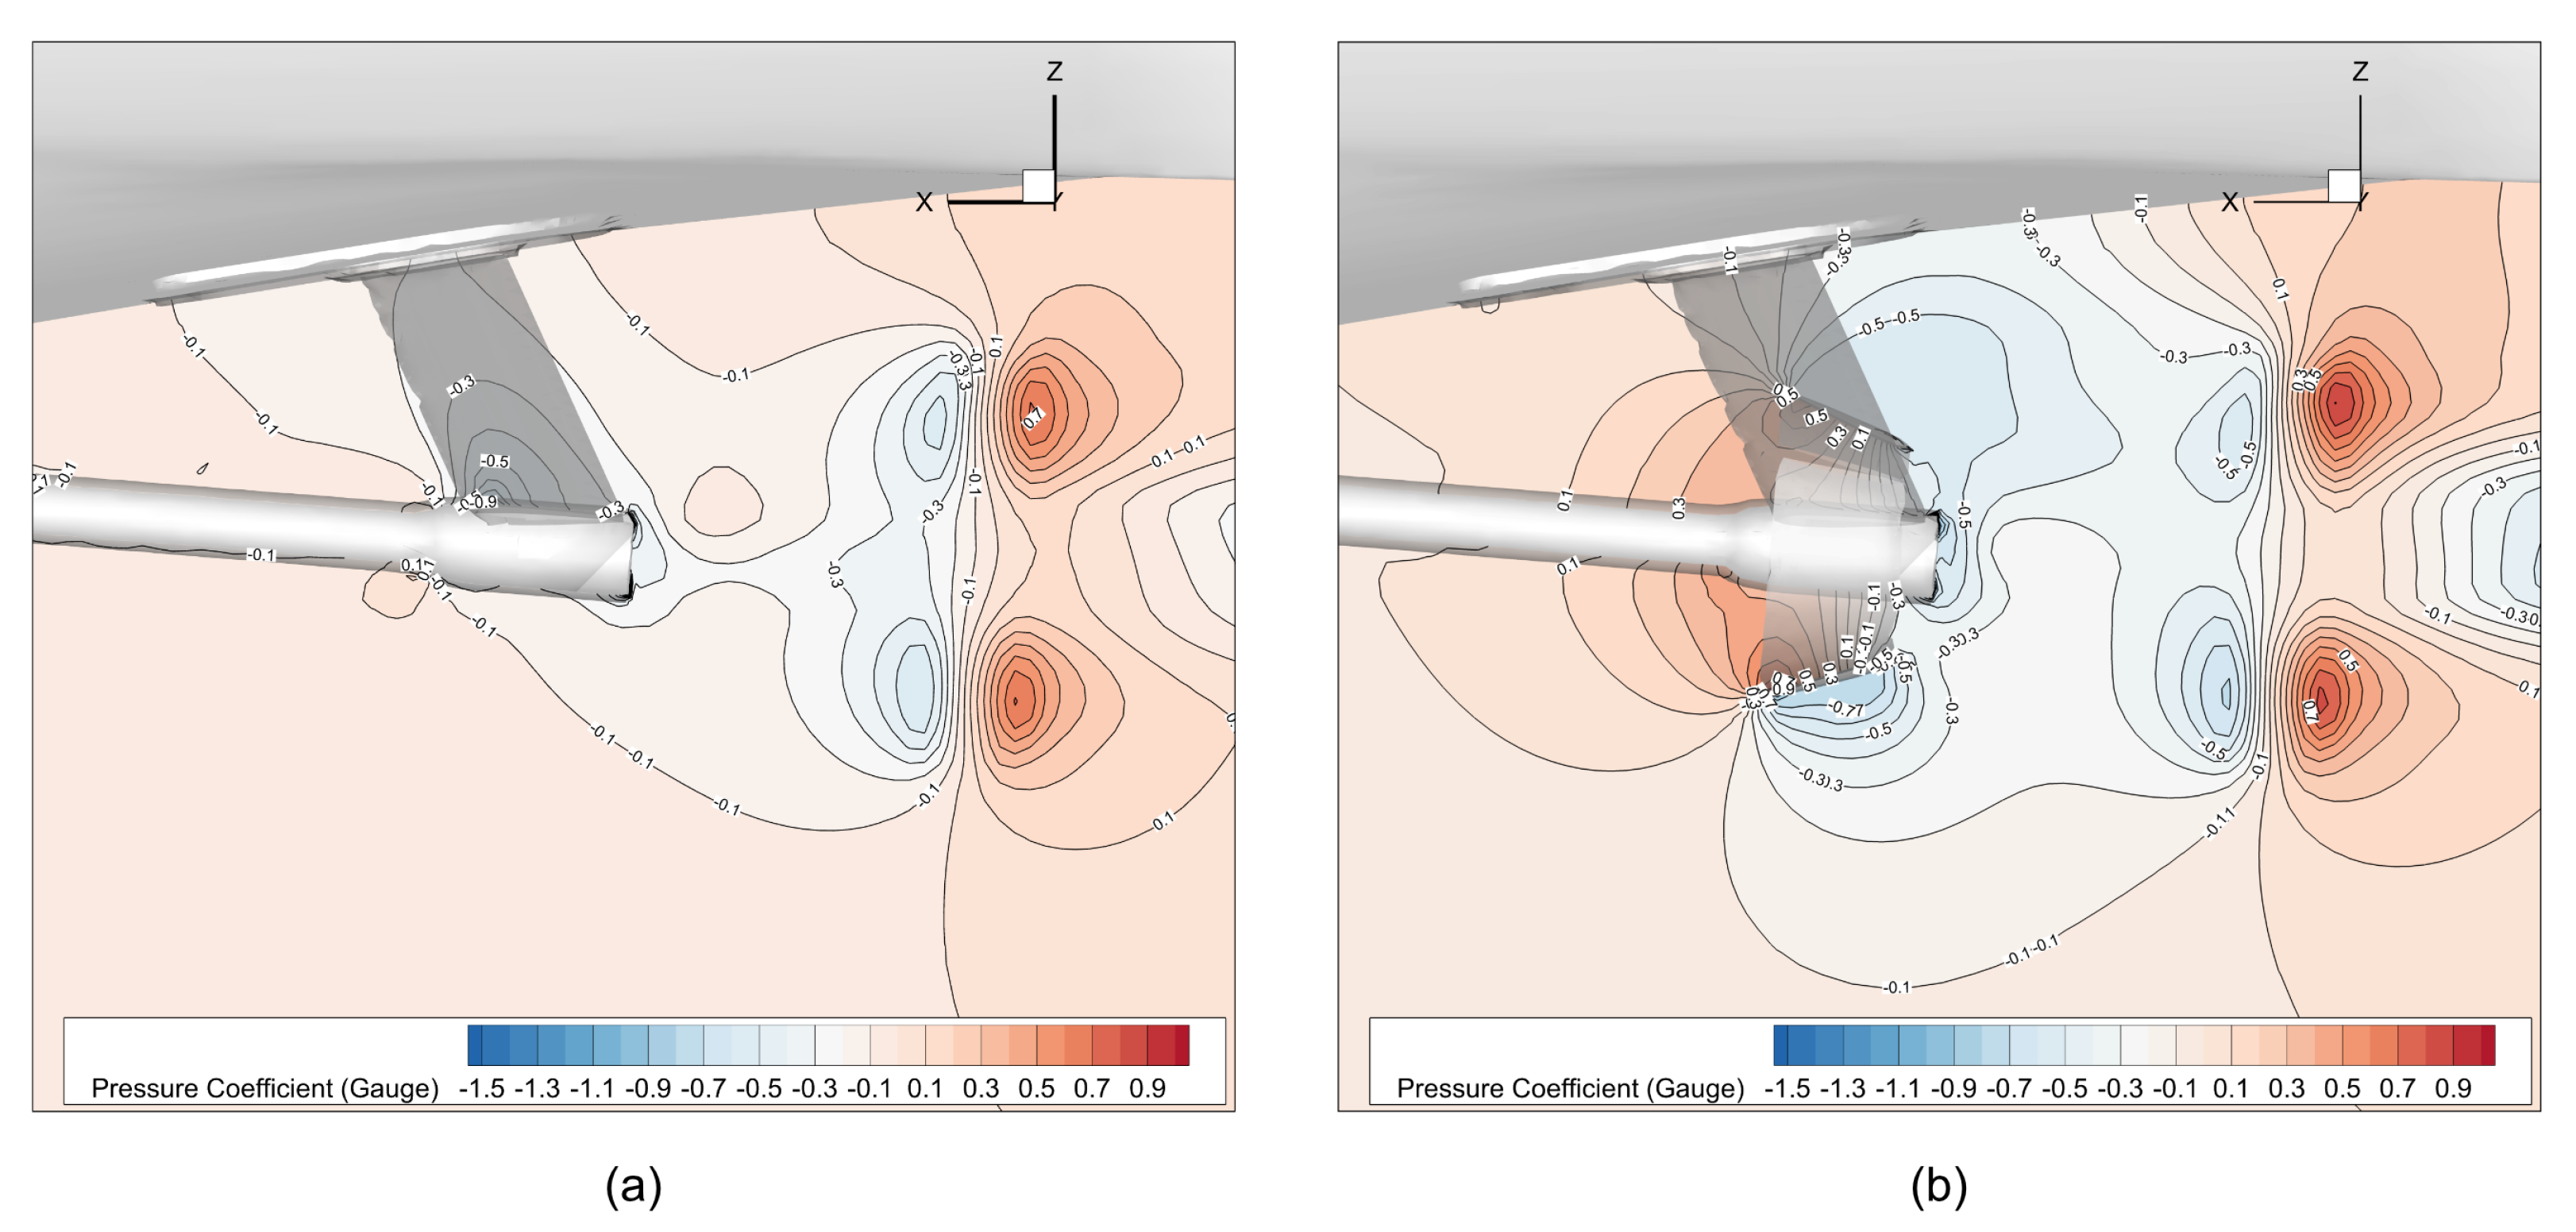
Geometric Optimization: The visualization of the pressure and axial velocity fields (
Figure 10,
Figure 12, and
Figure 13) confirms that the duct’s strongest hydrodynamic influence is concentrated in the upper quadrants above the propeller shaft. Based on this observation, a worthwhile direction for future optimization is the investigation of a ‘part duct’ or half-duct configuration, possibly spanning between the two shaft brackets. This alternative geometry aims to maintain the high-efficiency benefits while reducing the overall wetted surface, minimizing the slight resistance penalty and simplifying structural integration.
Structural Feasibility: The hydrodynamic analysis does not include a detailed structural assessment of the ducts or their connection to the hull, which is a critical consideration for practical implementation.
Additional Physics: The current study focuses on power savings. Future investigations should analyze the beneficial impact of the more uniform wake on propeller cavitation, as ESDs can be optimized not only for power savings but also to address issues like cavitation and pressure fluctuations [
33], vortex tip cavitation [
34], inception and underwater radiated noise. Furthermore, the ducts’ effect on the vessel’s maneuverability is not assessed.
Non-Calm Sea Performance: The current calm-water analysis must be extended to rough weather. We are currently awaiting field data from the vessel’s sea trials under real operational conditions (including waves) to serve as the necessary validation target for subsequent high-fidelity VOF numerical simulations aimed at quantifying the ducts’ effect on added resistance and propulsive efficiency in non-calm seas.
Financial Feasibility: While this study confirms the hydrodynamic benefits, a complete feasibility analysis for practical implementation should also assess the structural integration of the ducts and the economic viability, considering installation costs, long-term maintenance, and classification society requirements.
Ultimate Validation: For the ultimate validation of these findings, the implementation of the optimal duct will be carried out and tested. This involves the physical manufacturing and retrofitting of the duct system onto the M/Y Incal, followed by a new sea trial campaign to confirm the predicted power savings in real-world operation.

