
Acquisition of Crop Spatial Patterns Based on Remote Sensing Data from Sentinel-2 Satellite

 , ,
, ,
Abstract
:1. Introduction
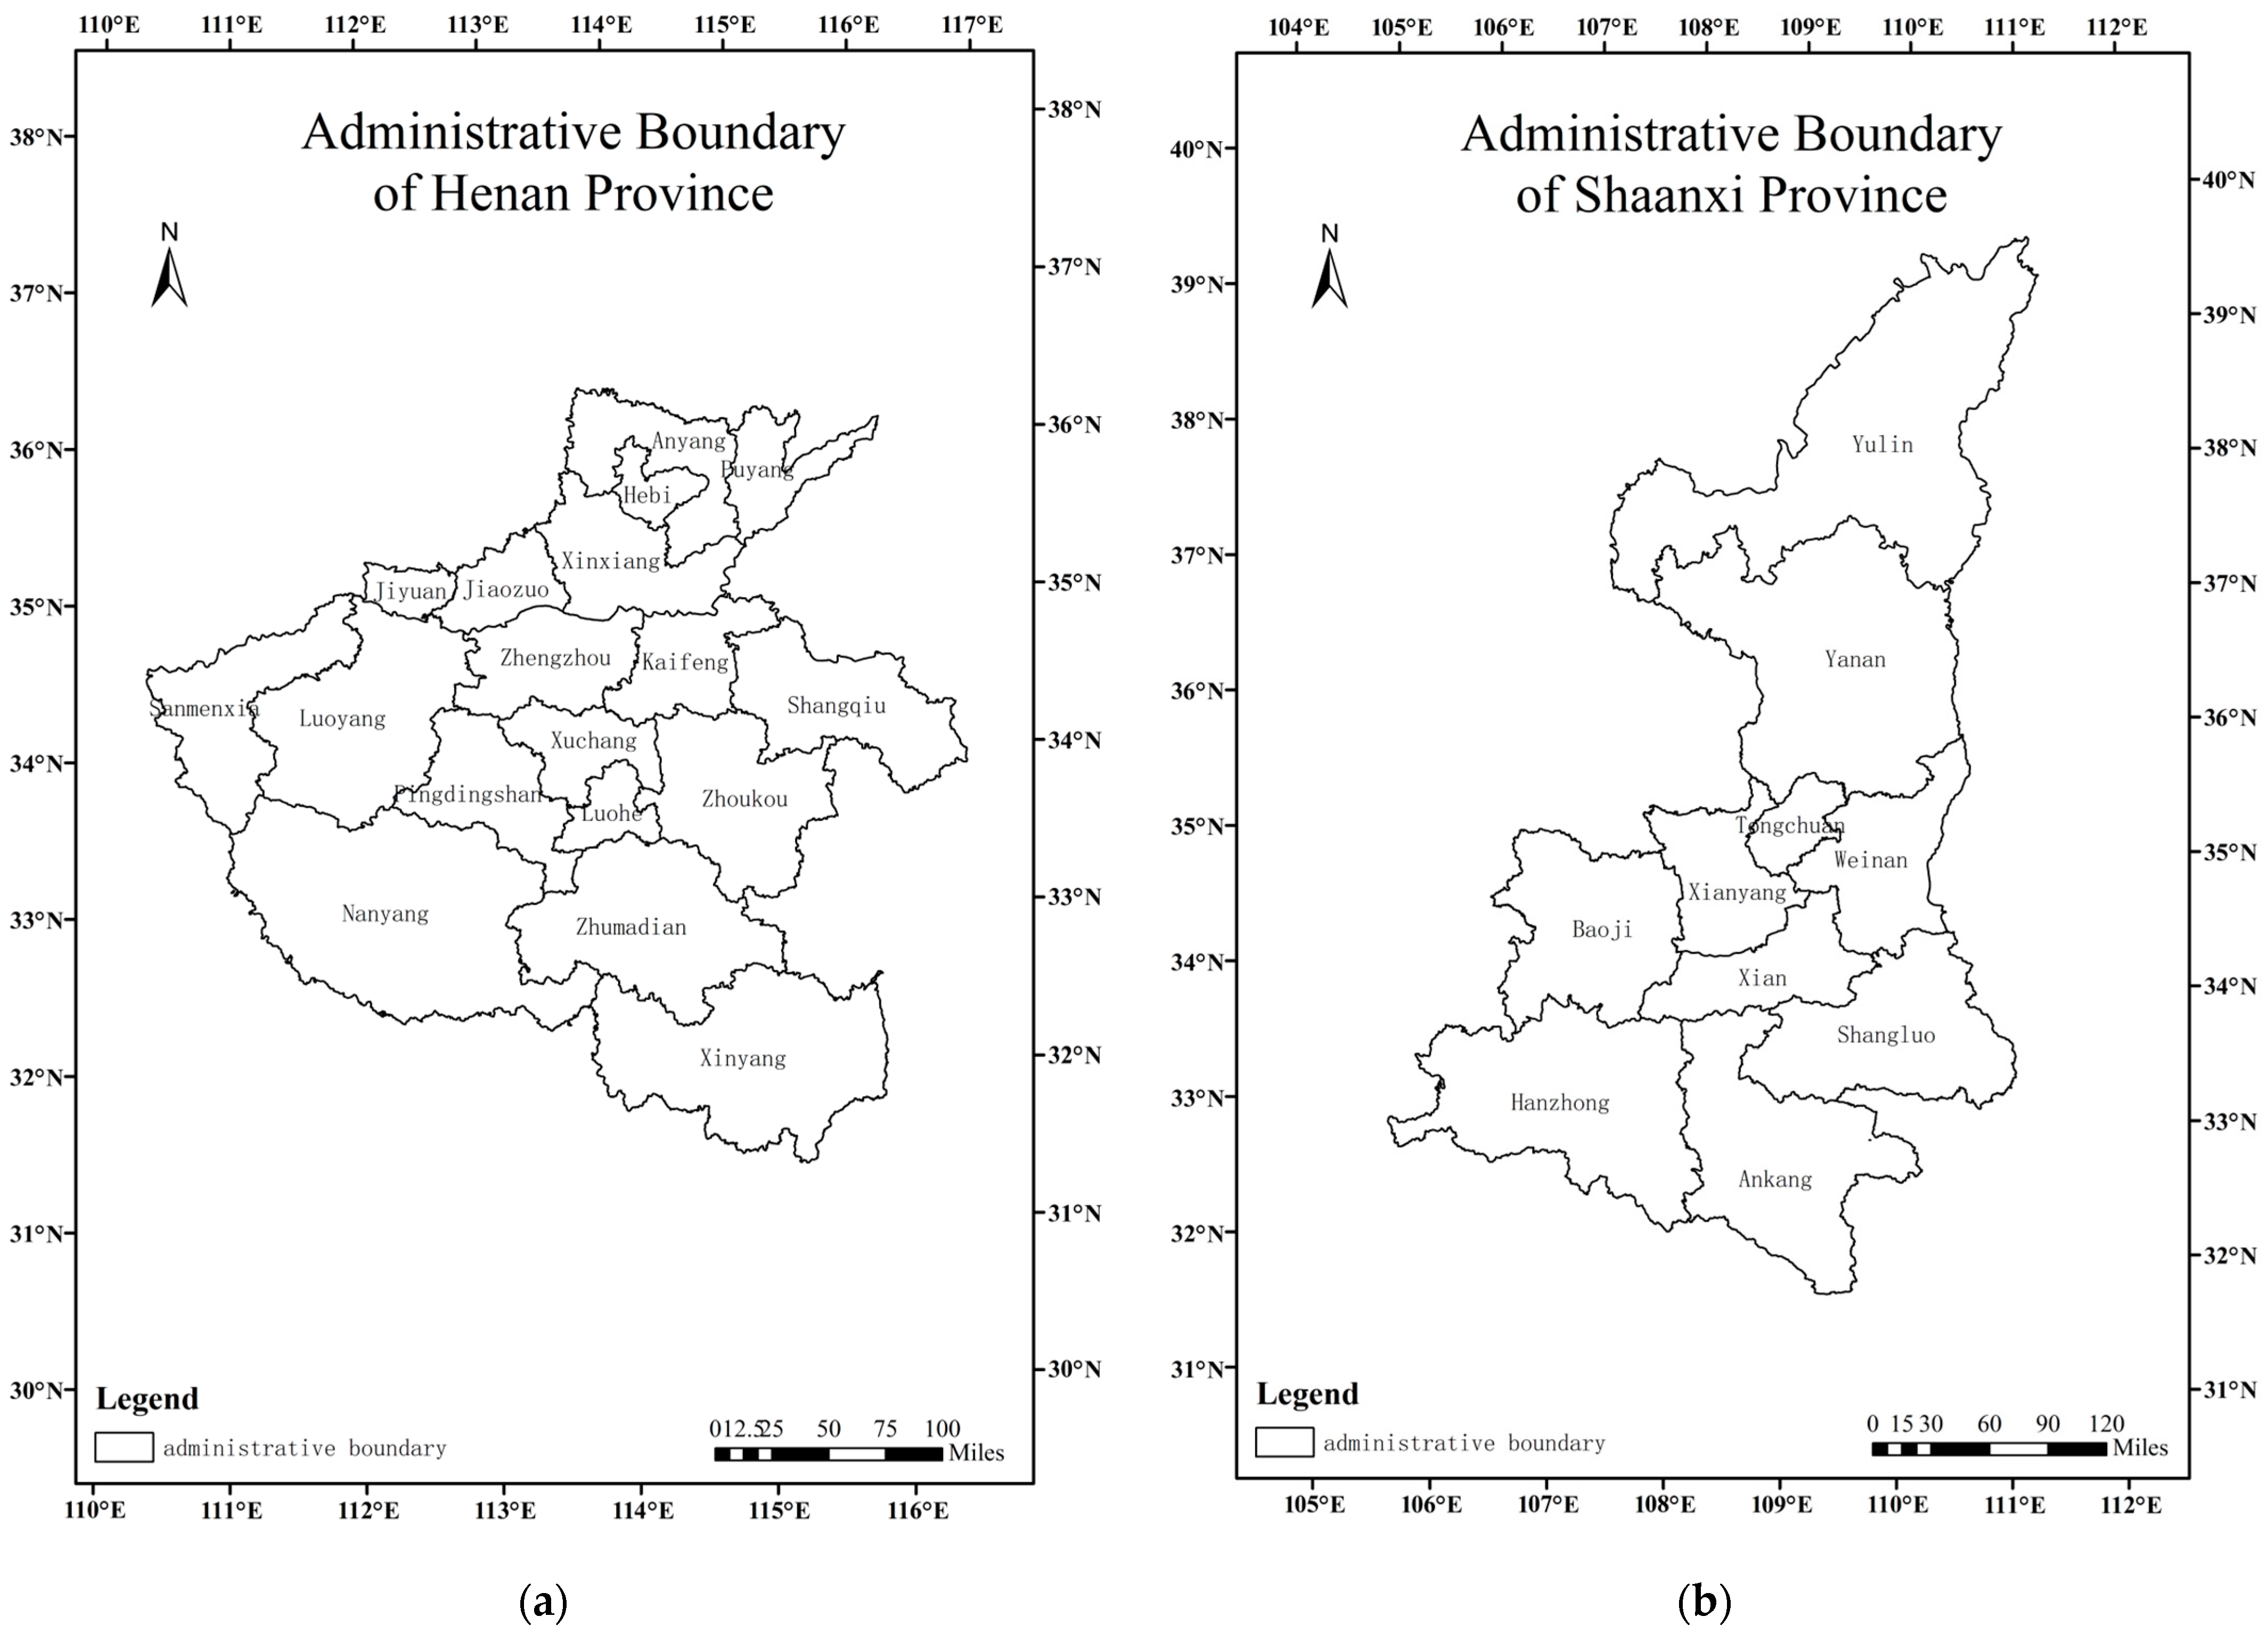
2. Research Area and Data
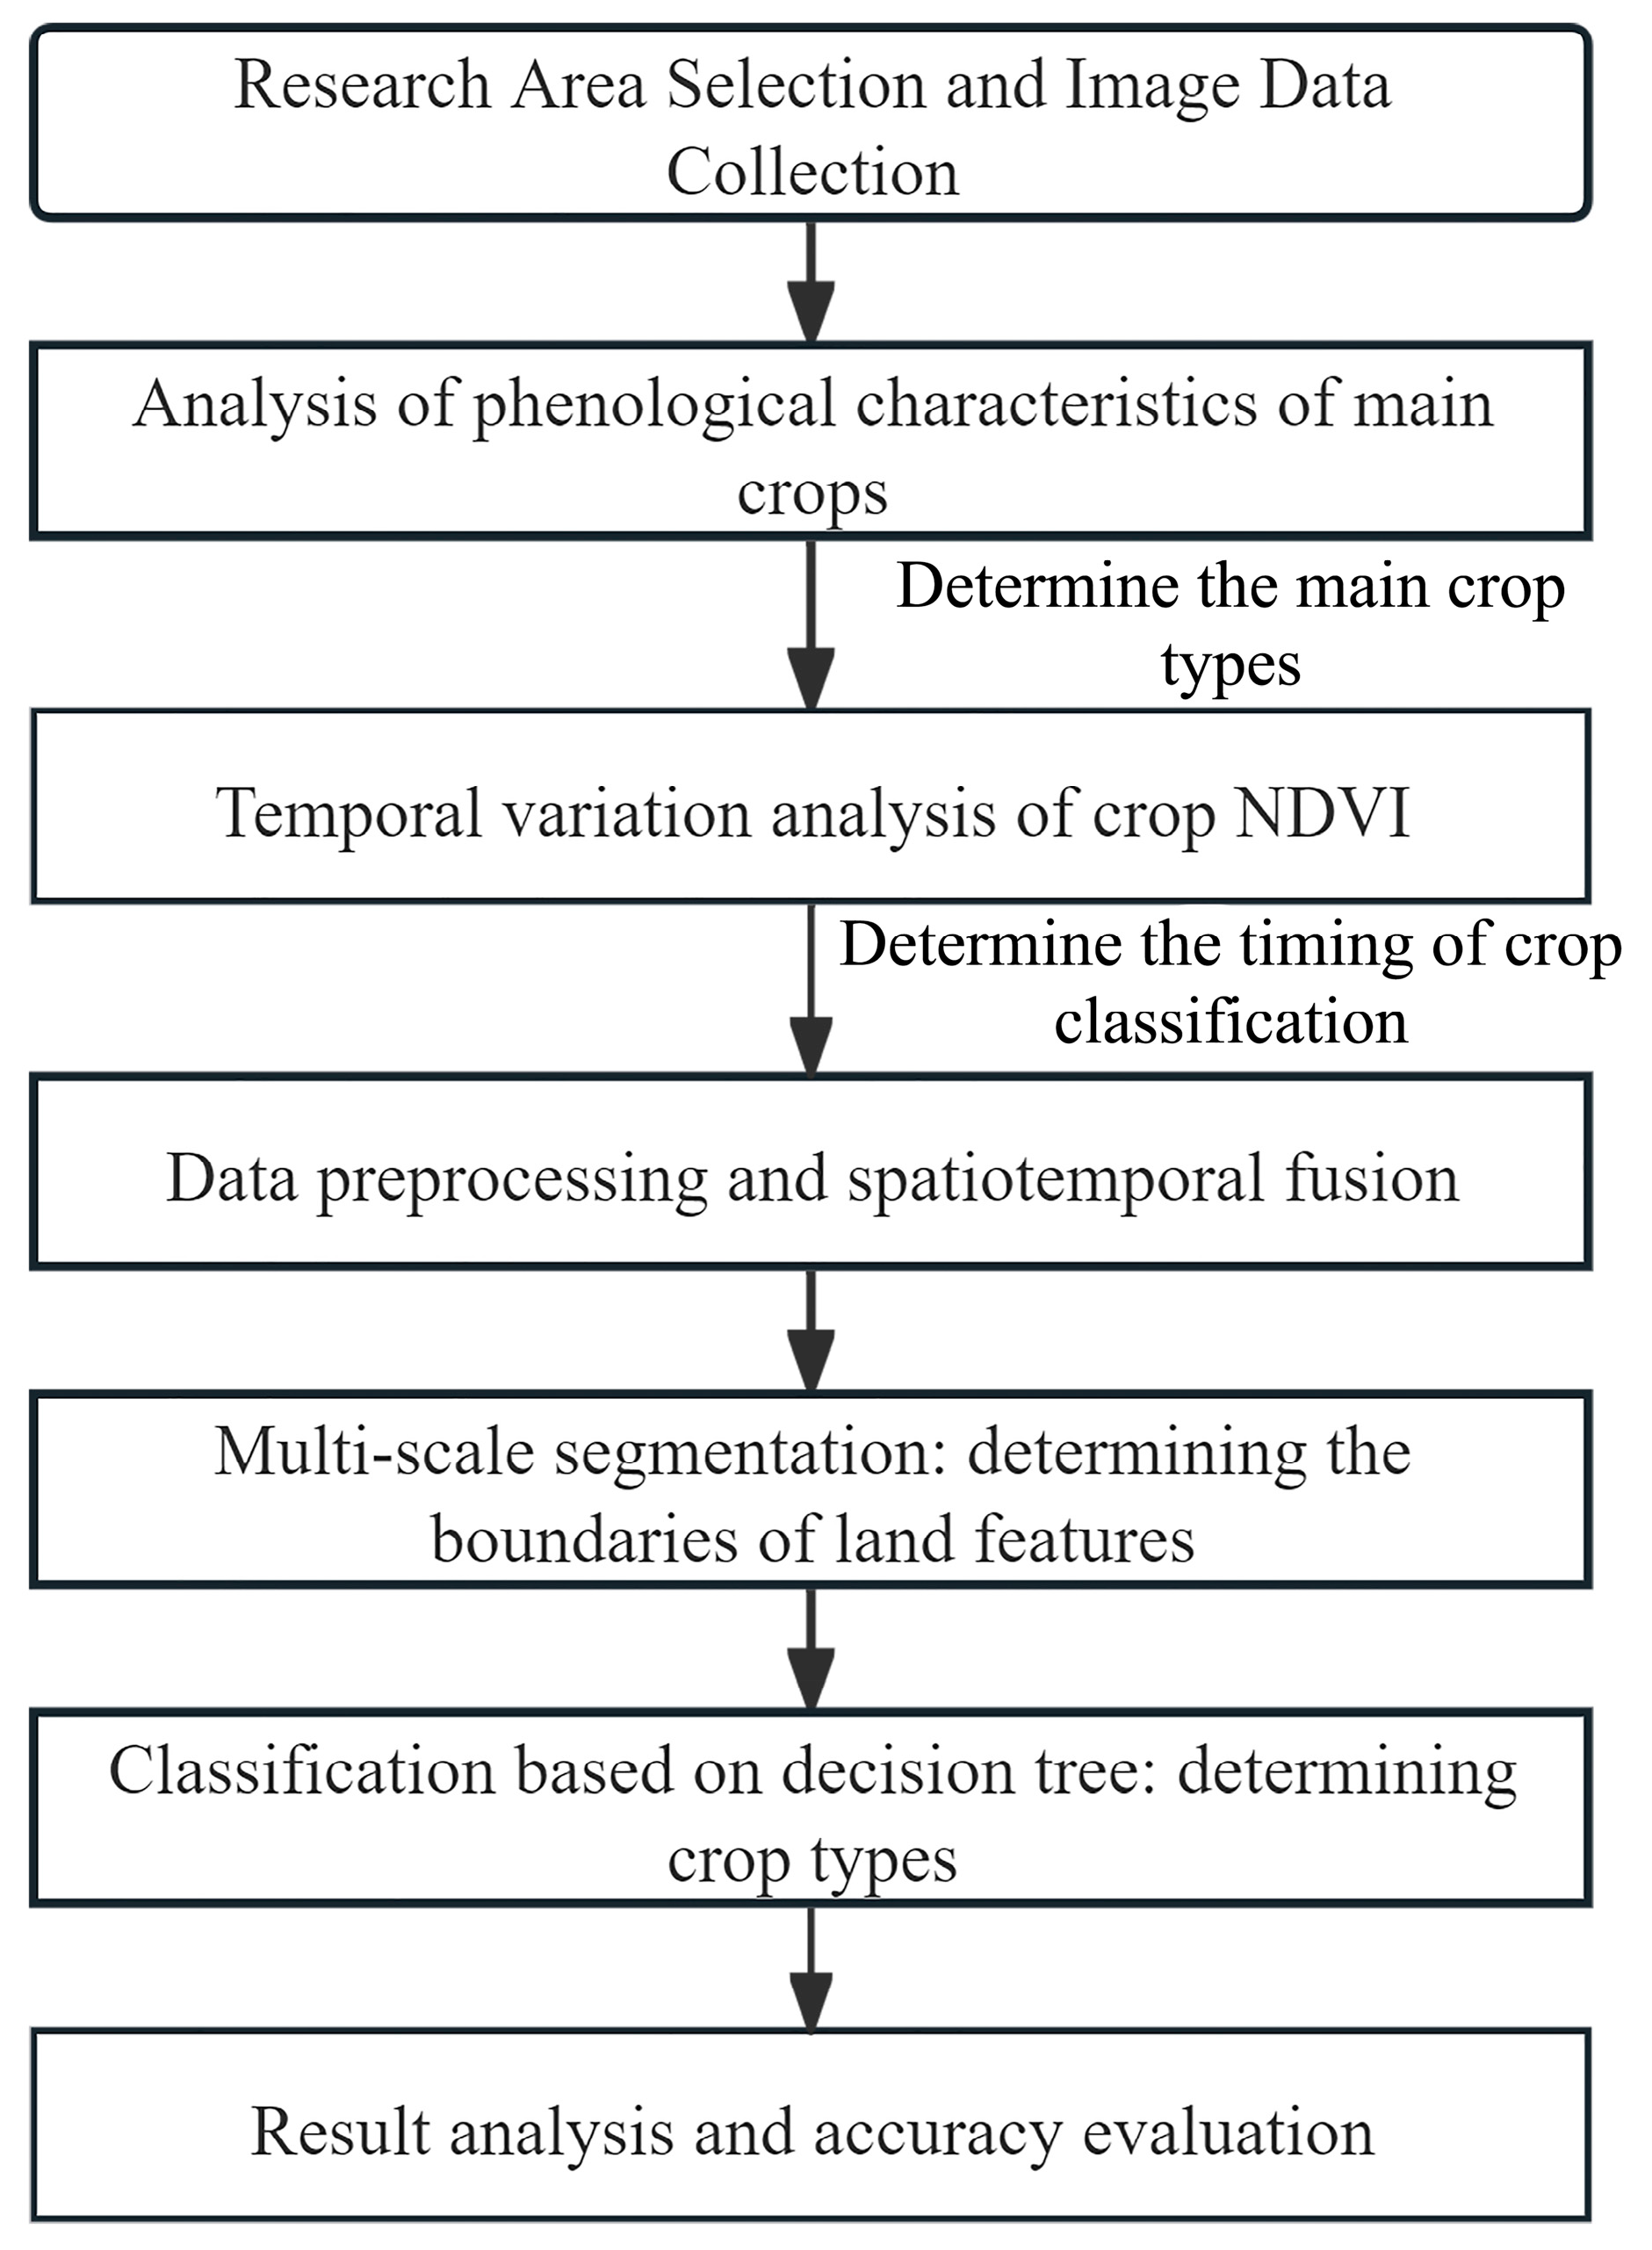
3. Research Method
3.1. Analysis of Phenological Characteristics of Main Crops
3.2. Temporal Variation Analysis of Crop NDVI
3.3. Data Processing
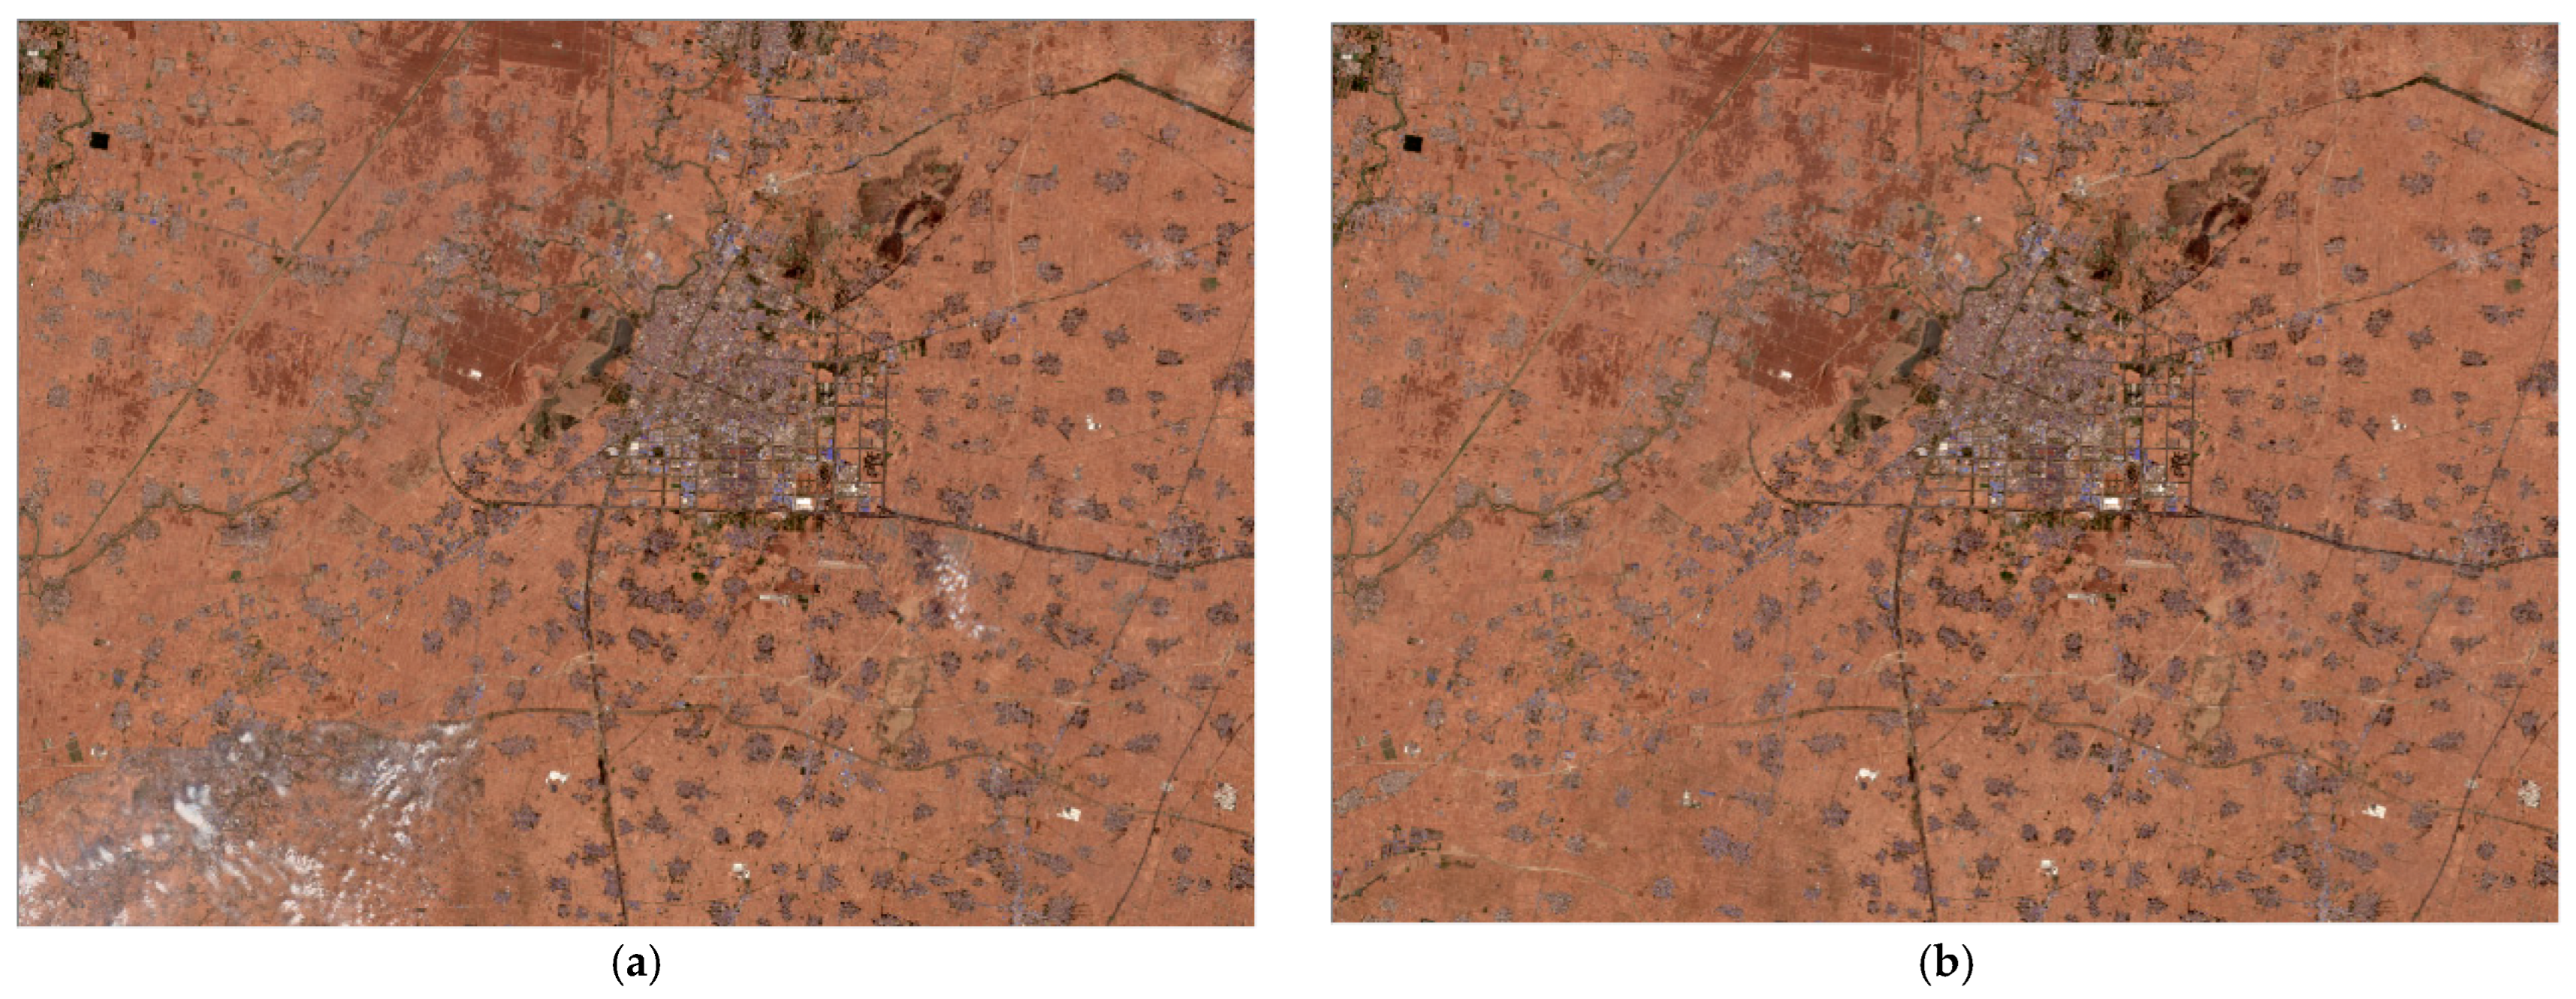
3.3.1. Data Selection and Preprocessing (Including Data Filtering for Significant Crop Distinction Periods, Spatiotemporal Data Mosaicking—Illustrated with a Single Scene)
3.3.2. Spatiotemporal Image Fusion
3.4. Extraction of CSPs
3.4.1. Multi-Scale Segmentation
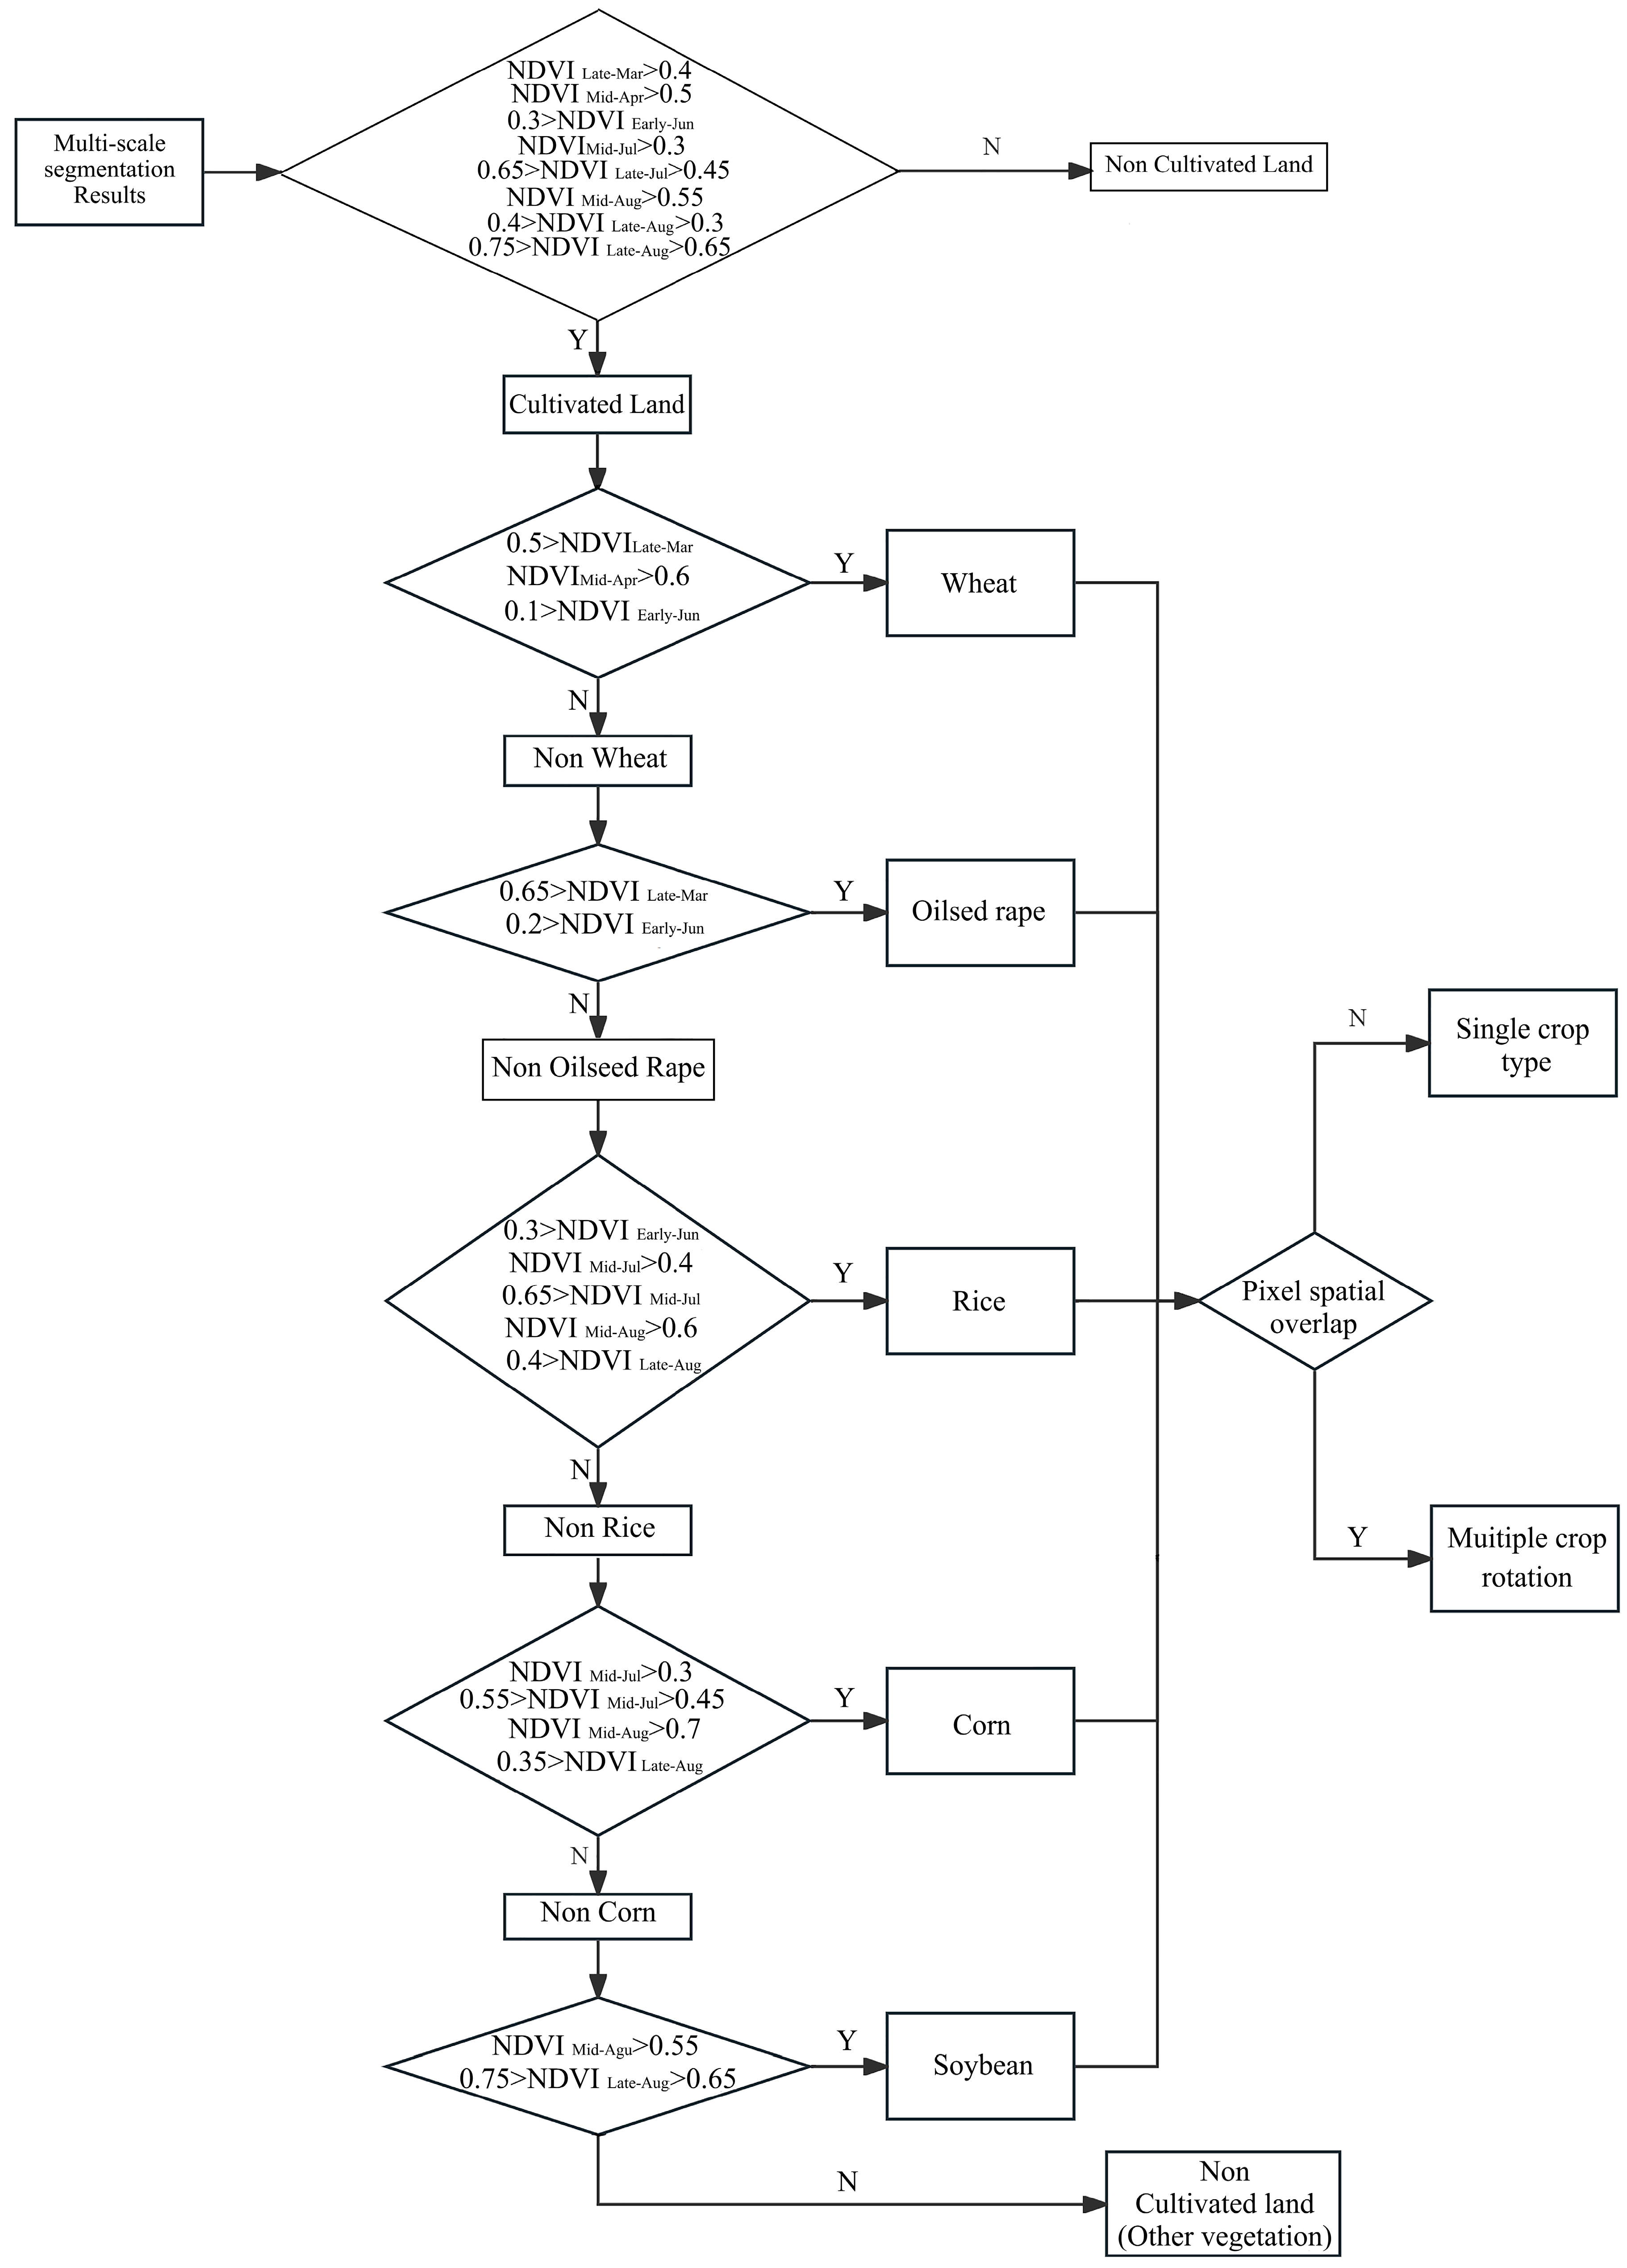
3.4.2. Extraction of Classification Decision Trees
4. Results and Validation
4.1. Accuracy Evaluation
4.1.1. Comparison with Validation Points
4.1.2. Comparison with the Third Survey
4.1.3. Comparison with the Statistical Yearbook for Validation
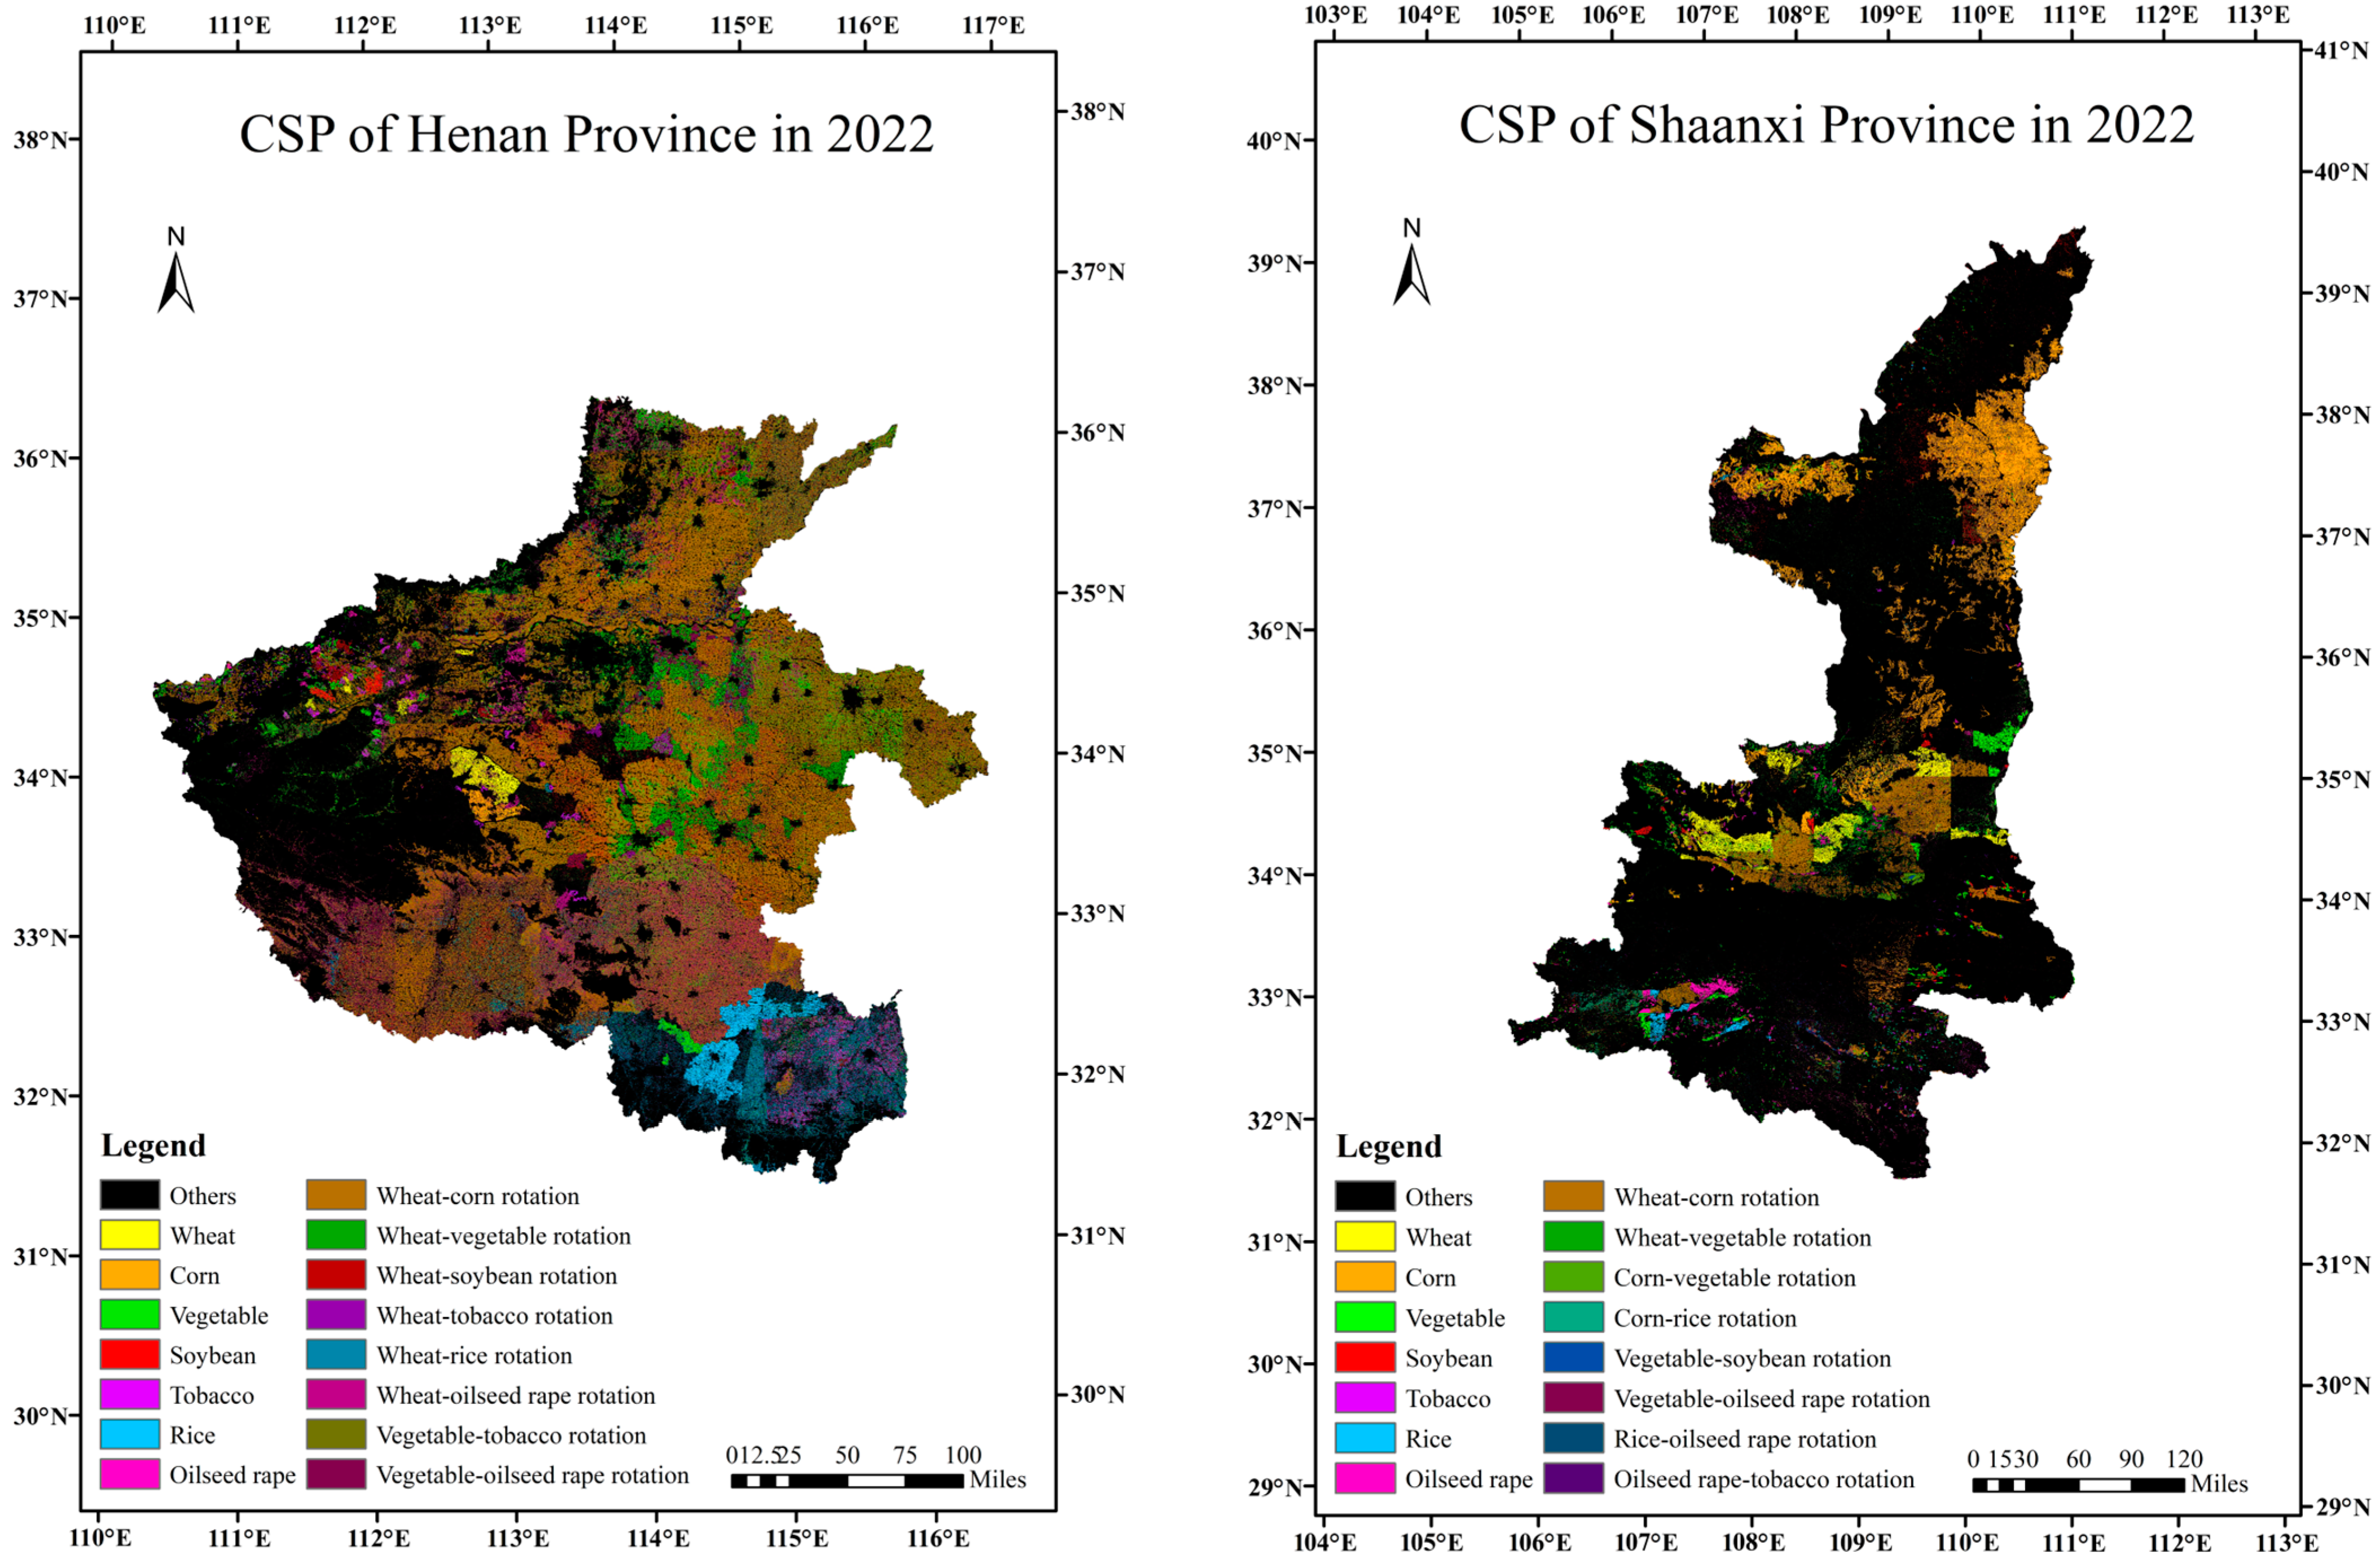
4.2. Analysis of CSP
5. Discussion
- (1)
- The integration of higher spatial resolution satellite imagery, such as the GF series, holds promise for augmenting research outcomes, particularly in overcoming the spatial limitations of Sentinel-2 imagery restricted to 10 m. Additionally, delving into more intricate spatiotemporal fusion models stands as a potential avenue for refining both the spatial and temporal resolution of the underlying data.
- (2)
- In the realm of classifying and extracting CSPs, the incorporation of supplementary image features, including texture features, is poised to enrich analytical capabilities. Furthermore, the utilization of advanced identification algorithms, such as deep learning convolutional neural networks (CNNs), presents an opportunity for achieving heightened accuracy in classification tasks.
- (3)
- This study mainly focuses on the identification and classification of phenology in mature crops, but early crop identification and extraction are crucial for agricultural planning. In future research, it may be considered to use images of crop sprouting or jointing stages for more refined classification and extraction in order to grasp the planting range and growth status of crops.
6. Conclusions
- (1)
- Through an examination of the phenology of major crops in the research area and the temporal characteristics of their Sentinel-2 multi-temporal NDVI data, specific time-phase combinations with distinct crop phenology features were identified. The effective utilization of spatiotemporal image fusion notably augmented the differentiation capabilities among different crops.
- (2)
- Building upon the outcomes of the fused images, a multi-scale segmentation approach was applied to delineate patches of different crop types. Decision tree classification rules, accounting for crop phenological differences, were formulated to facilitate the extraction of CSPs. The overall classification accuracy in both provinces achieved 91.11% and 90.12%, accompanied by Kappa coefficients of 0.897 and 0.887, respectively.
- (3)
- At the municipal level, the accuracy evaluation of the extraction results proceeded with the data from the third survey results and the 2022 statistical yearbook for validation. The assessment revealed that the extraction accuracy for both the total area occupied by crops and the area occupied by each type of crop surpassed 90% in the majority of cities.
- (4)
- In 2022, wheat and corn emerged as the most extensively cultivated crops (including rotation) in both Henan and Shaanxi provinces, collectively constituting 74.42% and 62.32% of the overall crop area, respectively. Conversely, tobacco occupied the smallest planting area, representing merely 0.99% and 0.75% of the total crop area in the respective provinces.
Supplementary Materials
Author Contributions
Funding
Institutional Review Board Statement
Data Availability Statement
Acknowledgments
Conflicts of Interest
References
- Tang, H.J. Research progress on remote sensing monitoring of crop spatial pattern. Sci. Agric. Sin. 2010, 43, 2879–2888. [Google Scholar]
- Huemmrich, K.F.; Privette, J.L.; Mukelabai, M.; Myneni, R.B.; Knyazikhin, Y. Time-series validation of MODIS land biophysical products in a Kalahari woodland, Africa. Int. J. Remote Sens. 2005, 26, 4381–4398. [Google Scholar] [CrossRef]
- Yang, N.; Liu, D.; Feng, Q.; Xiong, Q.; Zhang, L.; Ren, T.; Huang, J. Large-scale Crop Mapping Based on Machine Learning and Parallel Computation with Grids. Remote Sens. 2019, 11, 1500. [Google Scholar] [CrossRef]
- See, L.; Fritz, S.; You, L.; Ramankutty, N.; Herrero, M.; Justice, C.; Obersteiner, M. Improved Global Cropland Data as an Essential Ingredient for Food Security. Glob. Food Secur. 2015, 4, 37–45. [Google Scholar] [CrossRef]
- Shiyin, C.; Zhiyu, M. Temporal and Spatial Characteristics and Optimization of the Intensive Use of Cultivated Land in Maoming City. J. Resour. Ecol. 2020, 11, 598–605. [Google Scholar] [CrossRef]
- Xiao, P.; Qian, P.; Xu, J.; Lu, M. A Bibliometric Analysis of the Application of Remote Sensing in Crop Spatial Patterns: Current Status, Progress and Future Directions. Sustainability 2022, 14, 4104. [Google Scholar] [CrossRef]
- Lobell, D.B.; Hicke, J.A.; Asner, G.P.; Field, C.B.; Tucker, C.J.; Los, S.O. Satellite estimates of productivity and light use efficiency in United States agriculture, 1982–1998. Glob. Change Biol. 2010, 8, 722–735. [Google Scholar] [CrossRef]
- Hill, J.D.; Strommen, N.D.; Sakamoto, C.M.; Leduc, S.K. LACIE—An Application of Meteorology for United States and Foreign Wheat Assessment. J. Appl. Meteorol. 1980, 19, 22–34. [Google Scholar] [CrossRef]
- Verdcourt, B. Remarks on the Classification of the Rubiaceae. Bull. Jard. Bot. L’etat Brux./Bull. Van Den Rijksplantentuin Bruss. 1958, 28, 209–290. [Google Scholar] [CrossRef]
- Curran, P.J. Multispectral Remote Sensing of Vegetation Amount. Prog. Phys. Geogr. 1980, 4, 315–341. [Google Scholar] [CrossRef]
- Kauth, R.J.; Lambeck, P.F.; Richardson, W.; Thomas, G.S.; Pentland, A.P. Feature extraction applied to agricultural crops as seen by LANDSAT. In Proceedings of the LACIE Symposium: 13–16 August 1979; NASA: Housto, TX, USA, 1979. [Google Scholar]
- Guoping, Z.; Jiyuan, L.; Zengxiang, Z. Spatial-temporal Changes of Cropland in China for the Past10Years Based on Remote Sensing. Acta Geogr. Sin. 2003, 58, 323–332. [Google Scholar]
- Liu, J.; Liu, M.; Tian, H.; Zhuang, D.; Zhang, Z.; Zhang, W.; Deng, X. Spatial and temporal patterns of China’s cropland during 1990–2000: An analysis based on Landsat TM data. Remote Sens. Environ. 2005, 98, 442–456. [Google Scholar] [CrossRef]
- Wardlow, B.D.; Egbert, S.L. Large-area crop mapping using time-series MODIS 250 m NDVI data: An assessment for the US Central Great Plains. Remote Sens. Environ. 2008, 112, 1096–1116. [Google Scholar] [CrossRef]
- Xun, L.; Wang, P.; Li, L.; Wang, L.; Kong, Q. Identifying crop planting areas using Fourier-transformed feature of time series MODIS leaf area index and sparse-representation-based classification in the North China Plain. Int. J. Remote Sens. 2019, 40, 2034–2052. [Google Scholar] [CrossRef]
- Ren, S.; Guo, B.; Wu, X.; Zhang, L.; Ji, M.; Wang, J. Winter wheat planted area monitoring and yield modeling using MODIS data in the Huang-Huai-Hai Plain, China. Comput. Electron. Agric. 2021, 182, 106049. [Google Scholar] [CrossRef]
- Vuolo, F.; Neuwirth, M.; Immitzer, M.; Atzberger, C.; Ng, W.T. How much does multi-temporal Sentinel-2 data improve crop type classification? Int. J. Appl. Earth Obs. Geoinf. 2018, 72, 122–130. [Google Scholar] [CrossRef]
- Liao, C.; Wang, J.; Xie, Q.; Baz, A.A.; Huang, X.; Shang, J.; He, Y. Synergistic Use of multi-temporal RADARSAT-2 and VENμS data for crop classification based on 1D convolutional neural network. Remote Sens. 2020, 12, 832. [Google Scholar] [CrossRef]
- Qian SO, N.G.; Zhou, Q.B.; Wu, W.B.; Qiong, H.U.; Miao, L.U.; Liu, S.B. Mapping regional cropping patterns by using GF-1 WFV sensor data. J. Integr. Agric. 2017, 16, 337–347. [Google Scholar]
- Torbick, N.; Huang, X.; Ziniti, B.; Johnson, D.; Masek, J.; Reba, M. Fusion of moderate resolution earth observations for operational crop type mapping. Remote Sens. 2018, 10, 1058. [Google Scholar] [CrossRef]
- Xia, T.; He, Z.; Cai, Z.; Wang, C.; Wang, W.; Wang, J.; Song, Q. Exploring the potential of Chinese GF-6 images for crop mapping in regions with complex agricultural landscapes. Int. J. Appl. Earth Obs. Geoinf. 2022, 107, 102702. [Google Scholar] [CrossRef]
- Yi, Z.; Jia, L.; Chen, Q. Crop classification using multi-temporal Sentinel-2 data in the Shiyang River Basin of China. Remote Sens. 2020, 12, 4052. [Google Scholar] [CrossRef]
- Knauer, K.; Gessner, U.; Dech, S.; Kuenzer, C. Remote sensing of vegetation dynamics in West Africa. Int. J. Remote Sens. 2014, 35, 6357–6396. [Google Scholar] [CrossRef]
- Zhu, X.; Zhan, W.; Zhou, J.; Chen, X.; Liang, Z.; Xu, S.; Chen, J. A novel framework to assess all-round performances of spatiotemporal fusion models. Remote Sens. Environ. 2022, 274, 113002. [Google Scholar] [CrossRef]
- Qian, Q.J.; Xie, R.; Zhang, L.; Yan, C.Z. Research on Object-Oriented Land Cover Information Extraction Method. Remote Sens. Technol. Appl. 2005, 20, 338–342. [Google Scholar]
- Li, H.L.; Dai, S.P.; Hu, Y.Y.; Zhu, P.J.; Li, M.F.; Zheng, Q.; Luo, H.X.; Yu, X. Progress and Development of Crop Spatial Pattern Research. J. Trop. Crops 2023, 44, 2537–2545. [Google Scholar]
- Tang, C.G. The role of remote sensing technology in monitoring the spatial pattern of crops. Sci. Technol. Inf. 2021, 19, 79–81. [Google Scholar]
- Li, J.R. Research progress on remote sensing monitoring of crop spatial pattern. Rural. Pract. Technol. 2020, 4, 56. [Google Scholar]
- Ye, Q.; Yang, F.H.; Liu, H.J.; Meng, X.T.; Guan, H.X.; Cui, Y. Remote sensing yield estimation and spatial pattern analysis of maize at the field scale using terrain features. Sci. Technol. Eng. 2021, 21, 10215–10221. [Google Scholar]
- Wang, S.Y.; Liu, J.S.; Ma, T.B. Dynamics and changes in spatial patterns of land use in Yellow River Basin, China. Land Use Policy 2010, 27, 313–323. [Google Scholar] [CrossRef]
- Li, X.; Xu, X.; Wang, J.; Wu, H.; Jing, X.; Li, C.; Bao, Y. Crop classification recognition based on time-series images from HJ satellite. Trans. Chin. Soc. Agric. Eng. 2013, 29, 2013. [Google Scholar]
- Lei, L. Study on crops classification based on multi-spectral image and decision tree method. J. Anhui Agric. Sci. 2011, 179, 1703–1706+1710. [Google Scholar]
- Dong, S.W.; Sun, D.F.; Li, H. Crop Decision Tree Classification Extraction Based on MODIS NDVI in Beijing. Adv. Mater. Res. 2014, 955, 787–790. [Google Scholar] [CrossRef]
- Zhang, H.; Wang, Z.; Li, Z.; Liu, X.; Wang, K.; Sun, S.; Gao, Z. Extracting the winter wheat using the decision tree based on time series dual-polarization SAR feature and NDVI. PLoS ONE 2024, 19, e0302882. [Google Scholar] [CrossRef] [PubMed]


| Province | City | Time Phase |
|---|---|---|
| Henan | Zhengzhou | Early April, Early June, Early July, Late July, Mid-August |
| Kaifeng | Late March, Early April, Mid-June, Early July, Late July | |
| Luoyang | Mid-March, Late April, Early May, Late May, Mid-July | |
| Henan | Pingdingshan | Early April, Early June, Mid-June, Mid-August |
| Anyang | Late March, Early June, Late July, Early September | |
| Hebi | Late May, Mid-June, Late July, Early September | |
| Xinxiang | Early May, Late May, Mid-June, Late July, Early August, Early September | |
| Jiaozuo | Early April, Early May, Mid-May | |
| Puyang | Late March, Mid-April, Mid-June, Early July, Mid-September | |
| Xuchang | Early May, Early June, Early August | |
| Luohe | Early June, Late July, Early October | |
| Sanmenxia | Mid-April, Early May, Late June, Late September | |
| Nanyang | Mid-May, Mid-June, Mid-July, Early September, Late September | |
| Shangqiu | Late May, Early June, Early July, Mid-August | |
| Xinyang | Mid-March, Late May, Late June, Early August, Early September, Mid-September | |
| Zhoukou | Mid-April, Mid-May, Mid-June, Late July, Early September | |
| Zhumadian | Mid-May, Early June, Late July, Mid-August | |
| Jiyuan | Late March, Early April, Early July, Late July | |
| Shaanxi | Xi’an | Early March, Early August, Early September |
| Tongchuan | Mid-March, Late April, Early August | |
| Baoji | Early March, Early April, Late May, Early August | |
| Xianyang | Early April, Early August, Mid-August | |
| Weinan | Mid-March, Late April, Mid-May, Early August | |
| Yan’an | Early March, Mid-June, Mid-September | |
| Hanzhong | Early March, Late April, Early July, Mid-August | |
| Yulin | Late June, Early July, Mid-July, Early August, Mid-September | |
| Ankang | Mid-April, Late April, Mid-October | |
| Shangluo | Mid-March, Early April, Late May, Late July, Mid-September |
| Province | City | Cultivated Land Area from the Third Survey (km2) | Cultivated Land Area from the Extraction Results (km2) | Accuracy (%) |
|---|---|---|---|---|
| Henan Province | Zhengzhou | 2068 | 2262.54 | 90.59 |
| Kaifeng | 3996 | 4323.37 | 91.81 | |
| Luoyang | 3447 | 3520.25 | 97.88 | |
| Pingdingshan | 3136 | 3295.31 | 94.92 | |
| Anyang | 3792 | 3946.33 | 95.93 | |
| Hebi | 1133 | 1035.89 | 91.43 | |
| Xinxiang | 4558 | 4713.39 | 96.59 | |
| Jiaozuo | 1820 | 1858.88 | 97.86 | |
| Puyang | 2529 | 2705.63 | 93.02 | |
| Xuchang | 2681 | 2768.75 | 96.73 | |
| Luohe | 1827 | 1991.07 | 91.02 | |
| Sanmenxia | 1447 | 1405.84 | 97.16 | |
| Nanyang | 9874 | 10,006.35 | 98.66 | |
| Shangqiu | 7010 | 7548.23 | 92.32 | |
| Xinyang | 7946 | 7568.59 | 95.25 | |
| Zhoukou | 8428 | 8863.20 | 94.84 | |
| Zhumadian | 9329 | 9800.90 | 94.94 | |
| Jiyuan | 329 | 317.60 | 96.54 | |
| Shaanxi Province | Xi’an | 1412 | 1528.64 | 91.74 |
| Tongchuan | 879 | 878.12 | 99.90 | |
| Baoji | 2725 | 2753.77 | 98.94 | |
| Xianyang | 3288 | 3290.94 | 99.91 | |
| Weinan | 3990 | 4009.02 | 99.52 | |
| Yan’an | 2615 | 2652.34 | 98.57 | |
| Hanzhong | 2584 | 2720.85 | 94.70 | |
| Yulin | 9485 | 9500.25 | 99.84 | |
| Ankang | 1773 | 1856.45 | 95.29 | |
| Shangluo | 1143 | 1186.35 | 96.21 |
| Province | City | Statistical Results | Crop Type | ||||||
|---|---|---|---|---|---|---|---|---|---|
| Wheat | Rice | Corn | Oilseed Rape | Vegetables | Soybean | Tobacco | |||
| Henan Province | Zhengzhou | Statistical yearbook (km2) | 1360.90 | 1.70 | 1278.70 | 298.70 | 605.60 | 33.10 | 0.20 |
| Extraction results (km2) | 1357.34 | - | 1279.45 | 298.72 | 606.47 | 33.49 | - | ||
| Accuracy (%) | 99.74 | - | 99.94 | 99.99 | 99.86 | 98.83 | - | ||
| Kaifeng | Statistical yearbook (km2) | 3026.70 | 52.70 | 1876.70 | 1085.30 | 2285.10 | 116.30 | - | |
| Extraction results (km2) | 2850.53 | 53.03 | 1877.64 | 1048.48 | 2084.28 | 115.72 | - | ||
| Accuracy (%) | 94.18 | 99.38 | 99.95 | 96.67 | 91.21 | 99.54 | - | ||
| Luoyang | Statistical yearbook (km2) | 2320.70 | 12.40 | 1965.50 | 382.40 | 743.60 | 144.10 | 181.60 | |
| Extraction results (km2) | 2469.50 | 12.66 | 1968.23 | 380.62 | 728.06 | 139.44 | 183.24 | ||
| Accuracy (%) | 93.59 | 97.94 | 99.86 | 99.53 | 97.91 | 96.77 | 99.94 | ||
| Pingdingshan | Statistical yearbook (km2) | 2205.70 | 10.90 | 1973.60 | 439.50 | 532.00 | 127.10 | 96.10 | |
| Extraction results (km2) | 2407.71 | 11.21 | 1852.86 | 411.41 | 539.25 | 127.90 | 96.89 | ||
| Accuracy (%) | 9.84 | 97.14 | 93.88 | 93.68 | 98.64 | 99.37 | 99.18 | ||
| Anyang | Statistical yearbook (km2) | 2906.30 | 0.10 | 2515.60 | 507.30 | 1003.70 | 35.20 | - | |
| Extraction results (km2) | 2989.17 | - | 2516.40 | 518.15 | 1063.12 | 32.67 | - | ||
| Accuracy (%) | 97.15 | - | 99.97 | 97.86 | 94.83 | 92.82 | - | ||
| Hebi | Statistical yearbook (km2) | 900.70 | - | 782.10 | 133.90 | 112.60 | 1.40 | - | |
| Extraction results (km2) | 924.52 | - | 790.63 | 133.89 | 111.37 | - | - | ||
| Accuracy (%) | 97.36 | - | 98.99 | 100.00 | 98.93 | - | - | ||
| Xinxiang | Statistical yearbook (km2) | 3877.60 | 86.70 | 3092.70 | 774.60 | 683.30 | 92.30 | - | |
| Extraction results (km2) | 4051.63 | 87.37 | 3105.69 | 765.13 | 661.76 | 93.44 | - | ||
| Accuracy (%) | 95.51 | 99.23 | 99.58 | 98.78 | 96.85 | 98.76 | - | ||
| Jiaozuo | Statistical yearbook (km2) | 1500.10 | 7.10 | 1263.90 | 251.40 | 339.30 | 19.60 | - | |
| Extraction results (km2) | 1528.54 | 7.23 | 1264.88 | 252.86 | 330.34 | 20.42 | - | ||
| Accuracy (%) | 98.15 | 98.13 | 99.92 | 99.42 | 97.36 | 95.84 | - | ||
| Puyang | Statistical yearbook (km2) | 2316.00 | 175.70 | 1532.70 | 204.00 | 619.40 | 226.20 | - | |
| Extraction results (km2) | 2190.24 | 174.31 | 1534.04 | 204.68 | 619.02 | 226.43 | - | ||
| Accuracy (%) | 94.58 | 99.21 | 99.91 | 99.67 | 99.94 | 99.90 | - | ||
| Xuchang | Statistical yearbook (km2) | 2304.90 | - | 1535.90 | 210.00 | 449.60 | 415.50 | 96.60 | |
| Extraction results (km2) | 2436.01 | - | 1540.73 | 203.25 | 412.65 | 415.52 | 106.58 | ||
| Accuracy (%) | 94.31 | - | 99.69 | 96.78 | 91.78 | 99.99 | 89.67 | ||
| Luohe | Statistical yearbook (km2) | 1472.50 | - | 928.80 | 159.60 | 749.90 | 295.80 | 35.40 | |
| Extraction results (km2) | 1590.77 | - | 941.43 | 158.46 | 702.36 | 295.39 | 34.73 | ||
| Accuracy (%) | 91.97 | - | 98.65 | 99.28 | 93.66 | 99.86 | 98.98 | ||
| Sanmenxia | Statistical yearbook (km2) | 751.70 | - | 602.70 | 92.20 | 362.40 | 146.70 | 162.30 | |
| Extraction results (km2) | 800.91 | - | 603.10 | 88.64 | 354.70 | 147.11 | 161.59 | ||
| Accuracy (%) | 93.45 | - | 99.93 | 96.13 | 97.87 | 99.72 | 99.56 | ||
| Nanyang | Statistical yearbook (km2) | 7283.70 | 328.50 | 4678.60 | 3520.80 | 2762.40 | 272.50 | 131.30 | |
| Extraction results (km2) | 7311.84 | 328.88 | 4678.62 | 3392.28 | 2694.51 | 273.81 | 131.42 | ||
| Accuracy (%) | 99.61 | 99.88 | 100.00 | 96.35 | 97.54 | 99.52 | 99.97 | ||
| Shangqiu | Statistical yearbook (km2) | 6055.80 | - | 4457.10 | 796.90 | 2787.20 | 349.80 | 3.00 | |
| Extraction results (km2) | 5995.50 | - | 4257.78 | 804.19 | 2692.05 | 348.41 | - | ||
| Accuracy (%) | 99.42 | - | 95.53 | 99.85 | 96.59 | 99.64 | - | ||
| Xinyang | Statistical yearbook (km2) | 3128.00 | 5000.00 | 156.20 | 1644.30 | 1593.20 | 36.10 | 3.40 | |
| Extraction results (km2) | 3196.82 | 4981.29 | 156.65 | 1642.08 | 1592.95 | 35.37 | - | ||
| Accuracy (%) | 97.80 | 99.63 | 99.71 | 99.86 | 99.98 | 97.98 | - | ||
| Zhoukou | Statistical yearbook (km2) | 7346.10 | 1.40 | 5428.20 | 944.40 | 3306.30 | 736.50 | 8.40 | |
| Extraction results (km2) | 7287.92 | - | 4999.24 | 877.52 | 3021.65 | 680.11 | 8.01 | ||
| Accuracy (%) | 99.28 | - | 92.98 | 92.92 | 91.40 | 92.34 | 95.39 | ||
| Zhumadian | Statistical yearbook (km2) | 7931.60 | 275.40 | 4388.30 | 3375.90 | 1427.90 | 243.60 | 40.80 | |
| Extraction results (km2) | 8371.79 | 274.09 | 4439.09 | 3378.52 | 1429.11 | 244.77 | 40.87 | ||
| Accuracy (%) | 94.45 | 99.52 | 98.84 | 99.92 | 99.92 | 99.52 | 99.84 | ||
| Jiyuan | Statistical yearbook (km2) | 218.20 | 0.40 | 200.50 | 7.10 | 51.30 | 13.10 | 4.90 | |
| Extraction results (km2) | 236.85 | - | 218.47 | 7.35 | 54.91 | 13.14 | 5.34 | ||
| Accuracy (%) | 91.45 | - | 91.37 | 96.43 | 92.96 | 99.70 | 9.95 | ||
| Shaanxi Province | Xi’an | Statistical yearbook (km2) | 1402.35 | 1.67 | 1107.97 | 36.30 | 710.60 | 28.93 | - |
| Extraction results (km2) | 1312.71 | - | 1169.07 | 35.55 | 510.40 | 29.54 | - | ||
| Accuracy (%) | 93.68 | - | 94.48 | 97.93 | 71.83 | 97.90 | - | ||
| Tongchuan | Statistical yearbook (km2) | 218.24 | 0.28 | 431.86 | 16.00 | 28.70 | 13.89 | - | |
| Extraction results (km2) | 278.61 | - | 540.00 | 16.55 | 28.73 | 14.24 | - | ||
| Accuracy (%) | 72.34 | - | 74.96 | 96.55 | 99.98 | 97.48 | - | ||
| Baoji | Statistical yearbook (km2) | 1861.28 | 0.98 | 968.37 | 67.10 | 464.80 | 79.81 | 27.10 | |
| Extraction results (km2) | 1862.20 | - | 970.50 | 67.22 | 464.49 | 80.19 | 27.27 | ||
| Accuracy (%) | 99.96 | - | 99.78 | 99.83 | 99.93 | 99.52 | 99.37 | ||
| Xianyang | Statistical yearbook (km2) | 1961.37 | - | 1373.12 | 142.40 | 791.90 | 38.50 | 6.10 | |
| Extraction results (km2) | 1992.26 | - | 1464.80 | 143.64 | 789.65 | 39.02 | 6.11 | ||
| Accuracy (%) | 98.43 | - | 93.32 | 99.14 | 99.72 | 98.65 | 99.91 | ||
| Weinan | Statistical yearbook (km2) | 2848.15 | - | 2177.74 | 199.10 | 911.70 | 44.18 | - | |
| Extraction results (km2) | 2847.22 | - | 2177.23 | 204.10 | 913.05 | 44.65 | - | ||
| Accuracy (%) | 99.97 | - | 99.98 | 97.49 | 99.85 | 98.95 | - | ||
| Yan’an | Statistical yearbook (km2) | 2.96 | 12.22 | 750.22 | 16.20 | 252.90 | 150.26 | 10.70 | |
| Extraction results (km2) | 3.89 | 12.36 | 2204.20 | 16.10 | 254.80 | 149.72 | 11.27 | ||
| Accuracy (%) | 68.53 | 98.87 | -93.87 | 99.38 | 99.25 | 99.64 | 94.70 | ||
| Hanzhong | Statistical yearbook (km2) | 385.08 | 812.60 | 682.60 | 786.60 | 676.90 | 170.63 | 35.90 | |
| Extraction results (km2) | 386.07 | 812.24 | 683.14 | 785.01 | 675.38 | 170.17 | 35.75 | ||
| Accuracy (%) | 99.74 | 99.96 | 99.92 | 99.80 | 99.77 | 99.73 | 99.59 | ||
| Yulin | Statistical yearbook (km2) | 2.95 | 28.80 | 2902.17 | 160.40 | 465.70 | 638.51 | 0.60 | |
| Extraction results (km2) | 3.00 | 29.69 | 8208.22 | 160.45 | 466.10 | 632.79 | - | ||
| Accuracy (%) | 98.25 | 96.92 | -82.83 | 99.97 | 99.91 | 99.14 | - | ||
| Ankang | Statistical yearbook (km2) | 291.03 | 201.03 | 824.83 | 648.10 | 835.30 | 142.86 | 76.80 | |
| Extraction results (km2) | 291.77 | 200.39 | 825.78 | 645.26 | 835.45 | 143.38 | 76.91 | ||
| Accuracy (%) | 99.75 | 99.68 | 99.88 | 99.56 | 99.98 | 99.64 | 99.86 | ||
| Shangluo | Statistical yearbook (km2) | 359.83 | 1.78 | 687.15 | 91.20 | 218.20 | 185.76 | 69.00 | |
| Extraction results (km2) | 362.02 | 1.86 | 689.34 | 92.20 | 218.83 | 185.99 | 70.25 | ||
| Accuracy (%) | 99.40 | 95.63 | 99.69 | 98.94 | 99.71 | 99.88 | 98.19 | ||
Disclaimer/Publisher’s Note: The statements, opinions and data contained in all publications are solely those of the individual author(s) and contributor(s) and not of MDPI and/or the editor(s). MDPI and/or the editor(s) disclaim responsibility for any injury to people or property resulting from any ideas, methods, instructions or products referred to in the content. |
© 2025 by the authors. Licensee MDPI, Basel, Switzerland. This article is an open access article distributed under the terms and conditions of the Creative Commons Attribution (CC BY) license (https://creativecommons.org/licenses/by/4.0/).
Share and Cite
Wang, Y.; Guo, K.; Kong, X.; Zhao, J.; Chang, B.; Zhao, C.; Jin, F. Acquisition of Crop Spatial Patterns Based on Remote Sensing Data from Sentinel-2 Satellite. Agriculture 2025, 15, 633. https://doi.org/10.3390/agriculture15060633
Wang Y, Guo K, Kong X, Zhao J, Chang B, Zhao C, Jin F. Acquisition of Crop Spatial Patterns Based on Remote Sensing Data from Sentinel-2 Satellite. Agriculture. 2025; 15(6):633. https://doi.org/10.3390/agriculture15060633
Chicago/Turabian StyleWang, Yinan, Kai Guo, Xiangbing Kong, Jintao Zhao, Buhui Chang, Chunjing Zhao, and Fengying Jin. 2025. "Acquisition of Crop Spatial Patterns Based on Remote Sensing Data from Sentinel-2 Satellite" Agriculture 15, no. 6: 633. https://doi.org/10.3390/agriculture15060633
APA StyleWang, Y., Guo, K., Kong, X., Zhao, J., Chang, B., Zhao, C., & Jin, F. (2025). Acquisition of Crop Spatial Patterns Based on Remote Sensing Data from Sentinel-2 Satellite. Agriculture, 15(6), 633. https://doi.org/10.3390/agriculture15060633