Abstract
Rapid and accurate moisture detection is critical for alfalfa quality control, yet conventional methods are slow, and non-destructive techniques are challenged by different product forms. This study leveraged Short-Wave Infrared Hyperspectral Imaging (SWIR-HSI) to acquire spatially representative spectra, aiming to develop and validate robust, form-specific moisture prediction models for compressed and powdered alfalfa. For compressed alfalfa, a full-spectrum Support Vector Regression (SVR) model demonstrated stable and good performance (mean Prediction Coefficient of Determination = 0.880, Ratio of Performance to Deviation RPD = 2.93). In contrast, powdered alfalfa achieved superior accuracy (mean = 0.953, RPD = 5.29) using an optimized pipeline of Savitzky–Golay’s first derivative, Successive Projections Algorithm (SPA) for feature selection, and an SVR model. A key finding is that the optimal model for powdered alfalfa frequently converged to an ultra-sparse, single-band solution near water absorption shoulders (~970/1450 nm), highlighting significant potential for developing low-cost, filter-based agricultural sensors. While this minimalist model showed excellent average accuracy, rigorous repeated evaluations also revealed non-negligible performance variability across different data splits—a crucial consideration for practical deployment. Our findings underscore that tailoring models to specific product forms and explicitly quantifying their robustness is essential for reliable NIR sensing in agriculture and provides concrete wavelength targets for sensor development.
1. Introduction
Alfalfa (Medicago sativa), recognized for its exceptional protein content and nutritional richness, is an indispensable high-quality forage crop in ruminant livestock production [1,2]. Commercially, alfalfa is often processed into powder or compressed blocks to improve transportation, storage convenience, and feed conversion efficiency [3]. Among the various factors determining alfalfa product quality, moisture content plays a pivotal role, directly influencing nutrient stability, microbial safety, and economic value [4].
Excessive moisture not only dilutes nutrient concentrations in dry matter, leading to feed formulation inaccuracies and potentially misleading nutritional claims [5], but it also accelerates the degradation of key nutrients such as crude protein, fiber, and vitamins, especially during the storage and transport of high-protein forages like alfalfa [6]. For example, alfalfa moisture content exceeding 15% readily promotes mold growth and aflatoxin production, posing severe risks to animal health and causing the consumption of soluble sugars and proteins, thereby diminishing overall nutritional quality [7]. Regulatory limits (typically 12–14% depending on product form) further underscore the need for precise and efficient determination [8,9]. However, conventional techniques like oven drying, despite being standardized, are generally time-consuming, destructive, and ill-suited for high-throughput quality control in agricultural settings [10].
Given the limitations of traditional detection methods, hyperspectral imaging (HSI) has emerged as an advanced, non-destructive analytical tool with immense potential for agricultural product quality assessment [11]. HSI simultaneously acquires high-resolution reflectance spectra across hundreds of contiguous narrow bands while capturing the spatial distribution of chemical or physical properties in samples [12]. This technology has shown substantial promise in detecting external attributes of agricultural and food products, such as size, color, and surface defects [13], as well as internal compositional traits, including moisture [14], starch [15], protein [16], chlorophyll [17], and polysaccharides. However, another critical, albeit more fundamental, application of its imaging capability is to overcome the challenge of sample heterogeneity, a common issue in agricultural products. Unlike conventional non-imaging (point-based) spectrometers, which are susceptible to sampling bias when measuring non-uniform materials, HSI captures spectra from thousands of pixels across a defined area. By averaging these spectra, a highly representative and robust spectral signature that reflects the bulk properties of the sample can be obtained, effectively minimizing noise from local variations in particle size, density, and texture. This makes HSI an ideal tool for acquiring high-quality data from challenging samples like the powdered and compressed alfalfa investigated in this study.
Hyperspectral imaging (HSI), particularly in the short-wave infrared (SWIR) region, represents a significant advancement over traditional near-infrared spectroscopy (NIRS) for the quality assessment of diverse agricultural products. While both technologies offer rapid, non-destructive analysis, HSI’s ability to integrate spatial and spectral information provides a distinct advantage in visualizing chemical distributions. This is crucial for heterogeneous samples where physical form [18], orientation, or measurement position can significantly impact spectral signatures, as demonstrated in recent studies on wheat grains and jujubes. However, the path to widespread industrial adoption of HSI faces significant hurdles regarding its cost, accuracy (robustness), and speed (complexity) [19]. Recent research highlights three primary challenges: (1) high hardware cost, which limits accessibility compared to lower-cost NIRS systems and motivates the search for critical wavelengths to design simpler sensors [20]; (2) insufficient model robustness, where model accuracy degrades when faced with real-world variations in physical form or sample batches [21]; and (3) complex data processing, where the high data volume necessitates advanced chemometrics and artificial intelligence techniques, such as deep learning models (e.g., CNNs), to achieve optimal performance, impacting overall analysis speed and requiring specialized expertise [22]. Therefore, this study aims to address these challenges by systematically investigating the impact of product form on model performance. By identifying a minimal set of critical wavelengths, we provide a scientific basis for developing low-cost, robust, and application-specific sensors. This approach seeks to combine the spatial advantages of imaging with the cost-effectiveness and speed of simpler spectroscopic systems, thereby bridging the gap between laboratory potential and practical application.
Nonetheless, the high dimensionality, severe multicollinearity, information redundancy, and noise interference inherent in HSI data pose critical challenges to its application in agricultural research [23]. These issues complicate data processing and can compromise model robustness and predictive accuracy. Constructing high-precision and robust hyperspectral prediction models requires a systematic data processing pipeline. This pipeline typically encompasses spectral preprocessing, feature extraction, and regression model selection, which collectively form the cornerstone of model development. First, raw hyperspectral data are frequently plagued by external factors and instrumental effects, such as light scattering, baseline drift, and random noise [24]. These interferences significantly degrade the signal-to-noise ratio, obscuring genuine spectral signatures and thus impairing model prediction accuracy and stability. Therefore, effective spectral preprocessing is essential [25]. Common preprocessing techniques mitigate these issues; for example, scatter correction (e.g., Standard Normal Variate, SNV) reduces scattering effects, smoothing (e.g., Savitzky–Golay) attenuates random noise, derivative operations (e.g., first/second derivatives) eliminate baseline drift and highlight spectral details, and baseline correction (e.g., Asymmetric Least Squares, ALS) removes background interference. All these methods enhance spectral data quality and establish a solid foundation for subsequent analyses [26].
Second, the hundreds of wavelength variables in hyperspectral data exhibit severe multicollinearity, information redundancy, and noise interference [27]. This not only escalates computational demands but also predisposes models to overfitting, diminishing generalization capability [28]. Hence, feature extraction (or wavelength selection) emerges as a pivotal step, aimed at pinpointing the most informative wavelengths [29]. Diverse strategies have been developed to achieve this goal. For instance, Li et al. [30] integrated Competitive Adaptive Reweighted Sampling (CARS) with Partial Least Squares Regression (PLSR) to optimize predictions of pH and L* color values in beef. Similarly, the fusion of the Successive Projections Algorithm (SPA) with one-dimensional convolutional neural networks (1D-CNN) facilitated precise detection of aflatoxin contamination levels and timelines in maize kernels [31]. Moreover, Uninformative Variable Elimination (UVE) has been effectively applied to short-wave near-infrared hyperspectral data, providing high-quality spectral inputs for models [32]. In numerous instances, hybrid selection approaches, such as CARS_MIV and UVE_SPA, have demonstrated superior efficacy in denoising and bolstering feature stability. For example, Park et al. [33] utilized a CARS_UVE method to select just 18.3% of SWIR wavelengths, markedly enhancing the detection efficiency and robustness of a quantitative contamination model in dried laver. These examples illustrate that disparate algorithmic mechanisms yield markedly different feature extraction outcomes, with optimal feature subsets varying across specific application contexts in agriculture [34]. Therefore, systematic comparisons of standalone and hybrid feature selection strategies provide a robust groundwork for devising accurate and stable regression models customized to diverse nutritional components.
Furthermore, the proliferation of machine learning tools has profoundly amplified the analytical potential of spectral data in agricultural science. Various quantitative models have been successfully deployed to forecast nutritional components across heterogeneous food and feed matrices [35]. For instance, a CARS_PLS model achieved high-precision quantification of total and organic selenium in kefir grains [36]. An Support Vector Regression (SVR) model augmented by Particle Swarm Optimization (PSO) excelled in predicting moisture content in Camellia seeds [37]. Additionally, Random Forest (RF) models have been employed to predict ginsenoside content in Panax ginseng [38], and Backpropagation Neural Network (BPNN) models are extensively utilized for hyperspectral data modeling, such as forecasting capsaicin and hydroxy-α-sanshool content in hotpot seasonings [39]. Notably, hyperspectral imaging integrated with machine learning has also been successfully applied for the quantitative analysis of aroma components, including alcohols and esters, in Soy Sauce-Aroma Type Baijiu (SSAB), where optimal models (PSO-SVR) attained exceptionally high predictive accuracies— of 0.997 and of 0.118 mg/L for alcohols, and of 0.996 and of 0.017 mg/L for esters [40]. Despite these advancements, the efficacy of disparate modeling algorithms, when paired with tailored preprocessing and feature selection strategies, can exhibit substantial variability. Thus, appraising the predictive prowess of multifaceted modeling pipelines across divergent alfalfa product morphologies holds profound implications, enabling the discernment of dependable, form-specific and component-specific modeling paradigms relevant to agricultural processing.
Moreover, in HSI-based quality assessment of agricultural products, the physical form of samples represents an often-overlooked yet pivotal factor. Material physical attributes, such as particle size, packing density, surface roughness, and compaction degree [41], profoundly modulate the interaction between incident light and the sample, thereby altering spectral response characteristics [42]. For example, enhanced scattering or altered light penetration depths can induce baseline shifts or signal attenuation, rendering models calibrated for one form suboptimal when applied to another. Although researchers broadly acknowledge the significance of physical form, existing studies predominantly focus on modeling for specific forms or the isolated impact of single attributes, such as particle size [43]. Currently, investigations systematically comparing, within a unified experimental framework, the modeling processes, feature extraction disparities, and ultimate performance metrics for moisture prediction in disparate physical morphologies of the same agricultural product (e.g., compressed and powdered alfalfa) remain scarce. This research gap restricts the broader applicability of HSI in agricultural processing chains, particularly in scenarios with morphological variability.
Considering these identified gaps, our study leverages Short-Wave Infrared Hyperspectral Imaging (SWIR-HSI) to build non-destructive moisture models for alfalfa across two distinct morphologies (powder and compressed blocks). This research advances the field in three main ways: (1) form -resolved spectral analysis that links scattering differences and specific water absorption features (~970/1450 nm) to moisture sensitivity, providing a deeper understanding of light-matter interaction in different alfalfa forms; (2) Large-scale pipeline optimization encompassing various pretreatments (SNV, SG_1d, BC_ALS, SG+SNV), wavelength selection methods (CARS_MIV, PLS_VIP, SPA, UVE, Lasso), and regressors (PLS, SVR, XGBoost, RF, BPNN), yielding form -specific optimal pathways for enhanced prediction; and (3) Feature-wavelength interpretation and cross-form comparison conducted on a held-out prediction set, which reveals ultra-sparse solutions (often a single band near water shoulders) that enable compact, filter-based sensor designs suitable for agricultural applications. These comprehensive results provide actionable pipelines and specific wavelength targets for reliable, form-aware deployment of SWIR-HSI in agricultural quality control and processing.
2. Materials and Methods
2.1. Sample Preparation
This study utilized two different forms of alfalfa samples: powdered and compressed blocks. Their preparation process is illustrated in Figure 1. Alfalfa (Medicago sativa L.) samples were obtained from the experimental base of Inner Mongolia Agricultural University and alfalfa planting bases in Hohhot.
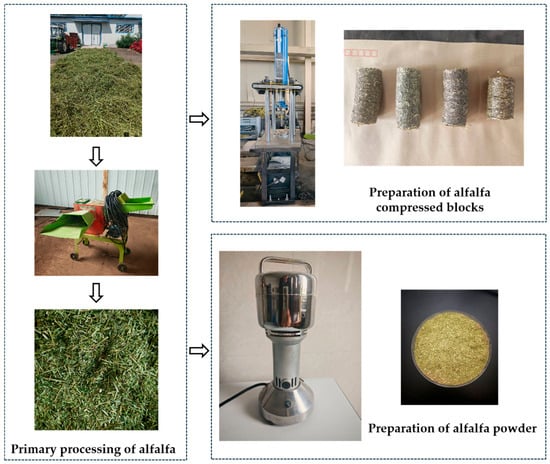
Figure 1.
Sample preparation process for two forms of alfalfa (compressed and powdered).
First, freshly harvested alfalfa was naturally air-dried and then mechanically crushed. Subsequently, its moisture content (MC) was adjusted to a target range of 8% to 25% using a gradient water addition method. To ensure homogeneous moisture distribution, samples were equilibrated in sealed bags for 24 h. After this, a secondary pulverization step was performed to achieve fine and uniform particle size. This resulted in the preparation of 109 powdered alfalfa samples with varying MCs. Concurrently, compressed alfalfa samples were also prepared from initially crushed alfalfa. During the compression process, 50 distinct combinations of processing parameters, including moisture content, pressing temperature, and length-to-diameter ratio, were employed. This led to the preparation of 198 unique compressed alfalfa samples with different MCs and physical characteristics. The dimensions of each compressed alfalfa sample were uniformly controlled to minimize spectral scattering effects arising from geometric variations.
The true moisture content of all samples (powdered alfalfa and compressed alfalfa) was determined using the national standard oven-drying method. Samples were placed in a DHG-9140A electric heating constant-temperature blast drying oven (Shanghai Yiheng Scientific Instrument Co., Ltd., Shanghai, China) and dried at a constant temperature of 105 °C until a constant weight was achieved. The MC was calculated as a percentage of mass loss, accurate to 0.01%, using the following formula:
where is the initial wet weight of the sample, and is the final dry weight of the sample.
2.2. Hyperspectral Data Acquisition
Hyperspectral images of both powdered and compressed alfalfa samples were acquired using a push-broom imaging system featuring a SPECIM FX17 camera (Specim, Spectral Imaging Ltd., Oulu, Finland), as shown in Figure 2. The system operated in the short-wave infrared (SWIR) region (900–1700 nm) with a spectral resolution of 8 nm, yielding 224 spectral bands. This range, while part of the broader near-infrared (NIR) spectrum, is more specifically referred to as SWIR for precision. The imaging system was equipped with four 35W halogen lamps for illumination, and the camera’s exposure time and scanning speed were synchronized at 10 mm/s. The SPECIM FX17 camera was specifically chosen for this study for two key reasons. Firstly, its spectral range effectively covers the two major water absorption bands (~970 nm and ~1450 nm), which are fundamental for moisture quantification. Secondly, the instrument provides a high signal-to-noise ratio and sufficient spectral resolution to capture subtle spectral features, making it ideal for the detailed analysis and feature selection required by our research.
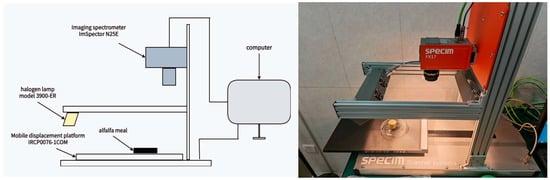
Figure 2.
Near-Infrared Hyperspectral Imaging (NIRHSI) system setup (SPECIM FX17, 900–1700 nm).
To ensure the accuracy of the spectral data, a rigorous radiometric correction was performed. Prior to sample scanning, a white reference image () was acquired from a standard Teflon board (>99% reflectance) that filled the entire field of view, and a dark current image () was captured with the lens completely covered. This standard procedure corrects for non-uniform illumination and sensor response across the imaging plane [44,45]. The calibrated reflectance (R) was then calculated for each pixel using the following widely accepted formula:
where R represents the corrected reflectance image, is the raw hyperspectral image intensity, is the image intensity of a standard white Teflon board (with reflectance > 99%), and is the image intensity obtained by closing the lens cap.
The corrected hyperspectral images were then processed using ENVI 5.3 software (Exelis Visual Information Solutions, Boulder, CO, USA). The key advantage of using an imaging system is its ability to generate a highly representative spectrum from heterogeneous samples. As illustrated in Figure 3, both product forms exhibit considerable surface non-uniformity, where a single-point measurement could lead to significant sampling error. To mitigate this, a large and uniform Region of Interest (ROI) was manually selected from the central area of each sample, avoiding edges or physical defects. The spectra from all pixels within this ROI were then averaged to produce a single, robust signature for each sample. This averaging process effectively minimizes noise from local physical variations, yielding a smoother and more representative spectrum for subsequent modeling. Each final spectrum comprised 224 reflectance values at their corresponding wavelengths.
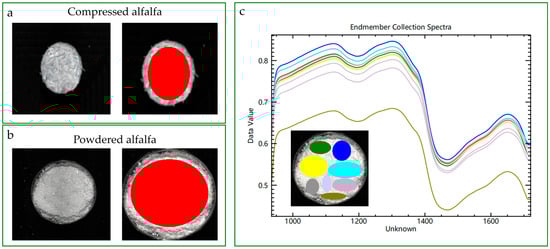
Figure 3.
Acquiring representative spectra from non-uniform alfalfa samples using hyperspectral imaging. Left panels (a,b): A large Region of Interest (ROI, red) is manually selected for both compressed (a) and powdered (b) alfalfa to generate an average spectrum. Right panel (c): The variability of spectra from multiple small, localized ROIs (colored curves, corresponding to the inset) is contrasted with the smooth, averaged spectrum from the large ROI (red curve), highlighting the necessity of this approach for robust modeling.
2.3. Spectral Preprocessing and Modeling Framework
Spectral preprocessing is the first critical step in building a robust model, as it mitigates physical and instrumental artifacts (e.g., light scattering, baseline drift) that can obscure chemical information and degrade performance [46]. Our study’s innovation lies not in developing new algorithms, but in a systematic, combinatorial evaluation to identify the optimal preprocessing method for each product form. To this end, we systematically compared five commonly used techniques:
Raw Reflectance Spectra: Used directly without any transformation, serving as a baseline for evaluating the effectiveness of other preprocessing methods.
Standard Normal Variate (SNV): This method normalizes each spectrum individually (to zero mean and unit standard deviation) to correct for multiplicative scatter effects caused by physical variations like particle size and packing density.
Asymmetric Least Squares Baseline Correction (BC_ALS): A robust algorithm used to remove complex, non-linear baseline drift by iteratively fitting and subtracting a smooth baseline, which is particularly effective even in the presence of strong absorption peaks.
Savitzky–Golay Smoothing followed by Standard Normal Variate (SG_SNV): A two-step process where a Savitzky–Golay (SG) filter first reduces random noise in the spectra, after which SNV is applied to correct for scattering effects.
Savitzky–Golay First Derivative (SG_1d): This derivative operation, calculated using the SG algorithm to minimize noise amplification, was applied to eliminate baseline drift and enhance spectral resolution by highlighting the rate of change in the spectral curve, thereby resolving overlapping peaks. The general form of the SG filter for the derivative is:
where are the Savitzky–Golay convolution coefficients that incorporate the derivative order and polynomial order.
2.4. Feature Extraction and Band Selection
Hyperspectral data are characterized by high dimensionality, strong multicollinearity, and redundant information. This not only increases computational burden but can also compromise model performance and generalization ability. Feature extraction aims to select a subset of the most representative and discriminative bands from the full spectrum to simplify models, enhance efficiency, and improve accuracy [47]. This study systematically evaluated six mainstream feature extraction methods.
No Band Selection (None): No band selection was performed. All original or preprocessed 224 bands were directly used as model inputs, serving as a baseline to assess the impact of feature extraction.
A hybrid method that first uses CARS, an iterative screening process based on PLS model coefficients, to select a subset of important variables, and then uses MIV to further refine the selection by quantifying each variable’s impact on the model output [48].
Variable Importance in Projection (PLS_VIP): PLS_VIP is a variable selection method based on the PLS regression model. The VIP score quantifies the importance of each variable in the projection, reflecting its contribution to explaining the variance of both predictors and responses during the PLS model construction. A higher VIP value indicates a stronger explanatory power of that variable for the response variable.
Successive Projections Algorithm (SPA): A forward selection algorithm designed to minimize collinearity among selected variables. It iteratively projects and selects the wavelength that has the least redundancy with the already chosen set, resulting in a small subset of highly informative bands [49].
Uninformative Variable Elimination (UVE): This method identifies and removes uninformative variables by comparing the stability of their regression coefficients (from a PLS model) against that of artificially introduced random noise variables. Variables less stable than the noise are eliminated.
Least Absolute Shrinkage and Selection Operator (Lasso): Lasso is a linear regression method that performs both feature selection and regularization simultaneously [50]. By adding an L1 penalty term (sum of absolute values of coefficients) to the loss function, it can force some regression coefficients to be exactly zero, thereby achieving band selection and automatically eliminating unimportant bands. The objective function for Lasso regression is:
where y is the response vector, X is the spectral matrix, is the vector of regression coefficients, is the L2 norm (sum of squared residuals), is the L1 norm (sum of absolute values of coefficients), and is the regularization parameter. In this study, LassoCV was used to automatically optimize the regularization parameter lambda through cross-validation. The key parameters and settings for all preprocessing and feature extraction methods discussed above are summarized in Table 1.

Table 1.
Summary of Key Modeling Parameters (Details in Appendix A Table A1, Table A2 and Table A3).
2.5. Regression Models
To comprehensively evaluate the performance of different algorithms in predicting alfalfa moisture content, five widely applied regression models from the field of spectral analysis were selected. These models encompass various paradigms, including linear, non-linear, ensemble learning, and neural networks. Each model underwent hyperparameter optimization using the Optuna framework to achieve its best predictive performance.
Partial Least Squares Regression (PLSR): A classic linear method adept at handling high-dimensional and collinear data, like spectra. PLSR reduces data dimensionality by projecting it onto a small number of latent variables that maximize the covariance between predictors and the response variable [51].
Random Forest (RF): A non-linear ensemble method that builds a multitude of decision trees on random subsets of data and features. The final prediction is an average of all individual tree outputs, which effectively reduces overfitting and improves robustness [52].
Extreme Gradient Boosting (XGBoost): An optimized and highly efficient implementation of gradient boosting decision trees. It builds a powerful predictive model by sequentially adding weak learners, where each new tree corrects the errors of the previous one, while incorporating regularization to prevent overfitting [53].
Support Vector Regression (SVR) is an extension of Support Vector Machines (SVMs) applied to regression tasks. It aims to find a hyperplane that best fits the data by minimizing the distance from all training samples to this hyperplane within a specified error margin (), and it handles training errors by introducing an -insensitive loss function [54]. SVR can map input data into a higher-dimensional feature space using a kernel function, thereby addressing non-linear relationships. The decision function for SVR can be expressed as:
where is the number of support vectors, is the kernel function (RBF kernel typically used in this study), and are Lagrange multipliers (support vector weights), and b is the bias term.
Backpropagation Neural Network (BPNN): A BPNN is a multi-layer feedforward neural network trained using the back-propagation algorithm to adjust network weights and biases, thereby minimizing the error between predicted outputs and true values [55]. It consists of an input layer, one or more hidden layers, and an output layer, capable of learning and approximating highly complex non-linear functions. The output of a BPNN with N hidden layers can be generally represented as:
where is the input vector, and are the weight matrix and bias vector for the i-th layer, respectively, and is the activation function for the i-th layer.
2.6. Model Development and Evaluation
For each form, data were initially partitioned into a 70% training set and a 30% independent test set. This splitting employed stratified random sampling based on the moisture content (Y) to maintain consistent distributions across subsets, with a fixed random seed for initial reproducibility. Z-score normalization parameters were derived solely from the training set and subsequently applied to both the training and test sets. To identify the optimal modeling pipeline (comprising pretreatment, feature extraction, and regression model) for each form, hyperparameter optimization was performed using the Optuna framework (TPE algorithm). This process targeted the minimization of from 10-fold cross-validation on the training set, with 100 optimization trials per combination. The selection of the best feature extraction method and its parameters, along with the regression model’s hyperparameters, was strictly confined to the training set through this inner cross-validation loop.
2.7. Robustness and Uncertainty Assessment of Optimal Pipelines
To rigorously assess the robustness, uncertainty, and generalizability of the identified optimal pathways for each alfalfa form, a repeat evaluation protocol was implemented. Each optimal pathway (the specific combination of pretreatment, feature extraction, and regression model) underwent 20 independent repetitions. In each repetition, the initial dataset was re-split into a 70% training set and a 30% independent test set using a different random seed (sequentially generated from a master seed).
For every repetition, outlier detection and removal for feature data (X) was performed solely on the training subset (using PCA-based T2 and Q statistics), ensuring no information leakage from the test set. The label data (Y) outlier removal (IQR method) was also applied only to the training Y subset. The test set remained completely untouched by any cleaning procedures. Feature selection (e.g., SPA, Lasso, etc.) and its associated parameter optimization were re-executed entirely within the respective training subset using an inner Optuna-based cross-validation loop. This ensured that the feature selection was not biased by the test set. Regression model hyperparameter optimization was similarly re-performed on the selected features of the training subset using another inner Optuna-based cross-validation. The final model, trained on the optimized parameters and selected features from the training subset, was then evaluated a single time on the unseen independent test subset.
For each repetition, we recorded the test set’s sample count (), the standard deviation of its true moisture values (), and the key performance metrics: coefficient of determination (), root mean squared error (), mean absolute error (), and ratio of performance to deviation (RPD). Across the 20 repetitions, these metrics were summarized by their mean, standard deviation, 95% confidence intervals (CI), and minimum/maximum values, providing a comprehensive assessment of the model’s stability and predictive range.
Model performance was rigorously quantified using four key metrics on the prediction set, providing a comprehensive assessment of the model’s prediction accuracy, stability, and practical utility.
- (1)
- Coefficient of Determination ():
quantifies the proportion of the variance in the true moisture content that is explained by the model’s predictions. An value closer to 1 indicates a better model fit and higher explanatory power. The formula for is:
where is the true value, is the predicted value, is the mean of the true values, and N is the number of samples.
- (2)
- Root Mean Square Error (RMSE):
RMSE quantifies the average magnitude of the errors between predicted and actual values. Its unit is consistent with that of the moisture content. Lower RMSE values indicate higher prediction accuracy. The formula for RMSE is:
where is the true value, is the predicted value, and N is the number of samples.
- (3)
- Mean Absolute Error (MAE)
MAE measures the average absolute difference between predicted and actual values on the test set. It provides a more robust measure of average error compared to RMSE as it is less sensitive to outliers. Lower MAE values indicate higher precision. The formula for MAE is:
where is the true value, is the predicted value, and N is the number of samples.
- (4)
- Residual Prediction Deviation (RPD)
RPD is a crucial evaluation metric utilized to assess the robustness and practical utility of a model, particularly in independent test sets. It provides a relative assessment by combining the prediction error with the inherent variability of the reference values. A higher RPD value indicates a more robust and practically useful model. The general interpretation criteria are: RPD 1.5 (poor), 1.5RPD2 (acceptable for screening), 2 RPD 2.5 (good for quality control), and RPD 2.5 (excellent for quantitative prediction). The formula for RPD is:
where is the standard deviation of the true (reference) values, and is the Root Mean Square Error of Prediction on the test set. As shown by our repeated evaluations, these two metrics exhibit a strong inverse relationship, where a lower RMSEP consistently leads to a higher RPD (see Appendix A, Figure A1).
All analyses were performed in a Python 3.11 environment using scikit-learn, XGBoost, TensorFlow, and Optuna libraries.
3. Results
3.1. Spectral Characteristics Analysis of Alfalfa in Different Morphologies
Raw Near-Infrared (NIR) spectra (900–1700 nm) revealed common trends in both alfalfa morphologies, yet with distinct differences in intensity and fine spectral details. Figure 4a displays the raw spectra of compressed alfalfa, while Figure 4b shows those of powdered alfalfa. Key water absorption features were observed in both forms, primarily around 970 nm (O–H stretching overtone) and 1450 nm (O–H stretching combination band), which are crucial for moisture assessment. Additionally, reflectance peaks at 1100–1300 nm and ~1650 nm typically relate to C–H and N–H bonds, indicative of nutritional components.
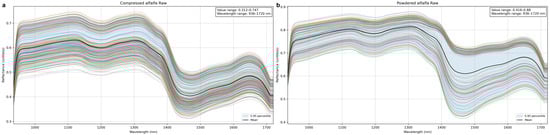
Figure 4.
Raw Near-Infrared spectra (900–1700 nm) of (a) compressed and (b) powdered alfalfa.
Comparing the two morphologies, powdered alfalfa (Figure 4b) exhibited significantly higher overall reflectance (approx. 0.45–0.90) compared to compressed alfalfa (Figure 4a, approx. 0.30–0.75). This difference is mainly due to increased diffuse reflection and scattering from fine particles and a larger specific surface area in the powdered form. Conversely, compressed samples, with their higher compaction, limited light penetration and internal scattering, leading to lower overall reflectance.
Further spectral baseline and shape analysis revealed more discrete and varied curves for powdered alfalfa, especially around the 1450 nm absorption. This may indicate variability in particle uniformity or packing density. Despite lower overall intensity, compressed alfalfa spectra showed higher aggregation in the 1100–1300 nm and 1500–1700 nm regions. Both forms displayed baseline drift. However, the strong scattering in powders likely contributed to greater baseline irregularity and deeper, more fluctuating water absorption peaks at 970 nm and 1450 nm, potentially due to enhanced light path lengths. These morphological differences profoundly influence NIR spectral intensity and baseline, thus necessitating specific preprocessing to mitigate physical interferences for accurate prediction modeling in agricultural applications.
3.2. Spectral Preprocessing Effects
Spectral preprocessing is critical for enhancing chemical information in NIR data by mitigating non-chemical interferences (e.g., scattering, baseline drift, noise). This study systematically compared four methods: Standard Normal Variate (SNV), Savitzky–Golay Smoothing with First Derivative (SG_1d), Asymmetric Least Squares Baseline Correction (BC_ALS), and Savitzky–Golay Smoothing followed by SNV (SG_SNV). Figure 5a–d illustrate the effects of these methods on compressed alfalfa spectra, while Figure 5e–h show their effects on powdered alfalfa spectra.
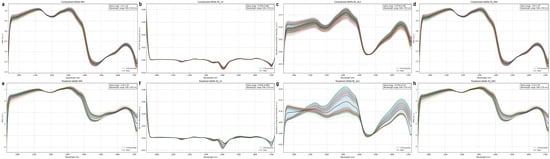
Figure 5.
Effects of preprocessing on alfalfa spectra. Subfigures (a–d) display spectra of compressed alfalfa after SNV, SG_1d, BC_ALS, and SG_SNV preprocessing, respectively; subfigures (e–h) display spectra of powdered alfalfa after the same preprocessing methods.
SNV (Figure 5a,e) effectively normalized spectra by correcting baseline shifts and scatter, which was particularly significant for scattering-prone powdered alfalfa. SG_1d (Figure 5b,f) eliminated baseline interference and enhanced spectral resolution, transforming broad absorption bands into sharp derivative peaks, notably highlighting water features at ~970 nm and ~1450 nm. BCALS (Figure 5c,g) robustly corrected nonlinear baseline drift while preserving original absorption shapes. SG + SNV (Figure 5d,h) combined noise reduction (SG smoothing) with scatter correction (SNV), effectively normalizing spectra while retaining details, especially for powdered samples. While all methods improved spectral quality to varying degrees, their ultimate impact on model prediction performance will be quantitatively validated in Section 3.4.
3.3. Feature Extraction and Wavelength Selection Effects
The high dimensionality, strong multicollinearity, and information redundancy of hyperspectral data not only increase computational burden but also can compromise model prediction performance and generalization ability. Therefore, feature extraction aims to select a subset of the most representative and discriminative wavelengths from the full spectrum to simplify models, enhance efficiency, and improve accuracy. This study systematically evaluated five advanced feature extraction methods: Competitive Adaptive Reweighted Sampling–Mean Impact Value (CARS_MIV), Lasso Regression Selection, Variable Importance in Projection (PLS_VIP), Successive Projections Algorithm (SPA), and Uninformative Variable Elimination (UVE). “None” (no feature extraction) served as a baseline to comprehensively investigate their impact on alfalfa moisture prediction models.
3.3.1. Wavelength Reduction and Model Performance Optimization
To visually demonstrate the comprehensive impact of different preprocessing and feature extraction (FE) method combinations on final model performance, we constructed the performance heatmap shown in Figure 6. This heatmap presents the best independent test set and RPD values achieved for compressed alfalfa and powdered alfalfa under various combinations, along with the corresponding optimal regression model. Additionally, Table 2 summarizes the number of wavelengths selected by different preprocessing and FE combinations, providing an overview of wavelength reduction efficiency.
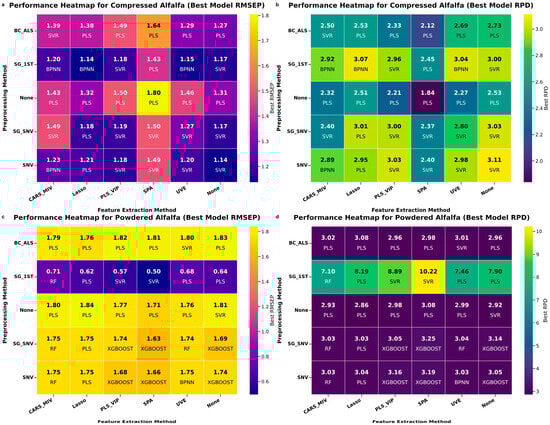
Figure 6.
Heatmap of best prediction-set (a,c) and RPD (b,d) across pretreatment × feature-selection combinations. The label under each cell shows the top regressor.
Table 2.
Summary of Wavelengths Selected by Different Feature Extraction Methods Under Various Preprocessing Strategies for Two Alfalfa Morphologies.
As shown in Table 2, all feature extraction methods significantly reduced the original 224 spectral bands. Lasso generally reduced the number of bands to about 10–50 (average around 11), demonstrating strong sparsity capability, which is meaningful for building lightweight multispectral systems in agriculture. CARS_MIV and SPA averaged about 27 bands, showing relatively high efficiency. PLS_VIP and UVE tended to retain more bands (averages of about 77 and 52, respectively), but still far fewer than the original bands. These two methods focused more on keeping bands that contributed significantly to the model or had high stability. Preprocessing methods had a noticeable impact on the band numbers of feature extraction results. For example, SG_1d and SNV led to significant differences in the number of bands selected by PLS_VIP for compressed alfalfa, indicating that preprocessing alters spectral feature distributions and thus affects the recognition by feature extraction algorithms.
Figure 6 presents a heatmap of the best prediction-set (a, c) and RPD (b, d) across pretreatment × FE combinations, along with the optimal regressor. For compressed alfalfa, SG_1d and SNV pretreatments generally led to lower and higher RPD (e.g., SNV + full spectrum + SVR yielded RPD = 3.11; SG_1d + Lasso + SVR yielded RPD = 3.07, = 1.14). For powdered alfalfa, SG-1d preprocessing proved particularly advantageous, with SG-1d + SPA + SVR achieving the lowest (0.5%) and highest RPD (10.22) on its best split. The SVR model consistently performed robustly across most optimal combinations for both morphologies. This heatmap clearly demonstrates the synergistic effects of optimized data processing pipelines for form-specific moisture prediction, laying the groundwork for interpreting selected wavelengths.
3.3.2. Chemical Interpretability Analysis of Selected Wavelengths
To gain a deeper understanding of the mechanisms behind feature selection methods and their chemical relevance in different alfalfa morphologies, we further analyzed the correspondence between selected key wavelengths and known absorption peaks of water and other major chemical components. This analysis was based on the optimal or representative preprocessing and FE combinations identified in Table 3. We specifically focused on the 970 nm (O-H stretching overtone) and 1450 nm (O-H stretching combination band) regions, which are strongly correlated with moisture content. Figure 7 visualizes these selected wavelengths on the spectral curves, with red dots indicating selected wavelengths and blue dashed lines marking the 970 nm and 1450 nm positions.
Table 3.
Summary of Optimal Modeling Pathways and Performance for Alfalfa Moisture Prediction Across Different Morphologies and Feature Extraction Methods.
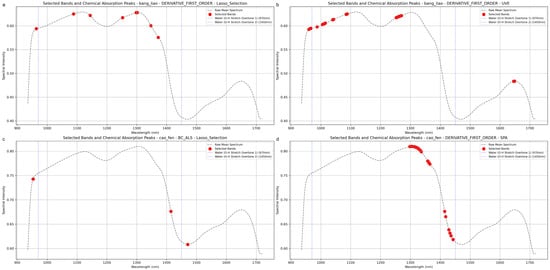
Figure 7.
Visualization of key wavelengths selected by different feature extraction methods, overlaid on the preprocessed alfalfa spectra. The selected bands (red dots) are shown in relation to the two major water absorption features (vertical dashed lines at ~970 nm and ~1450 nm). The subfigures represent: (a) bands selected by SG_1d + Lasso for compressed alfalfa; (b) bands selected by SG_1d + UVE for compressed alfalfa; (c) bands selected by BC_ALS + Lasso for powdered alfalfa; and (d) bands selected by SG_1d + PLS_VIP for powdered alfalfa.
For compressed alfalfa, the SG_1d preprocessing combined with Lasso and UVE methods proved effective. The Lasso method selected a sparse set of wavelengths primarily distributed around the water absorption peak shoulders (~970 nm and ~1450 nm) and regions related to C-H bonds (1050–1200 nm), reflecting its tendency to identify a minimal set of highly influential variables. In contrast, the UVE method retained a larger number of bands, densely covering the 970 nm water peak region (950–1050 nm) and broader regions associated with organic compounds like C-H and N-H bonds (1150–1300 nm and 1600–1700 nm).
For powdered alfalfa, where model performance was generally higher, different feature selection patterns emerged. The SG_1d + PLS_VIP combination selected a dense set of wavelengths, with a strong focus on the 1450 nm water absorption region (1300–1450 nm) and C-H bond areas (1000–1100 nm and 1550–1650 nm). More notably, the BC_ALS + Lasso combination achieved excellent performance (RPD = 3.08) with a remarkably sparse set of only three wavelengths.
Band 1 (~953 nm): Located on the left shoulder of the 970 nm water absorption peak, reflecting changes in water content.
Band 2 (~1471 nm): Located on the right shoulder of the 1450 nm water absorption peak, capturing absorption strength and shape.
Band 3 (~1410–1425 nm): Located on the rising edge (left shoulder) of the 1450 nm absorption band.
These three wavelengths provide complementary coverage of critical water absorption shoulders, enabling robust moisture prediction with minimal features. For powdered alfalfa, optimal pipelines often converged to an ultra-sparse solution, sometimes even a single band near ~970 nm or ~1450 nm, underscoring its potential for simplified, filter-based sensor designs in agricultural contexts.
In summary, wavelength selection strategies were form dependent. For compressed alfalfa, selected wavelengths were sparse and focused on water and key organic matter regions. For powdered alfalfa, advanced preprocessing (e.g., SG_1d) more effectively revealed chemical signals, allowing FE methods to isolate highly relevant wavelengths, often converging to highly parsimonious sets, directly supporting the development of cost-effective moisture sensors.
3.4. Comparative Analysis of Optimal Models and Morphological Differences
Through extensive optimization, form-specific optimal modeling pipelines were identified for each alfalfa form. Their prediction-set performance and robustness were rigorously assessed.
3.4.1. Optimal Prediction Performance
For compressed alfalfa, the optimal model combination was SNV preprocessing + No Feature Extraction (None) + SVR model (Figure 8c). This model achieved = 0.897, = 1.145%, and RPD = 3.11 on the independent test set. The scatter plot in Figure 8c shows predicted and actual values closely distributed around the ideal line, indicating good prediction accuracy. The residual plot in Figure 8a shows residuals randomly distributed around the zero line without obvious systematic bias. An RPD value of 3.11 confirms that this model is suitable for precise moisture prediction and quality control of compressed alfalfa. It is crucial to highlight that the SVR model, even without feature extraction, demonstrated strong robustness in this combination, effectively handling collinearity in the raw full-spectrum data and achieving excellent nonlinear fitting.
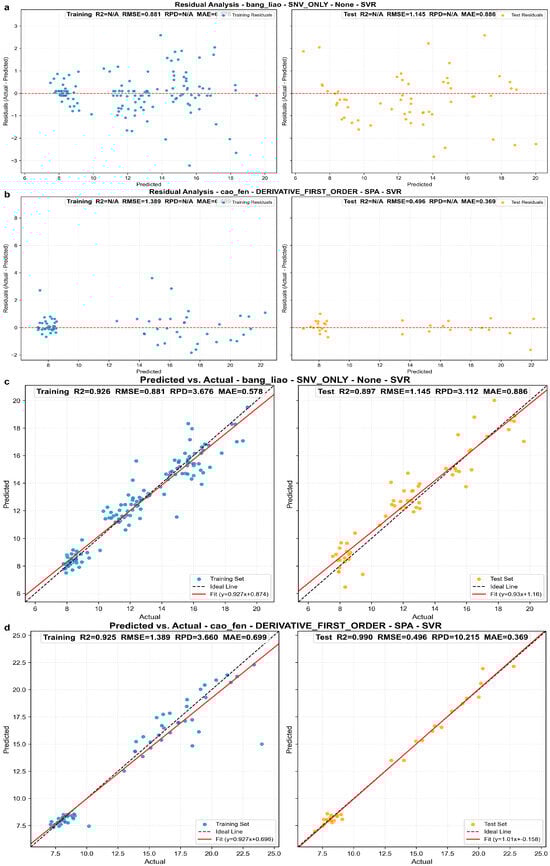
Figure 8.
Prediction performance analysis of optimal models for alfalfa in different morphologies. (a,b) Residual distribution plots for the optimal models for compressed and powdered alfalfa, respectively. The red line represents the LOWESS (Locally Weighted Scatterplot Smoothing) trend line, which helps visualize any systematic bias in the residuals. (c,d) Scatter plots of predicted vs. actual moisture content for the optimal models for compressed and powdered alfalfa. In these plots, the dashed line is the ideal 1:1 reference, and the solid line is the linear regression fit of the predictions.
For powdered alfalfa, the absolute optimal model combination was SG_1d preprocessing + SPA feature extraction + SVR model (Figure 8d). This model exhibited significantly superior performance on the independent test set: = 0.990, = 0.496%, and RPD = 10.22. The scatter plot in Figure 8d clearly shows predicted and actual values in high agreement, almost perfectly aligned with the ideal line, with minimal data dispersion. The residual plot in Figure 8b further confirmed the model’s exceptionally high precision, with very small and uniformly distributed residuals around the zero line. The RPD of 10.22, far exceeding the threshold for precise screening, signifies the model’s extremely strong quantitative prediction capability. In this high-precision model, SVR, as a nonlinear regressor, effectively captured the complex nonlinear relationships inherent in the simplified wavelength set after derivative processing and SPA selection, leading to outstanding predictive performance.
It is noteworthy that in some of the optimal models reported from this single data partition (e.g., in Table 3), the prediction set coefficient of determination () is slightly higher than that of the calibration set (). While counter-intuitive, this phenomenon can occasionally occur in machine learning workflows due to the specific random sampling of a “lucky split,” where the test set happens to be less complex or more concentrated than the training set. This observation underscores the potential pitfalls of relying on a single train-test partition for model assessment. Therefore, to obtain a more reliable and generalized estimation of the models’ true performance, a rigorous repeated evaluation protocol, as detailed in the following section, was imperative.
3.4.2. Robustness and Uncertainty Analysis Across 20 Repetitions
To rigorously assess generalizability, each form’s optimal pipeline underwent 20 independent repetitions with fresh training/prediction set splits. Results are summarized in Table 4 and Figure 9.
Table 4.
Summary of Performance Metrics for Optimal Modeling Pathways across 20 Independent Repetitions.
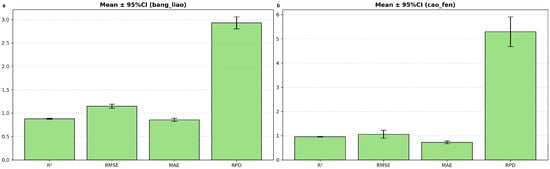
Figure 9.
Mean and 95% CIs of prediction-set metrics across 20 repetitions for compressed (a) and powdered (b) alfalfa.
For compressed alfalfa (SNV + full spectrum + SVR), the model consistently demonstrated a stable and acceptable level of performance. Across the 20 repetitions, the mean test set size () was 60, with an average of 3.34 0.12. The mean was 0.88 (95% CI: 0.870–0.890), mean was 1.148 (95% CI: 1.105–1.191), and mean RPD was 2.93 (95% CI: 2.80–3.06). The RPD values ranged from 2.41 to 3.69 across repetitions, indicating a relatively narrow and consistent performance range (Figure 9a). The selected feature count for this ‘None’ method consistently remained at 224, reflecting the use of the full spectrum, which likely contributed to its stability.
In contrast, powdered alfalfa (SG_1d + SPA + SVR) achieved a significantly higher average performance, but exhibited a broader range of variability across repetitions. The mean was 33, with an average of 5.12 0.19. The mean was 0.953 (95% CI: 0.939–0.968), mean was 1.058% (95% CI: 0.891–1.225), and mean RPD was 5.29 (95% CI: 4.68–5.91). The RPD values spanned a wider range from 2.81 to 7.57, showcasing the impact of different data partitions (Figure 9b). Notably, the SPA feature selection for powdered alfalfa predominantly yielded an extremely parsimonious solution, with the number of selected features consistently converging to 1 band across all repetitions. This minimalist feature set, while powerful on average, likely contributes to the observed run-to-run variability.
This detailed analysis confirms that the peak RPD of 10.22 for powdered alfalfa represents an exceptionally favorable outcome, while the mean RPD ≈ 5.3 provides a more realistic and robust performance expectation for practical deployment. The full distribution of these performance metrics across all 20 repetitions is visualized in the violin plots in Appendix A, Figure A2, which clearly illustrates the greater performance variability for the powdered alfalfa model.
3.4.3. Form-Driven Mechanisms and Practical Implications for Agriculture
The repeated evaluation unequivocally confirms the significantly superior predictive accuracy for powdered alfalfa compared to compressed alfalfa, robustly substantiated by non-overlapping 95% confidence intervals for RPD and (Figure 9 and Table 4). The mean RPD for powdered alfalfa was approximately 1.8 times higher (5.29 vs. 2.93).
This performance gap stems from distinct light-matter interactions. Powdered alfalfa, with its fine particles and large specific surface area, enhances multiple light scattering and increases the effective optical path length. This intensifies and clarifies characteristic water absorption features, making advanced pretreatments like SG_1d highly effective in amplifying chemical signals. The optimal pipeline for powdered alfalfa, utilizing SG_1d and SPA, frequently converged to an ultra-sparse, often single-band model near critical water absorption shoulders (~970 nm or ~1450 nm). While this parsimony delivers high average accuracy, it also renders the model more sensitive to specific data partitions, explaining the wider RPD distribution across repetitions. For compressed alfalfa, the dense internal structure limits light penetration and interaction, resulting in attenuated signals. The full-spectrum approach (SNV + full spectrum + SVR) effectively manages these complexities, yielding a respectable, stable, though lower, prediction accuracy.
These findings directly inform sensor design for agricultural applications. For powdered materials, a low-cost, filter-based sensor targeting a single (or very few) specific water absorption wavelength(s) is highly feasible. For compressed materials, a broader spectral range or more advanced (though potentially more expensive) sensor may be necessary to maintain robust performance.
4. Discussion
The rigorous multi-pathway optimization and repeated evaluation framework of this study provided robust insights into non-destructive moisture prediction in alfalfa. The distinct optimal pipelines for compressed and powdered alfalfa underscore that form is a primary determinant of Hyperspectral Imaging (HSI) model performance. This is not merely an empirical observation but is rooted in fundamental light-matter interaction principles relevant to agricultural materials. Powdered samples, with their increased scattering, effectively amplify the optical path length, thereby intensifying characteristic water absorption features. This amplification makes them more amenable to derivative preprocessing (e.g., SG_1d), which further sharpens these signals, facilitating highly effective wavelength selection methods like SPA. Conversely, the dense nature of compressed samples attenuates signals, favoring a more robust, full-spectrum approach combined with scatter correction (SNV) to manage complex spectral interference.
A significant outcome of this research is the practical guidance it offers for developing cost-effective, dedicated moisture sensors. For powdered alfalfa, our findings strongly advocate for a sensor design based on an ultra-sparse set of wavelengths. The consistent selection of bands near 970 nm or 1450 nm suggests that a simple, low-cost device using custom interference filters or specific-wavelength LEDs could achieve high precision, making large-scale, real-time monitoring economically viable. However, our robustness analysis indicates a trade-off: while a single-band model is cost-optimal, its performance can be sensitive to sample variations. Therefore, for maximum real-world robustness, a sensor incorporating a complementary set of 2–3 key features—such as the bands near 953 nm, 1415 nm, and 1471 nm identified by Lasso—represents a more balanced and reliable solution. In contrast, for compressed alfalfa, the consistent superiority of full-spectrum models implies that a simple filter-based sensor would be inadequate. A robust device for such dense products would likely require a more sophisticated, compact spectrometer capable of capturing a wider spectral range to deconvolve the complex light-matter interactions. These form-specific recommendations provide concrete, actionable insights for translating advanced hyperspectral research into practical tools for the agricultural industry.
Our methodological design, involving 20 independent repetitions with training-only optimization and unseen prediction set evaluation, significantly strengthened confidence in the reported performance metrics. This approach provided not just peak performance values but also their mean, standard deviation, and 95% confidence intervals, offering a more realistic understanding of model robustness for practical agricultural deployment. This represents a crucial step towards reducing the optimism bias often found in spectral modeling studies.
Despite these strengths, transitioning this laboratory-based research to practical at-line or in-process applications requires addressing several key challenges. The models were developed under stable laboratory illumination and static conditions. Real-world deployment will need to account for variable ambient lighting (requiring shielding or advanced calibration). Furthermore, while our study initiated the exploration of physical form, industrial settings present broader variations in sample properties (e.g., variety, origin) and environmental conditions (e.g., temperature, humidity), which can affect spectral signatures. Therefore, a crucial next step is to validate and potentially adapt these models across diverse industrial batches. The fact that our most promising sparse models rely on wavelengths tied to fundamental water absorption physics suggests they may possess greater inherent robustness and transferability, a hypothesis that future model transfer studies should investigate. Ultimately, integrating these validated sensor-enabled models into real-time online monitoring systems represents the next logical step towards advancing smart agriculture.
5. Conclusions
This study presents a comprehensive and rigorously validated framework for non-destructive alfalfa moisture prediction using Near-Infrared Hyperspectral Imaging (NIR–HSI). It specifically addresses two distinct morphologies: compressed blocks and fine powder. Through an exhaustive multipipeline optimization and a stringent repeated evaluation protocol (20 independent repetitions), we identified form-specific optimal modeling pipelines and quantified their robustness.
A key finding confirms that predictive accuracy for powdered alfalfa is significantly superior to that for compressed alfalfa (mean RPD approximately 1.8 times higher). This performance difference stems from form-driven light-matter interactions. For powdered alfalfa, the optimal pipeline (SG_1d + SPA + SVR) often converged to an ultra-sparse, single-band solution (e.g., near ~970 nm or ~1450 nm water absorption shoulders). This minimalist approach offers transformative potential for cost-effective, filter-based sensor deployment in industrial agricultural settings. However, the repeated evaluation also revealed its higher sensitivity to data partitions, indicating a need for careful consideration in practical applications. For compressed alfalfa, a full-spectrum SVR model with SNV pretreatment proved effective in managing attenuated and complex signals.
This research underscores the critical importance of form-specific optimization in hyperspectral analysis for agricultural contexts. It provides validated pipelines, concrete wavelength targets, and insights into model robustness for non-destructive quality assessment and process control in the agricultural industry. While this research provides validated pipelines and concrete wavelength targets for sensor development, future efforts must focus on validating these models under real-world industrial conditions and integrating them into online monitoring systems to realize their full potential in smart agricultural production.
Author Contributions
Conceptualization, H.C. and Y.M.; methodology, H.C.; software, H.C. and C.F.; validation, H.C., H.S. and Y.M.; formal analysis, H.C. and H.D.; investigation, H.C. and Y.M.; resources, Y.M.; data curation, H.C.; writing—original draft preparation, H.C.; writing—review and editing, H.C., T.L. and Y.M.; supervision, Y.M., Z.H. and H.S.; project administration, Y.M. and Z.H.; funding acquisition, Y.M. All authors have read and agreed to the published version of the manuscript.
Funding
This work is partially supported by the Project funded by Science and Technology Planning Project of Inner Mongolia Autonomous Region (No. 2023YFDZ0037), Fundamental Research Funds of Inner Mongolia Agricultural University (Nos. BR221314, BR221032), Interdisciplinary Research Fund of Inner Mongolia Agricultural University (No. BR231517), National Natural Science Foundation of China (No. 32060771), Inner Mongolia Autonomous Region “First-Class Discipline Research Special Project” (Grassland and Special Economic Crop and Food Industry Chain Intelligent Equipment Creation) (No. YLXKZX-NND-046), Capacity Building Project for the Engineering Technology Research Center of Intelligent Equipment for Grassland and Animal Husbandry in Inner Mongolia Autonomous Region (No. BR251042).
Data Availability Statement
The original contributions presented in the study are included in the article, further inquiries can be directed to the corresponding author.
Acknowledgments
The authors acknowledge the chemical testing technical support provided by Inner Mongolia Bocetancy Quality Inspection Technology Co., Ltd. (Hohhot, China).
Conflicts of Interest
The authors declare no conflicts of interest.
Abbreviations
The following abbreviations are used in this manuscript:
| 1D-CNN | One-dimensional Convolutional Neural Networks |
| CI | Confidence Intervals |
| FE | Feature Extraction |
| GBDT | Gradient Boosting Decision Trees |
| IQR | Interquartile Range |
| Mean Absolute Error of Prediction | |
| NIR | Near-Infrared |
| MIV | Mean Impact Value |
| PCA | Principal Component Analysis |
| PRC | People’s Republic of China |
| PSO | Particle Swarm Optimization |
| RBF | Radial Basis Function |
| ROI | Region of Interest |
| Prediction Coefficient of Determination | |
| Root Mean Squared Error of Prediction | |
| SSAB | Soy Sauce-Aroma Type Baijiu |
| SWIR | Short-Wave Infrared |
| TPE | Tree-structured Parzen Estimator |
| SPA | Successive Projections Algorithm |
| CARS | Competitive Adaptive Reweighted Sampling |
| UVE | Uninformative Variable Elimination |
| Lasso | Least Absolute Shrinkage and Selection Operator |
| PLSR | Partial Least Squares Regression |
| SVR | Support Vector Regression |
| RF | Random Forest |
| XGBoost | Extreme Gradient Boosting |
| BPNN | Backpropagation Neural Network |
Appendix A
Table A1.
Outlier handling and stratified sampling settings.
Table A1.
Outlier handling and stratified sampling settings.
| Method | Fixed Value/Range |
|---|---|
| X outliers (PCA) | Retain PCs for ≥95% variance |
| Y outliers (IQR) | Factor = 2.5 |
| Stratified split | 10 equal-frequency Y bins |
Table A2.
Model hyperparameter spaces, sampling, and selection criteria.
Table A2.
Model hyperparameter spaces, sampling, and selection criteria.
| Method | Fixed Value/Range |
|---|---|
| PLSR | n_components in [1, 10] |
| SVR | Kernel = RBF; C in [1 × 10⁻³, 10]; gamma in [1 × 10⁻⁴, 1 × 10³]; epsilon in [0.01, 0.5]; cache_size = 2000 |
| RE | n_estimators in {100, 200, 300}; max_depth in [5, 20]; min_samples_split in {2, 5, 10, 20}; min_samples_leaf in {1, 2, 4, 8} |
| XGBoost | n_estimators in {100, 200, 300, 500}; learning_rate in [0.01, 0.1]; max_depth in [3, 7]; subsample in [0.6, 0.9]; colsample_bytree in [0.6, 0.9]; gamma in [0.1, 5]; reg_alpha in [0.1, 10]; reg_lambda in [1, 10] |
| BPNN | hidden_layers in {1, 2}; width = round(k × Nfeat), k in [0.5, 1.5]; activation in {relu,tanh}; dropout in [0.1, 0.5]; L2 in [1 × 10⁻⁶, 1 × 10⁻³]; Adam lr in [1 × 10⁻⁴, 1 × 10⁻²]; batch in {16, 32, 64}; max_epoch = 500; early stopping (patience = 30, restore_best_weights = True) |
Table A3.
Feature selection and wavelength selection settings.
Table A3.
Feature selection and wavelength selection settings.
| Method | Fixed Value/Range |
|---|---|
| SPA | Exhaustive seed scan; forward step = 1; max_vars in [5, 50]; |
| UVE | Append 20 Gaussian noise vars (scaled to X); CV = 5 |
| PLS_VIP | PLS components h = 5 (fixed) |
| Lasso | Standardize X; CV = 10; max_iter = 10,000; tol = 1 × 10⁻⁴ |
| CARS_MIV | Monte Carlo = 200; initial factor = 2 |

Figure A1.
Scatter Plot of Test versus Test RPD across 20 Independent Repetitions for Optimal Models. (a) Compressed alfalfa; (b) Powdered alfalfa. Each point in the plot represents the performance result from one independent repetition, illustrating the inverse relationship between and RPD.

Figure A2.
Distribution of prediction performance metrics for the optimal models, evaluated across 20 independent run-to-run repetitions. The violin plots illustrate the variability of (i) the coefficient of determination on the prediction set (), (ii) root mean squared error of prediction (), (iii) mean absolute error of prediction (), and (iv) ratio of performance to deviation (RPD). For each violin, the width indicates the density of the results, while the internal box plot shows the median (white dot) and interquartile range. The results compare the performance for (a) the compressed alfalfa model and (b) the powdered alfalfa model.
References
- Yuan, N.; Sun, L.; Du, S.; Ge, G.; Wang, Z.; Li, Y.; Bao, J.; Zhao, M.; Si, Q.; Hao, J.; et al. Effects of harvesting period and storage duration on volatile organic compounds and nutritive qualities of alfalfa. Agriculture 2022, 12, 1115. [Google Scholar] [CrossRef]
- Köninger, M.; von Velsen-Zerweck, A.; Eiberger, C.; Löffler, C.; Töpper, A.; Visscher, C.; Reckels, B.; Vervuert, I. Nutrient composition and feed hygiene of alfalfa, comparison of feed intake and selected metabolic parameters in horses fed alfalfa haylage, alfalfa hay or meadow hay. Animals 2024, 14, 889. [Google Scholar] [CrossRef]
- Hernández, J.; Rojas, L. Alfalfa pelletizing: A review of the process and the quality analysis. J. Anim. Sci. Technol. 2021, 63, e29. [Google Scholar] [CrossRef]
- Du, H.J.; Lei, T.; Ma, Y.; Li, Y.; Yang, X.T. Effect of process parameters on quality of alfalfa block. BioResources 2024, 19, 3234–3248. [Google Scholar] [CrossRef]
- Alhotan, R.A. Commercial poultry feed formulation: Current status, challenges, and future expectations. World’s Poult. Sci. J. 2021, 77, 279–299. [Google Scholar] [CrossRef]
- Driehuis, F.; Elferink, S.J.W.H.O. The impact of the quality of silage on animal health and food safety: A review. Vet. Q. 2000, 22, 212–216. [Google Scholar] [CrossRef]
- Zamudio, D.; Killerby, M.A.; Charley, R.C.; Chevaux, E.; Drouin, P.; Schmidt, R.J.; Bright, J.; Romero, J.J. Factors affecting nutrient losses in hay production. Grass Forage Sci. 2024, 79, 499–515. [Google Scholar] [CrossRef]
- GB 13078-2017; Hygienic Standard for Feed. Standards Press of China: Beijing, China, 2017.
- European Feed Manufacturers’ Federation (FEFAC). Guide to Good Practice for the Manufacturing of Safe Feed Materials, 2020. Available online: https://fefac.eu (accessed on 14 October 2025).
- Zhang, L.; Zhang, Q.; Wu, J.; Liu, Y.; Yu, L.; Chen, Y. Moisture detection of single corn seed based on hyperspectral imaging and deep learning. Infrared Phys. Technol. 2022, 125, 104279. [Google Scholar] [CrossRef]
- Adesokan, M.; Alamu, E.O.; Otegbayo, B.; Maziya-Dixon, B. A review of the use of near-infrared hyperspectral imaging (NIR-HSI) techniques for the non-destructive quality assessment of root and tuber crops. Appl. Sci. 2023, 13, 5226. [Google Scholar] [CrossRef]
- Antony, M.M.; Sandeep, C.S.; Matham, M.V. Hyperspectral vision beyond 3D: A review. Opt. Lasers Eng. 2024, 178, 108238. [Google Scholar] [CrossRef]
- Pham, Q.T.; Liou, N.-S. The development of on-line surface defect detection system for jujubes based on hyperspectral images. Comput. Electron. Agric. 2022, 194, 106743. [Google Scholar] [CrossRef]
- Li, J.; Zhang, R.; Li, J.; Wang, Z.; Zhang, H.; Zhan, B.; Jiang, Y. Detection of early decayed oranges based on multispectral principal component image combining both bi-dimensional empirical mode decomposition and watershed segmentation method. Postharvest Biol. Technol. 2019, 158, 110986. [Google Scholar] [CrossRef]
- Qi, H.; Chen, A.; Yang, X.; Xing, X. Estimation of crude protein content in natural pasture grass using unmanned aerial vehicle hyperspectral data. Comput. Electron. Agric. 2025, 229, 109714. [Google Scholar] [CrossRef]
- Zhong, L.; Fan, Y.; Wu, Y.; Gao, Y.; Gao, Z.; Zhou, A.; Shao, Q.; Zhang, A. Data fusion strategy for rapid prediction of glyceryl trioleate and polysaccharide content in Ganoderma lucidum spore powder based on near-infrared spectroscopy and hyperspectral imaging. J. Food Compos. Anal. 2025, 141, 107403. [Google Scholar] [CrossRef]
- Huang, Q.; Yang, M.; Ouyang, L.; Wang, Z.; Lin, J. Vis/NIR spectroscopy and chemometrics for non-destructive estimation of chlorophyll content in different plant leaves. Sensors 2025, 25, 1673. [Google Scholar] [CrossRef] [PubMed]
- Li, Y.; Ma, B.; Li, C.; Yu, G. Accurate prediction of soluble solid content in dried Hami jujube using SWIR hyperspectral imaging with comparative analysis of models. Comput. Electron. Agric. 2022, 193, 106655. [Google Scholar] [CrossRef]
- Cheng, M.-F.; Mukundan, A.; Karmakar, R.; Valappil, M.A.E.; Jouhar, J.; Wang, H.-C. Modern Trends and Recent Applications of Hyperspectral Imaging: A Review. Technologies 2025, 13, 170. [Google Scholar] [CrossRef]
- Batshev, V.; Machikhin, A.; Martynov, G.; Pozhar, V.; Boritko, S.; Sharikova, M.; Lomonov, V.; Vinogradov, A. Polarizer-Free AOTF-Based SWIR Hyperspectral Imaging for Biomedical Applications. Sensors 2020, 20, 4439. [Google Scholar] [CrossRef]
- Özdoğan, G.; Gowen, A. Wheat grain classification using hyperspectral imaging: Concatenating Vis-NIR and SWIR Data for single and bulk grains. Food Control 2025, 168, 110953. [Google Scholar] [CrossRef]
- Pipatsart, N.; Meenune, M.; Hoonlor, A.; Niamsiri, N.; Punyasuk, N.; Mairhofer, S.; Lertsiri, S. Application of short-wave infrared hyperspectral imaging combined with machine learning on chilling injury detection in fresh coriander. Food Control 2025, 172, 111176. [Google Scholar] [CrossRef]
- Wang, W.; Man, Z.; Li, X.; Chen, R.; You, Z.; Pan, T.; Dai, X.; Xiao, H.; Liu, F. Response mechanism and rapid detection of phenotypic information in rice root under heavy metal stress. J. Hazard. Mater. 2023, 449, 131010. [Google Scholar] [CrossRef]
- Kamruzzaman, M.; Kalita, D.; Ahmed, M.T.; ElMasry, G.; Makino, Y. Effect of variable selection algorithms on model performance for predicting moisture content in biological materials using spectral data. Anal. Chim. Acta 2022, 1202, 339390. [Google Scholar] [CrossRef] [PubMed]
- Cozzolino, D.; Williams, P.J.; Hoffman, L.C. An overview of pre-processing methods available for hyperspectral imaging applications. Microchem. J. 2023, 193, 109129. [Google Scholar] [CrossRef]
- Saha, D.; Manickavasagan, A. Machine learning techniques for analysis of hyperspectral images to determine quality of food products: A review. Curr. Res. Food Sci. 2021, 4, 28–44. [Google Scholar] [CrossRef]
- Rogers, M.; Blanc-Talon, J.; Urschler, M.; Delmas, P. Wavelength and texture feature selection for hyperspectral imaging: A systematic literature review. Food Meas. Charact. 2023, 17, 6039–6064. [Google Scholar] [CrossRef]
- Xu, Z.; Zhang, P.; Wang, Q.; Fan, S.; Cheng, W.; Liu, J.; Wang, H.; Liu, B.; Wu, Y. Comparative study of different wavelength selection methods in the transfer of crop kernel qualitative near-infrared models. Infrared Phys. Technol. 2022, 123, 104120. [Google Scholar] [CrossRef]
- Wang, T.; Zheng, Y.; Xu, L.; Yun, Y.-H. Comprehensive comparison on different wavelength selection methods using several near-infrared spectral datasets with different dimensionalities. Spectrochim. Acta Part A Mol. Biomol. Spectrosc. 2025, 331, 125767. [Google Scholar] [CrossRef] [PubMed]
- Li, B.; Ou-yang, S.-T.; Li, Y.-B.; Lu, Y.-J.; Liu, Y.-D.; Ou-yang, A.-G. Quantitative detection of beef freshness characterized by storage days based on hyperspectral imaging technology combined with physicochemical indexes. J. Food Compos. Anal. 2025, 140, 107303. [Google Scholar] [CrossRef]
- Li, S.; Shao, X.; Guo, Z.; Wang, H.; Lu, F.; Darwish, I.A.; Sun, X.; Guo, Y. Novel detection method for Aspergillus flavus contamination in maize kernels based on spatial-spectral features using short-wave infrared hyperspectral imaging. J. Food Compos. Anal. 2025, 140, 107219. [Google Scholar] [CrossRef]
- Wu, Y.; Wang, B.; Chen, J.; Huang, X.; Xu, J.; Wei, W.; Chen, K. Non-destructive prediction and pixel-level visualization of polysaccharide-based properties in ancient paper using SWNIR hyperspectral imaging and machine learning. Carbohydr. Polym. 2025, 352, 123198. [Google Scholar] [CrossRef]
- Park, J.-J.; Park, S.-K.; Yun, D.-Y.; Lee, G.; Kim, S.S.; Park, K.-J.; Lim, J.-H.; Choi, J.-H.; Cho, J.-S. Non-destructive quantification of sea lettuce in laver using hyperspectral imaging with hybrid spectral feature selection techniques. Food Biosci. 2025, 66, 106272. [Google Scholar] [CrossRef]
- Guo, Z.; Zhang, J.; Ma, C.; Yin, X.; Guo, Y.; Sun, X.; Jin, C. Application of visible–near-infrared hyperspectral imaging technology coupled with wavelength selection algorithm for rapid determination of moisture content of soybean seeds. J. Food Compos. Anal. 2023, 116, 105048. [Google Scholar] [CrossRef]
- Qiao, M.; Xia, G.; Xu, Y.; Cui, T.; Fan, C.; Li, Y.; Han, S.; Qian, J. Generic prediction model of moisture content for maize kernels by combing spectral and color data through hyperspectral imaging. Vib. Spectrosc. 2024, 131, 103663. [Google Scholar] [CrossRef]
- Li, M.; Yang, J.; Guo, X.; Sun, R.; Zhang, G.; Liu, W.; Liu, Y.; Wang, Z.; Yuan, Y.; Yue, T. A rapid and nondestructive quantitative detection method for total and organic selenium in selenium-enriched kefir grain based on hyperspectral imaging. Food Control 2025, 169, 110958. [Google Scholar] [CrossRef]
- Yuan, W.; Zhou, H.; Zhang, C.; Zhou, Y.; Wu, Y.; Jiang, X.; Jiang, H. Determination and visualization of moisture content in Camellia oleifera seeds rapidly based on hyperspectral imaging combined with deep learning. Spectrochim. Acta Part A Mol. Biomol. Spectrosc. 2025, 330, 125676. [Google Scholar] [CrossRef]
- Miao, P.; Hao, N.; Zhao, Q.; Ping, J.; Liu, C. Non-destructive determination of ginsenosides in ginseng by combined hyperspectral and X-ray techniques based on ensemble learning. Food Chem. 2024, 437, 137828. [Google Scholar] [CrossRef]
- Zhang, D.; Chen, X.; Lin, Z.; Lu, M.; Yang, W.; Sun, X.; Battino, M.; Shi, J.; Huang, X.; Shi, B.; et al. Nondestructive detection of pungent and numbing compounds in spicy hotpot seasoning with hyperspectral imaging and machine learning. Food Chem. 2025, 469, 142593. [Google Scholar] [CrossRef] [PubMed]
- Huang, Y.; Tian, J.; Yang, H.; Hu, X.; Xie, L.; Zhou, Y.; Xia, Y.; Huang, D. Utilization of hyperspectral imaging for the analysis of aroma components of soy sauce-aroma type Baijiu. J. Food Compos. Anal. 2024, 134, 106498. [Google Scholar] [CrossRef]
- Vera, W.; Salvador-Reyes, R.; Quispe-Santivañez, G.; Kemper, G. Detection of adulterants in powdered foods using near-infrared spectroscopy and chemometrics: Recent advances, challenges, and future perspectives. Foods 2025, 14, 3195. [Google Scholar] [CrossRef]
- Cozzolino, D. The sample, the spectra and the maths—The critical pillars in the development of robust and sound applications of vibrational spectroscopy. Molecules 2020, 25, 3674. [Google Scholar] [CrossRef]
- Román-Ospino, A.D.; Singh, R.; Ierapetritou, M.; Ramachandran, R.; Méndez, R.; Ortega-Zuñiga, C.; Muzzio, F.J.; Romañach, R.J. Near infrared spectroscopic calibration models for real-time monitoring of powder density. Int. J. Pharm. 2016, 512, 61–74. [Google Scholar] [CrossRef]
- Liu, Q.; Jiang, X.; Wang, F.; Fan, S.; Zhu, B.; Yan, L.; Chen, Y.; Wei, Y.; Chen, W. Evaluation and process monitoring of jujube hot air drying using hyperspectral imaging technology and deep learning for quality parameters. Food Chem. 2025, 467, 141999. [Google Scholar] [CrossRef]
- Li, Y.-h.; Tan, X.; Zhang, W.; Jiao, Q.-b.; Xu, Y.-x.; Li, H.; Zou, Y.-b.; Yang, L.; Fang, Y.-p. Research and application of several key techniques in hyperspectral image preprocessing. Front. Plant Sci. 2021, 12, 627865. [Google Scholar] [CrossRef] [PubMed]
- Khamsopha, D.; Teerachaichayut, S. Detection of adulteration of tapioca starch with dolomite by near infrared hyperspectral imaging. Key Eng. Mater. 2020, 862, 46–50. [Google Scholar] [CrossRef]
- Wang, B.; Sun, J.; Xia, L.; Liu, J.; Wang, Z.; Li, P.; Guo, Y.; Sun, X. The applications of hyperspectral imaging technology for agricultural products quality analysis: A review. Food Rev. Int. 2021, 38, 1269–1292. [Google Scholar] [CrossRef]
- Zhang, L.; Nie, P.; Zhang, S.; Zhang, L.; Sun, T. Research on defect detection in Kubo peach based on hyperspectral imaging technology combined with CARS-MIV-GA-SVM method. Foods 2023, 12, 3593. [Google Scholar] [CrossRef]
- Chen, X.; Jiao, Y.; Liu, B.; Chao, W.; Duan, X.; Yue, T. Using hyperspectral imaging technology for assessing internal quality parameters of persimmon fruits during the drying process. Food Chem. 2022, 386, 132774. [Google Scholar] [CrossRef]
- Ping, J.; Hao, N.; Guo, X.; Miao, P.; Guan, Z.; Chen, H.; Liu, C.; Bai, G.; Li, W. Rapid and accurate identification of Panax ginseng origins based on data fusion of near-infrared and laser-induced breakdown spectroscopy. Food Res. Int. 2025, 204, 115925. [Google Scholar] [CrossRef]
- Li, F.; Shen, J.; Yang, Q.; Wei, Y.; Zuo, Y.; Wang, Y.; Ning, J.; Li, L. Monitoring quality changes in green tea during storage: A hyperspectral imaging method. Food Chem. X 2024, 23, 101538. [Google Scholar] [CrossRef]
- Jin, S.; Liu, X.; Wang, J.; Pan, L.; Zhang, Y.; Zhou, G.; Tang, C. Hyperspectral imaging combined with fluorescence for the prediction of microbial growth in chicken breasts under different packaging conditions. LWT 2023, 181, 114727. [Google Scholar] [CrossRef]
- Yan, Y.; Yang, J.; Li, B.; Qin, C.; Ji, W.; Xu, Y.; Huang, Y. High-resolution mapping of soil organic matter at the field scale using UAV hyperspectral images with a small calibration dataset. Remote Sens. 2023, 15, 1433. [Google Scholar] [CrossRef]
- Ye, M.; Zhu, L.; Li, X.; Ke, Y.; Huang, Y.; Chen, B.; Yu, H.; Li, H.; Feng, H. Estimation of the soil arsenic concentration using a geographically weighted XGBoost model based on hyperspectral data. Sci. Total Environ. 2023, 858, 159798. [Google Scholar] [CrossRef] [PubMed]
- Bai, Z.; Tian, J.; Hu, X.; Sun, T.; Luo, H.; Huang, D. A back-propagation neural network model using hyperspectral imaging applied to variety nondestructive detection of cereal. J. Food Process Eng. 2022, 45, e13973. [Google Scholar] [CrossRef]
Disclaimer/Publisher’s Note: The statements, opinions and data contained in all publications are solely those of the individual author(s) and contributor(s) and not of MDPI and/or the editor(s). MDPI and/or the editor(s) disclaim responsibility for any injury to people or property resulting from any ideas, methods, instructions or products referred to in the content. |
© 2025 by the authors. Licensee MDPI, Basel, Switzerland. This article is an open access article distributed under the terms and conditions of the Creative Commons Attribution (CC BY) license (https://creativecommons.org/licenses/by/4.0/).