
Weather Conditions, Orchard Age and Nitrogen Fertilization Influences Yield and Quality of ‘Łutówka’ Sour Cherry Fruit


Department of Ornamental Plants, Dendrology and Pomology, Poznań University of Life Sciences, Dąbrowskiego 159, 60-594 Poznań, Poland
*
Author to whom correspondence should be addressed.
Agriculture 2022, 12(12), 2008; https://doi.org/10.3390/agriculture12122008
Submission received: 25 September 2022
/
Revised: 20 November 2022
/
Accepted: 22 November 2022
/
Published: 25 November 2022
(This article belongs to the Special Issue The Impact of Environmental Factors on Fruit Quality)
Abstract
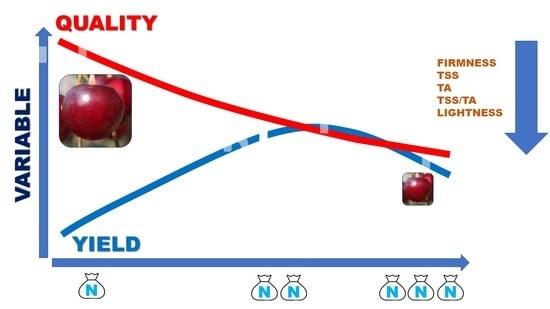
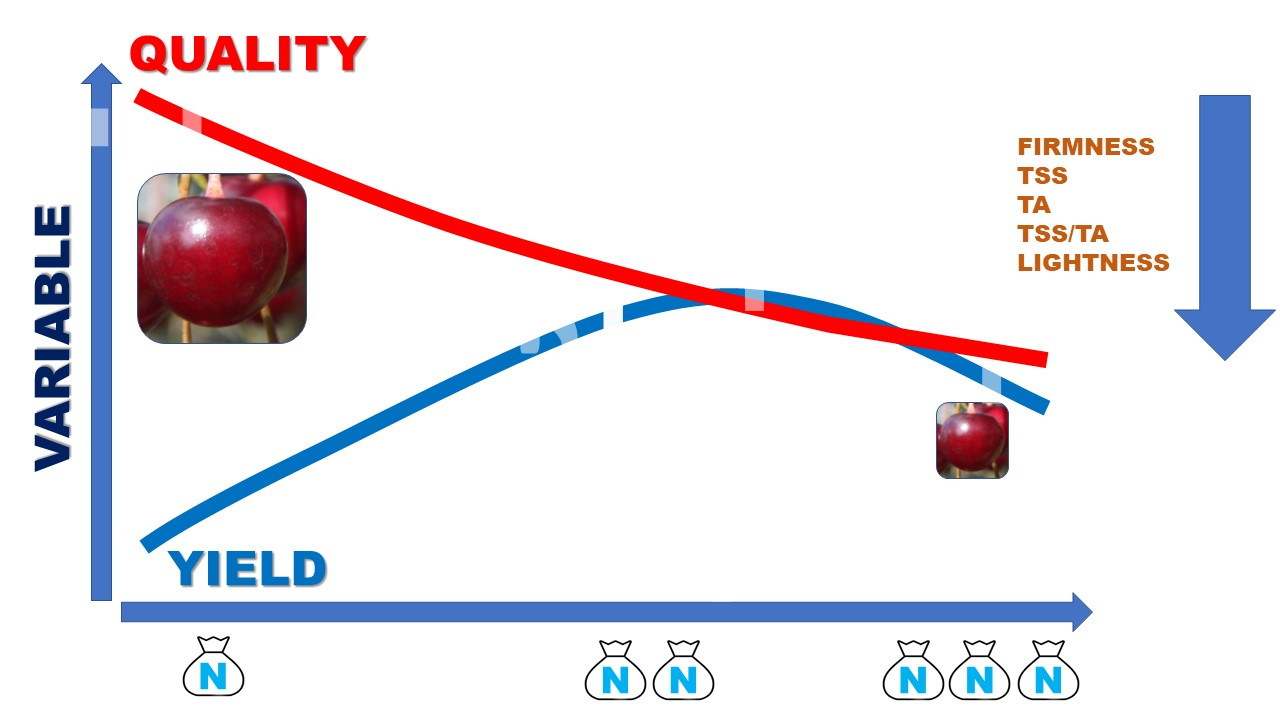
:Nitrogen fertilization is a basic agrotechnical orchard treatment, and affects quality and size of the crops. The aim of this study was to assess the impact of nitrogen fertilization on the yield and quality of sour cherry fruit of the ‘Łutówka’ cultivar. The course of climatic conditions in relation to the timing of flowering and fruiting was analyzed. The trials were carried out in three different experimental sour cherry orchards (quarters) with different planting dates (1999, 2001 and 2002) located at the experimental orchard of the Poznań University of Life Sciences in Poland. In each orchard, three levels of fertilization were used: control without fertilization, fertilization at a dose of 60 kg N ha−1 and fertilization at 120 kg N ha−1. Increasing the dose of N did not have a significant effect on sour cherry yield. However, it resulted in a reduction of fruit weight, extract content, acidity and TSS/TA ratio, whereas the brightness (L*) and redness (a*) of the fruit surface color increased. Temperature and precipitation had the greatest influence on the course of flowering, fruiting and fruit ripening. Particularly important was the course of climatic conditions at the beginning of the growing season, especially during flowering, when there is a high risk of spring frosts. The timing of flowering and fruiting was correlated with the sum of active temperatures. The greatest relationship for the flowering date was found for SAT (sum of active temperatures) when the base temperature equals 11 °C and the temperature for the harvest date equals 9 °C.
1. Introduction
Sour (tart) cherry (Prunus cerasus L.) species are native to south-eastern Europe and Asia and is a species that tolerate low temperatures. Sour cherry trees withstand temperature drops up to −26 °C, which allows them to be grown in most European regions, including Poland. Fruit production is an important branch of agriculture in Poland [1,2,3]. Europe produces 80% of the sour cherries consumed worldwide, with Poland alone contributing 10%, making it the largest sour cherry produced in the world [4]. Cultivation is concentrated in the central and eastern part of Polish territory due to favorable climatic and soil conditions. The most suitable soils for sour cherry growth are permeable, where the groundwater level is located at a depth of less than 1.7 m [5]. The share of Poland to the European production is 15–18%, depending on the year and the weather conditions. Sour cherry blossom often occurs during the frost periods in Poland, and negative temperatures at this time cause damage to flowers or fruit buds. The spring period is characterized by a high variability of climatic conditions. The occurrence of spring frosts or low temperatures and high precipitation limits the pollination of flowers and, consequently, fruit yield [1,6].
The basic system for soil maintenance in orchards is the use of grass in the strips between the tree rows and the fallow herbicide in the strip under the trees [7,8]. However, many years of application of preemergence herbicides reduces the amount of organic matter in the soil and has a negative effect on soil microorganisms [9]. On the other hand, the use of herbicides causes the increase of N concentration in the leaves [10]. The reason for the higher absorbable nitrogen (especially nitrate) is apparently the lack of competition of grasses or weeds in the herbicide belt, as well as the transfer of significant amounts of nitrogen from removed grass to the turf strips [11]. A clear reaction to nitrogen fertilization in a sour cherry orchard occurs in older trees when most of the root system is already under the turf [12]. The basic method of fertilization in fruit production is soil mineral fertilization [13], providing primarily components such as nitrogen, potassium and phosphorus. Unlike nitrogen, phosphorus and potassium are components that move slowly through the soil and are not washed out into deeper layers of soil and groundwater [14]. Nitrate leaching into groundwater may intensify on mineral soils with low sorption capacity [3]. Nitrogen fertilization results in better vegetative growth [15] but too high nitrogen disturbs the balance between growth and yield, and contributes to the imbalance between minerals in the soil. Applied too late, it extends the growing season, which delays the entry of trees into the dormant period and increases their sensitivity to low temperatures in the winter. The use of nitrogen at the end of the growing season results in lower flowering intensity, fruit setting, the number of flowers in the bud and the yield of trees [15].
An increase in nitrogen fertilization doses above a certain level does not increase yield, and results in production of fruit with lower quality and shorter storage life [10,15,16]. It is assumed that the nutritional needs of trees are much lower than those of annual plants. This is confirmed by many years of research, where the very low phosphorus content in the soil did not affect the yield and content of this element in the sour cherry leaves [10,17]. The greatest impact on yield is the potassium content in the soil [10,18] Different cultivars respond poorly to potassium and phosphorus fertilization [19]. Differences in nitrogen uptake were found depending on the rootstock used. The grafted Prunus mahaleb L. has a lower ability to take up potassium than the rootstock Prunus avium L. [10,20]. The effect of using fertilization of fruit trees is visible in the following years [16,21,22,23].
Sour cherry fruits are used primarily as industrial fruits from which juices, jams, alcohols and bakery products are produced. From whole fruits, compotes and frozen food are made. Only a small proportion of the cultivars have characteristics that make them attractive for direct consumption. Sour cherry cultivars intended for fresh consumption should be characterized by large size, dark color, balanced ratio of sugars to acids and relatively low acidity [24]. High acidity is desirable in fruits intended for processing, affecting the taste of finished products [25]. In addition, the content of aromatic compounds and firmness are important [24].
The popularity of the sour cherry ‘Łutówka’ cultivar is due to the fact that in addition to high yield, it meets the requirements of the industry. This cultivar characterized by a high content of extract and also the intensity of the color. These features are important in the production of juices and jams. Other important features of this cultivar are the large weight of fruit and the high ratio of pulp to pit, which makes the waste in the production of juices small [25]. Fruit intended for processing should have a higher acidity and extract content than fruit intended for direct consumption [26]. The higher extract content reduces the cost of concentrating the juice by producing a concentrate, which is a standard commercial product. Shorter juice heating also reduces the loss of anthocyanins and other temperature-sensitive antioxidants. The content of anthocyanin dyes and phenolic compounds, which are distributed primarily in the skin [27] is correlated with the color of the fruit [25,28] A correlation was found between the total content of anthocyanin compounds in sour cherries and the color parameter a* of the CIE L*a*b* system [29]. Therefore, dark colored skin is a very desirable feature in processing, as it affects the color of the final product.
Overfertilization leads to elevated levels of N in the soil, accumulating in the form of nitrates, which are not bound by a constant phase of the soil. Not taken up by plants, it is very easily washed out into deeper layers of soil beyond the reach of the root system and then part of it enters the groundwater and some enters the atmosphere as N2O (greenhouse gas). Nitrogen fertilization doses must be optimized to balance the amount of N supplied to trees with minimal risk of environmental contamination [30]. Abundant nitrogen mineral fertilization is a source of environmental pollution, because nitrogenous compounds due to high mobility penetrate into groundwater [21,31,32,33]. The aspect of environmental protection was an element that additionally contributed to the implementation of the described research.
The main objective of this study was to determine the optimal nitrogen dose for sour cherry orchards, the effect of nitrogen levels on yield and quality of the fruit and the impact of climacteric factors on flowering, fruit ripening and fruit quality.
2. Materials and Methods
Sour cherry (Prunus cerasus L.) trees of cultivar ‘Łutówka’ (‘Schattenmorelle’, ‘English Morello’), type IR2, grafted on the rootstock of mahaleb cherry (Prunus mahaleb L.) planted on different dates (orchard one—1999 (OR 1), orchard two—2001 (OR 2) and orchard three—2002 (OR 3)) at the experimental orchard of Poznan University (52°31′23.6″ N 16°39′18.6″ E) in Poland were used for this study. The trials were carried out over a period of eight years (2006–2013).
The distance between the rows of trees in all the orchards was 4 m. In the first orchard (OR 1), trees were planted in rows every 2.0 m. After 2 years, due to the still large space between the trees, it was decided to compact the trees, and orchards OR 2 and OR 3 were planted at a density every 1.3 m. The trees were formed and cut annually, giving the crown the shape of a wide spindle.
In the orchard under the trees and inter-row grass, black fallow herbicide (Roundup 360 SL, Monsanto Europe N.V., Brussels, Belgium) was used. Protection against diseases and pests was carried out according to the recommendations for production orchards for the years 2006–2013 [34].
Before the experiment was established, a chemical analysis of the soil was performed, and mineral fertilization was carried out on its results [35]. Soil preparation for each orchard was carried out taking into account the two-year period in which green fertilizers and liming of the soil were applied. Before planting, potassium (200 kg·ha−1 K2O), phosphorus (185 kg·ha−1 P2O5) and 60 t·ha−1 manure fertilization were applied to each orchard.
2.1. Nitrogen Fertilization
The experiment was established in a system of random blocks in four replicates. In each replication there were 5 trees, with a total 20 trees for one treatment, and between the combinations, an insulating gap with another two trees was used.
The following fertilization treatments were used:
- 0 kg N ha−1 (N0), control without fertilization;
- 60 kg N ha−1 (N60);
- 120 kg N ha−1 (N120).
Nitrogen fertilization was carried out annually between 10 and 20 April before tree flowering using 34% ammonium nitrate.
2.2. Measurements, Observations and Analyses
2.2.1. Vegetative Growth
Truck cross-sectional area (TCSA) was calculated from the measurements of the tree trunks taken at a height of 30 cm from the ground. Measurements were taken after the end of the growing season between 10 and 20 November.
2.2.2. Fruit Yield and Fertility
The date of harvesting was established based on fruit ripeness (full colored typical for cultivar and easy moving away from the peduncle). The fruits were harvested from each tree separately. The result was presented as the average yield from the tree and the sum of the yield from the tree in the years 2006–2013. Unit yield per tree (kg·tree−1) was converted into yield per hectare (t·ha−1). Based on the results obtained, the coefficient of fertility of trees (kg·cm−2 TCSA) was calculated.
2.2.3. Fruit Quality
During the harvest period, fruit samples were taken for quality assessment. The size of a single sample was 200 fruits harvested from five trees in repetition. The fruit on the tree of the ‘Łutówka’ cultivar ripens evenly; however, to ensure the sample is representative for quality tests, the fruits were harvested from half the height of the crown and the outer lots. This method of collection of fruits of quality tests has been used for all years, and in our opinion, allows you to compare the results.
The fruit quality assessment was carried out on the basis of the following five measurements:
- -
- Weight of fruits—from each repetition, a group of 100 fruits were taken and weighed with an accuracy of 0.1 g.
- -
- Fruit firmness—determined individually for 100 fruits from each repetition using a firmness tester model FT 02 (Facchini Srl, Alfonsine, Italy), which was fixed on a tripod. This test consists of piercing the fruit (whole fruits with peel) with a stem with a diameter of 2.5 mm. Results were expressed in newtons (N).
- -
- Total Soluble Solids (TSS)—the research was conducted on the same fruits analyzed for firmness and mass. The measurement was made using the PR-101a electronic refractometer (Atago Co., Ltd., Tokyo, Japan). The measurement value was expressed in °Brix.
- -
- Titratable acidity (TA) of the fruit was measured with a pH meter (pH 538, WTW, Gerbershausen, Germany) calibrated with pH 4 and 7 buffers. From each repetition, 50 fruits were taken, and 150 mL of juice was squeezed. In total, 5 mL was taken for analysis, 50 mL of distilled water was added and 0.1 N NaOH was titrated, neutralizing the acid solution to achieve pH 8.1. On the basis of the amount of NaOH consumed, the acidity was calculated and the result was converted into the percentage of malic acid.
- -
- The color of the fruit skin was measured with a manual Minolta CR-100 colorimeter (Minolta Corp., USA) and recorded using the uniform CIE L* a* b* color space. The value of L* reflects the brightness of the color, a* specifies the proportions of red (positive values) and green (negative values), while b* determines the proportion of yellow (positive values) and blue (negative values). Parameters a* and b* define the chromaticity of a color, whereas the parameter L* define its luminance, related to the size of the luminous flux that reflects from the object and reaches the eye of the observer. The numeric values a* and b* have been converted to a Hueab angle value (h° = tan−1 b*/a*), chroma (C* = ((a*)2 + (b*)2)0.5) [36,37], tomato color index (COL = (2000 × a)/(L × (a2 + b2)0.5)) [38] and index CIRG = (180h)/(L* + C) [39,40].
2.3. Weather Conditions
Climatic conditions were recorded using the automatic meteorological station iMetos (Pessl Instruments, Werksweg, Austria), which was located in the orchard. Temperatures were measured at a height of 2 m above ground level (Table 1, Table 2 and Table 3).
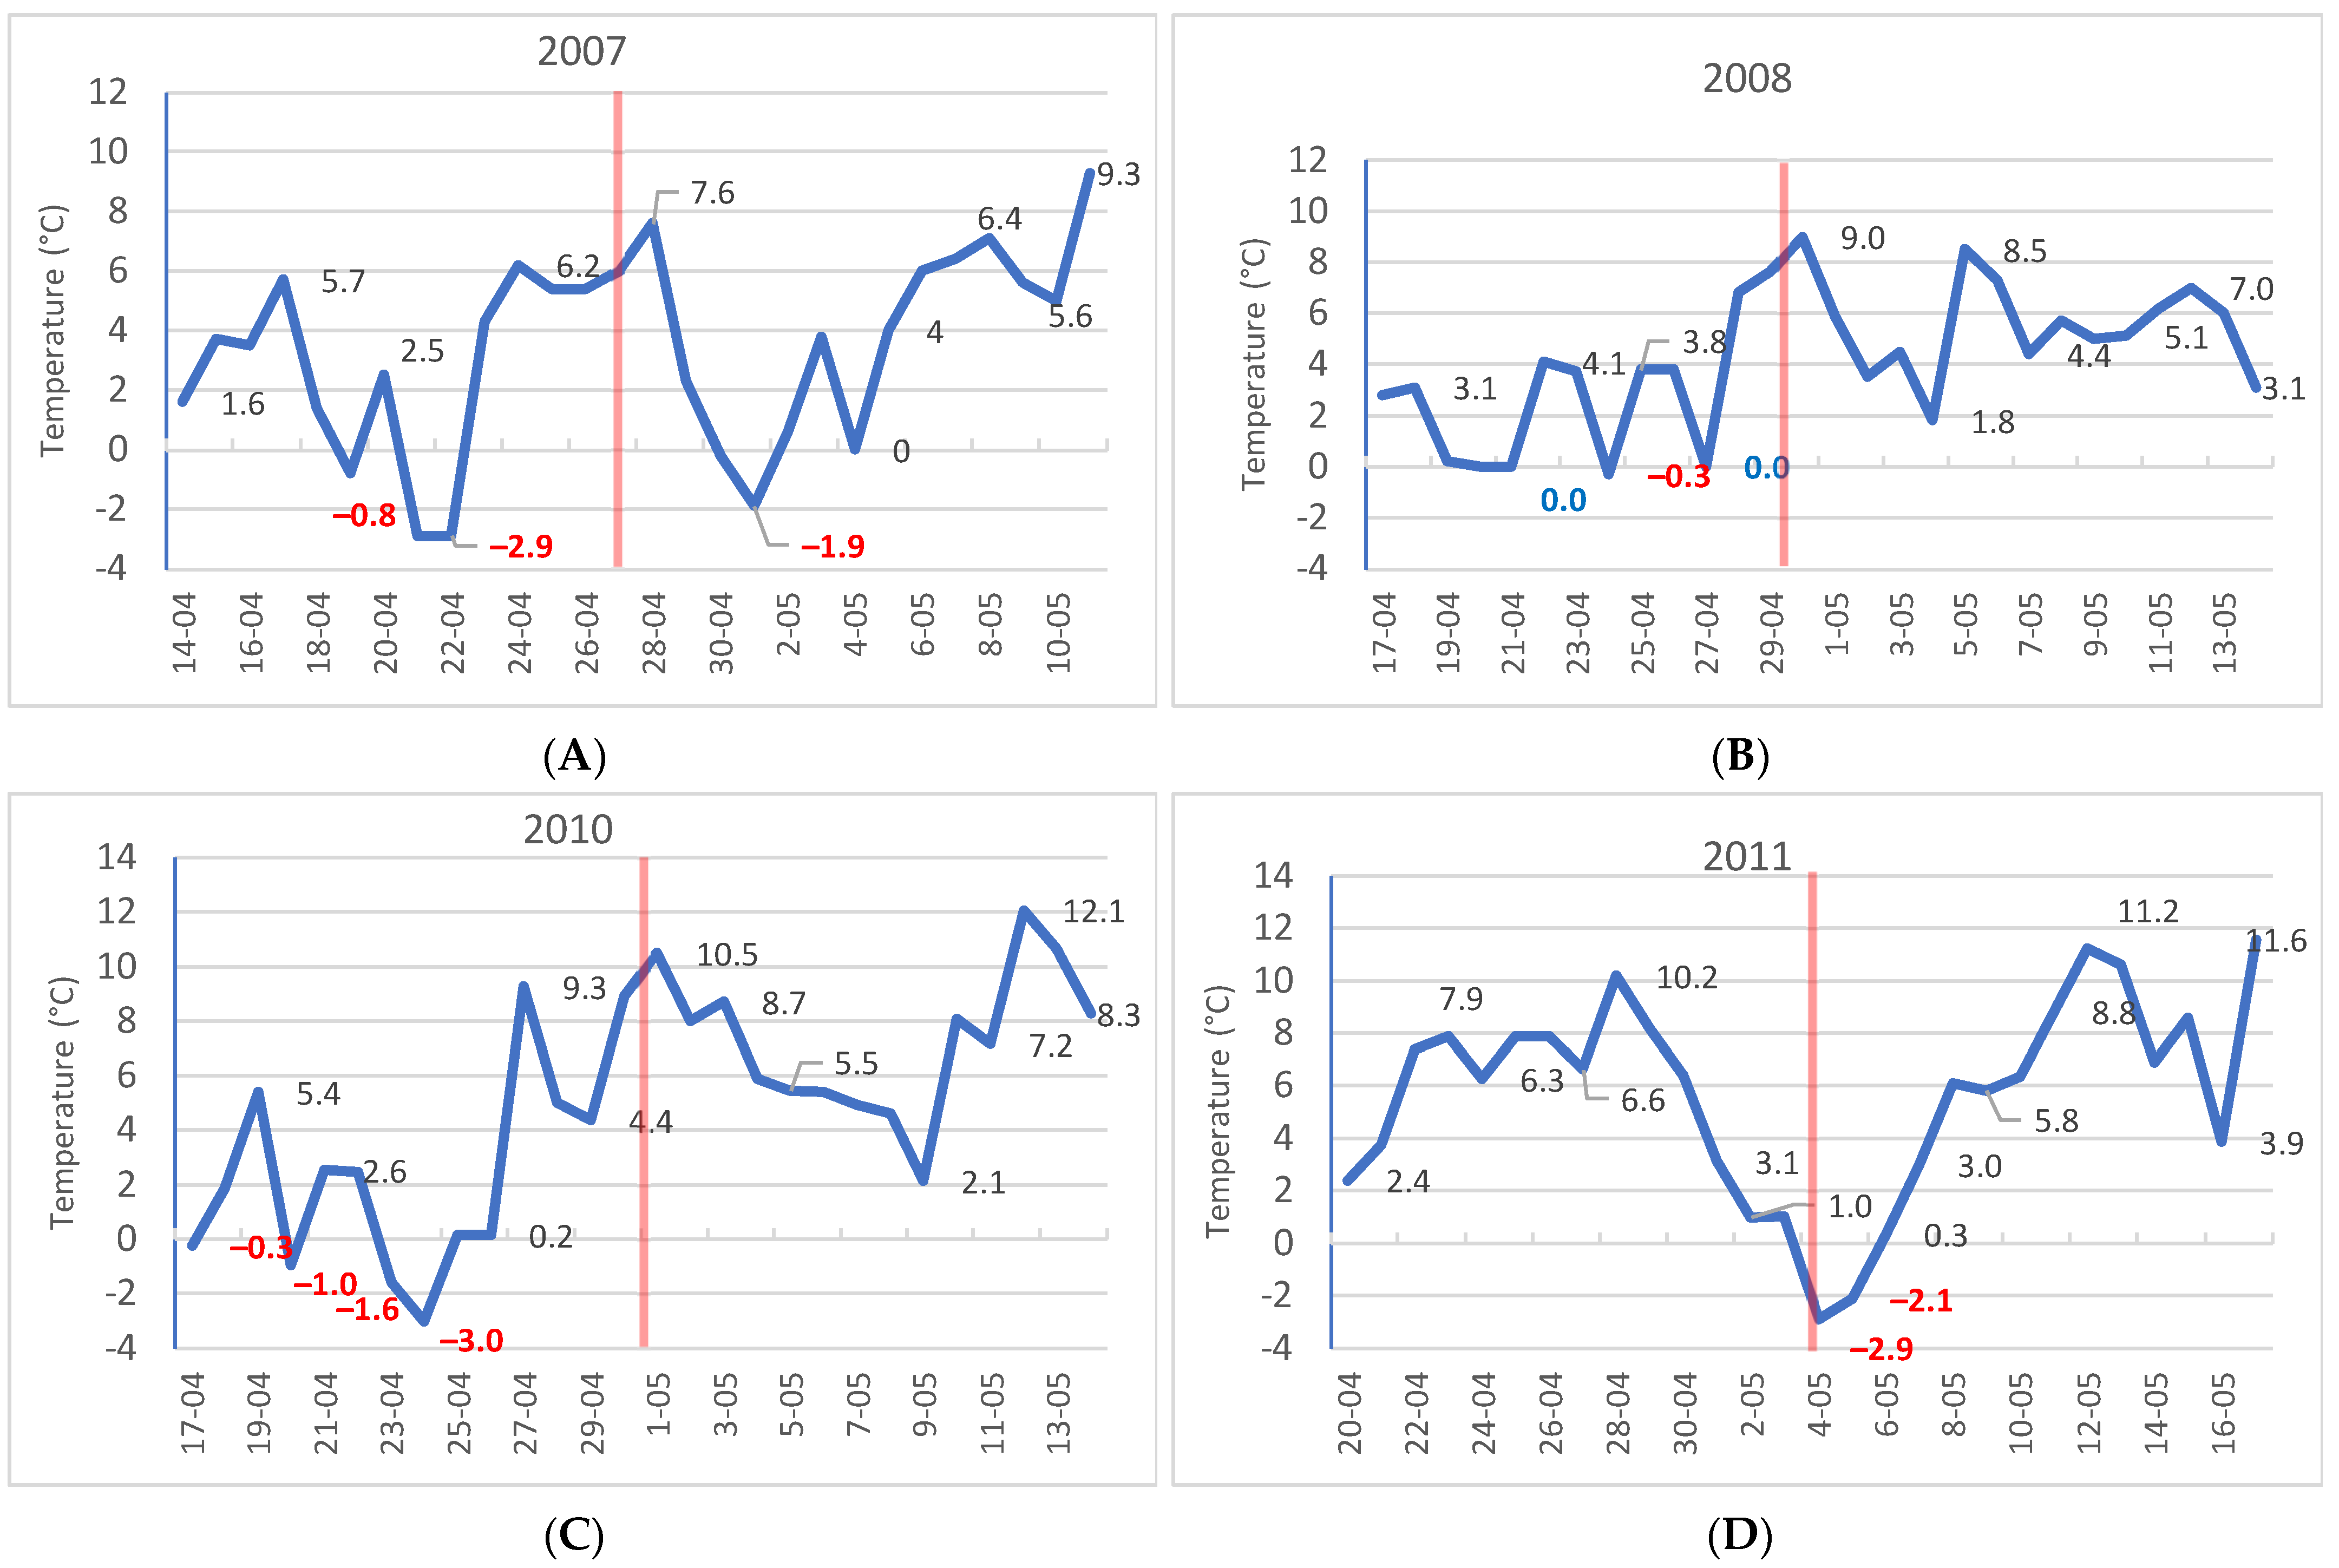
In 2007 and 2011, there were spring frosts, which caused damage to flowers and fruit buds. In the spring of 2009, the conditions were optimal, but hailstorms reduced the yield and quality of the fruit. In other years, the climatic conditions were conducive to pollination and fertilization of fruits (Figure 1A–D).
2.4. Statistical Analysis
The data were subjected to a one-way and two-way ANOVA using Statistica 13.3 (TIBCO Software Inc., Palo Alto, CA, USA). Multiple comparisons of means were performed with Duncan test (p = 0.05). Pearson’s correlation coefficient was also calculated.
3. Results and Discussions
3.1. Fruit Yield
The sour cherry yield depended on the weather conditions during the period the study was conducted. The climatic conditions are presented in Table 1, Table 2 and Table 3 and Figure 1A–D. Spring frosts that occurred during flowering and fruit establishment in four of the eight years of the study had a significant impact on yield. Decrease in yield depended on the minimum temperature, which confirms the resistance of flowers to minor frosts. Damages caused by minor spring frosts can be reduced by the use of chemicals that increase the resistance of plants to damage. Such research was not carried out in this orchard, but studies conducted on apple trees in the same farm in the same years when sour cherries were damaged (2006–2008) proved that the use of 5-aminolevulinic acid (5-ALA) increase resistance to low temperatures [41].
In 2008, spring frost was the weakest and did not cause a significant decrease in yield. In 2007, the decrease in yield was significant, but it was only about 15%. In 2010 and 2011, frosts caused large losses and reduced yield by 65 and 70%, respectively, and the tree yield was below 3 kg. In other years, the average yield per tree ranged from 6.4 to 8.7 kg. The occurrence of strong spring frosts can cause damage not only to flowers or fruit buds, but also to young shoots and leaves, which usually leads to trees shedding even those few buds that survived frost [6,42]. The occurrence of temperatures below 10 °C and rainfall during flowering makes it difficult for insects to pollinate flowers, which reduces the percentage of pollinated and fertilized flowers. A better fruit setting occurs if the flowers are pollinated within 1 to 2 days after opening [1,43]. If the temperature drops below −2.5 °C during full flowering, this can cause complete destruction of the flowers. On the other hand, if 50% of the flowers are pollinated, high fruit yield can be obtained [44], which ranges from 8 to 13 t ha−1 [45,46]. According to other reports, a satisfactory yield can be obtained even if 25–30% of flowers tie fruits [43]; however, it should be emphasized that this type of calculation is fraught with a large error, because it depends on the abundance of flowering or the number of flower buds tied in the previous year.
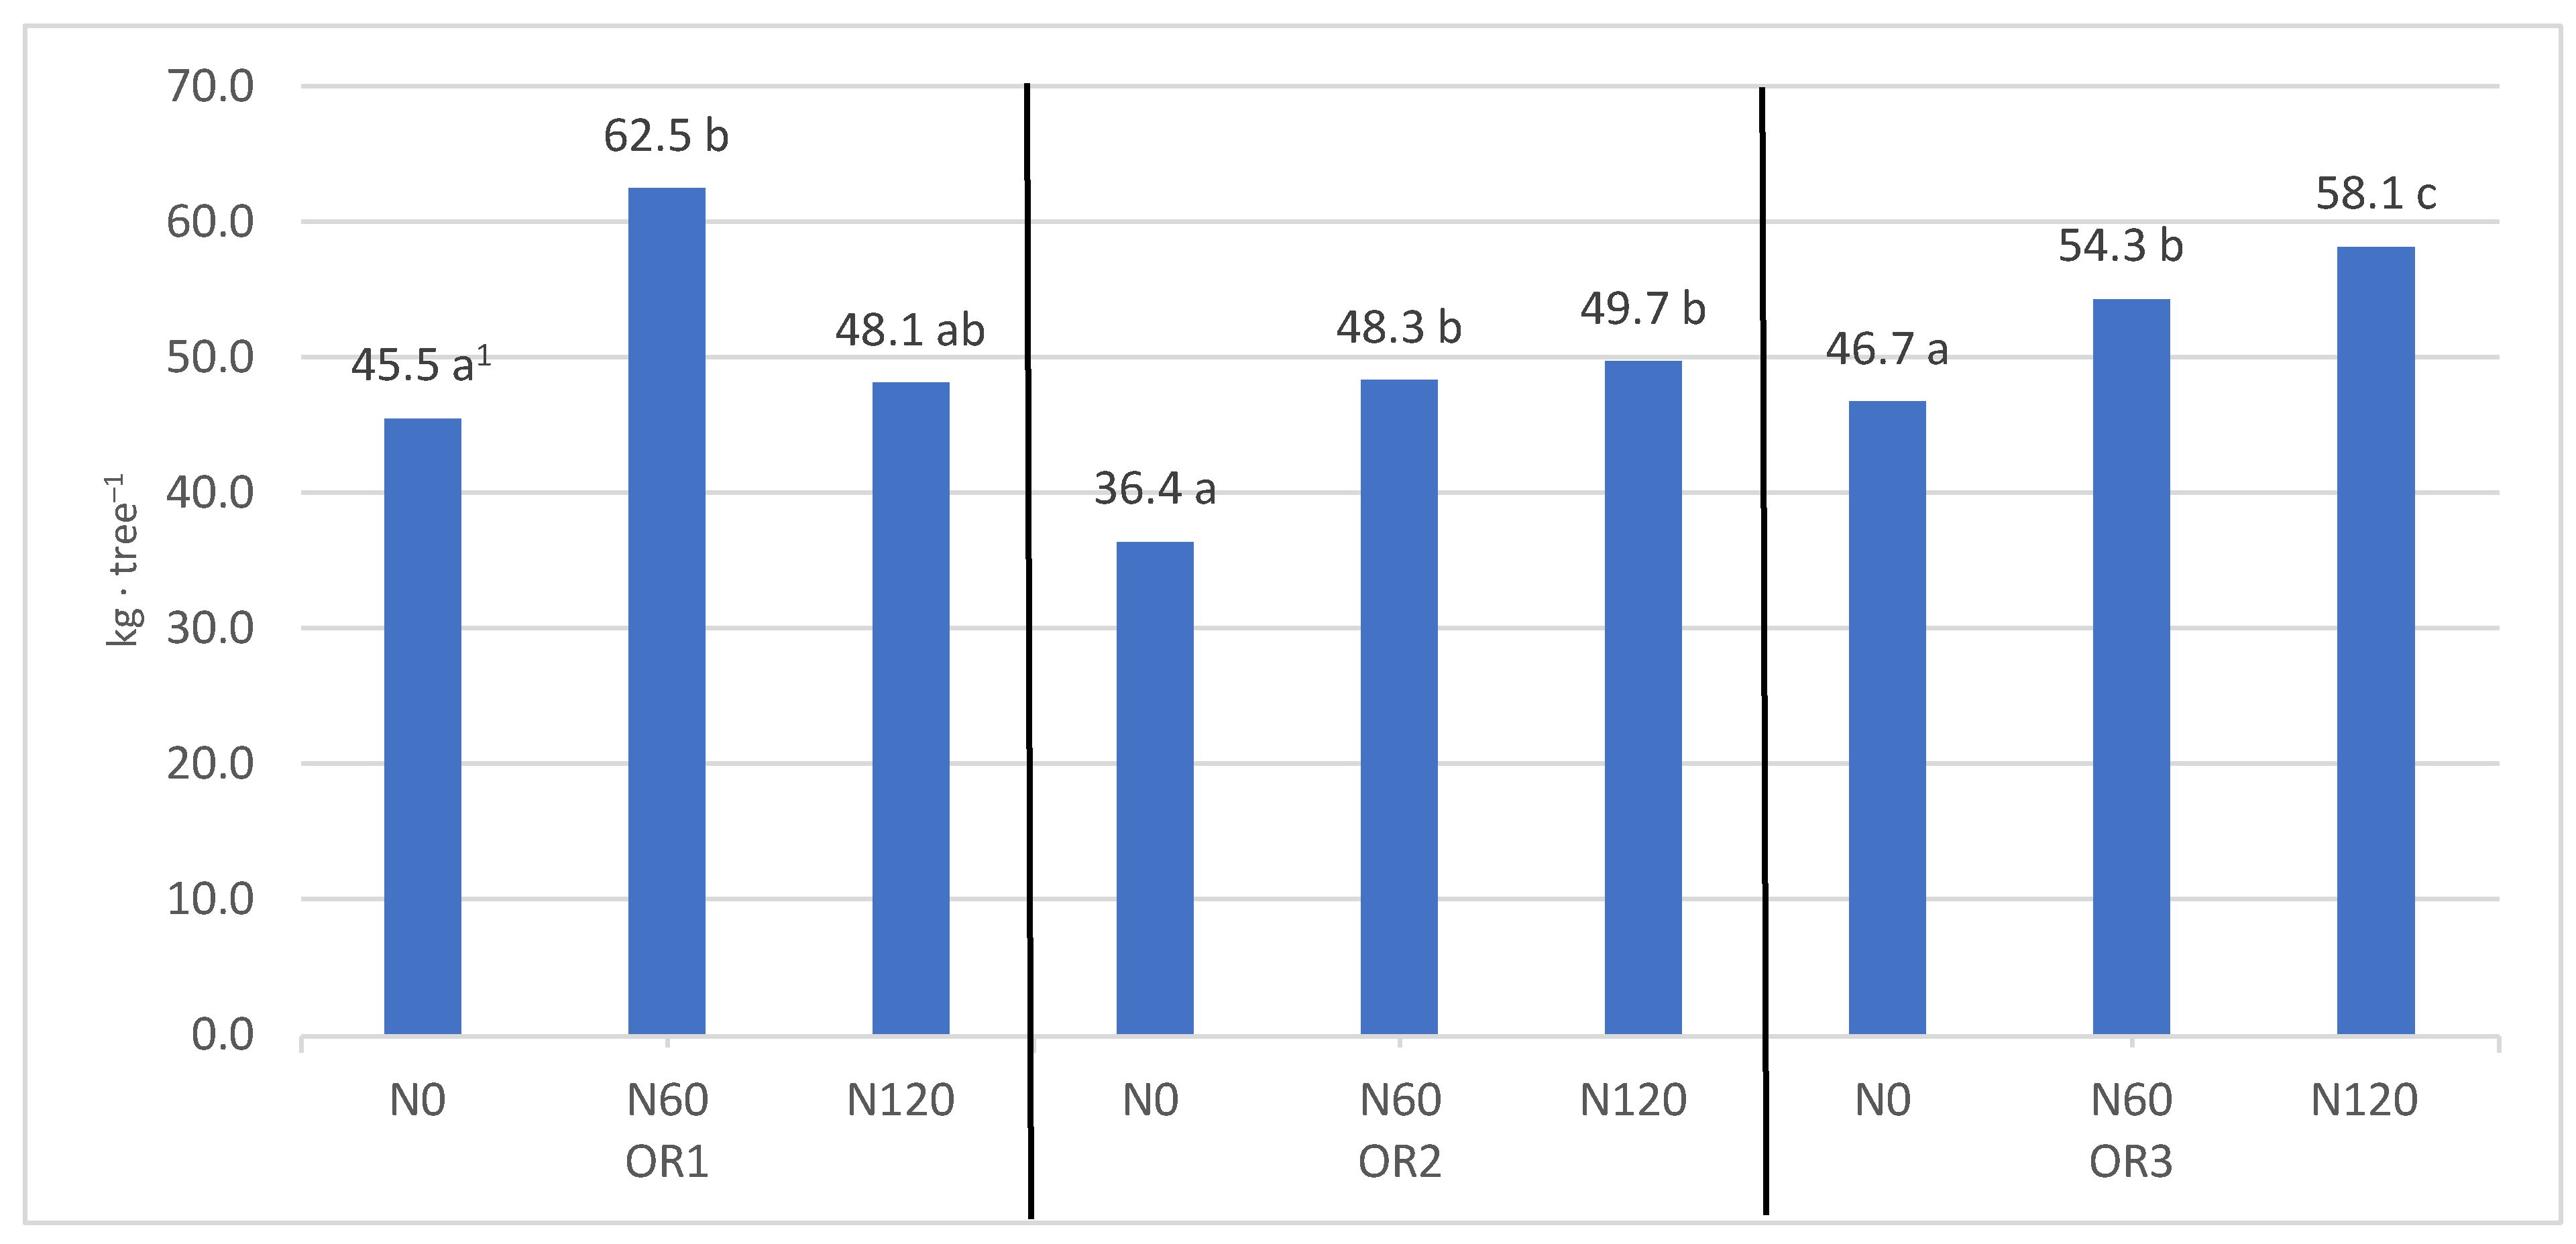
Fertilization at the level of 60 and 120 kg N·ha−1 increased the yield of trees compared to the control (Figure 2); however, increasing the dose from 60 to 120 kg N·ha−1 did not cause a significant increase in yield in any of the three orchards used in this study. Furthermore, despite a significant increase in yield and downward trend, no significant reduction in yield was proven under the influence of a dose of 120 kg N·ha−1. These results are in agreement with several previously published studies that also showed that application of nitrogen fertilization is necessary in sour cherry orchards and that a dose of 60 kg N ha−1 is sufficient to produce a good yield [11]. Thus, it is debatable if increasing the dose of N is necessary. For example, increasing the fertilization of apple orchards from 50 kg N·ha−1 to 100 kg N·ha−1 also did not have a significant impact on yield for a 10-year period of conducting research [16]. This explains the low demand of fruit trees for nitrogen fertilization. In addition, the soil maintenance system with herbicides undoubtedly promotes the availability of nitrogen [47]. Since fertilizer needs of fruit trees are not high, increasing the dose of nitrogen not only has no economic justification, but it also has a prejudicial effect on microorganisms and soil enzymes [48,49,50,51]. In addition, the use of unnecessary elevated doses of fertilizers is harmful to the environment and contributes to water pollution [52].
The decrease in yields in 2011 was caused by a drop in air temperatures to −2.9 °C, immediately after the end of flowering on May 4 and 5. Fruit buds just after flowering are more sensitive to frost [53]. In 2013, despite the lack of negative temperatures during the flowering period of the trees, the yield was poor, probably due to extremely variable weather during this period (Table 1). Frequent rains and strong winds, as well as temperatures below 8 °C, make it difficult and sometimes even impossible for pollinating insects to fly [54]. Pollination and fertilization should take place within 48 h after the bud cracking; otherwise, the embryo degenerates and does not set fruit [55].
The total yield from the tree in the years 2006–2013 was the highest in the OR 1, where fertilization of 60 kg N·ha−1 was used. Doubling the dose of nitrogen fertilization contributed to a decrease in yield. In OR 2 and OR 3, the highest dose of nitrogen fertilization had no significant impact on the total yield of the tree (Figure 2 and Table 4).
The fertility rate of trees was not very diverse. The only significant difference was shown in OR 3, between trees fertilized at a dose of 120 kg N·ha−1 and control (Table 5). Since the increase in yield under the influence of fertilization was previously shown, the current lack of differences in the coefficient shows that the increase in yield was directly proportional to the strength of tree growth. Larger sour cherry trees generally give higher yield [12]. This is particularly pronounced in fruiting cultivars on annual shoots and the tested cultivar has just such a fruiting character. It then depends on the strength of growth, on the correct cut and the sum of annual increments. Until the space resulting from the spacing is filled, soil nitrogen fertilization has a big impact on growth and yield [12]. However, it was found that urea foliar fertilization of sour cherries with urea was found to have a significant effect on yield [13].
3.2. Fruit Quality
3.2.1. Fruit Weight
The average weight of the fruit depended on the age of the orchard. The largest fruits were harvested from OR 1, which during eight years has produced fruit with an average weigh of approximately 6 g. In orchards OR 2 and OR 3, the weight of the fruit was 5.6 g, although there were no differences between these orchards (Table 6). These results are in agreement with previous published works that reported an average weight between 5.3 and 6.1 g for ‘Łutowka’ sour cherry fruit [56]. Others have, however, reported slightly lower weighs between 4 and 5 g [57,58].
The fertilization dose did not affect the weight of the fruit harvested from OR 1 and OR 2. There is only a significant difference between 0 N and 120 N for OR 3, where fruits receiving higher 120 N were heavier than the control (0 N). On average (three orchards combined), fruit from the 0 N and 60 N treatments were smaller than the fruit from the 120 N treatment but there was no significant difference between 0 N and 60 N. The highest mass of fruit was found in the OR 1. (Table 6). However, such an obvious result is not always achieved, because there are reports of an increase in yields while reducing the size of the fruit after applying soil nitrogen fertilization [17]. However, the use of foliar fertilization with urea did not affect the weight of the fruit [13].
3.2.2. Fruit Firmness
Fertilization did not affect the firmness of the fruit, regardless of the N dose (Table 7). However, significant differences were found between orchards, which suggests that the firmness of the fruit is influenced by the age of the orchard. In the orchard planted in 1999 (OR 1), the firmness of the fruit was the highest, but not significantly different from OR 2. Lower firmness was found in the orchard established at the latest year (OR 3). Others have shown that, unlike the results of this study, fertilization can contribute to both an increase and a decrease in fruit firmness. For example, in apricots, firmness decreased, while in sweet cherries, it increased with increasing N levels. [59,60].
3.2.3. Total Soluble Solids
The differences were not large, but a decrease in the TSS content was only proven for averages for all orchards (Table 8); the negative effect of nitrogen fertilization on the TSS content of fruits was previously noticed with the fertigation of sweet cherry trees [61,62]. The higher N doses reduced TSS from 15.2 to 14.0. No differences were found between OR 1 and OR 3 and OR 2 and OR 3. The TSS content of the extract differed only between OR 1 and OR 2.
3.2.4. Titratable Acidity
Nitrogen fertilization did not affect the content of acids in fruits. Only the tendency is observed that with the increase in nitrogen fertilization, the acidity of fruits decreased (Table 9). Other important features of this cultivar are the large weight of fruit and the high ratio of pulp to pit, which makes the waste in the production of juices small [61,62].
The acidity changed with the age of the orchard. The largest amount of malic acid was determined in fruits from trees planted in 1999 (OR 1). The increase in the acidity of the fruit increased during 5 years of experimentation, where different intensities of sour cherry cutting was used [1].
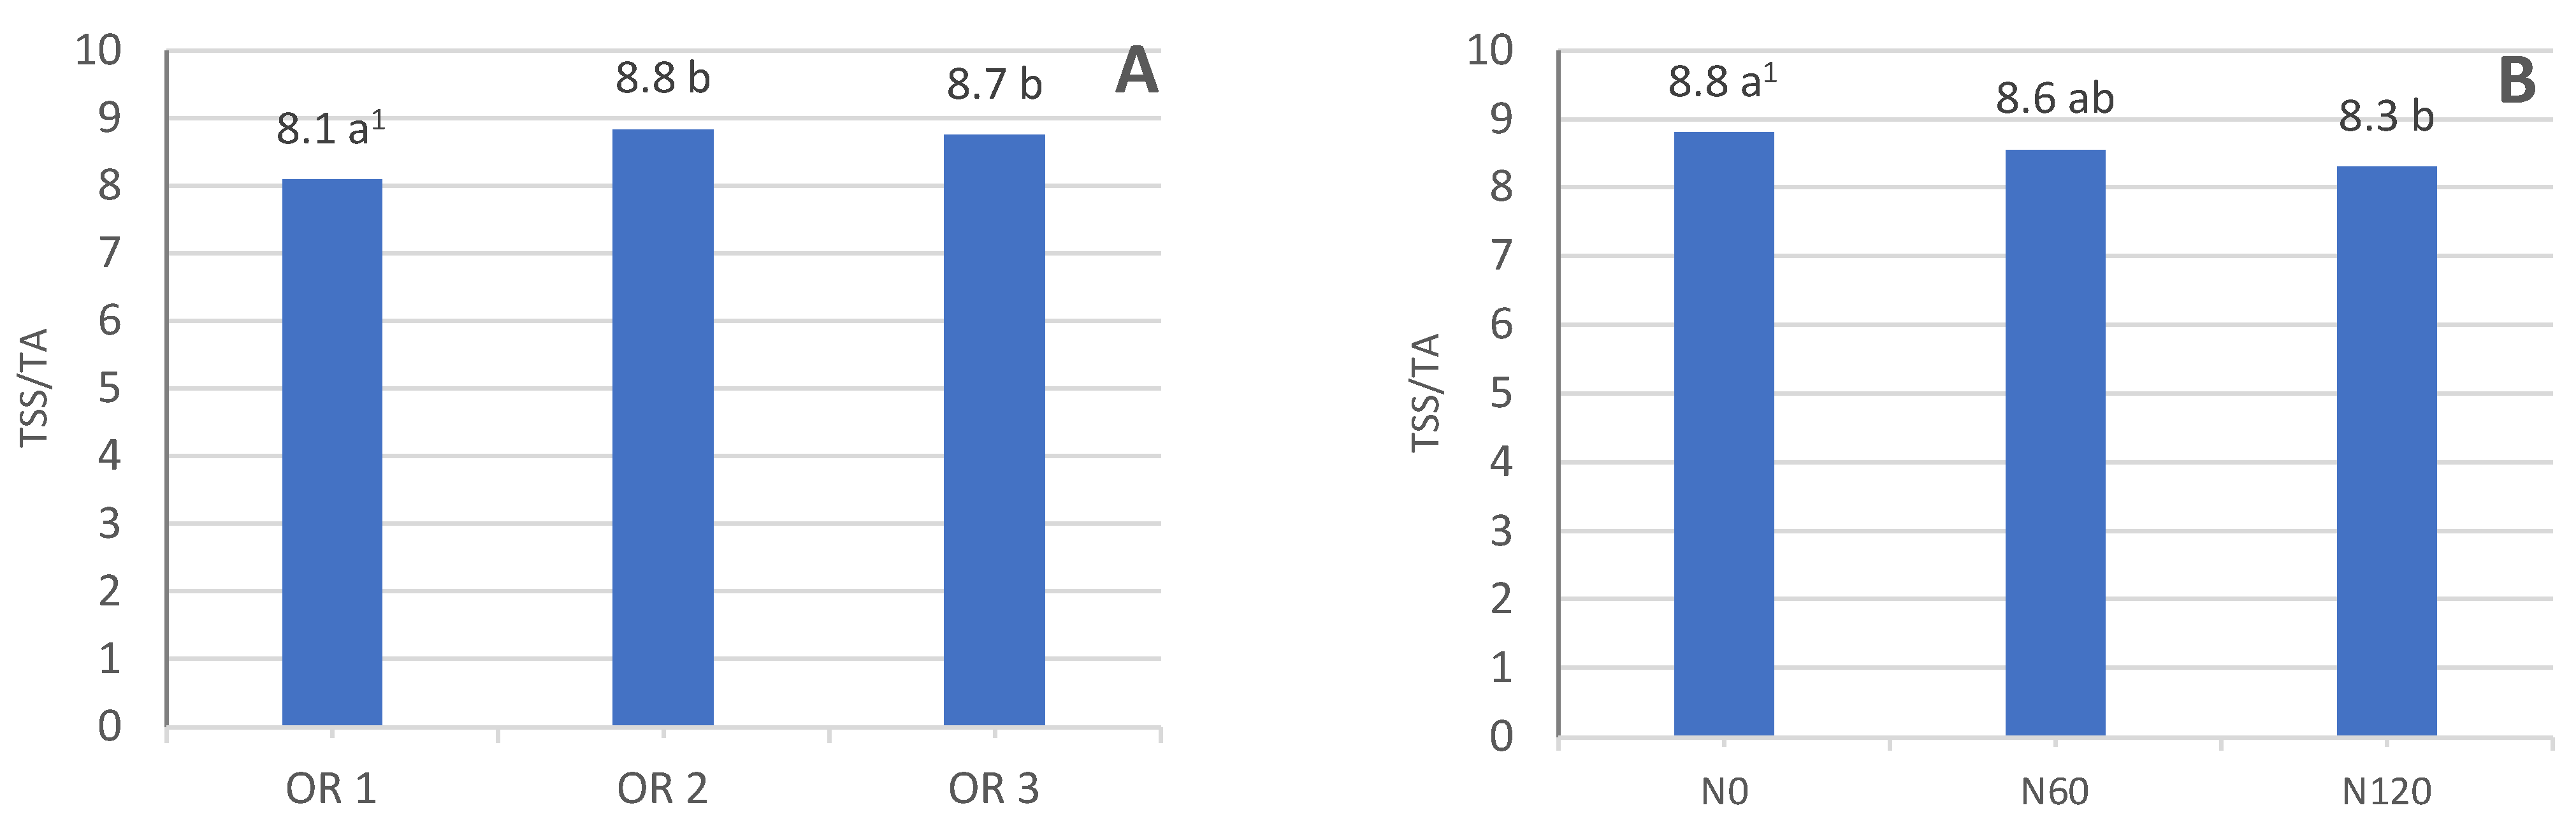
The TSS/TA ratio was significantly lower in the oldest orchard (OR 1) (Figure 3A). The average during the time of the study showed the effect of nitrogen fertilization on this characteristic. However, only the use of a high dose of nitrogen (120 kg N h−1) compared to the control resulted in a noticeable reduction of the TSS/TA ratio (Figure 3B). Fertilization, however, can cause a significant increase in TSS/TA ratio, which Mikiciuk et al. (2018) proved in their research using foliar compound fertilizer in a sweet cherry orchard (8.0% N, 13.0% CaO and 1.0% Zn) [63]. The opposite effect was achieved in apricots, using potassium nitrate before harvest, which lowered the TSS/TA ratio [64].
3.2.5. pH of the Juice
In our study, pH of sour cherry was not affected by the levels of N (data not shown). Likewise, pH of fruit from the different orchards was not significant different (data not shown). Studies of different cultivars of sour cherries grown in the US did not show large differences in the pH of the juice. Only the sour cherry cv. ‘Balaton’ had a significantly higher juice pH [25]. On the other hand, a comparison of sweet cherry and sour cherry cultivars indicates that sour cherry juice has a much lower pH [25,27]—for sweet cherries it Is 3.8 and for sour cherries it is 3.3 [25,65]. Qualitative characteristics, such as acidity or pH of juice, are genetically determined and are variable both for the species and for the cultivar. However, the use of agrotechnical treatments can affect the pH of the juice. Mineral fertilization with K lowered the pH of sweet cherry juice [66]. However, this was not confirmed for sweet cherries, where fertigation of N and K caused an increase in pH. A similar effect was achieved with nitrogen and phosphorus fertilization [62]. In sweet cherries, standard nitrogen fertilization applied at the turn of April and May at a dose of 75 kg N h−1 and fertigation in June and August after fruit harvest caused an increase in the pH of the juice [62].
3.2.6. Fruit Coloring
Fruit color is an indicator of fruit ripeness and quality [29,36]. During the ripening period, the color of the fruit changes from green to dark red [67]. This is due to the degradation of chlorophyll and an increase in the concentration and distribution of anthocyanins on the skin of the fruit [68]. The brightening of the fruit color was visible under the influence of applied nitrogen fertilization and was visible as an increase in the L* value. Fertilized fruit were brighter and less red than without nitrogen fertilization (Table 10). This is confirmed by research in sweet cherries, where darker fruits were characterized by a higher content of anthocyanin compounds. Additionally, h° was always higher in less ripe sweet cherries [69,70]. In orchards, OR 2 and OR 3 were darker, as indicated by the lower value of the L* parameter. The share of red in the fruits tested increased under the influence of nitrogen fertilization. The use of nitrogen fertilization significantly increased the intensity of the red color, which is indicated by an increase in the a* parameter. L* values were not different between N treatments. The a* values were definitely different between N fertilizations. The literature reports that there is a strong correlation between the color and the content of anthocyanins, which translates into the belief that also in our experiment fruit from trees that were fertilized with 60 and 120 kg N, i.e., probably contained more anthocyanins. However, we have not studied these groups of compounds. The parameter b* also increased with nitrogen fertilization, indicating a greater share of the blue in the color of fruits. Similar relationships were found in saturation and color tone (C* and h°). According to sweet cherries studies, the increase in the tested parameters suggests that nitrogen fertilization causes a decrease in the content of anthocyanin compounds [70].
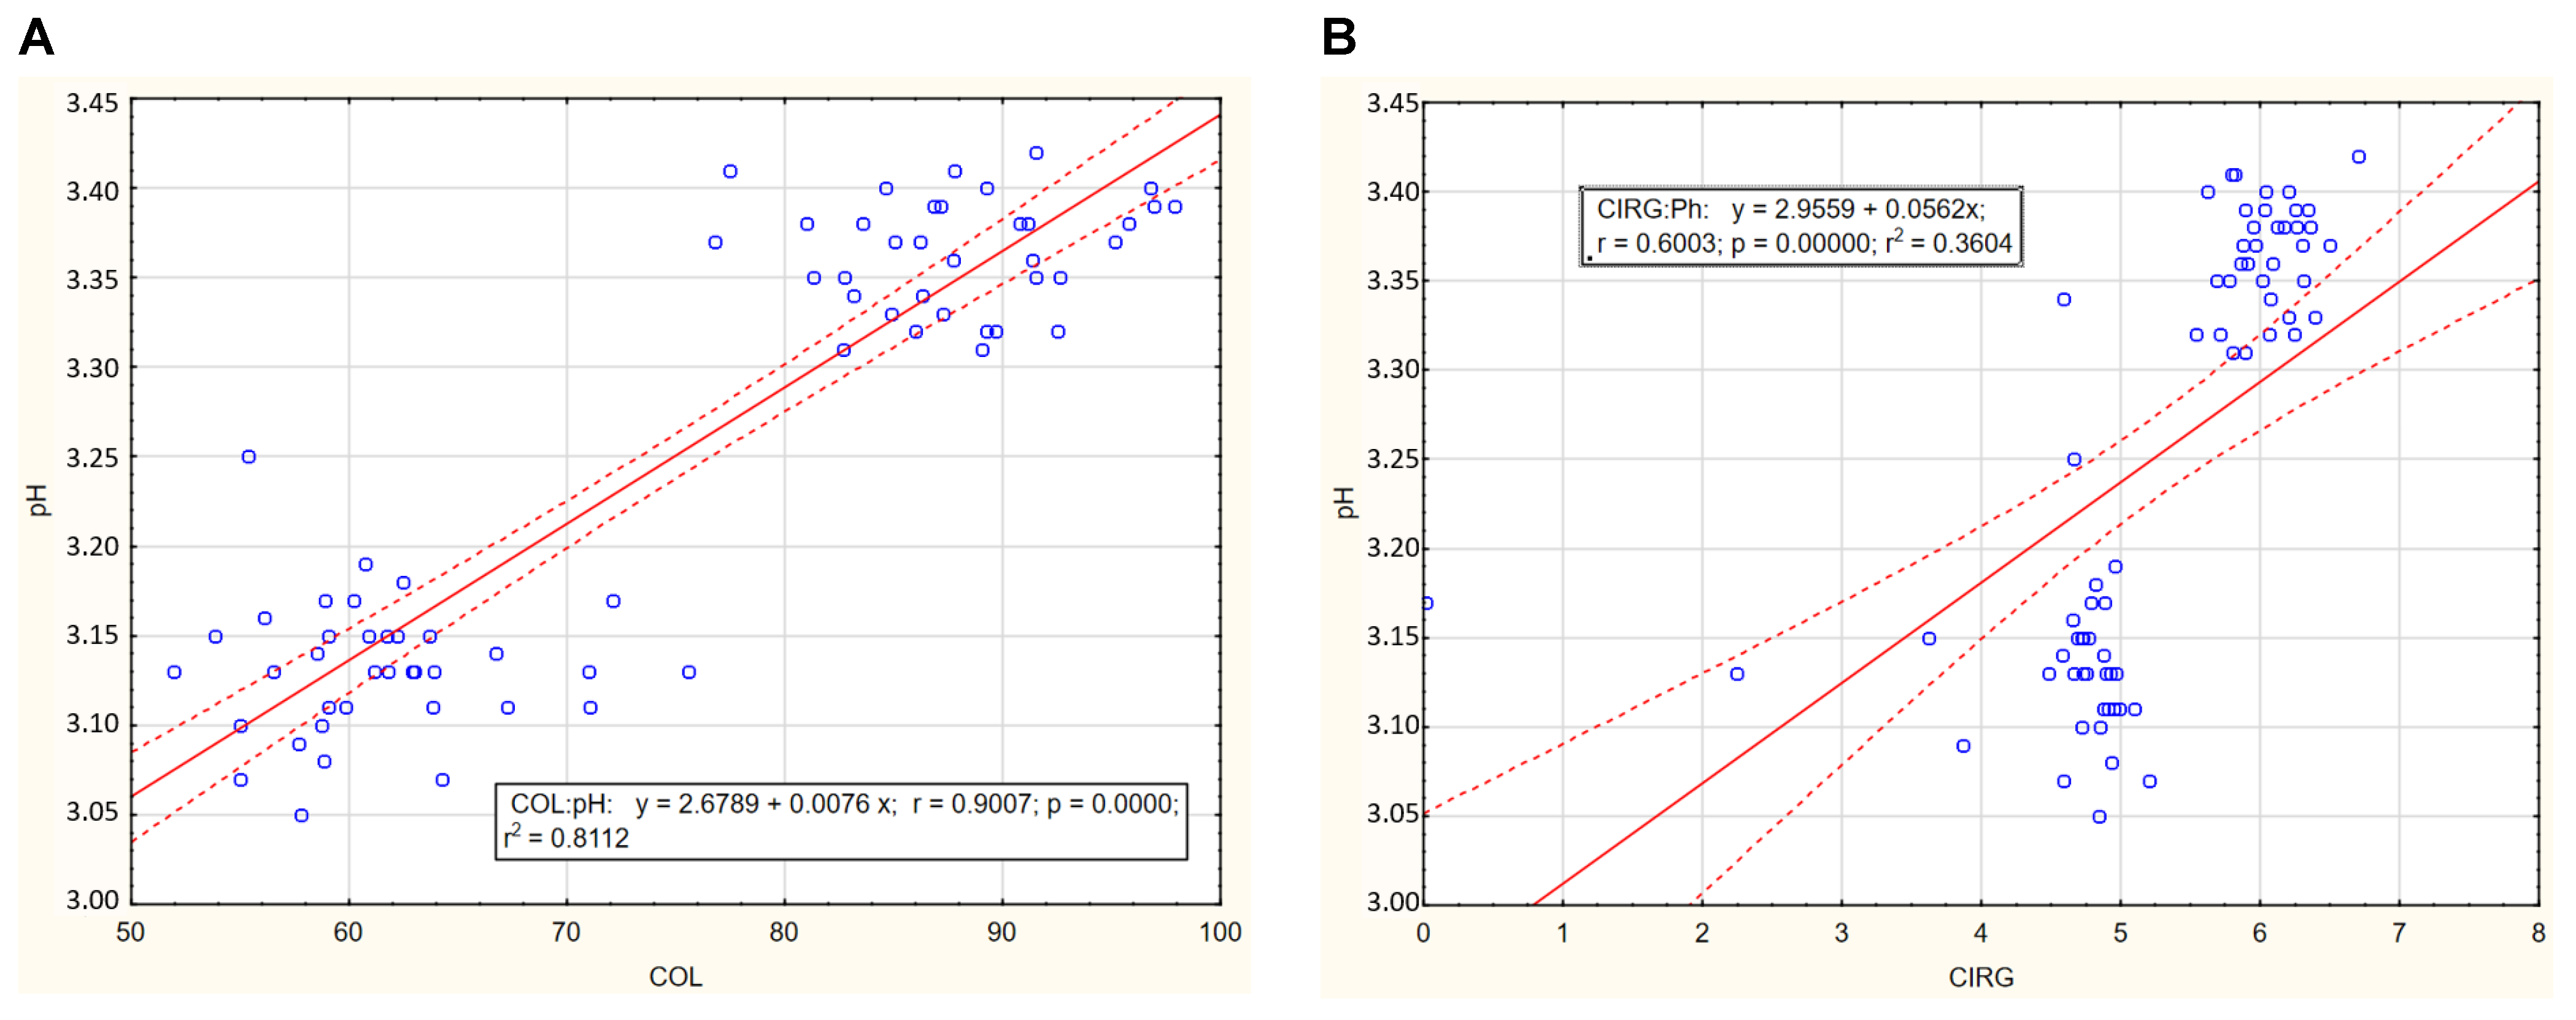
The color indices of COL and CIRG fruits were correlated with the pH of fruit juice (Table 11, Figure 4A,B). The greatest relationship was found for the color coefficient proposed for COL tomatoes [38]. A lower relationship was for the CIRG index for red grapes [40]. High linear correlation coefficients were also found in relation to the pH of cell juice for other color parameters (Table 11).
3.3. Influence of Climatic Conditions on Yield and Fruit Quality
The course of the climatic conditions had a significant impact on the flowering and ripening dates and the quality of the fruit (Table 12).
The increase in precipitation caused an increase in fruit weight, while it negatively affected the extract content, acidity and firmness of the fruit. Such phenomena can be seen as the effect of dilution. In addition, heavy rainfall prolongs the period of growth and ripening of fruits [71].
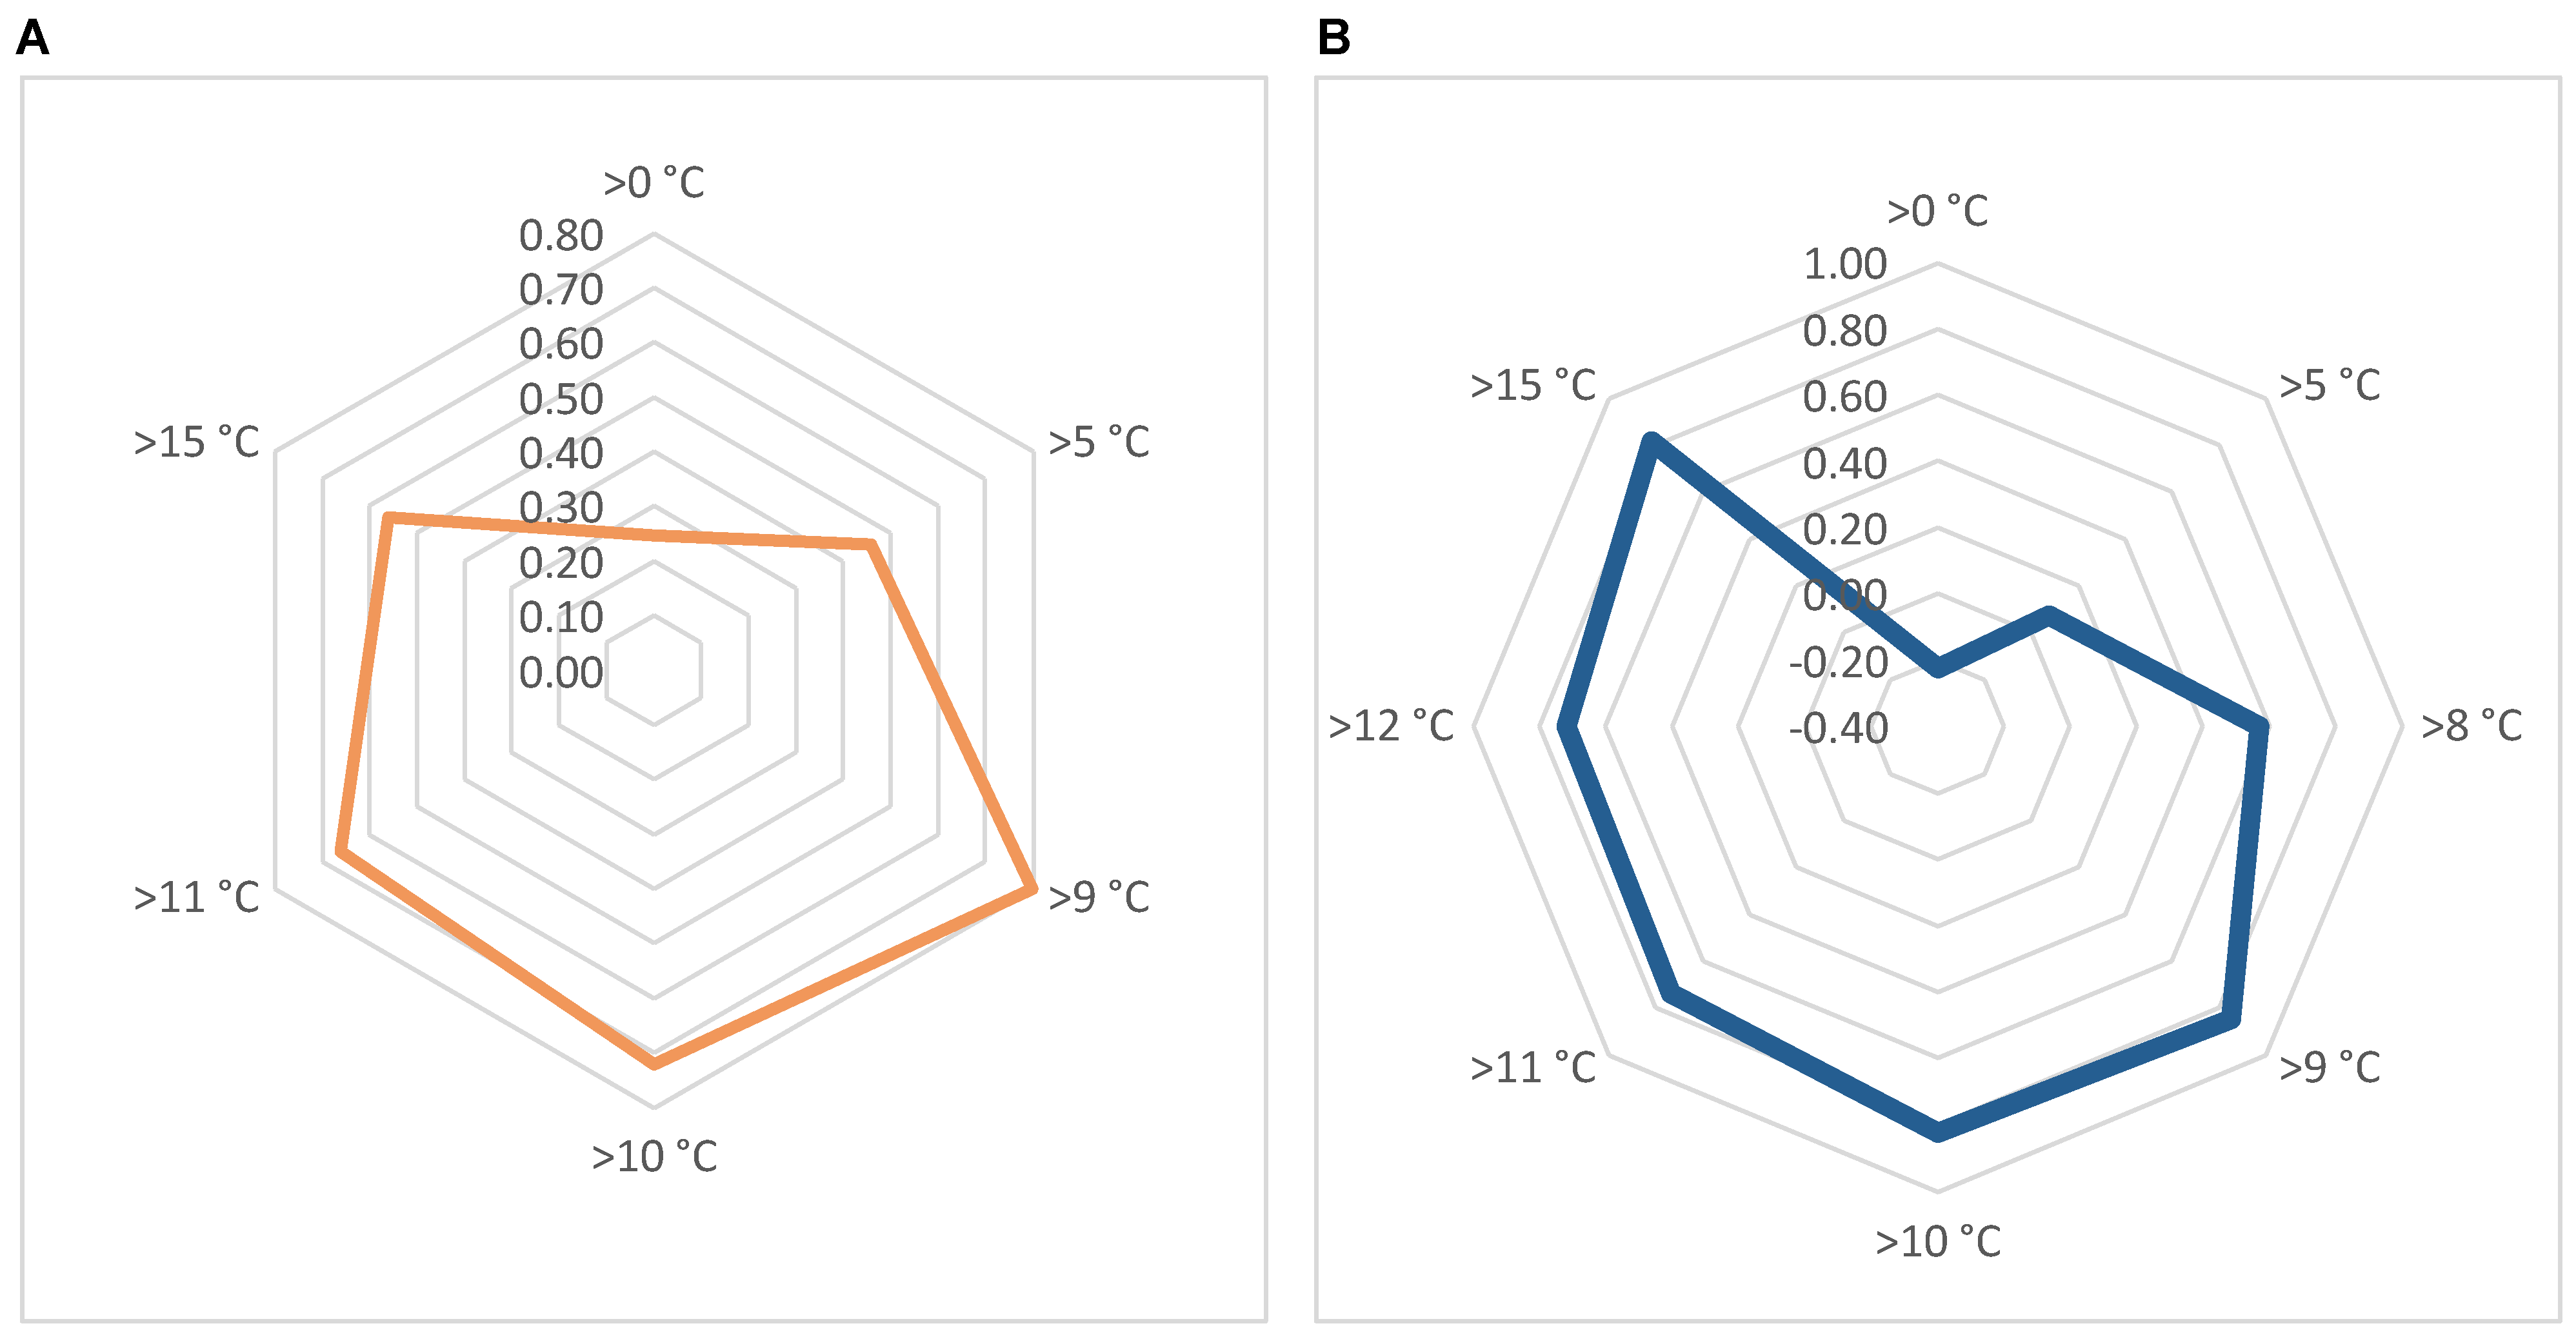
The sum of active temperatures above 9 °C until the flowering had a significant impact on the flowering date of trees (Table 13 and Figure 5A). The maturity date of the fruit was more dependent on the sum of active temperatures above 9 °C until the harvest (Table 14 and Figure 5B).
The higher number of sunny days increased the firmness of the fruits and the yield of the trees (Table 12). The increase in frequency under the influence of the sun in some species is explained by better conditions for the accumulation of calcium, which, being a component of cell walls, is responsible for their firmness [72,73].
Precipitation increased the weight of the fruit, while reducing its acidity (Table 11). The fruit was soaked with water from rain, which leads to less concentrated chemical components. This effect occurring in Wielkopolska, which belongs to regions with very little rainfall, underscores the need to supplement water shortages.
3.4. Influence of Active Temperatures on Selected Characteristics
The timing of flowering depended on the climatic conditions (Table 13). The increase in the sum of active temperatures was positively correlated with the timing of the flowering of trees and the ripening of the fruits (Table 14). It is often emphasized that temperature affects the speed of chemical reactions, which is especially noticeable during the storage of fruits [74,75]. The earliest full flowering was 27 April and 9 May at the latest. The delay in flowering was most influenced by precipitation and soil temperature. The duration of the flowering period depends mainly on the temperature and on the difference between day and night temperatures. High temperature amplitude shortens the flowering period. If during the day the temperature is above 20 °C and during the night it drops to several degrees, the flowering period can be shortened up to 4 days [76]. The length of the flowering period, and thus, effective pollination, is much shorter at high temperatures [55]. At 10 °C, the effective pollination is 5 days and at 15 it is reduced to 3 [77,78]. Precipitation before and during flowering has a significant impact on the duration of flowering [79].
The calculated sum of active temperatures for different ranges indicates that the flowering term was most correlated with a SAT above 9 °C. The sums calculated for 0 °C and 5 °C were negatively correlated with the flowering date (Table 14).
The sum of the temperature active is used as a method for the determination of phenological phases [80]. The sum of active temperatures calculated for different ranges had a significant impact on the flowering date and fruit harvest. The greatest relationship was between the date of fruit harvest and the sum of active temperatures above 9 °C. Similar relationships were found for 10 and 11 °C (Table 14).
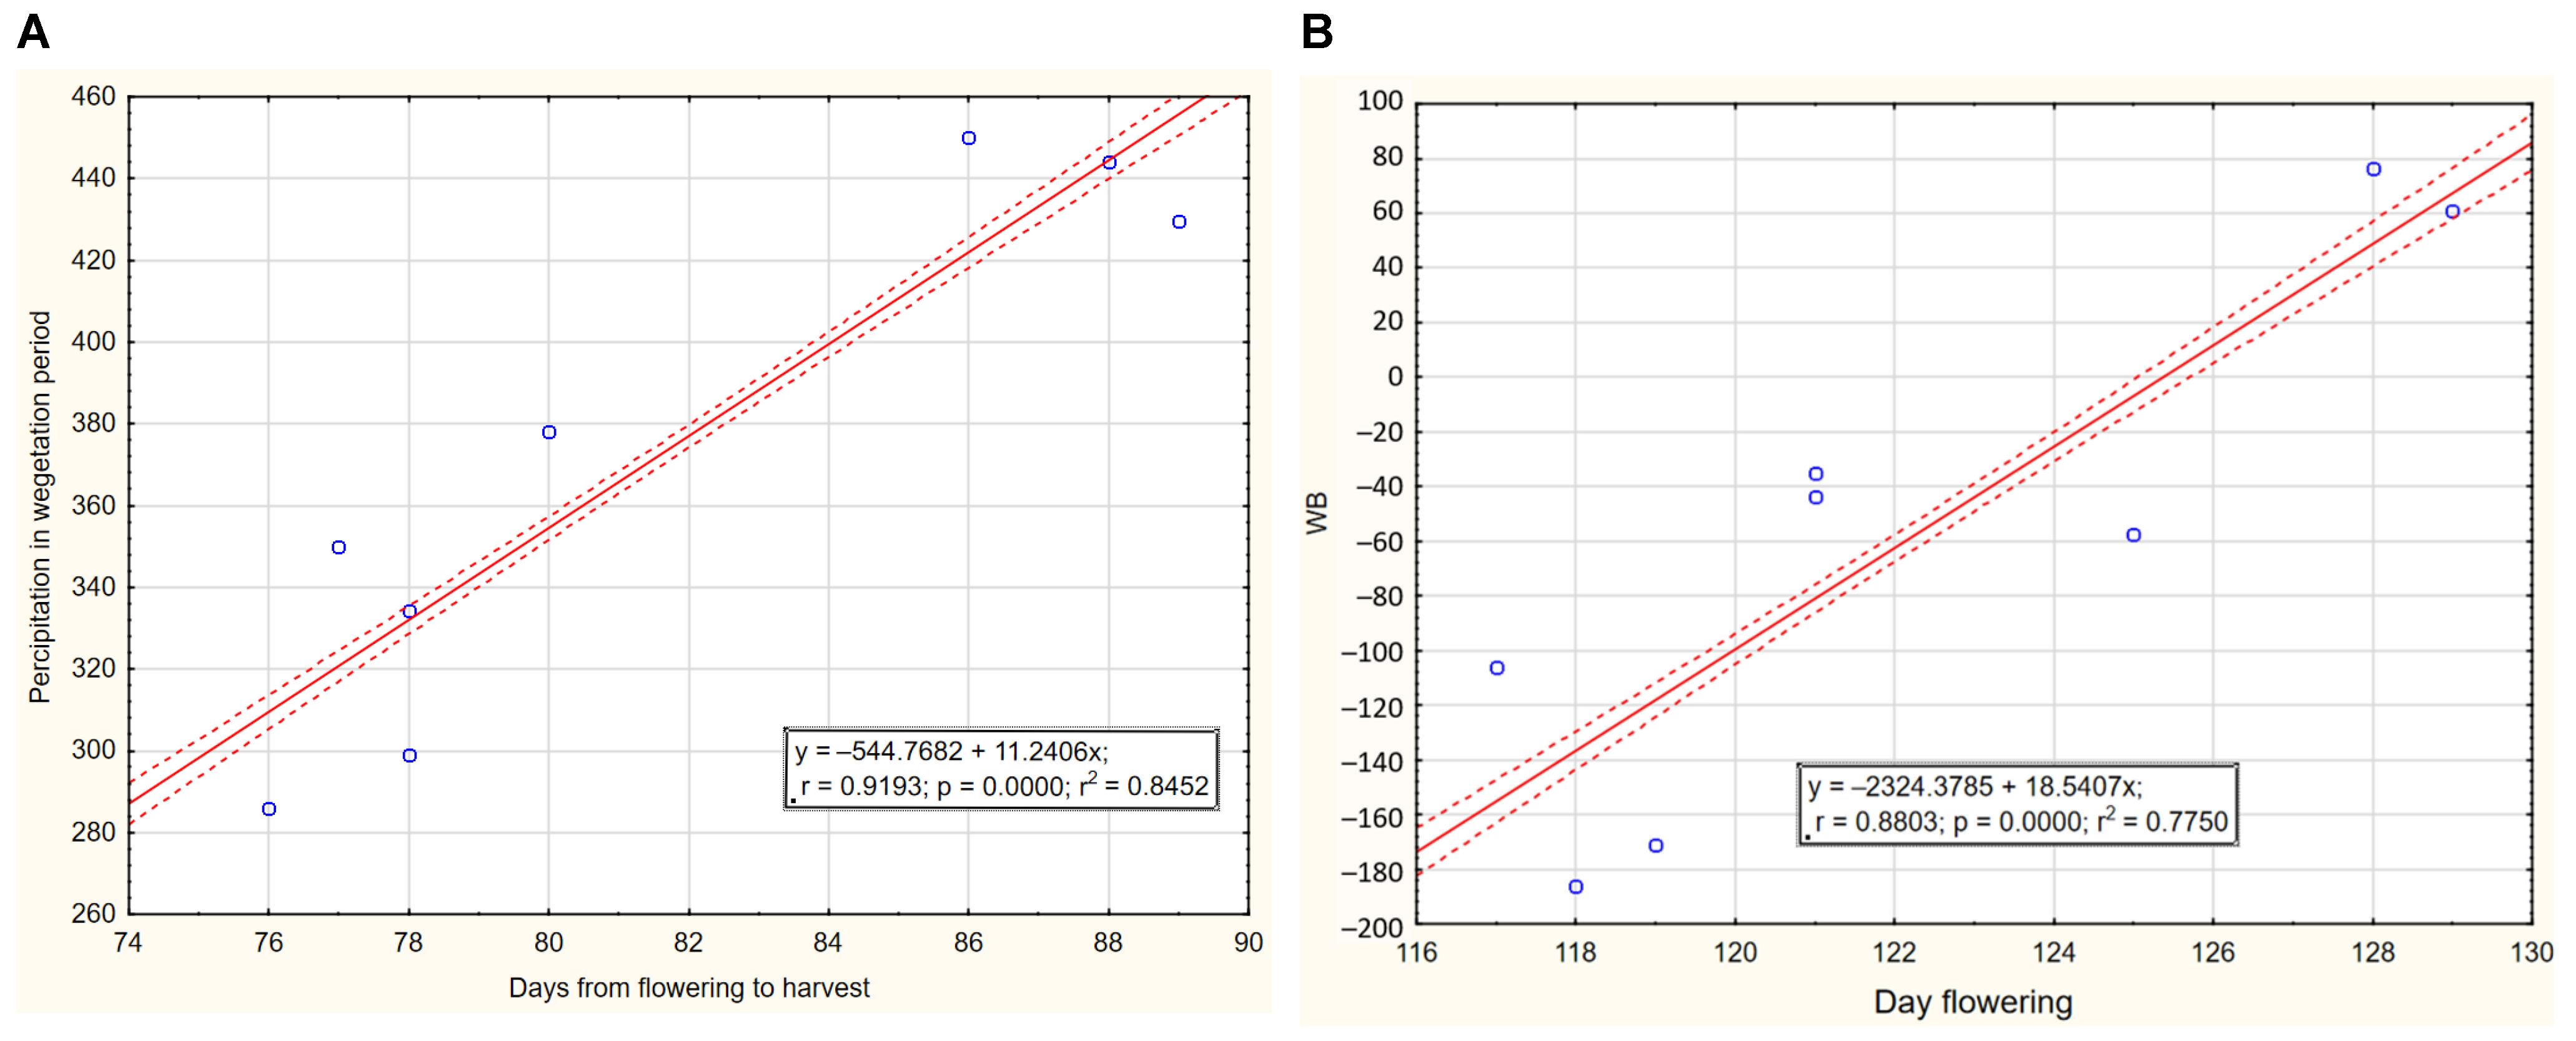
The timing of the fruit harvest differed by 14 days during the period of conducting the research. The earliest sour cherry harvested was on 13 July (2007), and at the latest on 27 July (2009) (Table 12). Ripening and harvest time depends on the climatic conditions (temperature and precipitation) [81]. The greatest impact on the timing of flowering was the sum of precipitation during the growing season (Figure 6B). The increase in the number of days with rainfall prolonged the period of fruit ripening. This is confirmed by the high relationship between precipitation in the vegetation period and the number days from flowering to harvest (Figure 6A).
For the calculation of the sum of active temperatures, the values of 0 °C, 5 °C, 9 °C, 10 °C, 11 °C and 15 °C were used. It is assumed that some physiological processes already take place above 0 °C for some cultivars of apple trees is the basis for calculating the harvest date [82]. The greatest relationship was between the flowering date and the sum of temperatures above 9 °C. On the other hand, the date of fruit harvest was most dependent on the sum of temperatures above 0 °C. Similar results were found for the share of red color in the fruit at the time of harvest (Table 14).
The sum of temperatures to term from the harvest calculated for different values indicates that the sum of temperatures above 9 °C had the greatest impact on the fruit harvest date. Fruit yield was negatively correlated for all SATs (Table 15).
4. Conclusions
Nitrogen fertilization had an impact on the yield of sour cherry trees. However, the use of nitrogen fertilization at a dose of 120 kg N ha−1 is not justified. Doubling nitrogen fertilization did not increase fruit yield. Only in some years was there a higher yield using higher nitrogen fertilization, but the fertility coefficient did not differ significantly.
The use of nitrogen fertilization reduces the TSS of the fruit and decreases with an increasing nitrogen dose. The bright red color of the fruit increased at higher N doses. These are the basic parameters of fruit quality for this cultivar, which is the cultivar used for processing. The intensity of the color and the proportion of the red color are important in the production of juices and jams.
Both precipitation and temperature affected the quality of the fruit, the course of flowering and fruit ripening. The timing of tree flowering and yield was correlated with the sum of active temperatures. For the flowering date, the greatest relationship was found for sums above 11 °C, and for the harvest date above 9 °C.
High doses of nitrogen fertilization have no economic justification, because they do not increase yield or fruit quality and cause an increase in production costs at high prices of mineral fertilizers. At the same time, too high nitrogen fertilization should be avoided due to the threat to the natural environment.
Author Contributions
Conceptualization, K.R.; methodology, K.R.; software, K.R.; validation, K.R. and G.P.Ł.; investigation, K.R.; resources, K.R. and G.P.Ł.; data curation, K.R.; writing—original draft preparation, K.R. and G.P.Ł.; writing—review and editing, K.R. and G.P.Ł.; visualization, K.R.; supervision, K.R.; project administration, K.R.; funding acquisition, K.R. All authors have read and agreed to the published version of the manuscript.
Funding
The publication was co-financed within the framework of the “Regional Initiative Excellence” program implemented at the initiative of the Polish Ministry of Science and Higher Education in 2019–2022 (No. 005/RID/2018/19)”, financing amount: PLN 12,000,000.
Institutional Review Board Statement
Not applicable.
Informed Consent Statement
Not applicable.
Data Availability Statement
Data available on request.
Conflicts of Interest
The authors declare no conflict of interest.
References
- Rutkowski, K.; Zydlik, Z.; Pacholak, E. Effect of Tree Pruning Intensity on the Yield and Fruit Quality of the Sour Cherry. Zemdirb.-Agric. 2015, 102, 417–422. [Google Scholar] [CrossRef]
- Rutkowski, K.; Zydlik, Z.; Stachowiak, A. Effect of Tree Pruning Intensity on the Content of Mineral Components in the Sour Cherry Leaves of ‘Łutówka’. Folia Hortic. 2018, 30, 47–55. [Google Scholar] [CrossRef] [Green Version]
- Gondek, K.; Mierzwa-Hersztek, M.; Kopec, M.; Zaleski, T.; Bogdal, S.; Bieniasz, M.; Blaszczyk, J.; Kaczmarczyk, E.; Kowalczyk, B.; Knaga, J. Mineral Composition of Fruits and Leaves of San Andreas® Everbearing Strawberry in Soilless Cultivation. J. Elem. 2020, 25, 1333–1347. [Google Scholar] [CrossRef]
- Sredojević, Z.; Milić, D.; Jeločnik, M. Investment in Sweet and Sour Cherry Production and New Processing Programs in Terms of Serbian Agriculture Competitiveness. Pet.-Gas Univ. Ploiesti Bull. Tech. Ser. 2011, 63, 37–49. [Google Scholar]
- Wojcik, P. ‘Schattenmorelle’ Tart Cherry Response to Boron Fertilization. J. Plant Nutr. 2006, 29, 1709–1718. [Google Scholar] [CrossRef]
- Kurlus, R.; Rutkowski, K.; Łysiak, G.P. Improving of Cherry Fruit Quality and Bearing Regularity by Chemical Thinning with Fertilizer. Agronomy 2020, 10, 1281. [Google Scholar] [CrossRef]
- Sanchez, J.E.; Edson, C.E.; Bird, G.W.; Whalon, M.E.; Willson, T.C.; Harwood, R.R.; Kizilkaya, K.; Nugent, J.E.; Klein, W.; Middleton, A.; et al. Orchard Floor and Nitrogen Management Influences Soil and Water Quality and Tart Cherry Yields. J. Am. Soc. Hortic. Sci. 2003, 128, 277–284. [Google Scholar] [CrossRef] [Green Version]
- Lisek, J. Possibilities and Limitations of Weed Management in Fruit Crops of the Temperate Climate Zone. J. Plant Prot. Res. 2014, 54, 318–326. [Google Scholar] [CrossRef]
- Mia, M.J.; Massetani, F.; Murri, G.; Neri, D. Sustainable alternatives to chemicals for weed control in the orchard—A Review. Hortic. Sci. 2020, 47, 1–12. [Google Scholar] [CrossRef] [Green Version]
- Mercik, S.; Slowik, K.; Wasowski, T. Effect of 65-Year Static Soil Fertilization on the Growth, Fruiting and Leaf Nutrient Status of a Tart Cherry Trees. Acta Hortic. 1990, 331–338. [Google Scholar] [CrossRef]
- Sadowski, A.; Jadczuk, E. Results of 11-Year N-Fertiliser Trial in a Sour Cherry Orchard. Acta Hortic. 2001, 279–284. [Google Scholar] [CrossRef]
- Sadowski, A.; Jadczuk, E. Effects of Nitrogen Fertilisation in a Sour Cherry Orchard. Acta Hortic. 1997, 475–480. [Google Scholar] [CrossRef]
- Wocior, S.; Wojcik, I.; Palonka, S. The Effect of Foliar Fertilization on Growth and Yield of Sour Cherry (Prunus cerasus L.) Cv. Lutowka. Acta Agrobot. 2011, 64, 63–68. [Google Scholar] [CrossRef] [Green Version]
- Juárez-Rosete, C.R.; Aguilar-Castillo, J.A.; Aburto-González, C.A.; Alejo-Santiago, G.; Juárez-Rosete, C.R.; Aguilar-Castillo, J.A.; Aburto-González, C.A.; Alejo-Santiago, G. Biomass Production, Nutritional Requirement of Nitrogen, Phosphorus and Potassium, and Concentration of the Nutrient Solution in Oregano. Rev. Chapingo Ser. Hortic. 2019, 25, 17–28. [Google Scholar] [CrossRef]
- Lindhard, P.H.; Hansen, P. Effect of Timing of Nitrogen Supply on Growth, Bud, Flower and Fruit Development of Young Sour Cherries (Prunus cerasus L.). Sci. Hortic. 1997, 69, 181–188. [Google Scholar] [CrossRef]
- Wrona, D. The Influence of Nitrogen Fertilization on Growth, Yield and Fruit Size of’Jonagored’apple Trees. Acta Sci. Pol.-Hortorum Cultus 2011, 10, 3–10. [Google Scholar]
- Vang-Petersen, O. Fertilizing Sour Cherry {Prunus cerasus L. Cv. Stevnsbær) with N, P, and K. Tidsskr. Planteavl 1977, 81, 346–350. [Google Scholar]
- Szücs, E. Effect of Nutrient Supply on Frost Hardiness and Fruit Set of Sour Cherry Flowers and on Yield. Acta Hortic. 1996, 551–554. [Google Scholar] [CrossRef]
- Sadowski, A.; Jadczuk, E.; Jurczak, B. Effects of Pre-Planting P Fertilization in Sour Cherry Orchards. Acta Hortic. 1995, 239–246. [Google Scholar] [CrossRef]
- Jadczuk, E. Some Factors Affecting Potassium Nutrition of Sour Cherry Trees. In Proceedings of the Optimization of Plant Nutrition: Refereed Papers from the Eighth International Colloquium for the Optimization of Plant Nutrition, Lisbon, Portugal, 31 August–8 September 1992; Fragoso, M.A.C., Van Beusichem, M.L., Houwers, A., Eds.; Developments in Plant and Soil Sciences. Springer: Dordrecht, The Netherlands, 1993; pp. 127–132, ISBN 978-94-017-2496-8. [Google Scholar]
- Sanchez, E.E.; Khemira, H.; Sugar, D.; Righetti, T.L. Nitrogen Management in Orchards; Marcel Dekker: New York, NY, USA, 1995; pp. 327–380. [Google Scholar]
- Faust, M. Physiology of Temperate Zone Fruit Trees; Jojin Wiley & Sons: New York, NY, USA, 1989. [Google Scholar]
- Cruz-Alvarez, O.; Hernández-Rodríguez, O.A.; Jacobo-Cuellar, J.L.; Ávila-Quezada, G.; Morales-Maldonado, E.; Parra-Quezada, R.Á.; Robles-Hernandez, L.; Ojeda-Barrios, D.L.; Cruz-Alvarez, O.; Hernández-Rodríguez, O.A.; et al. Nitrogen Fertilization in Pecan and Its Effect on Leaf Nutrient Concentration, Yield and Nut Quality. Rev. Chapingo Ser. Hortic. 2020, 26, 163–173. [Google Scholar] [CrossRef]
- Grafe, C.; Schuster, M. Physicochemical Characterization of Fruit Quality Traits in a German Sour Cherry Collection. Sci. Hortic. 2014, 180, 24–31. [Google Scholar] [CrossRef]
- Siddiq, M.; Iezzoni, A.; Khan, A.; Breen, P.; Sebolt, A.M.; Dolan, K.D.; Ravi, R. Characterization of New Tart Cherry (Prunus cerasus L.): Selections Based on Fruit Quality, Total Anthocyanins, and Antioxidant Capacity. Int. J. Food Prop. 2011, 14, 471–480. [Google Scholar] [CrossRef] [Green Version]
- Schuster, M. Sour Cherries for Fresh Consumption. Acta Hortic 2019, 1235, 113–118. [Google Scholar] [CrossRef]
- Chaovanalikit, A.; Wrolstad, R.E. Total Anthocyanins and Total Phenolics of Fresh and Processed Cherries and Their Antioxidant Properties. J. Food Sci. 2004, 69, FCT67–FCT72. [Google Scholar] [CrossRef]
- Girard, B.; Kopp, T.G. Physicochemical Characteristics of Selected Sweet Cherry Cultivars. J. Agric. Food Chem. 1998, 46, 471–476. [Google Scholar] [CrossRef] [PubMed]
- Pedišić, S.; Levaj, B.; Dragović-Uzelac, V.; Škevin, D.; Skendrović Babojelić, M. Color Parameters and Total Anthocyanins of Sour Cherries (Prunus cerasus L.) during Ripening. Agric. Conspec. Sci. 2009, 74, 259–262. [Google Scholar]
- Zipori, I.; Erel, R.; Yermiyahu, U.; Ben-Gal, A.; Dag, A. Sustainable Management of Olive Orchard Nutrition: A Review. Agriculture 2020, 10, 11. [Google Scholar] [CrossRef] [Green Version]
- Przybyłko, S.; Kowalczyk, W.; Wrona, D. The Effect of Mycorrhizal Fungi and PGPR on Tree Nutritional Status and Growth in Organic Apple Production. Agronomy 2021, 11, 1402. [Google Scholar] [CrossRef]
- Dong, S.; Neilsen, D.; Neilsen, G.H.; Fuchigami, L.H. Foliar N Application Reduces Soil NO3−-N Leaching Loss in Apple Orchards. Plant Soil 2005, 268, 357–366. [Google Scholar] [CrossRef]
- Carranca, C.; Brunetto, G.; Tagliavini, M. Nitrogen Nutrition of Fruit Trees to Reconcile Productivity and Environmental Concerns. Plants 2018, 7, 4. [Google Scholar] [CrossRef] [Green Version]
- Fruit Plant Protection Program for Years 2006–2013; Plantpress Ltd.: Kraków, Poland.
- Zydlik, Z.; Pacholak, E.; Styla, K. Effect Exerted on Soil Properties by Apple-Tree Cultivation for Many Years and by Replantation. Part I. Biochemical Soil Properties. Acta Sci. Pol. Hortorum Cultus 2011, 10, 113–122. [Google Scholar]
- Łysiak, G. The Base Colour of Fruit as an Indicator of Optimum Harvest Date for Two Apple Cultivars (Malus Domestica Borkh.). Folia Hortic. 2012, 24, 81–89. [Google Scholar] [CrossRef] [Green Version]
- Łysiak, G.; Kurlus, R.; Zydlik, Z.; Walkowiak-Tomczak, D. Apple Skin Colour Changes during Harvest as an Indicator of Maturity. Acta Sci. Pol.-Hortorum Cultus 2014, 13, 71–83. [Google Scholar]
- Dodds, G.T.; Brown, J.W.; Ludford, P.M. Surface Color Changes of Tomato and Other Solanaceous Fruit during Chilling. J. Am. Soc. Hortic. Sci. 1991, 116, 482–490. [Google Scholar] [CrossRef] [Green Version]
- Usenik, V.; Štampar, F.; Veberič, R. Anthocyanins and Fruit Colour in Plums (Prunus domestica L.) during Ripening. Food Chem. 2009, 114, 529–534. [Google Scholar] [CrossRef]
- Carreño, J.; Martínez, A.; Almela, L.; Fernández-López, J.A. Proposal of an Index for the Objective Evaluation of the Colour of Red Table Grapes. Food Res. Int. 1995, 28, 373–377. [Google Scholar] [CrossRef]
- Łysiak, G.P.; Kurlus, R.; Michalska, A. Increasing the Frost Resistance of ‘Golden Delicious’,‘Gala’and ‘Šampion’Apple Cultivars. Folia Hortic. 2016, 28, 125. [Google Scholar] [CrossRef] [Green Version]
- Bieniek, A.; Draganska, E.; Pranckietis, V. Assesment of Climatic Conditions for Actinidia Arguta Cultivation in North-Eastern Poland. Zemdirb.-Agric. 2016, 103, 311–318. [Google Scholar] [CrossRef] [Green Version]
- Davarynejad, G.H.; Szabo, Z.; Persely, S.; Szabo, T.; Nyéki, J. The Fruit Set Capability of Some Sour Cherry Cultivars (Prunus cerasus L.). Acta Hortic. 2014; 181–184. [Google Scholar] [CrossRef]
- Szabó, Z.; Nyéki, J.; Soltész, M. Frost Injury to Flower Buds and Flowers of Cherry Varieties. Acta Hortic. 1996, 315–322. [Google Scholar] [CrossRef]
- Głowacka, A.; Rozpara, E. Growth and Yield Characteristics of Some Juicing Sour Cherry Cultivars Selected in Poland. Acta Hortic. 2017, 299–302. [Google Scholar] [CrossRef]
- Głowacka, A.; Rozpara, E. Charakterystyka wzrostu i owocowania nowych niemieckich odmian wiśni w warunkach klimatycznych centralnej Polski. Zeszyty Naukowe Instytutu Sadownictwa i Kwiaciarstwa w Skierniewicach 2010, 18, 15–24. [Google Scholar]
- Wrona, D.; Sadowski, A. Effects of Nitrogen Fertilisation in Young Apple Orchard. Acta Hortic. 1997, 481–486. [Google Scholar] [CrossRef]
- Piotrowska, A.; Wilczewski, E. Effects of Catch Crops Cultivated for Green Manure and Mineral Nitrogen Fertilization on Soil Enzyme Activities and Chemical Properties. Geoderma 2012, 189–190, 72–80. [Google Scholar] [CrossRef]
- Shen, W.; Lin, X.; Shi, W.; Min, J.; Gao, N.; Zhang, H.; Yin, R.; He, X. Higher Rates of Nitrogen Fertilization Decrease Soil Enzyme Activities, Microbial Functional Diversity and Nitrification Capacity in a Chinese Polytunnel Greenhouse Vegetable Land. Plant Soil 2010, 337, 137–150. [Google Scholar] [CrossRef]
- Ge, C.; Xue, D.; Yao, H. Microbial Biomass, Community Diversity, and Enzyme Activities in Response to Urea Application in Tea Orchard Soils. Commun. Soil Sci. Plant Anal. 2010, 41, 797–810. [Google Scholar] [CrossRef]
- Wan, S.-Z.; Gu, H.-J.; Yang, Q.-P.; Hu, X.-F.; Fang, X.-M.; Singh, A.N.; Chen, F.-S. Long-Term Fertilization Increases Soil Nutrient Accumulations but Decreases Biological Activity in Navel Orange Orchards of Subtropical China. J. Soils Sediments 2017, 17, 2346–2356. [Google Scholar] [CrossRef]
- Martínez-Dalmau, J.; Berbel, J.; Ordóñez-Fernández, R. Nitrogen Fertilization. A Review of the Risks Associated with the Inefficiency of Its Use and Policy Responses. Sustainability 2021, 13, 5625. [Google Scholar] [CrossRef]
- Szpadzik, E.; Matulka, M.; Jadczuk-Tobjasz, E. The Growth, Yielding and Resistance to Spring Frost of Nine Sour Cherry Cultivars in Central Poland. J. Fruit Ornam. Plant Res. 2009, 17, 139–148. [Google Scholar]
- Bieniasz, M.; Konieczny, A. The Effect of Titanium Organic Complex on Pollination Process and Fruit Development of Apple Cv. Topaz. Agronomy 2021, 11, 2591. [Google Scholar] [CrossRef]
- Lakatos, L.; Szabó, T.; Szabó, Z.; Soltész, M.; Nyéki, J. Relation of Sour Cherry Blooming Dynamics and Meteorological Variables. Int. J. Hortic. Sci. 2009, 15, 17–23. [Google Scholar] [CrossRef]
- Szpadzik, E.; Jadczuk-Tobjasz, E.; \Lotocka, B. Floral Biology of Some Sour Cherry Cultivars and Their Suitability for Cultivation. Hortic. Landsc. Archit. 2010, 31, 43–51. [Google Scholar]
- Jadczuk-Tobjasz, E.; Bednarski, R. Wstepna Ocena Wzrostu i Owocowania Dziesieciu Odmian Wisni (Preliminary Evaluation of the Growth and Yielding of 10 Sour Cherry Cultivars). Zeszyty Naukowe Instytutu Sadownictwa i Kwiaciarstwa w Skierniewicach 2007, 15, 17–27. [Google Scholar]
- Lipa, T.; Szot, I. Effect of Fertilization Methods on Growth of Pear Trees, Yielding and Fruit Quality. Modern Phytomorphology 2013, 4, 55–58. [Google Scholar]
- Uçgun, K. Effects of Nitrogen and Potassium Fertilization on Nutrient Content and Quality Attributes of Sweet Cherry Fruits. Not. Bot. Horti Agrobot. Cluj-Napoca 2019, 47, 114–118. [Google Scholar] [CrossRef] [Green Version]
- Rettke, M.A.; Pitt, T.R.; Maier, N.A.; Jones, J.A. Quality of Fresh and Dried Fruit of Apricot (Cv. Moorpark) in Response to Soil-Applied Nitrogen. Aust. J. Exp. Agric. 2006, 46, 123. [Google Scholar] [CrossRef]
- Neilsen, G.; Kappel, F.; Neilsen, D. Fertigation and Crop Load Affect Yield, Nutrition, and Fruit Quality of ‘Lapins’ Sweet Cherry on Gisela 5 Rootstock. HortScience 2007, 42, 1456–1462. [Google Scholar] [CrossRef] [Green Version]
- Neilsen, G.; Kappel, F.; Neilsen, D. Fertigation Method Affects Performance of ‘Lapins’ Sweet Cherry on Gisela 5 Rootstock. HortScience 2004, 39, 1716–1721. [Google Scholar] [CrossRef] [Green Version]
- Mikiciuk, G.; Mikiciuk, M.; Statkiewicz, A.T.M.; Chylewska, U. The Effects of InCa Fertilizer Used in Foliar Nutrition on Yield Quantity and Quality and Selected Physiological Parameters of Sweet Cherry Cv.’Burlat’. Folia Pomeranae Univ. Technol. Stetin. Agric. Aliment. Piscaria Zootech. 2018, 345, 91–103. [Google Scholar] [CrossRef]
- Moradinezhad, F.; Dorostkar, M. Pre-Harvest Foliar Application of Calcium Chloride and Potassium Nitrate Influences Growth and Quality of Apricot (Prunus armeniaca L.) Fruit Cv. ‘Shahroudi.’. J. Soil Sci. Plant Nutr. 2021, 21, 1642–1652. [Google Scholar] [CrossRef]
- Blando, F.; Oomah, B.D. Sweet and Sour Cherries: Origin, Distribution, Nutritional Composition and Health Benefits. Trends Food Sci. Technol. 2019, 86, 517–529. [Google Scholar] [CrossRef]
- Yener, H.; Altuntaş, Ö. Effects of Potassium Fertilization on Leaf Nutrient Content and Quality Attributes of Sweet Cherry Fruits (Prunus avium L.). J. Plant Nutr. 2021, 44, 946–957. [Google Scholar] [CrossRef]
- Pedisić, S.; Dragović-Uzelac, V.; Levaj, B.; Škevin, D. Effect of Maturity and Geographical Region on Anthocyanin Content of Sour Cherries (Prunus cerasus Var. Marasca). Food Technol. Biotechnol. 2010, 48, 86–93. [Google Scholar]
- Gao, L.; Mazza, G. Characterization, Quantitation, and Distribution of Anthocyanins and Colorless Phenolics in Sweet Cherries. J. Agric. Food Chem. 1995, 43, 343–346. [Google Scholar] [CrossRef]
- Gonçalves, B.; Silva, A.P.; Moutinho-Pereira, J.; Bacelar, E.; Rosa, E.; Meyer, A.S. Effect of Ripeness and Postharvest Storage on the Evolution of Colour and Anthocyanins in Cherries (Prunus avium L.). Food Chem. 2007, 103, 976–984. [Google Scholar] [CrossRef]
- Gonçalves, B.; Landbo, A.-K.; Knudsen, D.; Silva, A.P.; Moutinho-Pereira, J.; Rosa, E.; Meyer, A.S. Effect of Ripeness and Postharvest Storage on the Phenolic Profiles of Cherries (Prunus avium L.). J. Agric. Food Chem. 2004, 52, 523–530. [Google Scholar] [CrossRef] [PubMed]
- Szot, I.; Lipa, T.; Sosnowska, B. Evaluation of Yield and Fruit Quality of Several Ecotypes of Cornelian Cherry (Cornus Mas L.) in Polish Condiotions. Acta Sci. Pol. Hortorum Cultus 2019, 18, 139–148. [Google Scholar] [CrossRef]
- Tomala, K. Orchard Factors Affecting Fruit Storage Quality and Prediction of Harvest Date of Apples. In Proceedings of the International Symposium Effect of Pre-& Postharvest Factors in Fruit Storage 485, Warsaw, Poland, 3 August 1997; pp. 373–382. [Google Scholar]
- Ochmian, I.D. The Impact of Foliar Application of Calcium Fertilizers on the Quality of Highbush Blueberry Fruits Belonging to the “Duke” Cultivar. Not. Bot. Horti Agrobot. Cluj-Napoca 2012, 40, 163–169. [Google Scholar] [CrossRef] [Green Version]
- Dziedzic, E.; Błaszczyk, J.; Kaczmarczyk, E. Influence of Rootstocks and Storage Conditions on the Quality of Sweet Cherry Fruits ‘Regina’. Acta Sci Pol Hortorum Cultus 2016, 15, 119–131. [Google Scholar]
- Łysiak, G.P.; Rutkowski, K.; Walkowiak-Tomczak, D. Effect of Storage Conditions on Storability and Antioxidant Potential of Pears Cv. ‘Conference’. Agriculture 2021, 11, 545. [Google Scholar] [CrossRef]
- Szpadzik, E.; Jadczuk-Tobjasz, E.; Lotocka, B. Preliminary Evaluation of Pollen Quality, Fertility Relations and Fruit Set of Selected Sour Cherry Cultivars in Polish Conditions. Acta Agrobot. 2008, 61, 71–77. [Google Scholar] [CrossRef] [Green Version]
- Cerovlć, R.; Ružić, D. Pollen Tube Growth in Sour Cherry (Prunus cerasus L.) at Different Temperatures. J. Hortic. Sci. 1992, 67, 333–340. [Google Scholar] [CrossRef]
- Lech, W.; Małodobry, M.; Dziedzic, E.; Bieniasz, M.; Doniec, S. Analysis of Flowering of Several Sweet Cherry Cultivars in the Climatic Conditions of Southern Poland. Acta Hortic. 2012, 932, 143–148. [Google Scholar] [CrossRef]
- Lakatos, L.; Dussi, M.C.; Szabó, Z.; Soltész, M.; Nyéki, J.; Szabó, T.; Davarynejad, G.H. Weather Effects on Flowering Dynamics of Sour Cherry. Acta Hortic. 2014, 293–302. [Google Scholar] [CrossRef]
- Zavalloni, C.; Andresen, J.A.; Flore, J.A. Phenological Models of Flower Bud Stages and Fruit Growth of ‘Montmorency’ Sour Cherry Based on Growing Degree-Day Accumulation. J. Am. Soc. Hortic. Sci. 2006, 131, 601–607. [Google Scholar] [CrossRef] [Green Version]
- Szot, I.; Łysiak, G.P. Effect of the Climatic Conditions in Central Europe on the Growth and Yield of Cornelian Cherry Cultivars. Agriculture 2022, 12, 1295. [Google Scholar] [CrossRef]
- Łysiak, G. The Sum of Active Temperatures as a Method of Determining the Optimum Harvest Date of ‘Sampion’and ‘Ligol’Apple Cultivars. Acta Sci.-Pol. Hortorum Cultus 2012, 11, 3–13. [Google Scholar]
Figure 1.
Temperature profiles corresponding to the 2 weeks before and after full flowering in the years of onset of spring frosts. (A) 2007, (B) 2008, (C) 2010, (D) 2011.
Figure 1.
Temperature profiles corresponding to the 2 weeks before and after full flowering in the years of onset of spring frosts. (A) 2007, (B) 2008, (C) 2010, (D) 2011.

Figure 2.
Total fruit yield in the years 2006–2013 (kg·tree–1). 1 means that the same letters for each orchard are not significantly different at α = 0.05 (Duncan’s test).
Figure 2.
Total fruit yield in the years 2006–2013 (kg·tree–1). 1 means that the same letters for each orchard are not significantly different at α = 0.05 (Duncan’s test).

Figure 3.
Ratio of total soluble solid content (TSS) and acidity (TA) depending on the age of the orchard (A) and nitrogen fertilization (B). 1 means that the same letters are not significantly different at α = 0.05 (Duncan’s test).
Figure 3.
Ratio of total soluble solid content (TSS) and acidity (TA) depending on the age of the orchard (A) and nitrogen fertilization (B). 1 means that the same letters are not significantly different at α = 0.05 (Duncan’s test).

Figure 4.
Relationship between pH sour cherry juice and color index for: A (COL) B (CIRG).

Figure 5.
Influence of active temperatures on: (A)—flowering date, (B)—ripening date.

Figure 6.
Relationship between: (A)—total of rainfall and number of days between flowering and harvest date and (B)—flowering date and water balance.
Figure 6.
Relationship between: (A)—total of rainfall and number of days between flowering and harvest date and (B)—flowering date and water balance.


Table 1.
Air temperatures in the experimental plot at bloom time in 2006–2013.
| 2006 | 2007 | 2008 | 2009 | 2010 | 2011 | 2012 | 2013 | |
|---|---|---|---|---|---|---|---|---|
| Air temperature before full bloom | ||||||||
| 7 days | ||||||||
| Mean | 16.6 | 10.8 | 12.0 | 13.2 | 11.2 | 12.1 | 11.6 | 13.0 |
| Min | 5.4 | −3.2 | −0.3 | 0.0 | −3.0 | 1.0 | 1.7 | 4.8 |
| Max | 22.2 | 25.1 | 20.1 | 22.9 | 26.6 | 25.0 | 19.0 | 22.9 |
| Air temperature after full bloom | ||||||||
| 7 days | ||||||||
| Mean | 14.9 | 9.5 | 11.8 | 11.9 | 10.5 | 11.3 | 19.2 | 15.7 |
| Min | 3.3 | −2.6 | 1.8 | 1.4 | 4.9 | −2.9 | 10.8 | 8.7 |
| Max | 25.2 | 24.6 | 20.3 | 25.4 | 19.9 | 26.6 | 29.8 | 27.1 |
| 14 days | ||||||||
| Mean | 14.9 | 10.7 | 12.9 | 11.7 | 11.2 | 12.8 | 16.8 | 16.5 |
| Min | 3.3 | −2.6 | 1.8 | −0.4 | 2.1 | −2.9 | 4.6 | 7.4 |
| Max | 25.2 | 24.6 | 24.3 | 25.4 | 21.3 | 28.2 | 29.8 | 27.1 |
| 28 days | ||||||||
| Mean | 13.2 | 13.1 | 13.0 | 12.6 | 11.6 | 14.9 | 15.8 | 14.9 |
| Min | 3.3 | −2.6 | 0.0 | −0.4 | 2.1 | −2.9 | 1.5 | 3.5 |
| Max | 25.2 | 28.8 | 24.3 | 25.4 | 24.1 | 29.7 | 31.2 | 27.1 |
Table 2.
Total precipitation recorded in 2006–2013.
| Month | Total Rainfall (mm) | |||||||
|---|---|---|---|---|---|---|---|---|
| 2006 | 2007 | 2008 | 2009 | 2010 | 2011 | 2012 | 2013 | |
| Jan | 11.0 | 59.0 | 65.3 | 22.4 | 23.5 | 37.5 | 34.2 | 44.8 |
| Feb | 12.1 | 41.8 | 7.2 | 19.8 | 15.2 | 33.0 | 21.2 | 1.2 |
| Mar | 16.6 | 52.8 | 36.1 | 54.2 | 42.6 | 27.6 | 7.6 | 10.2 |
| Apr | 39.8 | 5.4 | 56.2 | 19.6 | 19.0 | 9.2 | 9.8 | 85.2 |
| May | 33.3 | 98.8 | 9.0 | 85.4 | 110.1 | 32.8 | 57.0 | 99.4 |
| Jun | 17.4 | 85.6 | 15.2 | 160.0 | 13.0 | 56.2 | 127.8 | 46.0 |
| Jul | 23.8 | 95.8 | 62.0 | 79.4 | 111.4 | 182.4 | 121.8 | 37.6 |
| Aug | 162.0 | 34.8 | 116.4 | 32.8 | 124.1 | 32.4 | 39.0 | 38.2 |
| Sep | 22.6 | 29.4 | 27.0 | 52.4 | 72.4 | 27.8 | 24.6 | 81.0 |
| Oct | 25.2 | 20.2 | 57.2 | 68.4 | 5.3 | 27.4 | 64.4 | 23.8 |
| Nov | 25.0 | 30.6 | 26.6 | 17.8 | 114.9 | 3.2 | 22.8 | 49.4 |
| Dec | 35.9 | 21.6 | 33.4 | 16.6 | 46.5 | 53.2 | 46.6 | 20.0 |
| Total | 424.7 | 575.8 | 511.6 | 628.8 | 698.0 | 522.7 | 576.8 | 516.8 |
Table 3.
Temperatures in 2006–2013.
| Month | Temperature (°C) | |||||||
|---|---|---|---|---|---|---|---|---|
| 2006 | 2007 | 2008 | 2009 | 2010 | 2011 | 2012 | 2013 | |
| Jan | −6.6 | 3.6 | 1.6 | −3.2 | −7.3 | 0.4 | 1.1 | −2.2 |
| Feb | −1.4 | 0.3 | 3.4 | −1.1 | −1.8 | −2.3 | −4.3 | 0.0 |
| Mar | 0.7 | 5.8 | 3.5 | 3.5 | 3.3 | 3.2 | 6.3 | −2.1 |
| Apr | 9.2 | 9.6 | 7.9 | 11.3 | 8.7 | 12.6 | 9.8 | 9.5 |
| May | 14.4 | 14.2 | 13.6 | 12.5 | 11.6 | 16.5 | 15.4 | 14.4 |
| Jun | 19.5 | 18.1 | 17.4 | 14.6 | 17.0 | 21.3 | 16.0 | 17.4 |
| Jul | 22.9 | 17.7 | 19.0 | 18.5 | 22.0 | 18.6 | 19.1 | 19.7 |
| Aug | 16.7 | 18.2 | 17.6 | 18.8 | 18.8 | 20.6 | 18.3 | 18.7 |
| Sep | 16.1 | 12.8 | 12.7 | 14.8 | 12.7 | 16.2 | 14.2 | 12.6 |
| Oct | 10.4 | 7.4 | 8.6 | 6.8 | 6.4 | 9.4 | 8.2 | 10.2 |
| Nov | 5.8 | 2.0 | 4.7 | 5.7 | 4.5 | 3.1 | 5.3 | 5.1 |
| Dec | 3.8 | 0.7 | 0.7 | −1.2 | −5.8 | 2.5 | −1.4 | 2.7 |
| Mean | 9.3 | 9.2 | 9.2 | 8.4 | 7.5 | 10.2 | 9.0 | 8.8 |
Table 4.
Yield of sour cherries of the ‘Łutówka’ cultivar in the years 2006–2013 depending on the year and fertilization (kg·tree−1).
Table 4.
Yield of sour cherries of the ‘Łutówka’ cultivar in the years 2006–2013 depending on the year and fertilization (kg·tree−1).
| Fertilization | 2006 | 2007 | 2008 | 2009 | 2010 | 2011 | 2012 | 2013 | Mean for Fertilization |
|---|---|---|---|---|---|---|---|---|---|
| 0 N | 7.9 a 1 | 4.6 a | 6.8 a | 6.5 a | 2.1 a | 1.7 a | 8.0 a | 5.2 a | 5.4 A 2 |
| 60 N | 9.4 b | 7.8 b | 8.1 ab | 8.2 b | 3.0 b | 2.2 ab | 9.6 b | 6.7 b | 6.9 B |
| 120 N | 7.9 a | 7.2 b | 8.3 b | 6.9 a | 3.1 b | 3.1 b | 8.3 a | 7.2 b | 6.5 B |
1 means that the same letters column for fertilization in each year are not significantly different at α = 0.05 (Duncan’s test). 2 means that the same capital letters for fertilization in 2006–2013 (last column) are not significantly different at α = 0.05 (Duncan’s test).
Table 5.
Effect of nitrogen fertilization on tree yield.
| Orchard | Fertilization | Mean Yield in 2006–2013 | Sum Yield in 2006–2013 | Productivity Coefficient | ||
|---|---|---|---|---|---|---|
| kg·tree−1 | t·ha−1 | kg·tree−1 | t·ha−1 | kg·cm−2 | ||
| OR 1 | N0 | 5.4 b 1 | 7.1 a | 45.5 ab | 56.9 a | 0.09 a |
| N60 | 7.6 e | 9.8 bc | 62.5 d | 78.1 bc | 0.10 ab | |
| N120 | 5.7 bc | 7.5 a | 48.1 bc | 60.2 a | 0.09 a | |
| OR 2 | N0 | 4.4 a | 8.7 ab | 36.4 a | 69.9 ab | 0.09 a |
| N60 | 5.8 bc | 11.6 cd | 48.3 bc | 92.9 cd | 0.11 a–c | |
| N120 | 5.9 bc | 11.9 de | 49.7 bc | 95.5 de | 0.11 a–c | |
| OR 3 | N0 | 5.5 bc | 11.2 cd | 46.7 a-c | 89.9 cd | 0.13 bc |
| N60 | 6.5 cd | 13.1 de | 54.3 b-d | 104.4 de | 0.14 cd | |
| N120 | 7.0 de | 14.0 e | 58.1 cd | 111.8 e | 0.15 d | |
1 orchard × fertilization, means that the same letters for each column are not significantly different at α = 0.05 (Duncan’s test).
Table 6.
The weight of fruits of the sour cherry cv. ‘Łutówka’ depending on the age of the orchard and nitrogen fertilization in the years 2006–2013.
Table 6.
The weight of fruits of the sour cherry cv. ‘Łutówka’ depending on the age of the orchard and nitrogen fertilization in the years 2006–2013.
| Orchard | Mass of 100 Fruit (g) | ||
|---|---|---|---|
| Fertilization | |||
| 0 N | 60 N | 120 N | |
| OR 1 | 576.2 b 1 | 586.4 b | 607.6 b |
| OR 2 | 527.9 a | 550.0 a | 575.5 ab |
| OR 3 | 540.2 a | 560.3 ab | 558.7 b |
| Mean for fertilization | 556.3 A 2 | 572.3 AB | 585.0 C |
1 orchard × fertilization; the same letters are not significantly different at α = 0.05 (Duncan’s test). 2 means that the same capital letters in the last row are not significantly different at α = 0.05 (Duncan’s test).
Table 7.
Firmness of sour cherry fruit cv. Łutówka in 2006–2013.
| Orchard | Firmness (N) | ||
|---|---|---|---|
| Fertilization | |||
| 0 N | 60 N | 120 N | |
| OR 1 | 2.19 a 1 | 2.07 a | 2.17 b |
| OR 2 | 2.12 a | 2.10 a | 2.12 ab |
| OR 3 | 1.99 a | 2.02 a | 1.94 a |
| Mean for fertilization | 2.10 A 2 | 2.06 A | 2.08 A |
1 orchard × fertilization; the same letters are not significantly different at α = 0.05 (Duncan’s test). 2 means that the same capital letters in the last row are not significantly different at α = 0.05 (Duncan’s test).
Table 8.
Influence of fertilization on TSS content of sour cherry fruit cv. ‘Łutówka’ in the years 2006–2013.
Table 8.
Influence of fertilization on TSS content of sour cherry fruit cv. ‘Łutówka’ in the years 2006–2013.
| Orchard | Total Soluble Solid (°Brix) | |||
|---|---|---|---|---|
| Fertilization | Mean for Orchard | |||
| 0 N | 60 N | 120 N | ||
| OR 1 | 14.7 a 1 | 14.0 a | 14.1 a | 14.3 A 3 |
| OR 2 | 15.7 b | 14.6 b | 14.0 a | 14.8 B |
| OR 3 | 15.2 ab | 14.7 b | 13.9 a | 14.6 AB |
| Mean for fertilization | 15.2 C 2 | 14.5 B | 14.0 A | |
1 orchard × fertilization; the same letters are not significantly different at α = 0.05 (Duncan’s test). 2 means that the same capital letters in the last row are not significantly different at α = 0.05 (Duncan’s test). 3 means that the same capital letters in the last column for year are not significantly different at α = 0.05 (Duncan’s test).
Table 9.
Influence of fertilization on titratable acidity of sour cherry cv. ‘Łutówka’ fruits in 2006–2013.
Table 9.
Influence of fertilization on titratable acidity of sour cherry cv. ‘Łutówka’ fruits in 2006–2013.
| Orchard | Titratable Acidity (Malic Acid mg/100 mL) | |||
|---|---|---|---|---|
| Fertilization | Mean for Orchard | |||
| 0 N | 60 N | 120 N | ||
| OR 1 | 1.82 b 1 | 1.77 a | 1.81 b | 1.80 B 3 |
| OR 2 | 1.73 a | 1.69 a | 1.63 a | 1.68 A |
| OR 3 | 1.69 a | 1.68 a | 1.69 ab | 1.69 A |
| Mean for fertilization | 1.74 A 2 | 1.72 A | 1.70 A | |
1 orchard × fertilization; the same letters are not significantly different at α = 0.05 (Duncan’s test). 2 means that the same capital letters in the last row are not significantly different at α = 0.05 (Duncan’s test). 3 means that the same capital letters in the last column for year are not significantly different at α = 0.05 (Duncan’s test).
Table 10.
Color space of skin of sour cherry cv. ‘Łutówka’.
| Year | Fertilization [N kg ha–1] | Color Components and Indices | ||||||
|---|---|---|---|---|---|---|---|---|
| L* | a* | b* | C* | h° | COL | CIRG | ||
| 2006 | 0 | 24.4 f 1 | 20.4 j | 2.9 gh | 20.6 m | 6.2 a–c | 81.4 c | 3.9 c–e |
| 60 | 24.8 g | 20.7 j | 3.3 h | 21.0 m | 7.2 a–c | 79.7 c | 3.9 cd | |
| 120 | 24.8 g | 23.4 k | 3.9 i | 23.8 n | 7.6 a–c | 79.9 c | 3.6 c | |
| 2007 | 0 | 20.6 b–d | 12.9 gh | −0.1 a | 14.7 k | 1.0 a | 81.4 c | −0.0 a |
| 60 | 21.0 d | 14.3 h | 1.0 b | 17.6 l | 12.7 b–d | 81.6 c | 1.6 b | |
| 120 | 20.9 d | 17.7 i | 0.7 b | 17.9 l | 4.7 ab | 91.9 d–f | 1.8 b | |
| 2008 | 0 | 20.4 bc | 11.3 g | 2.1 c | 11.5 i | 7.4 a–c | 97.3 f | 5.5 i–l |
| 60 | 20.7 cd | 12.6 gh | 2.4 c–f | 12.9 j | 7.4 a–c | 95.6 ef | 5.2 h–j | |
| 120 | 20.5 bc | 14.3 h | 2.7 e–g | 14.6 k | 7.7 a–c | 96.5 ef | 5.0 g–i | |
| 2009 | 0 | 20.5 bc | 5.6 a–d | 2.1 c | 6.1 b–d | 18.0 d–f | 86.9 cd | 6.1 l |
| 60 | 20.2 b | 7.2 d–f | 2.3 cd | 7.6 e–g | 12.8 b–d | 93.0 d–f | 5.8 j–l | |
| 120 | 20.3 bc | 8.6 f | 2.7 d–g | 9.0 h | 13.1 cd | 92.8 d–f | 5.8 j–l | |
| 2010 | 0 | 23.4 e | 6.1 b–e | 2.2 cd | 6.5 c–e | 14.2 cd | 79.7 c | 5.6 i–l |
| 60 | 23.5 e | 6.7 c–f | 2.5 c–g | 7.2 d–g | 14.1 cd | 79.7 c | 5.4 i–k | |
| 120 | 23.6 e | 7.8 ef | 2.8 fg | 8.3 gh | 13.6 cd | 79.7 c | 5.2 h–j | |
| 2011 | 0 | 19.4 a | 5.2 a–d | 3.0 gh | 6.1 b–d | 23.9 e–g | 85.6 cd | 6.2 l |
| 60 | 19.6 a | 6.0 b–e | 3.0 gh | 6.8 d–f | 20.8 d–f | 88.2 c–e | 6.0 kl | |
| 120 | 19.7 a | 7.0 d–f | 3.3 h | 7.8 fg | 19.0 d–f | 90.2 d–f | 5.9 kl | |
| 2012 | 0 | 28.1 h | 4.7 ab | 1.1 b | 5.1 ab | 16.4 de | 62.3 b | 3.6 c |
| 60 | 28.3 hi | 4.1 ab | 2.1 c | 4.7 a | 20.4 d–f | 60.6 b | 4.8 f–h | |
| 120 | 28.5 ij | 4.8 a–c | 2.3 c–e | 5.4 a–c | 19.1 d–f | 61.1 b | 4.8 f–h | |
| 2013 | 0 | 28.8 j | 3.7 a | 2.7 d–g | 4.8 ab | 30.8 gh | 48.7 a | 4.2 c–f |
| 60 | 28.6 ij | 3.8 a | 2.8 f–h | 4.9 ab | 31.7 h | 50.9 a | 4.3 d–f | |
| 120 | 28.9 j | 4.5 ab | 2.9 gh | 5.4 a–c | 25.9 f–h | 55.6 ab | 4.5 e–g | |
| Mean for orchard | 1999 | 23.7 b 2 | 10.5 b | 2.6 b | 11.1 b | 14.3 ab | 78.9 ab | 4.6 a |
| 2001 | 23.1 a | 8.3 a | 2.2 a | 9.2 a | 17.5 b | 77.7 a | 4.6 a | |
| 2002 | 23.1 a | 10.3 b | 2.3 a | 11.0 b | 12.6 a | 81.0 b | 4.4 a | |
| Mean for fertilization | 0 | 23.2 a 3 | 8.7 a | 2.0 a | 9.4 a | 14.7 ab | 77.9 a | 4.4 a |
| 60 | 23.3 b | 9.4 b | 2.4 b | 10.3 b | 15.9 b | 78.7 ab | 4.6 b | |
| 120 | 23.4 b | 11.0 c | 2.7 c | 11.5 c | 13.8 a | 81.0 b | 4.6 ab | |
1 year × fertilization; the same letters are not significantly different at α = 0.05 (Duncan’s test). 2,3 the orchard and fertilization; the same letters are not significantly different at α = 0.05 (Duncan’s test). Explanations: L* indicates darkening of fruit at the time of harvest; a* indicates chromaticity on a green (−) to red (+) axis; b* chromaticity on a blue (−) to yellow (+) axis; C*—Chroma = ((a*)2 + (b*)2)0.5); H°– (tan–1 b*/a*); COL = (2000 × a)/(L × (a2 + b2)0.5); CIRG = (18O − h)/(L* + C).
Table 11.
Correlation coefficient between fruit coloring and fruit quality
| Firmness | TSS | Acidity | pH | Mass of Fruit | Yield | Fertility Index | |
|---|---|---|---|---|---|---|---|
| L* | 0.11 | −0.10 | −0.15 * | −0.80 *** | 0.17 * | 0.26 ** | 0.01 |
| a* | 0.62 *** | 0.05 | −0.11 | 0.48 ** | −0.41 ** | −0.30 ** | 0.63 *** |
| b* | −0.08 | −0.06 | 0.44 *** | −0.11 | 0.11 | −0.01 | 0.02 |
| H° | −0.29 ** | 0,34 | −0.28* | −0.57 ** | −0.25 * | −0.20 * | −0.39 * |
| C*ab | 0.68 *** | 0.05 | 0.02 | 0.55 ** | −0.46 ** | 0.30 * | 0.64 *** |
| COL | −0.06 | 0.04 | 0.08 | 0.90 *** | −0.12 * | −0.06 | 0.16 * |
| CIRG | −0.58 *** | −0.08 | 0.32 ** | 0.60 ** | 0.36 ** | −0.19 * | −0.29 ** |
* Significant levels p < 0.001, ** p < 0.01, *** p < 0.05. Explanations: L* indicator of darkening of fruit at the time of harvest; a* indicates chromaticity on a green (−) to red (+) axis; b* chromaticity on a blue (−) to yellow (+) axis; C*ab—Chroma = ((a*)2 + (b*)2)0.5); H°—(tan−1 b*/a*); COL = (2000 × a)/(L* × ((a*)2 + (b*)2)0.5); CIRG = (18O − h)/(L* + C).
Table 12.
Influence of weather condition on fruit quality parameters.
| Firmness | TSS | Acidity | pH | Mass of Fruit | Yield | Fertility Index | |
|---|---|---|---|---|---|---|---|
| Precipitation | –0.47 ** | −0.44 ** | −0.40 ** | −0.22 * | 0.58 *** | −0.14 * | −0.39 ** |
| Evapotranspiration | 0.65 *** | 0.34 * | 0.13 * | 0.11 | −0.52 ** | 0.12 * | 0.12 |
| Insolation | 0.37 * | 0.12 * | −0.06 | 0.33 ** | −0.42 ** | 0.41 ** | 0.55 ** |
| DBFH | −0.47 ** | −0.62 *** | −0.26 * | −0.24 ** | 0.66 *** | 0.03 | −0.17 |
| DOH | −0.31 ** | −0.35 ** | 0.25 * | −0.40 ** | 0.48 ** | −0.03 | −0.12 |
| DOF | 0.18 * | 0.30 ** | 0.63 *** | −0.21 ** | −0.20* | −0.07 | 0.05 |
* Significant levels p < 0.001, ** p < 0.01, *** p < 0.05. Explanations: DBFH—number of days between full flowering and harvest; DOH—number of days from the beginning of the year to harvest; DOF—number of days from the beginning of the year to flowering.
Table 13.
Dates of full bloom, harvest and sum of active temperatures for sour cherry cv. ‘Łutówka’.
Table 13.
Dates of full bloom, harvest and sum of active temperatures for sour cherry cv. ‘Łutówka’.
| Year | FB | HD | HDAFB | SAT | |||||||
|---|---|---|---|---|---|---|---|---|---|---|---|
| DOY | DOY | 0 °C | 5 °C | 9 °C | 10 °C | 11 °C | 15 °C | ||||
| 2006 | 09.05 | 129 | 26.07 | 207 | 78 | 1976 | 1935 | 1836 | 1779 | 1683 | 1189 |
| 2007 | 27.04 | 117 | 13.07 | 194 | 77 | 1849 | 1704 | 1426 | 1331 | 1278 | 895 |
| 2008 | 30.04 | 121 | 15.07 | 197 | 76 | 1759 | 1674 | 1381 | 1334 | 1272 | 872 |
| 2009 | 29.04 | 119 | 27.07 | 208 | 89 | 1775 | 1696 | 1604 | 1470 | 1365 | 862 |
| 2010 | 01.05 | 121 | 26.07 | 207 | 86 | 1887 | 1881 | 1639 | 1562 | 1467 | 1132 |
| 2011 | 04.05 | 125 | 21.07 | 203 | 78 | 1939 | 1867 | 1676 | 1619 | 1577 | 1215 |
| 2012 | 27.04 | 118 | 24.07 | 206 | 88 | 1945 | 1838 | 1609 | 1513 | 1428 | 1116 |
| 2013 | 07.05 | 128 | 26.07 | 208 | 80 | 1800 | 1722 | 1674 | 1589 | 1579 | 1207 |
| Mean | 02.05 | 122.3 | 23.07 | 203.8 | 81.5 | 1866 | 1790 | 1606 | 1525 | 1456 | 1061 |
| SD | 4.6 | 5.4 | 5.3 | 83.2 | 101.3 | 144.7 | 149.3 | 149.3 | 156.9 | ||
DOY—day of the year; HDAFB—harvest day after full blooming; HD—harvest day; FB—full blooming; SAT—sum of active temperatures; SD—standard deviation.
Table 14.
Influence of the total of active temperatures until the flowering date on selected features.
Table 14.
Influence of the total of active temperatures until the flowering date on selected features.
| Variable | >0 °C | >5 °C | >9 °C | >10 °C | >11 °C | >15 °C |
|---|---|---|---|---|---|---|
| L* | −0.46 *** | −0.34 ** | 0.20 ** | −0.06 | −0.06 | 0.11 |
| a* | 0.48 *** | 0.32 ** | −0.36 *** | −0.27 *** | −0.01 | −0.19 ** |
| b* | −0.37 ** | −0.10 | 0.44 *** | 0.50 *** | 0.40 *** | 0.53 *** |
| Hab | −0.46 *** | −0.09 | 0.08 | 0.19 ** | 0.25 ** | 0.22 ** |
| C*ab | 0.57 *** | 0.37 ** | −0.25 ** | −0.28 *** | −0.12* | −0.20 ** |
| COL | 0.31 ** | 0.19 * | −0.32 *** | −0.09 | −0.16* | −0.14 * |
| CIRG | −0.43 *** | −0.33 ** | 0.04 | 0.07 | 0.02 | 0.11 |
| F | 0.36 ** | 0.36 ** | 0.30 | −0.23 ** | −0.14 * | −0.17 * |
| TSS | 0.22 * | −0.02 | 0.16 * | 0.02 | 0.01 | −0.01 |
| TA | −0.15 * | −0.03 | 0.51 *** | 0.64 *** | 0.59 *** | 0.55 *** |
| MOF | −0.50 ** | −0.22 ** | −0.21 ** | −0.18 * | −0.18 * | −0.12 * |
| Y | 0.02 | −0.34 *** | −0.13 * | −0.05 | −0.09 | 0.05 |
| YE | 0.12 * | −0.02 | −0.02 | −0.15 * | 0.03 | 0.11 |
| DOH | −0.82 *** | −0.33 *** | 0.32 *** | 0.43 *** | 0.37 *** | 0.50 *** |
| DOF | −0.22 ** | 0.07 | 0.85 *** | 0.82 *** | 0.74 *** | 0.82 *** |
* Significant levels p < 0.001, ** p < 0.01, *** p < 0.05. Explanations: L* indicator of darkening of fruit at the time of harvest; a* indicates chromaticity on a green (−) to red (+) axis; b* chromaticity on a blue (−) to yellow (+) axis; C*ab—Chroma = ((a*)2 + (b*)2)0.5); Hab—(H° = tan−1 b*/a*); COL = (2000 × a)/(L* × (a2 + b2)0.5); CIRG = (18O − h)/(L* + C); F—firmness; TSS—total soluble solid; TA—titratable acidity; MOF—mass of fruit; Y—yield; YE—yield efficiency (kg per tree cross sectional area); DOH—number of days from the beginning of the year to harvest; DOF—number of days from the beginning of the year to flowering.
Table 15.
Influence of the total of active temperatures until the harvest date on selected characteristics.
Table 15.
Influence of the total of active temperatures until the harvest date on selected characteristics.
| Variable | >0 °C | >5 °C | >9 °C | >10 °C | >11 °C | >15 °C |
|---|---|---|---|---|---|---|
| L* | 0.24 *** | 0.23 *** | 0.40 *** | 0.38 *** | 0.41 *** | 0.54 *** |
| a* | 0.19 ** | −0.15 ** | 0.04 | 0.11 | 0.06 | −0.17 * |
| b* | 0.18 ** | 0.38 *** | 0.55 *** | 0.60 *** | 0.59 *** | 0.47 *** |
| Hab | −0.04 | −0.27 *** | −0.36 *** | −0.39 *** | 0.34 *** | 0.38 *** |
| C*ab | −0.19 ** | −0.14 * | 0.03 | 0.09 | 0.04 | −0.19 * |
| COL | −0.17 ** | −0.13 * | −0.31 *** | −0.28 *** | −0.35 *** | −049 *** |
| CIRG | −0.01 | 0.14 * | 0.21 *** | 0.22 *** | 018 ** | 0.15 ** |
| F | 0.29 *** | 0.17 ** | 0.07 | 0.12 * | 0.12 | 0.02 |
| TSS | −0.18 ** | −0.16 ** | −0.21 *** | −0.10 | 0.00 | 0.05 |
| TA | −0.10 | −0.04 | 0.35 *** | 0.37 *** | 0.45 *** | 0.29 *** |
| MOF | 0.01 | 0.20 ** | 0.19 ** | 0.12 * | 0.04 | 0.12 * |
| Y | 0.09 | −0.19 ** | 0.07 | −0.09 | −0.12 * | −0.24 *** |
| YE | 0.02 | −0.05 | 0.03 | −0.02 | 0.04 | −0.28 *** |
| DOH | 0.25 *** | 0.46 *** | 0.80 *** | 0.72 *** | 0.67 *** | 0.56 *** |
| DOF | 0.27 *** | 0.43 *** | 0.72 *** | 0.79 *** | 0.87 *** | 0.71 *** |
* Significant levels p < 0.001, ** p < 0.01, *** p < 0.05. Explanations: L* indicator of darkening of fruit at the time of harvest; a* indicates chromaticity on a green (−) to red (+) axis; b* chromaticity on a blue (−) to yellow (+) axis; C*ab—Chroma = ((a*)2 + (b*)2)0.5); Hab—(H° = tan−1 b*/a*); COL = (2000 × a)/(L* × (a2 + b2)0.5); CIRG = (18O − h)/(L* + C); F- firmness; TSS—total soluble solid; TA—titratable acidity; MOF—mass of fruit; Y—yield, YE—yield efficiency (kg per tree cross sectional area); DOH—number of days from the beginning of the year to harvest; DOF—number of days from the beginning of the year to flowering.
Publisher’s Note: MDPI stays neutral with regard to jurisdictional claims in published maps and institutional affiliations. |
© 2022 by the authors. Licensee MDPI, Basel, Switzerland. This article is an open access article distributed under the terms and conditions of the Creative Commons Attribution (CC BY) license (https://creativecommons.org/licenses/by/4.0/).
Share and Cite
MDPI and ACS Style
Rutkowski, K.; Łysiak, G.P. Weather Conditions, Orchard Age and Nitrogen Fertilization Influences Yield and Quality of ‘Łutówka’ Sour Cherry Fruit. Agriculture 2022, 12, 2008. https://doi.org/10.3390/agriculture12122008
AMA Style
Rutkowski K, Łysiak GP. Weather Conditions, Orchard Age and Nitrogen Fertilization Influences Yield and Quality of ‘Łutówka’ Sour Cherry Fruit. Agriculture. 2022; 12(12):2008. https://doi.org/10.3390/agriculture12122008
Chicago/Turabian StyleRutkowski, Krzysztof, and Grzegorz P. Łysiak. 2022. "Weather Conditions, Orchard Age and Nitrogen Fertilization Influences Yield and Quality of ‘Łutówka’ Sour Cherry Fruit" Agriculture 12, no. 12: 2008. https://doi.org/10.3390/agriculture12122008
Note that from the first issue of 2016, this journal uses article numbers instead of page numbers. See further details here.