Article

QTL Analysis for Chlorophyll Content in Strawberry (Fragaria × ananassa Duch.) Leaves

Vegetable Research Division, National Institute of Horticultural and Herbal Science, Rural Development Administration, Wanju 55365, Korea
*
Author to whom correspondence should be addressed.
Co-first author, these authors contributed equally to this work.
Agriculture 2021, 11(11), 1163; https://doi.org/10.3390/agriculture11111163
Submission received: 12 October 2021 / Revised: 16 November 2021 / Accepted: 16 November 2021 / Published: 18 November 2021
(This article belongs to the Special Issue Breeding and Genetics of Horticultural Crops)

Abstract

:
Chlorophyll is an important factor facilitating plants to capture, allocate and transforms light energy and plays a major role in yield formation. Strawberry is one of the most important fruit crops worldwide. Breeding strawberry for better light utilization by improving photosynthetic efficiency can improve the yield potential. In strawberry, genetic studies have been done for several traits, but no reports on the genetic mapping of chlorophyll content in leaves. In the present study, we used two independent F2 mapping populations (BS-F2 and BC-F2) and, Axiom 35 K strawberry chip and genotyping-by-sequencing derived single nucleotide polymorphisms based linkage maps to identify the quantitative trait loci (QTLs) controlling leaf chlorophyll content. SPAD values were used to estimate the leaf chlorophyll content of parental lines and F2 populations. A total of seven QTLs, including major and minor effects, common and specific to populations, were identified across the strawberry genome explaining phenotypic variation (R2) ranging from 1.4 to 26.4%. Candidate genes associated with the photosynthesis and chlorophyll content were inferred in commonly detected QTLs. This work thus provides not only information for novel loci controlling chlorophyll content in strawberry leaves but also forms the basis for future marker assisted breeding in strawberry to select the plants for required chlorophyll content.

1. Introduction

Photosynthesis is an important phenomenon in plants which is directly involved in yield formation, and it has been extensively studied in relation to high crop yield in plant breeding [1,2]. Chlorophyll is the paramount feature facilitating plants to captivate, transfer and convert light energy and performs an imperative function in the growth and development of plants [3,4]. Sustaining a high level of chlorophyll matter in leaves is an essential requirement to increase the photosynthetic activity [1,3]. Up to a particular range, there is a positive correlation between chlorophyll level and photosynthetic rate and N utilization in plants, which directly specify the yield [1,5,6,7]. Furthermore, chlorophyll content has been reported to be associated with yield, disease resistance, herbicide tolerance, salt tolerance and senescence-related traits in crops [1,8,9,10,11]. Consequently, chlorophyll content plays a significant role in crop quality and yield formation [1,3].
Chlorophyll content is a quantitatively inherited trait that is primarily governed by nuclear genes [1,3,12]. Earlier studies have proposed that at least 27 genes are involved in 15 phases of chlorophyll formation, and biosynthetic frailties are deemed to be one of the key causes for low chlorophyll content [13]. Several other reasons may also cause chlorophyll deficiency, such as lacking signal transduction, harmful photo-oxidation, restrained heme feedback and so on [13]. Mainly, the molecular mechanisms underlying chlorophyll biosynthesis are quite complicated [14]. Over the years, researchers have identified quantitative trait loci (QTLs) associated with chlorophyll content in the leaves of various populations of several crops from diverse perceptions. These researches made substantial advancements and established groundwork for upcoming research, endeavoring to explicate the molecular mechanisms that determine the genetic basis for chlorophyll content in plants [15,16,17,18].
The octoploid strawberry (Fragaria × ananassa) is a vital horticultural crop worldwide. The consumption and the economic value of strawberries have been increasing due to its flavor, pleasant aroma, antioxidant characteristics, and other important health advantages [19,20]. The completion of the whole genome sequencing of strawberry implies that research on the strawberries genome has entered into a new era [19,21]. In the past few years, with the rapid development of next generation sequencing (NGS)-based molecular marker technologies, it has become achievable to construct a high density genetic map of strawberries. Recently, different NGS-based sequencing technologies have been used to identify the single nucleotide polymorphism markers (SNPs) and construct a genetic linkage map of strawberries such as Axiom IStraw 35K array, Axiom IStraw 90k array, ddRAD-seq, SALF-seq, DArT and genotyping-by-sequencing [19,22,23,24,25,26]. Among these technologies, the genotyping-by-sequencing (GBS) method is cost effective and is commonly used these days in a broad range of crops for genotyping due to its advantages such as reducing the genome complexity and cost-effectiveness [27,28,29].
Genetic analysis of chlorophyll content has been focused on detection of QTLs at different developmental stages in many crops [1,3,10]. The study of chlorophyll QTLs allows efficient breeding of economically important crops for better light efficiency providing important information for improving the yield potential in the current and future breeding programs [3,16]. Several QTLs for chlorophyll content and their underlying genes has been identified in wheat, rice, soybean, rapeseed, Chinese cabbage, lettuce and Chinese bayberry [1,3,10,16,18,30,31]. However, in strawberry, QTLs have been reported for the traits such as plant architecture, flowering habits, fruit color, fruit firmness, tolerance to freezing injuries and resistance to powdery mildew [19,20,23,24,25,32]. Breeding strawberries for high light efficiency by refining photosynthetic efficiency is economically important. Moreover, chlorophyll content in strawberry leaves have been found exhibiting a correlation to important traits such as disease resistance and high yield [8,33]. Nevertheless, there is no report so far about QTL identification for strawberry leaf chlorophyll content. Therefore, it is important to identify the QTLs associated with chlorophyll content in strawberry leaves.
The leaf chlorophylls were generally assessed by using the extracted-based approaches and can also be evaluated by non-destructive methods [1,2]. Chlorophyll evaluation by extract-based methods usually involved the laborious procedures including gatherings of leaf samples, solvent-based pigment separations, and quantifications of different contents of chlorophylls (largely chlorophyll a and chlorophyll b) by spectrophotometry [2,3,4]. Contrasting from the extraction-based approaches, the soil plant analysis development (SPAD) measuring method by a man-portable SPAD chlorophyll meter is a non-destructive, cheap and fast approach for relative chlorophyll measurements [5]. SPAD values, in several crops such as wheat, soybean, rapeseed, Arabidopsis, tomato and strawberry have been frequently used to assess the chlorophyll content [1,2,3,4,5,7,34,35]. Therefore, we evaluated the strawberry leaf chlorophyll content using a SPAD chlorophyll meter.
In this study, we took the SPAD values as the indicators of the relative strawberry leaf chlorophyll content in two independent strawberry F2 populations. Newly constructed and previously reported [19] linkage maps were used to map the QTLs linked to a chlorophyll content in two strawberry F2 populations. This study thus provides the information about the novel QTLs controlling chlorophyll content and potential candidate genes associated with leaf chlorophyll biosynthesis in strawberry.

2. Materials and Methods

2.1. Plant Materials and Growing Conditions

The BS-F2 population with 186 individuals was developed from a cross between the inbred lines ‘26(8-10)’ derived from ‘Benihoppe’ and ‘105(14-9)’ derived from ‘Sachinoka’ [19]. Another population, BC-F2 with 158 individuals was developed from a cross between the inbred lines ‘26(8-9)’ derived from ‘Benihoppe’ and ‘S27-10’ derived from ‘Chandler’. Both F2 populations were developed and evaluated at the National Institute of Horticultural and Herbal Science, Rural Development Administration, Wanju, Republic of Korea. The plants were grown in commercial growing mix in greenhouse condition. The fertilizer solution (20:20:20 NPK) were applied with electrical conductivity (EC) of 1 mS/cm monthly. The temperature was maintained 10–13 °C to 25–30 °C night/day. The runners were planted in September 2020 and chlorophyll content was evaluated in February 2021. Growing conditions were followed according to the standardized agronomic procedures.

2.2. Measurement of Chlorophyll Content

In this study, a SPAD-502 Chlorophyll Meter (Konica Minolta, Tokyo, Japan) was used to score the SPAD values of strawberry leaves. Three plants from each line and three leaves of each plant were sampled. The leaf veins, edges and diseased leaves were avoided during sampling and scoring. The SPAD values were recorded from the upper top leaf sampling sites of the target strawberry plants. The average value of the three plants represented the chlorophyll content for the corresponding family. Broad-sense heritability (H2bs) was calculated with the formula (suggested previously) H 2 = σ ^ g 2 σ ^ p 2 × 100 , where, σ ^ g 2 is the genetic variance and σ ^ p 2 is the phenotypic variance [36].

2.3. DNA Extraction and Genotyping

Genomic DNA was extracted from tender leaves of the BS-F2 and BC-F2 populations by a CTAB method [37]. BS-F2 population was genotyped by Axiom 35K strawberry chip (Affymetrix, Sanata Clara, CA, USA) [19]. BC-F2 population was genotyped through genotyping-by-sequencing method. Briefly, to construct the GBS libraries, genomic DNA of 158 individuals was digested, using ApeKI enzyme [28,38]. Next, the adapters were ligated to the digested gDNA with different barcodes for each sample. After amplification and quality check, the generated libraries were sequenced using Illumina NextSeq 500 (San Diego, CA, USA). The raw reads were aligned against the ‘Wongyo 3115’ reference genome [19] using the BWA v0.7.17 [28]. To group and sort the aligned read, Picard Tools v1.19 and SAM tools v1.1 were used [28]. The GATK v4.2 was used for SNP calling [28]. SNPs were filtered for minimum genotype quality of Q30 and a minimum five-read depth. SNPs showing polymorphism between the two parental lines and segregated in the BC-F2 population were used to construct bin map and genetic linkage map.

2.4. Genetic Map and QTL Detection

In this study, we used a high-density linkage map of the BS-F2 population, which was reported previously in [19]. The linkage map for the BC-F2 population was constructed as follows. A total of 158 BC-F2 individuals were subjected to GBS. The markers polymorphic between parental lines and the BC-F2 populations were used for genetic map construction. All the markers, except for the markers with a distorted segregation in BC-F2 (for example, A:H:B = 0:0:158 or A:H:B = 158:0:0), were used. The bin map was constructed by a sliding window approach with window size 40 flanking markers except chromosome 3-2, 3-4, 4-4, 7-2, 7-3 with 20 SNP [39]. To assign genetic positions to the bins, arranged bins were mapped with a LOD (logarithm of the odds) threshold of 3.0 and a distance threshold of 30 cM using CarthaGene software [28]. The Kosambi mapping function was used to infer genetic distances between markers in centimorgans (cM). The SPAD values scored for the BS-F2 and BC-F2 populations were used for QTL analysis. QTL analysis was done using composite interval mapping (CIM) of the QTL Cartographer v 2.5 [40]. The standard model (Model 6) with backward stepwise regression was implemented in a walk speed of 1 cM to identify QTLs. The window size was set at 10 cM and the maximum 5 background markers with the highest P-values used as cofactors. An LOD threshold of 2.8 was used to declare the presence of a putative QTL in a given genomic region. QTL regions were estimated by a 90–95% confidence interval of each QTL, and closely linked bins were used to assign the physical position of the QTLs.

2.5. Candidate Gene Analysis

The candidate genes were retrieved based on the physical position and the annotation data of strawberry reference genome ‘Wongyo 3115’ [19]. The positions of linked bin markers within QTLs on the genetic map were compared with their physical positions on the reference genome ‘Wongyo 3115’, and 1-Mb upstream and downstream sequences were mined for genes associated with chlorophyll biosynthesis.

3. Results

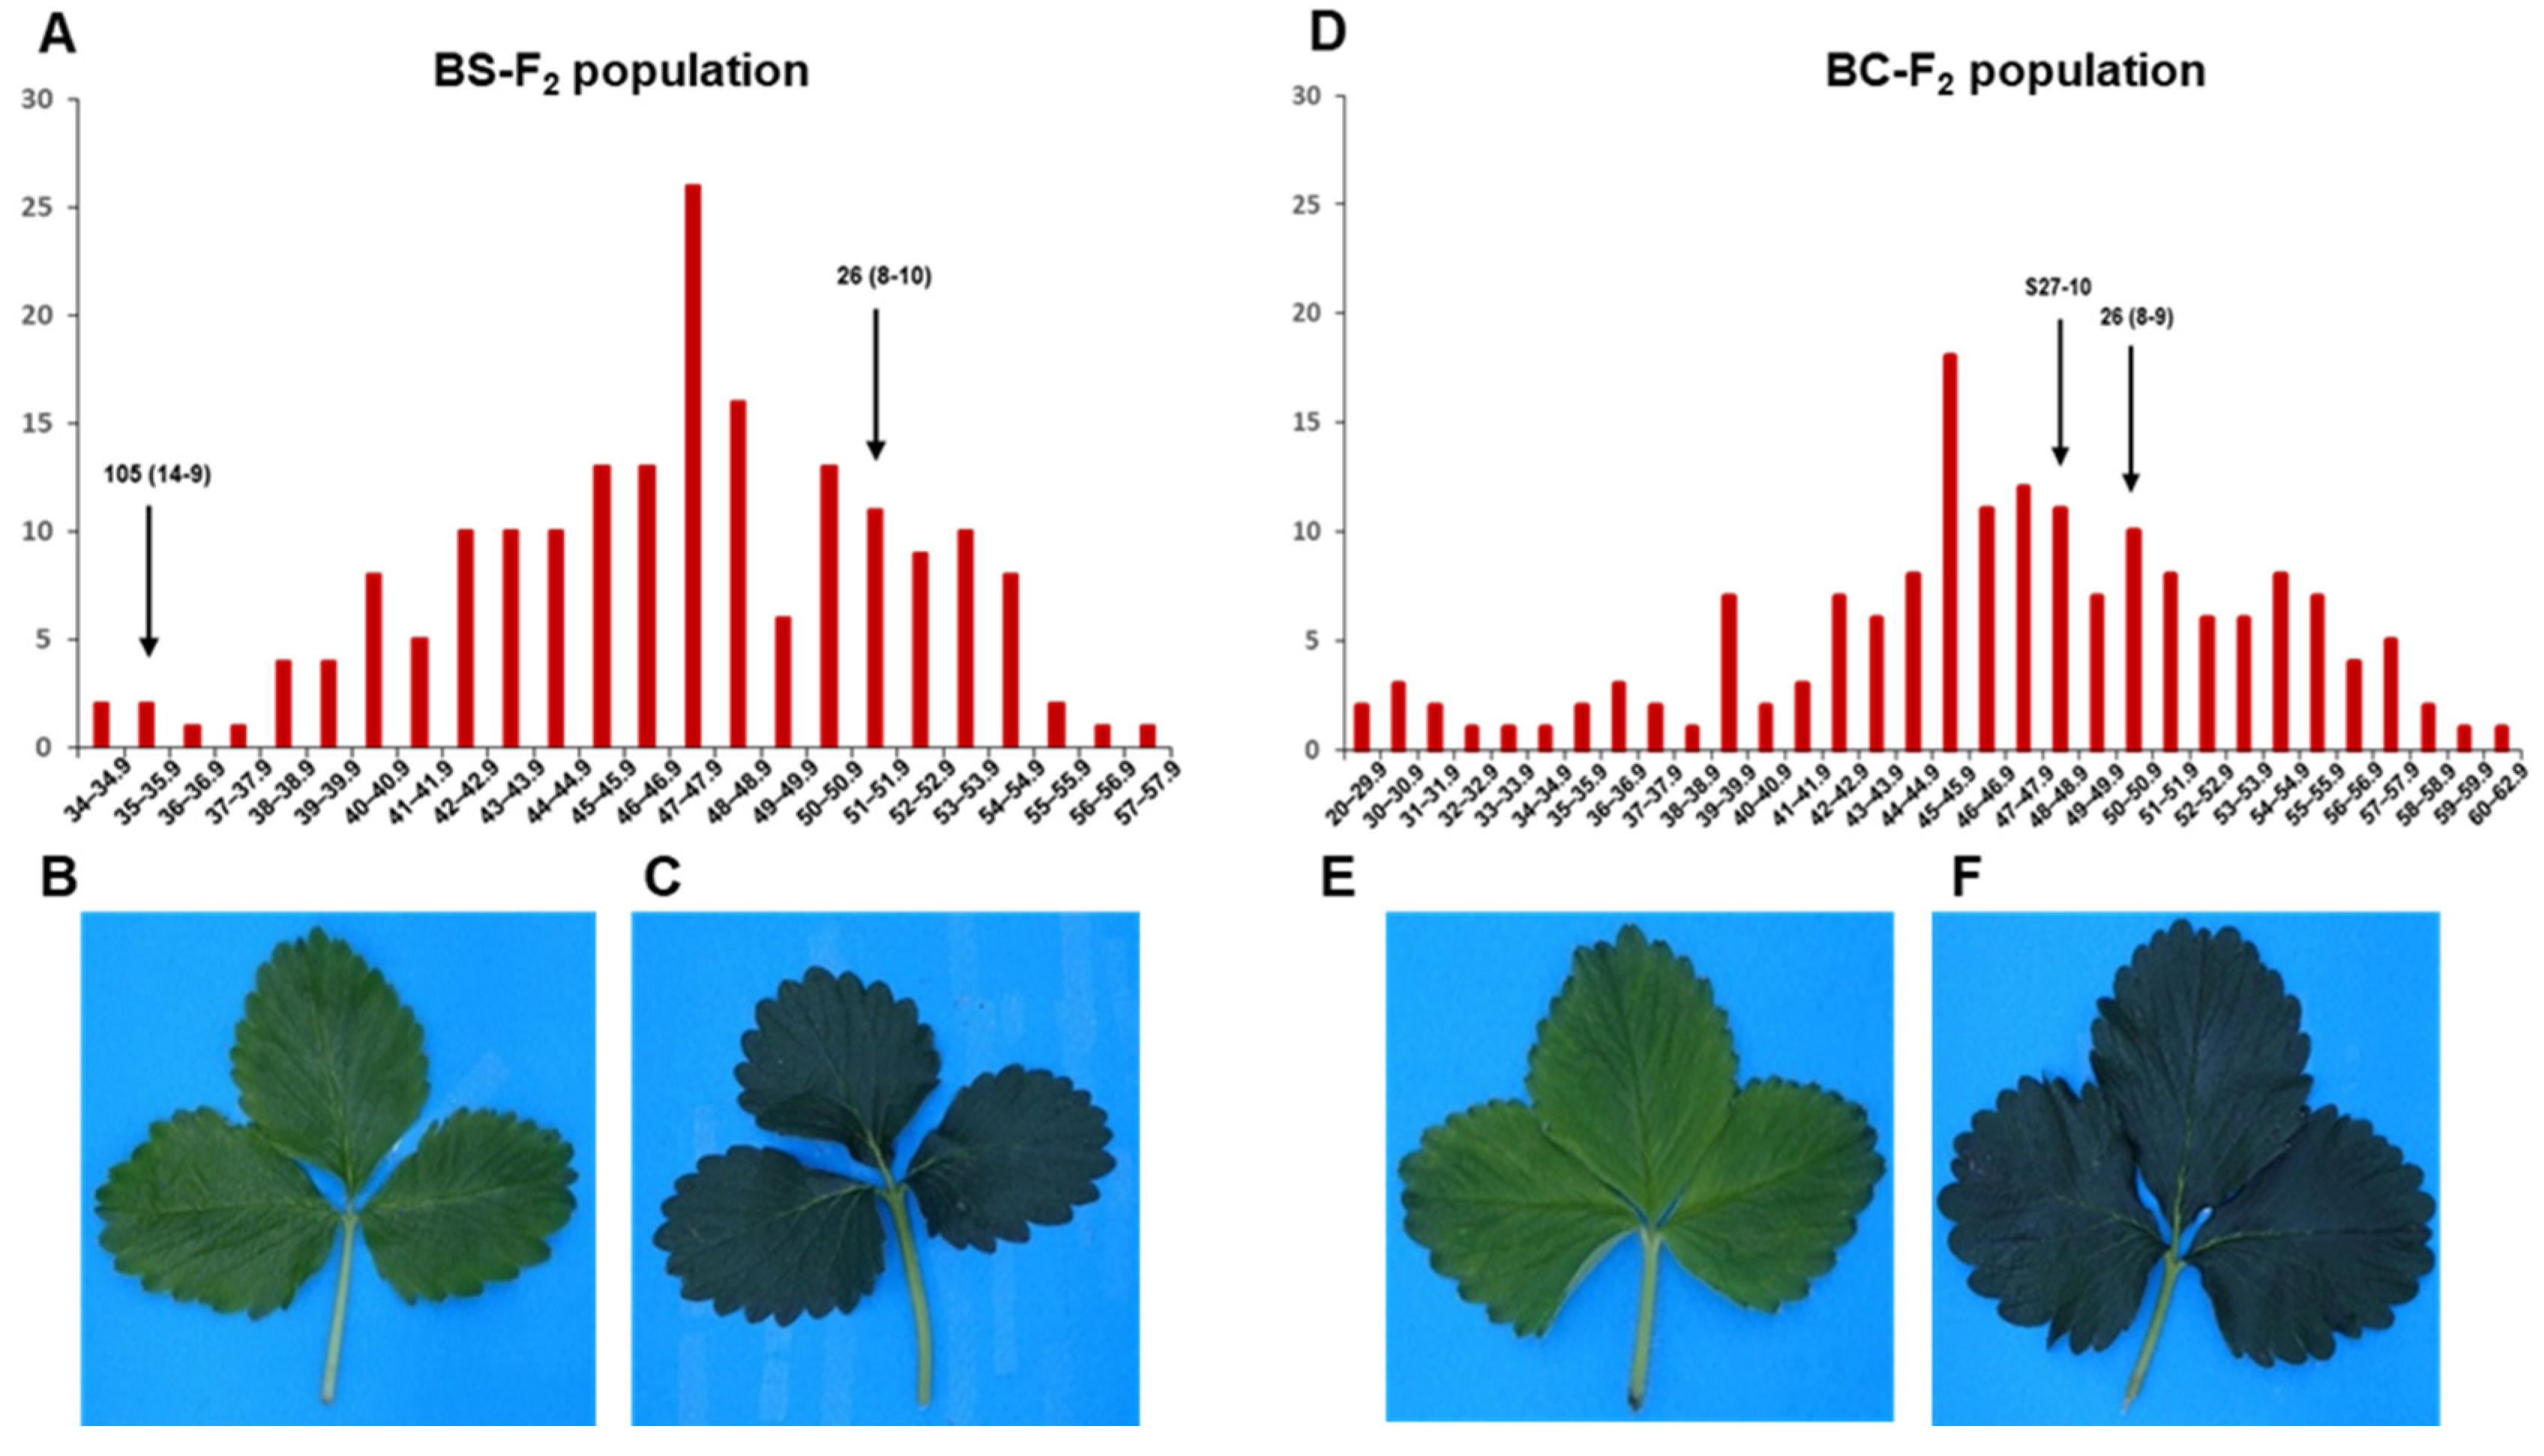
3.1. Phenotypic Analysis of Leaf Chlorophyll Content

The phenotypic variations for the chlorophyll content of BS-F2 and BC-F2 populations are summarized in Figure 1. The fully developed three upper top leaves of the 186 individuals in the BS-F2 and 158 individuals in BC-F2 populations were measured by a SPAD chlorophyll meter (SPAD 502, Konica Minolta, Tokyo, Japan). The parental lines ‘26(8-10)’ and ‘105(14-9)’ differed significantly in chlorophyll content (Figure 1A). The SPAD values of the BS-F2 population ranged from 34 to 57.9 and showed a continuous distribution (Figure 1A–C). On the other hand, the parental lines of BC-F2 population ‘26(8-9)’ and ‘S27-10’ were observed with slight differences in chlorophyll content (Figure 1D). However, the SPAD values of BC-F2 individuals scored from 20 to 62.9 showed a continuous distribution (Figure 1D–F). Broad sense heritability for chlorophyll content was 43.9% in the BS-F2 population and 55.44% in the BC-F2 population under similar growing conditions, showing genetic factors which strongly effect chlorophyll content variation in the mapping population (Table S1). These results showed that the chlorophyll content in BS-F2 and BC-F2 populations were controlled by multiple genes, and that the data fulfilled the demands for QTL analysis.

3.2. Construction of Bins and Linkage Map

The previously reported Axiom 35K strawberry chip-derived SNPs based genetic linkage map was used for the BS-F2 population [19]. To construct the high density genetic linkage map of BC-F2, a population comprising 158 individuals and parental lines were subjected to GBS analysis using AepKI Enzyme (Table 1). Approximately 124.1 Gbp of sequences were obtained from the Illumina NextSeq 500 (Table 1). After trimming, a total of 77.5 million average reads were retained, which mapped against the strawberry reference genome ‘Wongyo 3115’ [19]. A total of 17,416 high quality SNPs were obtained after removing more than 75% of missing data and the SNPs exhibiting distorted segregations (Table 1). These SNPs were used for a bin-based linkage map construction (Table 1). The sliding window approach was used to impute missing data and genotyping errors. Recombination breakpoints were determined by sliding 40 SNPs consecutively as one window except chromosome 3-2, 3-4, 4-4, 7-2, and 7-3 in which 20 SNPs were binned (Table S2). As a result, a high-density bin map consisting of 56 linkage groups encompassing 1,671 bins and covering a total genetic distance of 3,721.3 cM was constructed (Table S1). The average bins density was estimated to be 2 bins per cM (Table S2). The linkage groups LG1-1b, LG3-1b, LG4-4b and LG1-4a were recorded with shortest and longest genetic length, respectively (Table S2).

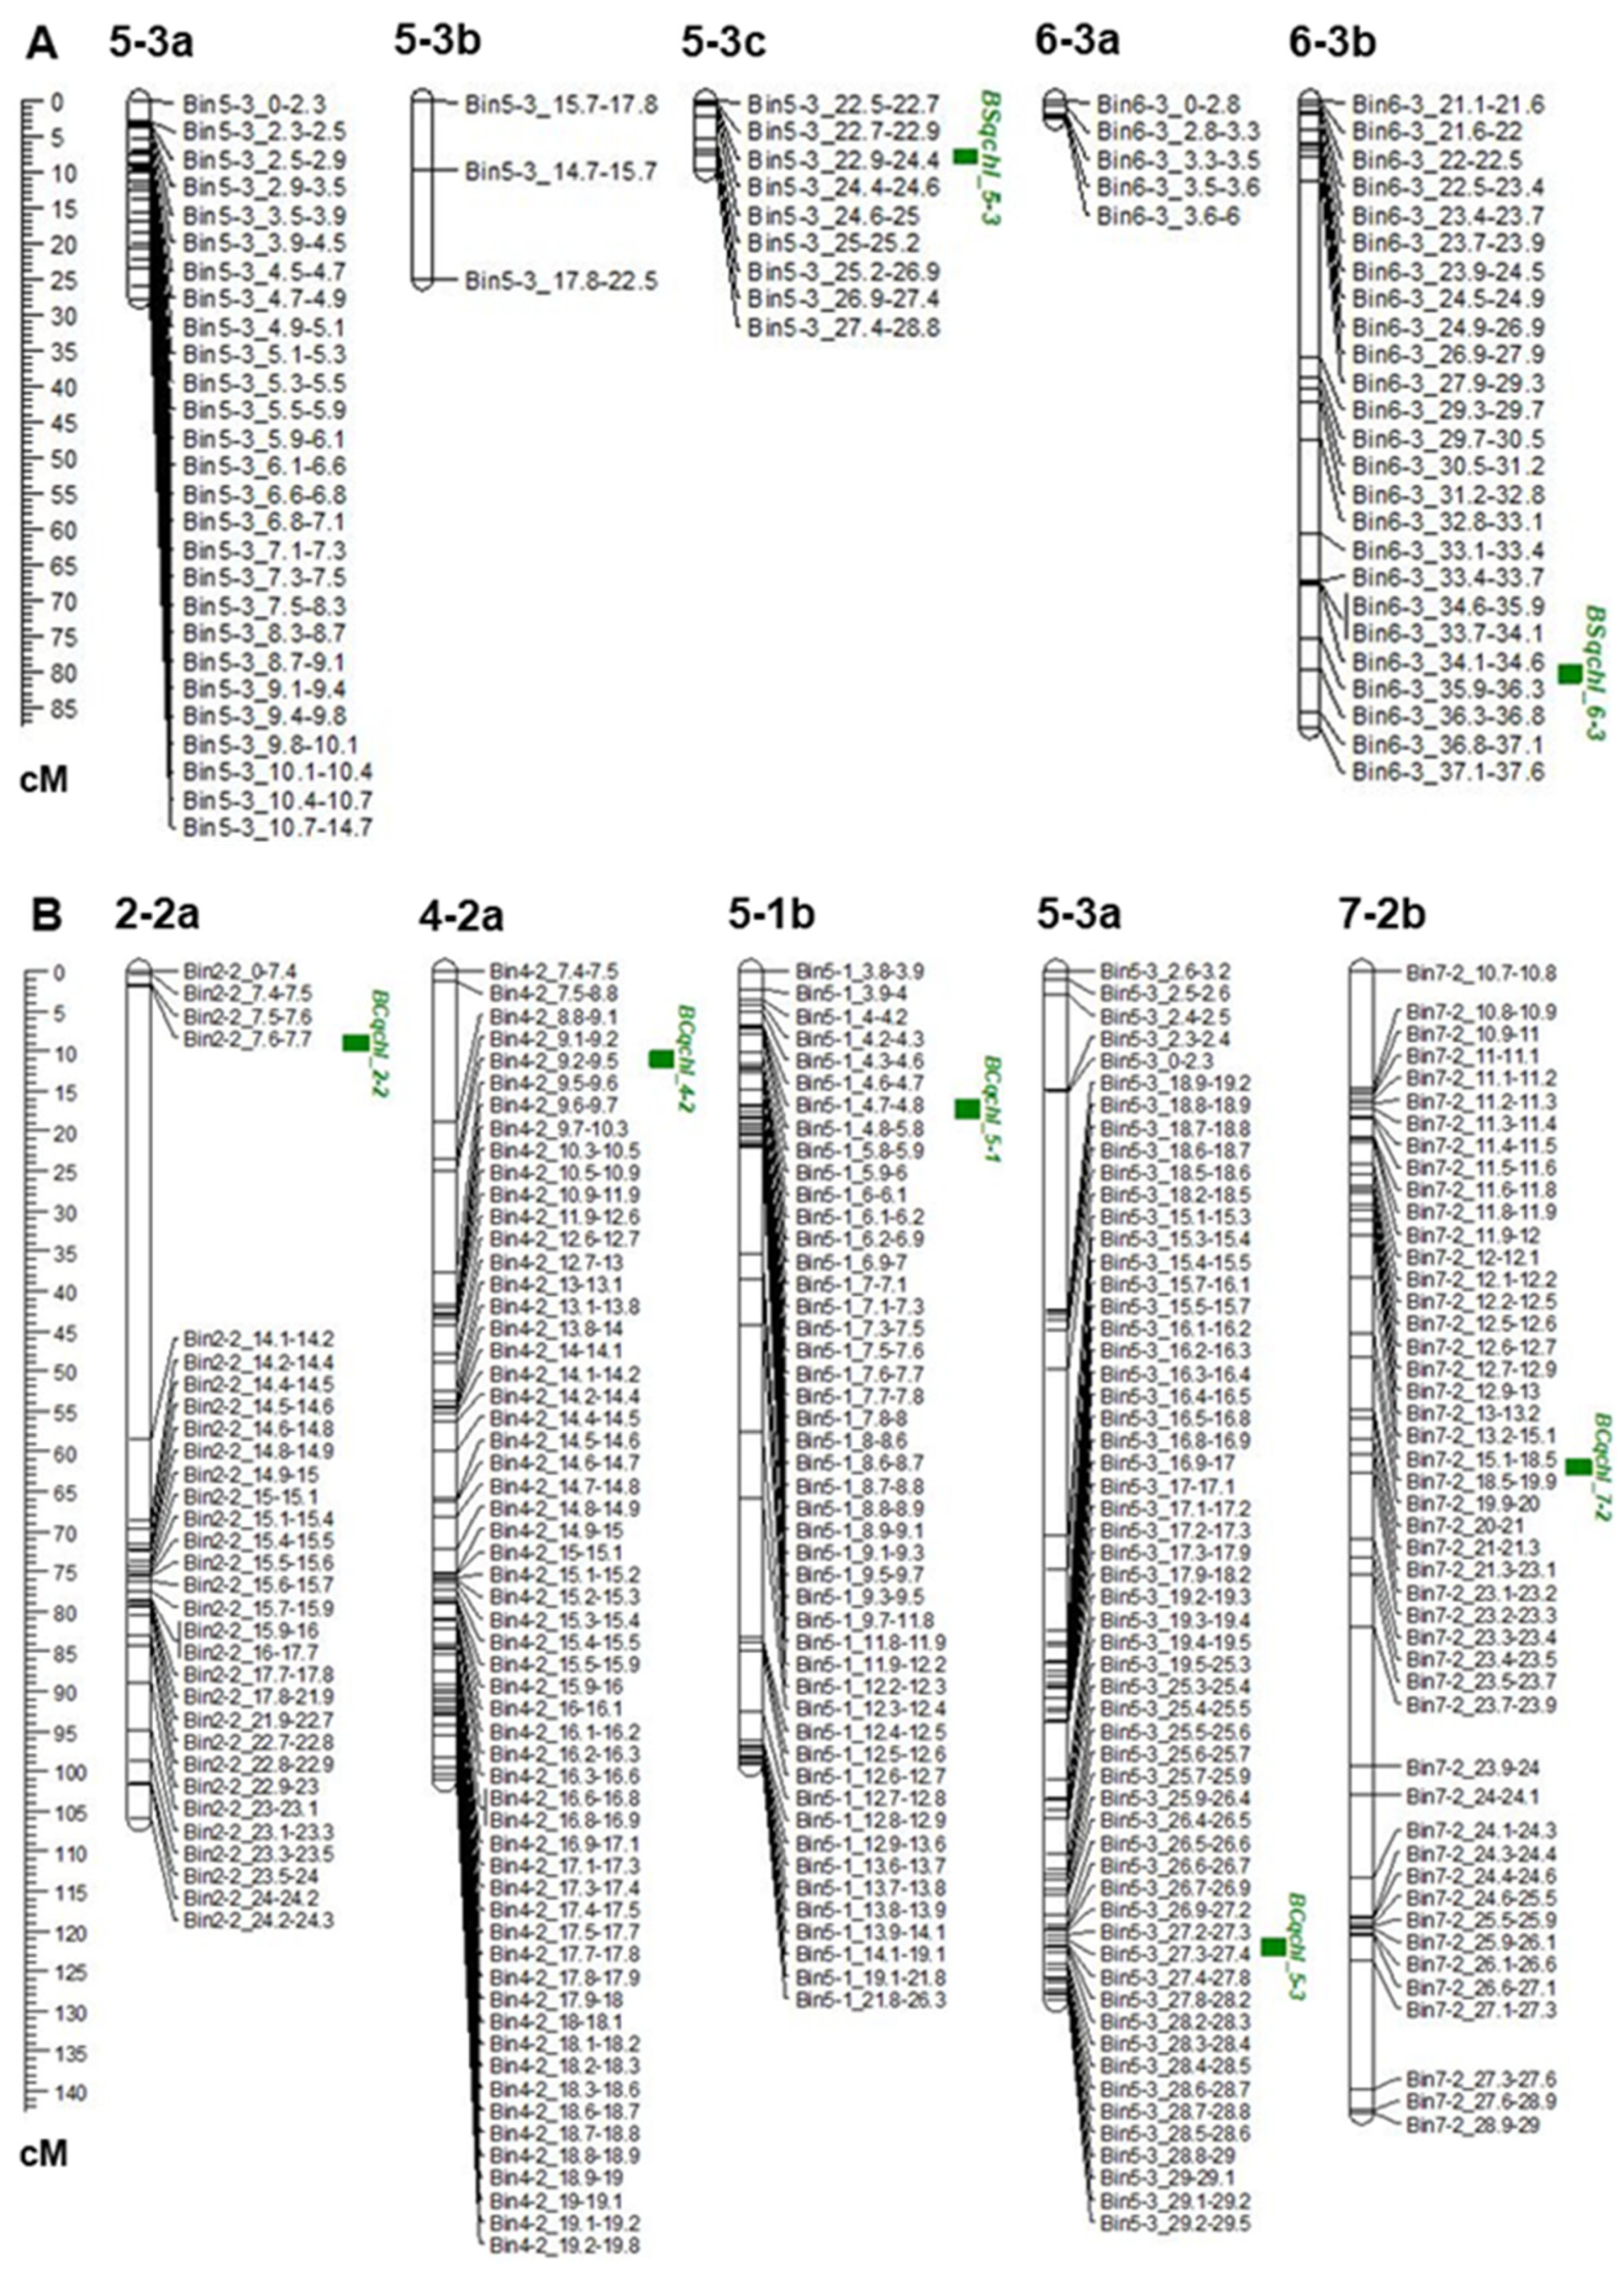
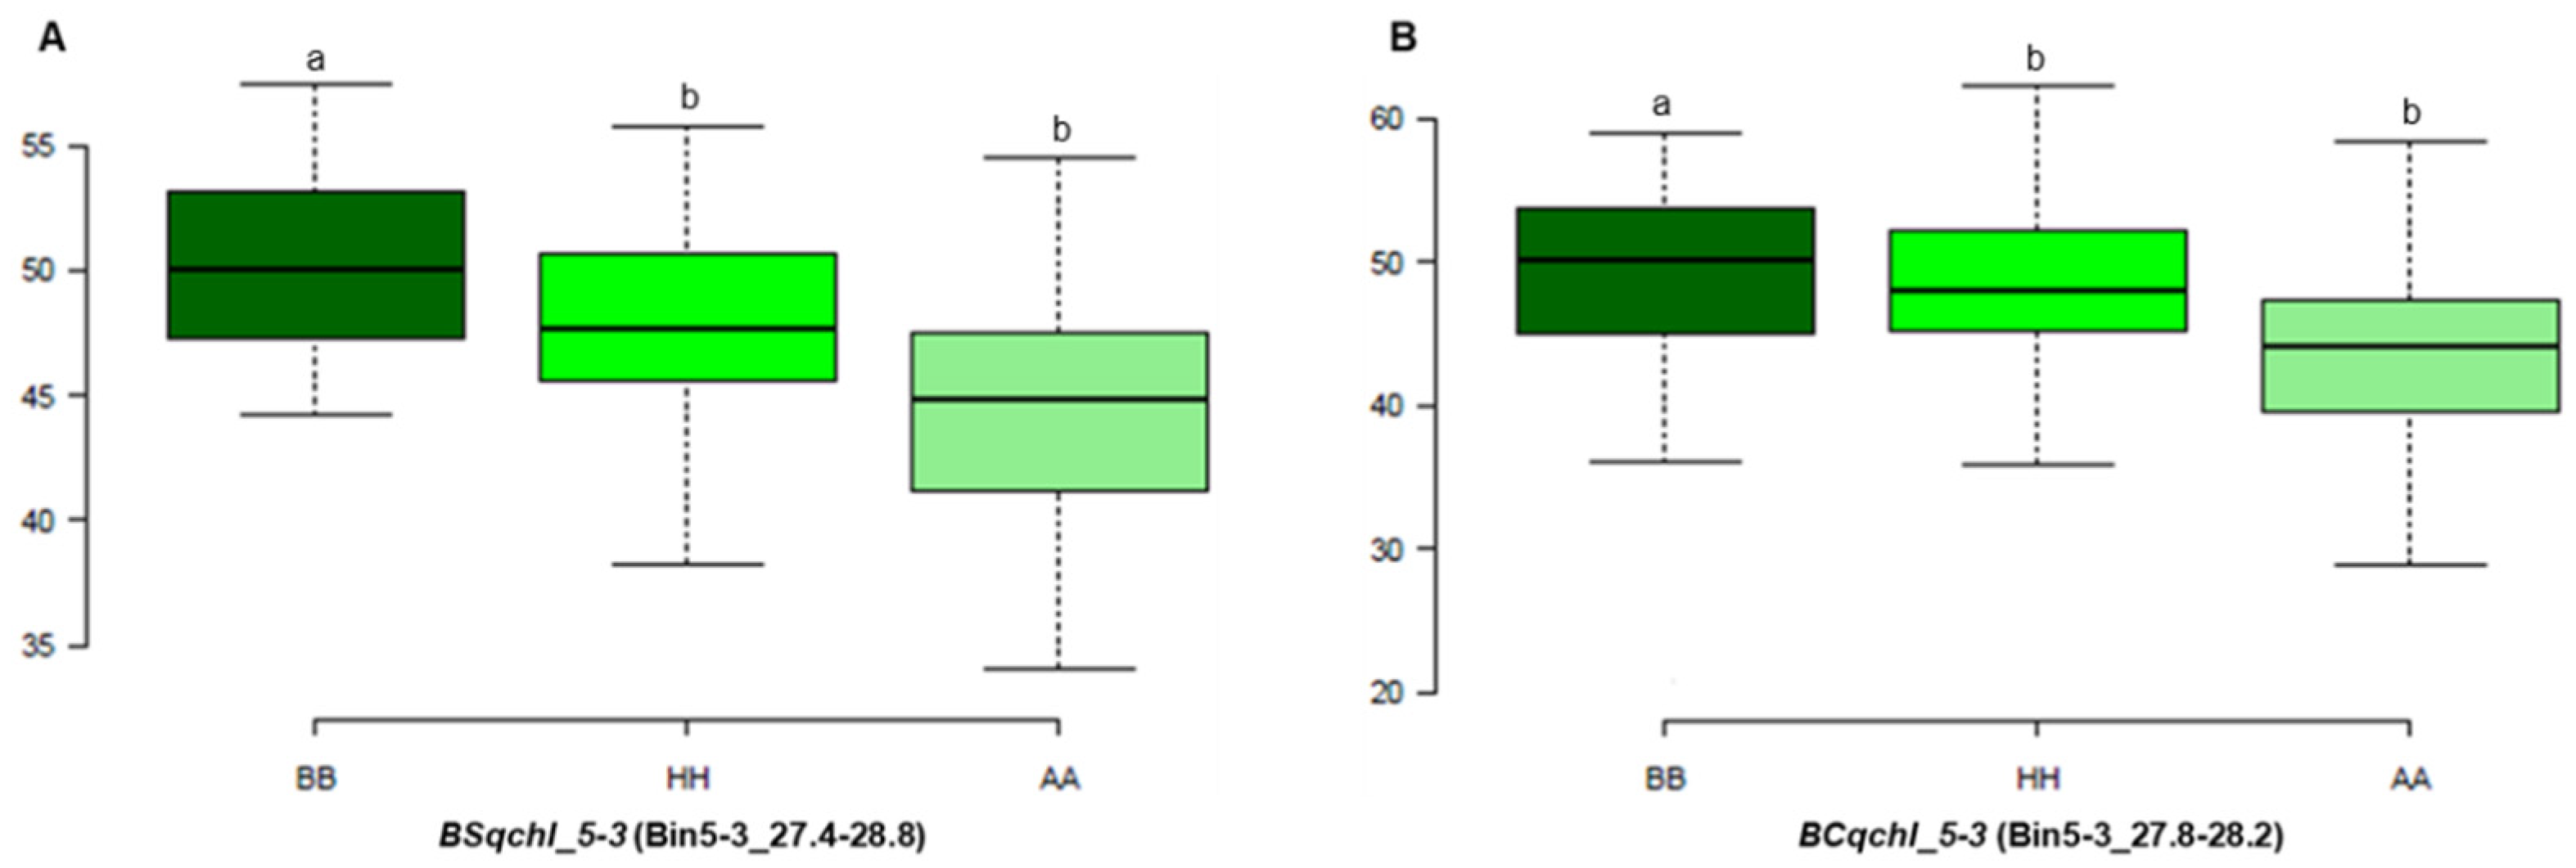
3.3. QTL Analysis and Detection

The QTL analysis was carried out for the chlorophyll content using two independent F2 segregating populations and high density linkage maps with SPAD values. In total, 7 QTLs, including those with major and minor effects, those specific to populations and those commonly detected across the strawberry genome explaining phenotypic variation (R2) ranging from 1.4 to 26.4% (Table 2). The chlorophyll content QTLs were detected on strawberry chromosomes 2-2, 4-2, 5-1, 5-3, 6-3 and 7-2 (Table 2). In BS-F2 population, one major QTL BSqchl_5-3 was detected on chromosome 5-3 at 7.01 cM corresponding to the 26.5–28 Mb on strawberry reference genome ‘Wongyo 3115’ (Table 2 and Figure 2A). The BSqchl_5-3 explained 17.3% (LOD of 8.1) phenotypic variation (R2) (Figure S1). One minor QTL BSqchl_6-3 was detected on chromosome 6-3 at 79.61 cM corresponding to the 36.3–37.1 Mb. The BSqchl_6-3 explained 5.9% (LOD of 8.1) phenotypic variation (R2) (Figure S1, Table 2 and Figure 2A). In the BC-F2 population, one major QTL BCqchl_4-2 was detected on 4-2 at 10.31 cM corresponding to the 8–9 Mb and explained 26.8% (LOD of 2.9) phenotypic variation (Figure S1, Table 2 and Figure 2B). The four minor QTLs, BCqchl_2-2, BCqchl_5-1, BCqchl_5-3 and BCqchl_7-2 detected on chromosomes 2-2, 5-1, 5-3, 7-2 at 9.91, 17.61, 122.01 and 61.41 cM, corresponding to the 8–14, 7–8, 27–28 and 23–24 Mb, respectively (Table 2 and Figure 2B). The QTLs BCqchl_2-2, BCqchl_5-1, BCqchl_5-3 and BCqchl_7-2 explained 6.3% (LOD of 3.4), 4.1% (LOD of 3.0), 1.4% (LOD of 3.4) and 5.4% (LOD of 2.9) phenotypic variation (Figure S1, Table 2 and Figure 2B). Interestingly, the QTLs BSqchl_5-3 and BCqchl_5-3 were commonly detected in both (BS-F2 and BC-F2) populations at similar genomic positions (Table 2 and Figure 2B). The tightly linked bin markers (Bin5-3_27.4–28.8 and Bin5-3_27.8–28.2) of QTL segments BSqchl_5-3 and BCqchl_5-3 were used to compare the chlorophyll levels of the BS-F2 and BC-F2 populations, respectively (Figure 3). As shown in the box plots, the homozygous genotypes BB are associated with enhanced chlorophyll levels compared to the homozygous genotypes AA in both BS-F2 and BC-F2 populations (Figure 3). These results indicate that commonly detected QTLs BSqchl_5-3 and BCqchl_5-3 are associated with chlorophyll content in strawberry leaves.

3.4. Candidate Gene Analysis

The commonly detected QTLs BSqchl_5-3 and BCqchl_5-3 on strawberry chromosome 5 used to predict candidate genes using ‘Wongyo 3115’ as a reference genome. A total of 263 genes were predicted in QTL region (Table S3). Among them, the function of 12 genes was found to be strongly related to chlorophyll biosynthesis (Table 3). These genes include mainly encoding glutamate-tRNA ligase, Aminotransferase ALD1, Pentatricopeptide repeat, chaperone protein dnaJ, Calvin cycle protein CP12-2, Phospholipase A1 PLIP2, Senescence-associated protein, Peroxiredoxin, heat shock protein and WAT1-related protein (Table 3). These genes could be potential candidate genes associated with strawberry leaf chlorophyll content. However, further studies would confirm their role in chlorophyll biosynthesis in strawberry leaves.

4. Discussion

Chlorophyll is the main pigment in plants for engrossing, transmitting and converting light energy within a certain range to perform biological functions. Leaf chlorophyll content is an essential quantitative feature that positively associates with the photosynthesis rate [1]. The chlorophyll content of plant leaves can be exploited to measure the physiological reactions resulting from abiotic and biotic stress conditions. Many studies revealed that chlorophyll content has been reported to be associated with yield, disease resistance, herbicide tolerance, salt tolerance and senescence-related traits in crops [1,8,9,10,11]. Additionally, there are several reports on heredity and genetic mapping, particularly at the molecular level in soybean, rice, wheat and rapeseed [1]. However, there is no report on the heredity and genetic mapping of leaf chlorophyll content in strawberry leaves. In the present study, we mapped the quantitative trait loci (QTLs) linked to strawberry leaf chlorophyll content in two F2 populations using Axiom 35K strawberry chip and (GBS)-derived (SNPs)-based linkage maps.
Chlorophyll content is generally influenced by numerous environmental aspects, for instance, photoperiod, nitrogen application, temperature, amount of irrigation, and degree of plant maturity [18,41,42,43,44,45]. Chlorophyll content increased with cumulative temperature. Researchers assessed the effect of wheat cultivars on the association between chlorophyll content and nitrogen status in the leaf, which revealed a very close relationship between chlorophyll and nitrogen content in the flag leaf [41]. This association has also been confirmed in paddy rice, grasses, soybean, and chili pepper [18,46,47,48,49]. Fluctuations in photoperiods have been shown to cause alterations in chlorophyll content in plants [50,51]. To assess the chlorophyll content in a non-destructive way, (SPAD) chlorophyll meter non-destructively evaluates light transference of the plant leaf in the red and infrared wavelengths at 650 and 940 nm, resulting in a numerical output that specifies leaf greenness and chlorophyll concentration [1]. The SPAD chlorophyll meter has also been used in strawberry to assess chlorophyll content [34]. In the present study, we homogenized the growth conditions for both strawberry F2 populations in term of nitrogen application, temperature and photoperiods and evaluated the chlorophyll content via SPAD values. However, we obtained different lowest and highest average SPAD values ((34–57.9 for BS-F2) and (20–62.9 for BC-F2)), which might be due to the different parental genotypes. We observed low broad sense heritability (H2) values in both F2 populations ((43.9% for BS-F2) and (55.44% for BC-F2)), indicating the environmental factors are influencing this trait. These results are in accordance with a recent report in lettuce where the researchers reported similar (H2) values for chlorophyll content in an F2 population [52].
High density linkage maps are prerequisite to identify the complex traits in plants such as chlorophyll content [1,3,53]. The emergence of high-throughput sequencing technology offers innovative methods for the development of genetic markers. Advanced molecular marker technologies endorse the rapid development of a genetic map, and facilitate the genetic mapping of complex traits [1,3,19,53]. In this study we constructed a GBS-derived SNP-based genetic linkage map for the BC-F2 population while a previously reported Axiom 35K strawberry chip-based SNP map [19] was used for BS-F2 population. To overcome the missing data problem during GBS, we leveraged sliding window approach [27,28]. The genetic length of the GBS-SNP-based map of the BC-F2 (3721.3 cM) and Axiom 35K strawberry chip-based SNP map of BS-F2 (3861 cM) was comparable. Our results are also in agreement of previously reported NGS-based genetic maps of strawberry [19,22,23,24,25,26].
Chlorophyll content is a quantitative characteristic that is primarily controlled by nuclear genes [1,3]. In the present study the frequency distribution for the chlorophyll content of both F2 populations (BS-F2 and BC-F2) showed continuous distribution attributing that chlorophyll content in strawberry leaves also governed by multiple genes. In recent years, research into the identification of QTLs controlling leaf chlorophyll content has been done in different populations of several crops; for example, wheat [10,11,12,15], rice [16,17], soybean [3], cabbage [18], rapeseed [1] and cucumber [54]. However, in strawberry, genetic analysis and QTL mapping for the leaf chlorophyll content has not been reported so far. In the present study, we detected a total of seven QTLs linked to strawberry leaf chlorophyll trait in two F2 populations, including major and minor effect QTLs. The two QTLs BSqchl_5-3 and BCqchl_5-3 were commonly detected in both (BS-F2 and BC-F2) populations at similar genomic positions. However, the QTL BCqchl_5-3 explained the fewer phenotypic variation R2 (%) compared to the BSqchl_5-3. This variation might be due to the different genetic linkage map or different parental genotypes. However, the chlorophyll content was significantly higher in the individuals with homozygous alleles of BCqchl_5-3, showing that both QTLs are independently involved in high chlorophyll content in both populations. These results indicated that the commonly detected QTLs can be further exploited for the molecular marker development in strawberry linked to high chlorophyll content.
Chlorophyll biosynthesis is a complex process, which involves several genes [1,2,3]. Chlorophyll is produced through the magnesium (Mg) branch of tetrapyrrole biosynthesis (TBS), which also synthesis three other crucial finish-products in plants including phytochromobilin, heme and, siroheme [13,55]. Glutamyl-tRNA reductase (GluTR) is the enzyme which functions rate-limiting in TBS, and along with glutamate 1-semialdehyde aminotransferase (GSAAT) it catalyzes the synthesis of 5-aminolevulinic acid (ALA) [13,55]. In the present study we predicted three GluTR-related genes in the genomic region of commonly detected QTLs which might be the candidate genes controlling chlorophyll content in strawberry leaves. WAT1 genes have been identified in transcriptomic study for the identification of major nitrogen stress responsive genes in Australian bread wheat cultivars [56]. Nitrogen absorption has a direct correlation with the chlorophyll content in leaves [7,56]. In the present study, a WAT1 gene was also listed in potential candidate genes. The ALD1 gene family has been reported to have a role in plant development, leaf chlorosis and basal defense against Pseudomonas syringae [57]. In the present study, an ALD1 gene was also predicted in the candidate gene. The roles of pentatricopeptide repeat (PPR) proteins are essential in plant organelles. A chloroplast-localized PPR protein (At3g59040) was characterized in Arabidopsis, which is classified as the 287th PPR protein [58]. The photosynthetic activity and chlorophyll content of ppr287 mutants were markedly reduced, and the chloroplast structures of the mutants were abnormal [58]. In this study, PPR coding gene was also predicted among the candidate genes. Among other candidate genes, Chaperone protein dnaJ, Calvin cycle protein CP12-2, Phospholipase A1 PLIP2, Senescence-associated protein, Peroxiredoxin, Heat shock protein 90-5-encoding genes were predicted, which have been reported to be involved in chlorophyll biosynthesis directly and indirectly [55,59,60,61,62]. However, further studies, including fine mapping of the loci, expression analysis, gene knock-out and gene cloning, are required to determine the strong candidate gene.

5. Conclusions

This study provides information regarding the genetic mapping of loci controlling chlorophyll content in strawberry leaves. We mapped a total of seven QTLs across the strawberry genome in two independent F2 populations using SNP-based high-density linkage maps. The detected QTLs explained 26.4% of phenotypic variation (R2) in segregating F2 populations. We also predicted the potential candidate genes in commonly detected QTL regions which may possibly be associated with chlorophyll biosynthesis in strawberry leaves. The detected QTLs and predicted candidate genes may directly or indirectly influence the strawberry leaf chlorophyll content and accelerate future strawberry marker-assisted breeding.

Supplementary Materials

The following are available online at https://www.mdpi.com/article/10.3390/agriculture11111163/s1, Figure S1: An original graph of WinQTL cartographer showing the locations and LOD score of QTLs for chlorophyll content for BS-F2 and BC-F2 population. Table S1: Genetic variation among BS-F2 and BC-F2 populations evaluated for the chlorophyll content via SPAD meter. Table S2: Summary of the bins and genetic linkage map for the BC-F2 population. Table S3: Candidate genes associated with chlorophyll content in commonly detected QTLs and their functions.

Author Contributions

Conceptualization, M.I.S., K.H. and D.-S.K.; methodology, M.I.S., K.H., S.Y.L. and J.L.; software, M.I.S. and K.H.; validation, M.I.S., H.-E.L. and Y.-R.L.; formal analysis, M.I.S. and K.H.; investigation, M.I.S., K.H., E.S.L. and J.L.; resources, D.-S.K.; data curation, M.I.S. and K.H.; writing—original draft preparation, M.I.S., K.H. and D.-S.K.; writing—review and editing, M.I.S., K.H. and D.-S.K.; visualization, M.I.S. and K.H.; supervision, D.-S.K. and H.-E.L.; project administration, D.-S.K.; funding acquisition, D.-S.K. All authors have read and agreed to the published version of the manuscript.

Funding

This study was supported by the National Institute of Horticultural and Herbal Science, Rural Development Administration, Republic of Korea (Project No: PJ01416902). M.I.S. and Y.R.L was supported by 2021 the RDA Fellowship Program of the National Institute of Horticultural and Herbal Science, Rural Development Administration, Republic of Korea.

Institutional Review Board Statement

Not Applicable.

Informed Consent Statement

Not Applicable.

Conflicts of Interest

The authors declare no conflict of interest.

References

  1. Ye, J.; Liu, H.; Zhao, Z.; Xu, L.; Li, K.; Du, D. Fine mapping of the QTL cqSPDA2 for chlorophyll content in Brassica napus L. BMC Plant Biol. 2020, 20, 1–9. [Google Scholar] [CrossRef]
  2. Raines, C.A. Increasing photosynthetic carbon assimilation in C3 plants to improve crop yield: Current and future strategies. Plant Physiol. 2011, 155, 36–42. [Google Scholar] [CrossRef] [PubMed] [Green Version]
  3. Wang, L.; Conteh, B.; Fang, L.; Xia, Q.; Nian, H. QTL mapping for soybean (Glycine max L.) leaf chlorophyll-content traits in a genotyped RIL population by using RAD-seq based high-density linkage map. BMC Genom. 2020, 21, 1–18. [Google Scholar] [CrossRef] [PubMed]
  4. Carter, G.A.; Knapp, A.K. Leaf optical properties in higher plants: Linking spectral characteristics to stress and chlorophyll concentration. Am. J. Bot. 2001, 88, 677–684. [Google Scholar] [CrossRef] [PubMed] [Green Version]
  5. Von Korff, M.; Grando, S.; Del Greco, A.; This, D.; Baum, M.; Ceccarelli, S. Quantitative trait loci associated with adaptation to Mediterranean dryland conditions in barley. Theor. Appl. Genet. 2008, 117, 653–669. [Google Scholar] [CrossRef] [PubMed]
  6. Mae, T. Physiological nitrogen efficiency in rice: Nitrogen utilization, photosynthesis, and yield potential. Plant Soil 1997, 196, 201–210. [Google Scholar] [CrossRef]
  7. Fiorentini, M.; Zenobi, S.; Giorgini, E.; Basili, D.; Conti, C.; Pro, C.; Monaci, E.; Orsini, R. Nitrogen and chlorophyll status determination in durum wheat as influenced by fertilization and soil management: Preliminary results. PLoS ONE 2019, 14, 1–16. [Google Scholar] [CrossRef]
  8. Meng, L.; Höfte, M.; Van Labeke, M.C. Leaf age and light quality influence the basal resistance against Botrytis cinerea in strawberry leaves. Environ. Exp. Bot. 2019, 157, 35–45. [Google Scholar] [CrossRef]
  9. Xu, L.; Liu, H.; Kilian, A.; Bhoite, R.; Liu, G.; Si, P.; Wang, J.; Zhou, W.; Yan, G. QTL Mapping Using a High-Density Genetic Map to Identify Candidate Genes Associated with Metribuzin Tolerance in Hexaploid Wheat (Triticum aestivum L.). Front. Plant Sci. 2020, 11, 1–11. [Google Scholar] [CrossRef]
  10. Yang, D.; Li, M.; Liu, Y.; Chang, L.; Cheng, H.; Chen, J.; Chai, S. Identification of quantitative trait loci and water environmental interactions for developmental behaviors of leaf greenness in wheat. Front. Plant Sci. 2016, 7, 1–16. [Google Scholar] [CrossRef] [PubMed] [Green Version]
  11. Sun, X.L.; Yu, Q.Y.; Tang, L.L.; Ji, W.; Bai, X.; Cai, H.; Liu, X.F.; Ding, X.D.; Zhu, Y.M. GsSRK, a G-type lectin S-receptor-like serine/threonine protein kinase, is a positive regulator of plant tolerance to salt stress. J. Plant Physiol. 2013, 170, 505–515. [Google Scholar] [CrossRef] [PubMed]
  12. Huang, L.; Dai, L.; Wang, L.; Leng, Y.; Yang, Y.; Xu, J.; Hu, J.; Rao, Y.; Zhang, G.; Zhu, L.; et al. Genetic Dissection for Chlorophyll Content of the Top Three Leaves During Grain Filling in Rice (Oryza sativa L.). J. Plant Growth Regul. 2015, 34, 381–391. [Google Scholar] [CrossRef]
  13. Beale, S.I. Green genes gleaned. Trends Plant Sci. 2005, 10, 309–312. [Google Scholar] [CrossRef] [PubMed]
  14. Wang, Y.; He, Y.; Yang, M.; He, J.; Xu, P.; Shao, M.; Chu, P.; Guan, R. Fine mapping of a dominant gene conferring chlorophyll-deficiency in Brassica napus. Sci. Rep. 2016, 6, 1–10. [Google Scholar] [CrossRef] [PubMed] [Green Version]
  15. Kumar, S.; Sehgal, S.K.; Kumar, U.; Prasad, P.V.V.; Joshi, A.K.; Gill, B.S. Genomic characterization of drought tolerance-related traits in spring wheat. Euphytica 2012, 186, 265–276. [Google Scholar] [CrossRef]
  16. Takai, T.; Kondo, M.; Yano, M.; Yamamoto, T. A quantitative trait locus for chlorophyll content and its association with leaf photosynthesis in rice. Rice 2010, 3, 172–180. [Google Scholar] [CrossRef] [Green Version]
  17. Ye, W.; Hu, S.; Wu, L.; Ge, C.; Cui, Y.; Chen, P.; Xu, J.; Dong, G.; Guo, L.; Qian, Q. Fine mapping a major QTL qFCC7L for chlorophyll content in rice (Oryza sativa L.) cv. PA64s. Plant Growth Regul. 2017, 81, 81–90. [Google Scholar] [CrossRef] [Green Version]
  18. Ge, Y.; Wang, T.; Wang, N.; Wang, Z.; Liang, C.; Ramchiary, N.; Choi, S.R.; Lim, Y.P.; Piao, Z.Y. Genetic mapping and localization of quantitative trait loci for chlorophyll content in Chinese cabbage (Brassica rapa ssp. pekinensis). Sci. Hortic. 2012, 147, 42–48. [Google Scholar] [CrossRef]
  19. Lee, H.E.; Manivannan, A.; Lee, S.Y.; Han, K.; Yeum, J.G.; Jo, J.; Kim, J.; Rho, I.R.; Lee, Y.R.; Lee, E.S.; et al. Chromosome level assembly of homozygous inbred line ‘Wongyo 3115’ facilitates the construction of a high-density linkage map and identification of QTLs associated with fruit firmness in octoploid strawberry (Fragaria × ananassa). Front. Plant Sci. 2021, 12, 1–16. [Google Scholar] [CrossRef]
  20. Alarfaj, R.; El-Soda, M.; Antanaviciute, L.; Vickerstaff, R.; Hand, P.; Harrison, R.J.; Wagstaff, C. Mapping QTL underlying fruit quality traits in an F1 strawberry population. J. Hortic. Sci. Biotechnol. 2021, 96, 634–645. [Google Scholar] [CrossRef]
  21. Edger, P.P.; Poorten, T.J.; VanBuren, R.; Hardigan, M.A.; Colle, M.; McKain, M.R.; Smith, R.D.; Teresi, S.J.; Nelson, A.D.L.; Wai, C.M.; et al. Origin and evolution of the octoploid strawberry genome. Nat. Genet. 2019, 51, 541–547. [Google Scholar] [CrossRef] [PubMed] [Green Version]
  22. Vining, K.J.; Salinas, N.; Tennessen, J.A.; Zurn, J.D.; Sargent, D.J.; Hancock, J.; Bassil, N.V. Genotyping-by-sequencing enables linkage mapping in three octoploid cultivated strawberry families. Peer J. 2017, 1–19. [Google Scholar] [CrossRef] [Green Version]
  23. Verma, S.; Zurn, J.D.; Salinas, N.; Mathey, M.M.; Denoyes, B.; Hancock, J.F.; Finn, C.E.; Bassil, N.V.; Whitaker, V.M. Clarifying sub-genomic positions of QTLs for flowering habit and fruit quality in U.S. strawberry (Fragaria × ananassa) breeding populations using pedigree-based QTL analysis. Hortic. Res. 2017, 4, 1–9. [Google Scholar] [CrossRef] [PubMed] [Green Version]
  24. Sargent, D.J.; Buti, M.; Šurbanovski, N.; Brurberg, M.B.; Alsheikh, M.; Kent, M.P.; Davik, J. Identification of QTLs for powdery mildew (Podosphaera aphanis; syn. Sphaerotheca macularis f. sp. fragariae) susceptibility in cultivated strawberry (Fragaria × ananassa). PLoS ONE 2019, 14, 1–17. [Google Scholar] [CrossRef]
  25. Hossain, M.R.; Natarajan, S.; Kim, H.T.; Jesse, D.M.I.; Lee, C.G.; Park, J.I.; Nou, I.S. High density linkage map construction and QTL mapping for runner production in allo-octoploid strawberry Fragaria × ananassa based on ddRAD-seq derived SNPs. Sci. Rep. 2019, 9, 1–11. [Google Scholar] [CrossRef]
  26. Dong, H.; Yang, L.; Li, L.; Zhang, J.; Fan, J.; Song, S.; Yang, L.; Li, H. High Density Genetic Map of Cultivated Strawberry by SLAF-seq. Acta Agric. Boreali-Sin. 2020, 35, 52–57. [Google Scholar] [CrossRef]
  27. Siddique, M.I.; Lee, H.-Y.; Ro, N.-Y.; Han, K.; Venkatesh, J.; Solomon, A.M.; Patil, A.S.; Changkwian, A.; Kwon, J.-K.; Kang, B.-C. Identifying candidate genes for Phytophthora capsici resistance in pepper (Capsicum annuum) via genotyping-by-sequencing-based QTL mapping and genome-wide association study. Sci. Rep. 2019, 9, 1–15. [Google Scholar] [CrossRef] [PubMed]
  28. Han, K.; Lee, H.Y.; Ro, N.Y.; Hur, O.S.; Lee, J.H.; Kwon, J.K.; Kang, B.C. QTL mapping and GWAS reveal candidate genes controlling capsaicinoid content in Capsicum. Plant Biotechnol. J. 2018, 16, 1546–1558. [Google Scholar] [CrossRef] [PubMed] [Green Version]
  29. Solomon, A.M.; Kim, T.G.; Han, K.; Lee, H.Y.; Patil, A.; Siddique, M.I.; Ahn, J.; Kang, B.C. Fine Mapping and Candidate Gene Identification for the CapUp Locus Controlling Fruit Orientation in Pepper (Capsicum spp.). Front. Plant Sci. 2021, 12, 1–12. [Google Scholar] [CrossRef] [PubMed]
  30. Damerum, A.; Selmes, S.L.; Biggi, G.F.; Clarkson, G.J.J.; Rothwell, S.D.; Truco, M.J.; Michelmore, R.W.; Hancock, R.D.; Shellcock, C.; Chapman, M.A.; et al. Elucidating the genetic basis of antioxidant status in lettuce (Lactuca sativa). Hortic. Res. 2015, 2, 1–13. [Google Scholar] [CrossRef] [PubMed] [Green Version]
  31. Zhang, S.; Yu, Z.; Qi, X.; Wang, Z.; Zheng, Y.; Ren, H.; Liang, S.; Zheng, X. Construction of a High-Density Genetic Map and Identification of Leaf Trait-Related QTLs in Chinese Bayberry (Myrica rubra). Front. Plant Sci. 2021, 12. [Google Scholar] [CrossRef]
  32. Labadie, M.; Vallin, G.; Petit, A.; Ring, L.; Hoffmann, T.; Gaston, A.; Potier, A.; Schwab, W.; Rothan, C.; Denoyes, B. Metabolite Quantitative Trait Loci for Flavonoids Provide New Insights into the Genetic Architecture of Strawberry (Fragaria × ananassa) Fruit Quality. J. Agric. Food Chem. 2020, 68, 6927–6939. [Google Scholar] [CrossRef] [PubMed]
  33. Santin, A.; Villa, F.; Paulus, D. Chlorophyll content in plants and fruit yield of strawberry plants grown on mulching. Rev. Ciencias Agroveterinarias 2017, 16, 262–268. [Google Scholar] [CrossRef] [Green Version]
  34. Güler, S.; Macit, I.; Koç, A.; Ibrikci, H. Estimating leaf nitrogen status of strawberry by using chlorophyll meter reading. J. Biol. Sci. 2006, 6, 1011–1016. [Google Scholar]
  35. Jiang, C.; Johkan, M.; Hohjo, M.; Tsukagoshi, S.; Maturo, T. A correlation analysis on chlorophyll content and SPAD value in tomato leaves. Hort. Res. 2017, 71, 37–42. [Google Scholar] [CrossRef]
  36. Allard, R.W. Principles of Plant Breeding; John Wiley and Sons Inc.: Hoboken, NJ, USA, 1960. [Google Scholar]
  37. Lee, Y.R.; Kim, J.; Lee, S.Y.; Lee, J. Diallelic SNP marker development and genetic linkage map construction in octoploid strawberry (Fragaria × ananassa) through next-generation resequencing and high-resolution melting analysis. Hortic. Environ. Biotechnol. 2020, 61, 371–383. [Google Scholar] [CrossRef]
  38. Sonah, H.; Bastien, M.; Iquira, E.; Tardivel, A.; Légaré, G.; Boyle, B.; Normandeau, É.; Laroche, J.; Larose, S.; Jean, M.; et al. An Improved Genotyping by Sequencing (GBS) Approach Offering Increased Versatility and Efficiency of SNP Discovery and Genotyping. PLoS ONE 2013, 8, e54603. [Google Scholar] [CrossRef] [PubMed] [Green Version]
  39. Han, K.; Jeong, H.J.; Yang, H.B.; Kang, S.M.; Kwon, J.K.; Kim, S.; Choi, D.; Kang, B.C. An ultra-high-density bin map facilitates high-throughput QTL mapping of horticultural traits in pepper (Capsicum annuum). DNA Res. 2016, 23, 81–91. [Google Scholar] [CrossRef] [Green Version]
  40. Wang, S.; Basten, C.J.; Zeng, Z.B. Windows QTL Cartographer 2.5; Department of Statistics, North CarolinaState University: Raleigh, NC, USA, 2007. [Google Scholar]
  41. Bojovic, B.; Markovic, A. Correlation between nitrogen and chlorophyll content in wheat (Triticum aestivum L.). Kragujev. J. Sci. 2009, 31, 69–74. [Google Scholar]
  42. Guo, P.; Baum, M.; Varshney, R.K.; Graner, A.; Grando, S.; Ceccarelli, S. QTLs for chlorophyll and chlorophyll fluorescence parameters in barley under post-flowering drought. Euphytica 2008, 163, 203–214. [Google Scholar] [CrossRef]
  43. Zhang, K.; Fang, Z.; Liang, Y.; Tian, J. Genetic dissection of chlorophyll content at different growth stages in common wheat. J. Genet. 2009, 88, 183–189. [Google Scholar] [CrossRef] [PubMed]
  44. Li, Y.H.; Sun, Z.L.; Xu, X.L.; Jin, M.; Liu, Y.J.; Zhang, H.; An, L.Z. Influence of low temperatures on photosystem II photochemistry and expression of the NADPH:Protochlorophyllide oxidoreductase in the alpine, subnival perennial, Chorispora bungeana. Photosynthetica 2010, 48, 457–468. [Google Scholar] [CrossRef]
  45. Chen, M.; Li, J.; Dai, X.; Sun, Y.; Chen, F. Effect of phosphorus and temperature on chlorophyll a contents and cell sizes of Scenedesmus obliquus and Microcystis aeruginosa. Limnology 2011, 12, 187–192. [Google Scholar] [CrossRef]
  46. Gáborčík, N. Relationship between contents of chlorophyll (a+b) (SPAD values) and nitrogen of some temperate grasses. Photosynthetica 2003, 41, 285–287. [Google Scholar] [CrossRef]
  47. Fritschi, F.B.; Ray, J.D. Soybean leaf nitrogen, chlorophyll content, and chlorophyll a/b ratio. Photosynthetica 2007, 45, 92–98. [Google Scholar] [CrossRef]
  48. Suharja, S.; Sutarno, S. Biomass, chlorophyll and nitrogen content of leaves of two chili pepper varieties (Capsicum annum) in different fertilization treatments. Bioscience 2009, 1, 9–16. [Google Scholar]
  49. Lee, Y.J.; Yang, C.M.; Chang, K.W.; Shen, Y. Effects of nitrogen status on leaf anatomy, chlorophyll content and canopy reflectance of paddy rice. Bot. Stud. 2011, 52, 295–303. [Google Scholar]
  50. Zucchi, M.R.; Necchi, O. Effects of temperature, irradiance and photoperiod on growth and pigment content in some freshwater red algae in culture. Phycol. Res. 2001, 49, 103–114. [Google Scholar] [CrossRef]
  51. Seyfabadi, J.; Ramezanpour, Z.; Khoeyi, Z.A. Protein, fatty acid, and pigment content of Chlorella vulgaris under different light regimes. J. Appl. Phycol. 2011, 23, 721–726. [Google Scholar] [CrossRef]
  52. De Oliveira, A.H.G.; Maciel, G.M.; Siquieroli, A.C.S.; Luz, J.M.Q.; Da Silva, E.C. Dynamics of heritability in different characters of lettuce. Rev. Caatinga. 2021, 34, 514–526. [Google Scholar] [CrossRef]
  53. Yu, K.; Wang, J.; Sun, C.; Liu, X.; Xu, H.; Yang, Y.; Dong, L.; Zhang, D. High-density QTL mapping of leaf-related traits and chlorophyll content in three soybean RIL populations. BMC Plant Biol. 2020, 20, 1–14. [Google Scholar] [CrossRef] [PubMed]
  54. Li, D.D.; Si, L.T.; Zhang, G.Y.; Zhang, S.J.; Tian, L.B. Quantitative trait loci analysis for chlorophyll content of cucumber (Cucumis sativus L.) seedlings under low-light stress. African J. Biotechnol. 2010, 9, 4692–4699. [Google Scholar] [CrossRef]
  55. Ji, S.; Siegel, A.; Shan, S.-O.; Grimm, B.; Wang, P. Chloroplast SRP43 autonomously protects chlorophyll biosynthesis proteins against heat shock. Nat. Plants 2021. [Google Scholar] [CrossRef] [PubMed]
  56. Sultana, N.; Islam, S.; Juhasz, A.; Yang, R.; She, M.; Alhabbar, Z.; Zhang, J.; Ma, W. Transcriptomic study for identification of major nitrogen stress responsive genes in Australian bread wheat cultivars. Front. Genet. 2020, 11, 1–29. [Google Scholar] [CrossRef] [PubMed]
  57. Song, J.T.; Lu, H.; Greenberg, J.T. Divergent roles in Arabidopsis thaliana development and defense of two homologous genes, aberrant arowth and death2 And AGD2-Like Defense Response Protein 1, Encoding Novel Aminotransferases. Plant Cell 2004, 16, 353–366. [Google Scholar] [CrossRef] [Green Version]
  58. Lee, K.; Park, S.J.; Han, J.H.; Jeon, Y.; Pai, H.S.; Kang, H. A chloroplast-targeted pentatricopeptide repeat protein PPR287 is crucial for chloroplast function and Arabidopsis development. BMC Plant Biol. 2019, 19, 1–10. [Google Scholar] [CrossRef] [PubMed]
  59. Wang, P.; Richter, A.S.; Kleeberg, J.R.W.; Geimer, S.; Grimm, B. Post-translational coordination of chlorophyll biosynthesis and breakdown by BCMs maintains chlorophyll homeostasis during leaf development. Nat. Commun. 2020, 11. [Google Scholar] [CrossRef] [Green Version]
  60. Nguyen, M.K.; Shih, T.H.; Lin, S.H.; Lin, J.W.; Nguyen, H.C.; Yang, Z.W.; Yang, C.M. Transcription profile analysis of chlorophyll biosynthesis in leaves of wild-type and chlorophyll b-deficient rice (Oryza sativa L.). Agriculture 2021, 11, 401. [Google Scholar] [CrossRef]
  61. Inoue, H.; Li, M.; Schnell, D.J. An essential role for chloroplast heat shock protein 90 (Hsp90C) in protein import into chloroplasts. Proc. Natl. Acad. Sci. USA 2013, 110, 3173–3178. [Google Scholar] [CrossRef] [PubMed] [Green Version]
  62. Lee, H.S.; Choi, I.; Jeon, Y.; Ahn, H.K.; Cho, H.; Kim, J.W.; Kim, J.H.; Lee, J.M.; Lee, S.H.; Bünting, J.; et al. Chaperone-like protein DAY plays critical roles in photomorphogenesis. Nat. Commun. 2021, 12, 1–13. [Google Scholar] [CrossRef]
Figure 1. Phenotypic frequency distribution of chlorophyll SPAD in the BS-F2 and BC-F2 population. The arrows indicate traits associated with values for the two parents used to construct the F2 population. (A) Chlorophyll SPAD values of BS-F2 population. (B,C). The representative of individuals having lowest and highest SPAD values in BS-F2 population respectively. (D) Chlorophyll SPAD values of BC-F2 population. (E,F) The representative of individuals having lowest and highest SPAD values in BS-F2 population respectively.
Agriculture 11 01163 g001
Figure 2. A bin linkage chromosomal map showing the locations of QTLs for chlorophyll content (A) in BS-F2 population and (B) in BC-F2 population. The genetic distance is shown in centimorgans (cM).
Agriculture 11 01163 g002
Figure 3. Box plots of tightly linked bins to commonly detected QTLs from chromosome 5-3. (A) BS-F2 grouped based on the tightly linked bin to QTL BSqchl_5-3 for chlorophyll content. (B) BC-F2 grouped based on the tightly linked bin to QTL BCqchl_5-3 for chlorophyll content. Small letters (a and b) refer to significant differences (p < 0.05) according to Duncan multiple range test. BB, genotype of paternal parent; AA, genotype of maternal parent; HH, genotype of heterozygote.
Agriculture 11 01163 g003
Table 1. Summary of genotyping-by-sequencing data used to construct the BC-F2 linkage map.
Summary of Illumina SequencingData
Number of BC-F2 plants subjected sequencing158
Total base number of raw reads (bp)124,093,242,956
Average base number of raw reads (bp)775,582,768
Average number of trimmed reads3,000,099
Average mapping rate (%)97.5
Average depth of mapped region9.9
Total number of SNPs detected17,416
Table 2. QTL analysis for the strawberry leaf chlorophyll content in the BS-F2 and BC-F2 populations using composite interval mapping.
PopulationTraitQTLsLinkage
Group
ChromosomePosition 1
(cM)
Position 2
(Mb)
LOD 3R2 (%) 4Additive
Effect
BS-F2ChlBSqchl_5-35-3c5-37.0126.5–288.117.3−2.5
BS-F2ChlBSqchl_6-36-3b6-379.6136.3–374.25.9−1.7
BC-F2ChlBCqchl_2-22-2a2-29.918–143.46.39
BC-F2ChlBCqchl_4-24-2a4-210.318–92.926.8−3.1
BC-F2ChlBCqchl_5-15-1b5-117.617–834.11.8
BC-F2ChlBCqchl_5-35-3a5-3122.0127–283.41.42.4
BC-F2ChlBCqchl_7-27-2b7-261.4123–242.95.40
1 Positions of the bins on the linkage map. 2 Positions of flanking bins on strawberry genome. 3 LOD, logarithm of odds. 4 Percent of the phenotypic variation explained by the QTLs.
Table 3. Candidate genes associated with chlorophyll content in commonly detected QTLs and their functions.
QTLsChromosomeLocationGene IDFunctional Annotation
BSqchl_5-3
BCqchl_5-3
Chr5-326833856–26835283ID = g00061270Glutamate-tRNA ligase
Chr5-326902815–26905722ID = g00061283Aminotransferase ALD1
Chr5-326938249–26940105ID = g00061289Pentatricopeptide repeat-containing protein
Chr5-327008147–27010431ID = g00061300Chaperone protein dnaJ
Chr5-327323239–27328734ID = g00061382Glutamyl endopeptidase
Chr5-327339049–27339435ID = g00061384Calvin cycle protein CP12-2
Chr5-327351854–27352555ID = g00061388Glutamate--tRNA ligase
Chr5-327536789–27540838ID = g00061428Phospholipase A1 PLIP2
Chr5-327596348–27596541ID = g00061448Senescence-associated protein
Chr5-327630517–27630918ID = g00061457Peroxiredoxin
Chr5-327652144–27655367ID = g00061460Heat shock protein 90-5
Chr5-327706473–27712240ID = g00061470WAT1-related protein
Publisher’s Note: MDPI stays neutral with regard to jurisdictional claims in published maps and institutional affiliations.

