Abstract
Objective: Diabetic retinopathy (DR) is a leading cause of blindness, and understanding its progression from non-proliferative (NPDR) to sight-threatening proliferative diabetic retinopathy (PDR) is crucial. Systemic lactate dehydrogenase (LDH) has been implicated in various disease processes. We investigated the association between systemic LDH levels at the time of NPDR diagnosis and the 1-year risk of progression to PDR and its complications. Methods: We conducted a retrospective, propensity-matched cohort study using the TriNetX US Collaborative Network. Patients with type 2 diabetes and a new diagnosis of NPDR were stratified into three groups based on a single LDH measurement taken within 6 months of the index date: low (<200 U/L), moderate (201–280 U/L), and high (≥281 U/L). Two separate analyses were performed: one comparing the low-LDH group to the moderate-LDH group, and another comparing the low-LDH group to the high-LDH group. The primary outcomes were the 1-year absolute risks and risk ratios (relative risk, RR) for PDR, tractional retinal detachment (TRD), and vitreous hemorrhage (VH). Results: Comparing the low-LDH cohort to the moderate-LDH cohort, the moderate-LDH group had a higher 1-year absolute risk of PDR (3.93% vs. 2.96%), TRD (1.35% vs. 0.99%), and VH (4.38% vs. 3.51%). Comparing the low-LDH group to the high-LDH group, the high-LDH cohort showed an increased risk for PDR (3.66% vs. 3.00%), TRD (1.27% vs. 0.96%), and VH (1.27% vs. 0.96%). Conclusions: Our findings demonstrate a consistent, dose-dependent relationship between higher systemic LDH levels and an increased risk of progression to PDR and its complications.
1. Introduction
Diabetic retinopathy (DR) is the most common microvascular complication of diabetes mellitus and a leading cause of new-onset blindness in working-age adults worldwide. The disease is characterized by a spectrum of vascular changes, beginning with non-proliferative diabetic retinopathy (NPDR), which presents as microaneurysms, intraretinal hemorrhages and exudates, and potentially advancing to the more severe sight-threatening stage of proliferative diabetic retinopathy (PDR), characterized by neovascularization. PDR can lead to subsequent complications such as vitreous hemorrhage (VH) and tractional retinal detachment (TRD) [1]. Studies have estimated the median time to progression from moderate NPDR to PDR to be around 2 years [2], yet this varies widely depending on the stage of NPDR, with up to 50 to 75% of eyes with severe NPDR progressing to PDR within one year [3,4].
The pathogenesis of DR progression is complex and involves multiple factors, including chronic hyperglycemia, inflammation, and cellular hypoxia [5]. Lactate dehydrogenase (LDH) is a ubiquitous intracellular enzyme that plays a crucial role in glycolysis. Elevated systemic LDH levels in the bloodstream are often considered a non-specific marker of tissue damage, cellular turnover, or hypoxia [6]. Previous studies investigated the association between serum LDH levels and DR, indicating a strong association between elevated LDH levels (> 134 U/L) and DR [7,8]. However, its specific role as a predictive biomarker for the progression of NPDR to PDR and in evaluating TRD and VH has not been studied in large patient population studies.
This study aimed to investigate whether varying systemic LDH levels at the time of NPDR diagnosis are associated with a higher 1-year risk of progression to PDR, TRD, or VH in type 2 diabetic patients. We hypothesized that patients with higher LDH levels would be at increased risk for these adverse outcomes, even after accounting for known risk factors and comorbid conditions.
2. Materials and Methods
2.1. Study Design and Data Source
This was a retrospective, propensity-matched cohort study utilizing data from the TriNetX US Collaborative Network (Cambridge, MA, USA), a large-scale research database of electronic health records from numerous healthcare organizations. The network includes >90 healthcare organizations (HCOs) in the United States and abroad, with >130 million patients. The study period encompassed a 1-year follow-up from the index date for each patient. The University of Arkansas for Medical Sciences Institutional Review Board (UAMS IRB) waived the study review/approval since the patient data were deidentified. The study adhered to the principles outlined in the Declaration of Helsinki.
2.2. Patient Cohorts and Exposure Definition
All patients included in this cohort were diagnosed with type 2 diabetes mellitus. The study cohort included patients with a first encounter coded for a diagnosis of NPDR, which served as the index date. For each patient, a single LDH measurement was retrieved if it was recorded within six months before or after the index date. Based on this measurement, patients were assigned to one of three mutually exclusive strata: low LDH: LDH levels < 200 Units per Liter (U/L); moderate LDH: LDH levels = 201–280 U/L, and high LDH: LDH levels ≥ 281 U/L. To ensure a clean separation between groups, any patient who had ever recorded an LDH value outside the qualifying range of their assigned stratum was excluded from the analysis.
2.3. Propensity Score Matching
We conducted two separate 1:1 greedy nearest-neighbor propensity score–matched comparisons. The first comparison was between patients with low LDH and those with moderate LDH, in which those with LDH < 200 U/L were matched to those with LDH 201–280 U/L (baseline characteristics are shown in Table 1). The second comparison compared low LDH vs. high LDH, matching patients with LDH < 200 U/L to those with LDH ≥281 U/L (baseline characteristics are shown in Table 2). The matching process was designed to balance baseline characteristics and minimize confounding factors that may affect the study outcomes. Covariates included demographics such as current age, age at NPDR diagnosis, sex, race, and Hispanic ethnicity. Metabolic and vascular comorbidities included HbA1c, body mass index (BMI), hypertension, dyslipidemia, and proteinuria. The ocular disease stage was accounted for using NPDR severity codes, the presence of macular edema, and open-angle glaucoma. Prior ophthalmic procedures were also included, specifically codes for intravitreal injections and other ophthalmic interventions, with the complete list of codes provided in (Table 3).

Table 1.
Baseline Characteristics of Patients with Non-Proliferative Diabetic Retinopathy: Moderate vs. Low LDH Cohorts Before and After Propensity Score Matching by LDH Level.
Table 2.
Baseline Characteristics of Patients with Non-Proliferative Diabetic Retinopathy: High vs. Low LDH Cohorts Before and After Propensity Score Matching by LDH Level.
Table 3.
Codes Used in the Study.
3. Outcomes
The primary outcomes, assessed within one year of the index date, were the absolute risk and relative risk of developing PDR, VH, and TRD. We calculated the risk ratios (also referred to as relative risk or RR) and their corresponding 95% confidence intervals (CIs) for each comparison. We set the significance level for this study at a p-value < 0.05 using two-sided tests.
4. Results
4.1. Comparison of Low (<200 U/L) vs. Moderate (201–280 U/L) LDH Cohorts
After matching, the cohorts were well-balanced on all predefined covariates (Table 1). For PDR, the 1-year absolute risk of PDR was 2.96% in the low-LDH cohort and 3.93% in the moderate-LDH cohort. This represented a 33% increase in relative risk (RR 1.33, 95% CI 1.14–1.54). TRD occurred in 0.99% of the low-LDH cohort and 1.35% of the moderate-LDH cohort. The relative risk was 1.36 (95% CI 1.07–1.73). VH occurred in 3.51% of the low-LDH cohort and 4.38% of the moderate-LDH cohort, resulting in a relative risk of 1.25 (95% CI 1.10–1.42) (Table 4 and Figure 1). In this comparison, a modest elevation of LDH levels from <200 U/L to 201–280 U/L was associated with small but statistically significant absolute risk increments of 0.4 to 0.9 percentage points for all three sight-threatening outcomes.
Table 4.
Risk of Proliferative Diabetic Retinopathy and Related Complications by LDH Level.
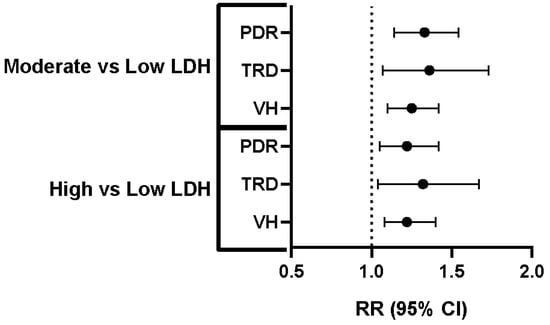
Figure 1.
Increased Risk of PDR, TRD, and VH with Higher LDH Levels. Relative risk (RR) and 95% confidence intervals (CI) for proliferative diabetic retinopathy (PDR), tractional retinal detachment (TRD), and vitreous hemorrhage (VH) in individuals with moderate versus low lactate dehydrogenase (LDH) levels and high versus low LDH levels. The dashed vertical line represents an RR of 1.0, indicating no difference in risk compared to the reference group (low LDH). Each horizontal line represents the 95% CI for the RR, with the dot indicating the point estimate of the RR. For all three complications (PDR, TRD, and VH), both the “moderate vs. low LDH” and “high vs. low LDH” groups show RR greater than 1.0, indicating a statistically significant increased risk of PDR, TRD, and VH in individuals with moderate and high LDH levels compared to those with low LDH levels.
4.2. Comparison of Low (<200 U/L) vs. High (≥281 U/L) LDH Cohorts
After matching, the cohorts were well-balanced on all predefined covariates (Table 2). This analysis also showed well-balanced cohorts after matching propensity scores. In the high-LDH cohort, the 1-year absolute risk of PDR was 3.66%, compared to 3.00% in the matched controls. The relative risk was 1.22 (95% CI 1.05–1.42). TRD developed in 1.27% of the high-LDH patients versus 0.96% of their matched controls. This corresponds to an RR of 1.32 (95% CI 1.04–1.67). VH occurred in 1.27% of patients with LDH ≥ 281 U/L and 0.96% of the control group, yielding an RR of 1.22 (95% CI 1.08–1.40) (Table 4 and Figure 1).
5. Discussion
The results of this study demonstrated a positive and significant association between higher systemic LDH levels and an increased 1-year risk of progression from NPDR to the vision-threatening PDR. Across both propensity-matched comparisons, the direction of effect was uniform: as the LDH levels increased, so did the absolute probability of PDR, TRD, and VH. The observed relative risks for these outcomes ranged from approximately 20% to 35%, despite matching for a wide array of demographic, metabolic, and ocular confounding factors.
LDH is a ubiquitous enzyme crucial for cellular energy metabolism. As an indicator of systemic cell damage, circulating LDH levels are measured in terms of enzymatic activity. While the reference range for adults is typically between 125 and 220 IU/L, this can vary among laboratories. Elevated LDH levels are a non-specific marker for a broad spectrum of pathologies, including tissue injury, malignancy, and blood disorders. Therefore, interpreting LDH activity requires correlation with other clinical and laboratory findings to identify the specific site of cellular necrosis or turnover. For example, a recent study demonstrated that serum LDH activities are correlated with various diseases, with a robust correlation observed in hepatic encephalopathy and lung fibrosis [9]. Our finding suggests that systemic LDH levels may be an independent marker of vulnerability to PDR. The underlying mechanism may be linked to LDH’s role in modulating cellular stress. In the context of diabetic retinopathy, elevated LDH could be a systemic reflection of the microvascular damage, chronic inflammation, and increased anaerobic metabolism occurring within the hypoxic retina. As retinal hypoxia worsens, cells shift towards anaerobic glycolysis, producing lactate and releasing LDH into the bloodstream upon cellular damage, which in turn fuels the neovascularization cascade characteristic of PDR [10,11].
The use of a large, real-world database and a propensity-matched design are key strengths of this study. This approach allowed us to control for numerous potential confounders, lending greater confidence to the observed associations. The consistent dose–response relationship across two separate matched analyses further strengthens our conclusion. In addition, our study is the first to show the association between LDH levels and VH and TRD. A previous study demonstrated the association between the elevated LDH levels (>134 U/L) and the increased risk of DR in type 2 diabetic patients [7]. However, it did not evaluate the risk associated with the different categories of LDH levels and the progression of DR. Serum LDH levels have been extensively studied as a biomarker for various human diseases [9]. It has been detected in other retinal diseases, including retinoblastoma [12]. Our study introduces LDH as a biomarker for the risk of progression from NPDR to PDR, which could help identify patients who require more frequent retinal monitoring to prevent vision loss. However, it is essential to acknowledge the study’s limitations; our study is correlational and cannot establish a causal relationship between LDH and progression from NPDR to PDR. Furthermore, we did not stratify patients by NPDR stage, and the follow-up was limited to one year from the index date. More importantly, LDH can be upregulated in various acute and chronic conditions (e.g., occult malignancy, hemolysis, liver or muscle disease), as mentioned earlier; therefore, it is essential to consider the patients’ comorbidities and repeat measurements after acute conditions that may affect LDH levels subside.
6. Conclusions
Systemic lactate dehydrogenase levels, even at modest elevations above the normal range, are significantly and independently associated with a higher risk of developing PDR and its complications (TRD and VH) within one year in type 2 diabetic patients. These findings suggest that LDH could serve as a valuable and accessible biomarker for risk stratification in patients with NPDR.
Author Contributions
Conceptualization, A.Y.F.; methodology, M.Z.C., J.M. and A.B.S.; software, M.Z.C. and J.M.; validation, M.Z.C. and J.M.; formal analysis, M.Z.C., J.M. and E.S.; investigation, E.S.; resources, A.B.S.; data curation, E.S.; writing—original draft preparation, E.S.; writing—review and editing, A.Y.F. and A.B.S.; supervision, A.Y.F. and A.B.S.; project administration, A.Y.F. and A.B.S.; funding acquisition, A.Y.F. and E.S. All authors have read and agreed to the published version of the manuscript.
Funding
The study was supported by an AHA Career Development Award (25CDA1446415) to ES and National Eye Institute (NIH/NEI) grants (R00 EY029373, R01 EY035658) to AYF.
Institutional Review Board Statement
This study was exempted from review by the UAMS IRB because it does not involve identifiable data and does not meet the definition of human subjects’ research.
Informed Consent Statement
Patient consent was waived because the study does not involve identifiable data and does not meet the definition of human subjects’ research.
Data Availability Statement
The data are available upon request.
Conflicts of Interest
The authors declare no conflicts of interest.
References
- Wilkinson, C.P.; Ferris, F.L., III; Klein, R.E.; Lee, P.P.; Agardh, C.D.; Davis, M.; Dills, D.; Kampik, A.; Pararajasegaram, R.; Verdaguer, J.T.; et al. Proposed international clinical diabetic retinopathy and diabetic macular edema disease severity scales. Ophthalmology 2003, 110, 1677–1682. [Google Scholar] [CrossRef] [PubMed]
- Moshfeghi, A.; Garmo, V.; Sheinson, D.; Ghanekar, A.; Abbass, I. Five-Year Patterns of Diabetic Retinopathy Progression in US Clinical Practice. Clin. Ophthalmol. 2020, 14, 3651–3659. [Google Scholar] [CrossRef] [PubMed]
- Perais, J.; Agarwal, R.; Evans, J.R.; Loveman, E.; Colquitt, J.L.; Owens, D.; Hogg, R.E.; Lawrenson, J.G.; Takwoingi, Y.; Lois, N. Prognostic factors for the development and progression of proliferative diabetic retinopathy in people with diabetic retinopathy. Cochrane Database Syst. Rev. 2023, CD013775. [Google Scholar] [CrossRef]
- Early Treatment Diabetic Retinopathy Study Research Group. Fundus photographic risk factors for progression of diabetic retinopathy. ETDRS report number 12. Ophthalmology 1991, 98, 823–833. [Google Scholar] [CrossRef]
- Antonetti, D.A.; Silva, P.S.; Stitt, A.W. Current understanding of the molecular and cellular pathology of diabetic retinopathy. Nat. Rev. Endocrinol. 2021, 17, 195–206. [Google Scholar] [CrossRef] [PubMed]
- Farhana, A.; Lappin, S.L. Biochemistry Lactate Dehydrogenase. In StatPearls; StatPearls Publishing: Treasure Island, FL, USA, 2025. [Google Scholar]
- Yang, P.; Xu, W.; Liu, L.; Yang, G. Association of lactate dehydrogenase and diabetic retinopathy in US adults with diabetes mellitus. J. Diabetes 2024, 16, e13476. [Google Scholar] [CrossRef] [PubMed]
- Lian, X.; Zhu, M. Factors related to type 2 diabetic retinopathy and their clinical application value. Front. Endocrinol. 2024, 15, 1484197. [Google Scholar] [CrossRef] [PubMed]
- Wu, Y.; Lu, C.; Pan, N.; Zhang, M.; An, Y.; Xu, M.; Zhang, L.; Guo, Y.; Tan, L. Serum lactate dehydrogenase activities as systems biomarkers for 48 types of human diseases. Sci. Rep. 2021, 11, 12997. [Google Scholar] [CrossRef] [PubMed]
- Li, Q.; Gui, X.; Zhang, H.; Zhu, W.; Zhang, R.; Shen, W.; Song, H. Role of glucose metabolism in ocular angiogenesis (Review). Mol. Med. Rep. 2022, 26, 363. [Google Scholar] [CrossRef] [PubMed]
- van Noorden, C.J.; Yetkin-Arik, B.; Serrano Martinez, P.; Bakker, N.; van Breest Smallenburg, M.E.; Schlingemann, R.O.; Klaassen, I.; Majc, B.; Habic, A.; Bogataj, U.; et al. New Insights in ATP Synthesis as Therapeutic Target in Cancer and Angiogenic Ocular Diseases. J. Histochem. Cytochem. 2024, 72, 329–352. [Google Scholar] [CrossRef] [PubMed]
- Ghiam, B.K.; Xu, L.; Berry, J.L. Aqueous Humor Markers in Retinoblastoma, a Review. Transl. Vis. Sci. Technol. 2019, 8, 13. [Google Scholar] [CrossRef] [PubMed]
Disclaimer/Publisher’s Note: The statements, opinions and data contained in all publications are solely those of the individual author(s) and contributor(s) and not of MDPI and/or the editor(s). MDPI and/or the editor(s) disclaim responsibility for any injury to people or property resulting from any ideas, methods, instructions or products referred to in the content. |
© 2025 by the authors. Licensee MDPI, Basel, Switzerland. This article is an open access article distributed under the terms and conditions of the Creative Commons Attribution (CC BY) license (https://creativecommons.org/licenses/by/4.0/).