Deep Forest-Based Monocular Visual Sign Language Recognition


School of Instrument Science and Engineering, Southeast University, Nanjing 210096, China
*
Authors to whom correspondence should be addressed.
†
These authors contributed equally to this work.
Appl. Sci. 2019, 9(9), 1945; https://doi.org/10.3390/app9091945
Submission received: 18 April 2019
/
Revised: 3 May 2019
/
Accepted: 8 May 2019
/
Published: 12 May 2019
(This article belongs to the Special Issue Advanced Intelligent Imaging Technology)
Abstract
:Sign language recognition (SLR) is a bridge linking the hearing impaired and the general public. Some SLR methods using wearable data gloves are not portable enough to provide daily sign language translation service, while visual SLR is more flexible to work with in most scenes. This paper introduces a monocular vision-based approach to SLR. Human skeleton action recognition is proposed to express semantic information, including the representation of signs’ gestures, using the regularization of body joint features and a deep-forest-based semantic classifier with a voting strategy. We test our approach on the public American Sign Language Lexicon Video Dataset (ASLLVD) and a private testing set. It proves to achieve a promising performance and shows a high generalization capability on the testing set.
1. Introduction
Sign language plays an indispensable role in the soundless world. It has been widely used across the world as the language of the hearing impaired. However, it is still a prominent problem for the hearing impaired to communicate with people who have normal hearing. Written communication on paper is a common method, but it has the disadvantage of inefficiency. Great effort is needed to help the hearing impaired to communicate well with the normal people, and using sign language recognition (SLR) techniques is an efficient way because SLR can convert the sign language into text or even voice. For example, a hearing impaired person could use a portable device to simultaneously communicate with someone. The SLR tool recognizes the signs and then shows the messages on the screen or speaks them out. It requires the device to work online under the condition of limited computing resources and power.
Research in the field of SLR can be divided into two categories [1,2]. One is static gesture, mainly used to represent letters of the alphabet, and the other is dynamic gesture, covering most sign languages.To recognize both static and dynamic gestures, feature extraction and semantic identification are the keys. The visual method and the wearable method are two main methods to acquire sign language features. The former uses monocular/stereo/depth cameras to capture gesture images and extract visual features [3]. The latter uses data gloves, which are equipped with embedded sensors, to get the joints’ locations directly [4,5,6].
Despite the flexible motion of human hands, data gloves can accurately obtain the three-dimensional information of a gesture in space [7]. Their disadvantage is that the operator must wear data gloves, which weakens the naturalness and flexibility of human–computer interaction. Besides, the price of the data glove is another reason for its limited use and promotion.
The visual SLR method using depth/stereo cameras, such as Kinect®, can generate outstanding results using a depth vision feature [8,9]. Kinect® is a motion-sensing device produced by Microsoft that is based on a time-of-flight camera. These cameras have a large overhead of hardware, and they are sensitive to environments like variant illumination. Compared with the depth/stereo camera, the monocular camera has a lighter structure and is less expensive, but requires robust recognition algorithms. Since the monocular camera only produces RGB images without depth information, it requires a powerful algorithm to achieve a promising result compared with depth/stereo cameras [2]. In the field of semantic recognition, there are two tendencies: the traditional methods, including hidden Markov models (HMMs) and dynamic time warping (DTW) [10,11], and the machine learning methods such as support vector machine (SVM) and deep neural networks (DNNs) [12].
The HMM model was mainly used in the field of speech recognition in the early days [13,14]. Although the HMM has achieved great success in speech recognition, its performance in SLR is not satisfactory. The reason is that the traditional HMM method needs to establish HMM models for each gesture separately, affecting the real-time performance of the system. In contrast, the DTW method is simple and effective. The optimal dynamic programming matching algorithm can be used to improve the accuracy rate of SLR [15]. Since DTW is based on a template matching algorithm, it is difficult for it to learn from data, which limits its robustness.
Machine learning methods have the characteristics of high parallelism, adaptability, and certain learning capabilities [16,17]. In particular, DNNs normally have various network models, which satisfy different application requirements. The accuracy of the DNNs depends on the number of training samples. In the field of sign language, as shown in Table 1, there is no public sign language dataset that has a large number of various signs and meanwhile has a sufficient volume of samples for each sign. It is hard for DNNs to achieve good performance if there are only between one and three samples for a sign. In addition, the computational overhead is also an obstacle in practical applications.
This paper introduces a novel SLR method for dynamic gestures that has high robustness and a strong generalization performance. We propose a combined joint model with both hand and arm joints to represent a human’s pose. Considering the characteristics of joints, we employ the extracted joints as the body features to explain the sign language. Overall, our SLR model involves two steps: In the first step, a visual skeleton extraction method is used to encode the body joint information via the OpenPose detector [18]. In the second step, a small sample data is used to train a classifier based on the deep forest model [19], which is compared with the SVM-based one.
The paper is organized as follows: In Section 2, the paper introduces relevant research from the aspect of skeleton detection. In Section 3, the basic modeling formulation is presented with the visual skeleton extraction method, the joint feature re-encoding method, the semantic classification, and the voting mechanism. In Section 4, the experiment is carried out with the public dataset and our private testing set, respectively. Finally, the conclusion is given in Section 5.
2. Related Work
Before the emergence of end-to-end learning, the main steps of visual sign language recognition could be divided into three parts: human skeleton detection, feature extraction, and semantic classification.
In terms of human skeleton detection, most traditional methods use the color-based skin segmentation model, which detects the human skeleton by the difference between the human’s color and the background color [20]. Nada et al. presented a dynamic skin detector based on face color tone and a skin-blob tracking technique for hand segmentation. It has a recognition rate of 97% in a signer-independent mode [21]. In recent years, along with the rise of depth cameras, e.g., Microsoft’s Kinect, many researchers have tried to combine depth information with appearance information. It can provide RGB images, depth images, and skeleton data [22]. Dong et al. adopted a 3D hand template with joint angle features with Microsoft’s Kinect [23]. Sílvia et al. used seven vision-based features from the RGB-D images and achieved accuracy results above 80% on average in Brazilian Sign Language [24].
After obtaining the human skeleton data, it is necessary to extract features from them. There are two types of features: graphical features and interaction information between skeleton. Graphical features involve the Fourier, Zernike moments, the pseudo-Zernike moments, the Hu moments, the complex moments, the Gabor features, and others [25,26]. Özbay and Safar used the Hausdorff distance and Hu invariants to process hand movements in a universal sign language recognition system [27]. Since the depth camera is able to convert human body images into human joint information, the meanings of signs are embedded in the distribution of joints [28]. Kishore et al. proposed a characterization of sign language gestures articulated at different body parts as 3D motionlets, which describe the signs with a subset of joint motions [29].
In the area of semantic classification, HMMs and DTW have been used to classify features since early times [30]. Pradeep et al. performed the recognition process using an HMM. The results showed the efficiency of the proposed framework, with an accuracy of 83.77% on occluded gestures [31]. However, due to the high efficiency of SVM, many scholars have tended to use SVM and make some improvements on it. Naresh combined linear discriminant analysis (LDA) and SVM to form the basis of tenfold classification to recognize sign language symbols. His work ensures 97.3% accuracy on a random sign symbolic dataset of gestural communication [32].
When neural networks, and especially deep learning methods, arose, the boundaries between feature extraction and semantic classification in SLR became blurred and even disappeared. A neural network can automatically learn and extract classification features from the input images [33]. Kiran et al. applied convolutional neural networks (CNNs) in the recognition of 3D motion-captured sign language. The 3D spatiotemporal information of each sign was interpreted using joint angular displacement maps (JADMs), which encoded the sign as a color texture image [16]. Although deep neural networks show strong performance, the performance of neural networks depends on the size and quality of the datasets.
3. Framework
3.1. Problem Formulation
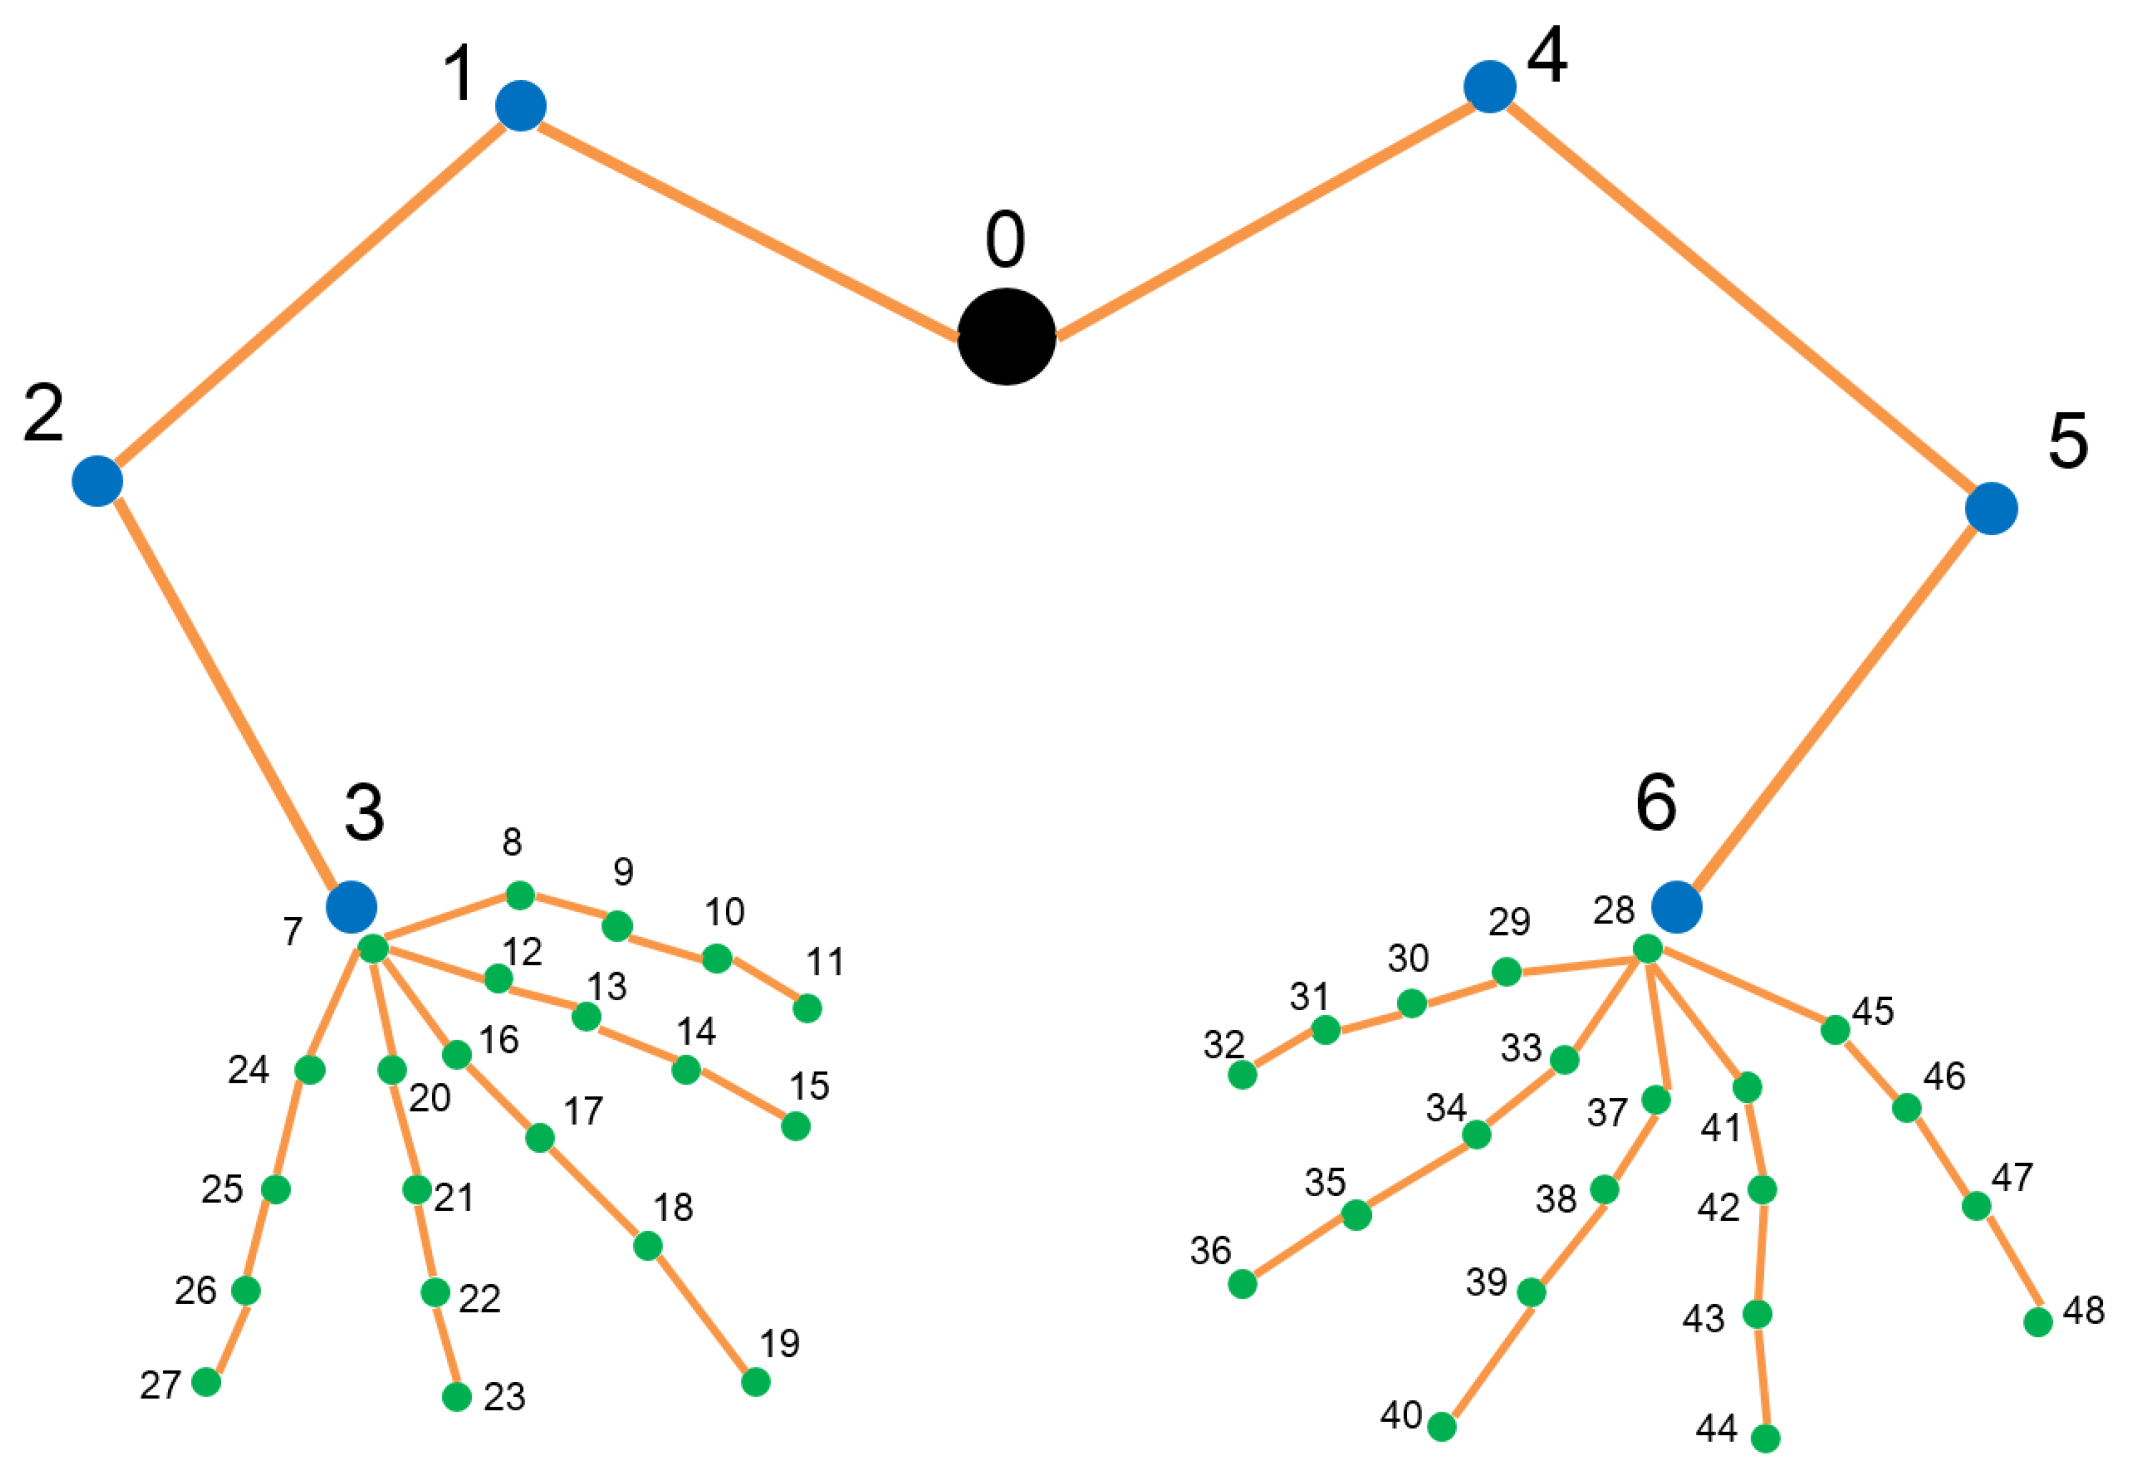
Human speech conveys information through sound, while sign language conveys information through body gestures. To identify sign language, gestures should be described precisely. In sign language, gestures mainly involve the movements of hands and arms. Therefore, gestures can be described by the continuous posture of hands and arms including position, movement, and shape. Position and movement can be represented using a human skeleton model. Since the shape of hands and arms has little effect on the meaning of sign language, modeling with the skeleton, especially joints, is sufficient for SLR. This paper presents a combined joint model with both hand and arm joints. Figure 1 shows the 48-marker template designed to represent hand and arm joints. The number of markers is defined as
where is the number of arm joints, denoted as (blue points in Figure 1), is the number of finger joints, denoted as (green points in Figure 1), and an extra root joint (black point in Figure 1), for each joint with at each frame t. and are defined as the position vector and the position confidence of the joint.
The framework of the SLR method is illustrated in Figure 2. The input is the raw image sequence from a monocular camera. The keypoints, regarded as the joints of the skeleton, are extracted frame-by-frame, and then the position vector and its confidence are calculated in term of the keypoints. In addition, we regularize the position vector into the normal position vector using a scaling coefficient generated from the position vector. The regularized position vectors are used as the input of the deep forest-based classifier. The output is the classifier combined with the confidence, which is used to generate the result by a voting strategy.
3.2. Feature Extraction
We employ OpenPose to obtain the joints information. OpenPose is a library for real-time keypoints detection [18]. OpenPose is a bottom-up algorithm of human pose estimation using part affinity fields (PAFs). It is a kind of real-time system to jointly detect human body, hands, and facial keypoints from a single image. Here, we explore one chest point, 6 arm joints (corresponding to the shoulders, the elbows, and the wrists), and 42 hand points (corresponding to the palms and the fingers).
The anatomical keypoints of people are extracted from an RGB image. PAFs are used to describe the direction of pixels in the skeleton, denoted as , and the confidence maps for body part location are represented by , where represents the locations of the keypoints in the image. The network uses a VGG pre-trained network as the encoder. The detection and association of keypoints are conducted simultaneously via two branches: the confidence map prediction and the affinity fields prediction. Finally, the confidence maps and PAFs are parsed to generate the 2D keypoints of people. The overall loss functions are defined as
where represents the ground-truth part confidence map, represents the keypoints, represents the ground-truth part affinity vector field, represents the limbs of the human body, represents the indicator function to diminish the loss of missing annotation, and stands for the Euclidean distance.
3.3. Regularization
Due to differences in human body size, distance from lens, and viewpoints of cameras, the distribution of joint points varies greatly in different images. A scaling method is used to make features consistent. At each frame t, the scaling coefficient is defined as
where refers to shoulder width and the length of upper arms and lower arms, which is defined as
In the default coordinates, the origin of the coordinates is located at the lower left corner of the image, which cannot reflect hand movement efficiently due to the symmetry of the human body’s left and right parts. Hence, another regularization method is used to make data symmetrical. In each frame t, the regularized position vector of each joint is defined as
The complete definition of the regularization process is
where f is the regularization function, and and represent the regularized point and the regularized position vector, respectively. and are the scaling coefficient and the regularized position vector, respectively. is the coordinate confidence. and are the position vector and the size of human body, respectively.
In each frame t, a confidence is used to evaluate the total confidence, which is defined as
3.4. Semantic Classification
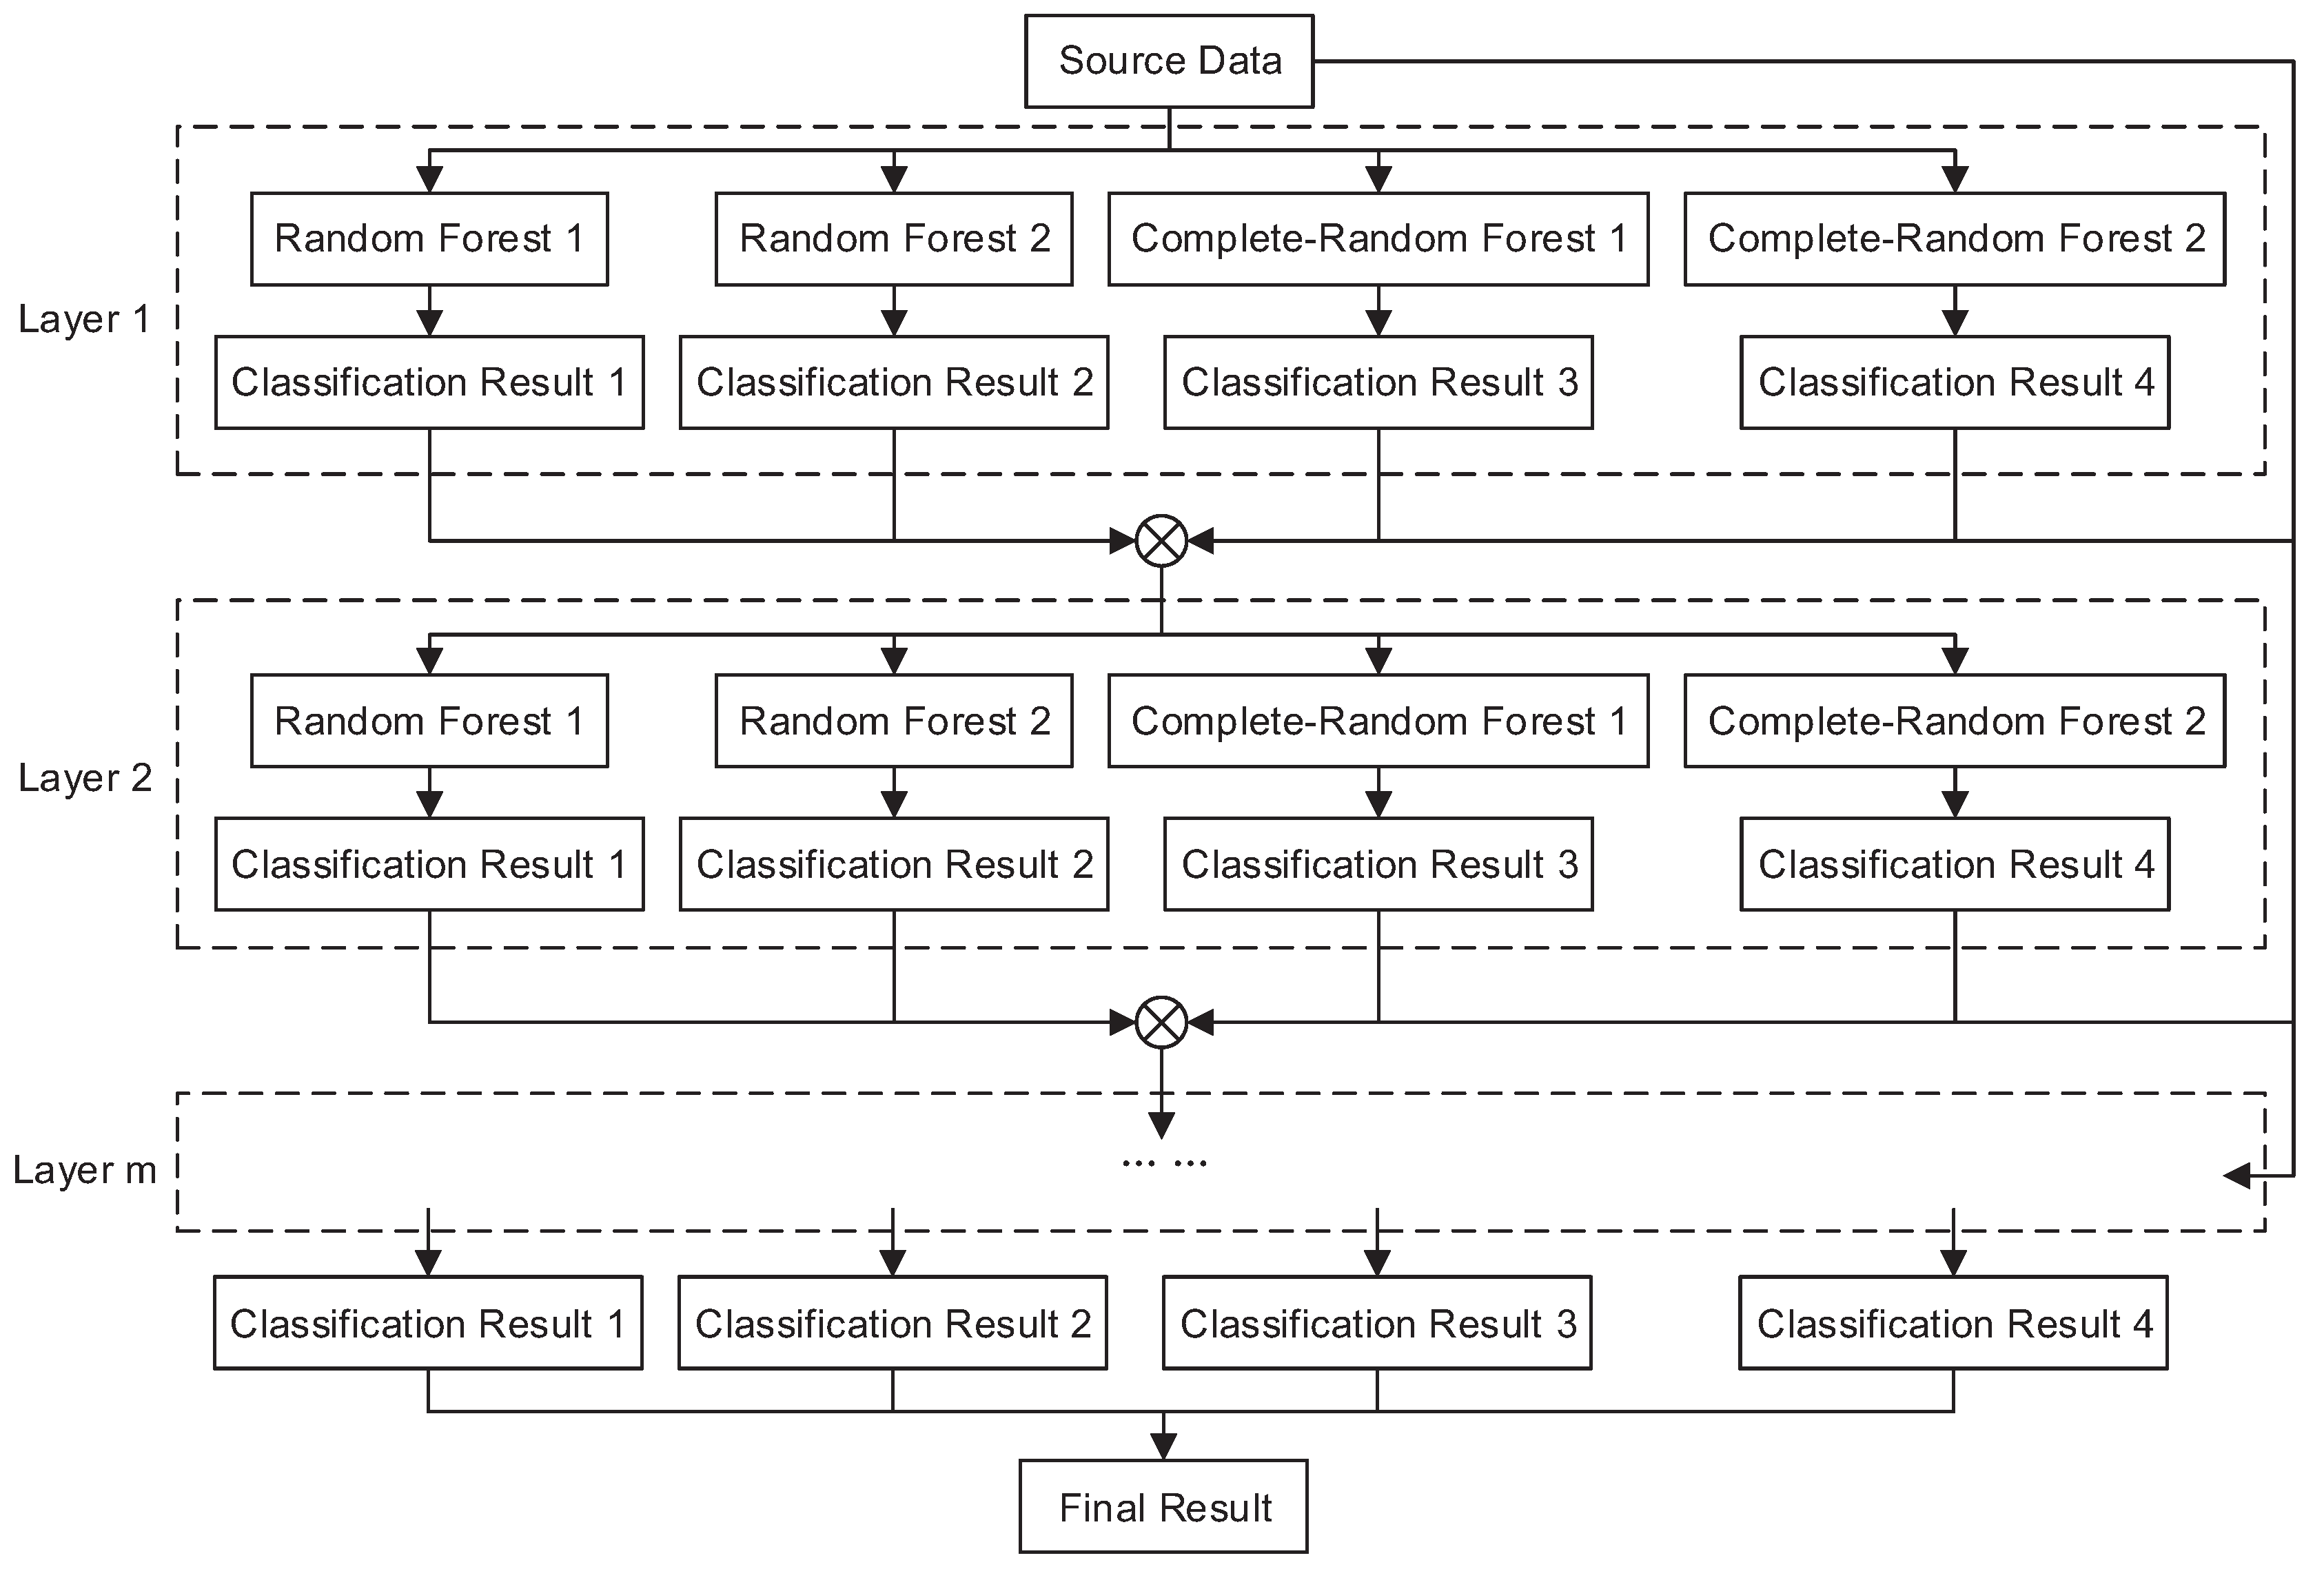
Deep neural networks ask for a huge amount of training data. It is hard to apply in certain tasks where there are only small-scale data. It is necessary to find an alternative to the deep neural networks. In this paper, we explore a deep forest-based classifier, which is fit for working on small-scale datasets. This classifier combines the characteristics of deep learning and random forests [19]. The framework of the Deep Forest is shown in Figure 3.
In our task, for each frame t, the input feature matrix is defined as
with the regularized position vector . Deep forest consists of several layers , to , where m depends on the training data. In the layer , there are two random forests ( and ) and two complete-random forests ( and ). Each random forest contains 500 decision trees, selecting the feature with the largest value from randomly picked features. In contrast, each complete-random forest contains 500 decision trees, really randomly selecting a feature at each node of the tree [34]. The combination of two random forests and two complete-random forests decided by the performance and the model size gives an optimized result. The input of the first layer is the source data . The output of the first layer is cascaded with the source data as the input of the second layer . Each layer has the output of the previous layer cascaded with the source data as input . In order to avoid over-fitting, each forest training uses K-fold cross-validation. Each sample is used as training and inspections, so the probability of each forest generation is not the training result from the same batch of training data, but is averaged by results after the cross-check. After the training of layer , the training model is used to estimate a testing set, and a cutoff accuracy is selected. If the accuracy of the obtained result is less than , the training is terminated. This step automatically determines the number of layers m. There are 3 layers in the deep forest classifier in Section 4. Each sample will find a path in each tree to find its corresponding leaf node, and the training data in this leaf node is likely to have different categories. The statistics of various categories can be obtained through u categories. u is the total number of semantics in the semantic data set, and the probability distribution of the entire forest is generated by averaging the proportions of all trees. Finally, the semantic category with the highest probability of each sample is selected as the recognition result for the sample.
3.5. Voting Mechanism
A sign language word is presented by a series of gestures captured by a monocular camera as a video consisting of t frames. For each frame t, the prediction is generated by the trained classifier. is the possibility of each category within k categories. To decide the final prediction of the whole gesture, a voting strategy is employed to differentiate and select . The weighted prediction on frame t is defined as
where is the confidence of prediction for frame t. The final prediction on the gesture is defined as
The meaning of a sign language symbol is decided by the category with the top prediction score. The meaning of the sentence is decided by categories with top n prediction scores. The category none is excluded as it has no meaning. The n is given in advance according to the symbol number of the sentence.
4. Experiments and Results
We use the public dataset ASLLVD and a private testing set in the experiments. The ASLLVD consists of more than 3300 American Sign Language (ASL) signs in video clips, including nouns, verbs, adjectives, and pronouns. Each sign is illustrated by 1–6 native ASL signers. In total, there are more than 9800 clips of signs. This dataset includes multiple synchronized videos showing the signs from different viewpoints. We only explore the front view of the monocular camera. Body joint features and sign recognition result examples are shown in Figure 4.
The classifiers are trained with the annotated images. In our experiments, four classifiers, the state-of-the-art deep forest and the standard classifiers including support vector machine, decision tree, and logistic regression have been used and compared in this experiment. We list the performance of all four classifiers, while only the SVM and deep forest are chosen as the typical classifiers to make an in-depth analysis.
In the experiment, there are 10 steps, and 10 signs are randomly chosen at the first step. Each sign includes around 3 video clips, and each clip consists of between 40 and 500 frames. All frames are labeled with their corresponding signs. Then, 20 signs are selected in the second step, 30 signs in the third step, and so on. Lastly, 104 signs are used to train the classifiers (we add 4 extra signs in that these signs can make up some common sentences). All of the experiments are conducted on a workstation with an Intel Xeon E5-1620 CPU, with 16GB RAM and a Nvidia GTX 1080 Ti GPU. The average training time of the deep forest classifier is about 5143 s.
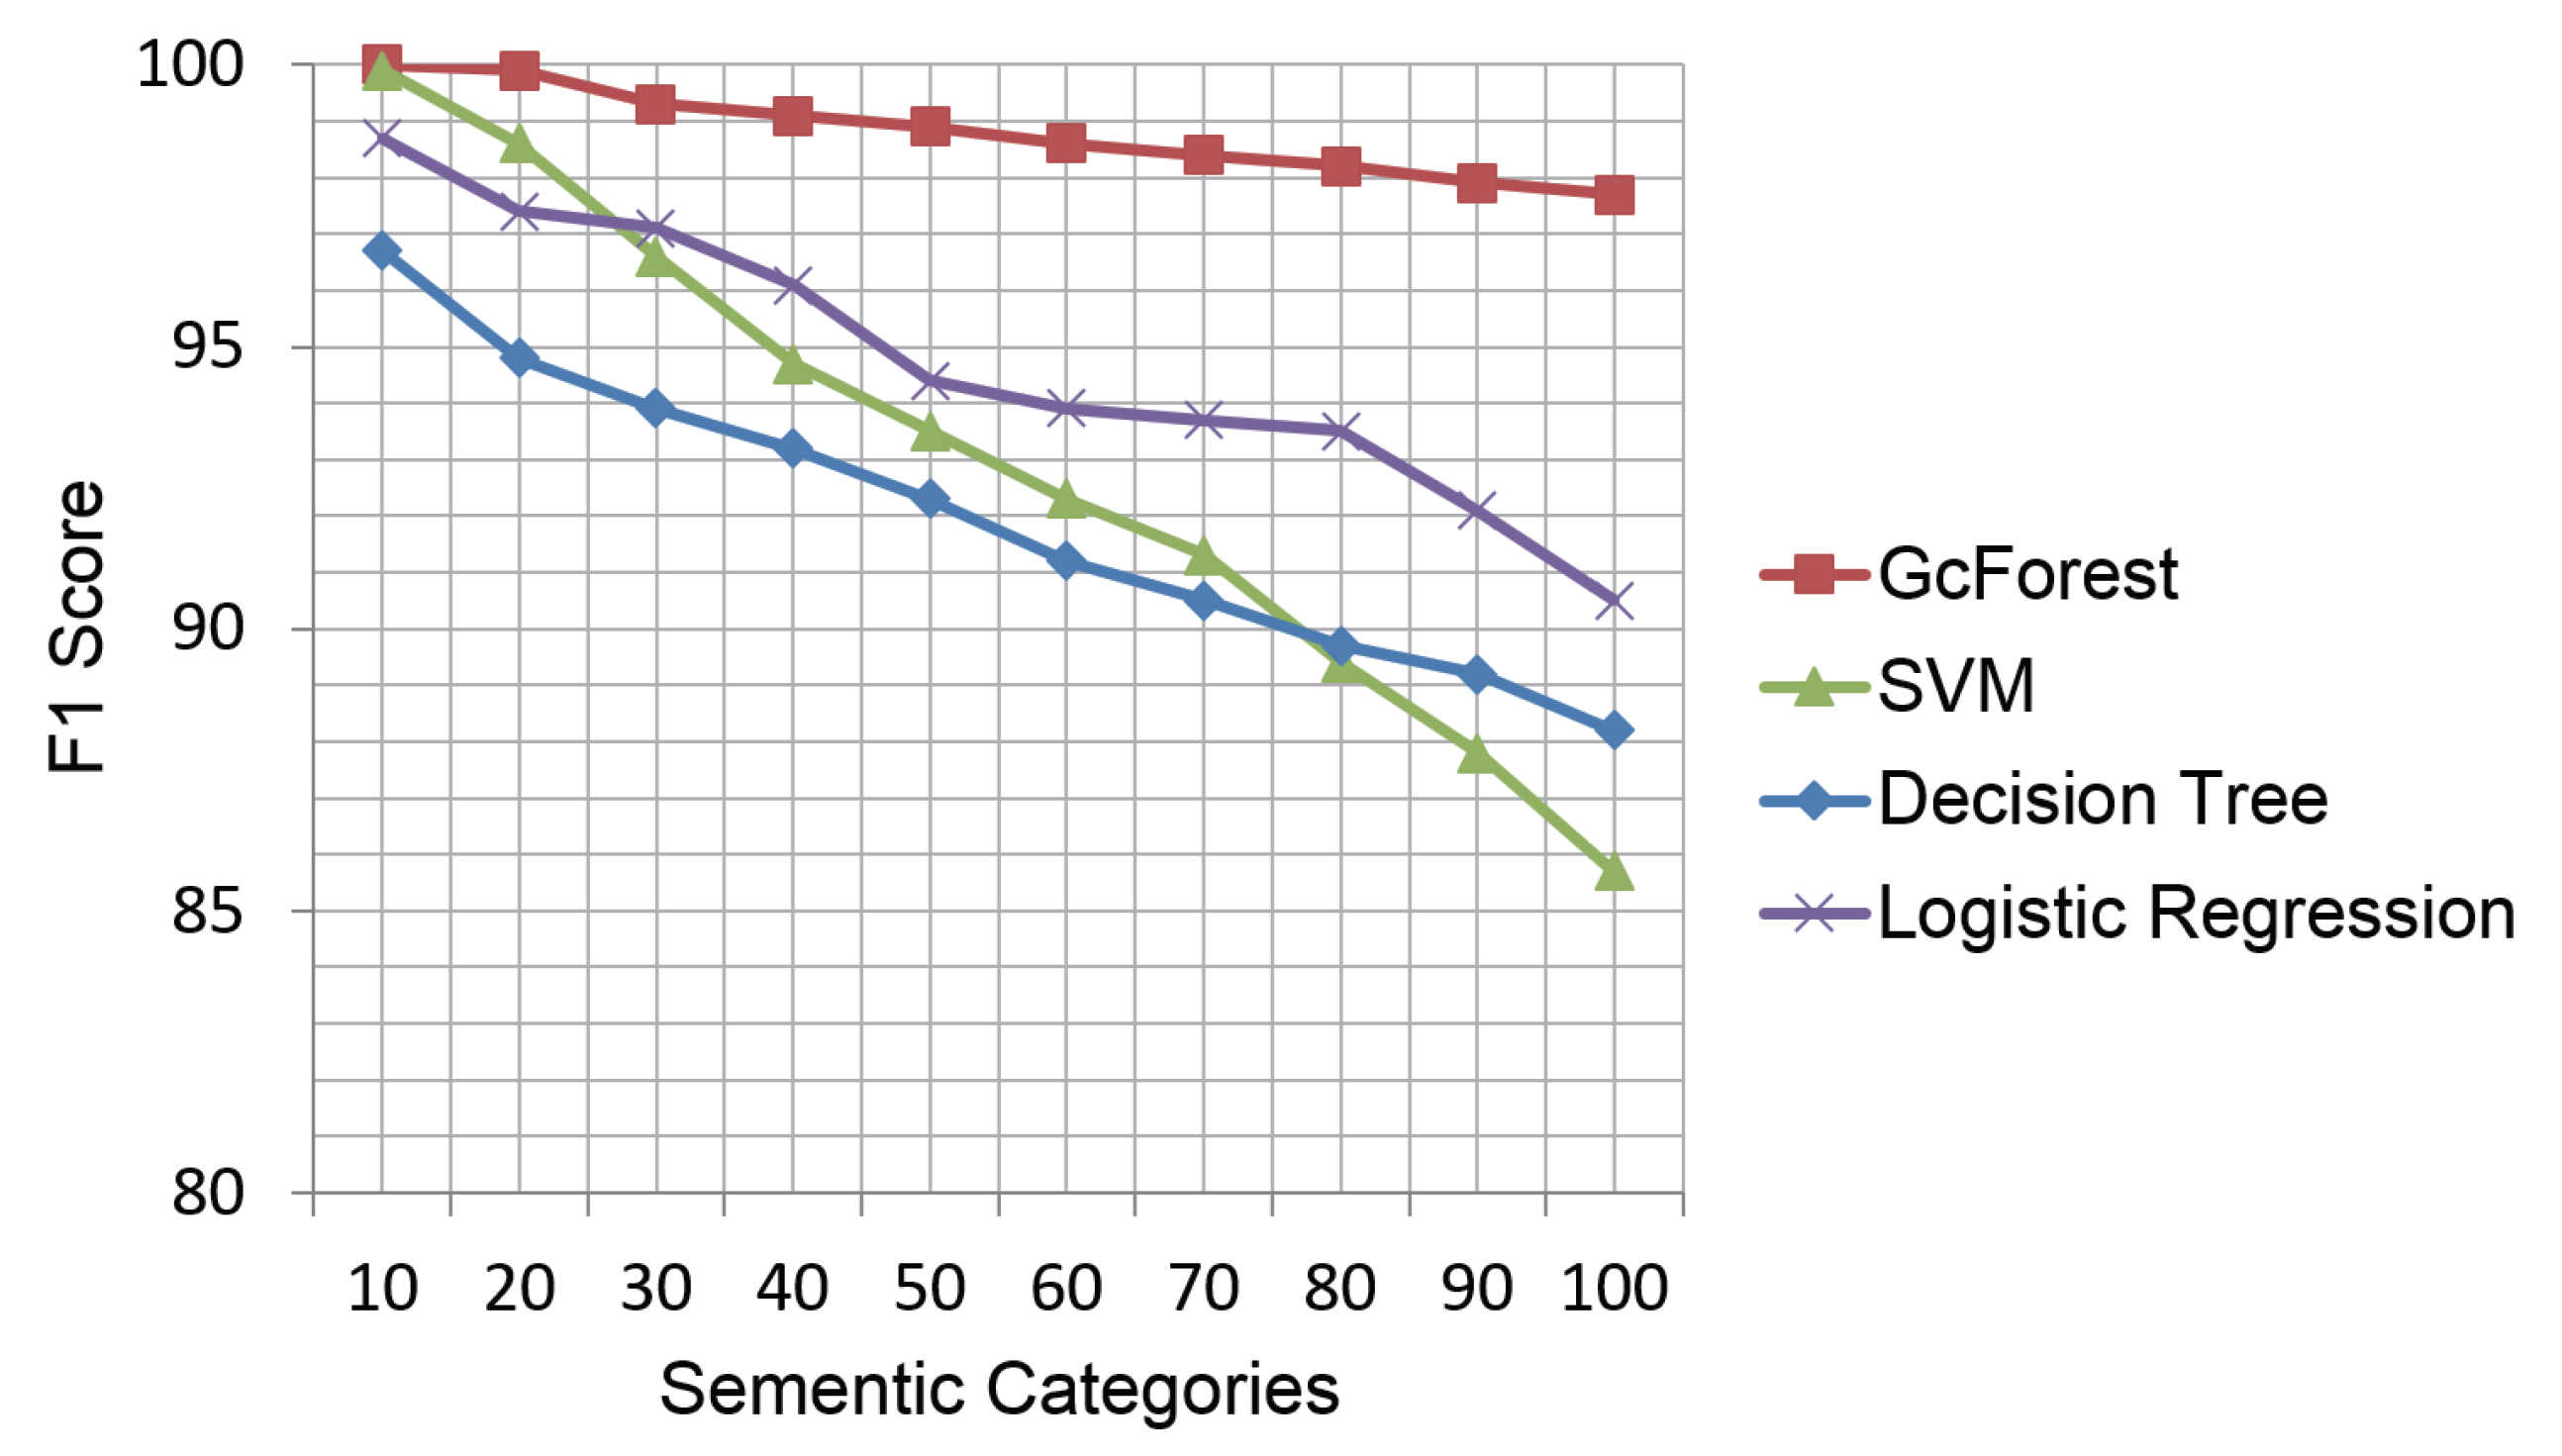
The samples of 104 signs (about 24,385 samples) are randomly split into 80% training data (19,508 samples) and 20% testing data (4877 samples). We adopt precision, recall, and F1 score to evaluate the performance of multi-sign recognition. The F1 score is the harmonic average of the precision and recall, where an F1 score reaches between 0 and 1. The F1 score of the four classifiers in 10 experiments is shown in Figure 5. It is defined as
where , , and refer to the number of true positive, false positive, and false negative samples.
In the random 10-sign experiments, all classifiers show good performance with F1 scores over 97%, as shown in Figure 5. However, with the increase in signs, the F1 score of the standard classifiers appears to decrease. The F1 score of the standard classifiers declines below 90% for 100 signs, while the deep forest classifier still has an F1 score of 97.7%. This can be explained as the standard classifiers are more useful for binary classification than multiple classification.
The performances of the two typical classifiers on the top 20 signs in the testing data are illustrated in the form of box-plots in Figure 6. The names of signs, the number of frames, precision, recall, and F1 score are listed in the columns “Signs”, “Number”, “Precision”, “Recall”, and “F1”. In each classifier, the 20 signs with top number of test samples are listed in Table 2.
As shown in Table 2, SVM and deep forest have average F1 scores of 86% and 98%, respectively. The performances of these two classifiers are quite different on some signs. For example, for the sign hot, SVM gets 0.00 for precision, recall, and F1 score, while deep forest gets 1.00, 0.92, and 0.96, respectively. Moreover, for the sign milk, SVM gets precision, recall, and F1 scores of 0.48, 0.76, and 0.58, respectively, while deep forest gets 1.00 for all scores. The minimum precision, recall, and F1 scores fpr deep forest are 0.82, 0.79, and 0.86, respectively. This shows that the deep forest classifier has a better performance than the SVM classifier.
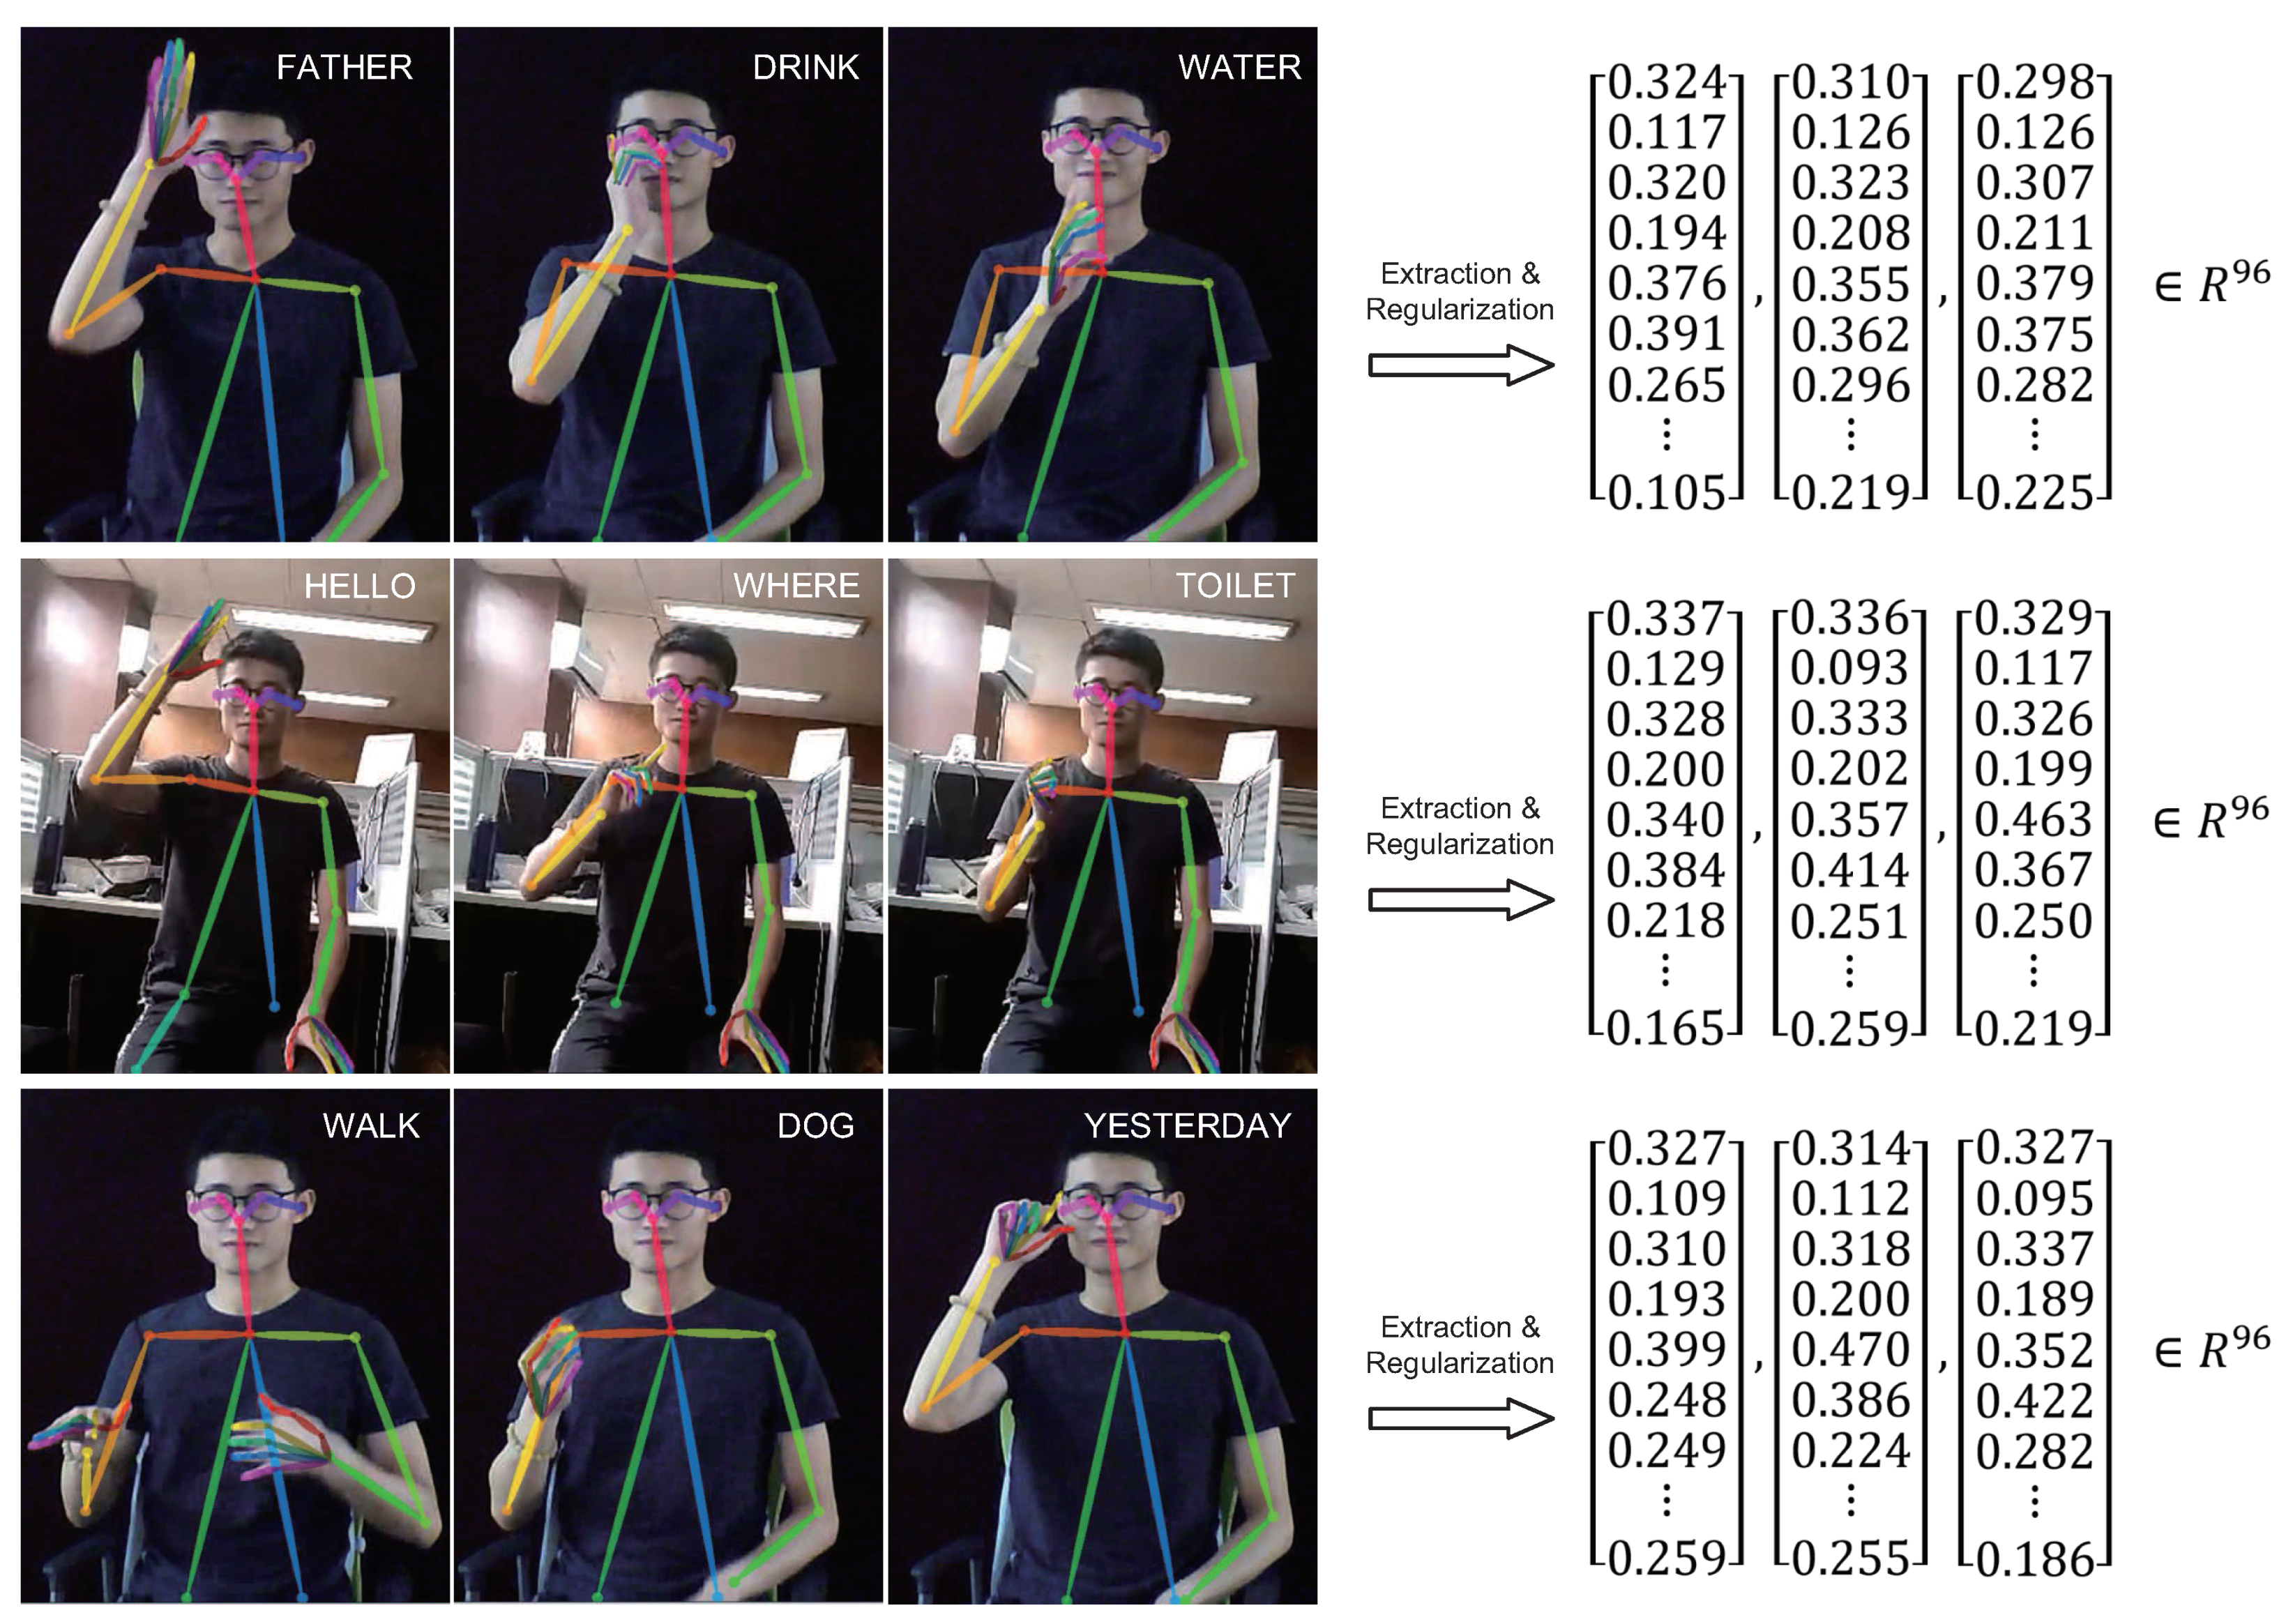
In the private testing dataset, 11 signs chosen to make up 6 daily words/sentences are illustrated in Table 3. We use a monocular camera to capture sign language videos of two people in two scenes: an office and a corridor with a black background. Six video clips are captured, containing 37 to 158 frames each. Figure 7 shows the visualized features and extracted vectors from the private testing dataset. All signs are picked from the 104 signs of the ASLLVD. The sign none, which has no meaning, is used to label the beginning and the end of a clip.
The deep forest and the SVM classifiers trained on the public ASLLVD with 104 signs are used in the test directly. A test clip is split into frames, and each frame is annotated by using these two classifiers. The results are handled based on the voting strategy. According to the expected number of signs, the corresponding top frequent signs are picked to combine the sentence. Table 4 shows the weighted results of each words. The top 5 weighted results are listed in the columns Prediction1, Prediction2, Prediction3, Prediction4, and Prediction5. The total column presents the number of frames for each sentence. The recognition numbers for each sign are weighted and listed in the brackets. Two widely used evaluation scores, precision of frames (PoF) and recall of signs (RoS), are employed to illustrate the results.
The PoF score is defined as
where , , and represent the number of correctly classified frames, the total number of frames, and the number of no-meaning none frames.
The RoS score is defined as
where represents the number of correctly recognized signs and represents the number of signs that should be recognized.
A high recognition rate for words with single symbol is shown in Table 4. For example, the word apple has an excellent recognition rate of 100% because we clip the video by reserving only the key frames from the whole video. For the word banana, the sign banana has 60 weighted frames, which is far more than that of the M3 sign again. After that, double-sign sentences can be recognized within a moderate recognition rate since some other signs are recognized by mistake. In the sentence drink-water, the sign drink scores 11 weighted frames, but the sign water only scores 4 weighted frames and the incorrect sign come and home score 4 and 3 weighted frames. A similar result appears in the sentence father-walk. In the triple sign sentences, since the transition frames between the key frames be a large proportion of the frames, the meaning of sentences might be confused. In the sentence he/llo-where-toilet, the core signs toilet and hello are correctly recognized, although some frames are wrongly recognized as home and finish. In next step, we will focus on this issue, which can be handled by neural language process models such as long short-term memory (LSTM) [35,36]. Overall, the correctly classified frames are dominant, and a promising performance is achieved in the isolated words. However, in terms of multi-word sentences, the desired signs sometimes might be missing or confused with other signs because the transition frames between two signs might be recognized incorrectly, and the ASLLVD dataset provides isolated signs for training. It is still not highly effective for multi-word sentences.
5. Conclusions
In this paper, we propose a monocular vision-based sign language recognition system that is flexible and accurate for translating visual gesture semantic information into words. The state-of-the-art human keypoint feature extraction system, OpenPose, is employed to accurately provide the keypoint position of the human skeleton from a single image sequence. Then, we further propose a feature regularization to normalize various features and use a deep forest-based classifier to train our model on a small dataset, including the public ASLLVD and our private testing set. It has proven to achieve a high generalization performance on varied datasets and be effective in real-world applications.
In the development of this system, some improvements have been identified that can be made in future. The voting strategy is not quite robust for complex semantic sentences. Considering the real-time performance, we do not employ a network with memory unit such as LSTM and gated recurrent unit (GRU) [37,38]. These methods have been proven effective in the field of natural language processing and are possible solutions to improve the performance of our sign language recognition system. Moreover, future investigation of other sign languages like Chinese is necessary to gain more accurate representation, and thus, various datasets from more participants are important to extend and validate our proposal.
Author Contributions
Conceptualization, X.L.; methodology, Q.X. and X.L.; software, Q.X.; validation, Q.X. and X.L.; formal analysis, Q.X.; investigation, X.L.; resources, Q.X. and X.L.; data curation, Q.X.; writing—original draft preparation, Q.X.; writing—review and editing, X.L., D.W., and W.Z.; visualization, Q.X.; supervision, X.L. and W.Z.; project administration, X.L. and D.W.; funding acquisition, X.L. and D.W.
Funding
This work is supported by the Natural Science Foundation of Jiangsu Province under Grants No. BK20160700 and BK20170681, and the Fundamental Research Funds for the Central Universities No. 2242018K40067 and 2242019K40039.
Conflicts of Interest
The authors declare no conflict of interest. The funders had no role in the design of the study; in the collection, analyses, or interpretation of data; in the writing of the manuscript, or in the decision to publish the results.
References
- Suharjito; Anderson, R.; Wiryana, F.; Ariesta, M.C.; Kusuma, G.P. Sign Language Recognition Application Systems for Deaf-Mute People: A Review Based on Input-Process-Output. Procedia Comput. Sci. 2017, 116, 441–448. [Google Scholar] [CrossRef]
- Al-Shamayleh, A.S.; Ahmad, R.; Abushariah, M.A.M.; Alam, K.A.; Jomhari, N. A systematic literature review on vision based gesture recognition techniques. Multimedia Tools Appl. 2018, 77, 28121–28184. [Google Scholar] [CrossRef]
- Kumar, P.; Gauba, H.; Pratim, R.P.; Prosad, D.D. A multimodal framework for sensor based sign language recognition. Neurocomputing 2017, 259, 21–38. [Google Scholar] [CrossRef]
- Ahmed, M.A.; Zaidan, B.B.; Zaidan, A.A.; Salih, M.M.; Bin Lakulu, M.M. A Review on Systems-Based Sensory Gloves for Sign Language Recognition State of the Art between 2007 and 2017. Sensors 2018, 18, 2208. [Google Scholar] [CrossRef] [PubMed]
- Wei, S.; Chen, X.; Yang, X.; Cao, S.; Zhang, X. A Component-Based Vocabulary-Extensible Sign Language Gesture Recognition Framework. Sensors 2016, 16, 556. [Google Scholar] [CrossRef]
- Yang, X.; Chen, X.; Cao, X.; Wei, S.; Zhang, X. Chinese Sign Language Recognition Based on an Optimized Tree-Structure Framework. J. Biomed. Health Informat. 2017, 21, 994–1004. [Google Scholar] [CrossRef]
- Su, R.; Chen, X.; Cao, S.; Zhang, X. Random Forest-Based Recognition of Isolated Sign Language Subwords Using Data from Accelerometers and Surface Electromyographic Sensors. Sensors 2016, 16, 100. [Google Scholar] [CrossRef] [PubMed]
- Chana, C.; Jakkree, S. Hand Gesture Recognition for Thai Sign Language in Complex Background Using Fusion of Depth and Color Video. Procedia Comput. Sci. 2016, 86, 257–260. [Google Scholar] [CrossRef] [Green Version]
- Yang, H. Sign Language Recognition with the Kinect Sensor Based on Conditional Random Fields. Sensors 2015, 15, 135–147. [Google Scholar] [CrossRef]
- Cheng, J.; Chen, X.; Liu, A.; Peng, H. A Novel Phonology- and Radical-Coded Chinese Sign Language Recognition Framework Using Accelerometer and Surface Electromyography. Sensors 2015, 15, 23303–23324. [Google Scholar] [CrossRef] [PubMed]
- Masoud, Z.; Manoochehr, N. An algorithm on sign words extraction and recognition of continuous Persian sign language based on motion and shape features of hands. Pattern Anal. Appl. 2018, 21, 323–335. [Google Scholar] [CrossRef]
- Huang, S.; Mao, C.; Tao, J.; Ye, Z. A Novel Chinese Sign Language Recognition Method Based on Keyframe-Centered Clips. Signal Process. Lett. 2018, 25, 442–446. [Google Scholar] [CrossRef]
- Elakkiya, R.; Selvamani, K. Extricating Manual and Non-Manual Features for Subunit Level Medical Sign Modelling in Automatic Sign Language Classification and Recognition. J. Med. Syst. 2017, 41, 175. [Google Scholar] [CrossRef]
- Kumar, P.; Roy, P.P.; Dogra, D.P. Independent Bayesian classifier combination based sign language recognition using facial expression. Inf. Sci. 2018, 428, 30–48. [Google Scholar] [CrossRef]
- Yang, W.; Tao, J.; Ye, Z. Continuous sign language recognition using level building based on fast hidden Markov model. Pattern Recognit. Lett. 2016, 78, 28–35. [Google Scholar] [CrossRef]
- Kumar, E.K.; Kishore, P.V.V.; Sastry, A.S.C.S.; Kumar, M.T.K.; Kumar, D.A. Training CNNs for 3-D Sign Language Recognition With Color Texture Coded Joint Angular Displacement Maps. Signal Process. Lett. 2018, 25, 645–649. [Google Scholar] [CrossRef]
- Zare, A.A.; Zahiri, S.H. Recognition of a real-time signer-independent static Farsi sign language based on fourier coefficients amplitude. Int. J. Mach. Learn. Cybern. 2018, 9, 727–741. [Google Scholar] [CrossRef]
- OpenPose: Real-Time Multi-Person Keypoint Detection Library for Body, Face, Hands, and Foot Estimation. Available online: https://github.com/CMU-Perceptual-Computing-Lab/openpose (accessed on 21 November 2018).
- Zhou, Z.; Feng, J. Deep forest: Towards an alternative to deep neural networks. In Proceedings of the 26th International Joint Conference on Artificial Intelligence, Melbourne, Australia, 19–25 August 2017; pp. 3553–3559. [Google Scholar]
- Reshna, S.; Jayaraju, M. Spotting and recognition of hand gesture for Indian sign language recognition system with skin segmentation and SVM. In Proceedings of the International Conference on Wireless Communications, Signal Processing and Networking (WiSPNET), Chennai, India, 22–24 March 2017; pp. 386–390. [Google Scholar]
- Ibrahim, N.B.; Selim, M.M.; Zayed, H.H. An Automatic Arabic Sign Language Recognition System (ArSLRS). Comput. Inf. Sci. 2018, 30, 470–477. [Google Scholar] [CrossRef]
- Wang, H.; Chai, X.; Chen, X. Sparse Observation (SO) Alignment for Sign Language Recognition. Neurocomputing 2016, 175, 674–685. [Google Scholar] [CrossRef]
- Dong, C.; Leu, M.; Yin, Z. American sign language alphabet recognition using microsoft kinect. In Proceedings of the 2015 IEEE Conference on Computer Vision and Pattern Recognition Workshops (CVPRW), Boston, MA, USA, 7–12 June 2015; pp. 44–52. [Google Scholar]
- Almeida, S.G.M.; Guimaraes, F.G.; Ramirez, J.A. Feature extraction in Brazilian Sign Language Recognition based on phonological structure and using RGB-D sensors. Expert Syst. Appl. 2014, 41, 7259–7271. [Google Scholar] [CrossRef]
- Chevtecgebko, S.F.; Vale, R.F.; Macario, V. Multi-objective optimization for hand posture recognition. Expert Syst. Appl. 2017, 92, 170–181. [Google Scholar] [CrossRef]
- Lim, K.M.; Tan, A.W.C.; Tan, S.C. Block-based histogram of optical flow for isolated sign language recognition. J. Vis. Commun. Image Represent. 2016, 40, 538–545. [Google Scholar] [CrossRef]
- Özbay, S.; Safar, M. Real-time sign languages recognition based on hausdorff distance, Hu invariants and neural network. In Proceedings of the 2017 International Conference on Engineering and Technology (ICET), Antalya, Turkey, 21–23 August 2017; pp. 1–8. [Google Scholar]
- Kumar, D.A.; Sastry, A.S.C.S.; Kishore, P.V.V.; Kumar, E.K. Indian sign language recognition using graph matching on 3D motion captured signs. Multimedia Tools Appl. 2018, 77, 32063–32091. [Google Scholar] [CrossRef]
- Kishore, P.V.V.; Kumar, D.A.; Sastry, A.S.C.S.; Kumar, E.K. Motionlets Matching with Adaptive Kernels for 3-D Indian Sign Language Recognition. IEEE Sens. J. 2018, 18, 3327–3337. [Google Scholar] [CrossRef]
- Tang, J.; Cheng, H.; Zhao, Y.; Guo, H. Structured dynamic time warping for continuous hand trajectory gesture recognition. Pattern Recognit. 2018, 80, 21–31. [Google Scholar] [CrossRef]
- Kumar, P.; Saini, R.; Roy, P.P.; Dogra, D.P. A position and rotation invariant framework for sign language recognition (SLR) using Kinect. Multimedia Tools Appl. 2018, 77, 8823–8846. [Google Scholar] [CrossRef]
- Naresh, K. Sign language recognition for hearing impaired people based on hands symbols classification. In Proceedings of the 2017 International Conference on Computing, Communication and Automation (ICCCA), Greater Noida, India, 5–6 May 2017; pp. 244–249. [Google Scholar]
- Ji, Y.; Kim, S.; Kim, Y.; Lee, K. Human-like sign-language learning method using deep learning. ETRI J. 2018, 40, 435–445. [Google Scholar] [CrossRef]
- Liu, F.T.; Ting, K.M.; Yu, Y.; Zhou, Z.H. Spectrum of variable-random trees. J. Artif. Intell. Res. 2008, 32, 355–384. [Google Scholar] [CrossRef]
- Sundermeyer, M.; Ney, H.; Schlüter, R. From feedforward to recurrent LSTM neural networks for language modeling. IEEE Trans. Audio Speech Lang. Process. 2015, 23, 517–529. [Google Scholar] [CrossRef]
- Rao, G.; Huang, W.; Feng, Z.; Cong, Q. LSTM with sentence representations for document-level sentiment classification. Neurocomputing 2018, 308, 49–57. [Google Scholar] [CrossRef]
- Mohanmed, M. Parsimonious memory unit for recurrent neural networks with application to natural language processing. Neurocomputing 2018, 314, 48–64. [Google Scholar] [CrossRef]
- Tan, Z.; Su, J.; Wang, B.; Chen, Y.; Shi, X. Lattice-to-sequence attentional Neural Machine Translation models. Neurocomputing 2018, 284, 138–147. [Google Scholar] [CrossRef]
Figure 1.
48 markers of hand and arm joints with one root joint.

Figure 2.
Flowchart of our sign language recognition (SLR) approach.
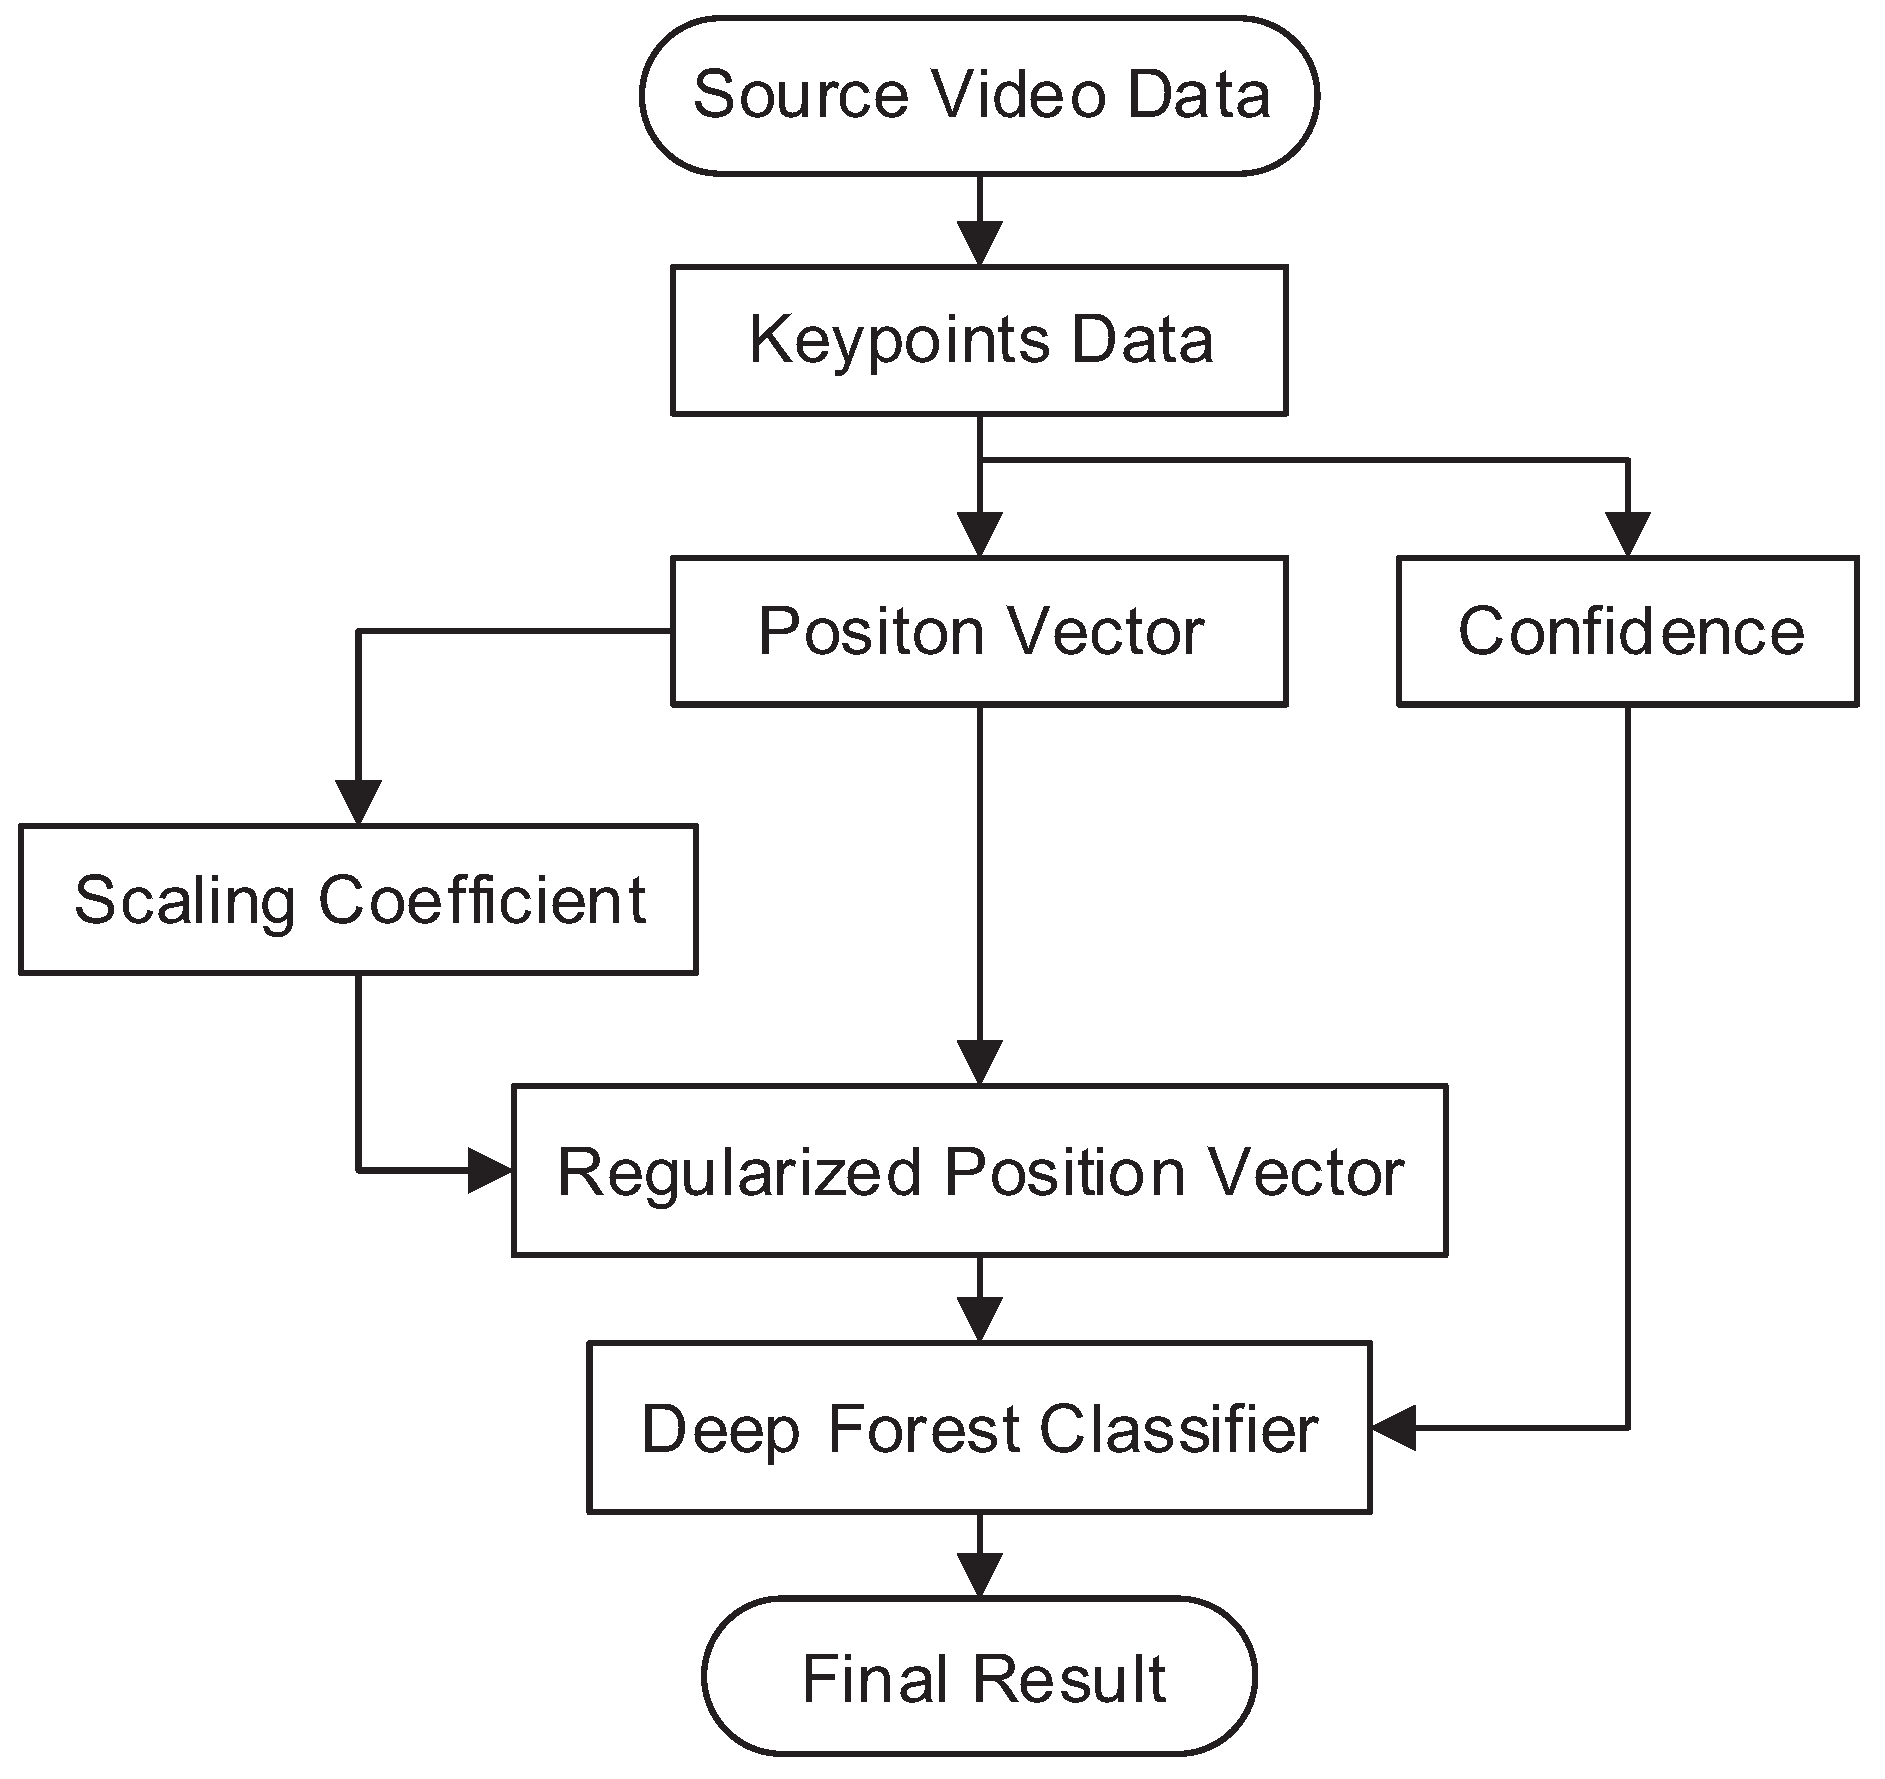
Figure 3.
Deep forest-based classifier.

Figure 4.
Visualized features and extracted vectors of sign recognition from the American Sign Language Lexicon Video Dataset (ASLLVD).
Figure 4.
Visualized features and extracted vectors of sign recognition from the American Sign Language Lexicon Video Dataset (ASLLVD).
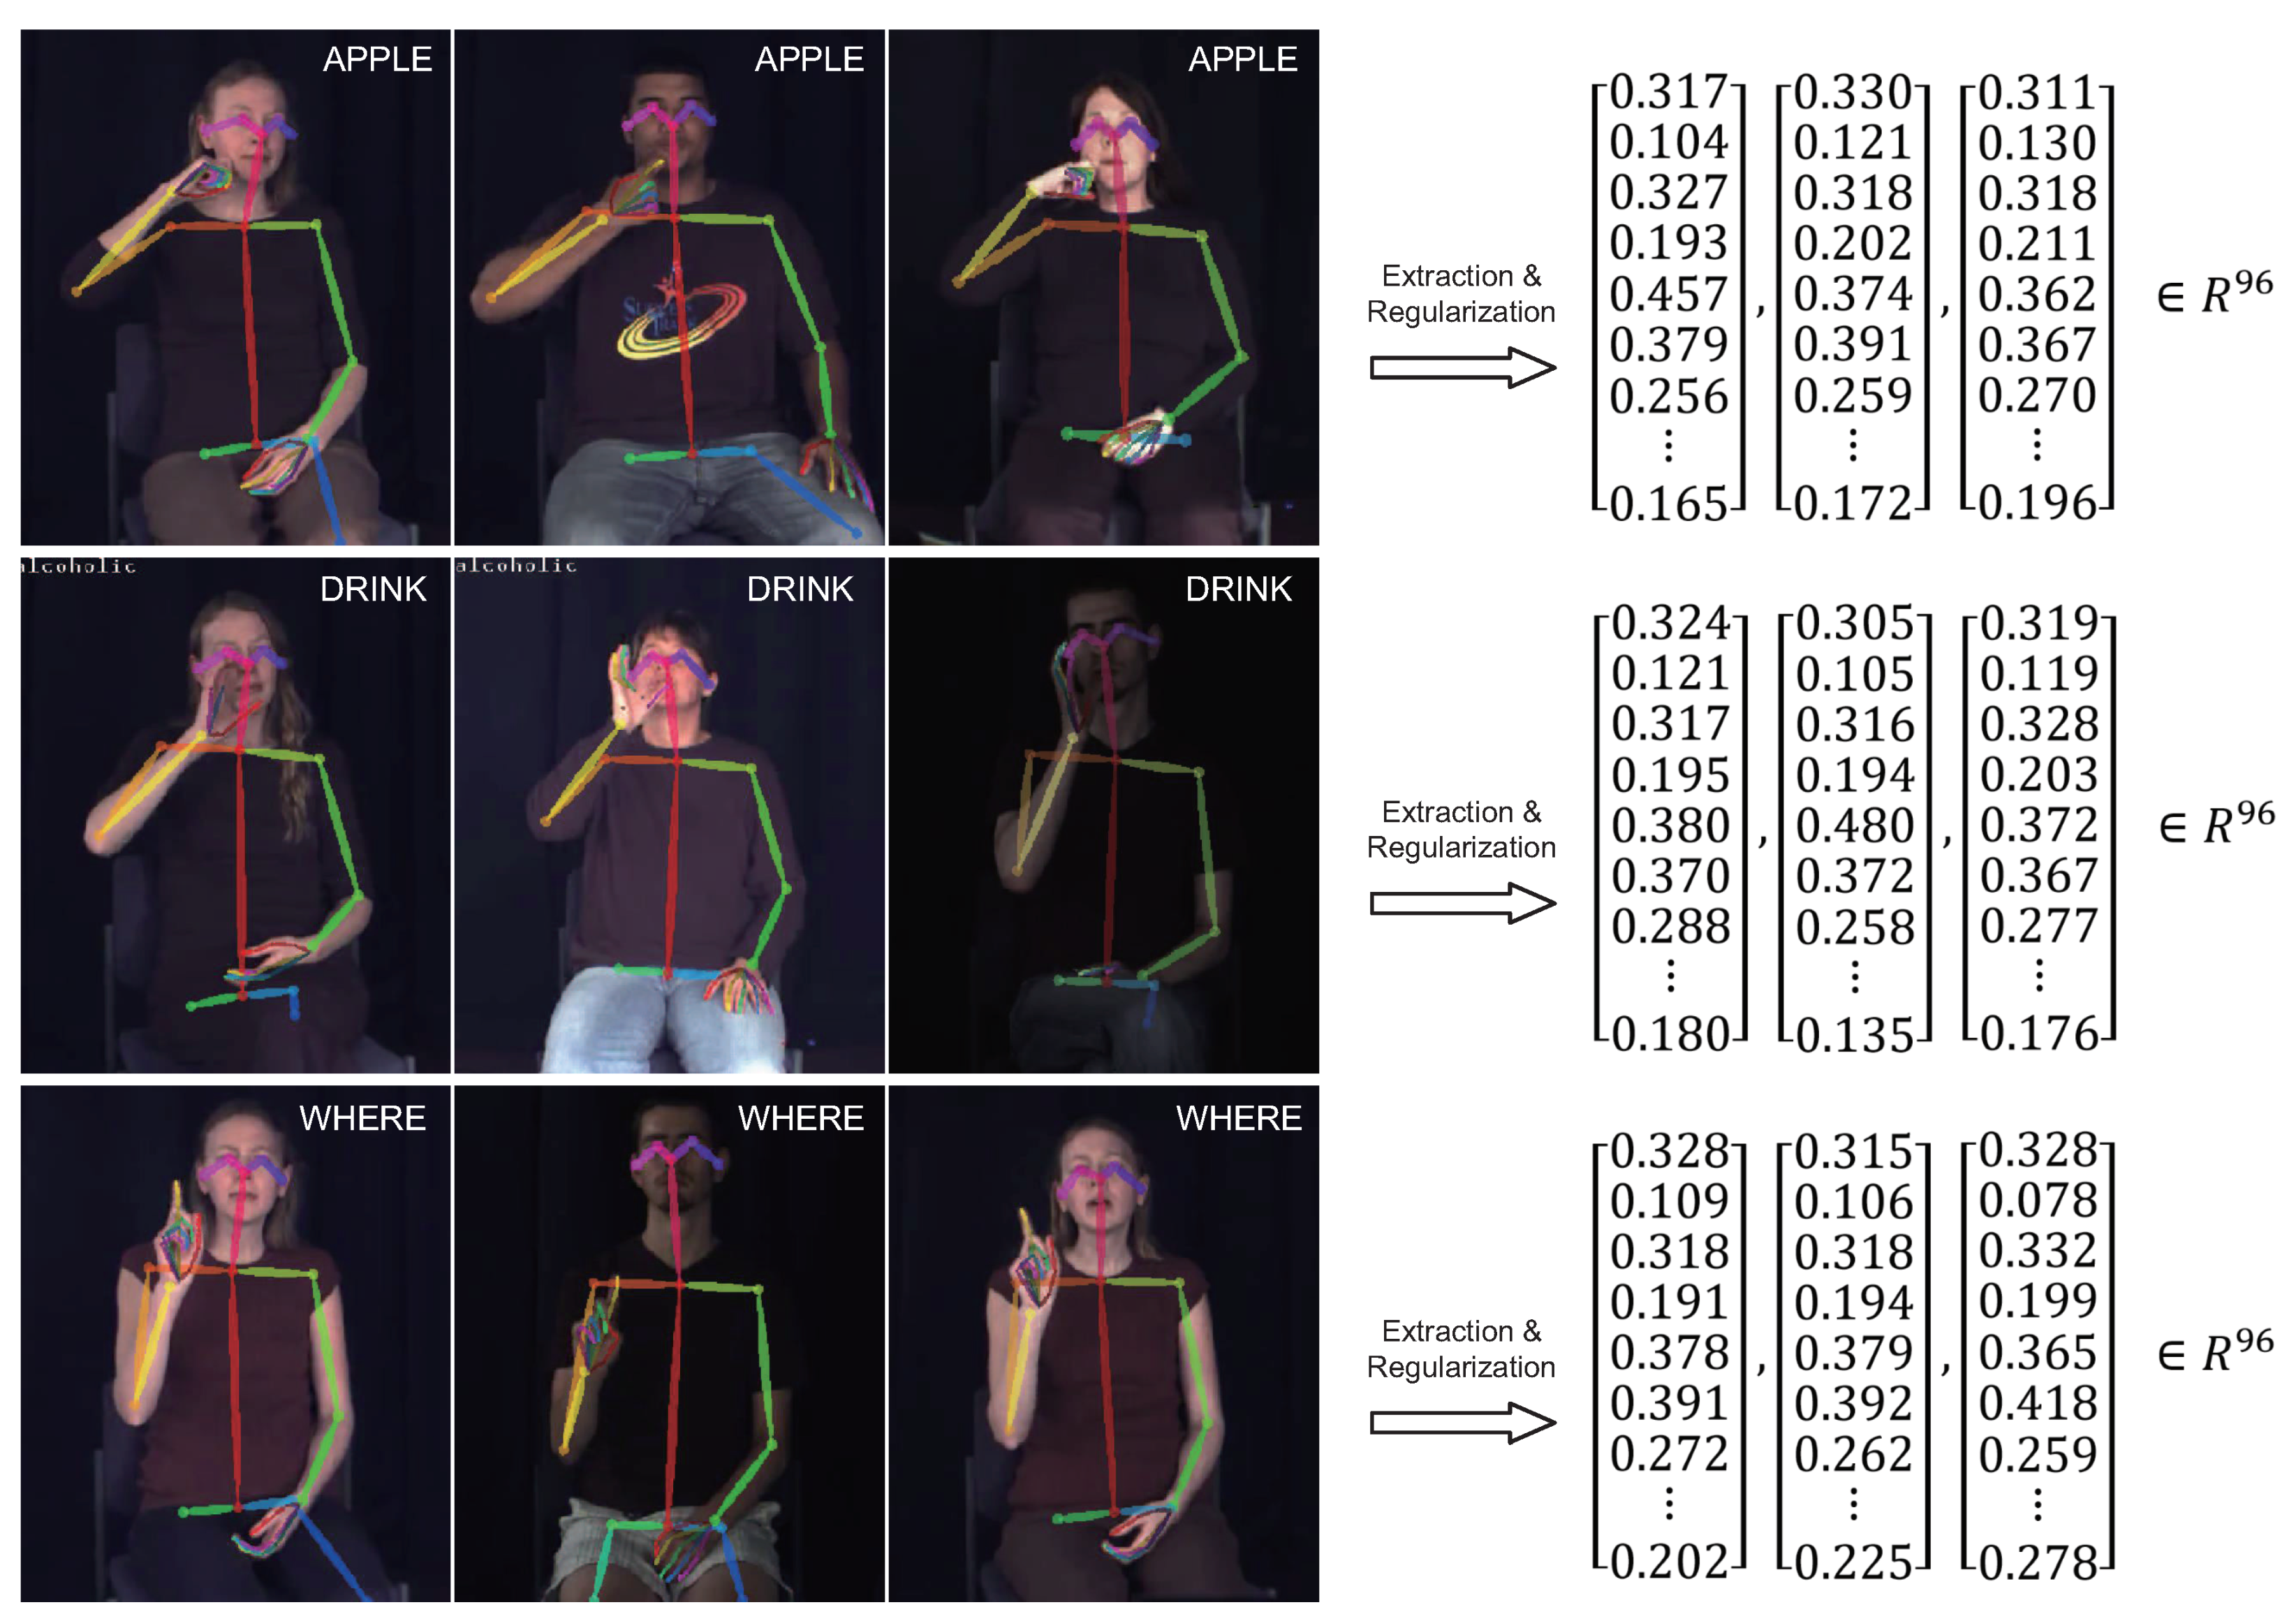
Figure 5.
Performance of the support vector machine (SVM) classifier and the deep forest classifier.
Figure 5.
Performance of the support vector machine (SVM) classifier and the deep forest classifier.

Figure 6.
Boxplot comparison between four classifiers.
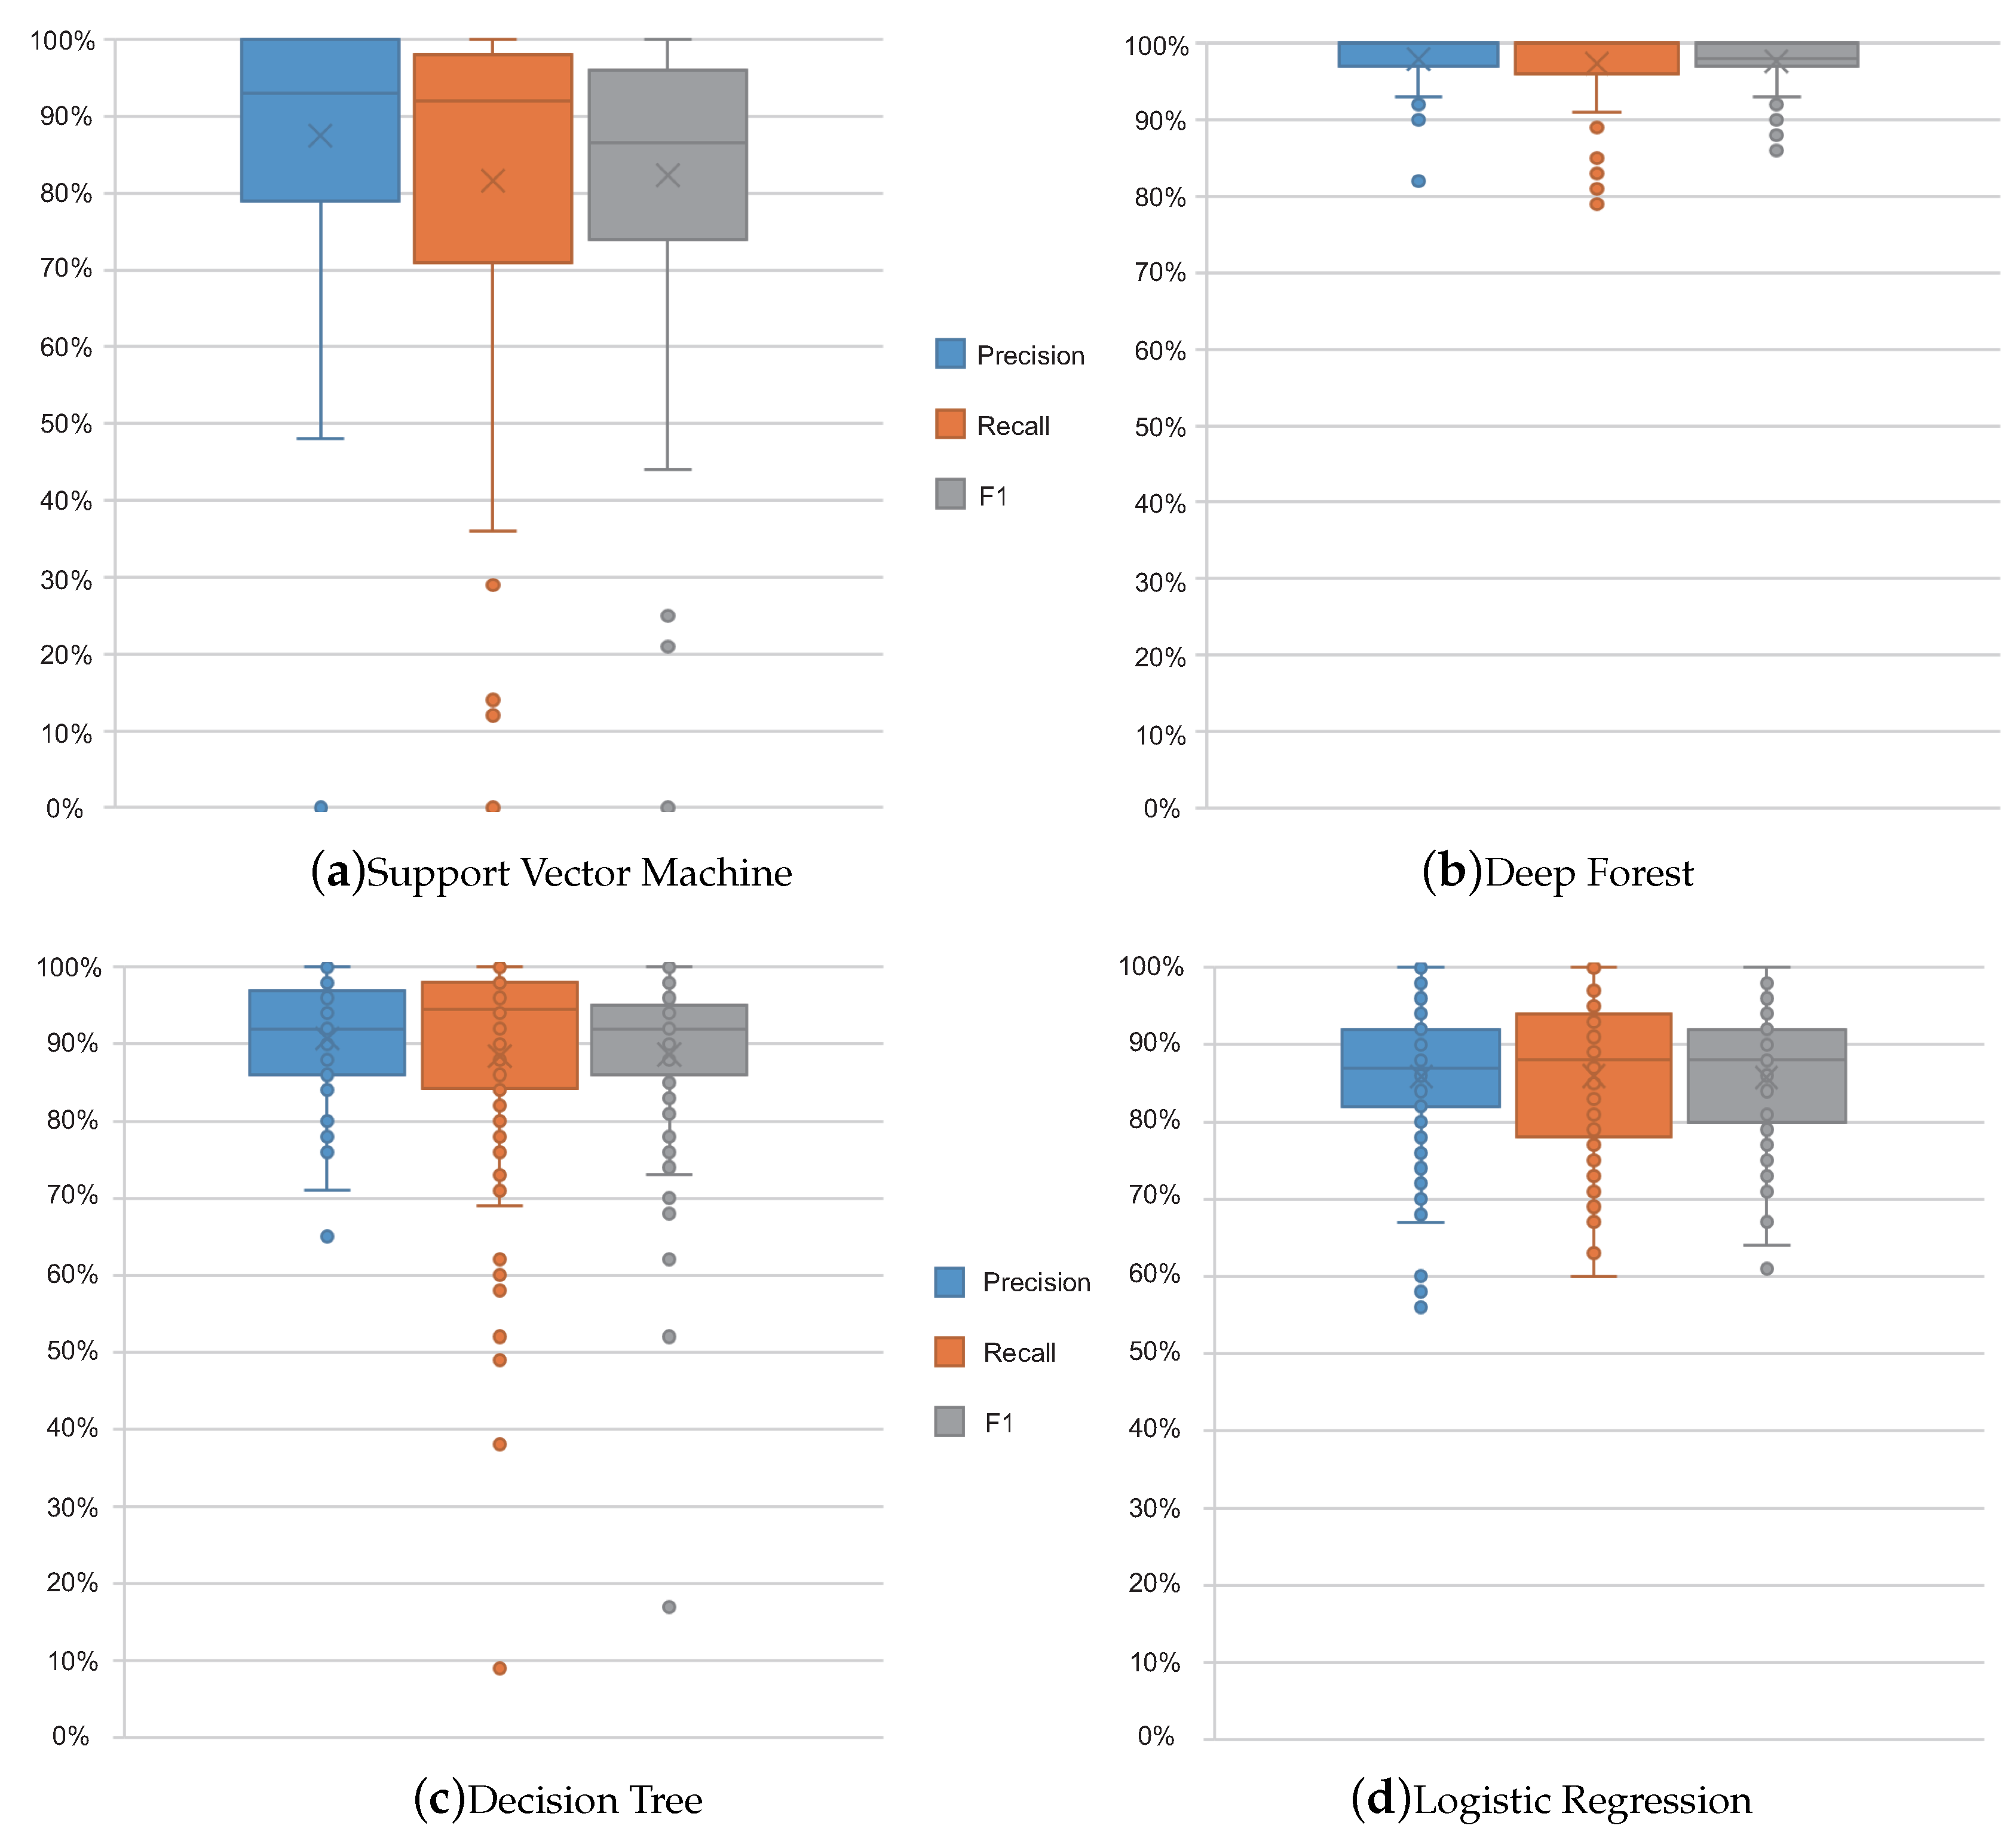
Figure 7.
Visualized features and extracted vectors from our private testing dataset.

Table 1.
Public sign language datasets.
| Index | Dataset | Country | Number of Signs | Sample Number |
|---|---|---|---|---|
| 1 | DGS Kinect 40 | Germany | 40 | 3000 |
| 2 | SIGNUM | Germany | 25 | 33,210 |
| 3 | Boston ASLLVD | USA | 3300 | 9800 |
| 4 | ASL-LEX | USA | 1000 | 1000 |
| 5 | LSA64 signs | Argentina | 64 | 3200 |
Table 2.
Performance of SVM and deep forest classifiers for the top 20 signs.
| SVM | Deep Forest | ||||||||
|---|---|---|---|---|---|---|---|---|---|
| Sign | Number | Precision | Recall | F1 | Sign | Number | Precision | Recall | F1 |
| None | 396 | 1.00 | 1.00 | 1.00 | None | 396 | 1.00 | 1.00 | 1.00 |
| Same | 124 | 0.91 | 0.94 | 0.93 | Same | 124 | 0.98 | 0.99 | 0.99 |
| Walk | 109 | 0.77 | 0.95 | 0.85 | Walk | 109 | 0.93 | 0.98 | 0.96 |
| Man | 108 | 0.54 | 0.72 | 0.62 | Man | 108 | 0.95 | 0.89 | 0.92 |
| Happy | 107 | 0.90 | 0.97 | 0.94 | Happy | 107 | 0.98 | 0.99 | 0.99 |
| Excuse | 102 | 1.00 | 1.00 | 1.00 | Excuse | 102 | 0.96 | 0.98 | 0.97 |
| Run | 97 | 0.97 | 0.99 | 0.98 | Run | 97 | 0.96 | 0.99 | 0.97 |
| Workout | 94 | 0.95 | 1.00 | 0.97 | Workout | 94 | 1.00 | 1.00 | 1.00 |
| Again | 89 | 0.92 | 0.93 | 0.93 | Again | 89 | 0.92 | 0.93 | 0.93 |
| Live | 84 | 0.93 | 0.92 | 0.92 | Live | 84 | 1.00 | 0.98 | 0.99 |
| Look | 80 | 0.66 | 0.97 | 0.78 | Look | 80 | 0.94 | 1.00 | 0.97 |
| Hamburger | 79 | 0.90 | 0.94 | 0.92 | Hamburger | 79 | 0.82 | 0.95 | 0.88 |
| Hurt | 75 | 0.93 | 0.99 | 0.95 | Hurt | 75 | 0.99 | 1.00 | 0.99 |
| Bird | 74 | 0.86 | 0.99 | 0.92 | Bird | 74 | 1.00 | 0.96 | 0.98 |
| Cat | 73 | 0.87 | 0.90 | 0.89 | Cat | 73 | 1.00 | 0.96 | 0.98 |
| Old | 66 | 0.79 | 0.58 | 0.67 | Old | 66 | 0.98 | 0.98 | 0.98 |
| Cold | 65 | 0.93 | 0.98 | 0.96 | Cold | 65 | 0.97 | 0.98 | 0.98 |
| Banana | 64 | 1.00 | 1.00 | 1.00 | Banana | 64 | 0.97 | 1.00 | 0.98 |
| Church | 63 | 1.00 | 0.98 | 0.99 | Church | 63 | 0.98 | 0.98 | 0.98 |
| Sleep | 63 | 0.73 | 0.92 | 0.82 | Sleep | 63 | 1.00 | 1.00 | 1.00 |
| … | … | … | … | … | … | … | … | … | … |
| Average | - | 0.88 | 0.87 | 0.86 | Average | - | 0.98 | 0.98 | 0.98 |
| Total | 4877 | - | - | - | Total | 4877 | - | - | - |
Table 3.
Private testing set.
| Index | Signs | Word/Sentence |
|---|---|---|
| 1 | Apple | Apple |
| 2 | Banana | Banana |
| 3 | Drink | Drink-Water |
| 4 | Water | |
| 5 | Father | Father-Walk |
| 6 | Walk | |
| 7 | Hello | |
| 8 | Where | Hello-Where-Toilet |
| 9 | Toilet | |
| 10 | Dog | Walk-Dog-Yesterday |
| 11 | Yesterday |
Table 4.
Results for the testing data.
| Word/Sentence | Prediction1 | Prediction2 | Prediction3 | Prediction4 | Prediction5 | Total | Classifier | PoF | RoS |
|---|---|---|---|---|---|---|---|---|---|
| Apple | Apple(40) | - | - | - | - | 40 | Deep Forest | 1.00 | 1/1 |
| Apple(34) | Hello(6) | - | - | - | SVM | 0.85 | 1/1 | ||
| Banana | Banana(60) | None(25) | Again(16) | Come(14) | Walk(7) | 158 | Deep Forest | 0.45 | 1/1 |
| Banana(63) | None(25) | Hamburger(19) | Friend(16) | Come(15) | SVM | 0.47 | 1/1 | ||
| Drink-Water | Drink(11) | None(6) | Water(4) | Come(4) | Home(3) | 37 | Deep Forest | 0.48 | 1/2 |
| Drink(9) | Eat(8) | None(4) | Come(4) | Water(3) | SVM | 0.27 | 1/2 | ||
| Father-Walk | Walk(11) | None(8) | Father(4) | Again(4) | Egg(4) | 50 | Deep Forest | 0.36 | 1/2 |
| Walk(10) | None(8) | Know(8) | Hello(6) | Father(5) | SVM | 0.24 | 1/2 | ||
| Hello-Where-Toilet | Toilet(36) | Home(28) | Hello(19) | Finish(15) | Drink(8) | 124 | Deep Forest | 0.44 | 2/3 |
| Toilet(61) | Boy(18) | Man(10) | Hearing(7) | Hello(7) | SVM | 0.49 | 1/3 | ||
| Walk-Dog-Yesterday | Walk(14) | Milk(9) | Dog(8) | Hello(6) | Other(4) | 53 | Deep Forest | 0.40 | 2/3 |
| Walk(12) | Egg(8) | Milk(8) | Dog(7) | Hello(6) | SVM | 0.23 | 1/3 |
© 2019 by the authors. Licensee MDPI, Basel, Switzerland. This article is an open access article distributed under the terms and conditions of the Creative Commons Attribution (CC BY) license (http://creativecommons.org/licenses/by/4.0/).
Share and Cite
MDPI and ACS Style
Xue, Q.; Li, X.; Wang, D.; Zhang, W. Deep Forest-Based Monocular Visual Sign Language Recognition. Appl. Sci. 2019, 9, 1945. https://doi.org/10.3390/app9091945
AMA Style
Xue Q, Li X, Wang D, Zhang W. Deep Forest-Based Monocular Visual Sign Language Recognition. Applied Sciences. 2019; 9(9):1945. https://doi.org/10.3390/app9091945
Chicago/Turabian StyleXue, Qifan, Xuanpeng Li, Dong Wang, and Weigong Zhang. 2019. "Deep Forest-Based Monocular Visual Sign Language Recognition" Applied Sciences 9, no. 9: 1945. https://doi.org/10.3390/app9091945
Note that from the first issue of 2016, this journal uses article numbers instead of page numbers. See further details here.