
A Synchrophasor Based Optimal Voltage Control Scheme with Successive Voltage Stability Margin Improvement


Abstract
:1. Introduction
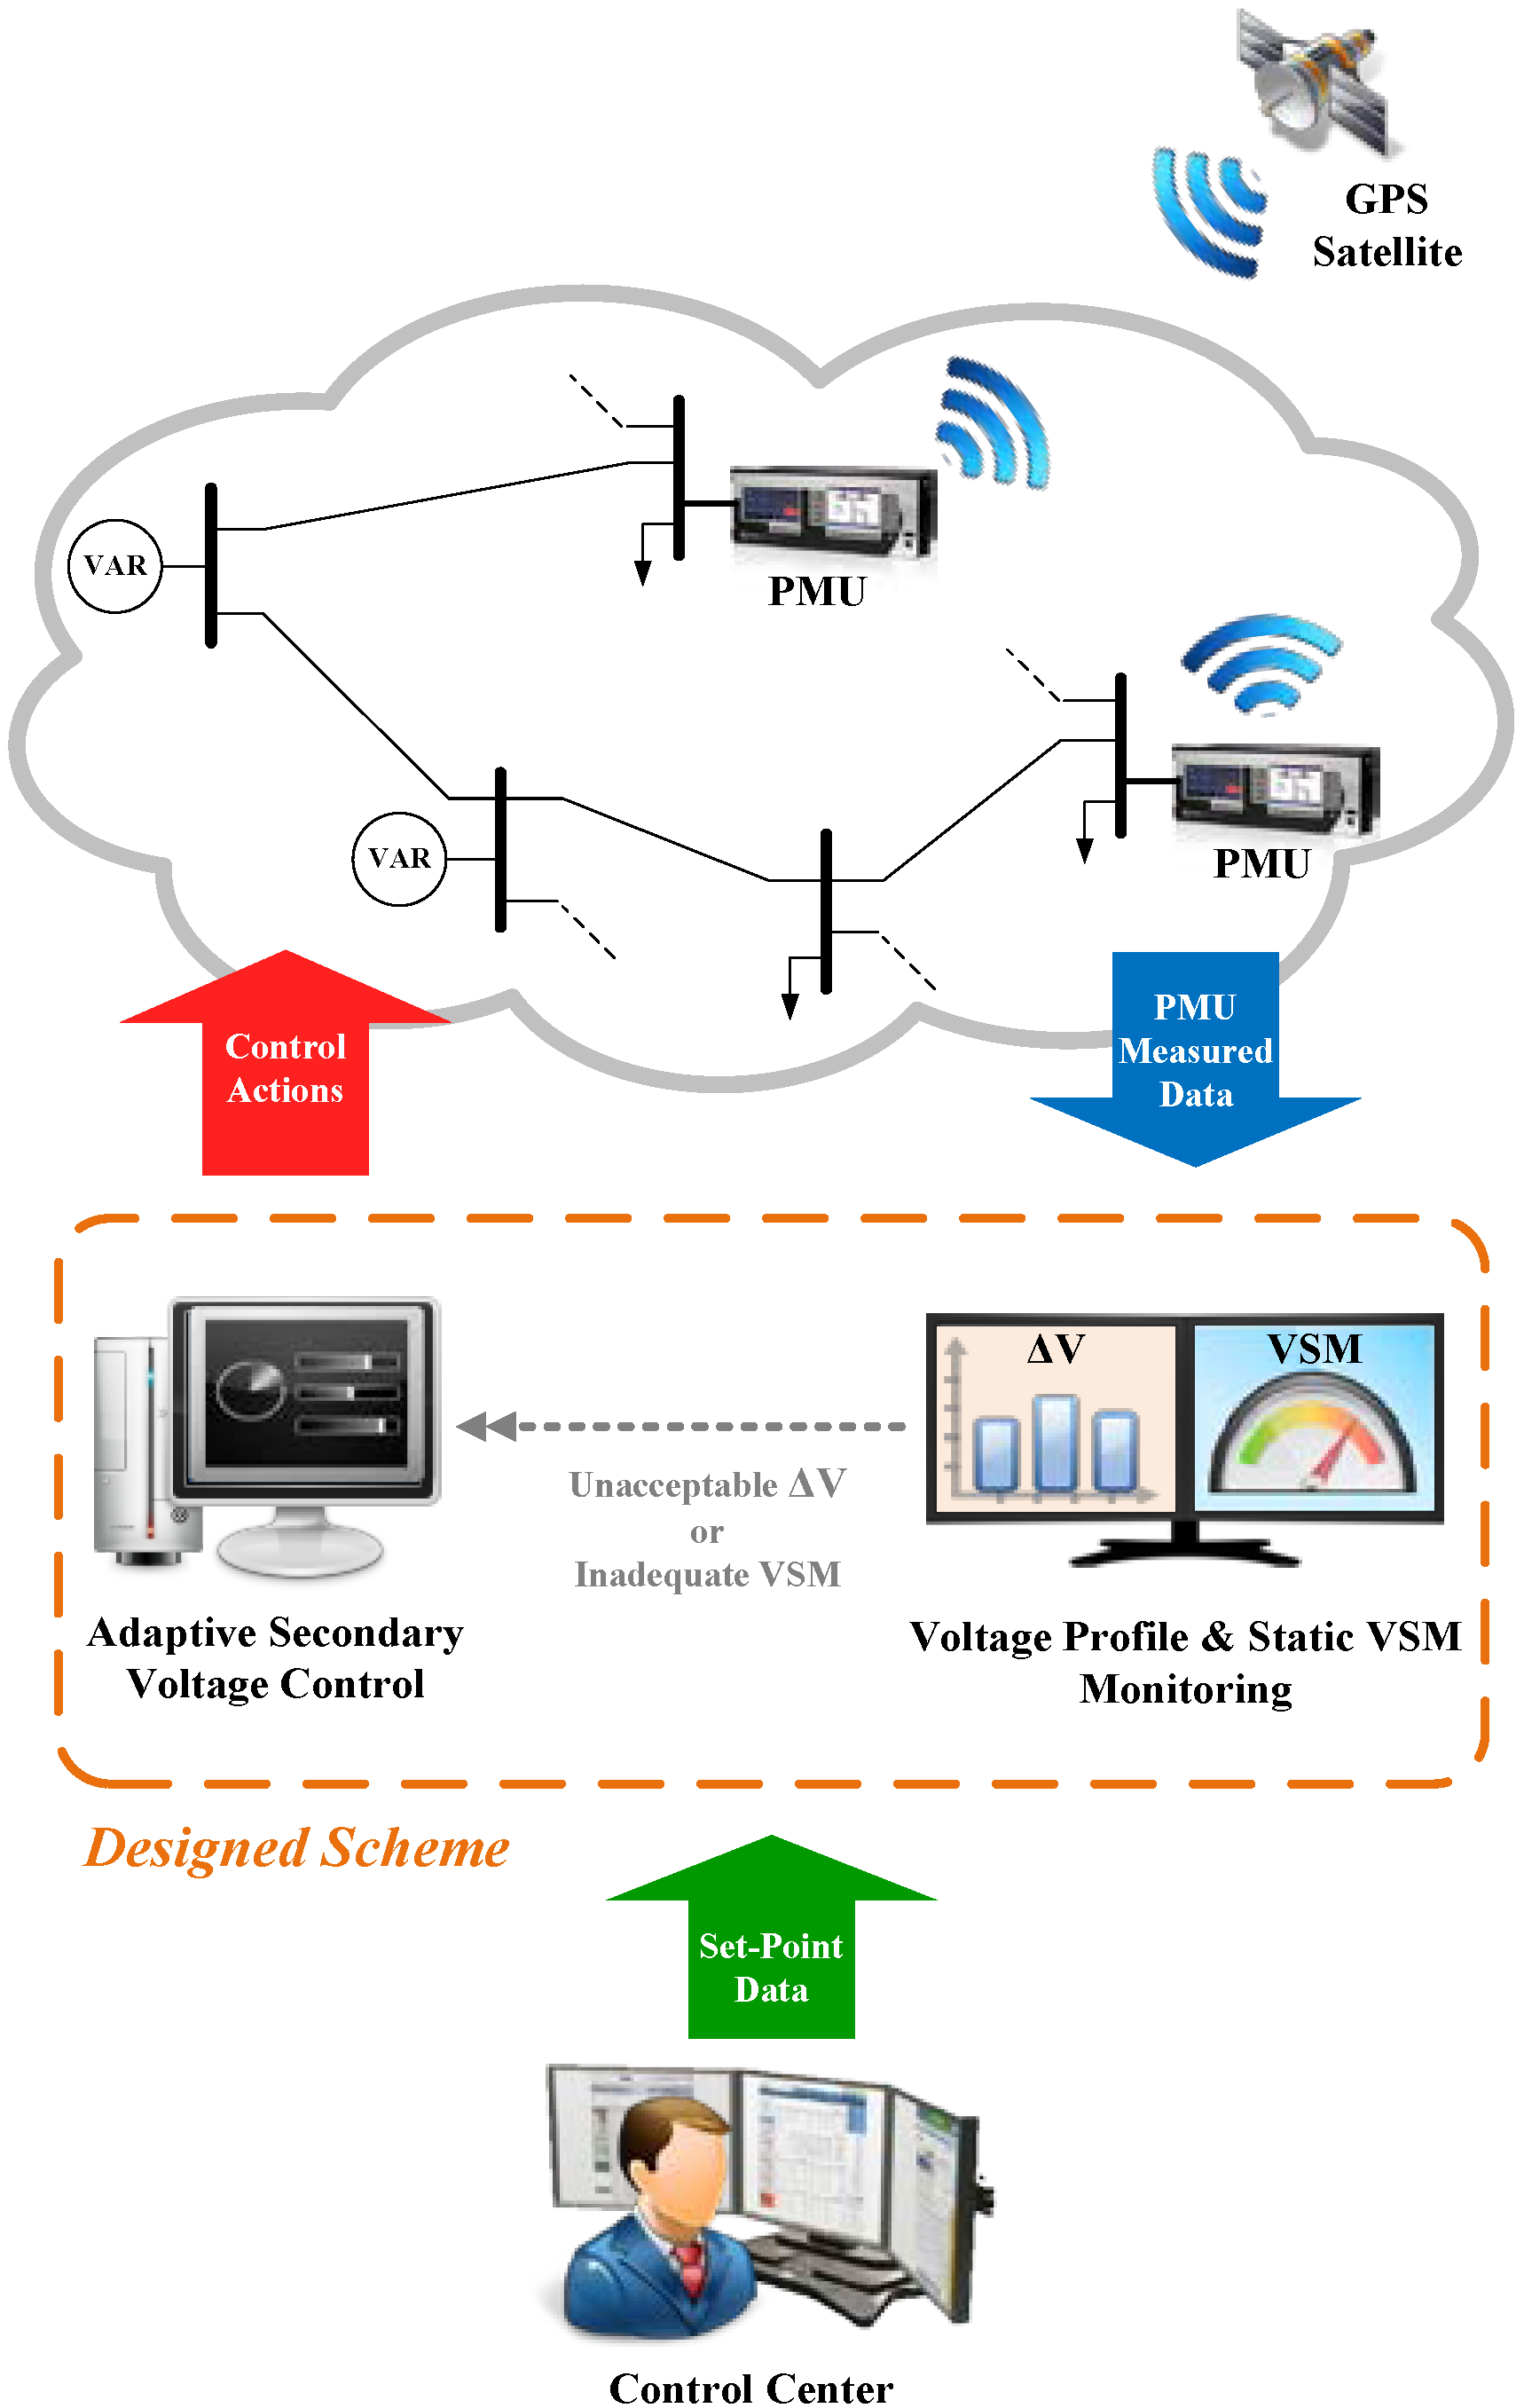
2. Overview of the Proposed Scheme

- (1)
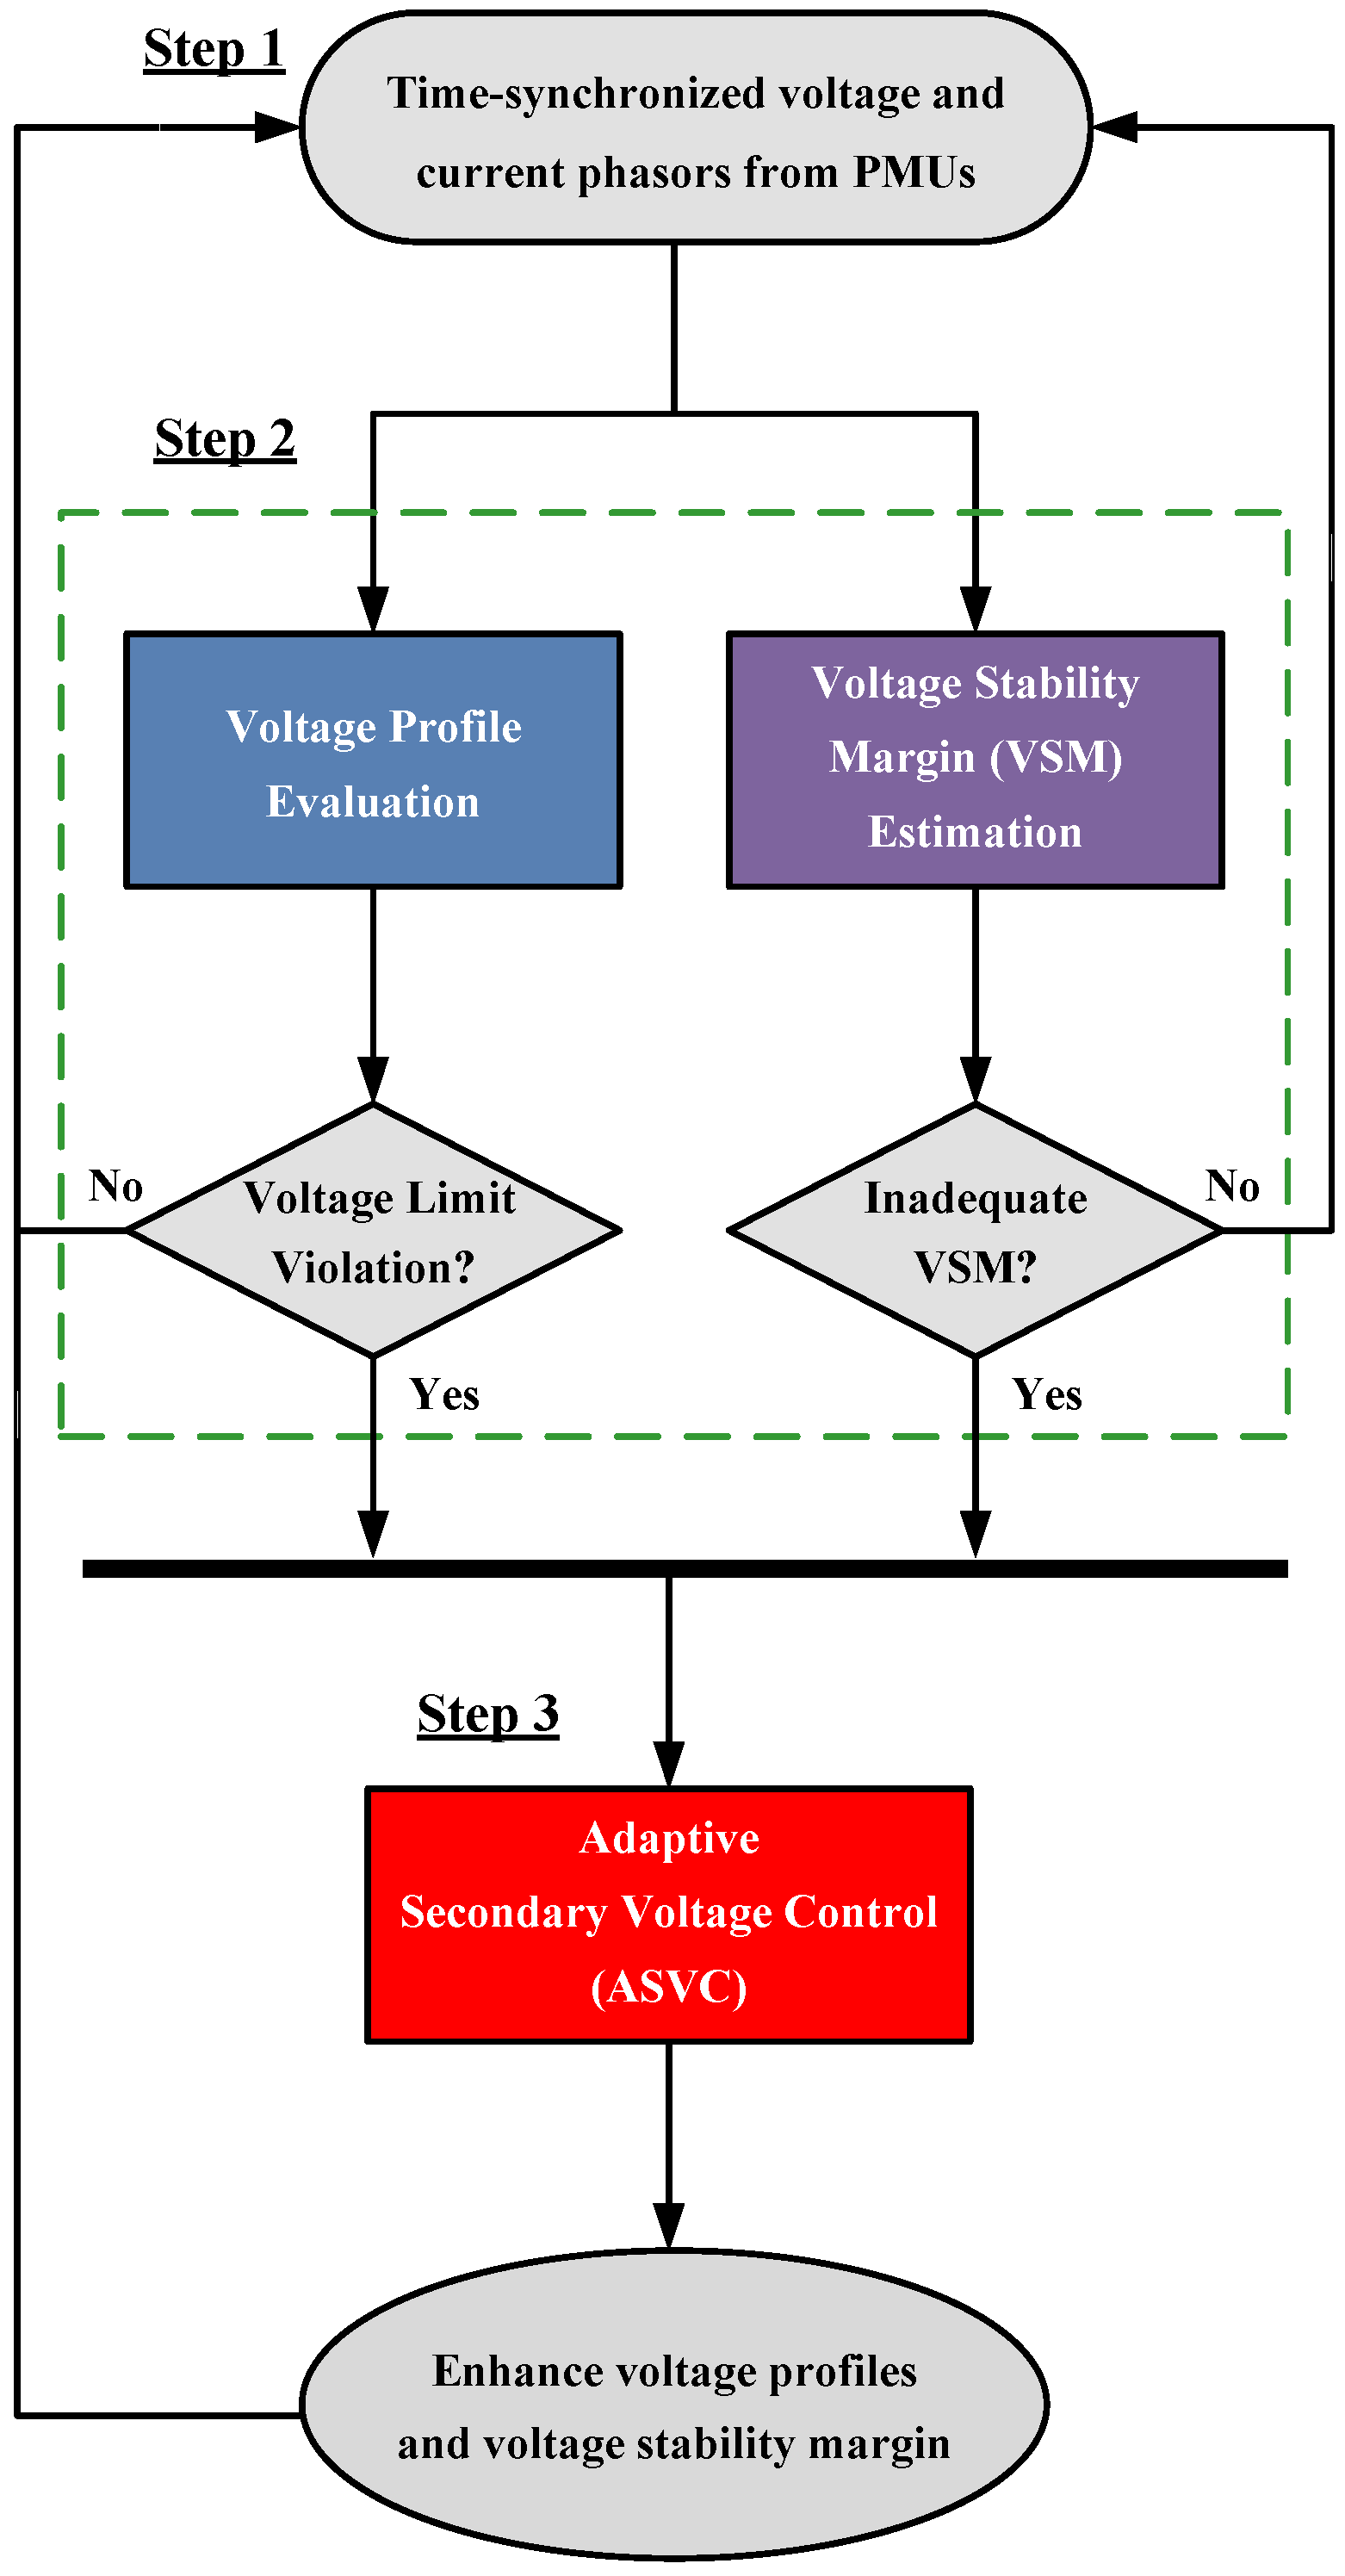
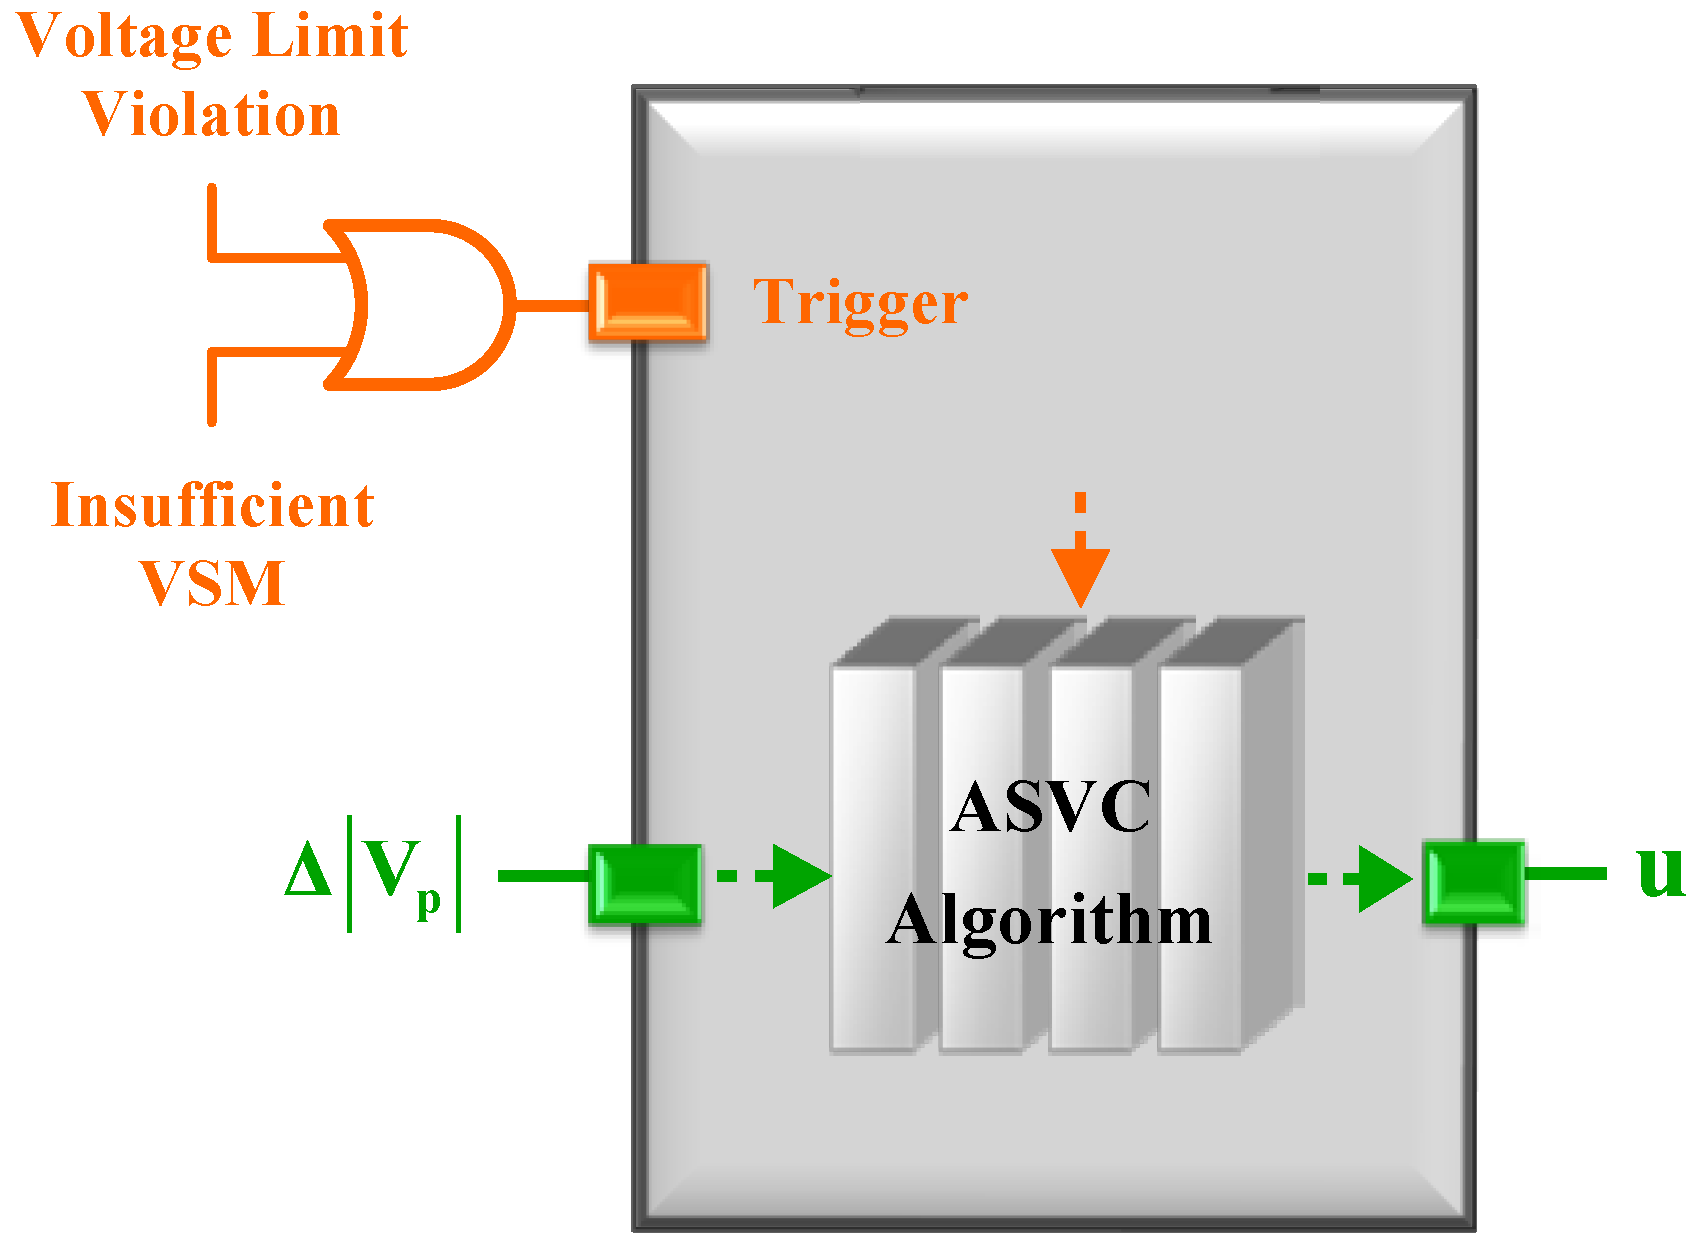
- The voltage magnitudes, which are extracted from the PMUs in step 1, are used to evaluate the voltage magnitudes of the monitored buses. As long as the measured voltages are not within the specified limit, voltage violation is confirmed. Then, the scheme will issue a trigger signal to the ASVC function. Otherwise, the scheme will go back to Step 1.
- (2)
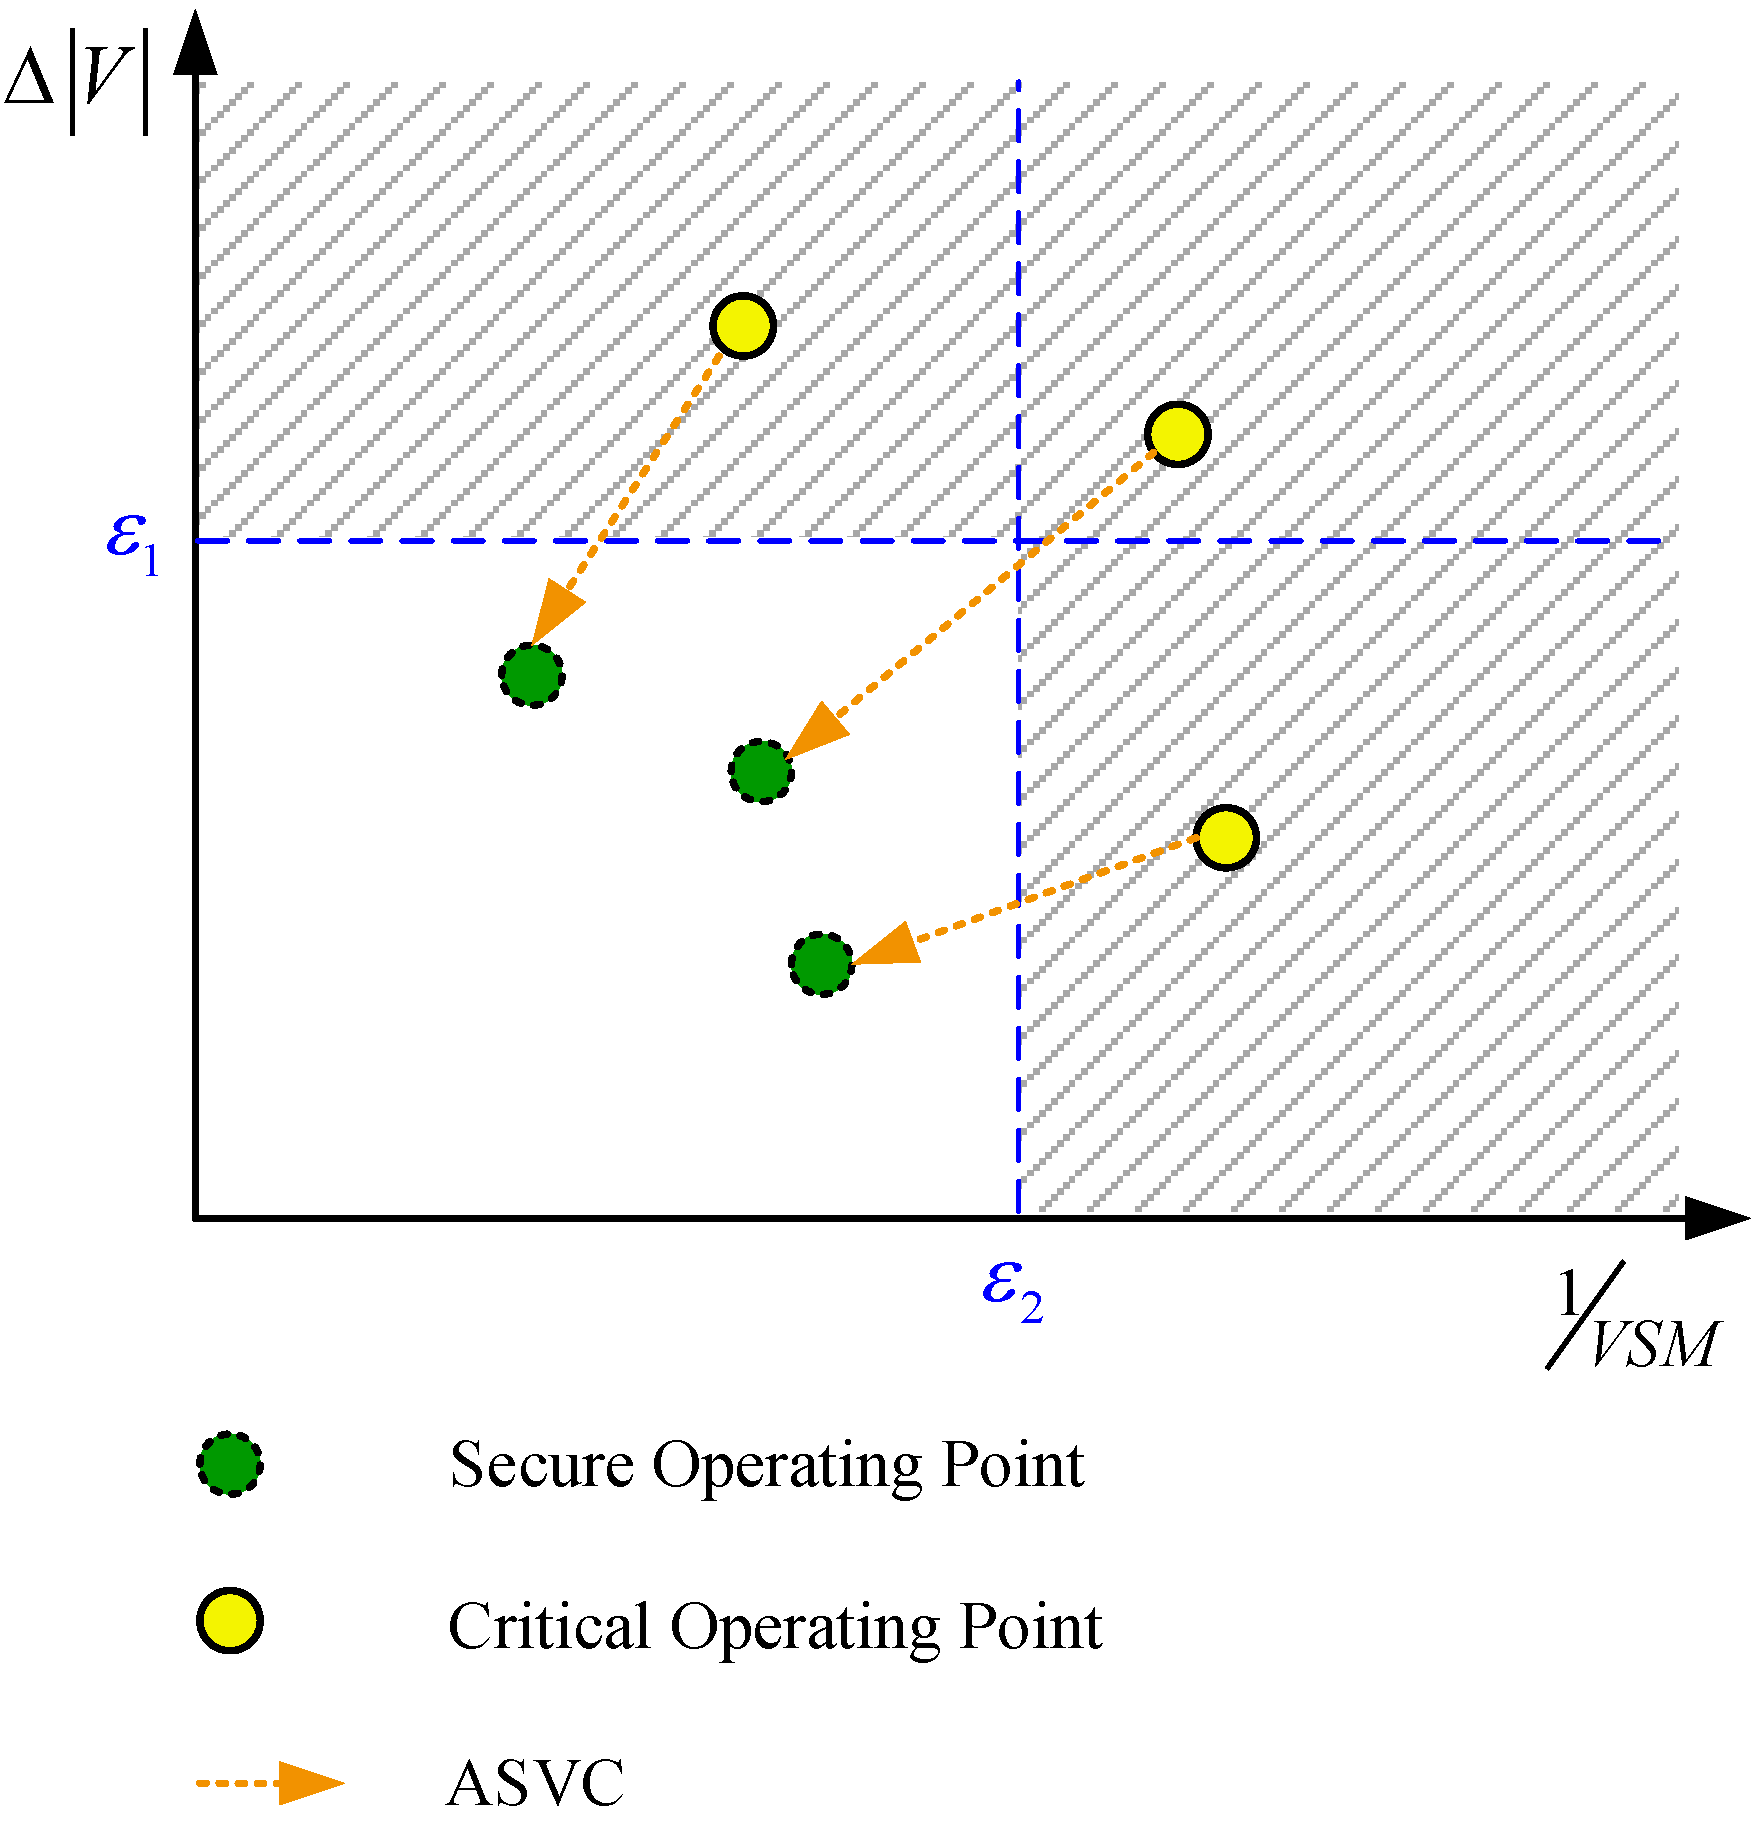
- As mentioned before, depending on bus voltages for the activation of control actions is not a very reliable strategy to be adopted. Another important index, which measures the proximity of an operating point to voltage instability, is the voltage stability margin (VSM). Therefore, the scheme needs to further check to see whether the current power system state is operated within a sufficient safety margin or not. If the computed value VSM is less than the predetermined security margin, inadequate VSM is identified. This will initiate the ASVC action accordingly.
3. Principles of the Scheme
3.1. Adaptive Secondary Voltage Control (ASVC) Function

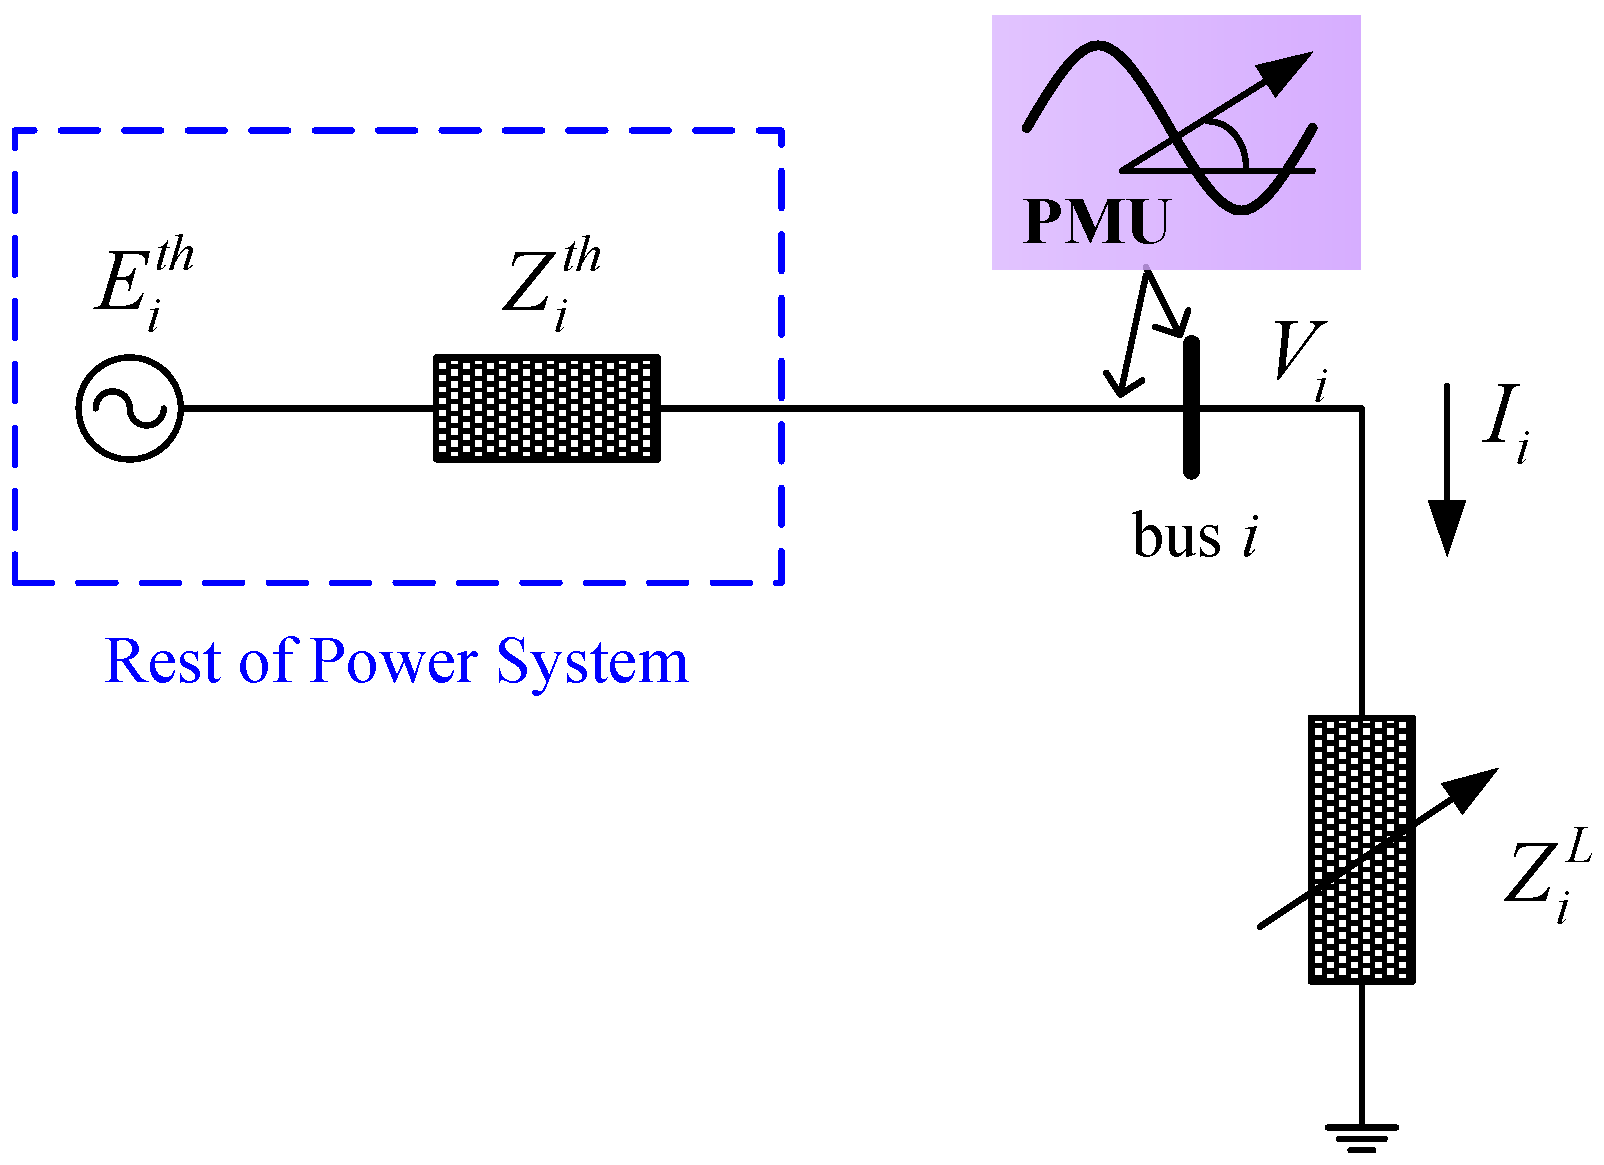
3.2. Voltage Stability Margin Estimation Function

4. Simulation Results

| Case | PMU Locations at | Load Change Pattern | Line Outage Contingency |
|---|---|---|---|
| I | #30 | Single bus | / |
| II | #3, #12 | All buses | / |
| III | #24, #29 | Several buses | Line #27–#28 |
| IV | All | Several buses | / |
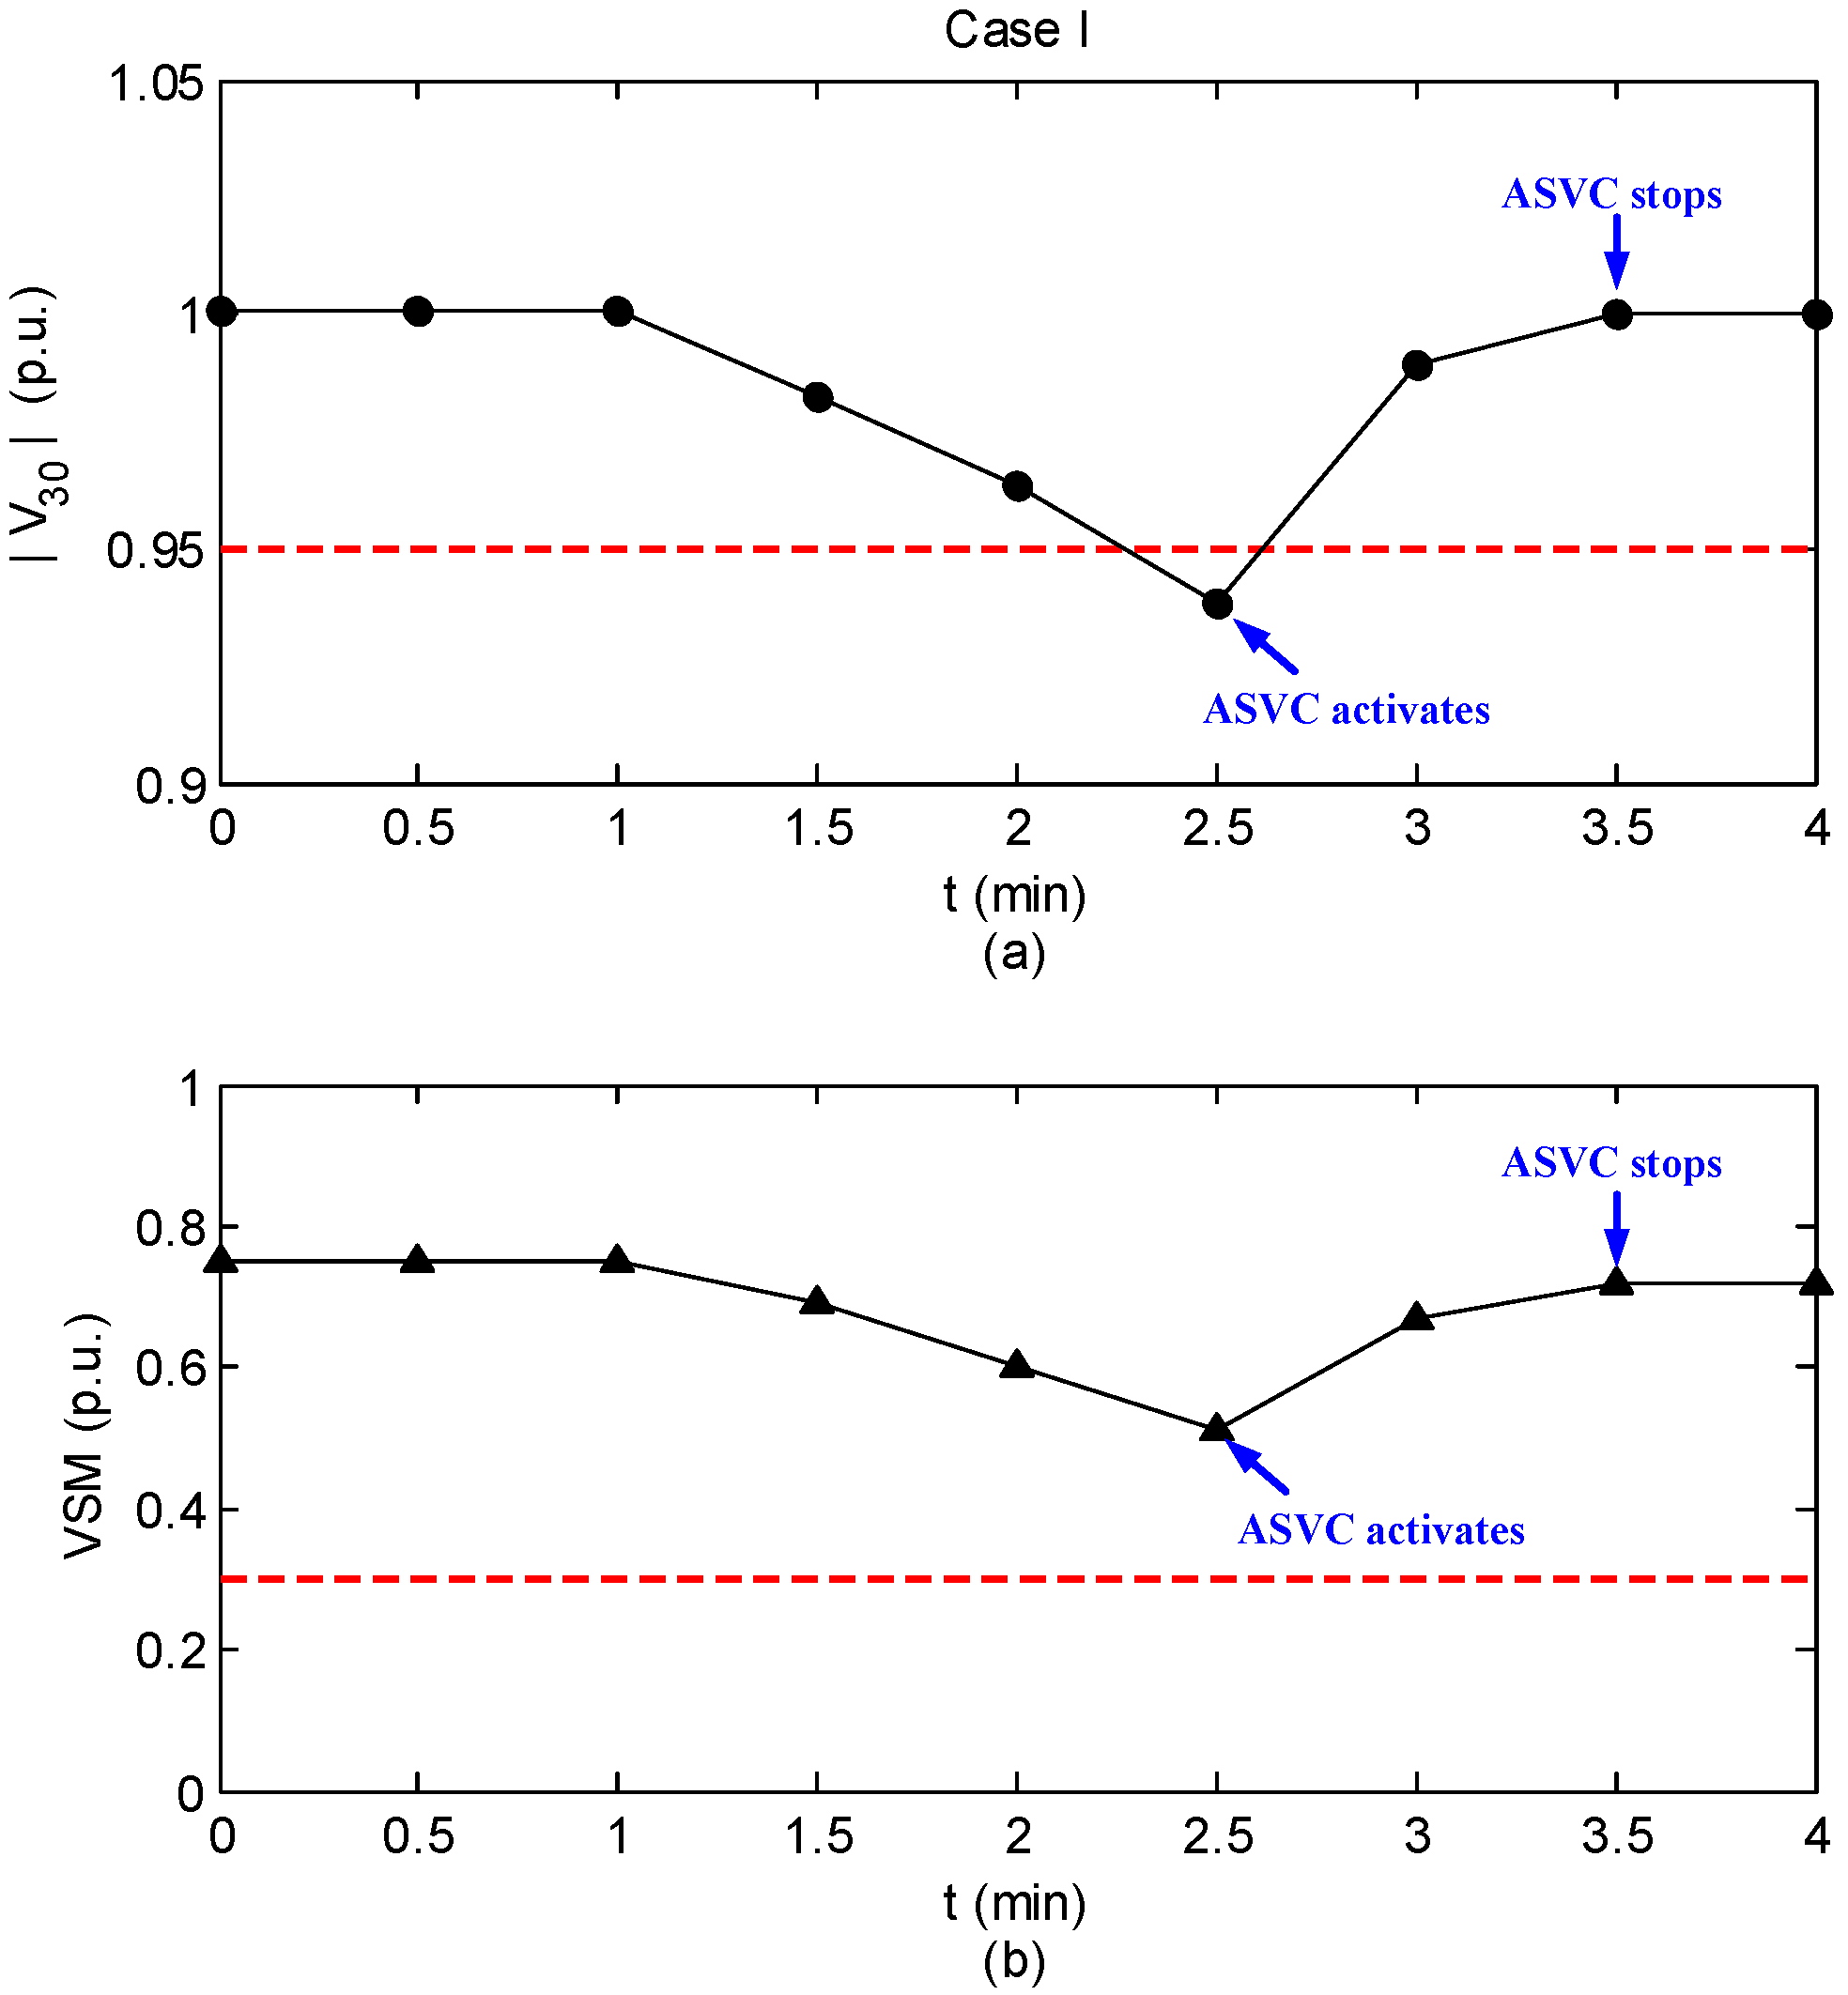
4.1. Case I
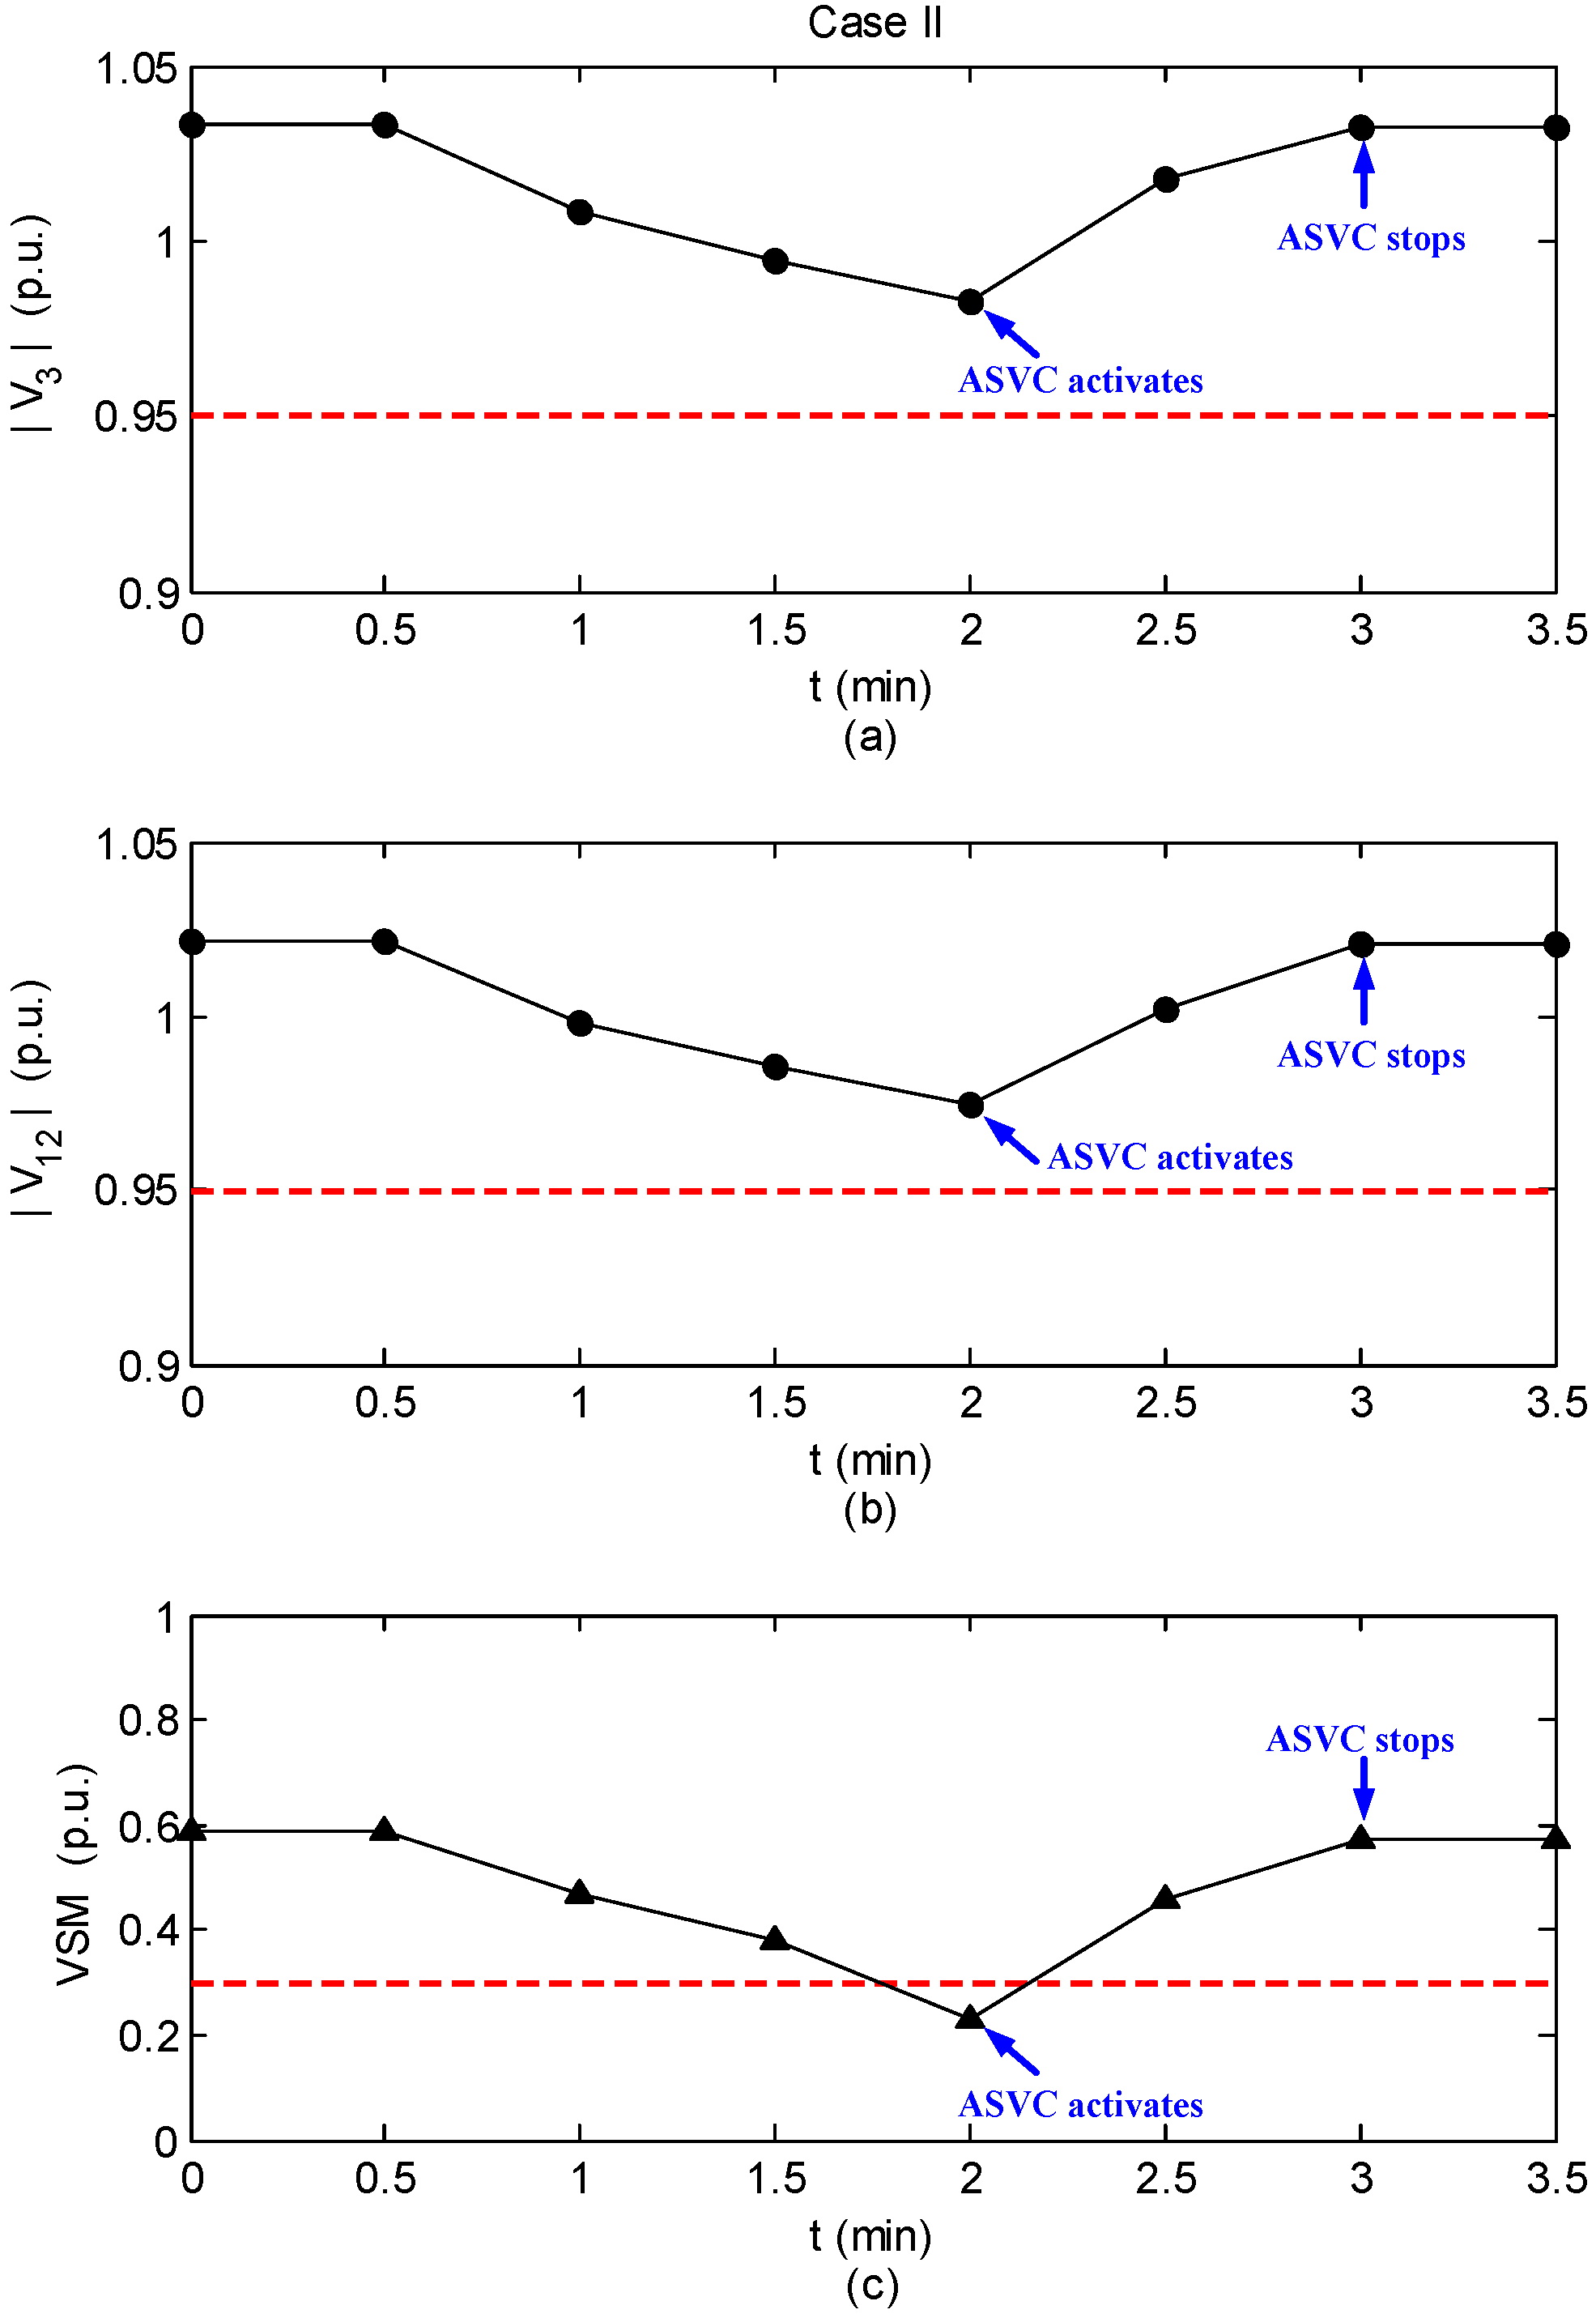
4.2. Case II
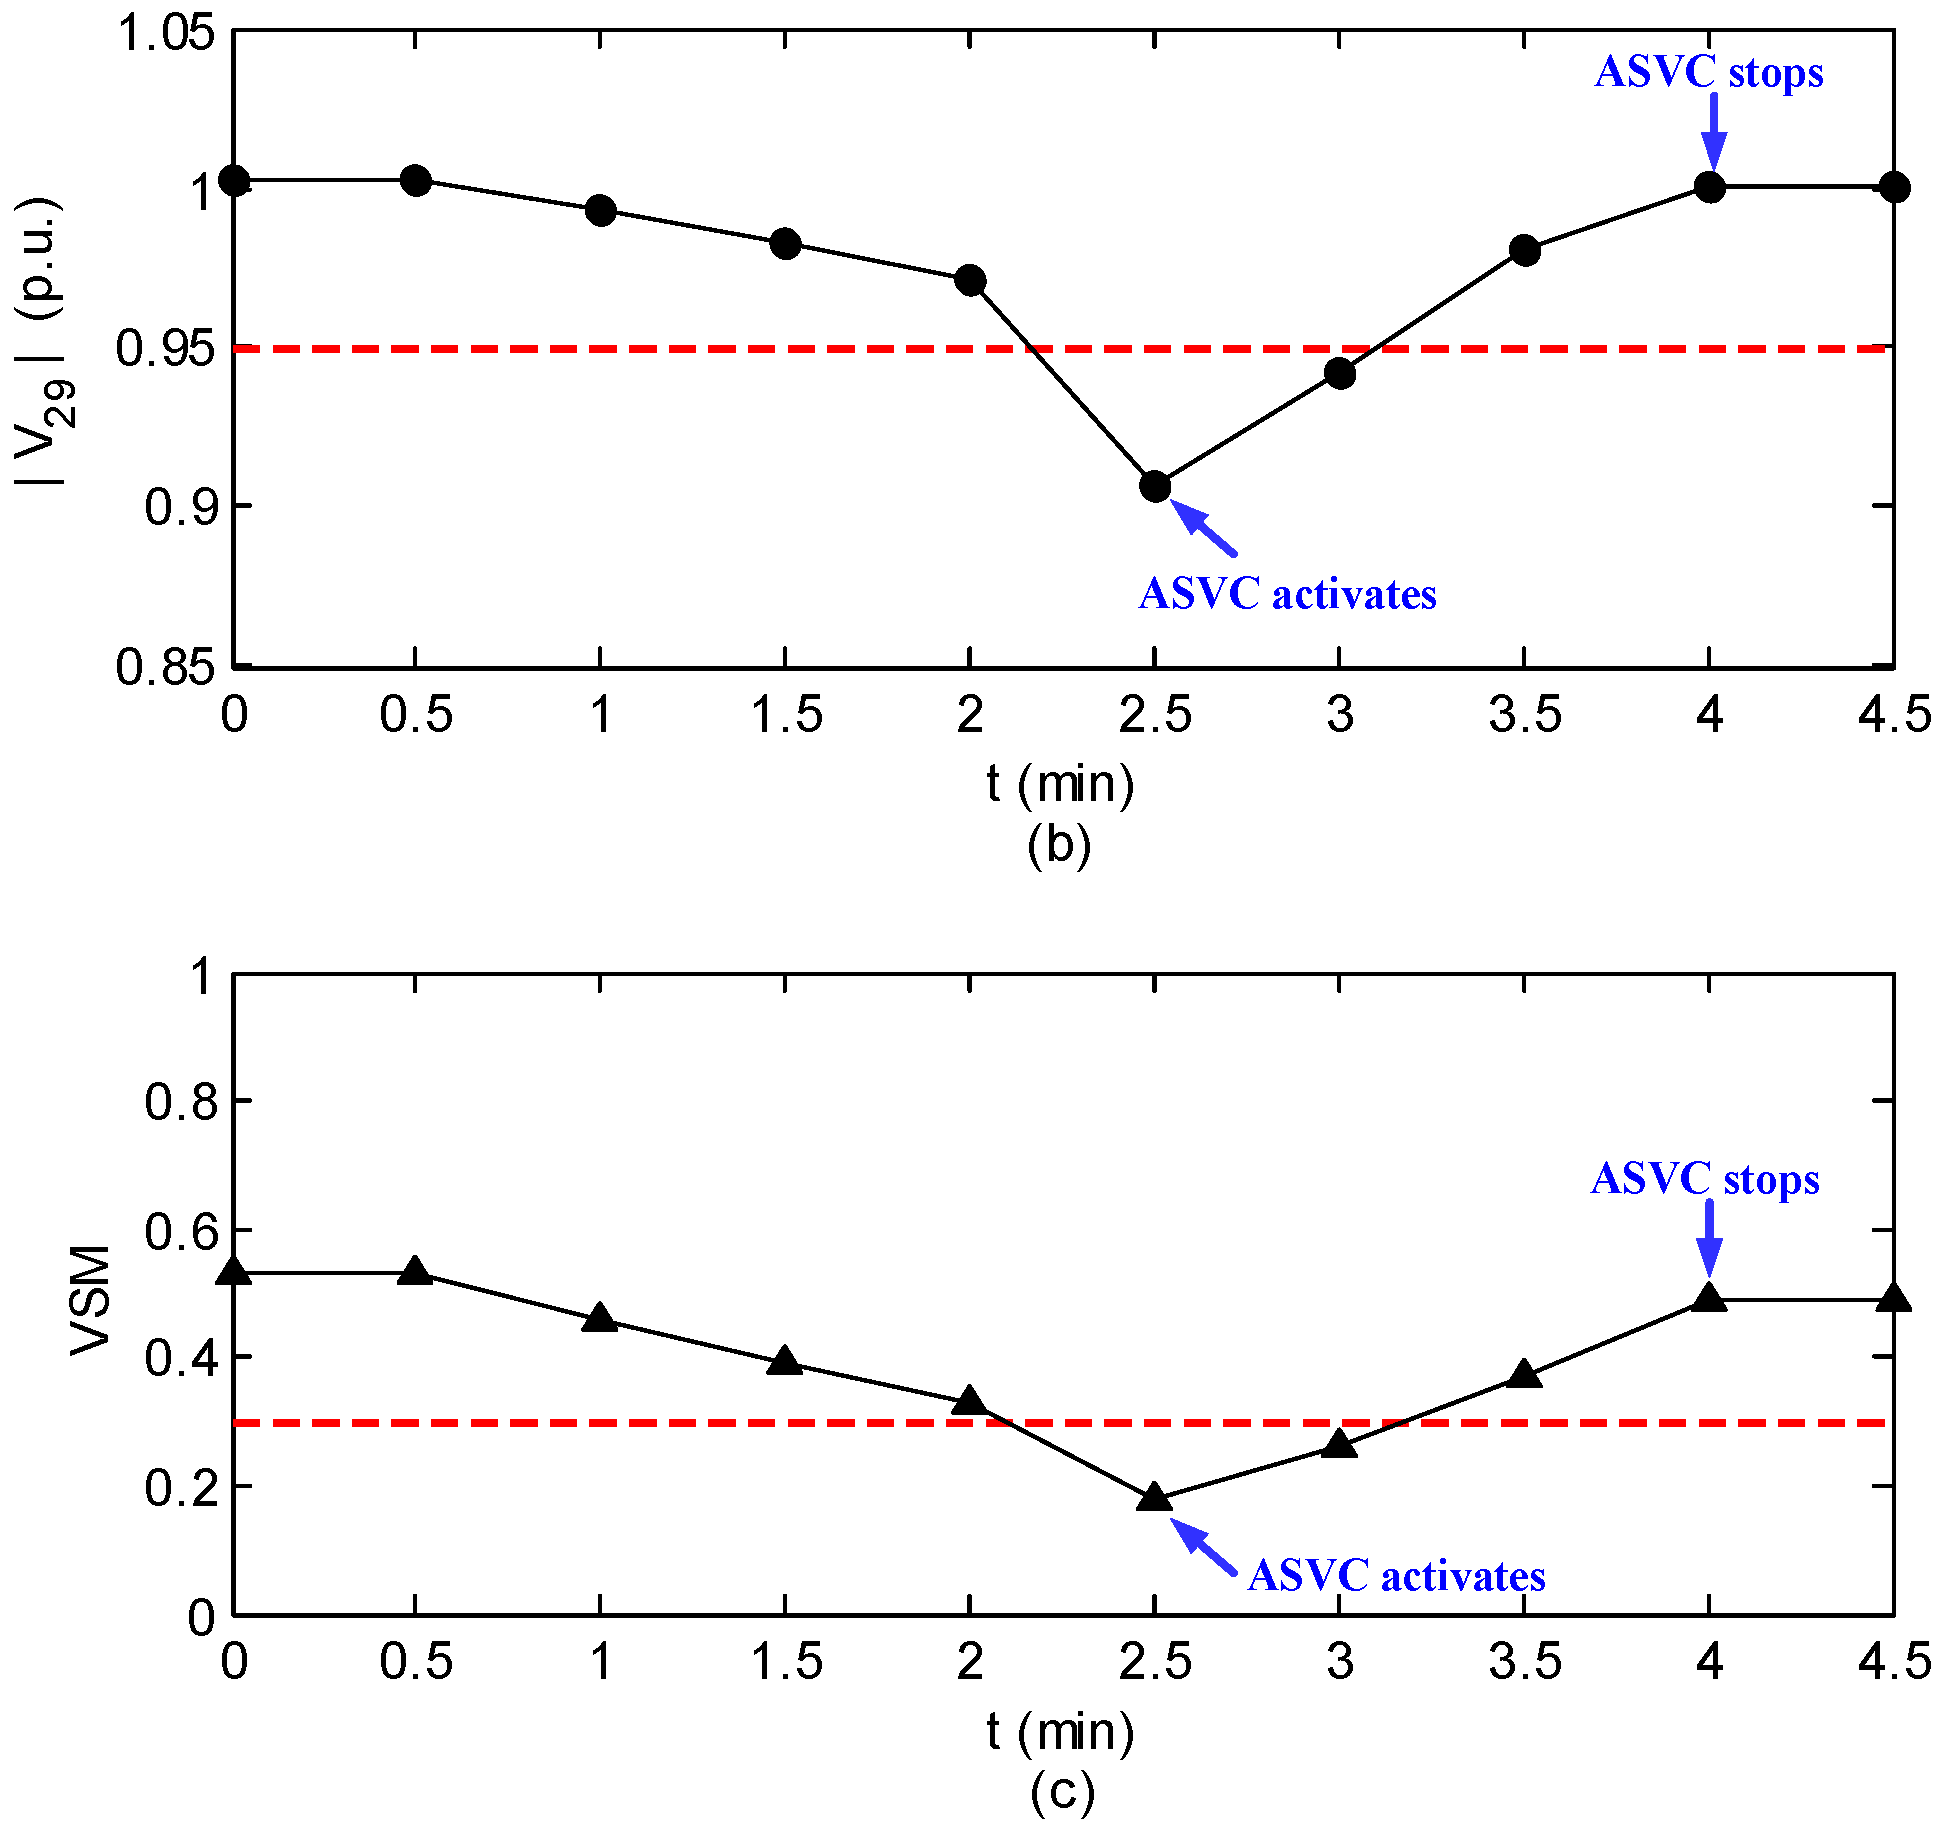
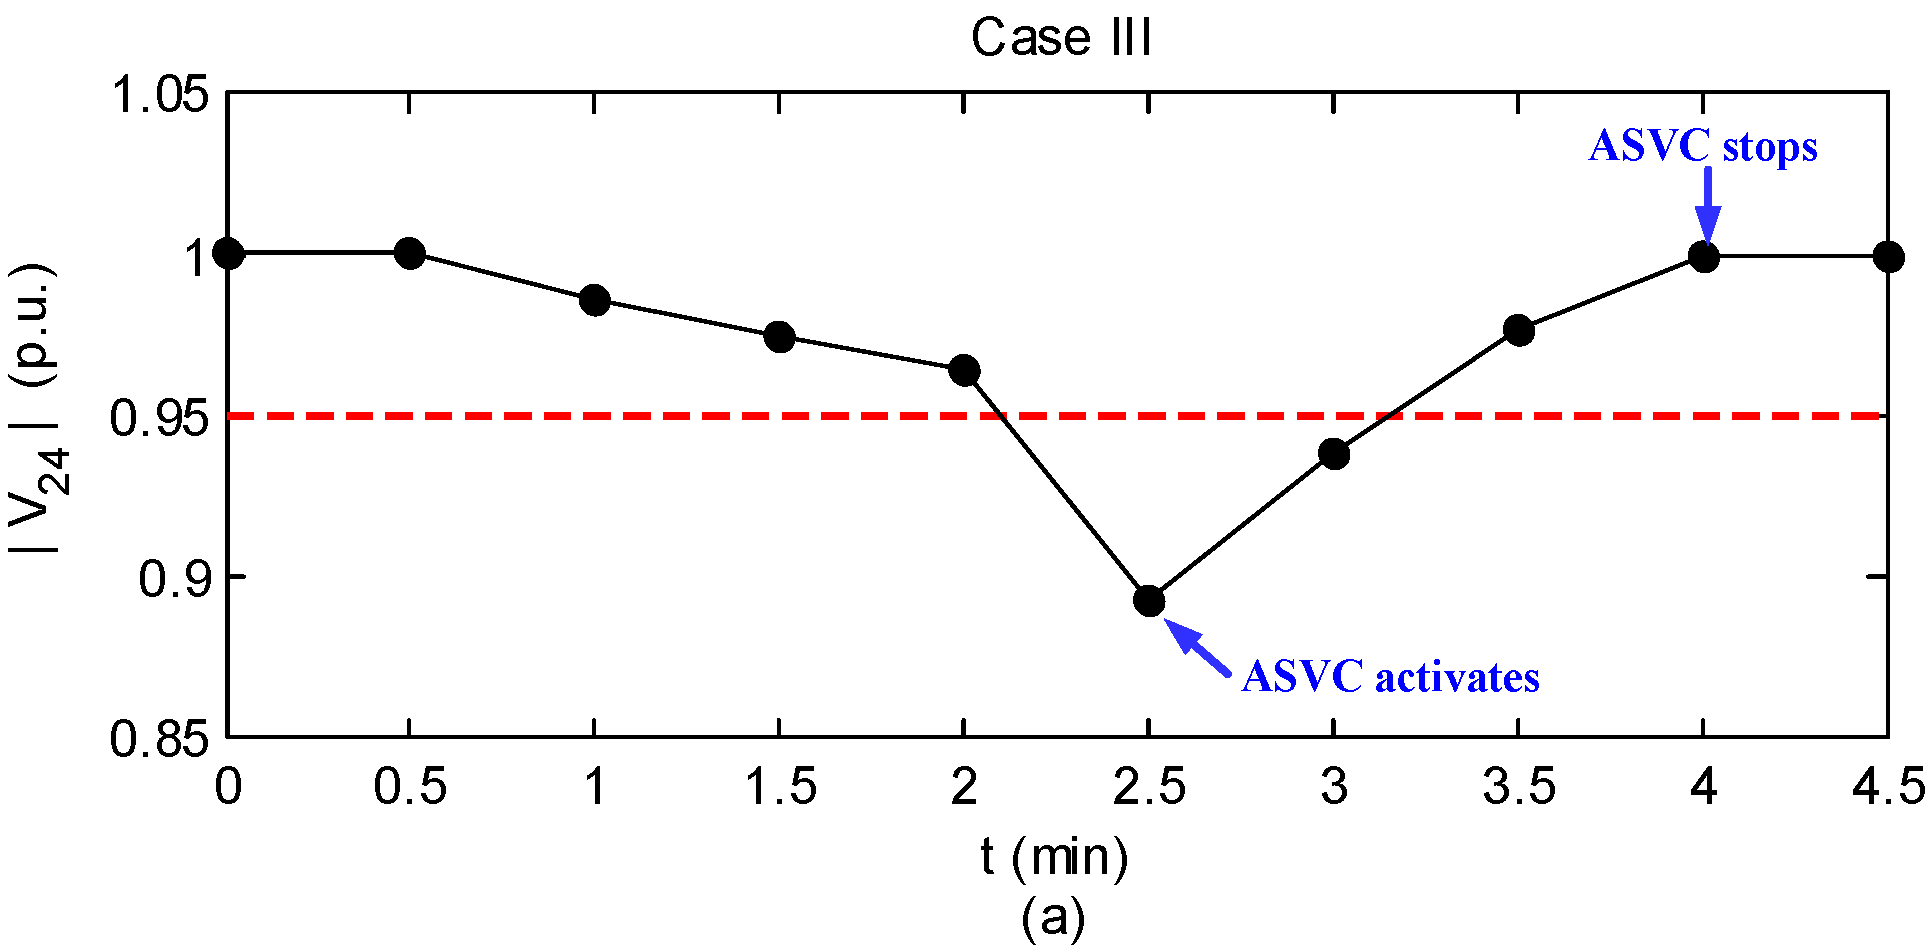
4.3. Case III

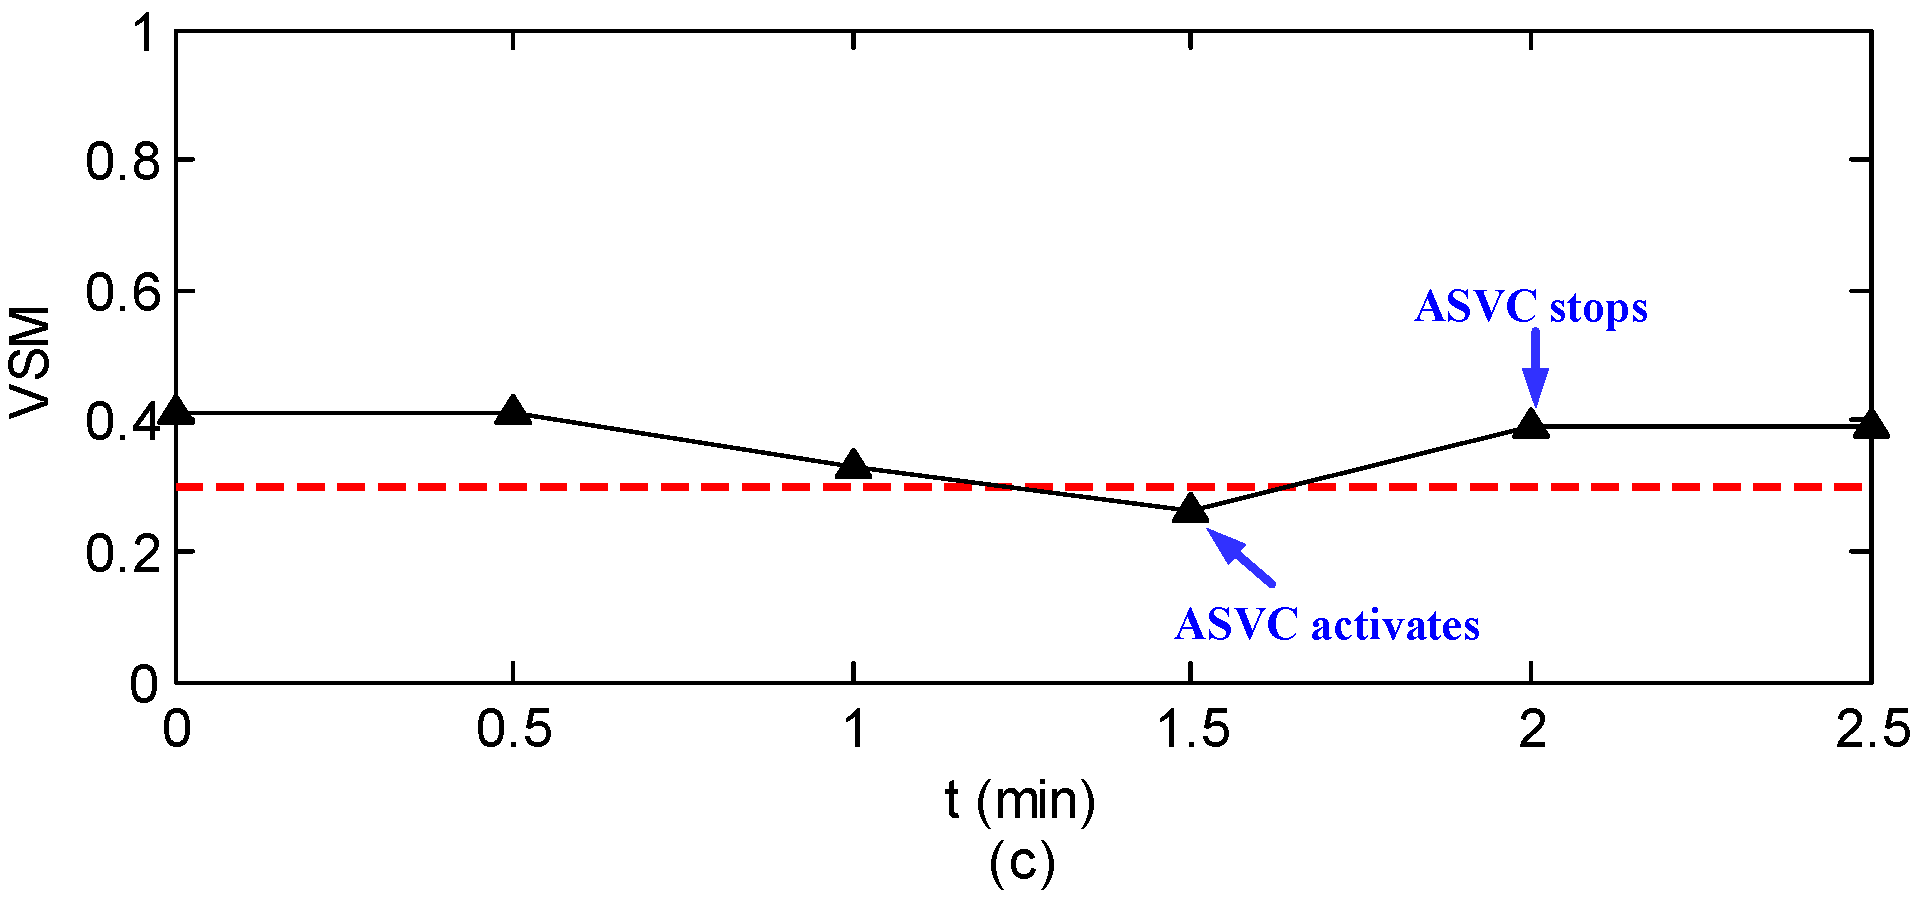
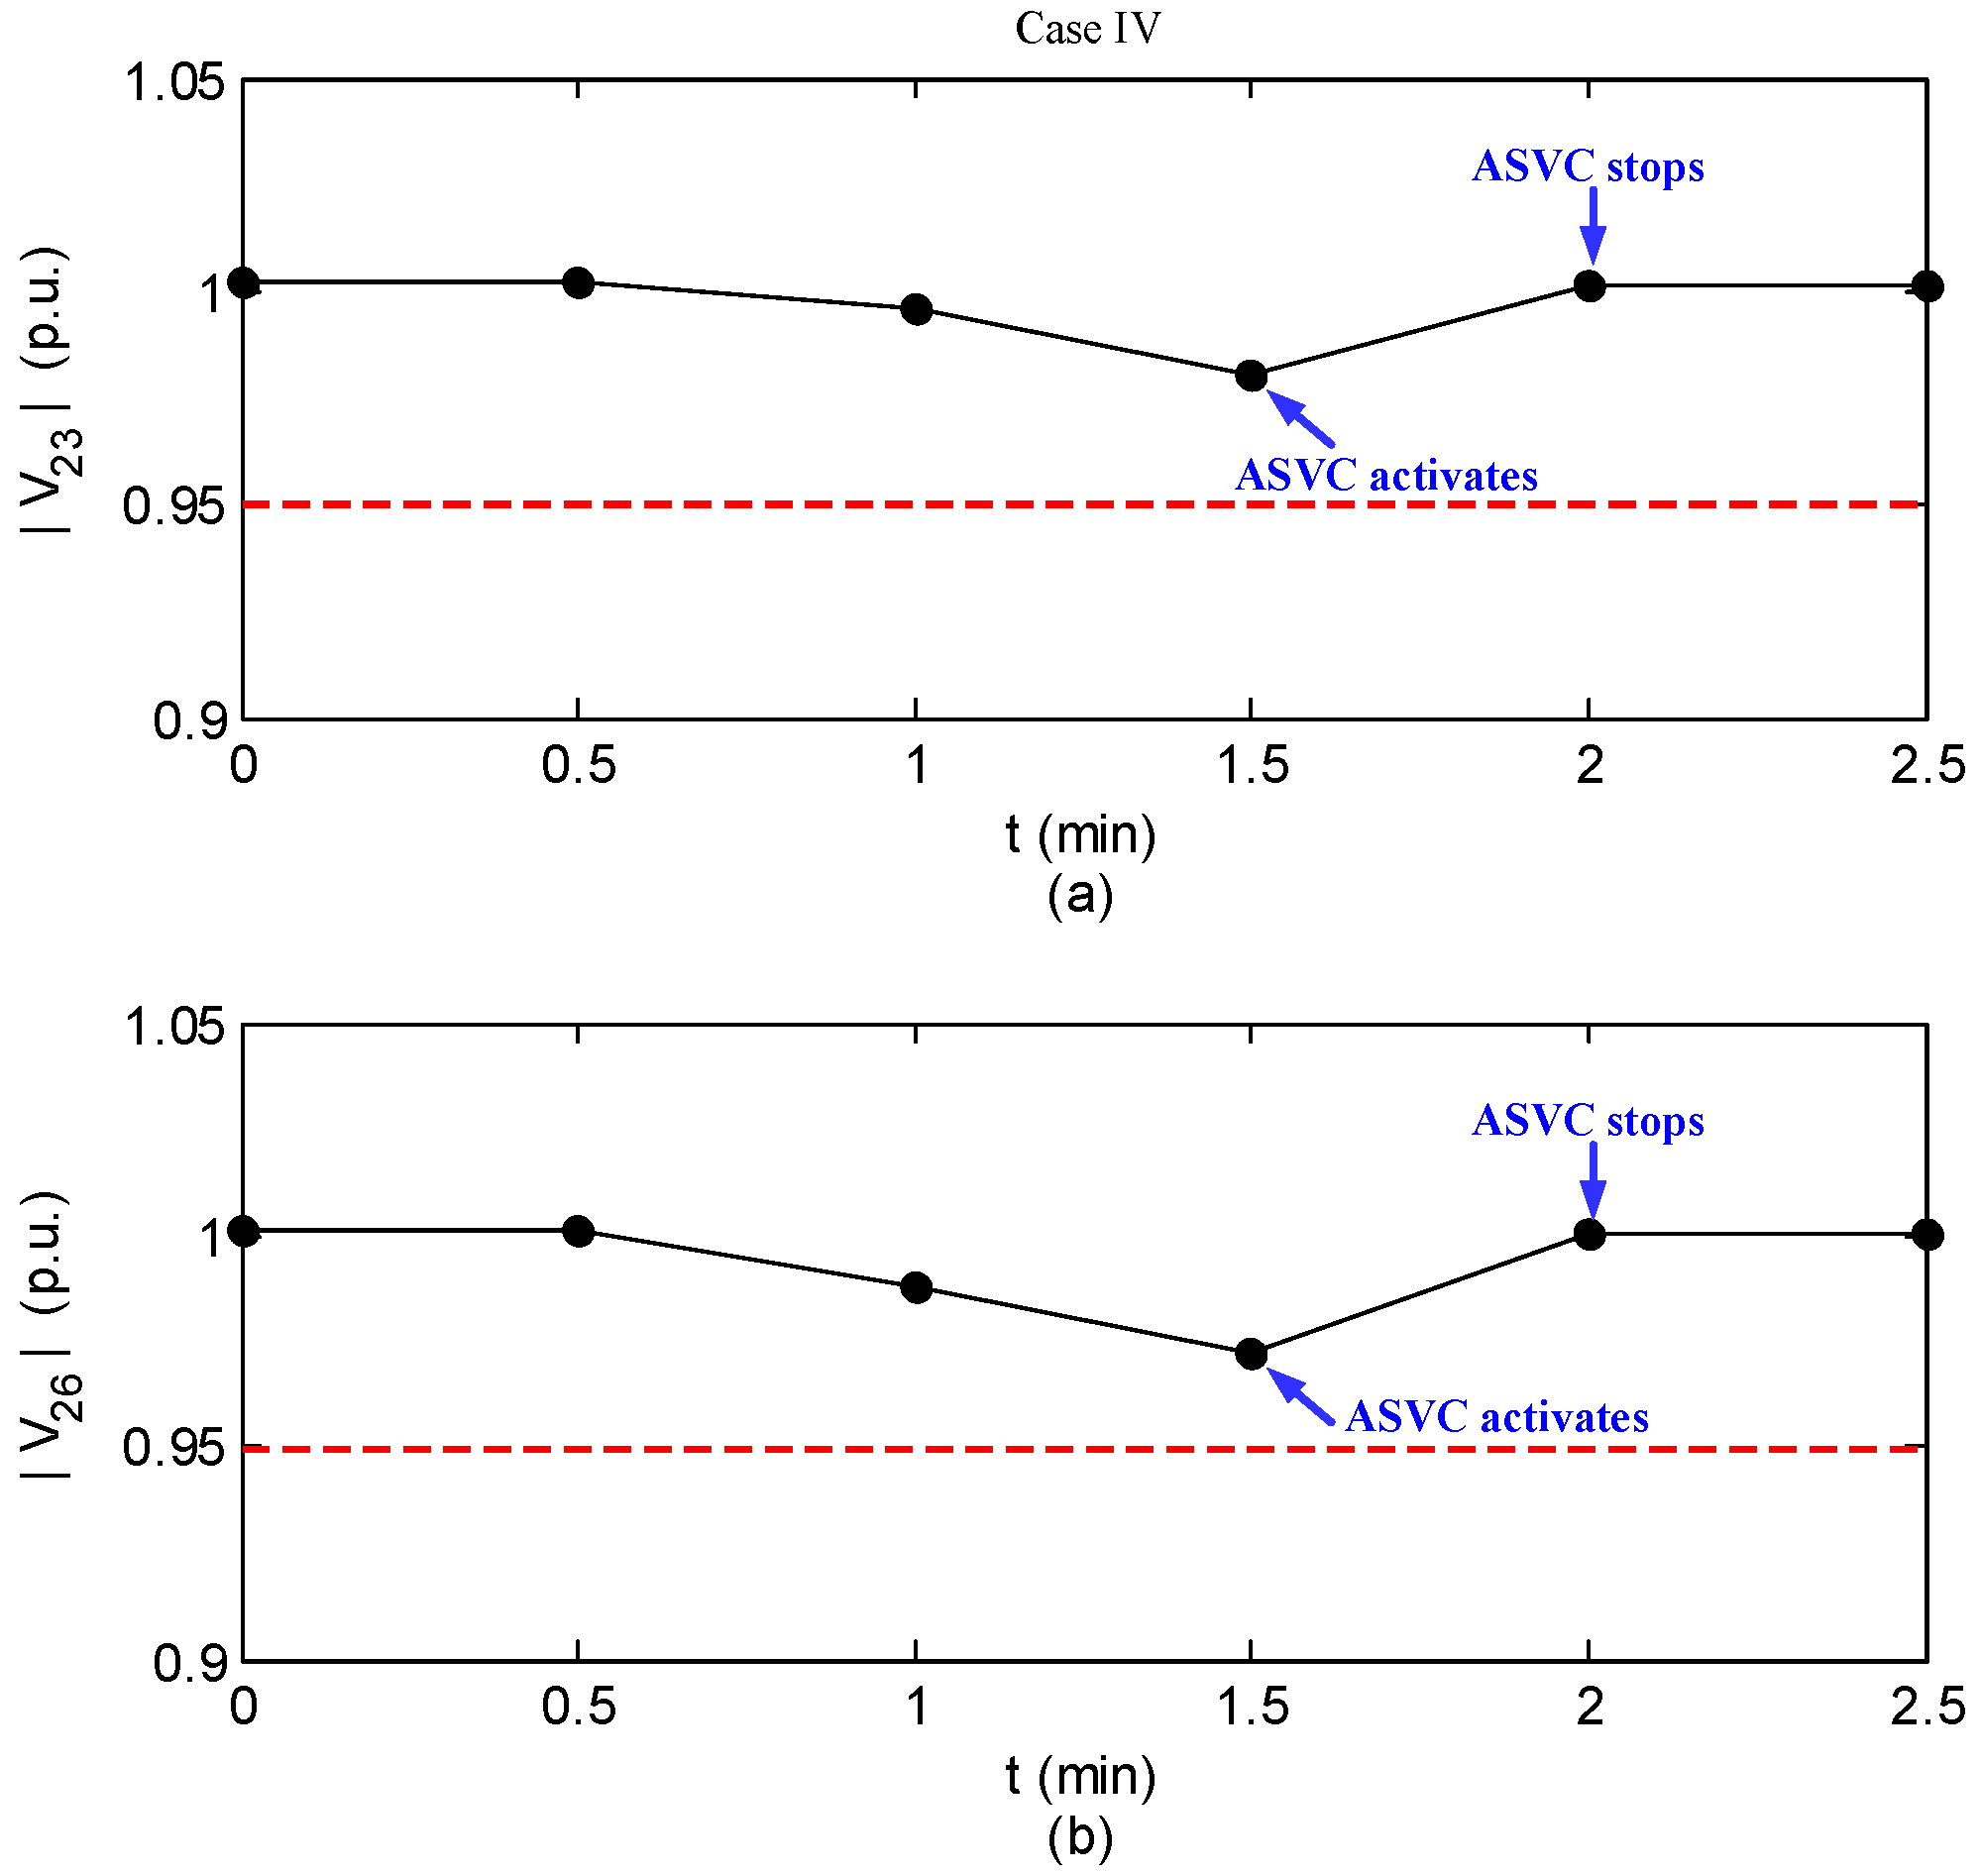
4.4. Case IV

| Case | xrms (p.u.) | VSM (p.u.) | ||
|---|---|---|---|---|
| Before | After | Before | After | |
| I | 0.0601 | 0.0355 | 0.51 | 0.72 |
| II | 0.0348 | 0.0205 | 0.23 | 0.57 |
| III | 0.0803 | 0.0411 | 0.18 | 0.49 |
| IV | 0.0416 | 0.0194 | 0.26 | 0.39 |
5. Conclusions
Acknowledgments
Author Contributions
Conflicts of Interest
References
- Kundur, P. Power System Stability and Control; McGraw-Hill: New York, NY, USA, 1994. [Google Scholar]
- Kundur, P.; Paserba, J.; Ajjarapu, V.; Andersson, G.; Bose, A.; Canizares, C.; Hatziargyriou, N.; Hill, D.; Stankovic, A.; Taylor, C.; et al. Definition and classification of power system stability IEEE/CIGRE joint task force on stability terms and definitions. IEEE Trans. Power Syst. 2004, 19, 1387–1401. [Google Scholar]
- Morison, G.K.; Gao, B.; Kundur, P. Voltage stability analysis using static and dynamic approaches. IEEE Trans. Power Syst. 1993, 8, 1159–1171. [Google Scholar] [CrossRef]
- Phadke, A.G.; Thorp, J.S. Synchronized Phasor Measurements and Their Applications; Springer-Verlag: New York, NY, USA, 2008. [Google Scholar]
- De La Ree, J.; Centeno, V.; Thorp, J.S.; Phadke, A.G. Synchronized phasor measurement applications in power systems. IEEE Trans. Smart Grid. 2010, 1, 20–27. [Google Scholar] [CrossRef]
- Thorp, J.S.; Ilic-Spong, M.; Varghese, M. An optimal secondary voltage-var control technique. Automatica 1986, 22, 217–222. [Google Scholar] [CrossRef]
- Ilic, M.; Christensen, J.; Eichorn, K.L. Secondary voltage control using pilot point information. IEEE Trans. Power Syst. 1988, 3, 660–668. [Google Scholar] [CrossRef]
- Stankovic, A.; Ilic, M.; Maratukulam, D. Recent results in secondary voltage control of power systems. IEEE Trans. Power Syst. 1991, 6, 94–101. [Google Scholar] [CrossRef]
- Zobian, A.; Ilic, M.D. A steady state voltage monitoring and control algorithm using localized least square minimization of load voltage deviations. IEEE Trans. Power Syst. 1996, 11, 929–938. [Google Scholar] [CrossRef]
- Wang, H.; Li, H.; Chen, H. Coordinated secondary voltage control to eliminate voltage violations in power system contingencies. IEEE Trans. Power Syst. 2003, 18, 588–595. [Google Scholar] [CrossRef]
- Berizzi, A.; Marannino, P.; Merlo, M.; Pozzi, M.; Zanellini, F. Steady-state and dynamic approaches for the evaluation of loadability margin in the presence of secondary voltage regulation. IEEE Trans. Power Syst. 2004, 9, 1048–1057. [Google Scholar] [CrossRef]
- Paul, J.P.; Leost, J.T.; Tesseron, J.M. Survey of the secondary voltage control in France: Present realization and investigations. IEEE Trans. Power Syst. 1987, 2, 505–511. [Google Scholar] [CrossRef]
- Lagonotte, P.; Sabonnadiere, J.C.; Leost, J.Y.; Paul, J.P. Structural analysis of the electrical system: Application to the secondary voltage control in France. IEEE Trans. Power Syst. 1989, 4, 1477–1484. [Google Scholar] [CrossRef]
- Corsi, S.; Marannino, P.; Losignore, N.; Moreschini, G.; Piccini, G. Coordination between the reactive power scheduling function and the hierarchical voltage control of the EHV ENEL system. IEEE Trans. Power Syst. 1995, 10, 686–694. [Google Scholar] [CrossRef]
- Sancha, J.L.; Fernandez, J.L.; Cortes, A.; Abarca, J.T. Secondary voltage control: Analysis, solutions, simulation results for the Spanish transmission system. IEEE Trans. Power Syst. 1996, 11, 630–638. [Google Scholar] [CrossRef]
- Corsi, S.; Pozzi, M.; Sabelli, C.; Serrani, A. The coordinated automatic voltage control of the Italian transmission grid-Part I: Reasons of the choice and overview of the consolidated hierarchical system. IEEE Trans. Power Syst. 2004, 19, 1723–1732. [Google Scholar] [CrossRef]
- Corsi, S.; Pozzi, M.; Sforna, M.; Dell’Olio, G. The coordinated automatic voltage control of the Italian transmission grid-part II: Control apparatuses and field performance of the consolidated hierarchical system. IEEE Trans. Power Syst. 2004, 19, 1733–1741. [Google Scholar] [CrossRef]
- Conejo, A.; Aguilar, M.J. Secondary voltage control: Nonlinear selection of pilot buses, design of an optimal control law, and simulation results. IEE Proc. Gen. Trans. Distrib. 1998, 145, 77–81. [Google Scholar] [CrossRef]
- Yu, C.; Yoon, Y.T.; Ilic, M.D.; Catelli, A. On-line voltage regulation: The case of New England. IEEE Trans. Power Syst. 1995, 10, 631–638. [Google Scholar]
- Begovic, M.; Fulton, D.; Gonzalez, M.R.; Goossens, J.; Haas, R.W.; Henville, C.F.; Michel, G.L.; Postforoosh, J.; Williams, J.B.; Zimmerman, K. Summary of system protection and voltage stability. IEEE Trans. Power Syst. 2004, 19, 1387–1401. [Google Scholar] [CrossRef]
- Flatabo, N.; Ognedal, R.; Carlsen, T. Voltage stability condition in a power transmission system calculated by sensitivity methods. IEEE Trans. Power Syst. 1990, 5, 1286–1293. [Google Scholar] [CrossRef]
- Flatabo, N.; Fosso, O.; Ognedal, R.; Carlsen, T. A method for calculation of margins to voltage instability applied on the Norwegian system for maintaining required security level. IEEE Trans. Power Syst. 1993, 8, 920–928. [Google Scholar] [CrossRef]
- Lof, P.A.; Semed, T.; Andersson, G.; Hill, D.J. Fast calculation of a voltage stability index. IEEE Trans. Power Syst. 1992, 7, 54–64. [Google Scholar] [CrossRef]
- Lof, P.A.; Andersson, G.; Hill, D.J. Voltage stability indices for stressed power systems. IEEE Trans. Power Syst. 1993, 8, 326–335. [Google Scholar] [CrossRef]
- Vu, K.; Begovic, M.M.; Novosel, D.; Saha, M.M. Use of local measurements to estimate voltage-stability margin. IEEE Trans. Power Syst. 1999, 14, 1029–1035. [Google Scholar] [CrossRef]
- Smon, I.; Verbic, G.; Gubina, F. Local voltage-stability index using Tllegen’s theorem. IEEE Trans. Power Syst. 2006, 21, 1267–1275. [Google Scholar] [CrossRef]
- Boyd, S.; Vandenberghe, L. Convex Optimization; Cambridge University Press: Cambridge, UK, 2004. [Google Scholar]
- MathWorks, Inc. MATLAB Optimization Toolbox. Available online: http://www.mathworks.com/products/ optimization/ (accessed on 4 March 2005).
- University of Washington College of Engineering. Power Systems Test Case Archive. Available online: http://www.ee.washington.edu/re-serach/pstcal/ (accessed on 17 September 2005).
© 2016 by the authors; licensee MDPI, Basel, Switzerland. This article is an open access article distributed under the terms and conditions of the Creative Commons by Attribution (CC-BY) license (http://creativecommons.org/licenses/by/4.0/).
Share and Cite
Su, H.-Y.; Chen, Y.-C.; Hsu, Y.-L. A Synchrophasor Based Optimal Voltage Control Scheme with Successive Voltage Stability Margin Improvement. Appl. Sci. 2016, 6, 14. https://doi.org/10.3390/app6010014
Su H-Y, Chen Y-C, Hsu Y-L. A Synchrophasor Based Optimal Voltage Control Scheme with Successive Voltage Stability Margin Improvement. Applied Sciences. 2016; 6(1):14. https://doi.org/10.3390/app6010014
Chicago/Turabian StyleSu, Heng-Yi, Yi-Chung Chen, and Yu-Liang Hsu. 2016. "A Synchrophasor Based Optimal Voltage Control Scheme with Successive Voltage Stability Margin Improvement" Applied Sciences 6, no. 1: 14. https://doi.org/10.3390/app6010014