1. Introduction
The increasing number of road traffic accidents globally has sparked interest in analyzing the causes and factors for their occurrence, as well as the extent of damage and their consequences. Factors are categorized based on various characteristics, such as road infrastructure, control, and speed limits, technical condition of the vehicle, human factors, and others [
1]. Of the human factors, special attention is paid to the medical condition of the driver, drowsiness, fatigue, and use of alcohol and drugs. In the USA, a study published by the NHTSA [
2] showed that up to 94% of road accidents are the result of driver errors, which are often caused by their mental and/or physiological state. Fatigue, distraction, strong emotional state (e.g., anger), and overthinking are prerequisites for a high probability of critical driver errors. The final report of the preliminary study SYNCOPE [
3] indicated that in Sweden, the main cause of fatal road accidents and about 10% of road deaths is sudden medical illness (SMI) of the driver. SMI is a sudden health disorder that, by its nature, poses a direct threat to life or health and requires prompt, immediate treatment. A study in Spain [
4], investigating the prevalence of adverse health conditions among Spanish drivers, found that 42% of 1200 drivers sometimes felt unfit to drive, and 1.8% considered this to happen often. It is possible that the statistics do not include fatal accidents that are due to SMI, because they are not defined as such and accordingly documented. This leads to the assumption that the proportion of accidents caused by SMI could be higher. Furthermore, sudden medical illnesses while driving, such as stroke, heart attack, and arrhythmias, accompanied by dizziness, vertigo, and fainting, are considered major causes of severe road traffic accidents [
5,
6].
The occurrence and severity of traffic accidents can be reduced by using a driver monitoring system (DMS) capable of detecting the onset of drowsiness, fatigue, distraction, strong emotional state, and life-threatening medical conditions, even at an early stage. Monitoring of drivers’ physiological parameters can be implemented using different measurement methods and sensors comprising wearable devices, such as smart watches, rings, and fitness bands with embedded sensors, wearable sensors for measuring vital biological signals, or sensors and technologies embedded in the vehicle itself.
In 2021, Arakawa [
7] presented a review of heartbeat detection systems in automotive applications and addressed the widespread use of smartwatches and smartphones, as well as barriers to their practical use in vehicles. In the conclusion of this review, the author noted that there are no recent examples of systems or devices that assess the driver’s condition based solely on heart rate, and that devices that can detect health conditions and abnormalities are expected to emerge as future applications. In 2022, Albadawi et al. [
8] presented a detailed review of driver drowsiness detection systems, describing the main approaches followed in the design of such systems. Based on the type of parameters used to indicate drowsiness, they categorized them into image-based, biological-based, vehicle-based, and hybrid systems. The same year, Razak et al. [
9] presented a scoping review of DMSs based on physiological indicators. In particular, they focused on the key physiological indicators applied in the design and development of DMSs related to driver recognition, driver alertness, driver drowsiness, driver fatigue, and drunk driving detection. In 2023, Lin and Li [
10] presented a review of research and applications of emotion recognition based on physiological signals, emphasizing their role and characteristics. Reviewing various applications, the authors found that a single physiological signal contains limited information and has poor representation ability. Usually, two or more physiological signals are needed to implement an emotion recognition system. For example, electrodermal activity and electrocardiographic signals can be used to implement a multimodal system for assessing driving stress and driver mentality. In 2023, Sriranga et al. [
11] presented a systematic review of studies that related to analyzing driver mental workload through various in-vehicle physiological sensors, focusing on cardiovascular and respiratory measures. They concluded that a research gap exists in the field of non-contact physiological monitoring in automotive environments that needs to be filled. These scoping and systematic reviews or scientific surveys have analyzed the existing publications in the field, concluding that the selection of proper measuring methods and sensors is crucial to the accuracy and stability of data collection in development of DMSs. Most scoping and systematic reviews in the field of physiological monitoring are related to applications for monitoring specific driver states, such as alertness, drowsiness, fatigue, emotional stress, etc. Others are related to methods for capturing a specific physiological signal or signals related to the function of a driver’s circulatory or respiratory system. However, there is still a lack of a structured general framework of methods, techniques, and sensors for acquiring physiological signals used for monitoring physiological parameters that are considered relevant and practically applicable in DMSs. The aim of this paper is, based on recent research on the wide spectrum of methods, techniques, and sensors for measuring physiological signals in DMSs, to propose a taxonomy providing a structured framework for the development of next-generation physiological-based DMSs (PDMSs). Therefore, special attention is paid to methods and sensors for acquisition of physiological signals to monitor the physiological parameters considered important for assessing the driver’s state, as well as to discuss their possible applications in real driving scenarios and challenges for further implementation.
The rest of the paper is organized as follows. In
Section 2, a brief overview of the physiological parameters for driver’s state assessment is provided. The methods, techniques, and sensor modalities used for measuring the driver’s physiological signals are examined in
Section 3. Based on this review, a proposed taxonomy scheme is presented at the end of this section. The potential and challenges of the considered methods for application in real driving scenarios are discussed in
Section 4. Finally, conclusions and ideas for future work are presented.
2. Physiological Parameters Used for Driver’s State Assessment
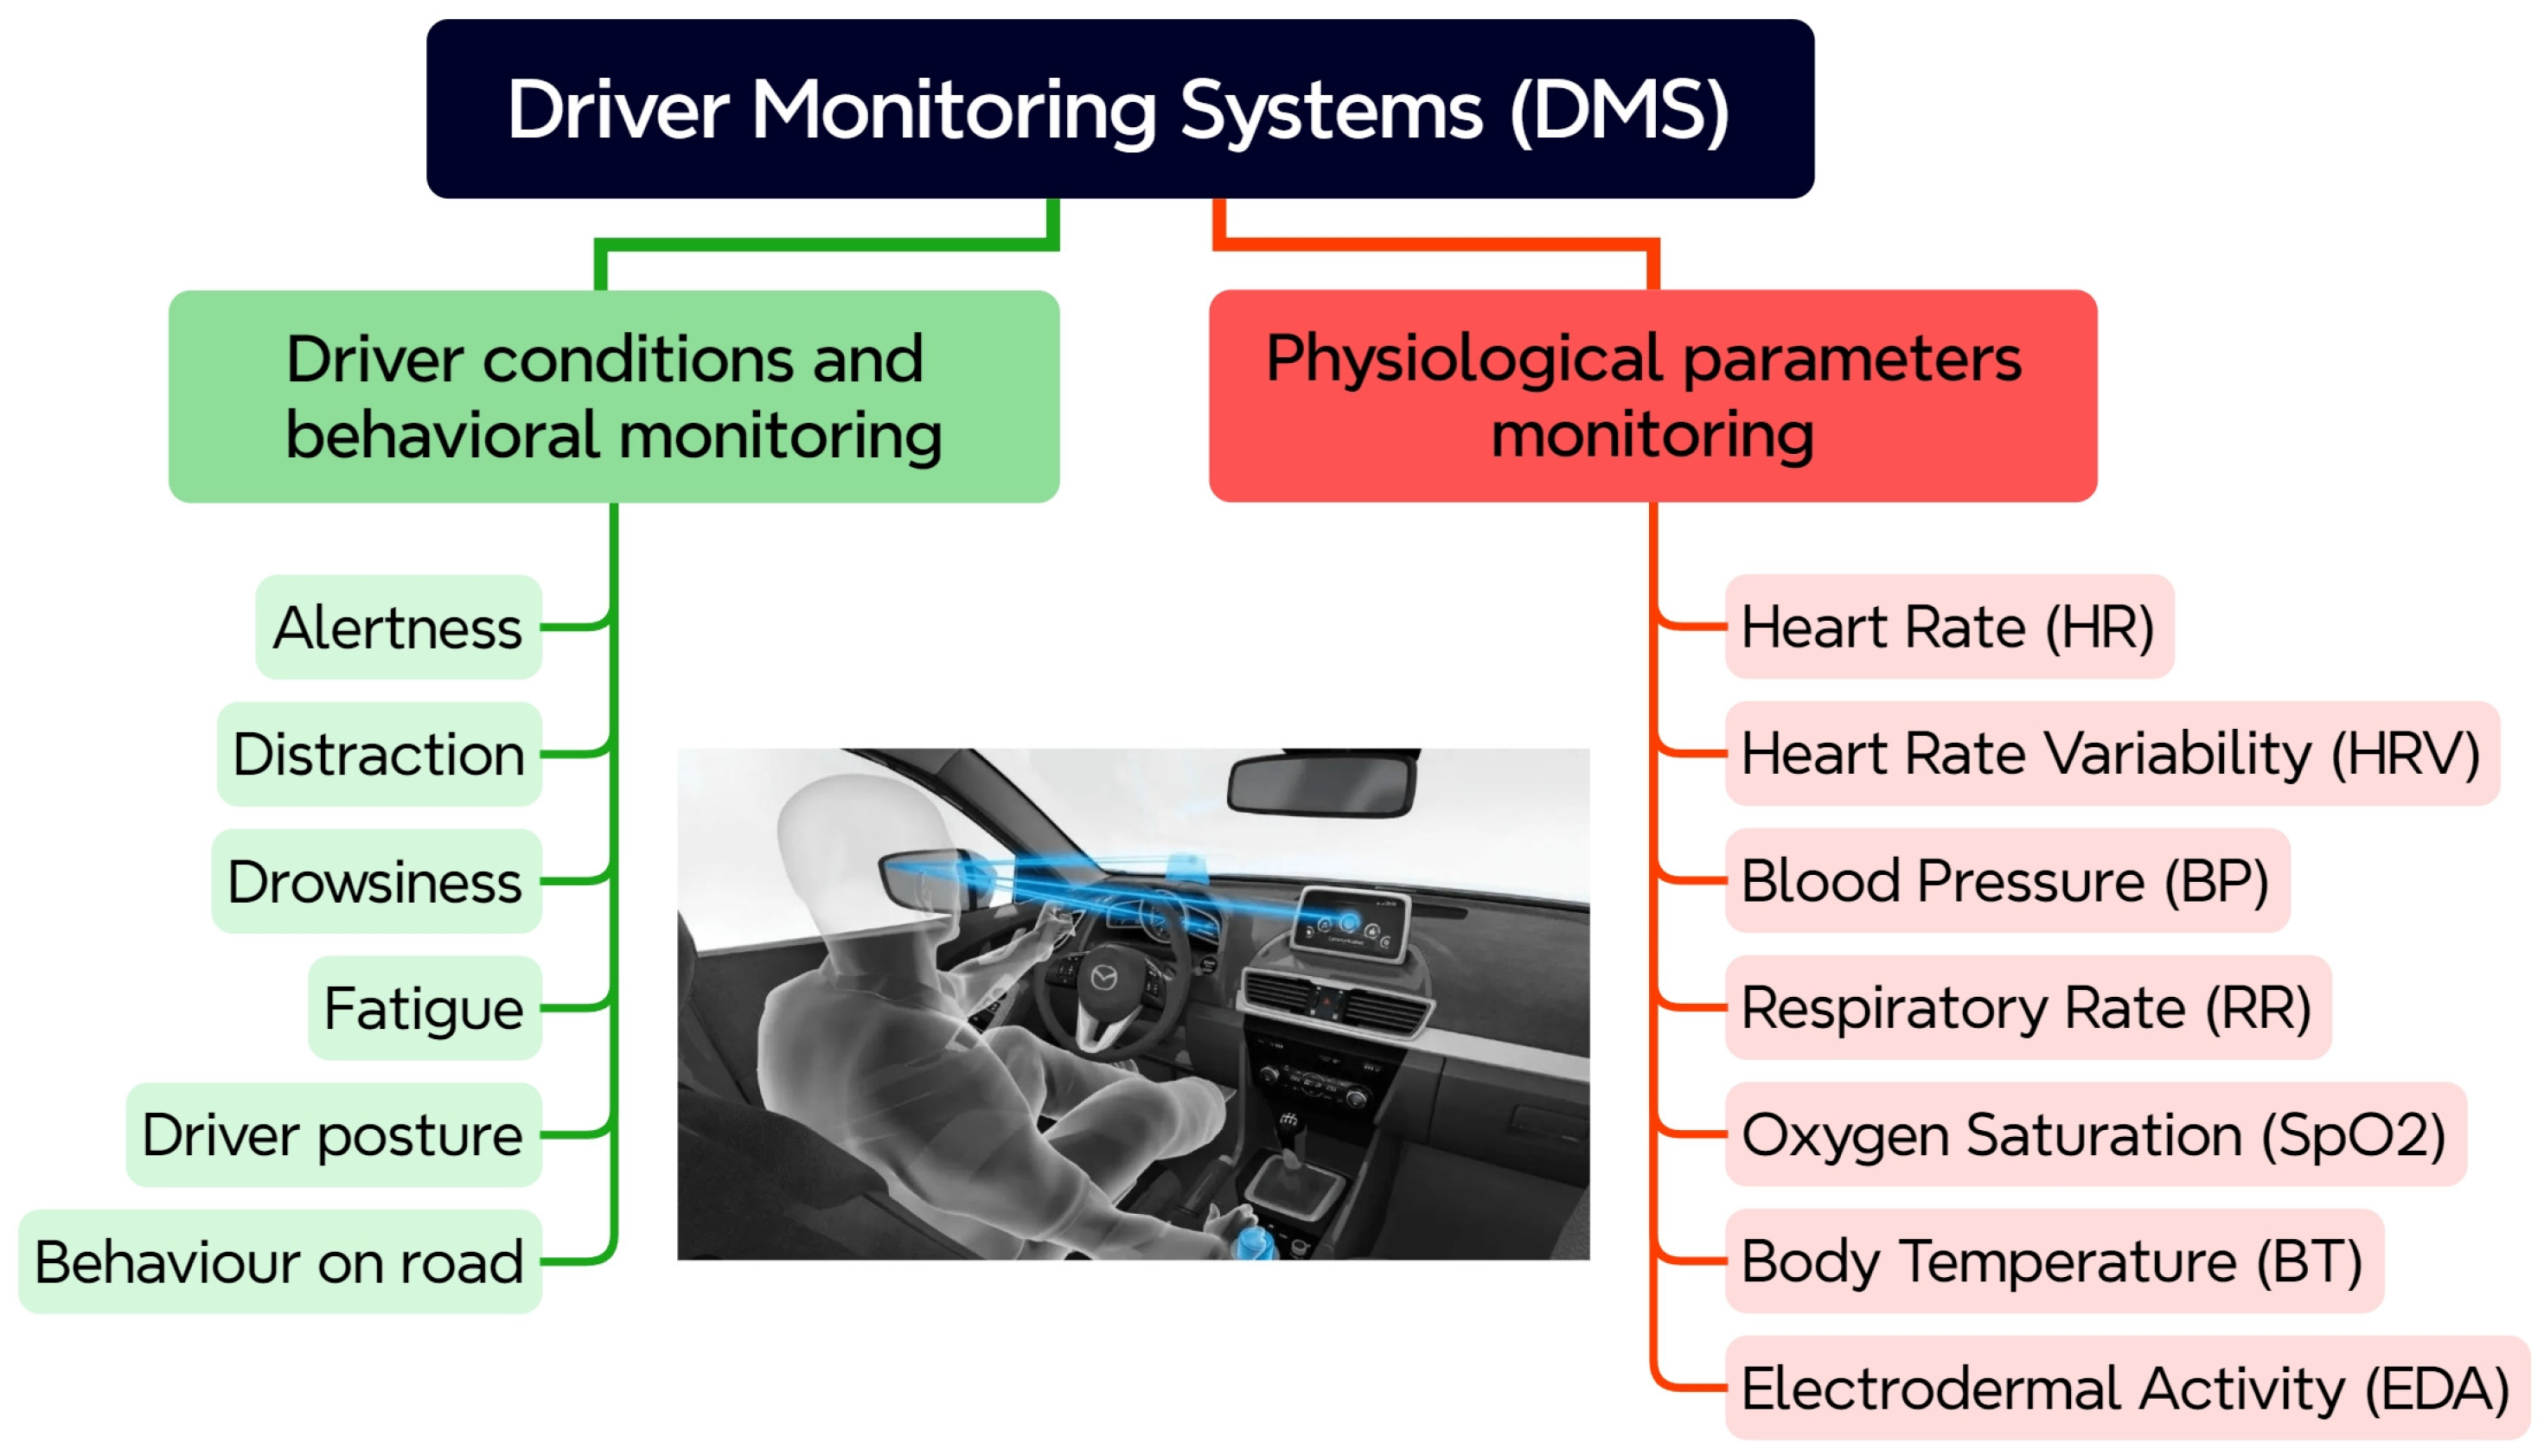
Depending on the monitored driver condition and parameters, DMSs can be divided into two groups, as shown in
Figure 1. The first group encompasses existing DMSs, which are focused basically on behavioral and observable cues. Typically, these are behavioral characteristics and states, such as alertness, distraction, drowsiness, fatigue, driver posture, and behavior on the road. Since these DMSs rely primarily on observable behavioral cues, their limitations in accurately and proactively assessing driver state are becoming increasingly apparent. Physiological parameters, acquired from measuring biological signals, offer a promising alternative for addressing these limitations. In the second group, “future” systems, with a focus on integration of biometric sensors for monitoring vital physiological parameters of the driver, are present. These physiological parameters can be used as valuable indicators of sudden occurrence of a health problem and a useful metric for providing feedback on the driver’s state.
A set of physiological parameters that are crucial for the driver’s health state assessment and their relevance to driving is presented in the following subsections. These parameters have been chosen based on their established correlation with the driver’s state and their feasibility for real-time monitoring in a vehicle environment.
2.1. Heart Rate (HR)
Heart rate, also referred to in the literature as “pulse rate” or “pulse rhythm”, indicates the number of heart beats per minute (bpm). Usually, in DMSs the HR parameter is used as an indicator to assess the driver’s fatigue or drowsiness, as it is well known that the electrical activity of the heart is regulated by the central and peripheral nervous systems [
12]. For example, the HR decreases if the driver is drowsy. On the other hand, an increased HR can indicate stress, anxiety, or physical exertion, all of which can impair driving performance. The range of HR values considered normal is between 50 bpm and 110 bpm [
13]. The values above 110 bpm indicate tachycardia and below 50 bpm indicate bradycardia. According to emergency care protocols, HR values above 130 bpm and below 40 bpm are indicators for immediate admission in intensive care units. The HR monitoring can provide valuable information about the driver’s cardiac activity, and risk conditions, such as stroke, heart attack, and cardiac arrest, can be detected in the first hours of their occurrence.
2.2. Heart Rate Variability (HRV)
Heart rate variability is another physiological parameter related to cardiac activity. It is quantified by analyzing the variations in the time intervals between consecutive normal heartbeats. HRV contains information about the neurohumoral factors regulating the cardiovascular system, which can then be used to assess conditions and prevent cardiovascular diseases. Reduced HRV is associated with fatigue, stress, and impaired cognitive function. Typically, in DMS, the HRV parameter is used as an indicator to assess the stress level of the driver. For example, under stress, HR usually increases and HRV decreases. Lower HRV corresponds to higher levels of stress and indicates a driver’s reduced ability to handle complex driving tasks or react quickly to emergencies. HRV can also be a good indicator of fatigue onset [
14]. The interval between two heartbeats can vary within a given range for normal cardiac activity, but if HRV goes outside this range, it can be an important indicator for predicting ischemic heart disease or angina pectoris, cardiac death, and arrhythmias. Depending on internal and environmental circumstances, HRV data vary between people and over time within individuals [
9], so it is important to monitor the trend of individual changes in a driver’s HRV.
2.3. Blood Pressure (BP)
Blood pressure is a measure of cardiovascular health and stress response. It is a vital physiological parameter that can be a valuable indicator of the onset of sudden illness or a life-threatening medical condition. In 2017, new guidelines from the American Heart Association defined 120 mmHg systolic and 80 mmHg diastolic as the thresholds for a normal blood pressure range. Values above these thresholds define three different stages of high blood pressure (hypertension), and blood pressure values higher than 180 mmHg systolic and higher than 120 mmHg diastolic (stage 3) are considered critical. On the other hand, values below 90 mmHg systolic and below 60 mmHg diastolic are defined as low blood pressure (hypotension). While low blood pressure presents with typical symptoms of confusion, dizziness, blurred vision, weakness, and fainting, high blood pressure is usually asymptomatic but is a major risk factor for heart attack, heart failure, stroke, and kidney disease [
15]. Sudden spikes in BP can occur during stressful driving situations. Chronic hypertension can increase the risk of cardiovascular events while driving.
2.4. Respiratory Rate (RR)
Respiratory rate is a vital physiological parameter that is a useful metric for assessment of breathing and lung respiratory function. It indicates the number of breaths per minute (brpm). Respiratory rate, along with heart rate, blood pressure, and body temperature, is considered as one of the critical vital parameters for monitoring human health status [
16]. For example, a sudden change in the heartbeat and abnormal breathing indicate the onset and progression of diseases, such as sudden cardiac death, asphyxia (choking), etc. [
17]. Different medical emergency teams have different definitions for normal and abnormal RR values, but recent investigations suggest that adults with a RR greater than 20 breaths/min are likely to be unwell, and those with a RR greater than 24 breaths/min are likely to be critically ill [
16]. For example, RR values above 27 breaths/min have been reported to be the most important predictor of cardiac arrest in hospitals [
18]. Respiratory rate has shown a high degree of effectiveness for detecting drowsiness and fatigue in automotive applications [
19,
20]. During drowsiness, the respiratory rate slows down, so it can be used as a valuable indicator for the assessment of the driver’s state. In contrast, rapid (hyperventilation) and shallow breathing can indicate stress or anxiety and can lead to dizziness and impaired judgment.
2.5. Oxygen Saturation (SpO2)
In clinical practice, a commonly used method for assessing the quality of respiration is pulse oximetry, which provides information on oxygen saturation. Oxygen saturation measures the percentage of hemoglobin saturated with oxygen in the blood. The normal range of SpO2 is between 96% and 100%, while the values between 85% and 95% are considered abnormal [
21]. Low SpO2 may indicate respiratory problems or oxygen deficiency (hypoxia), which can cause cognitive impairment. The values below 85% are critical, which indicate that the lungs are not functioning well and can lead to unconsciousness. In terms of driving, low SpO2 may be an indicator of underlying health problems that affect driving ability and may also impair the driver’s cognitive function and reaction time [
22].
2.6. Body Temperature (BT)
Changes in body temperature may be related to circadian rhythm effects but can also indicate fatigue or illness. The normal range of BT is 36.5–37.5 °C [
21]. BT below 35 °C is defined as hypothermia, with symptoms including shivering, confusion, and loss of coordination. BT higher than 38 °C is defined as hyperthermia, and extremely high BT above 40 °C is considered critical. Body temperature can affect the driver’s condition and cause various problems, such as respiratory and cardiovascular stress and muscle problems, which can lead to the driver’s inability to control the vehicle. It is known from medical practice that fever or extreme body temperature can impair cognitive functions and reaction time [
23], and thus seriously impair driving ability. Drowsiness can also be associated with a slight decrease in body temperature.
2.7. Electrodermal Activity (EDA)
Electrodermal activity measures changes in the electrical conductivity of the skin, which is influenced by sweat gland activity. It reflects changes in emotional arousal and stress. The variation of the electrical properties of the skin in response to sweat secretion is expressed either as a response to skin conductance or as a change in the skin conductance level. The measured signals are, therefore, composed of the superposition of two components: a constant component—the skin conductance level (SCL)—and a variable component—the skin conductance response (SCR) [
24]. The constant component represents the skin conductance value, which is determined by the average level of conductance created by sweat secretion over a certain time interval. The SCL varies depending on the physiological states of the driver and autonomic regulation, with variations in the SCL value being very slow, with frequencies in the range of 0 to 0.05 Hz. The variable component can be observed when the sympathetic nervous system is activated, which leads to a change in the level of skin moisture. The SCR is represented by a peak or a series of peaks with different amplitudes, slopes, and attenuations. Typically, the frequency range of the variable component is from 0.05 to 1.5 Hz. The values of SCL and SCR components are strictly individual. When the purpose of monitoring is a specific state of the driver, for example, stress, fatigue, or drowsiness, changes in these parameters are indicative. So, it is important for DMSs to monitor the trend of individual changes in these parameters. In driving, an increased EDA can indicate stress, anxiety, or emotional distraction [
25]. It can be useful as a measure of a driver’s emotional response to driving situations.
2.8. Conclusions on the Monitoring of Vital Physiological Parameters
The significance of monitoring the described physiological parameters can be considered in the following aspects:
Provide objective, quantifiable data on the physiological state of the driver.
Detection of early signs of sudden illness and life-threatening medical conditions before the driver shows overt symptoms.
Combining multiple parameters enhances the accuracy and reliability of driver state assessment.
Personalized monitoring and adaptation to individual differences.
Integration with advanced driver assistance systems to enhance safety.
Continuous monitoring of these physiological parameters in DMSs can significantly improve road safety and prevent accidents caused by changes in drivers’ health status.
3. A Taxonomy of Measuring Methods, Techniques, and Sensors in Physiological-Based DMSs
The main components of PDMS architecture comprise physiological signal collection, data processing, feature extraction, and classification methods for driver’s state assessment. In this study, the aim was to focus on the first component of PDMS and analyze various methods for collecting physiological signals from drivers, which differ in precision, accuracy, convenience, cost of implementation, and applicability in real-world driving conditions. First, a review of the measurement methods, techniques, and sensor modalities used for monitoring the physiological state of the driver in publications from recent years will be provided. Then, based on the review, a taxonomy will be proposed at the end of this section.
Specifically, the focus was on the methods for acquisition of physiological signals applied in DMS design and development. This included scientific articles in the recognized scientific databases Scopus and Research Gate over the past twenty years that used methods, techniques, and sensors to monitor physiological parameters considered important for the assessment of the driver’s health status, were implemented and tested in laboratory-simulated or real driving scenarios, and were written in English.
Studies using cameras to analyze facial expressions and body positions for the driver’s state assessment were excluded. Also excluded were studies and analyses that emphasized different approaches for data processing instead of methods, techniques, and sensors for signal collection, papers that duplicated already described measurement methods and sensors, and numerous conference proceedings with minor contributions. Finally, abstracts of selected papers were personally examined to verify their relevance to this study.
3.1. Electrocardiography (ECG)
ECG is a well-known method for measuring and recording the electrical activity of the heart with repeated cardiac contractions. Typically, the values of physiological parameters HR and HRV are determined from an electrocardiographic signal obtained non-invasively. Except for these two parameters, in driver monitoring systems, the ECG signal can be used for monitoring the RR parameter, since it is known that the amplitude of the QRS complex is modulated by respiration. So, the respiration signal can also be extracted from the ECG signal. This technique is called ECG-derived respiration. In addition, the ECG signal, in combination with the photoplethysmography signal, can be used for non-invasive cuffless measurement of BP. In DMS, ECG recording can be performed using contact, non-contact, or hybrid sensor techniques.
3.1.1. Contact ECG Sensors
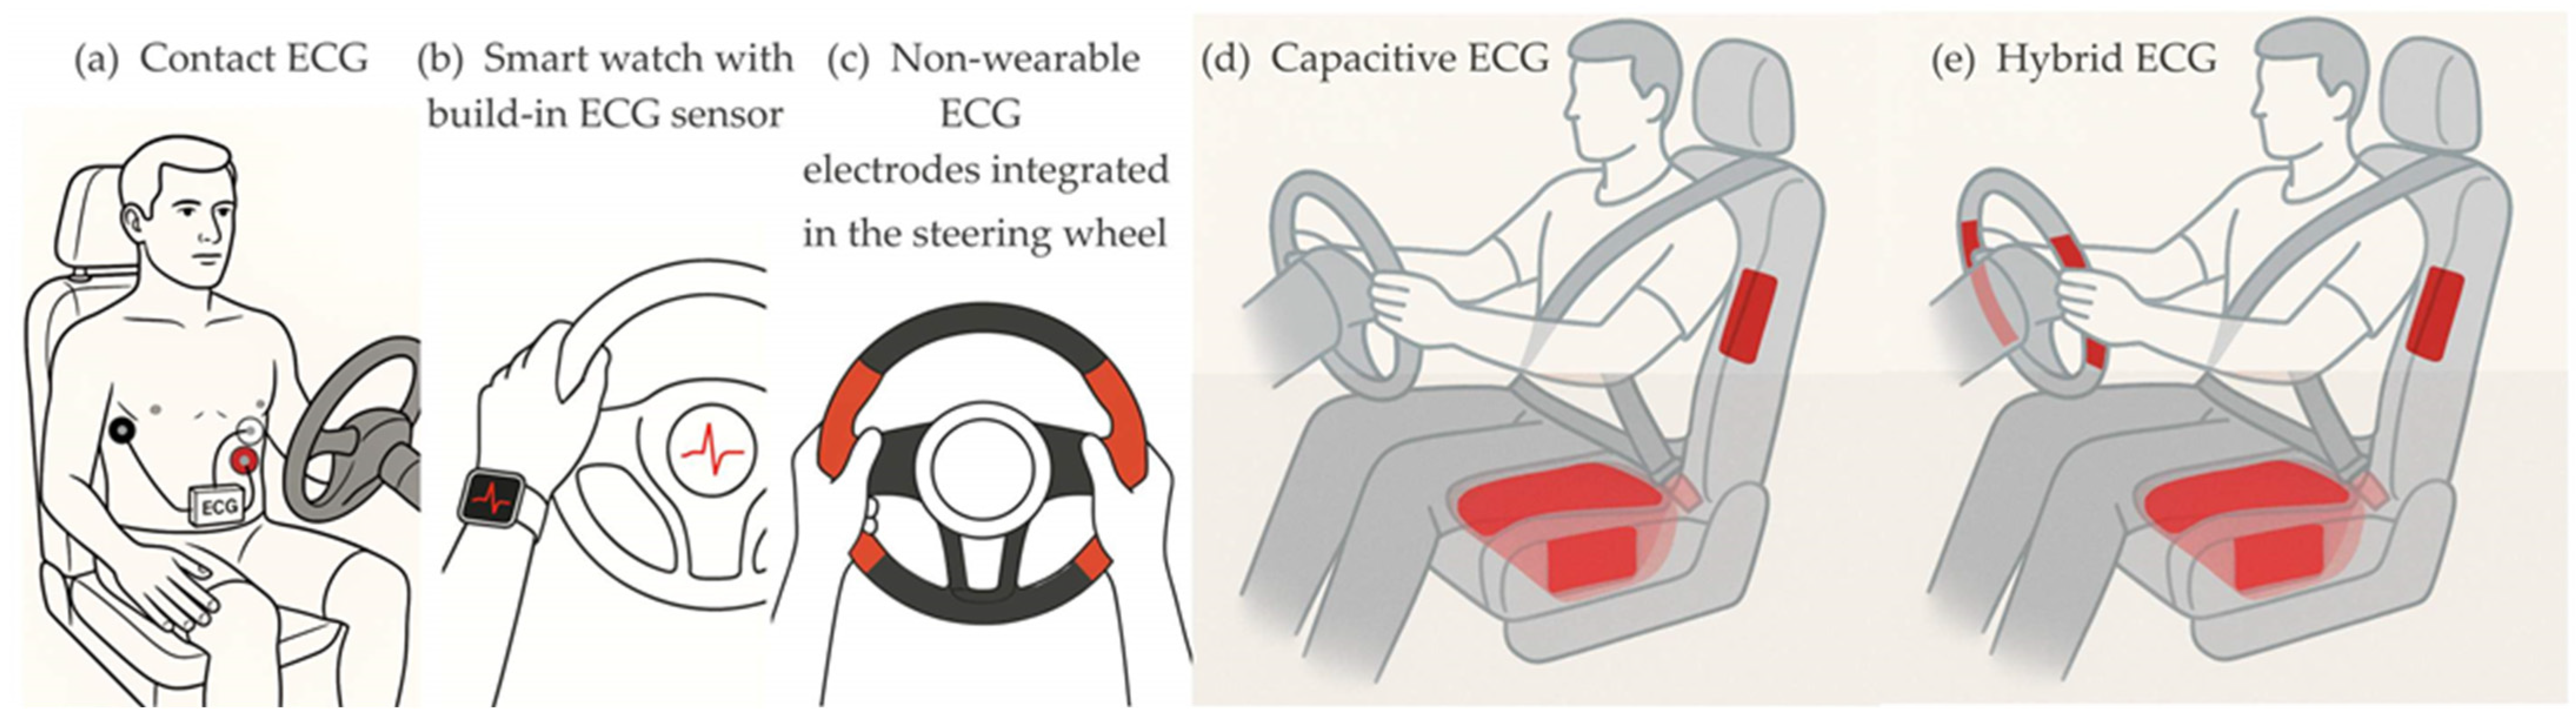
The classical contact method for real-time ECG signal acquisition involves three disposable electrodes attached to the driver’s skin. This method is reliable, using adhesive electrodes made of silver with a thin coating of silver chloride (Ag/AgCl) placed around the chest, as shown on
Figure 2a. A small portable device with an embedded ECG module records the voltage changes and transmits the signal via Bluetooth to a smartphone or a laptop [
26]. Direct and close contact with the driver’s cardiac region allows the generation of a reliable and high-quality ECG signal, which can be used also as a gold standard for evaluation of other methods. However, during long periods of driving, the self-adhesive electrodes can cause discomfort to the driver or peel off when sweating. They are sometimes perceived as intrusive by the driver.
A promising alternative to wearable ECG modules is a wearable wrist-worn device with a built-in ECG sensor (
Figure 2b), such as the smart watches that have been on the market in recent years (e.g., HUAWEI WATCH D2, Xiaomi Watch H1, etc.). Compared to the classical contact method for ECG recording, the advantage of the wrist-worn device is the lack of skin irritation and discomfort from stuck electrodes.
Various types of electrodes and their placements have been studied, developed, and implemented for ECG signal acquisition with contact non-wearable sensors. The placement of electrodes on the steering wheel is one of the early research ideas (
Figure 2c). In an attempt to quantify the stress level of a driver, Jeong et al. [
27] in 2007 investigated the mental workload of a driver and the corresponding stress response by examining HRV in the ECG signal obtained from a set of dry ECG electrodes placed symmetrically on both sides of the steering wheel at the level of the central horizontal axis. In the same year, Lee et al. [
28] presented their study using dry electrodes made of copper tape integrated into the steering wheel symmetrically on both sides at a level above the central horizontal axis. In 2010, Shin et al. [
29], and later in 2014, Jung et al. [
30], presented steering wheel electrodes based on conductive fabric. In 2010, Heuer et al. [
31] published their multi-sensor system, allowing measurement of ECG, skin conductance, and skin temperature with dry contact electrodes placed on the steering wheel symmetrically on both sides at the level of the central horizontal axis of a test car. At the same time, D’Angelo et al. [
32,
33] demonstrated a multi-sensor system integrated into the steering wheel of a test car. In their design, the conductive electrodes for ECG recording are integrated into the steering wheel, gear lever, and left armrest. The authors reported collected ECG data from the steering wheel sensor electrodes during 81% of the driving time. In 2012, Gomez-Clappers and Casanella [
34] presented a steering-wheel-mounted ECG demonstrator that used four dry ECG electrodes. The two-electrode pairs were mounted symmetrically on both sides of the steering wheel at the level of the central horizontal axis. In the same year, Plácido da Silva et al. [
35] demonstrated that dry Ag/AgCl electrodes mounted on the steering wheel could capture ECG signals with high quality, similar to the classical contact method. In 2014, Jung et al. [
30] proposed a design including two couples of conductive fabric electrodes placed on the steering wheel symmetrically on both sides at a level below the central horizontal axis. In 2015, Lourenco et al. [
36] developed a system for continuous acquisition of ECG signals by sewing a conductive fabric to a standard steering wheel cover. Further, the company CardioID developed an ECG sensor integrated into the steering wheel for monitoring the ECG signal (CardioWheel). In 2025, Khan et al. [
21] proposed a design for a driver health monitoring system with ECG sensor electrodes located on the left and right sides of both the upper and lower parts of the steering wheel, where the driver typically holds the steering wheel most of the time while driving. The front or rear electrodes are used interchangeably for ECG recording, thus ensuring driver comfort. In laboratory tests with ten participants, the authors reported a mean absolute error of 1.5 bpm for HR measurements from the ECG sensor compared to a standard medical device. In these developments, the ECG signal is acquired continuously and unobtrusively from the driver’s hands while the user is driving, via sensors embedded in the steering wheel. However, the reliability of these contact non-wearable sensors is highly dependent on the driver’s good grip with both hands of different parts of the steering wheel. Too many steering wheel movements and changes in grip position, as well as the habit of some drivers to steer with one hand, pose a problem for continuous ECG monitoring.
3.1.2. Non-Contact ECG Sensors
Unlike contact techniques for ECG signal monitoring, the non-contact acquisition does not rely on galvanic contact with the driver’s body. The ECG signal pickup is achieved through capacitive connection (
Figure 2d). Typically, capacitive electrodes are separated from the body by fabric or other textile layers, which is more comfortable for the driver, as they do not need to be in constant contact with the electrodes.
In 2008, Leonhardt and Aleksandrowic [
37] proposed capacitive ECG (cECG) acquisition with solid copper plate electrodes, coated with a protective acrylic paint, placed on the backrest of a car seat at a 45-degree angle to improve the signal-to-noise ratio (SNR) by simulating the typical axis of the heart. The reference electrode (“right leg”) is also placed in the backrest around the other electrodes. This design can be considered as one of the precursors from which a wide variety of sensor seats evolved over the next years. They differ in the number of electrodes, size, shape, locations, and material. Chamadiya et al. [
38] presented a concept for integrating textile capacitive electrodes into the driver’s seat. In this specific design, the electrodes are placed horizontally and laterally. However, the lateral placement of the electrodes does not seem optimal because the driver’s body may not completely cover the area above the electrodes. In 2011, Eilebrecht et al. [
39] published a design with six rectangular metal plate electrodes integrated into the backrest of the driver’s seat. The large-sized reference electrode is placed on the seat. This arrangement allows the strongest signal to be selected, considering the different pairs of electrodes. This also allows adaptation to different cardiac axes and to the torso size of different drivers. The practical applicability of this design was tested on the Ford testing track in Lommel (Belgium). The presented results show that ECG recording during driving is possible 85% of the time with three layers of clothing, with an increase to 93% when the driver’s clothing is two layers.
In 2011, Chamadiya et al. [
40] demonstrated pilot studies with textile, capacitive electrodes integrated into the backrest of a car seat. Two such electrodes were placed horizontally in the lumbar region, through which they recorded the ECG signal. In 2012, Schneider et al. [
41] developed a system for measuring vital parameters in a car, including a sensitive textile seat cover. Their design includes two sensing textile electrodes, located horizontally in the lumbar region of the backrest, and a reference electrode placed above the two sensing electrodes. The authors validated the performance of this capacitive ECG measurement system in real-world driving tests. They reported a sensitivity of up to 95.5% and a precision of up to 92.6%, paying special attention to the strong influence of vehicle dynamics on the quality of the ECG signal. They concluded that information about driving dynamics can be used to improve the precision of future capacitive ECG measurements. In the same year, Jung et al. [
42] presented another capacitive ECG monitoring system with two sensing and one reference electrodes integrated into the driver’s seat. The active measuring electrodes are flat copper plates, positioned horizontally relative to each other in the backrest, while the reference electrode is made of conductive textile and positioned on the seat.
3.1.3. Hybrid ECG Sensors
In 2008, Matsuda and Makikawa [
43], and later in 2013, Xu and Ta [
44], proposed the use of a conductive steering wheel electrode in combination with a capacitive electrode located in the driver’s seat (
Figure 2e). In this way, the disadvantage of the contact method due to the habit of steering with one hand can be minimized. This proposal combines the concepts of ECG measurements using both conductive and capacitive electrodes, hence its name—hybrid ECG monitoring.
3.2. Photoplethysmography (PPG)
Photoplethysmography is an optical measurement method used to record changes of blood volume in blood vessels. The PPG sensor integrates a light source (LED) and a photodetector (PD) to record the intensity of light that has passed through or been reflected from biological tissue. The intensity of the light changes depending on changes in blood volume at the location where the measurement is being made. Blood flow is pulsatile, and the resulting pulse wave can be detected in various parts of the circulatory system. Usually, in driver monitoring systems the PPG signal is used for monitoring HR and HRV, but it is known that the amplitude of the pulse wave is modulated by respiration. So, the respiration signal can also be extracted from the PPG for monitoring of the RR parameter. This technique is called PPG-derived respiration.
Blood pressure measurement is another notable application field of the PPG method. The relationship between BP, pulse transit time (PTT), and wave arrival time (PAT) is well known [
45,
46]. PTT is the time interval between the peaks of two PPG signals for one cardiac cycle, measured at two different locations on the body. PAT is the time interval between the R peak of the ECG signal and the subsequent peak of the PPG signal for the corresponding cardiac cycle. By using appropriate algorithms, the values of these parameters can be converted into BP values, but to implement this approach, two PPG sensors are required that simultaneously measure the PPG signals at a certain distance from each other. In 2021, Liu et al. [
47] proposed a PTT-based approach for continuous and cuffless BP measurement using single-site four-wavelength PPG signals (blue (470 nm), green (570 nm), yellow (591 nm), and red (635 nm)). The penetration depth depends on the wavelength of the light; therefore, the approach using multi-wavelength PPG signals can provide information about blood pulsations from different blood vessels located at different depths in the body. The time difference observed between PPG signals of different wavelengths obtained from the same body location can be considered as localized pulse transit time. Pulse wave analysis (PWA) is another recently used approach for cuffless blood pressure measurement using PPG signals [
48]. This technique is based on extracting various features from the PPG signal and training machine learning models to estimate blood pressure values.
In DMSs, the acquisition of PPG signals can be performed by using contact or non-contact techniques. In contact techniques, the PPG signal can be obtained from wearable or non-wearable devices.
3.2.1. Wearable PPG Sensors
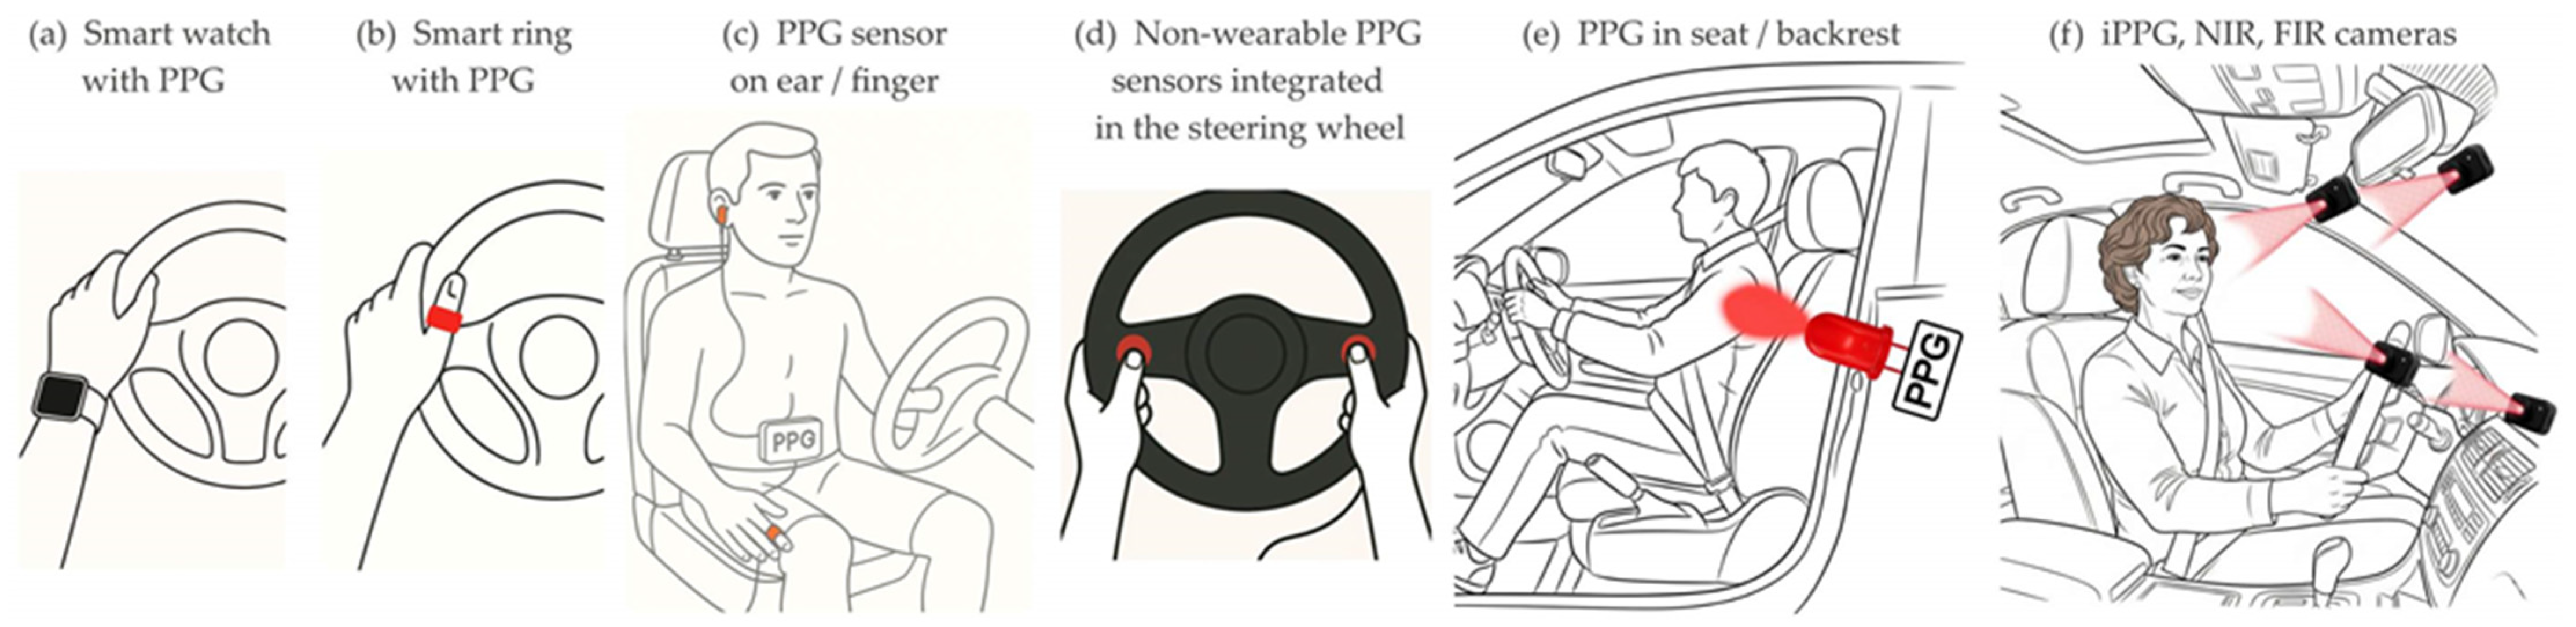
Wearable devices can be wrist-worn, such as smart watches (
Figure 3a), fitness bracelets, and smart rings (
Figure 3b) with an integrated PPG sensor [
49,
50], or portable PPG modules typically attached by clips to the driver’s ear or finger [
26] (
Figure 3c). Wearable PPG sensors measure the intensity of light reflected from the biological tissue under the sensor. Usually, the light source emits in the green spectrum with a wavelength of 520 nm.
In clinical practice, PPG signals with infrared (IR) and red wavelengths are used to measure oxygen saturation (SpO2), as it is well known that at these two wavelengths, the light absorption between oxyhemoglobin (HbO2) and deoxyhemoglobin (Hb) differs significantly [
51]. Some commercial smart watches with integrated PPG sensors, in addition to HR and HRV, can measure SpO2, using two wavelengths (usually red 660 nm and IR 910 nm) for collecting PPG signals.
3.2.2. Non-Wearable PPG Sensors
In DMS, non-wearable PPG sensors are usually integrated into the steering wheel (
Figure 3d). In 2010, the integration of a PPG sensor for HR monitoring in the steering wheel of a test car was demonstrated by D’Angelo et al. [
32]. Heuer et al. [
31] demonstrated SpO2 measurement from the steering wheel of a demonstration cockpit, in addition to contact ECG monitoring in the steering wheel and capacitive ECG monitoring in the seat. Also, in 2010, Shin et al. [
29] presented a steering wheel design incorporating conductive fabrics for ECG recording and a PPG sensor using infrared light with a wavelength of 940 nm.
In 2014, Futatsuyama et al. [
52] developed a sensor system for cuffless BP measurement using ECG and PPG sensors embedded in the steering wheel, correlating the two signals to measure the PTT and PAT values. In 2016, Arakawa et al. [
53] also presented a driving simulator using the same method with ECG and PPG sensors embedded in the steering wheel. This technique has the same disadvantages as those considered for the ECG measurement: it requires a two-handed grip on the steering wheel and its constant movement introduces interference.
A common drawback of the steering-wheel-integrated PPG sensor approach is that 100% sensor coverage cannot be guaranteed, as the driver must consciously cover it with their hand. Therefore, this technique can be useful for opt-in applications, but continuous monitoring requires driver involvement.
Radomski et al. [
54] in 2025 developed and validated a reflective PPG sensor integrated into the backrest of a car seat, which allows continuous HR monitoring through clothing (
Figure 3e). They used an LED with a wavelength of 657 nm (red light) and a high current value, which are optimal for penetrating through clothing and illuminating the skin underneath. In real-road driving with 12 participants, the results demonstrated high accuracy, achieving mean absolute error of 2.51 bpm. The authors pointed out the sensor’s sensitivity to driver movements, such as body shifts, stretching, or adjusting posture, which can introduce motion artefacts and affect signal quality, as a significant limitation for continuous monitoring.
3.2.3. Camera-Based PPG
An alternative variation of the classical PPG method is remote oximetry, which operates on the same principle as contact-based pulse oximetry. The principle of PPG measurement with reflected light can be extended to remote monitoring by a camera with a direct line of sight and a suitable light source of visible and/or near-infrared light (
Figure 3f). The camera-based PPG method, also known as Image PPG (iPPG), attracts ongoing scientific interest. The iPPG method is based on the fact that when the heart muscle contracts, the skin color changes due to the pulsation of the blood. The camera captures a video stream of the driver’s face images of the reflected light modulated by the change in skin color. From the captured subtle variations in skin color and cyclic body movements, respectively from the intensity of individual pixels, values of HR, HRV, and RR parameters can be calculated and monitored. Usually, the camera is placed in front of the driver on the windshield, on the center dashboard, or on the rearview mirror.
In 2014 and 2017, Zhang et al. [
55,
56] reported results on iPPG monitoring of heart and respiratory rates using RGB image processing and independent component analysis (ICA) in the visible light range. They used a web camera capturing facial images and applied FFT to calculate HR and RR values. While the earlier publication focused on laboratory experiments, the later publication included pilot measurements with one participant while driving a car. The results showed that the accuracy of the measurements depends on the ambient light and the distance between the camera and the driver’s face. In 2014, Guo et al. [
57] used the same method to continuously measure HRV in real-world driving conditions. A standard web camera captured a video stream (15 fps, 640 × 480 resolution) of the driver’s face and used it to calculate HRV. The facial image was divided into seven sub-regions, and an average HRV value was calculated from them using the ICA method applied to each region.
In 2017, Wu et al. [
58] presented an approach to measure the driver’s heart rate in a car by using RGB cameras. The results from laboratory experiments and test drives using an empirical decomposition algorithm to filter out motor artefacts were presented. A machine learning algorithm with a k-nearest neighbor (kNN) classifier was applied to the color features, thus receiving the accuracy of HR measurement approaching medical-grade devices. Similarly, in 2017, Blöcher et al. [
59] presented a web-camera-based online heart rate monitoring system for in-car applications. In laboratory conditions at rest and with constant ambient light, they reported an achieved sensitivity of 93%, but in real-world driving conditions the sensitivity was reduced to 84% due to motor disturbances. Superimposed noise is caused by changing light, frequent sharp braking and acceleration, and vibrations from uneven road surfaces. They identified the forehead as a suitable measurement region of interest because it is minimally affected by facial grimaces, which cause additional motor artefacts.
In 2018, Okada et al. [
60] conducted a study to obtain the pulse wave from RGB facial images through the changes in hemoglobin concentration over time. They used the ICA method to separate the RGB camera facial image into three components by the values of melanin pigment, hemoglobin pigment, and shadow intensity. In 2021, Liu et al. [
61] conducted a study with eight subjects for two weeks, filming their daily routes and capturing HRV data from facial images to assess the mental state of drivers. They used a web camera placed on the center dashboard, recording the driver’s face. After applying neural network algorithms, they reported 3.4% more accurate results compared to similar algorithms in other publications.
In the last decade, the use of active IR cameras (near-infrared—NIR) has also been proposed for use in DMSs. In 2015, Gücüyener [
62] proposed integrating an NIR camera with active LED illumination into a rearview mirror to monitor HR while driving. The presented results for heart rate measurement had a correlation coefficient of 0.95 with the reference signal. In 2018, Nowara et al. [
63] tested the practical applicability of an NIR camera with active 940 nm illumination in a vehicle to capture iPPG signals under controlled and variable ambient light. In parallel, they also evaluated the performance of an RGB camera. Comparing the results from the NIR and RGB cameras, they reported better performance of the NIR camera. However, despite the applied noise reduction algorithm in the raw iPPG images, the recordings from both types of cameras were significantly affected by the changes in ambient light, which considerably hindered iPPG measurements. Vibrations from a moving vehicle also negatively affected the performance of the cameras. The same team in 2020 [
64] implemented a new algorithm and hardware for monochrome imaging with a narrower NIR bandwidth of active illumination to overcome the described shortcomings. Despite the better results, they noted that further improvements will be needed for integration into a real DMS.
In 2022, Guo et al. [
65] demonstrated a driver monitoring system with a NIR time-of-flight (ToF) camera. They measured HR and RR parameters by simultaneously capturing grayscale images and the distance to the driver by the ToF camera. This approach was chosen to compensate for the interference of variable light from NIR active illumination in HR monitoring. Motion artefacts in RR monitoring were compensated by directly capturing chest movements from the ToF camera, measuring the distance to the driver’s chest wall. The authors reported a mean bias for RR measurements of 1.4 brpm, and a success rate of 71.9% for HR measurements. In 2023, Lie et al. [
66] measured HR from a series of facial images using a camera with two different optical channels: RGB and NIR. The contribution of the study is the innovative application of several algorithms as noise reduction techniques.
3.3. Infrared Thermography (IRT)
Unlike visible and near-infrared imaging, far-infrared (FIR) thermography, also known as infrared thermography (IRT), is a passive method that relies solely on the thermal radiation from the driver depending on the temperature. This method has the advantage of independence from changes in ambient lighting. The beginning of physiological monitoring through the application of facial thermography starts with measuring the breathing dynamics (
Figure 3f). In 2015, Pereira et al. [
67] demonstrated that it is possible to track the nostrils and monitor the breathing dynamic not only in static subjects, usually sitting in a chair, but also during head movements. However, depending on the size of the subject, the angle of attack, and the individual tidal volume, the temperature changes during inhalation and exhalation are usually less than 1 degree Celsius. The applications of thermal cameras for continuous respiration monitoring could be extended to evaluation of cessation of breathing and respiratory rate. However, several factors, including the placement of cameras and the movement of the subjects, can influence their accuracy and reliability in these applications. Subsequently, Pereira et al. [
68] found that the cyclic ejection of blood from the heart to the head through the carotid arteries leads to periodic, mechanical, and vertical micromovements of the head and can also be used to monitor the HR using FIR thermography. In 2020, Kiashari et al. [
69] presented a drowsiness detection system using facial thermal imaging to acquire the driver’s respiration signal. Both the respiration rate and inspiration-to-expiration time ratio were calculated and used as input features, in order to train two machine learning classifiers. Based on the results from experiments conducted in a car simulator with thirty participants, they reported that both classifiers were able to detect drowsiness and achieved 90% accuracy, 85% specificity, 92% sensitivity, and 91% precision. Although not yet widely used in DMSs, the biggest advantages of this method are no energy is transmitted to the test subject, there is no harmful radiation, and thermal cameras can be used in complete darkness. Furthermore, by detecting infrared radiation generated by the body, non-contact continuous body temperature monitoring can be performed.
3.4. Bioimpedance Measurement (BIM)
Human tissue is an inhomogeneous and anisotropic electrical media. Within the human torso, the value of electrical bioimpedance is modulated by cardio and respiratory activity due to fluid movement and organ deformation.
3.4.1. Contact BIM Measurement
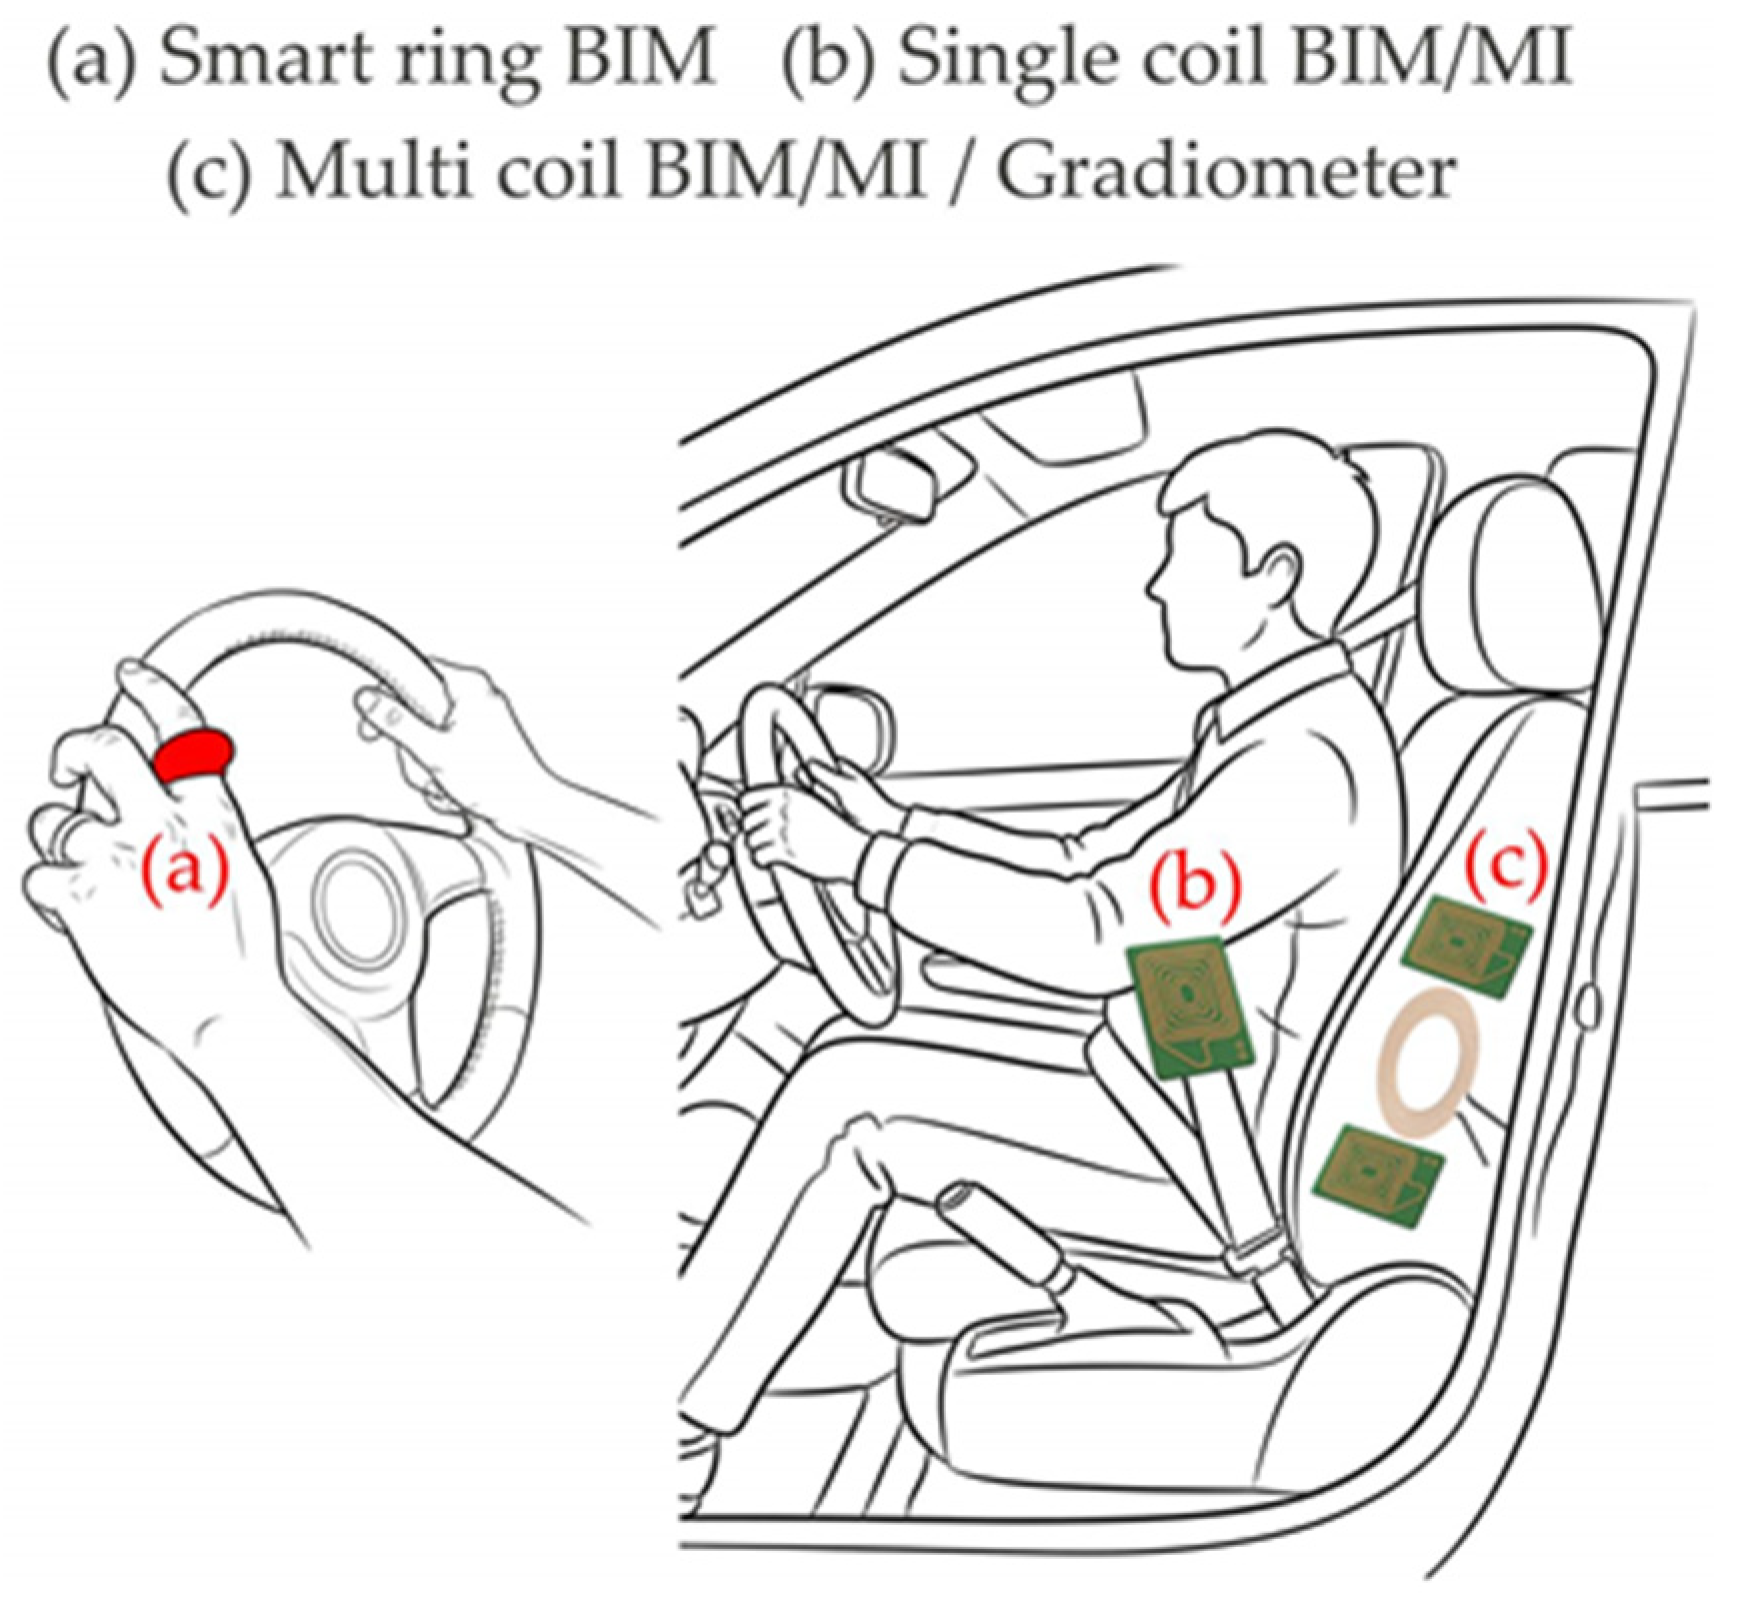
In 2023, Kaan et al. [
70] published detailed information about cuffless BP measurement in real time with a ring device (
Figure 4a). The development and validation of the ring using the 4-electrode bioimpedance measurement method are presented. The device measures impedance changes related to blood volume in the finger arteries. This approach overcomes the sensitivity of the PPG method to skin color and tissue structure. Different electrode configurations have been experimented with to achieve maximum accuracy in BP measurement. Machine learning was used to process the impedance data to predict BP in real time. The authors reported high accuracy achieved, with an error of 0.4 mmHg relative to reference values. The study was conducted in a laboratory setting and does not demonstrate what the results would be if the ring was used on a moving body part, such as a finger while driving. Nevertheless, this method provides opportunities for continuous physiological measurement, as the rings are easy to wear, are not heavy compared to other smart wearables, and ensure stable contact between the sensors and the skin at all times.
3.4.2. Inductive Bioimpedance Measurement (Magnetic Induction (MI))
Magnetic induction is a non-contact method for measuring intrathoracic impedance distribution. Its principle is based on electromagnetic coupling between a coil and the torso in its vicinity. When a high-frequency alternating current (typically with a frequency of 6 to 11 MHz [
71]) flows through the coil, this current induces a primary field that affects the tissue underneath, resulting in the formation of eddy currents flowing in closed loops perpendicular to the field. The eddy currents are modulated in amplitude, direction, and orientation by changes in blood and air volumes, and displacement of organ boundaries. The eddy currents create a secondary field that carries information about this modulation, dependent on the impedance of the tissue. The penetration depth is estimated to be approximately the diameter of the coil.
The inductive bioimpedance measurements can be implemented using a single-coil approach with frequency modulation or a multi-coil approach based on a gradiometer. Single-coil systems operate as part of a resonant Colpitts generator circuit. The coil serves as both a transmitter and a receiver and is part of the circuit for frequency setting. When the impedance of the coil changes due to the secondary field affecting the primary, this will cause a change in the generated frequency, which is the sensor’s output signal. This change in frequency is correlated with the physiological activity of the subject. In multi-coil systems, one coil is used as the transmitter and one or two are the receiver coils. When only one receiver coil is used, it should be placed in an orthogonal orientation to the transmitting coil to ensure that the primary field does not induce any voltages in the receiving coil. When two receiving coils are used, they are usually connected as gradiometers so that the primary field is almost completely compensated. In 2011, Walter et al. [
72] presented the integration of a single-coil sensor in the backrest of the car seat for bioimpedance monitoring. Although the results are preliminary, the usability of inductive bioimpedance measurement for respiratory monitoring while driving was demonstrated. Recently, Radomski and Teichmann [
73] evaluated the accuracy in RR monitoring of a similar single-coil sensor in the backrest of the driver seat for different real-world driving conditions and longer driving periods. The presented results demonstrated that motion artefacts significantly influenced the performance. The inductive bioimpedance sensor is sensitive to driver movements, especially during turning, acceleration, and deceleration phases, which creates difficulties in accurately monitoring RR. In 2017, Leicht et al. [
74] presented the PhysioBelt device, which includes an inductive bioimpedance sensor with a flexible coil sewn into the seat belt (
Figure 4b). In the same year, Vetter et al. [
75] reported an advance in gradiometer technology for automotive integration. The new sensor with one transmitting and two receiving coils forming a vertical gradiometer is integrated in the backrest of the driver seat (
Figure 4c). The reported results are preliminary and have not yet been extensively tested, but they demonstrate that both RR and HR can be monitored. In 2023, Linschmann et al. [
76] embedded an MI sensor in a pillow that monitors the vital parameters of a driver. The results confirmed the workability of the method, but some signals in the experiments were disturbed by superimposed spikes.
3.5. Ballistocardiography (BCG) and Seismocardiography (SCG)
Ballistocardiography is a non-invasive method based on the measurement of the body motion generated by the ejection of the blood at each cardiac cycle. A ballistocardiograph records the micro-vibrations of the body caused by the mechanical activity of the heart by using external pressure or strain sensors, whereas a seismocardiograph records the local vibrations of the chest wall in response to the heartbeat. The application of BCG sensors for driver monitoring has many similarities to BCG monitoring in a chair. In this posture, the sensor is normally placed on the chest (
Figure 5a). The attempts to integrate BCG sensors into car seats began in 2011 [
72] (
Figure 5b). The BCG signal was detected by a capacitive sensor mat based on a quasi-piezoelectric force transducer (EMFi sensor). The placement of this BCG sensor in the passenger seat of a SMART car was successfully demonstrated. With the car engine turned off, the mechanical action of the heart was visible in the acquired BCG signal, although the signal-to-noise ratio (SNR) of the BCG signal was not very high. However, data provided in [
72] show that movements and engine vibrations make BCG monitoring difficult in a running vehicle, and the superimposed artefacts do not allow correct signal interpretation. In 2018, Wusk and Gabler [
77] presented a method for measuring HR and RR using a BCG sensor placed in the passenger seat (
Figure 5c). The sensor was a liquid-filled bladder connected to a pressure transducer. Initial validation of this non-invasive seat sensor for HR and RR monitoring was performed in a controlled laboratory environment. In 2019, Shandhi et al. [
78] investigated the performance of a three-axis accelerometer and a three-axis gyroscope collecting SCG signals for continuous recording of vital signs in daily life. The sensors were mechanically attached to the participants’ chests through direct connection using attachment belts or textiles. The authors reported that the best accuracy for estimating the blood pre-ejection period was achieved by combining the gyroscope and accelerometer signals. Later, in 2022, Uskovas et al. [
79] proposed a SCG measurement system consisting of two accelerometers. The primary accelerometer measures chest vibrations in response to heartbeat. It is integrated into the seat belt located on the driver’s chest. The second accelerometer is used to eliminate the effects of external disturbances. It is located on the driver’s seat to measure vehicle vibrations and driver body movements.
3.6. RADAR Techniques
The methods for monitoring physiological parameters based on the radar technique use high-frequency electromagnetic waves that are emitted by a transmitter and reflected from the surface of the chest, thus carrying information about the displacement of the human chest and, to some extent, also depending on the depth of penetration, about the movements of internal organs. The reflected waves are captured by a receiver and further analyzed to get information about movements caused by both respiratory and cardiac activity. The type and shape of the emitted signal depends on the type of radar. There are four types of radars that can be used to detect drivers’ vital signs: continuous wave (CW) radar, frequency-modulated continuous wave (FMCW) radar, step-frequency continuous wave (SFCW) radar, and ultra-wideband pulsed radar (UWB-IR). An important specificity in the operation of radar sensors in DMSs is the high probability of interference with communication devices operating in the same location and sharing the same frequency spectrum, such as 5G, 6G, and IoT devices. To operate normally in the radio spectrum, all radar sensors must be compatible with standards and regulations for unlicensed activity for the respective countries. For Europe, the standards required for compliance are set by the European Telecommunications Standards Institute (ETSI) and European Communication Committee (ECC). For ultra-wideband pulsed radars [
80], the ranges 3.4–4.8 GHz and 6–8.5 GHz are used in DMSs, and for continuous wave radars of the types applicable in DMSs [
81], the ranges are 24–24.25 GHz and 76–81 GHz.
The CW radars emit a continuous, unmodulated, high-frequency signal. The echo signal is received and processed continuously. Their function is based on the Doppler effect, which is used to detect and capture the movements of breathing and heart activity. In DMSs, the CW radars are used because of their cost-effectiveness and relatively simple design. Over the past decade, a number of studies have been published related to radar applications for monitoring vital parameters, such as HR and RR, while driving. The different locations of the sensors are studied, aiming to find the optimal place in the interior of the vehicle [
82] (
Figure 6). In several studies, the radar system is located about half a meter in front of the driver, with the antenna pointed directly at their torso [
83], placed on and around the dashboard and center console, on the steering wheel, or located on the sun visor above the driver’s head with a field of view of their chest area [
84]. In other studies, the CW [
85] or FMCW [
86] radar sensors are integrated into the backrest of the driver seat in close proximity to the driver’s heart area. This placement ensures optimal detection of the driver’s HR and RR parameters by providing a stable and unobstructed line of sight to the driver’s chest area.
Unlike CW radar, FMCW radar can change its operating frequency during the measurement, thus the transmitted signal is frequency modulated. FMCW radars measure both speed and distance, which makes them suitable for monitoring drivers’ breathing and heart rate. In 2022, Wang et al. [
87] proposed a system for monitoring RR, HR, and HRV in the presence of drivers’ motion artifacts, using commercial millimeter-wave radio. The system performance was evaluated in a real driving environment, and the authors reported results for RR, HR, and HRV estimations, corresponding to the relative accuracies of 99.17%, 98.94%, and 94.11%, respectively. In 2023, Kawasaki and Kajiwara [
88] presented a system with a 60 GHz FMCW radar sensor for continuous measurement of chest wall displacements and monitoring HRV and blood pressure in drivers. The sensor was mounted on the steering wheel and the measurements were performed while driving. The results obtained had a correlation coefficient of 0.9 compared to the reference BP values measured by a cuff-based monitor. Although this study only included two drivers, the results indicate that future work in this direction has the potential to continuously measure systolic and diastolic BP values in DMSs.
SFCW radar emits a series of discrete tones in a stepped frequency sequence [
89]. An advantage of SFCW over FMCW signals is the use of a step-frequency variation of the emitted signal. This gives a possibility to apply compression of the signal in monitoring with this type of radar. By significantly reducing the number of measurements, the time to obtain a result can be reduced. The acceleration of the measurement process can be achieved by dividing the entire frequency band of the emitted signal into sub-bands, which are emitted simultaneously and in parallel instead of sequentially. Despite the advantages mentioned, there is still insufficient information about the application of this type of radar in DMS.
UWB-IR radars are based on time-of-flight measurements and often have separate transmit and receive antennas. They emit pulses in a wide frequency band. The interval between the emitted pulses is used to receive the incoming pulses reflected from the object under study. UWB-IR radars can detect fine micromotions, which makes them suitable for precise monitoring of the driver’s breathing and heart rate, but they have a more complex design and are more expensive compared to CW radars. In 2017, Leem et al. [
90] used UWB-IR (NVA6201) radar to measure HR and RR, and detect drowsiness and smartphone use while driving. The significant contribution of this study was the successful application of the radar method in real-world driving conditions. The presented results for measuring vital parameters in a “moving” driver showed a maximum error of ±1.2 brpm in RR values and ±2.5 bpm in HR values. In 2018, Schires et al. [
91] demonstrated the possibility of monitoring HR and RR parameters using a novel design of UWB-IR radar embedded in the backrest of a car seat. To increase the penetration depth of the electromagnetic pulses, the authors chose a carrier frequency of 3.9 GHz, using pulses with an approximate bandwidth of 2 GHz. In the same year, Yang et al. [
92] demonstrated 16 different positions of the UWB-IR (Xethru X2M200) radar sensor in a car to monitor the driver’s breathing and its immunity to engine noise. In urban driving, with the optimal placement of the radar next to the rearview mirror, the authors reported an error of 1.06 brpm in RR values.
3.7. Ultrasonic Sonar (US)
The method and techniques for measuring BP using ultrasonic sensors provoke the research interest. Schima et al. [
93] developed a system for monitoring BP based on the signal from a wearable watch device consisting of an ultrasonic transducer using the Doppler effect. They evaluated the accuracy of the proposed method in determination of the values of systolic blood pressure, HR, and signal quality in normal and arrythmia conditions. The maximum difference between blood pressure values assessed by ultrasound and stethoscope has been reported to be 4.6 mmHg. This method has the potential to be developed into small portable devices for non-contact real-time measurements. Another advantage is the measurement of small, distant objects. Therefore, in DMS applications, there will be more options in choosing a suitable location for placement, instead of the standard locations, such as steering wheel, dashboard, rearview mirror, etc. A prototype of such a system was developed by Arakawa et al. [
94] in 2018. A portable ultrasonic sonar was placed on the odometer visor to continuously measure the driver’s blood pressure (
Figure 7). It was evaluated in a driving simulator under laboratory conditions. The main disadvantages mentioned were related to the location of the sensor in the vehicle. When the ultrasonic sonar is mounted behind the steering wheel, it is obstructed by the driver’s hands when turning. Alternatively, if the sensor is mounted behind the seatback, the filling of the seatback causes relatively large interference.
3.8. Skin Conductance Measurement (SC)
Skin conductance measurement is a method of recording electrodermal activity by applying an external current to the skin. From an electrical measurement perspective, this is considered a two-wire resistance measurement. To achieve better contact between the skin and the electrodes, it is recommended to use disposable electrodes made of Ag/AgCl. In 2018, Malathi et al. [
95] presented the development of an embedded device for SC measurement on the wrist to detect driver drowsiness in real time. In 2020, Affanni [
96] proposed a dual-channel EDA sensor for acquiring data from the hands. The author pointed out the need for two sensor channels for SC measurement while driving, as the movement of the hands on the steering wheel led to significant motion artefacts. With a single-channel SC sensor, it is very difficult to separate the motion artefact from sympathetic activity. In 2024, Radev et al. [
26] presented a study on collecting physiological signals in real driving scenarios, on different road types and different sensor electrode locations, to determine the appropriate placement for obtaining a high-quality signal. The EDA measurement electrodes were placed in two locations—on the right palm (
Figure 8a) and on the middle and index fingers of the right hand (
Figure 8b). The presented results show that the EDA signals from the right palm were less affected by the movement of the hand during driving for all road types. In 2020, Distefano et al. [
97] used a wristband sensor (Empatica E4) for continuous measurement of SC in real-world driving scenarios with different road intersections (
Figure 8c). For assessment of the driver’s stress level, they introduced an Electrodermal Impact Index, calculated as the product of the number of SCR peaks and their average amplitude. In 2018, Darsi et al. [
98] presented a study on identifying dangerous driver states using a combination of driver characteristics, vehicle kinematics, and physiological indicators. The EDA signal was recorded via two electrodes attached to the palm of the non-dominant hand using a fingerless glove (
Figure 8d). Simulated driving tests were conducted with twenty-one participants. The ECG, RR, and SC signals were used to classify sleep deprivation (sleepiness versus alertness), and the authors reported a high achieved accuracy of 98.8%. In 2022, Ye et al. [
99] presented their development of a sensing platform with a flexible EDA sensor mounted on an off-the-shelf steering wheel sleeve (
Figure 8e). They investigated the influence of different forces applied by the driver’s hand gripping the sensor when holding the steering wheel while driving.
In summary, for each measurement method, detection technique, and sensor type,
Table 1 presents the advantages and disadvantages, as well as the physiological parameters that can be monitored.
3.9. A Taxonomy of Methods, Techniques, and Sensors for Acquisition of Physiological Signals in PDMS
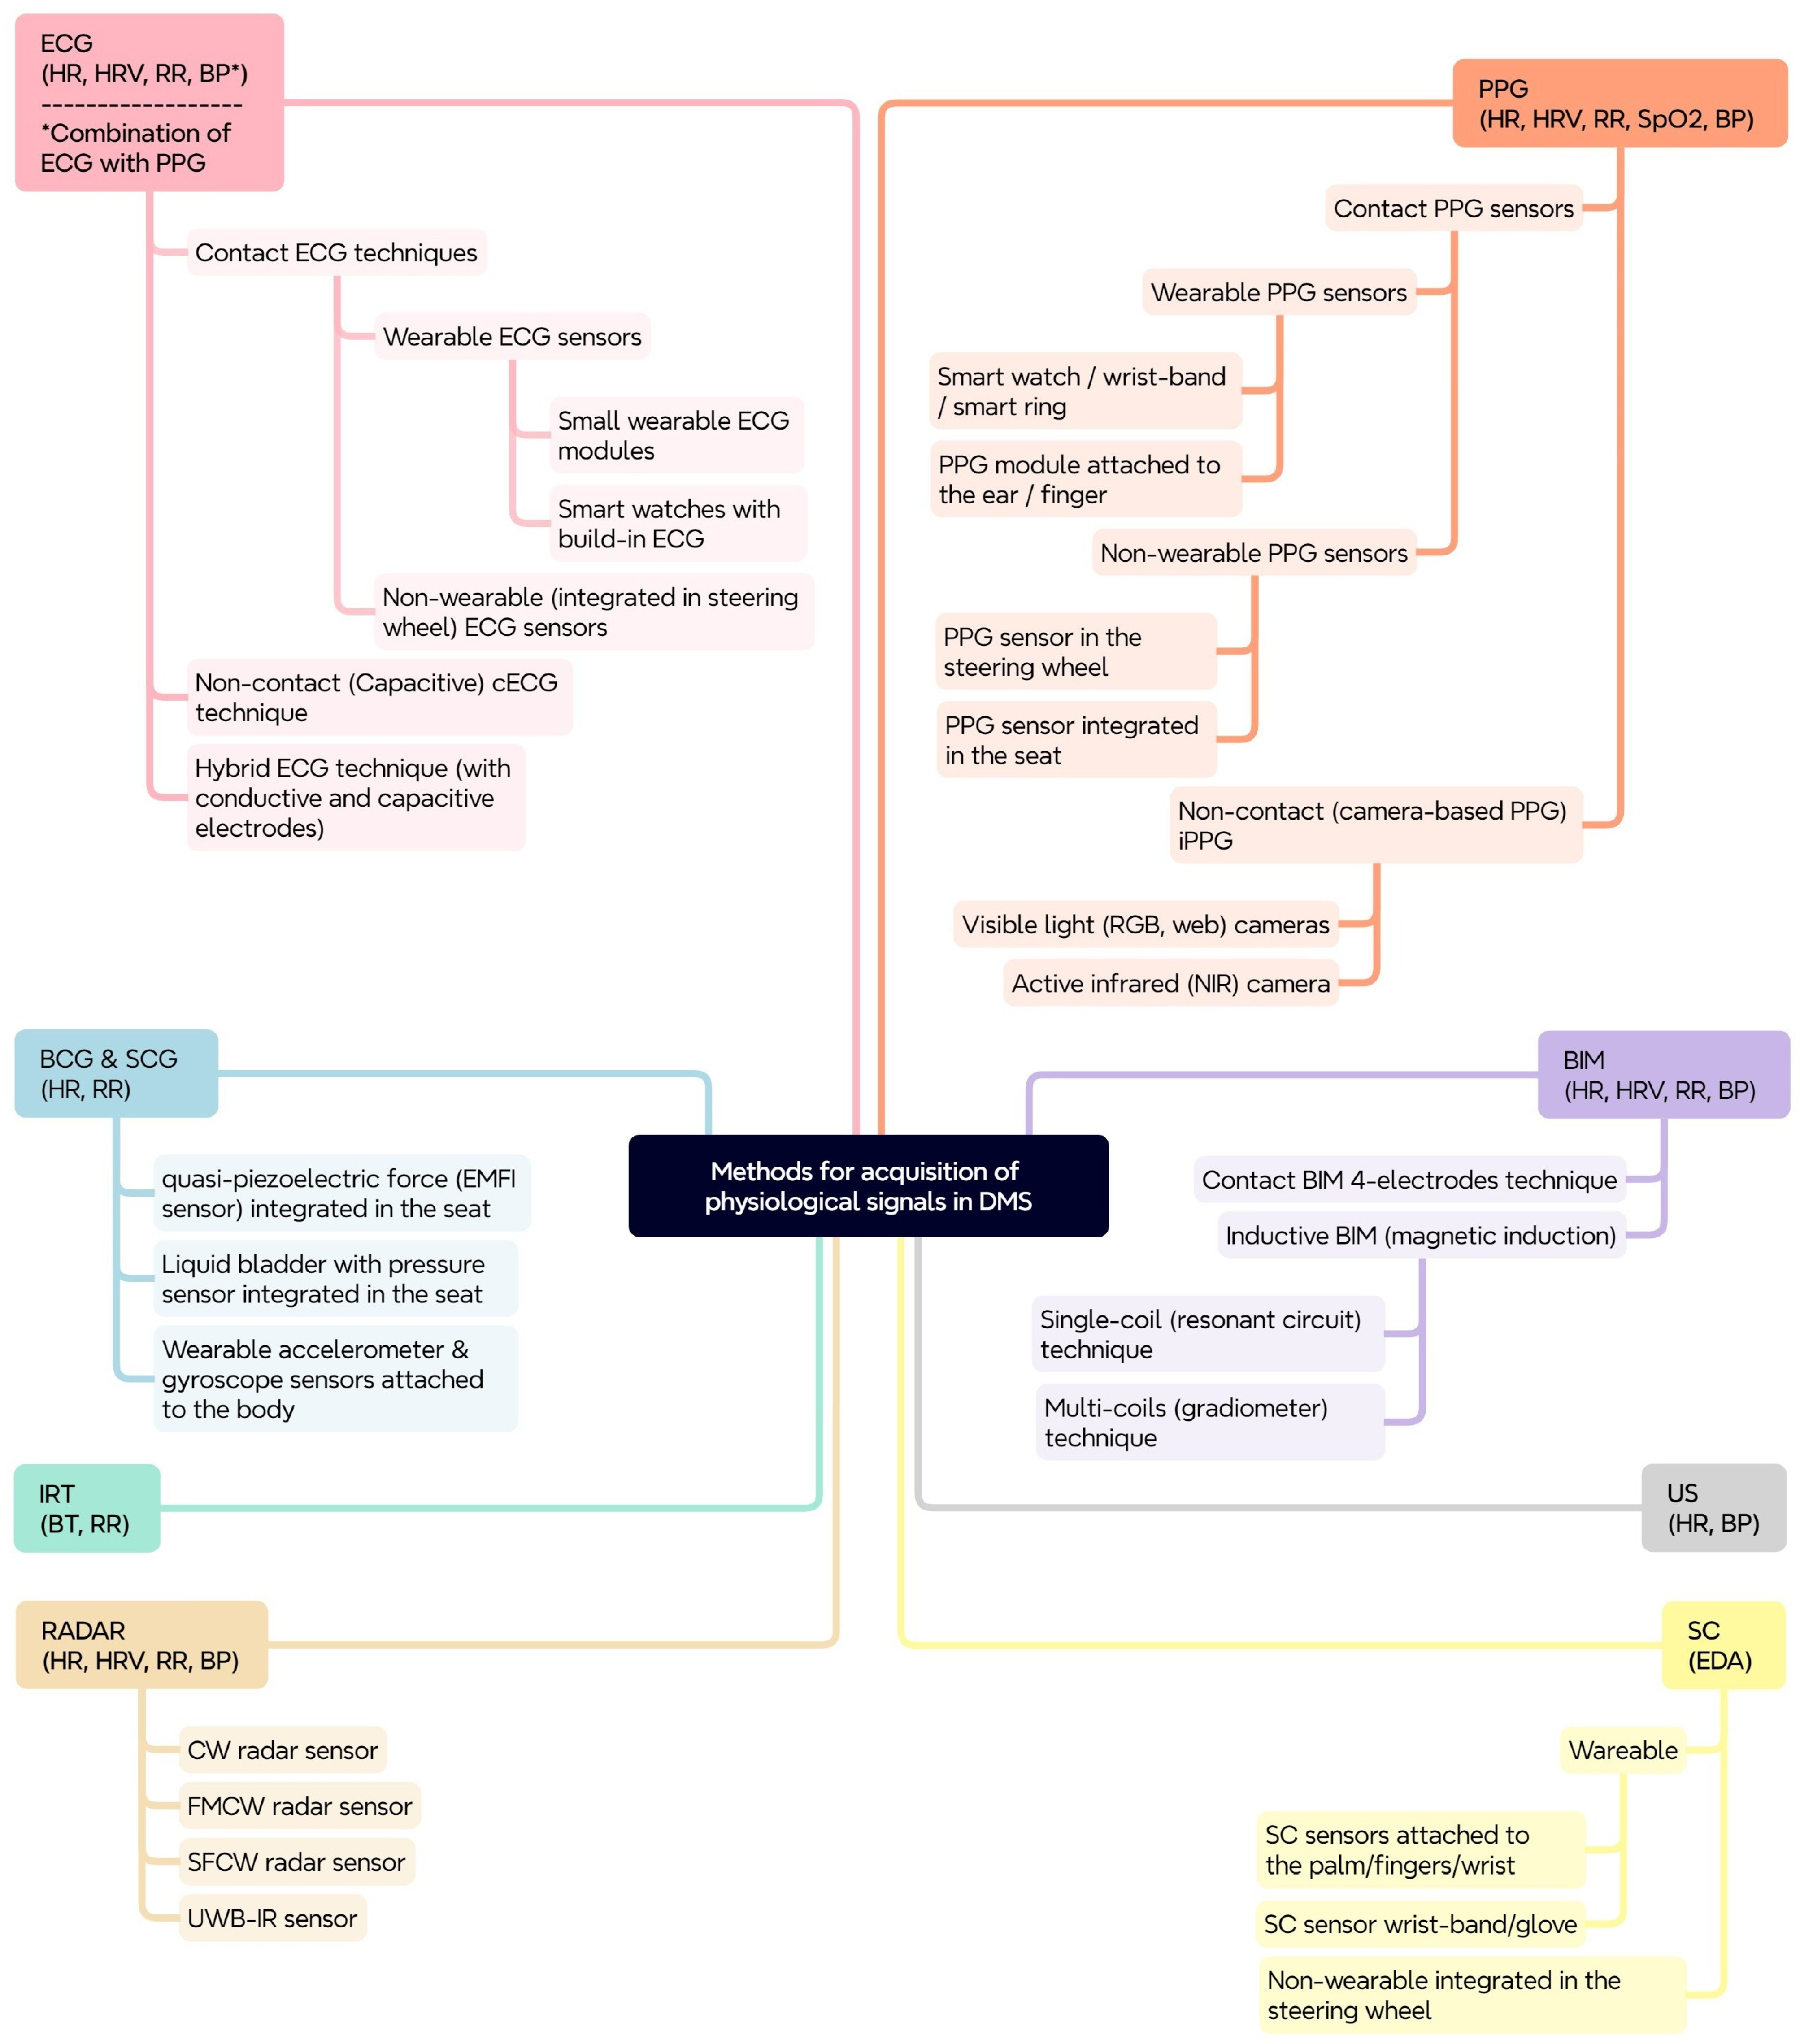
The proposed taxonomy aims to provide a structured overview of the methods, techniques, and sensors for acquisition of physiological signals for drivers’ physiological parameters’ monitoring, which can be used in the development of physiological-based DMSs. It highlights the shift from traditional behavioral monitoring to more advanced physiological monitoring for improving driver safety. The proposed scheme (
Figure 9) is based on a tree-like structure, where the primary layer represents the measurement methods, and for each method the next layers represent the variety of techniques and sensor modalities for obtaining physiological signals. The physiological parameters that can be monitored with the corresponding method are also shown (in brackets) in the figure.
The development of such a taxonomy is important for several reasons:
Systematic classification: It provides a structured general framework for categorizing and understanding the diverse set of methods and sensors used for physiological parameters’ monitoring.
Comparative analysis: It facilitates comparative analysis of the different methods and approaches, highlighting their strengths, weaknesses, and suitability for different applications.
Development guidelines: It serves as a guide for researchers and developers in the design and implementation of effective DMSs.
Advancement of the field: It contributes to the advancement of the field by promoting a systematic and comprehensive understanding of physiological-based DMSs.
4. Discussion
The research interest in the described methods, techniques, and sensors is different, and this is indicative of their successful application in the very dynamic and continuously vibrating working environment in the vehicle. Contact techniques with wearable sensors for recording ECG and PPG signals are mainly used by research teams as benchmark (gold standard) signals. Their accuracy correlates highly with clinical medical equipment. The most popular sensor techniques and methods used in publications are measurements with capacitive electrodes, cameras, and radars. Interest in capacitive electrode techniques was most significant in the period 2008–2018. Its end coincided with the increased interest in wearable, personal devices, such as smart watches and wristbands. Although, the motion artefacts while driving may limit the use of wrist-based wearable devices in a driving environment, too.
Camera monitoring is relevant for measuring HR, HRV, and RR parameters from video stream images. The ability to analyze facial expressions based on facial landmarks is a distinctive advantage of cameras. Despite significant (already mentioned) shortcomings in their operation, the research for implementation in real DMSs is devoted toward the application of increasingly complex deep learning algorithms to improve their accuracy and capabilities.
In recent years, an increased interest has been observed in the use of radars for physiological monitoring of drivers. Unlike RGB and NIR cameras, radars can directly measure RR and HR parameters together. In addition, recent research has focused on monitoring blood pressure. A number of publications investigated their appropriate placement inside the vehicle to minimize the influence of motion artefacts, which are the main problem for radars. The rapid development of the technologies in the field is increasing their operating frequency range, which helps to reduce the impact of interference from surrounding electronic equipment on the radar’s operation. This makes radars attractive for application in DMSs for continuous monitoring.
The possible locations of sensors in a vehicle are limited by the location of the driver. In order to minimize the superposition of interference in the recorded signal, the determining factors when choosing a location are the maximum working (contact or non-contact) area, minimum movements, or existence of obstacles in the working area. This identifies the steering wheel, seat, backrest, center console, dashboard behind the steering wheel, windshield, and rearview mirror as suitable sensor locations.
The application of BCG/SCG and inductive bioimpedance techniques for monitoring physiological parameters in vehicles is still limited to a few published studies. A potential reason is the mechanical movements of the driver’s body in the moving vehicle, since in an environment of sudden acceleration/deceleration and continuous vibrations, the difficulty in using these types of sensors is greater.
The potential for real-time blood pressure measurement using ultrasonic sonar, demonstrated in research in recent years, holds promise for the development of wearable devices or non-contact sensors integrated into the automotive environment.
There is a lack of application of smart rings for physiological monitoring in vehicles in scientific publications. A likely reason is that they are not yet widely available, as they have only been on the market for the last few years. The available information on smart rings shows high measurement accuracy and long battery life. Compared to smart watches and wrist-worn devices, their operating area is more static, which would maintain higher accuracy during wrist and hand movements while driving.
Monitoring of EDA parameters has proven to be a useful measure of the driver’s emotional response to driving situations, as well as for stress and anxiety detection. However, the motion artefacts in SC measurements may limit the use of wrist-based wearable devices in a driving environment. Since physical contact between the electrodes and the skin surface plays an essential role in signal quality, flexible EDA sensor electrodes, made of conductive fabric, mounted on the steering wheel or on a wearable sensor glove, are becoming increasingly attractive for continuous monitoring while driving.
To develop more robust and reliable monitoring systems in dynamic driving environments, the sensor data fusion approach can be applied. It can be implemented by using different sensor modalities or multiple sensors of the same modality placed at different locations, or even a combination of both, to obtain higher sensitivity and accuracy in monitoring a single physiological parameter. For example, a potential solution for continuous heart rate monitoring is to combine data from a radar sensor placed next to the rearview mirror with data from a smart ring with a PPG sensor. In this way, the gaps in the radar HR data collection due to artefacts from vehicle and driver body movements can be filled in with HR data from a smart ring. The ring sensor operates in a more static area with good contact with the driver’s finger and is less affected by motion artefacts. Additionally, the radar sensor can provide data for RR monitoring, and the smart ring can monitor HRV, which in combination with HR monitoring has been shown to provide valuable information for early detection of life-threatening medical conditions.
5. Conclusions
Measuring physiological signals in a car is a difficult challenge due to motion artefacts caused by vehicle vibrations and driver movements. The taxonomy proposed in this work provides a structured general framework for the development of physiological-based DMSs. By classifying the methods, techniques, and sensors for acquisition of physiological signals and discussing their principles, advantages, and limitations, this work will facilitate the design and implementation of more effective systems for enhancing road safety. The choice of methods and sensors depends on the specific requirements of the application, considering factors like accuracy, comfort, cost, and real-time processing capabilities. The integration of several physiological parameters, combined with advanced signal processing and machine learning techniques, enhances the robustness and reliability of the system for objective assessment of the driver’s condition. Increasing the accuracy and reliability of monitoring physiological parameters in DMSs provides the opportunity for early detection of sudden life-threatening medical conditions.
Future research should focus on refining the sensors and techniques, developing reliable algorithms for real-time analysis, and validating the performance of integrated systems in real-world driving scenarios.
A key challenge for physiological-based DMSs is the individual variability in drivers’ physiological parameters. Future systems should focus on generating a driver’s physiological profile and profile personalization using deep learning and data mining algorithms. Generating a personalized profile and adapting state classification thresholds to the individual values of physiological parameters for each driver will increase the effectiveness of health monitoring.


