1. Introduction
Several studies dealt with the potential host rock for a repository for high-level radioactive waste in Hungary [
1]. This is the Boda Claystone Formation (BCF); a formation with very low porosity and low permeability, that provides good retention properties for the repository. In addition to the intrinsic properties of the argillaceous rock, the host formation and the overlying and underlying formations must have specific favourable properties to be considered a possible site for a nuclear waste repository [
2,
3]. Exploration and investigation of the adjacent rock formations are critical, especially the investigation of the fracture networks that may developed across the formations. This is because the fluid flow in a claystone body could be related to its fracture system [
4,
5].
The caprock of the BCF is the Kővágószőlős Sandstone Formation (KSF), which has markedly different rheological and hydrogeological properties than the underlying impermeable claystone. Despite the uniform structural evolution, the different rheological properties of the formations could significantly influence fracturing and the resulting fracture system. Many aspects of fracturing are influenced considerably by the rheological properties of the host rock. Different rock types respond differently to the same stress field [
6,
7].
The deep well BAF–3 aimed to explore the caprock of the BCF and reached a depth of more than 800 m with a core recovery of almost 100%. The well intersected the KSF and drilled more than 400 m of the 700–900 m thick BCF. The boundary between the sandstone and the claystone formations is 343.08 m (reported depths are in total measured depth in metres throughout the paper). This borehole allows the differences in the properties of the fracture systems of different host rocks to be investigated and compared. This work aims to model the fracture network geometry of two different rock types in one borehole, investigate the differences in their natural fracture system, and evaluate the borehole hydrogeologically.
2. Geological Setting
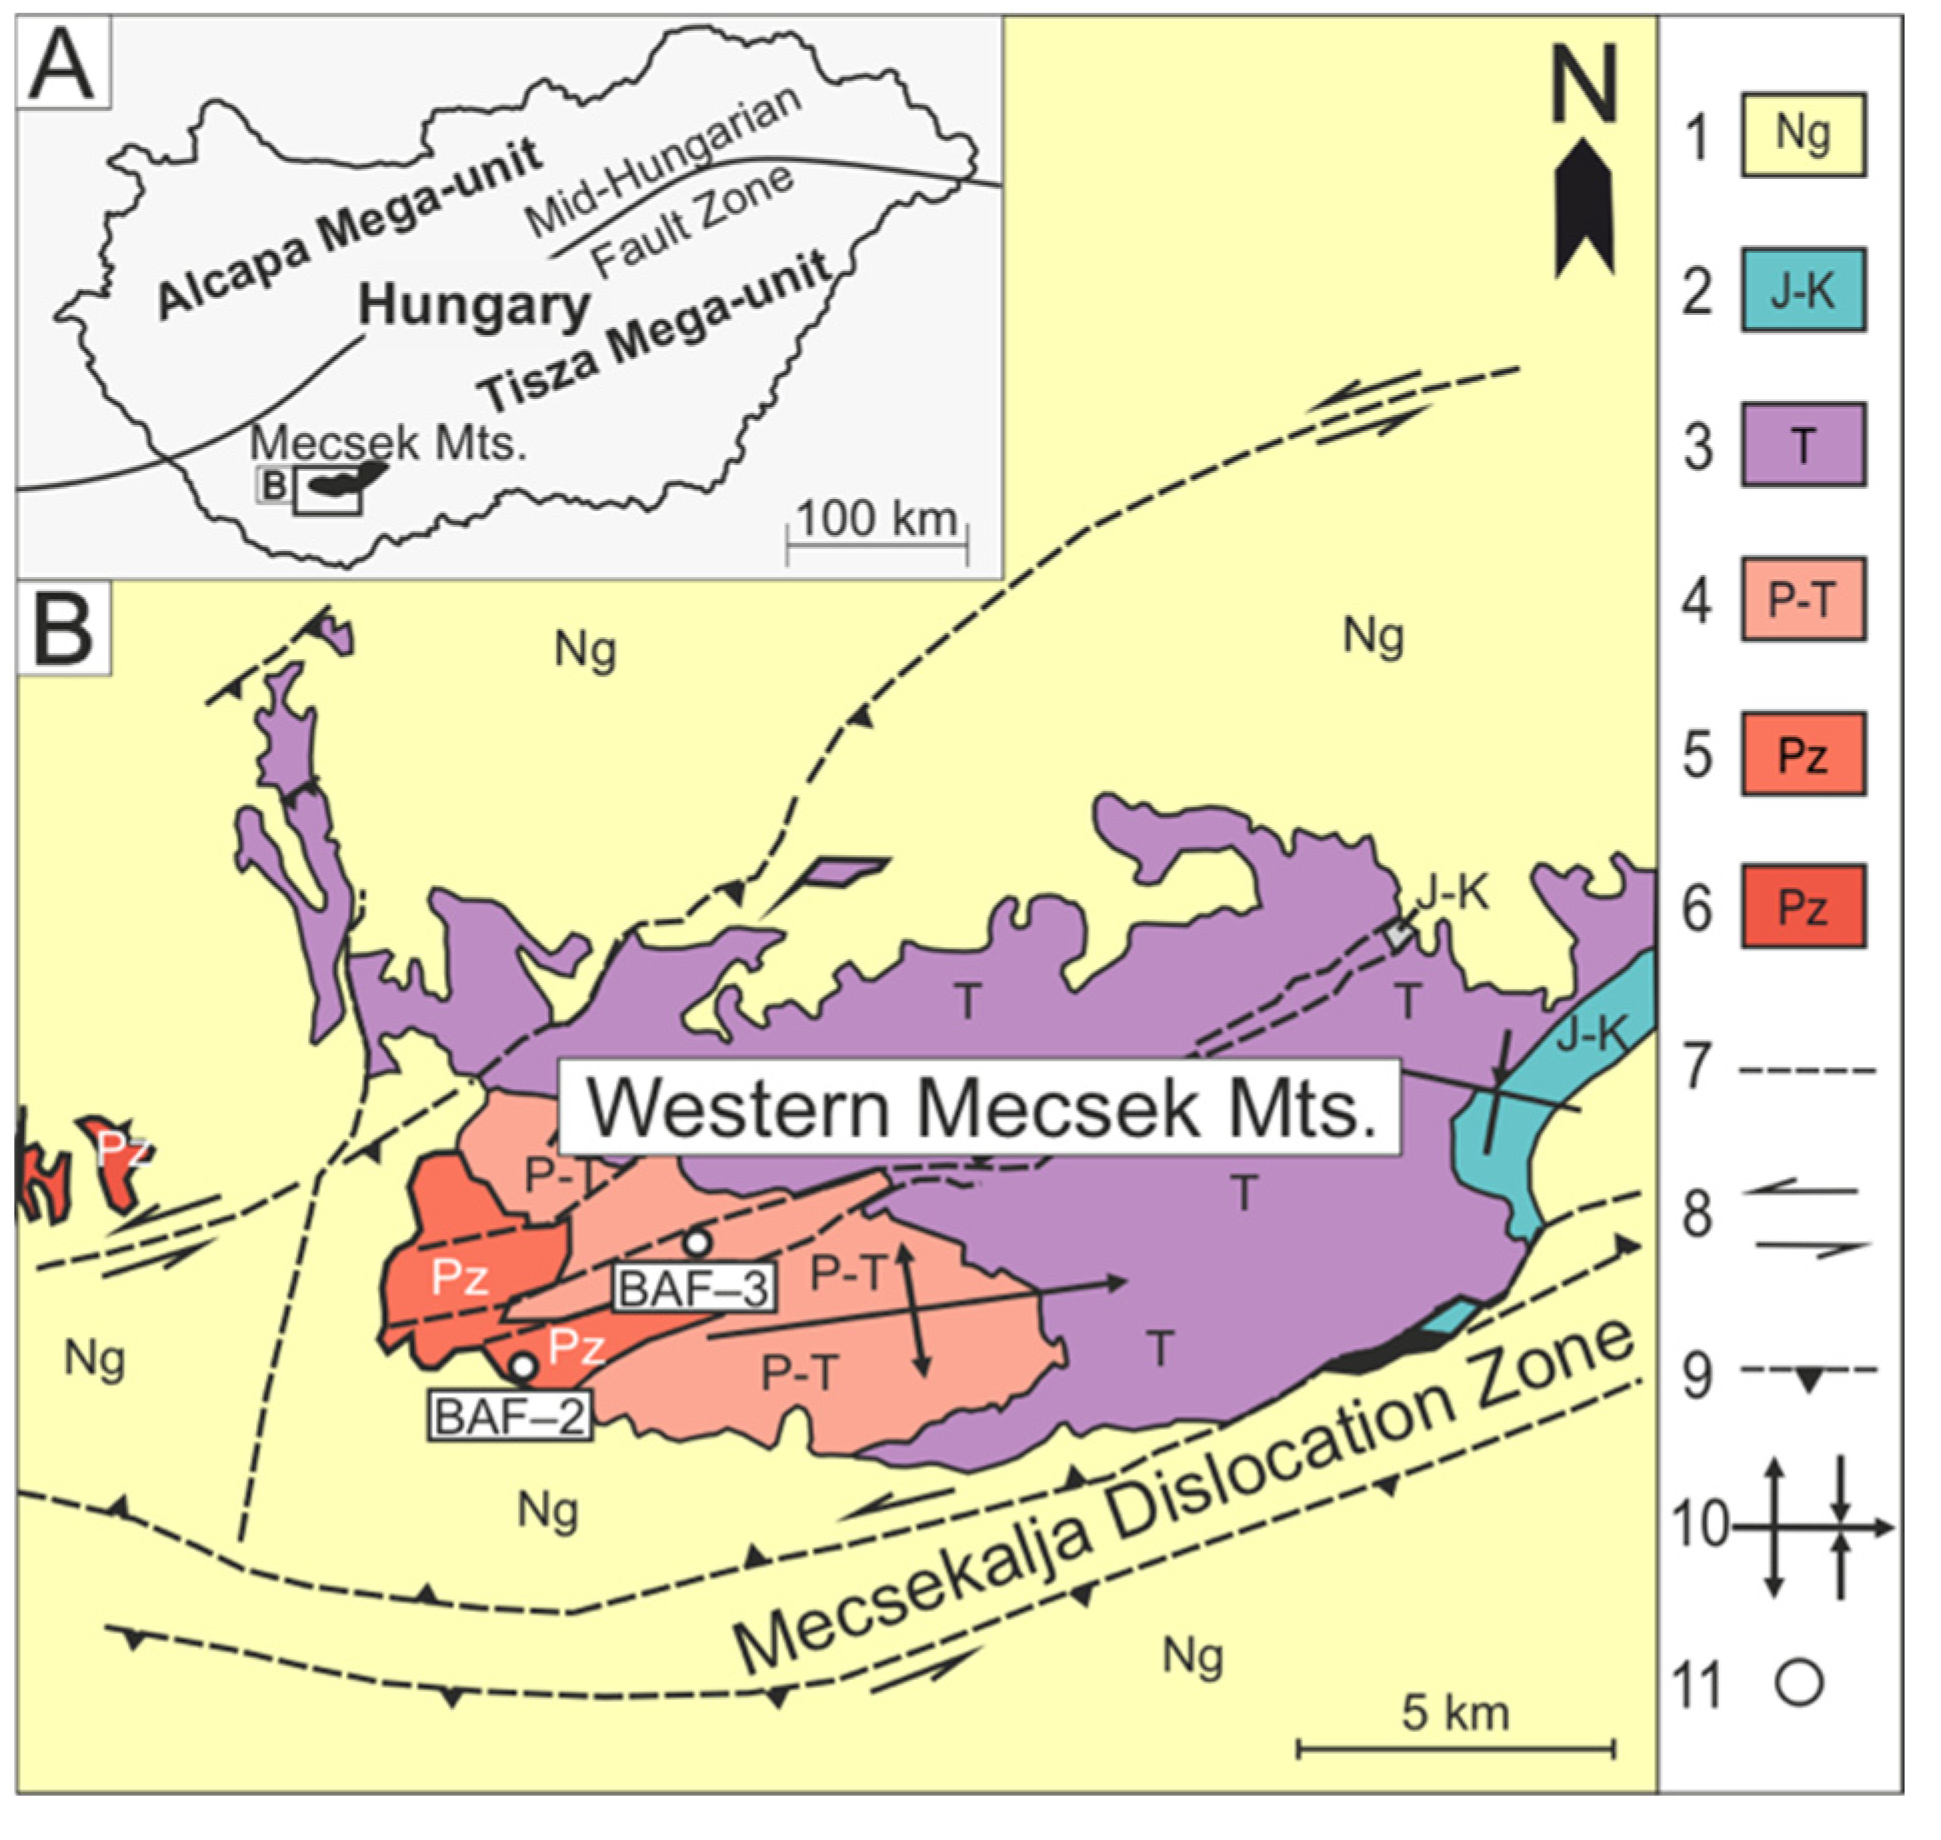
The Kővágószőlős Sandstone Formation and the Boda Claystone Formation are part of the 4000–5000 m thick Palaeozoic–Triassic sedimentary sequence of the Western Mecsek Mountains in SW Hungary (
Figure 1) [
8].
The KSF was deposited in continental (fluvial and paludinal) facies in a hot, semi-arid climate [
10,
11]. Due to the uneven subsidence of the depositional environment, the fluvial basin, the known thickness of the formation varies between 150 and 1400 m [
12]. Based on sporomorphs the uppermost part of the KSF can be dated to the Triassic. The Permian–Triassic boundary can be drawn within the formation [
13].
The KSF consists of a rhythmic succession of coarse- and fine-grained beds. The major sedimentary cycle begins with conglomerates, and the middle part consists of relatively fine-grained sandstone layers. The upper part of the formation becomes coarser again, and the uppermost part ends with coarse sandstone with pebbles, which could be related to regression [
14]. Based on the predominant colour of the sandstone layers, the formation could be divided into three heterotopic members: the deepest member is the varied sandstone (Bakonya varied sandstone), followed by the grey sandstone (Kővágótöttös Sandstone) and the red sandstone (Cserkút Red Sandstone) at the top [
11,
14]. At the boundary between the grey and red sandstones, a layer of green sandstone could be separated (Kajdács völgy Sandstone), with which significant uranium ore enrichment is associated [
11].
The underlying formation of the KSF is the Boda Claystone Formation, a reddish-brown formation composed of claystone, siltstone, albitolite with dolomite and fine sandstone interbeds [
15,
16]. Due to its extent (150 km
2), thickness (700–900 m) and impermeable properties, it is suitable for the proposed repository for high-level radioactive waste [
1]. BCF was deposited in a lacustrine environment, in an alkaline lake on a periodically drying playa mudflat in an arid to semi-arid climate [
15,
17,
18,
19,
20].
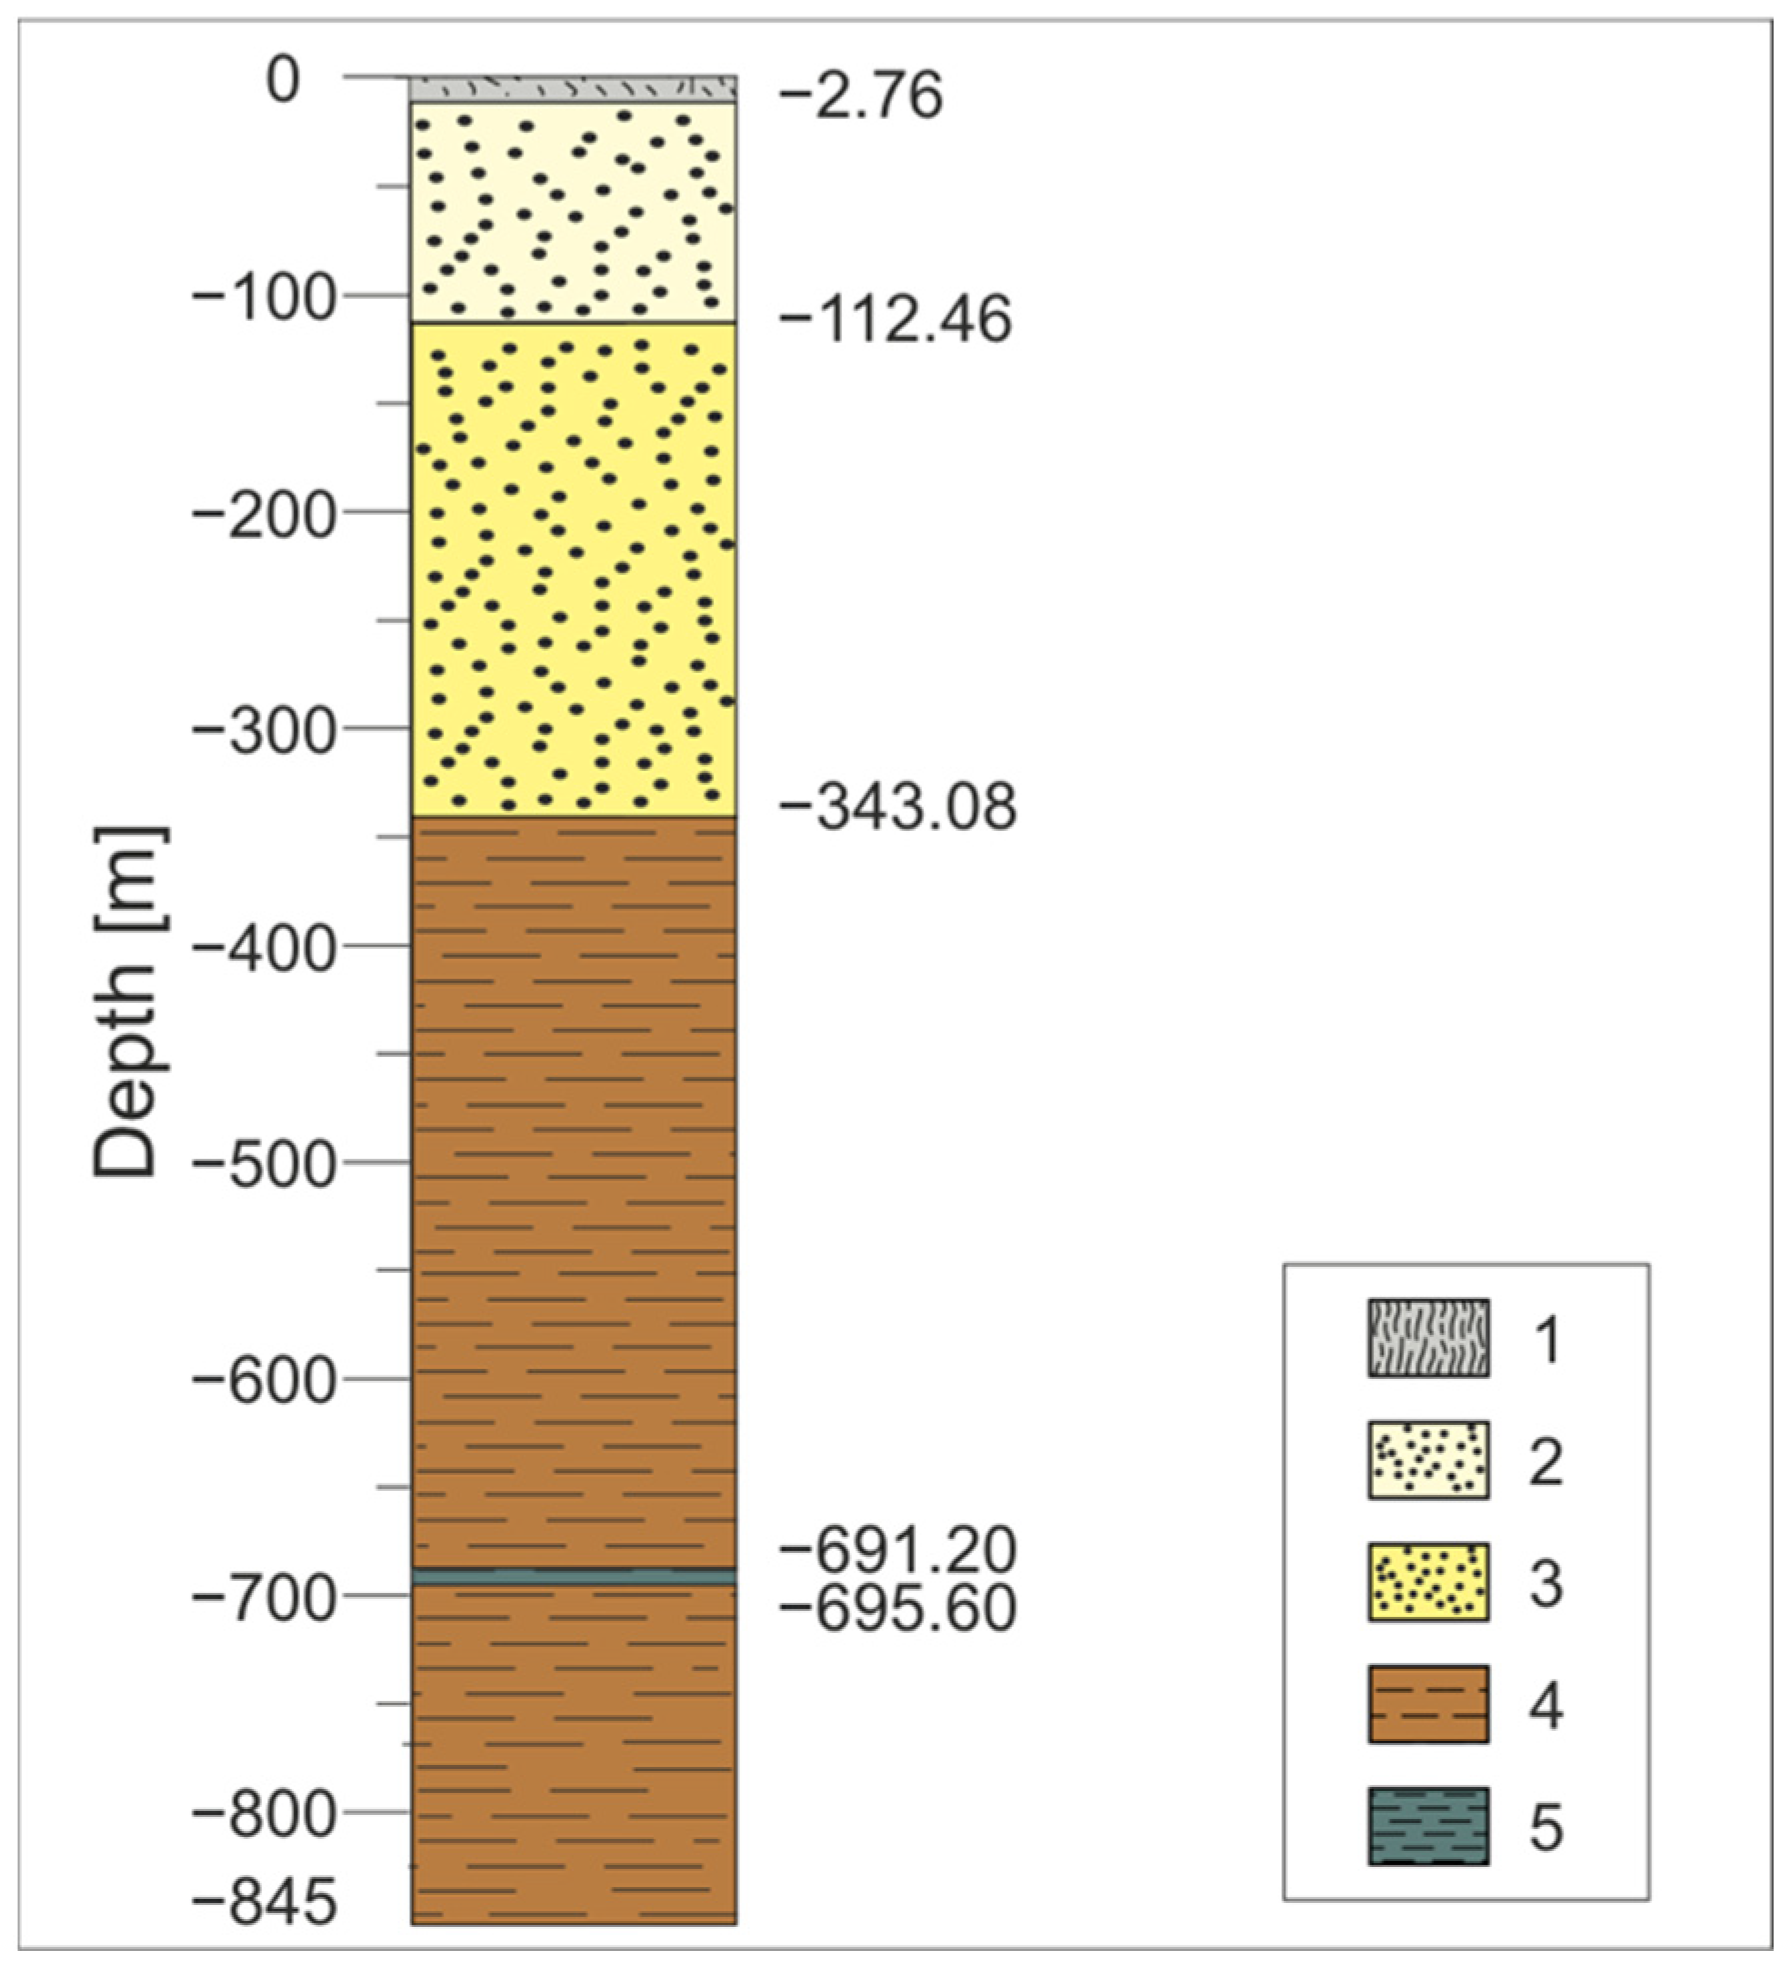
The study area is within the subvertical profile of well BAF–3, which intersected both formations in a considerable thickness. The borehole is 845 m deep, quaternary sediments are located in the uppermost 2.76 m, the Kővágótöttös member (grey sandstone) of the KSF is found between 2.76 and 112.46 m, and the Bakonya member (variegated sandstone) of the KSF is located below it, between 112.46 and 343.08 m. The boundary of the two formations is at 343.08 m, below that BCF is located. Between 691.2 and 695.6, there is a reductive layer in the BCF, which has been documented in several other boreholes as well (
Figure 2) [
21].
Numerous successive tectonic phases characterise the tectonic evolution of the area. In the Late Cretaceous, a significant NE-SW shortening is documented [
22]. The main tectonic events in the Neogene are related to the formation of the Pannonian Basin. In the early Miocene, tensional stresses [
23,
24,
25] and in the late Miocene, compression [
26] led to deformation in this area. This event was followed by thermal subsidence of the basin during the Pannonian [
27,
28]. The most recent significant event is the ongoing tectonic inversion of the basin [
9].
The dip direction of the bedding of the sandstone in the borehole is NE, while the dip direction of the claystone is predominantly E. Based on the analysis of the BHTV (borehole televiewer) data, the distribution of fractures is similar in the two formations, suggesting that the fracture system is the result of the younger tectonic events that affected both formations [
21].
Previous studies have distinguished four vein generations in the BCF, indicating four different tectonic and/or vein cementation processes. The four categories are the branched veins, the straight veins, the en-echelon vein arrays and the breccia-like veins [
29,
30,
31,
32]. The fractures are filled dominantly with calcite, anhydrite, and barite–celestine [
15,
29,
30,
31,
32].
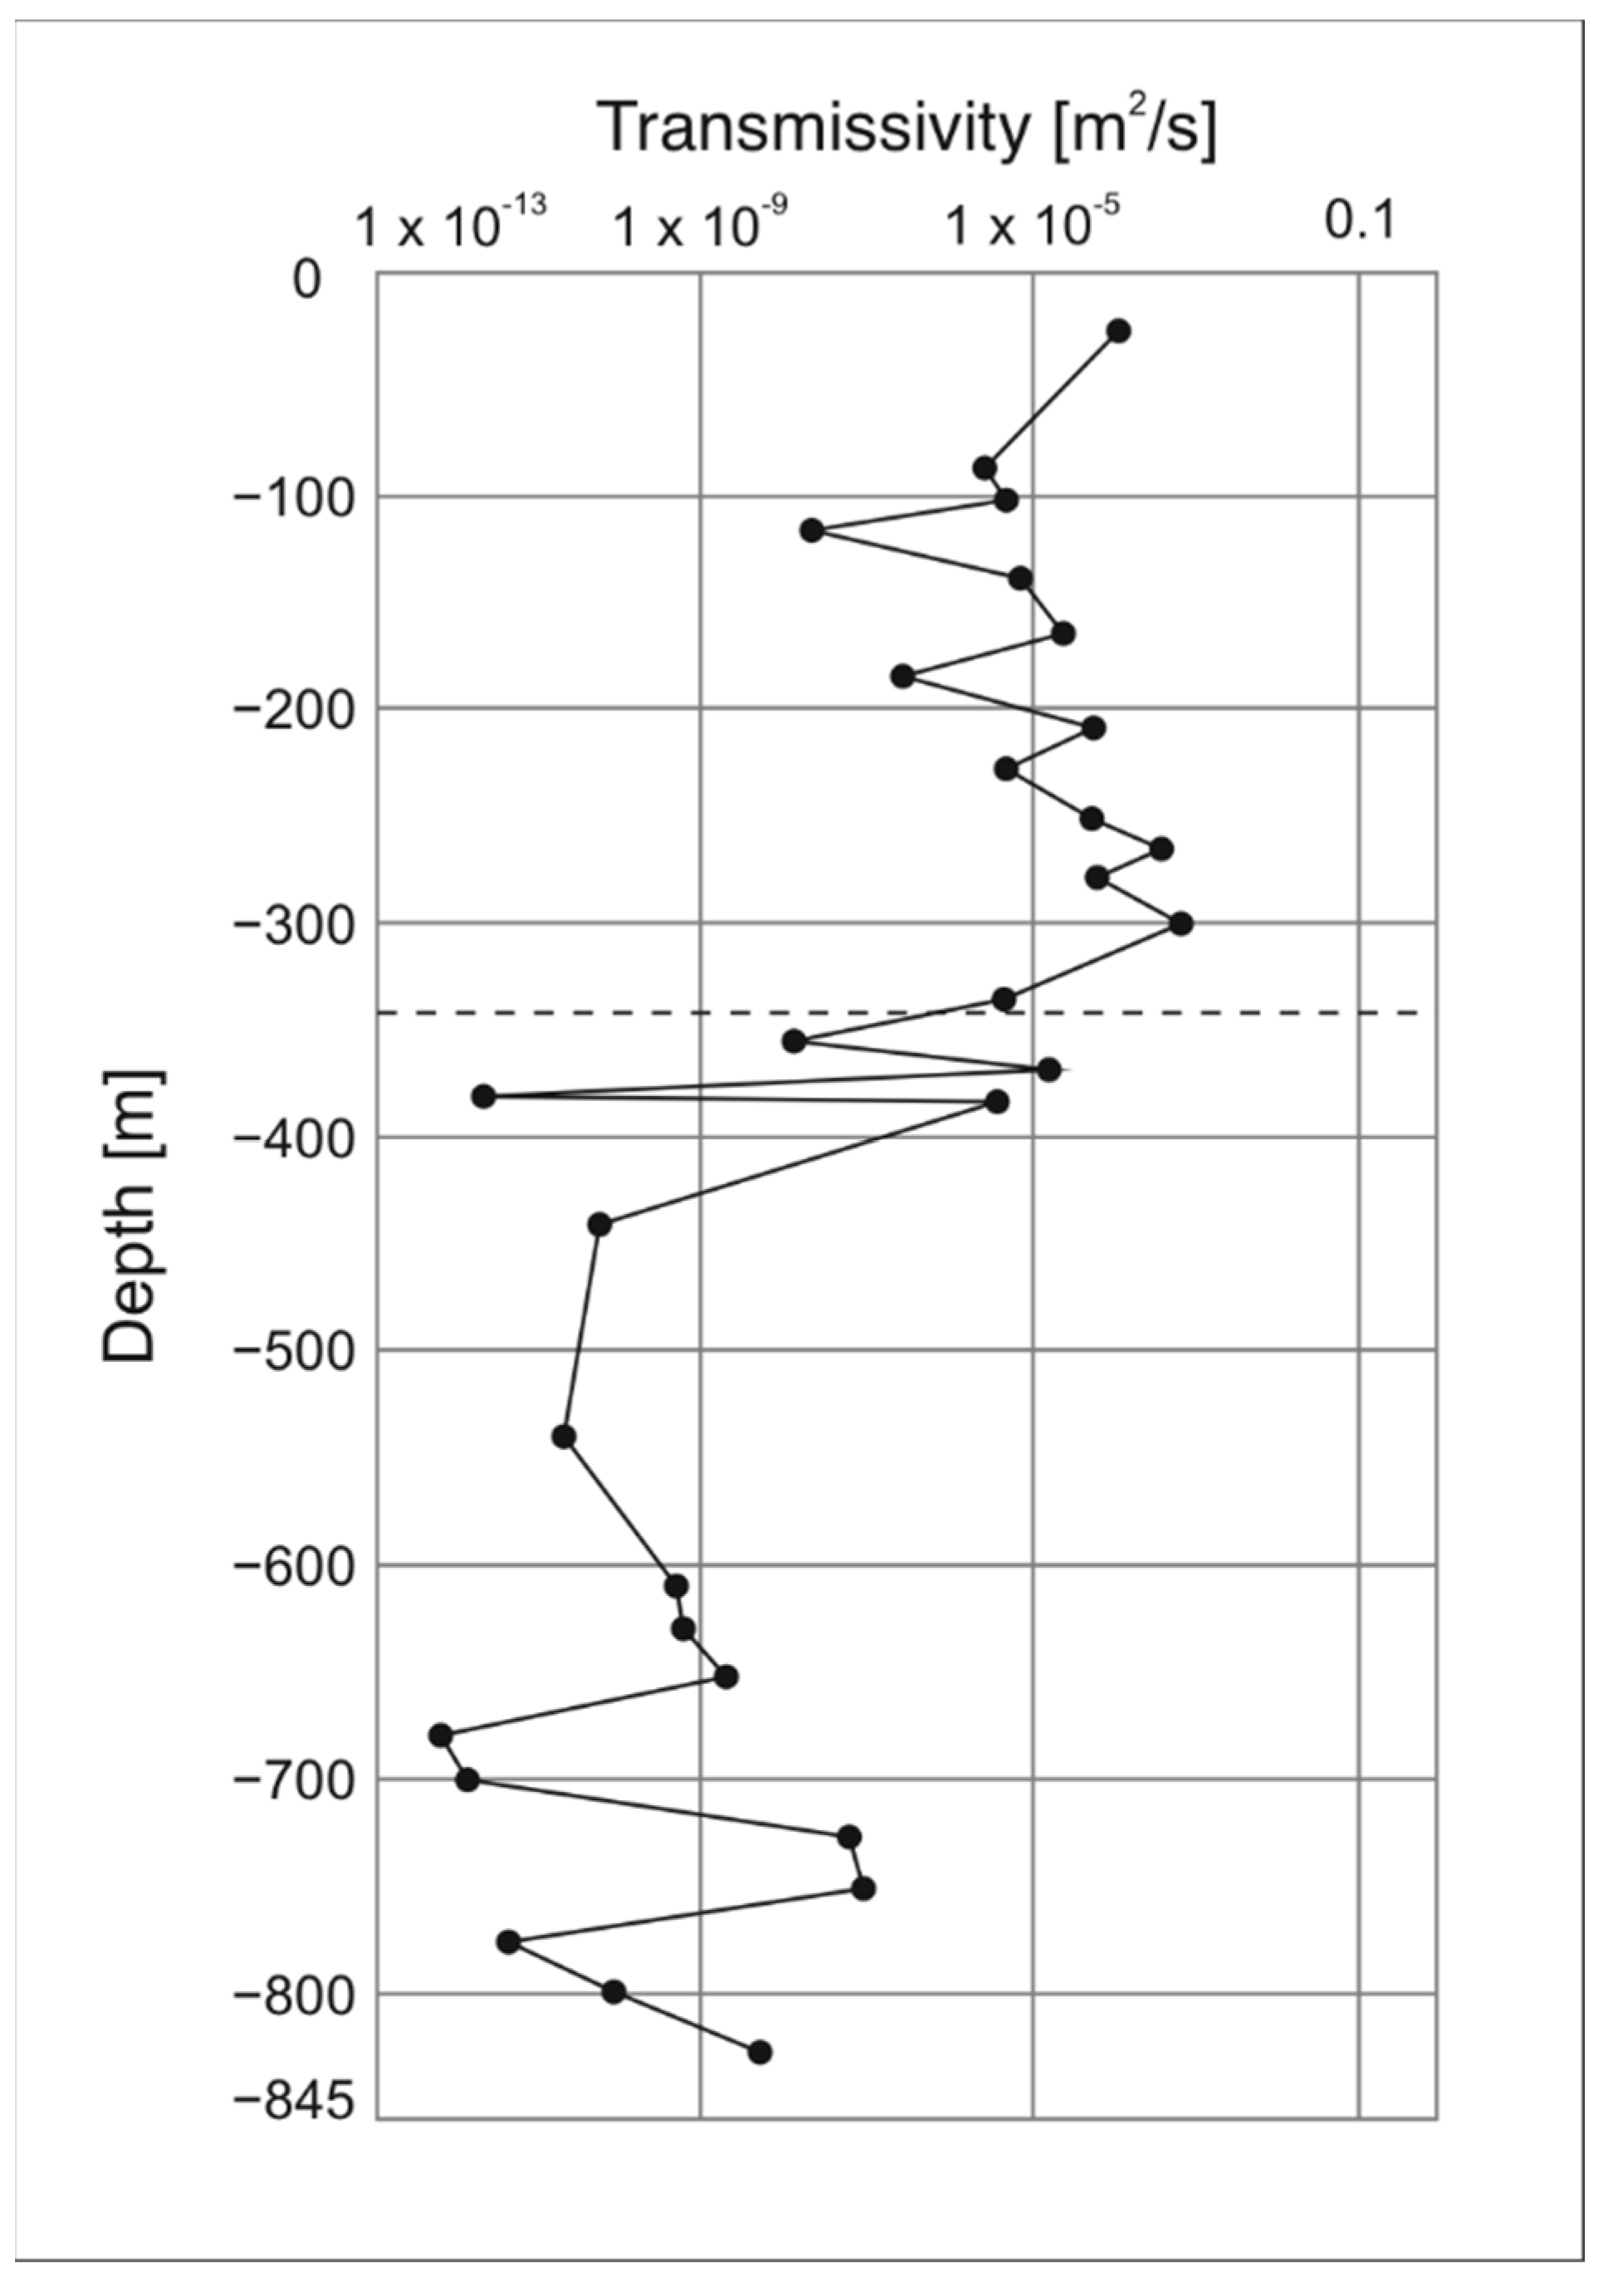
Accurate knowledge of hydrogeological conditions is an essential prerequisite for evaluating the suitability of a geological formation for radioactive waste disposal. The position of the Western Mecsek Mountains determines the general hydrological conditions of the studied area. The Palaeozoic–Mesozoic formations rise 400–500 m from their surroundings and define a regional recharge zone whose drainage basins are the Neogene basins in their wider surroundings [
33]. Based on the BAF–3 hydraulic tests, the transmissivity in the two formations differs significantly (
Figure 3).
KSF has higher transmissivity values without large deflections (2.7 × 10
−8–7.11 × 10
−4 m
2/s). Transmissivity values drop significantly at the boundary of the two formations; BCF has lower transmissivity values between 6.79 × 10
−13 and 1 × 10
−7 m
2/s [
34].
3. Methods
Fracture networks in rocks are fractal-like objects that can be modelled at any scale based on the geometric parameters of the individual fractures that make up the fracture network [
35,
36]. This study used discrete fracture network (DFN) modelling to investigate the differences between fracture networks of different host rocks [
37]. Primary data for modelling are the geometric parameters of individual fractures, i.e., fracture length distribution, spatial density, the orientation of fractures and their aperture. Based on these geometric parameters, a discrete fracture network was created using the Infress software [
38,
39,
40].
Fracture length is an essential geometric parameter of DFN modelling. Numerous studies have shown that the distribution of fracture lengths follows a power-law function so that
where N(L) is the number of fractures of length L, and E and F are the parameters of the distribution function [
41,
42]. This asymmetric distribution means that the number of small fractures is significantly larger than the number of large fractures. Measurements of fracture lengths were performed according to the M. Tóth [
39] method, which requires two images, using two methods with different sensitivities. The number of fractures detected with the less sensitive way is necessarily less than the number of fractures seen with the more sensitive method, with a constant difference (ΔN(L)). Based on this difference and the detection limits of the methods used, the parameters of Equation (1) can be calculated. For further details, see [
39]. The length exponent was determined using core images (higher resolution, 1 mm) and BHTV data (lower resolution, 3 mm).
The fractal dimension defines the spatial density of the fracture network. In a borehole, the fracture network is intersected by a line, resulting in a series of points. In this case, the spatial density of the fractures can be characterised by calculating the fractal dimension of the point series. Fractal dimension was calculated at every 50 m interval with an overlap of 25 m along the well, using Benoit 1.0 software [
39]. The parameter P10 was also used to determine the fracture density, which is the number of intersections per metre. This parameter was also calculated for every 50 m. The orientations of the fractures were characterised by the dip direction and the dip angle obtained from the BHTV data.
Infress fracture network modelling software simulates individual penny-shaped fractures in a stochastic manner using the given geometric parameters of the fracture network. It generates the desired number of equally probable realisations of the geometry of the fracture network and allows defining of the size and spatial position of the communicating subsystems of the simulated fracture networks [
39,
43,
44].
The fracture aperture is an essential parameter for evaluating the hydraulic conductivity behaviour of a fractured rock body. There are several ways to determine the aperture of a fracture. The physical aperture is defined as the average distance between the opposing walls of the fracture, which can be physically measured at any scale. The aperture of a natural fracture is influenced by the prevailing stress field, the orientation of the fracture, the depth and the roughness of the fracture wall. The aperture can be altered by water–rock interaction processes, which may affect the original aperture differently from part-to-part along the fracture plane. For understanding hydrodynamic processes, on the other hand, the hydraulic aperture should be used, which is defined as the width of a theoretical pipe that produces the same flow rate as the actual fracture does [
45,
46].
Using the Infress software, the fractured porosity and intrinsic permeability tensor elements can be calculated for each cubic volume element of the modelled rock body, if the aperture of the fractures is known [
40]. Previous studies show that fracture aperture is in a significant linear correlation with the fracture length [
35,
47,
48]:
where a is the aperture, while the aperture coefficient A is characteristic for the rock body and the fracture system and L is the length of the fracture. The initial aperture can be calculated for each fracture with the modelled length using this correlation. Finally, the modelled fractured porosity and permeability values estimated for each cubic cell depend solely on the geometry of the fracture network and the aperture coefficient (A).
The hydraulic aperture of the fractures in well BAF–3 can be estimated by comparing the observed and modelled permeabilities. First, porosity and the 3 × 3 intrinsic permeability tensor for an arbitrary cubic cell should be computed based on the generated geometry of the fracture network using an aperture coefficient value. Since the hydraulic measurements of the well do not consider the anisotropy of the permeabilities, the average of the diagonal elements of the permeability tensor is used in the subsequent calibration.
The observed permeability can be calculated from the measured transmissivity at any depth interval. The aperture coefficient of the modelled fracture system can be calibrated using the observed and the modelled permeability values. The goal of aperture calibration is to change the value of the aperture coefficient so that the two permeability values become equal. To estimate the permeability tensor with the Infress code, a rock volume of d3 was considered, where d is the length of the interval used for well-hydraulic measurements, usually 20 m. In this way, an average aperture coefficient could be calculated for each interval independently so that the effective porosity can also be calculated for all sections afterwards.
The hydrodynamic properties of a rock body can be described by the flow zone indicator (FZI). This indicator is based on the covariation of porosity and permeability and determines hydraulic flow units (HFU). By definition, an HFU is a volume of a rock body in which the geological and petrophysical properties controlling fluid flow are uniform internally. FZI values are related to porosity, permeability, capillary pressure, lithology distribution, mineralogy, and sedimentary structures and are also influenced by diagenetic processes [
46]. The FZI can be calculated as follows [
47]:
where FZI is the flow zone indicator in μm, NPI is the normalised porosity index, RQI is the reservoir quality index, k is the permeability in mD and Φ is the porosity in a volume fraction.
4. Results and Discussion
4.1. Fracture Network Modelling
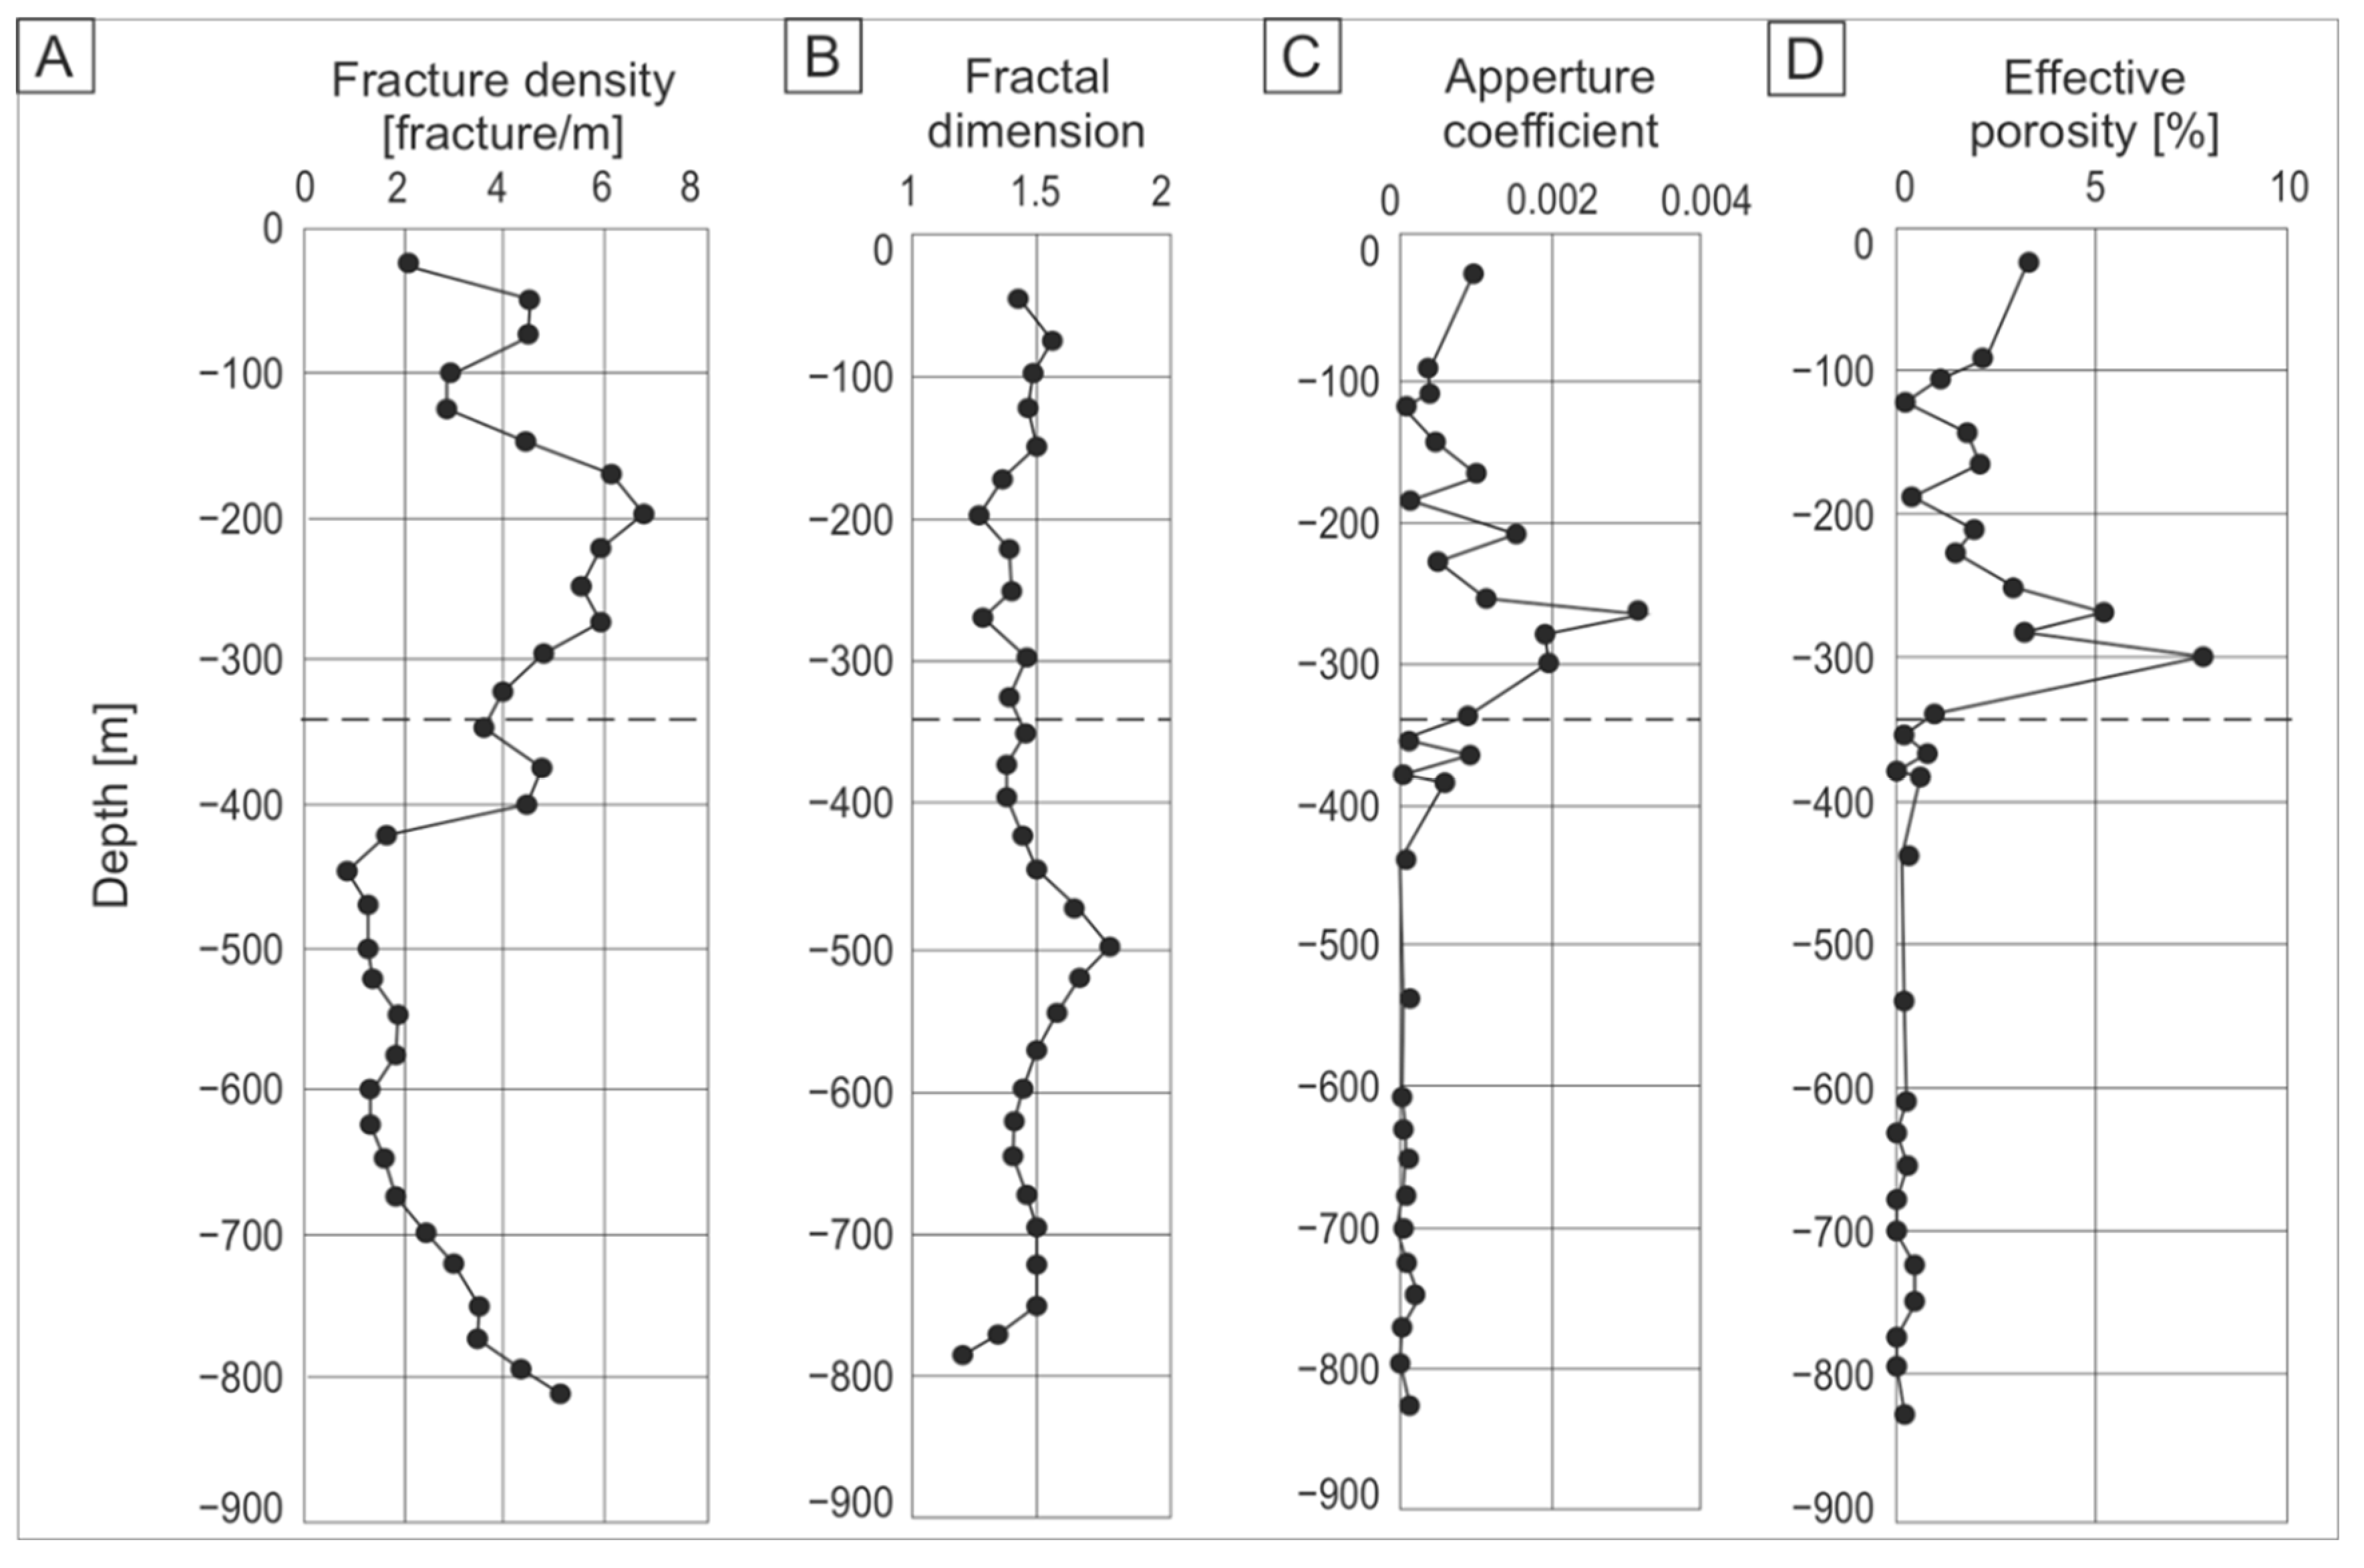
The fracture density of the borehole was determined using two methods, the fractal dimension and the P10 parameter. Both approaches are based on the BHTV data and therefore include all planes detected by BHTV, including faults, veins, joints and bedding planes. The average fracture density in KSF is 4.7 m
−1 and in BCF is 2.6 m
−1, based on the number of fractures per metre (P10). In the BCF, fracture density is highest near the border of the two formations at ~400 m, below which fracture density decreases significantly (1 m
−1), after which fracture density increases steadily with depth (
Figure 4A).
There is no significant difference in the two formations’ fractal dimension (D); the average D value is 1.53. The highest peak in D values is in the BCF at 500 m (
Figure 4B). The average length exponent E is −0.80, varying from −0.24 to −1.48, and F is 10.0.
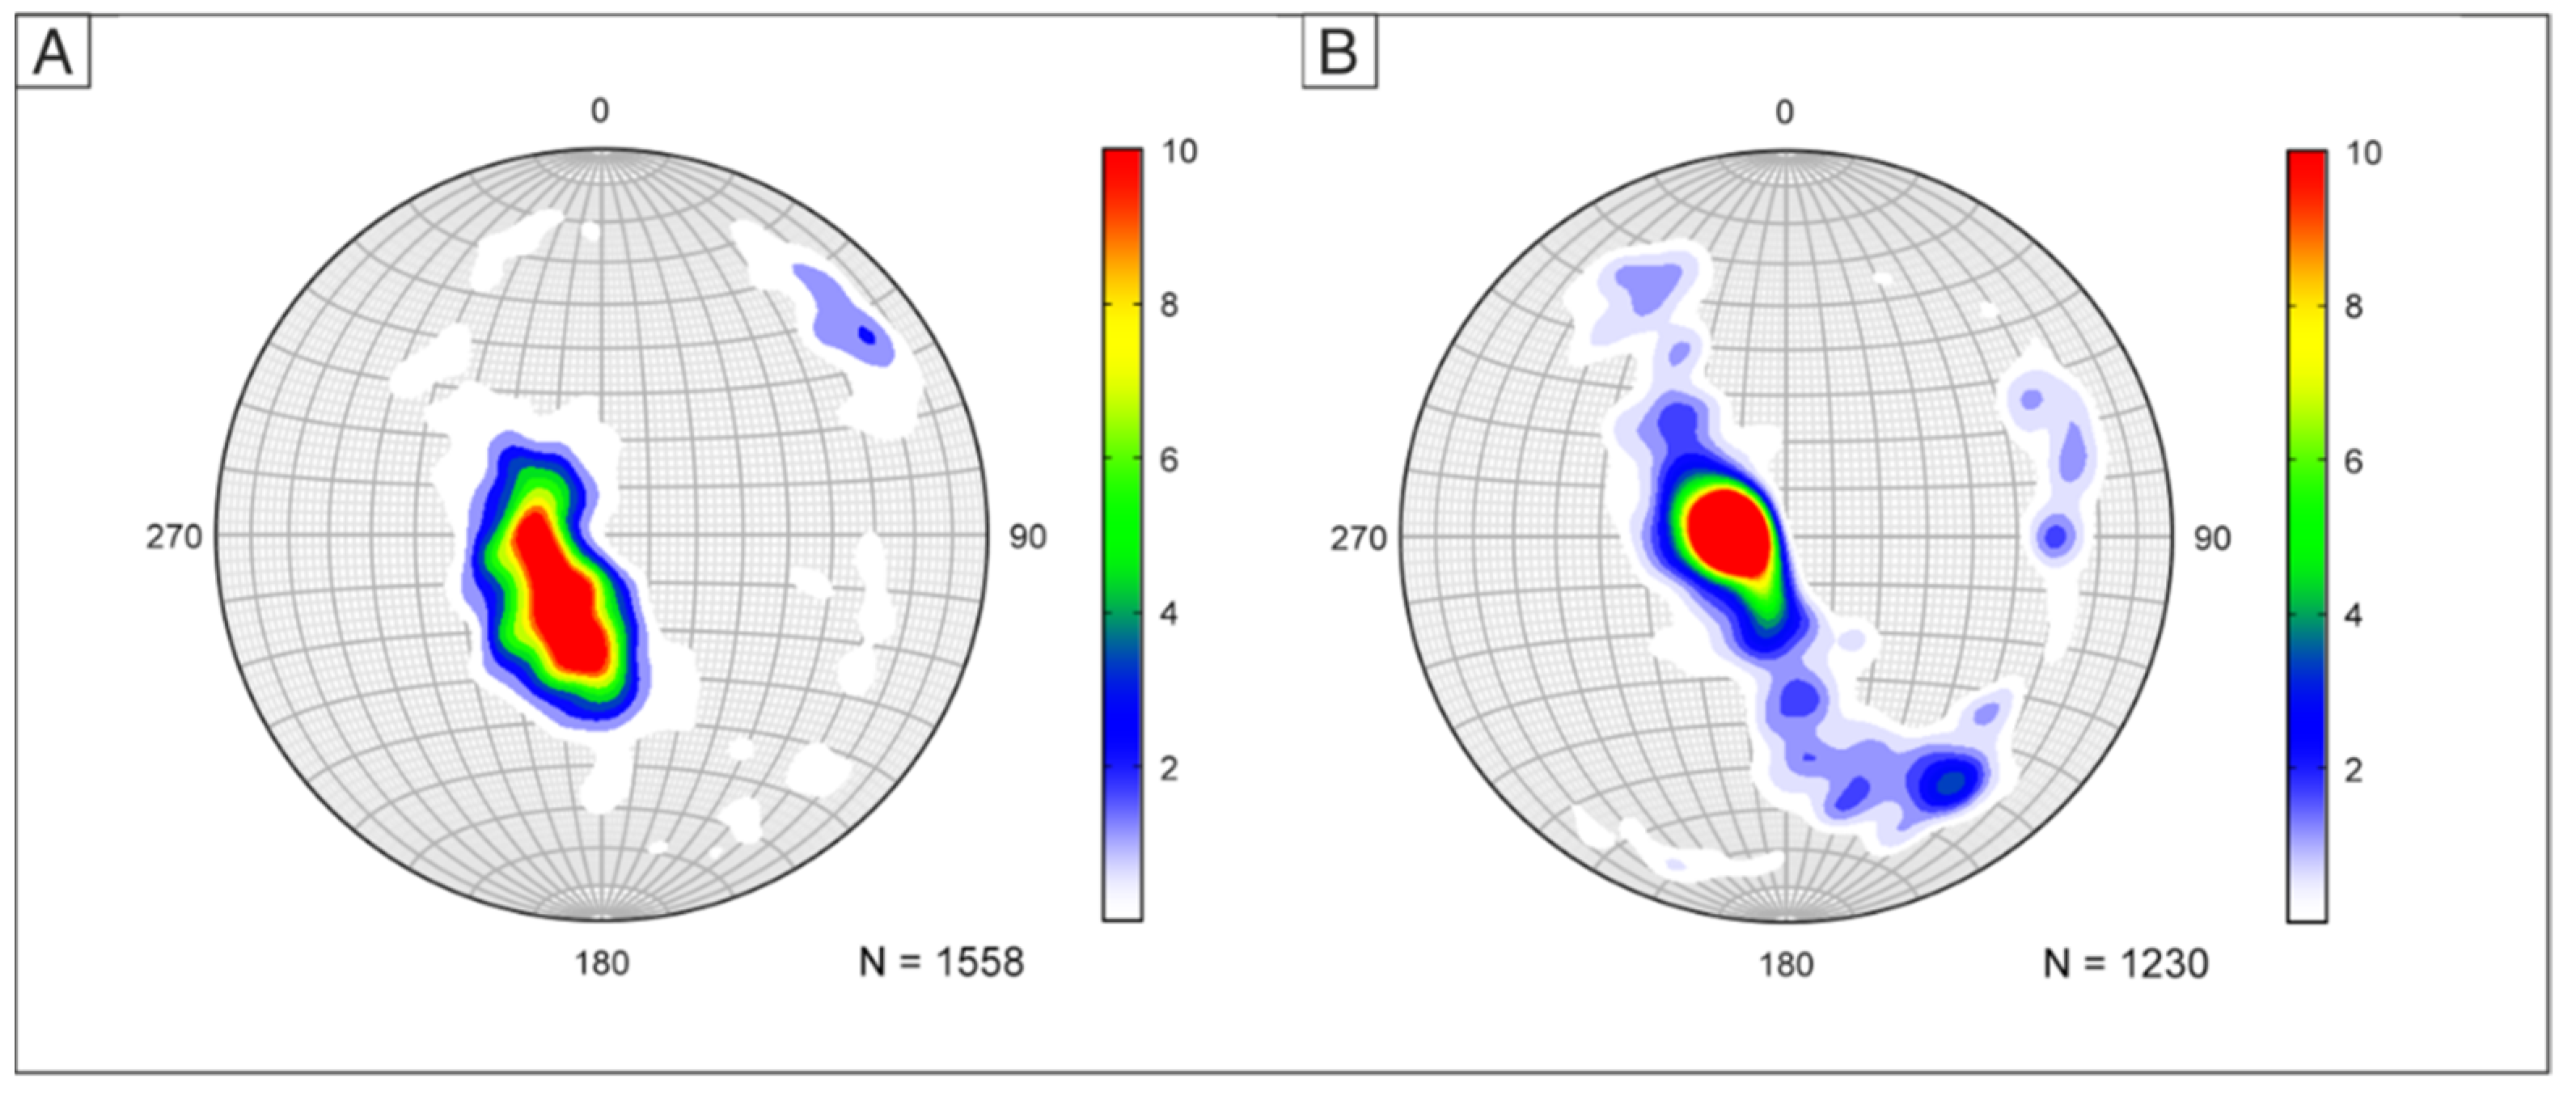
The orientation of the bedding and fracture planes are slightly different in the two formations. In the sandstone formation, the dip direction of the planes is mainly NE; a smaller group of planes has the dip direction SW. In the claystone, the dip direction of the plains is mainly E, and there are also two groups with different orientations whose dip direction is W and NW (
Figure 5). This difference was taken into account during the modelling of the fracture system.
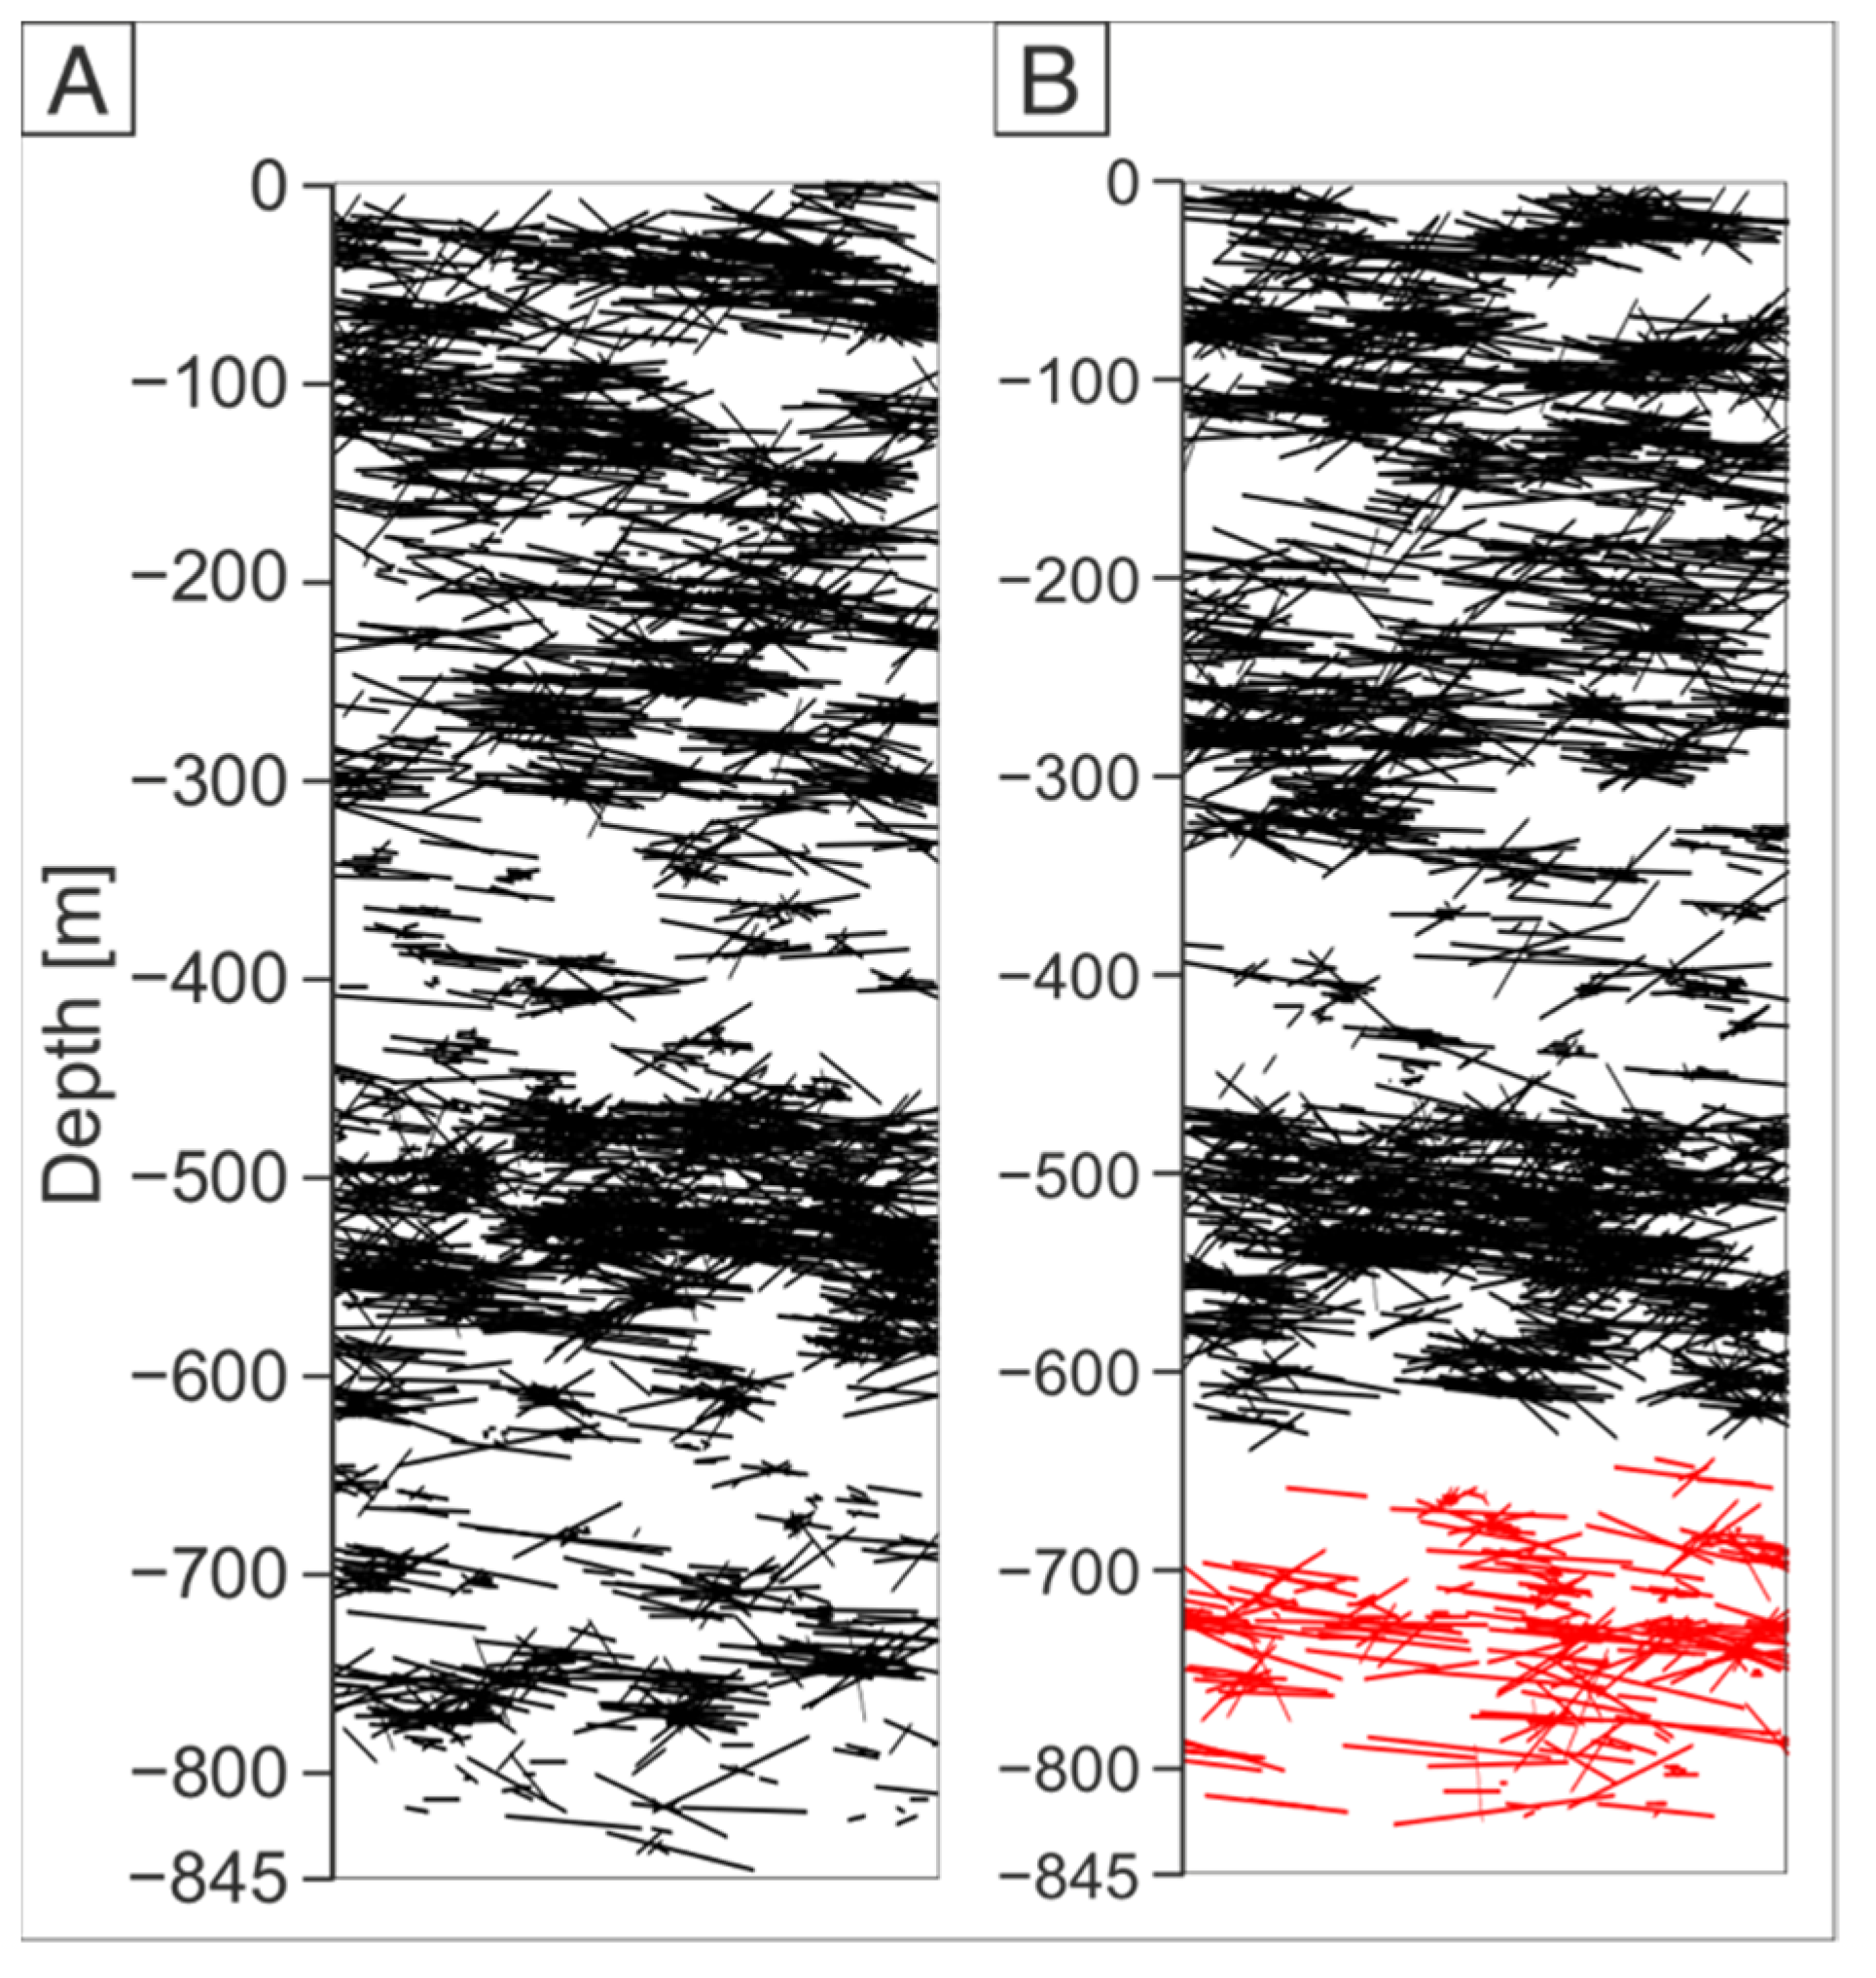
The fracture network was simulated in a 150 × 150 × 845 m cuboid around the borehole. The presence of interconnected subsystems can characterise the simulated fracture networks. Based on ten runs, two typical geometries were distinguished. In the first case, the whole fracture system defines one communicating group (
Figure 6A), while in the other case, there are two connected subgroups in the fracture network. The boundary of the two subgroups is located in the BCF at 670 m (
Figure 6B).
4.2. Hydrogeological Evaluation of the Fracture Network
The fractures’ calibrated aperture coefficient (A) values are significantly higher in the sandstone than claystone. In the sandstone body, the A values range from 1 × 10
−4 to 3 × 10
−4 (
Figure 4C). So, the hydraulic aperture of a fracture in KSF with a diameter of 1 m can vary from 0.1 to 0.3 mm. In the claystone, the fracture aperture coefficient ranges between 6 × 10
−6 and 1 × 10
−4, which means that the hydraulic aperture of a 1 m fracture in BCF varies between 6 μm and 0.1 mm. The effective porosity log follows the anomalies seen in the aperture coefficient log. The upper section of the borehole has high effective porosities compared to the lower half of the well. In the sandstone, the highest porosity value is 7% at 300 m, while the porosity in the claystone does not reach 1% (
Figure 4D).
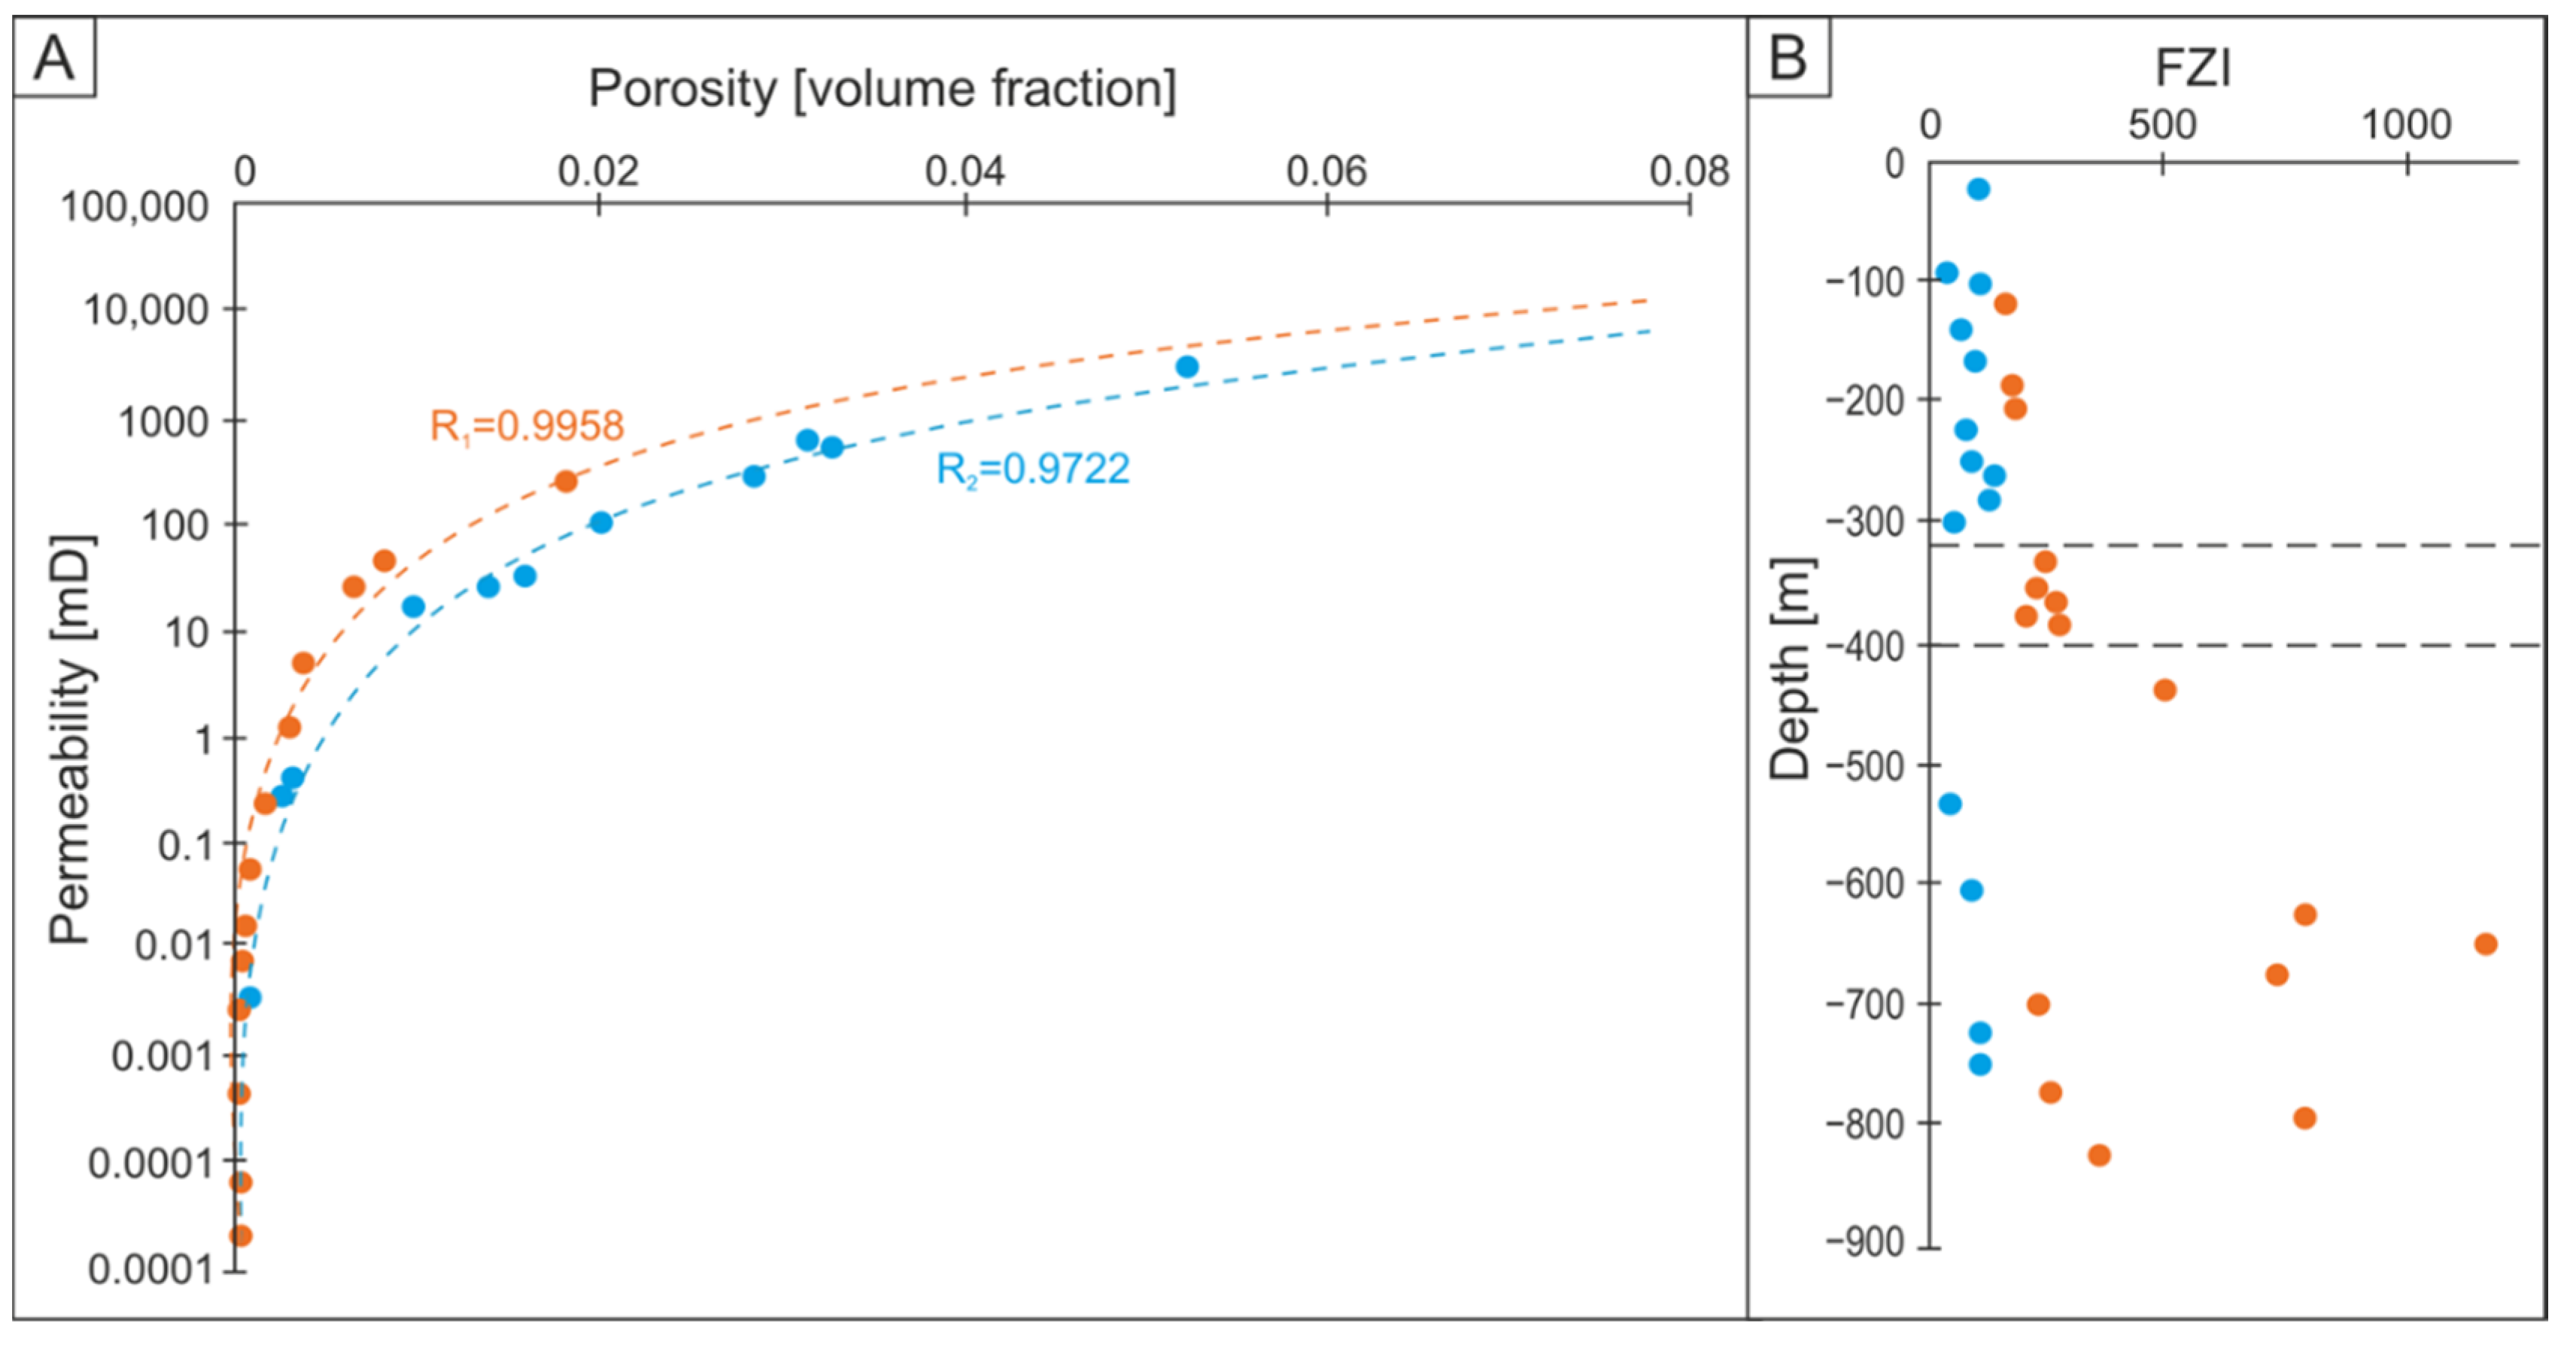
Based on the poro-perm diagram, two trends describe the hydraulic behaviour of the well (
Figure 7A). The permeability data were derived from hydraulic measurements of the borehole, while the porosity data were estimated based on the DFN model and calibrated aperture coefficients. Both trends show an excellent fit (R
1 = 0.996, R
2 = 0.972). The upper and lower parts of the borehole lie along with two distinct poro-perm trends, indicating the characteristics of the two different formations. The orange trend is predominant in the BCF, while the blue trend is dominant in the KSF.
The FZI values show the same characteristics as the poro-perm diagram (
Figure 7B). The sandstone forms a single HFU in the upper part of the borehole based on the FZI values. The transition zone between the two formations exhibits its own HFU. In the lower part of the borehole, the FZI values in the claystone vary considerably. It contains two well-defined zones with higher FZI values (630–700 m and 775–845 m), while the FZI values between these zones are much lower (
Figure 7B).
4.3. Interpretation of the Fracture Network Model
Three zones could be distinguished based on the fracture density and hydrogeological characteristics of the well. The first lies between 0 and 345 m, the second zone between 345 and 400 m and the third one between 400 and 845 m (
Figure 4). Several factors can influence the fracture density of a rock body; the most important are the rock type, the grain size, the prevailing stress field and the tectonic events. In the BAF–3 well, the main factor affecting the properties of the fracture network is lithology; since the well penetrated two different rock types, sandstone and claystone, and the two formations have identical structural evolution.
The first zone is the upper part of the well between 0 and 345 m, where sandstone is the predominant rock type. The fracture density based on both measured parameters is significantly higher in this zone. The coinciding hydrogeological properties are better (higher transmissivity and effective porosity) than in the other parts of the well. Although this sandstone body is well cemented, it undeniably has some intergranular porosity, and the pores may interact hydrodynamically and so may play a role in the measured transmissivity. Therefore, the fractured porosity calculated using the DFN model and the measured transmissivity data are upper estimates that also take into account the effects of the intergranular porosity of the sandstone. The fracture density data confirm the previous observation that the sandstone more easily and intensively deforms in a brittle way during the same tectonic events than the claystone does, which has self-sealing properties due to its high clay content [
33].
From the hydrodynamic perspective, this upper 300 m interval of the well forms a single HFU more than 300 m thick; fluid flow controlling properties are internally uniform in this zone. Within this HFU, a single zone at ~200 m has similar FZI values to those computed for the BCF. This behaviour could indicate that the KSF sandstone is becoming finer grained, increasing the clay content in this zone, or could indicate more intensely cemented zones.
Below 343 m, two zones could be distinguished within the BCF based on fracture density and hydrogeological characteristics of the fracture system. The second zone of the well is formed at the boundary between the two formations. This transition zone is located between 343 and 400 m in the claystone body, where both the fracture density and the hydrogeological properties of the BCF differ from the deeper parts. The fracture density in this zone is the highest in the entire claystone body, associated with higher aperture coefficient and effective porosity values. This zone forms a distinct HFU, which means that the rheological and geological properties controlling fluid flow are different from the other parts of the well. The top few dozens of metres of the BCF differ in mineralogical composition from the typical BCF. No authigenic albite is characteristic, and the proportion of K-feldspar also decreases, whereas the typical clay mineral is illite. This different mineralogical composition probably could lead to a significant change in the rheological properties of the rock body and could cause unique fracture geometry features.
The third unit is below the transition zone (400 m), where the fracture density decreases significantly. The lowest values of fracture density of the whole well were recorded at 450 m. Further down, the fracture density increases continuously, but the aperture coefficient and effective porosity do not change to the same extent. Despite the high fracture density, the hydraulic properties, i.e., transmissivity and porosity values in the claystone, do not increase with depth; transmissivity is lower than 10−8 m2/s, and porosity is in the 10−2–10−3 range. The aperture coefficients are 3–4 orders of magnitude smaller than typical for the sandstone body. The various water–rock interaction processes such as dissolution and cementation along the fracture planes could significantly alter the hydrodynamic properties. Small values of the aperture coefficient usually coincide with more closed, highly cemented and self-sealed fractures.
In the lowermost segment of the well, FZI values vary significantly, likely due to tiny changes in porosity or permeability. As a result, distinct and wide HFUs failed to form in the deepest part of the well. In two zones (520–630 and 700–775 m), the FZI values are lower than those typical in the claystone. In these zones, fracture densities (P10 and fractal dimension) also increase compared to their surroundings. This increased fracture number and better hydraulic properties could indicate a coarsening of the average grain size of the formation. Sedimentological descriptions show that fine sandstone interbeds are common in the BCF. In these sections, the number of sandstone layers could be increased compared to the average claystone.
Although fracture density data and hydrodynamic properties change at the boundary between the two lithologies, DFN models along the entire borehole based on ten independent runs show no lithology-related pattern concerning fracture network communication. Despite the distinctly different hydrogeological behaviour of the sandstone and the claystone, the fracture network is connected between the sandstone and the upper segment of claystone in all runs. Nevertheless, the results of some simulations indicate that two fracture subgroups may form along the well, which are not connected. The boundary of these subgroups is located at 670 m in the studied well. The explanation for this horizon is not clear based on the available information. At about the same depth (690 m), within the otherwise homogeneous claystone, there is a four-metre-wide reductive layer whose rheological properties could be different. In the reductive zones, the proportions of phyllosilicates are different and the predominant clay mineral in this zone is chlorite instead of illite [
16]. However, the influence of the reductive zone on the geometry of the fracture network is unclear. In this zone, the fracture system should be near its percolation threshold; a slight change in modelling parameters can significantly affect the connectivity of the fracture system [
43]. Therefore, the connectivity of the fracture network at this depth cannot be predicted with high certainty.
4.4. Correlation Possibilities with the BAF–2 Well
Approximately 3.4 km from the site of this study is the BAF–2 well located, which intersected the BCF for more than 900 metres. For the BAF–2 well, fracture network modelling and evaluation was performed by Tóth et al. [
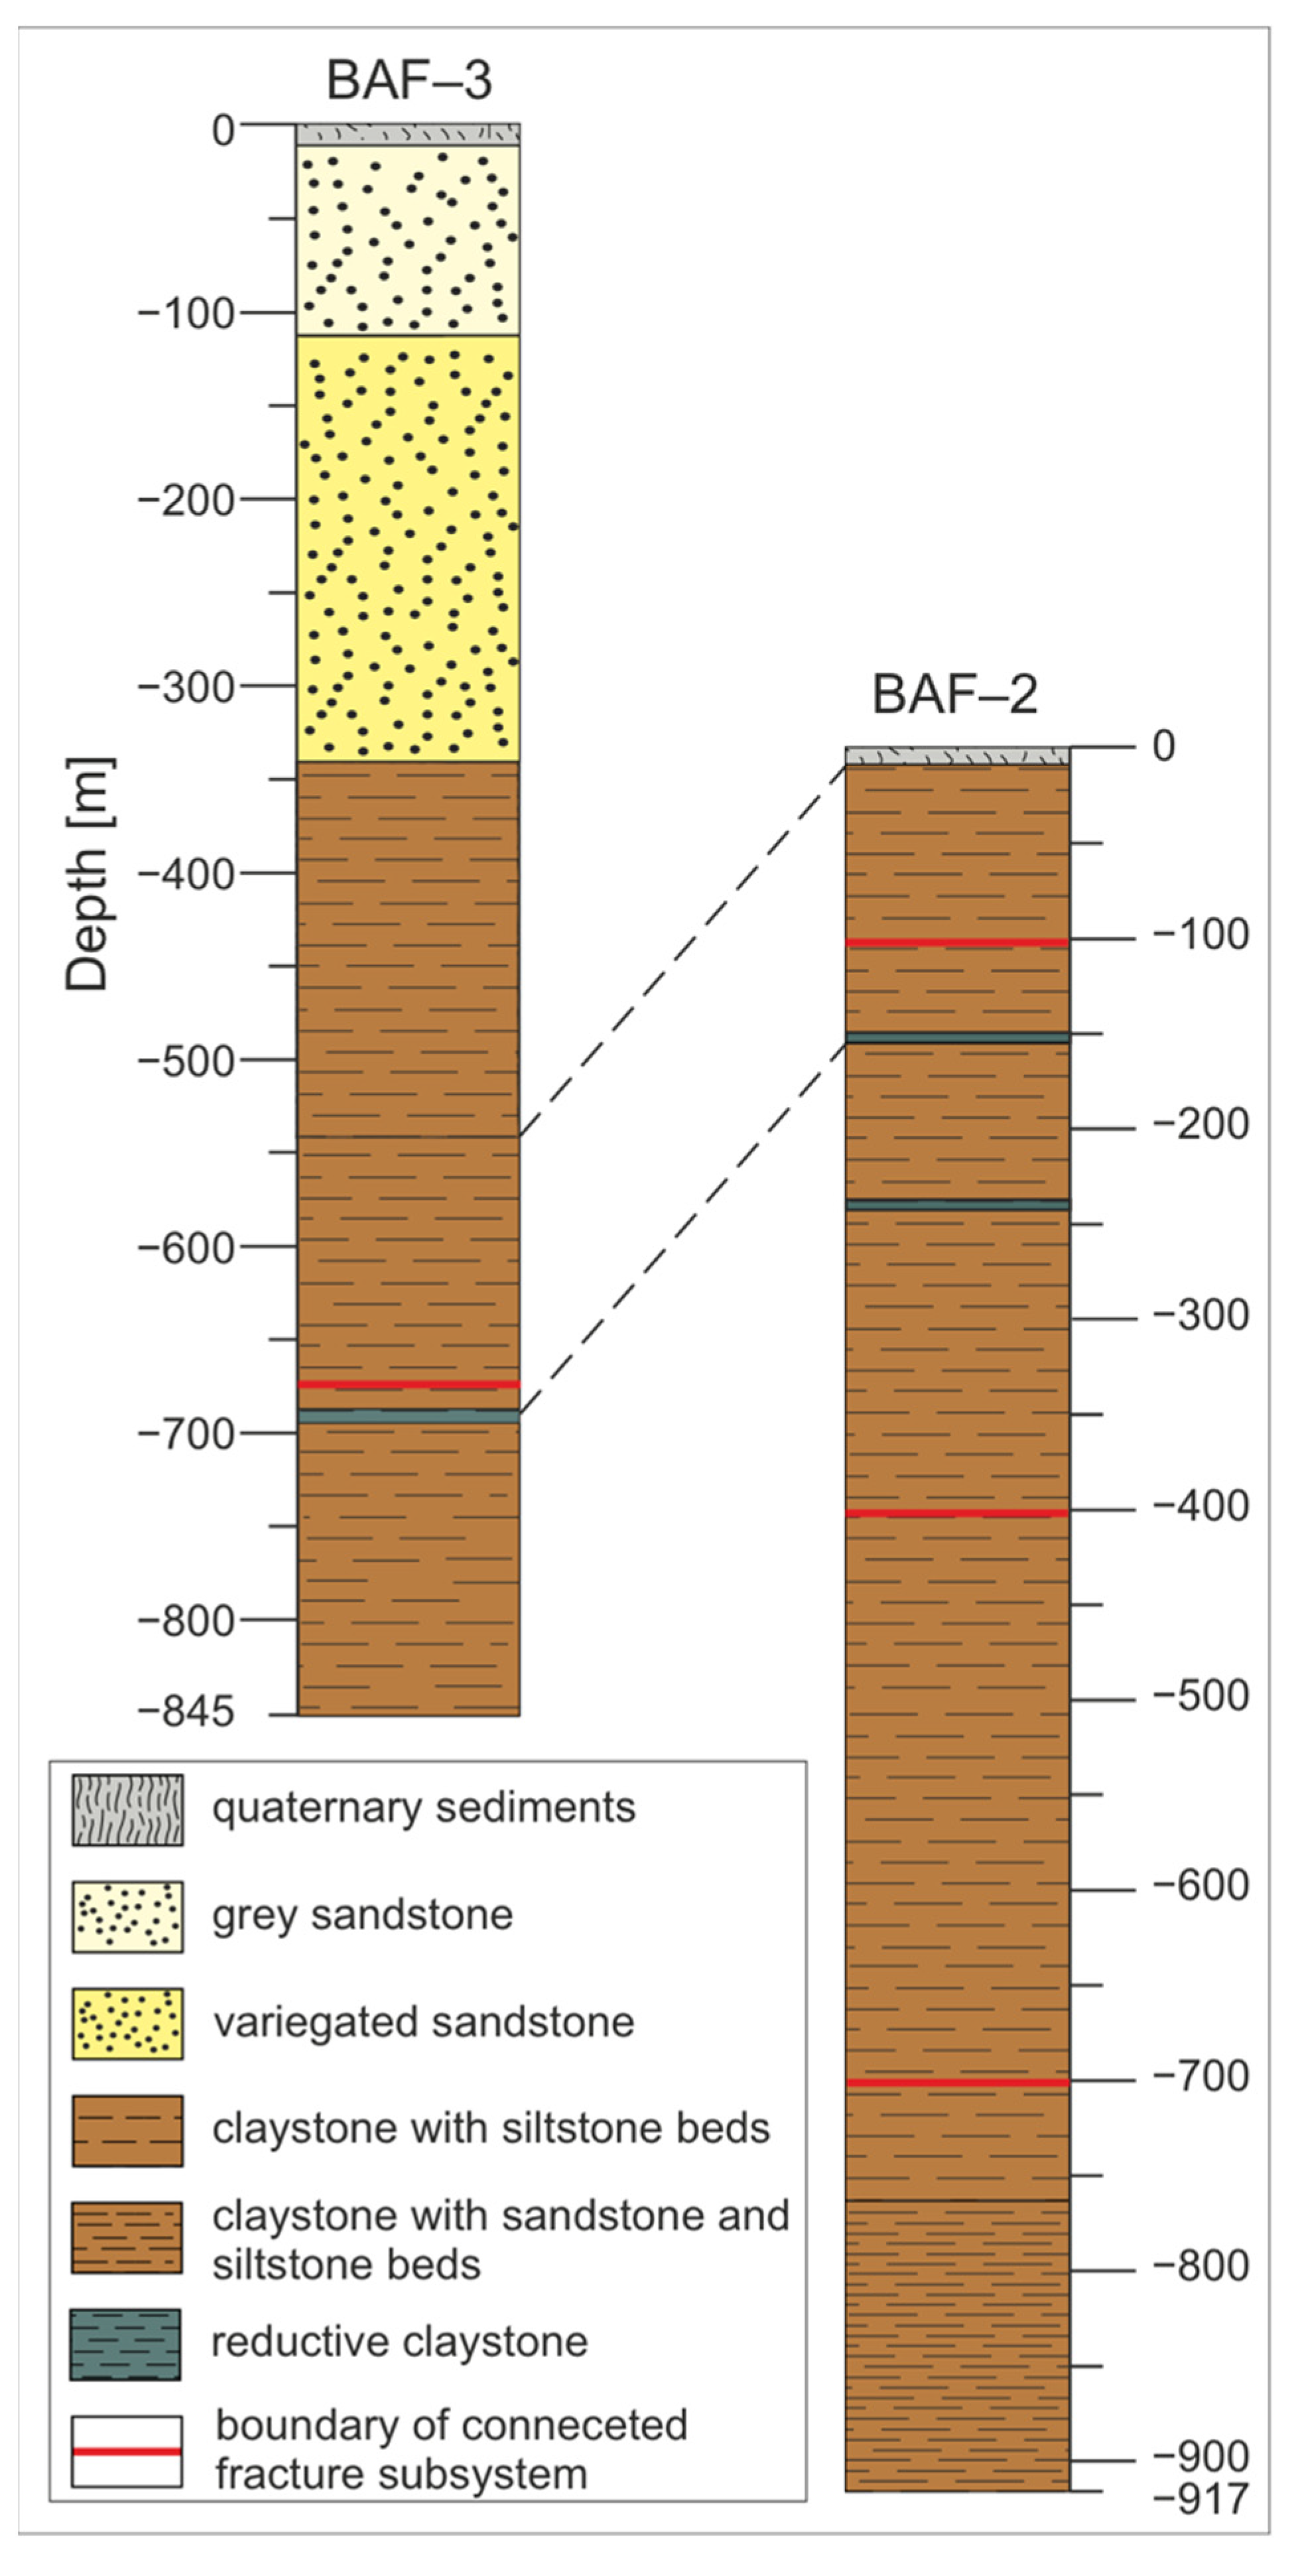
49] using an approach similar to that presented in this study. The main difference between the two wells is that in the BAF–2 well, the caprock of the BCF, the KSF, is missing, and the claystone formation is uncovered (
Figure 8).
In the BAF–2 well, a weathered type of the BCF was intersected between 0 and 100 m, resulting from long-term near-surface exposure. Below this interval, the hydrodynamic features indicated by the FZI values are uniform and form a single HFU. Further down, a large-scale tectonic boundary was encountered at 400 m based on fracture network features and hydrodynamic properties of the well.
Based on sedimentological observations, the uppermost ~200 m of the BCF has been eroded in the case of the BAF–2, while BAF–3 likely essentially penetrated this segment below the KSF. Good depth markers for the correlation of the two wells are the locations of the reductive zones within the claystone body. In borehole BAF–3, the only reductive zone is at 690 m, corresponding to 347 m in the claystone. In the BAF–2 well, there are two reductive zones, the recurrence of which in the well is probably due to tectonic activity. These zones appear at approximately 151 and 235 m.
Based on the boundaries of connected fracture subsystems and the location of the reductive layers in the wells, at least 110 m of claystone is missing from the BAF–2 well. Therefore, a few tens of metres short section could be correlated between the uppermost part of the BAF–2 well and the middle part of the BAF–3 well, where the reductive layer is located. Just above this horizon the fracture network can be divided into two connected subsystems in both wells what further confirms the possibility for correlation (
Figure 8).
On the other hand, the upper 100 m of the BAF–2 well is highly altered by weathering, which is not the case in the BAF–3 well. Therefore, the characteristics of the fracture system and its hydrogeologic properties differ significantly in the two wells. Due to the different stratigraphic positions and diagenetic processes in the two boreholes, the correlation is not straightforward with borehole BAF–2 regarding the fracture system of the claystone. BAF–3 instead provides essential complementary data to the BAF–2 well model for the uppermost part of the Boda Claystone and its caprock.
5. Conclusions
In this study, we investigated the properties of the fracture network and its hydrogeological consequences in a sandstone and a claystone formation in the same well. The hydraulic properties of the fracture system were investigated using measured permeabilities and calculated effective porosities. These were estimated using DFN models for each depth interval for which transmissivity measurements were available.
Based on fracture network properties and hydraulic characteristics, the fracture network could be divided into three zones, the location of which is controlled by the wellbore lithology. The first, more than 300 m thick zone forms an HFU located in the sandstone. The second zone is about 70 m thick, along with the transition zone between the two formations, where the predominant rock type is claystone. The fracture density and aperture coefficient are much higher than in the deeper parts of the claystone body. Below this transition zone appears the third zone, where no distinct HFU could form. This means that water–rock interactions have changed the porosity and permeability values to different degrees from point to point.
Based on DFN modelling, the fracture zones of the sandstone and claystone define a geometrically connected fracture system. Deeper parts of the claystone may be divided into two subgroups, but their boundary does not coincide with the lithologic zonation of the borehole. The geometry of the fracture network and the hydraulic properties of the BAF–3 well can provide a basis for further hydrodynamic modelling of the well and its surroundings.
A similar assessment of the fracture system was also performed for borehole BAF–2 previously. Based on the results of the two studies, the correlation between the fracture system of the two wells is uncertain because of the differences in stratigraphic positions and diagenetic processes that altered the BCF in the two wells. This study provides information on the uppermost segment of the BCF and its caprock, which was not penetrated by the BAF–2 well.


