
Traffic Noise Reduction Strategy in a Large City and an Analysis of Its Effect


1
School of Mechanical and Electrical Engineering, Guangzhou University, 230 Wai Huan Xi Road, Guangzhou 510006, China
2
Department of Mechanical Engineering, National University of Singapore, 9 Engineering Drive 1, Singapore 117575, Singapore
*
Author to whom correspondence should be addressed.
Appl. Sci. 2022, 12(12), 6027; https://doi.org/10.3390/app12126027
Submission received: 5 May 2022
/
Revised: 7 June 2022
/
Accepted: 11 June 2022
/
Published: 14 June 2022
(This article belongs to the Special Issue Monitoring and Prediction of Traffic Noise in Large Urban Zones)
Abstract
:A noise reduction strategy was proposed for Panyu District of Guangzhou City based on its traffic noise map, which considered both road and railway traffic noise. Commercial software was applied to compute the noise maps with and without noise barriers based on the field traffic flow measurements. Noise compliance maps were further developed to assess the effects of noise barriers on the quality of the sound environment. The change in populations exposed to unhealthy traffic noise with noise barriers was calculated, and the group noise indicators Gdn and Gnight, which indicate the populations of highly annoyed and sleep-disturbed people, were evaluated. The results showed that the traffic noise level was significantly decreased after the implementation of noise barriers. It was predicted that with the strategy of applying suitable noise barriers, the overall areas under heavy noise pollution could be reduced by 24.5 and 24.3 km2 during daytime and nighttime, respectively. Meanwhile, the total areas that could meet the regulated standard for noise levels were increased by 97.4, and 66.9 km2, corresponding to compliance rate increments of 18.38% and 12.62%, respectively, in daytime and nighttime. The results further revealed that the installation of noise barriers could significantly reduce the population of highly annoyed people, while the reduction of the population experiencing sleep disturbances was insignificant.
1. Introduction
Due to the wide sources of noises, such as traffic, neighborhood noise, and aircraft noise, exposure to noise has been the most frequent complaint of populations living in large cities all over the world [1]. For instance, although the EU has used noise maps and action plans since 2002, a recent European Environmental Noise Directive report [2] highlighted that noise pollution will continue to be a major health problem in Europe. This was reaffirmed by Titu et al. [3], who found that the noise pollution in Pitesti city, Romania even increased rather than decreased since the initialization of noise maps and action plans. The negative effects of environmental noise on people’s health, such as sleep disorders, learning impairment, diastolic blood pressure and hypertension, stroke, and annoyance, have been widely reported, and numerous efforts have been made to assess the impacts of different noise sources and mitigation strategies against the negative influences of environmental noise [4].
In Europe, road traffic is perceived as the most critical noise source, as 82 million Europeans were reported to be suffering under long-term day–evening–night (Lden) traffic noise levels of at least 55 dBA [5]. When people encounter traffic noise, the most widespread subjective response is “annoyance”, which could lead to chronic diseases. WHO Europe [6] has ranked “annoyance” to be the second major health effect of noise, just after sleep disorders or disturbances. Muzet, A. [7] reviewed the research regarding environmental noise over a 30-year period and found that continuous high-level noise exposure can lead to populations having strongly detrimental emotions, such as those of hostility, anger, and helplessness. Babisch et al. [8] investigated the effect of road traffic noise on the incidence of myocardial infraction. The results showed that the odds ratio of men being exposed to noise levels beyond 70 dBA during daytime was 1.3, as compared to those exposed to noise levels of less than 60 dBA. It was discovered that chronic exposure to high levels of traffic noise could lead to a high risk for cardiovascular disease. Dratva et al. [9] investigated the effects of railway and road traffic noise on the blood pressure of an exposed population. It was revealed that transportation noise may exert severe health effects on vulnerable populations, such as adults with hypertension, diabetes, or cardiovascular disease. Petri et al. [10] also found that exposure to traffic, airport, and recreational noise also led to an increase in diastolic blood pressure and hypertension problems. Among the various sources of noise, railway noise was reported to have the most significant impact on diastolic blood pressure. In order to explore the relationship between annoyance and traffic noise levels, research was carried out to correlate annoyance indexes and noise levels. Miedema and Oudshoorn [11] developed a model that correlated the annoyance scale and noise exposure level. The day–night level (DNL) and day–evening–night level (DENL) were used as the noise descriptors. The results showed that the developed model could fit the experimental data with high confidence intervals. In an effort to evaluate annoyance due to overall railway noise and vibration, Licitra et al. [12] further considered the effects of “unconventional railway noise” sources, such as braking, squeals, whistles, screeching, etc. They found that railway noise’s impact on the disturbance of people was generally underestimated and that the existence of unconventional railway noise increased annoyance during both the daytime and the nighttime. Traditional noise maps that were developed based on ordinary transits were usually biased toward the epidemiological studies of railways, and it has been suggested that the accuracy of noise maps can be improved by considering unconventional noise sources.
In addition, environmental noise also has a significant impact on humans’ cognitive and learning abilities, particularly for vulnerable groups, such as infants and young children. Rossi et al. [13] experimentally investigated the effects of low-frequency noise on human cognitive performance among 25 participants, including male and female volunteers of the ages of 19–29. The results showed that under noisy conditions, people’s stress was obviously enhanced, and their response time was decreased in comparison to that under silent conditions. Erickson et al. [14] reviewed the overall consequences of background noise on the health, perception, cognition, and learning of infants and children. They found that background noise can particularly lead to disadvantageous effects on infants’ and young children’s recognition and learning from speech. Zacarias et al. [15] investigated the noise levels of the neonatal helmets applied in respiratory support for preterm infants. The noise levels of the respiratory system were found to exceed the recommendations by reputable organizations, and filters with higher flow resistance were the cause of the higher noise levels created in the neonatal helmets. Hence, for the goodness of the preterm infants’ health, the sound performance of respiratory systems should be carefully considered during the design of products. Minichilli et al. [16] investigated the annoyance index with respect to environmental noise in students in secondary schools in Italy by using questionnaires. The acoustic environment in the classroom was found to have significant influences on students’ speech listening and comprehension, and, hence, it negatively affected their educational performance.
Aside from public health, the existence of traffic noise also exerts a significant impact on house prices. Wilhelmsson [17] developed an empirical analysis of traffic noise with respect to the value of single-family properties. The hedonic price method was applied by assuming that the negative externalities could be translated into property values. The results indicated that the effects of traffic noise on property values were negative. They found that the depreciation of the values of single-family houses due to noise pollution could be as high as 30%. Theebe [18] found that, in the Netherlands, the noise level could be translated into property prices when it exceeded 65 dBA, and the maximum discount of the property prices could be up to 12% because of noise. However, the properties in places where the noise levels were less than 40 dB could be sold with a premium of up to 6.5%. Cohen and Coughlin [19] applied spatial hedonic models to analyze the impact of airport noise on the house prices near the Atlanta airport. They found that the house prices in areas where the day–night noise level disrupted normal activities (70–75 dBA) were 20.8% lower than those in areas where the day–night noise level did not disrupt the normal activities of people. Anderson et al. [20] investigated the effects of road traffic noise and railway noise on the property prices in Sweden. A hedonic regression analysis implied the strong negative impact of traffic noise on the property prices. The impact of road traffic noise was more significant due to the fact that people were more disturbed by road traffic noise than that of railways. Mense and Kholodilin [21] further investigated the reaction of property prices to an airport expansion according to the planned flight paths. They found that the property listing prices of the areas impacted by the flight paths were greatly influenced after the flight paths were published. The average loss of value of the affected properties was as much as 9.6% when the slant distance between the affected areas and the flight paths was within 3 km. Moreover, the flight altitude also showed a noticeable influence on the property prices. Swoboda et al. [22] used the hedonic method to find the correlations between house prices and traffic noise in St. Paul, Minnesota, United States. They commented that the impact of traffic noise on house prices was obvious, and a precise estimation of the impact of traffic noise could be helpful for the cost of efficient mitigation projects. Similar research was conducted by Trojanek et al. [23]. They investigated the impact of aircraft noise on property prices from a database that included the transaction prices for 1328 apartments and 438 single-family houses from 2010 to 2015 in Poznan, Poland. They also found that the property prices were negatively related to the aircraft noise level. The depreciations of the index value due to noise were 0.87% and 0.57% for single-family houses and apartments, respectively.
In order to assess the levels of noise emitted in an urban area, noise mapping is widely accepted as one of the most meaningful and popular approaches in the research community [24,25,26,27,28]. A precise noise mapping can provide the detailed spatial noise level distribution of a certain area with multiple noise sources and temporal intervals. With these advantages, noise mapping can be applied as the first step toward the calculation of populations exposed to the noise levels in a specific area; then, some applicable noise mitigation strategies, such as noise barriers, vegetation, and landscaping, can be proposed to reduce the impact of noise. Over recent years, numerous efforts were made to develop traffic noise maps through numerical modeling based on traffic flow parameters and a geographic information system (GIS) [25]. Zhao et al. [29] proposed a method for three-dimensional (3D) road traffic noise mapping with unstructured surface meshes of buildings and roads. This method enabled 3D noise mapping with realistic buildings, road models, and traffic information. Bostanci [30] compared the accuracy of the noise maps created via the radial basis function (RBF), ordinary kriging (OK), and inverse distance weighting (IDW) methods. The RBF method was found to be the most accurate among the tested methods. Paschalidou [31] produced a noise map of selected sections of the Egnatia motorway together with an extended traffic noise measurement campaign, and the population under noise exposure was then calculated according to the noise map. A large population was found to live under relatively high noise levels, indicating the necessity of traffic noise monitoring in residential areas. Sonaviya and Tandel [32] assessed the noise pollution conditions in Surat city, India through noise mapping by using two inbuilt noise propagation models of SoundPLAN. Similarly, Alam et al. [33] constructed noise maps near the main roads that passed through densely populated residential areas in North India using the SoundPLAN and MapInfo Professional software, and a comparison between the 2D and 3D models was reported and analyzed. Wosniacki and Zannin [34] evaluated the railway noise in a municipality of Brazil based on noise measurements and strategic noise mapping (SNM). The results showed that one-quarter of the population in the study area was exposed to noise that exceeded the level of the limit recommended by the World Health Organization (WHO). Strategies for managing exposure to rail noise, including noise barriers, were proposed according to their analysis.
As mentioned before, it has been acknowledged that there are still large populations living in unhealthy sound environments in urban areas all over the world. The impact of noise has not only undermined the health of individuals, but has also lead to the depreciation of values of the affected private properties. Therefore, it is essential to take traffic noise issues into account in urban planning, particularly for urban renewal plans in old cities, which usually have high densities in terms of population and residential buildings. To achieve this, noise mapping can serve as a useful tool for evaluating different noise mitigation strategies or for proposing optimized soundscape designs to reduce the impact of noises emitted by major sources [25]. Nowadays, noise barriers are globally applied in residential areas lying adjacent to major roads, such as highways or expressways, to reduce the traffic noise emissions [35]. However, there are few studies using strategic noise mapping to characterize the performance of noise barriers implemented in the areas in megacities of developing countries that suffer from noise. Hence, in the present study, a noise map of Panyu District, which is one of the central parts of Guangzhou, China, was first constructed using a commercial numerical platform based on field traffic flow measurements and GIS. Then, noise barriers were suggested and applied along the traffic arteries in the areas exposed to high traffic noise levels in the numerical model. The qualities of the sound environment before and after the implementation of noise barriers were finally compared, and the effects of the noise barriers were discussed. The motivation of this study is to provide scientific references for the consideration of sound environment quality in the urban and urban renewal plans of Guangzhou, which has a history of more than 28 centuries and a total population of about 18.8 million. According to its 14th Five Year Plan (2021–2025), Guangzhou will be undergoing a mega urban renewal plan, which is expected to have large infrastructural projects, such as the construction of new expressways and high-speed railways and the widening of the main roads in its core areas, in the coming years. The future traffic noise nuisance will potentially be a big issue if it is not well considered before the start of these infrastructural projects.
2. Materials and Methods
2.1. Noise Pollution in Panyu District of Guangzhou City
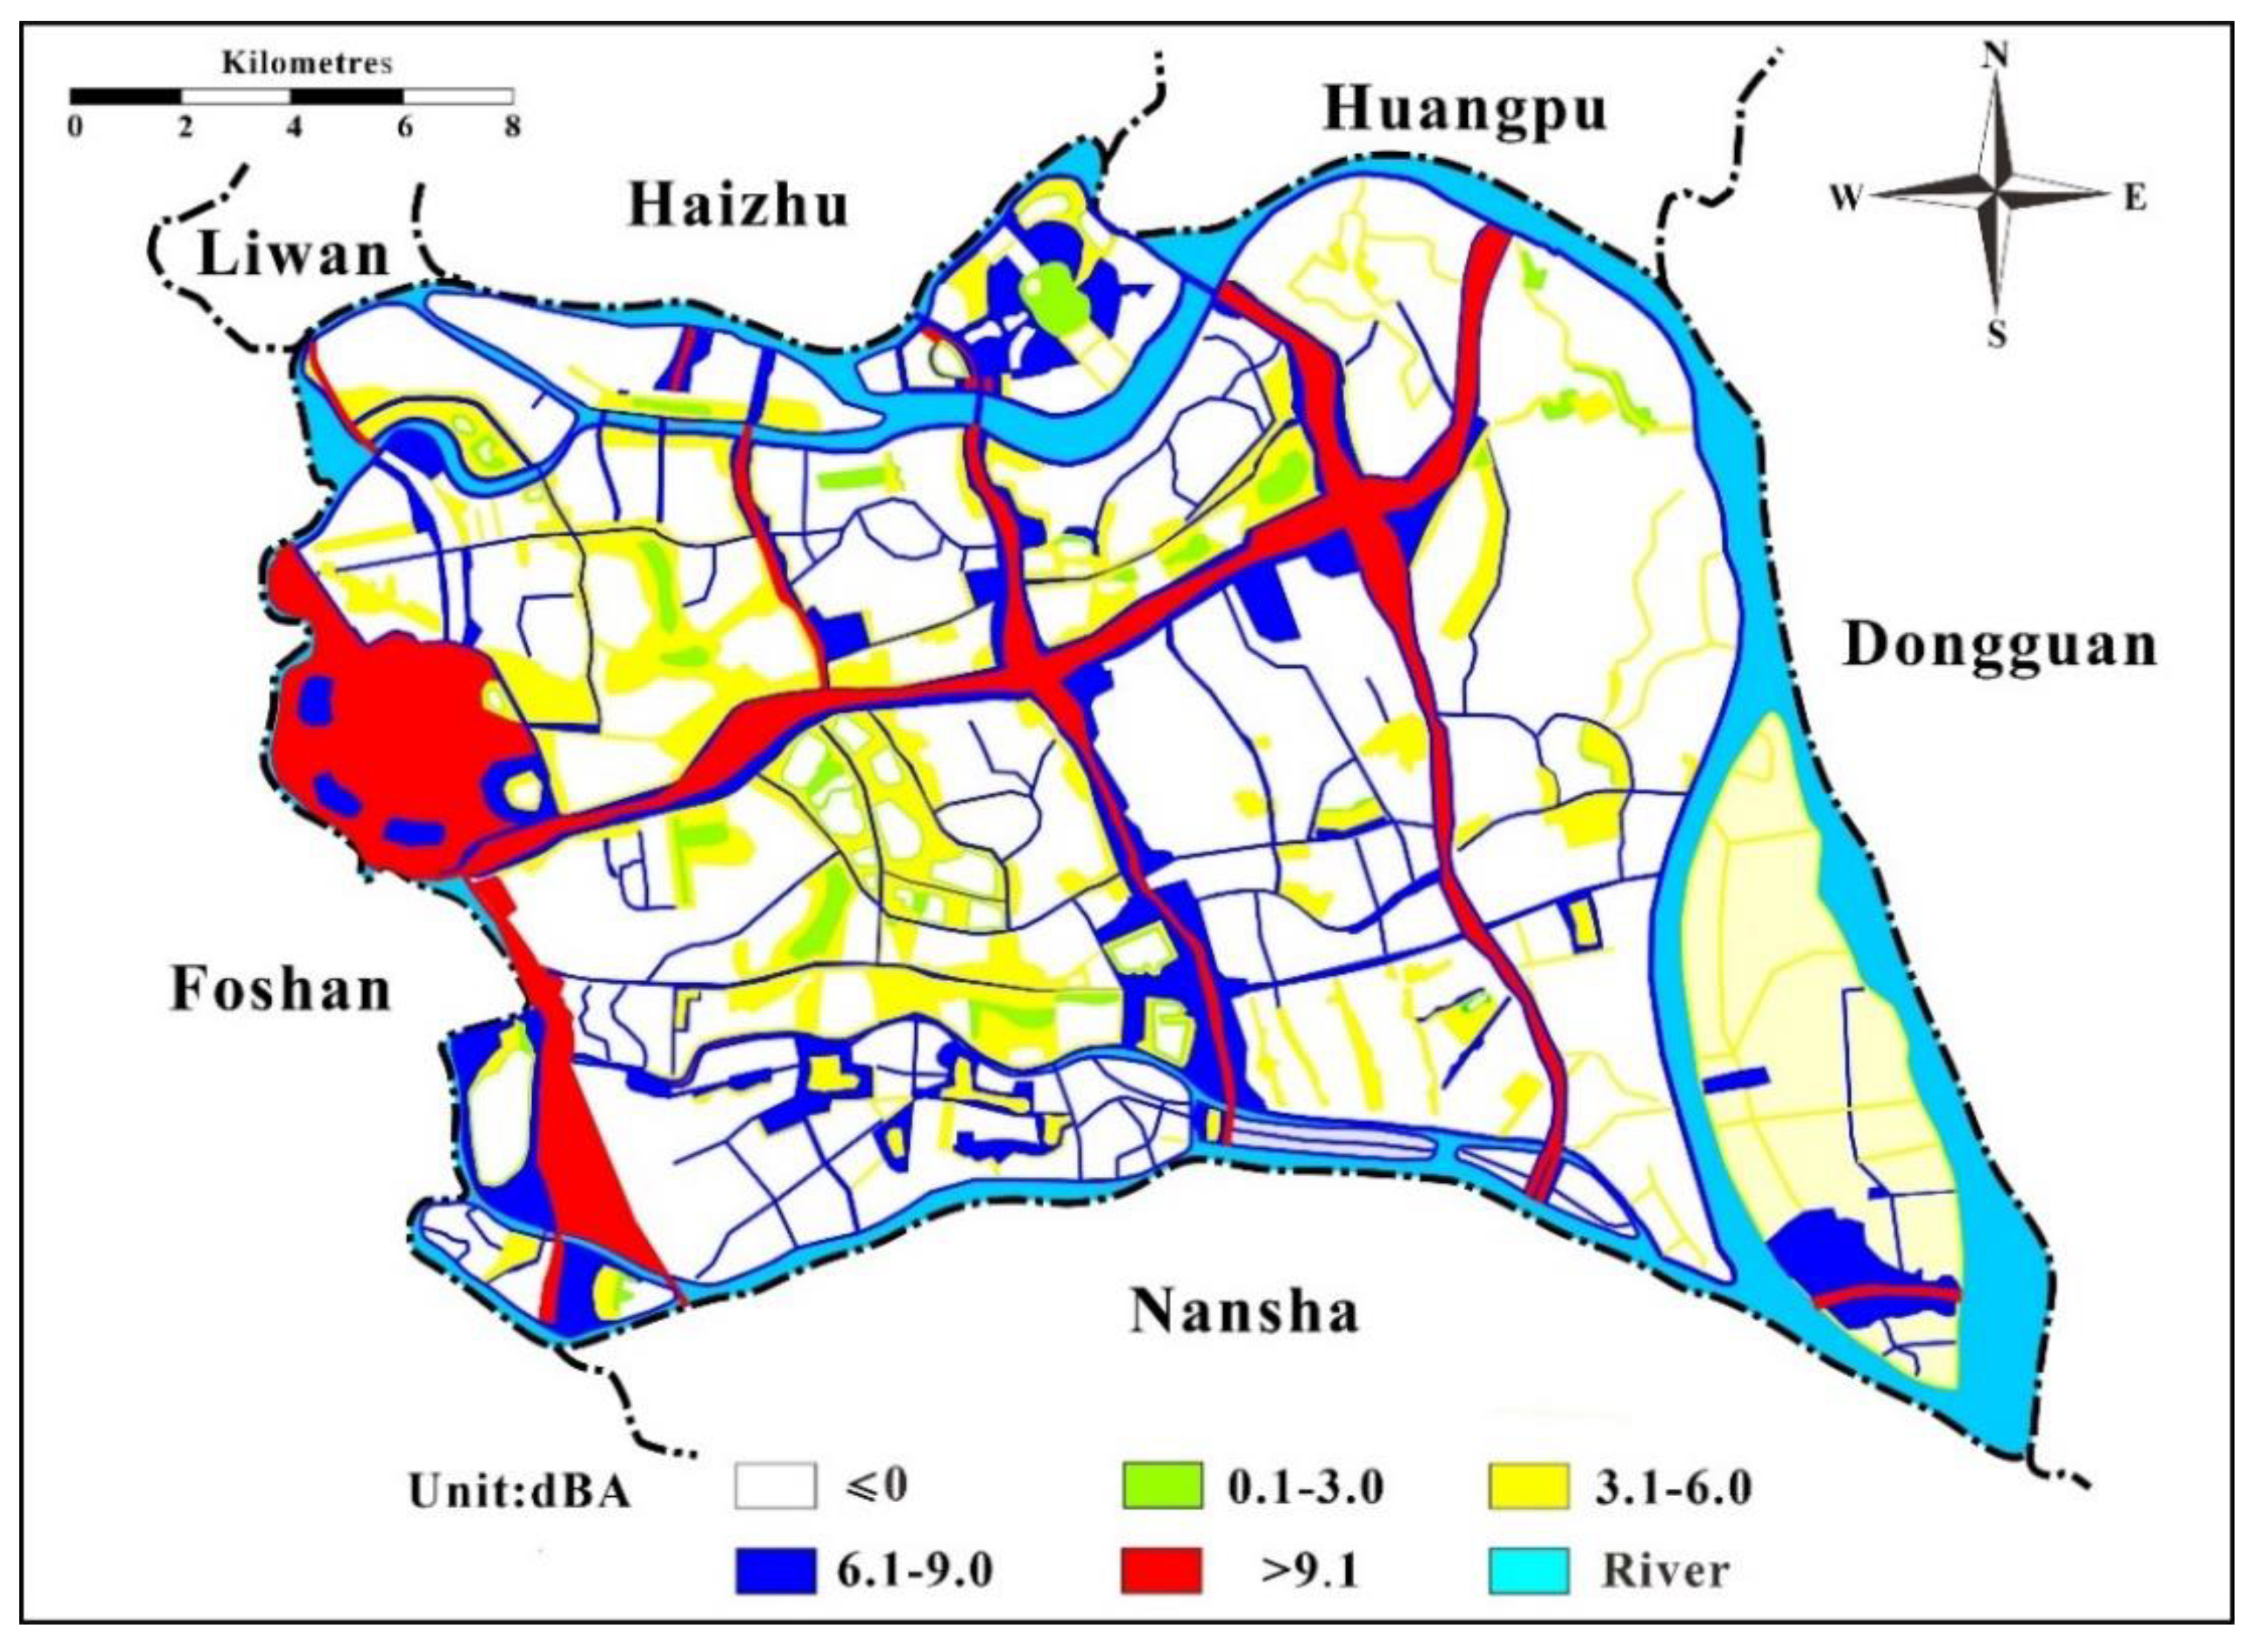
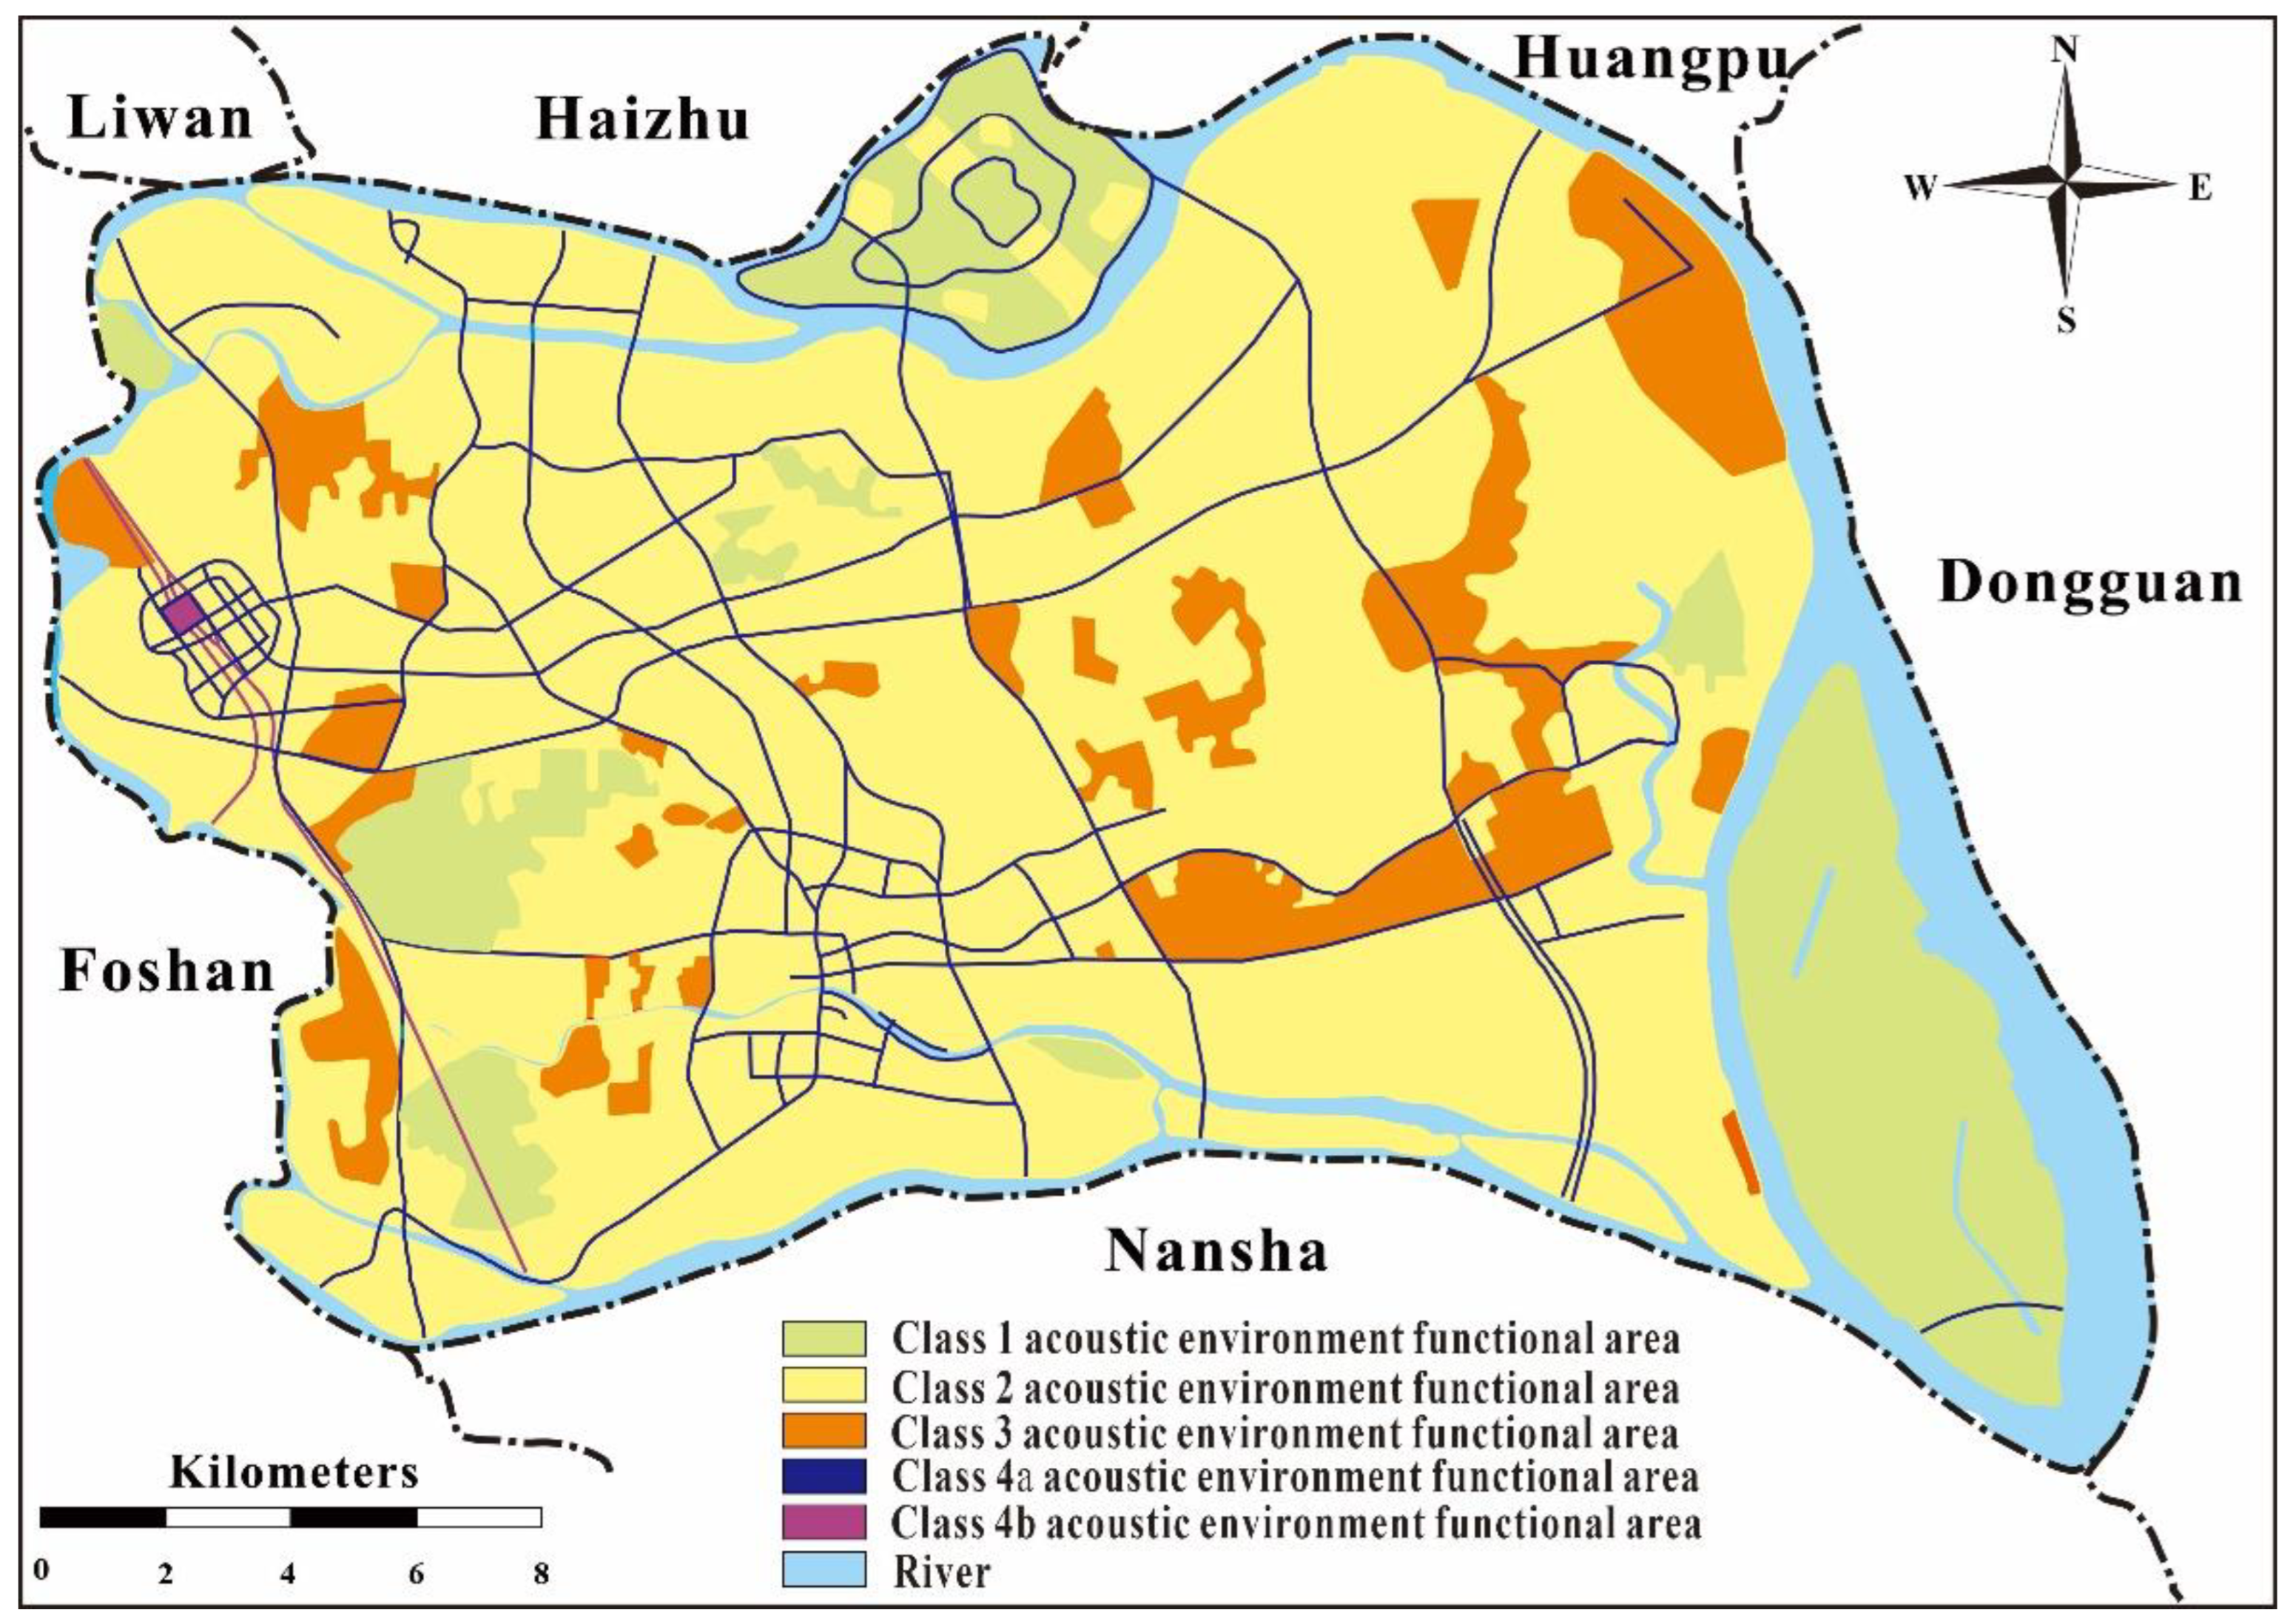
The noise pollution in Panyu District was firstly analyzed based on the noise map that was obtained from earlier work [36] (see Figure A1 and Figure A2 in Appendix A). The constructed noise map was computed using a noise model integrated into commercial software on the basis of field traffic flow measurements. The numerical model was firstly calibrated and verified with field noise measurements before being implemented in the city-scale simulations. In order to evaluate the noise pollution conditions in Panyu District, the total land area was divided into four classes of acoustic environment functional areas (see Figure A4 in Appendix A) according to the Environmental Protection Bureau of Guangzhou. The coverage and noise limit of each class of functional area are defined in Table A1 in Appendix A. For example, medical service areas were categorized as class 1 (noise limits of 55 and 45 dBA for daytime and nighttime, respectively) due to the necessity of a quiet environment for patients. However, for warehouse and industry areas, which are not sensitive to noise levels, these functional areas were categorized as class 3, which can bear high noise limits. According to the developed noise map, the daytime and nighttime over-limit value maps of Panyu District were redrawn, as shown in Figure 1 and Figure 2, respectively. In the present study, the over-limit value is defined as the traffic noise level (see Figure A1 and Figure A2) minus the defined noise limit (see Table A1) in a specific area (see Figure A4).
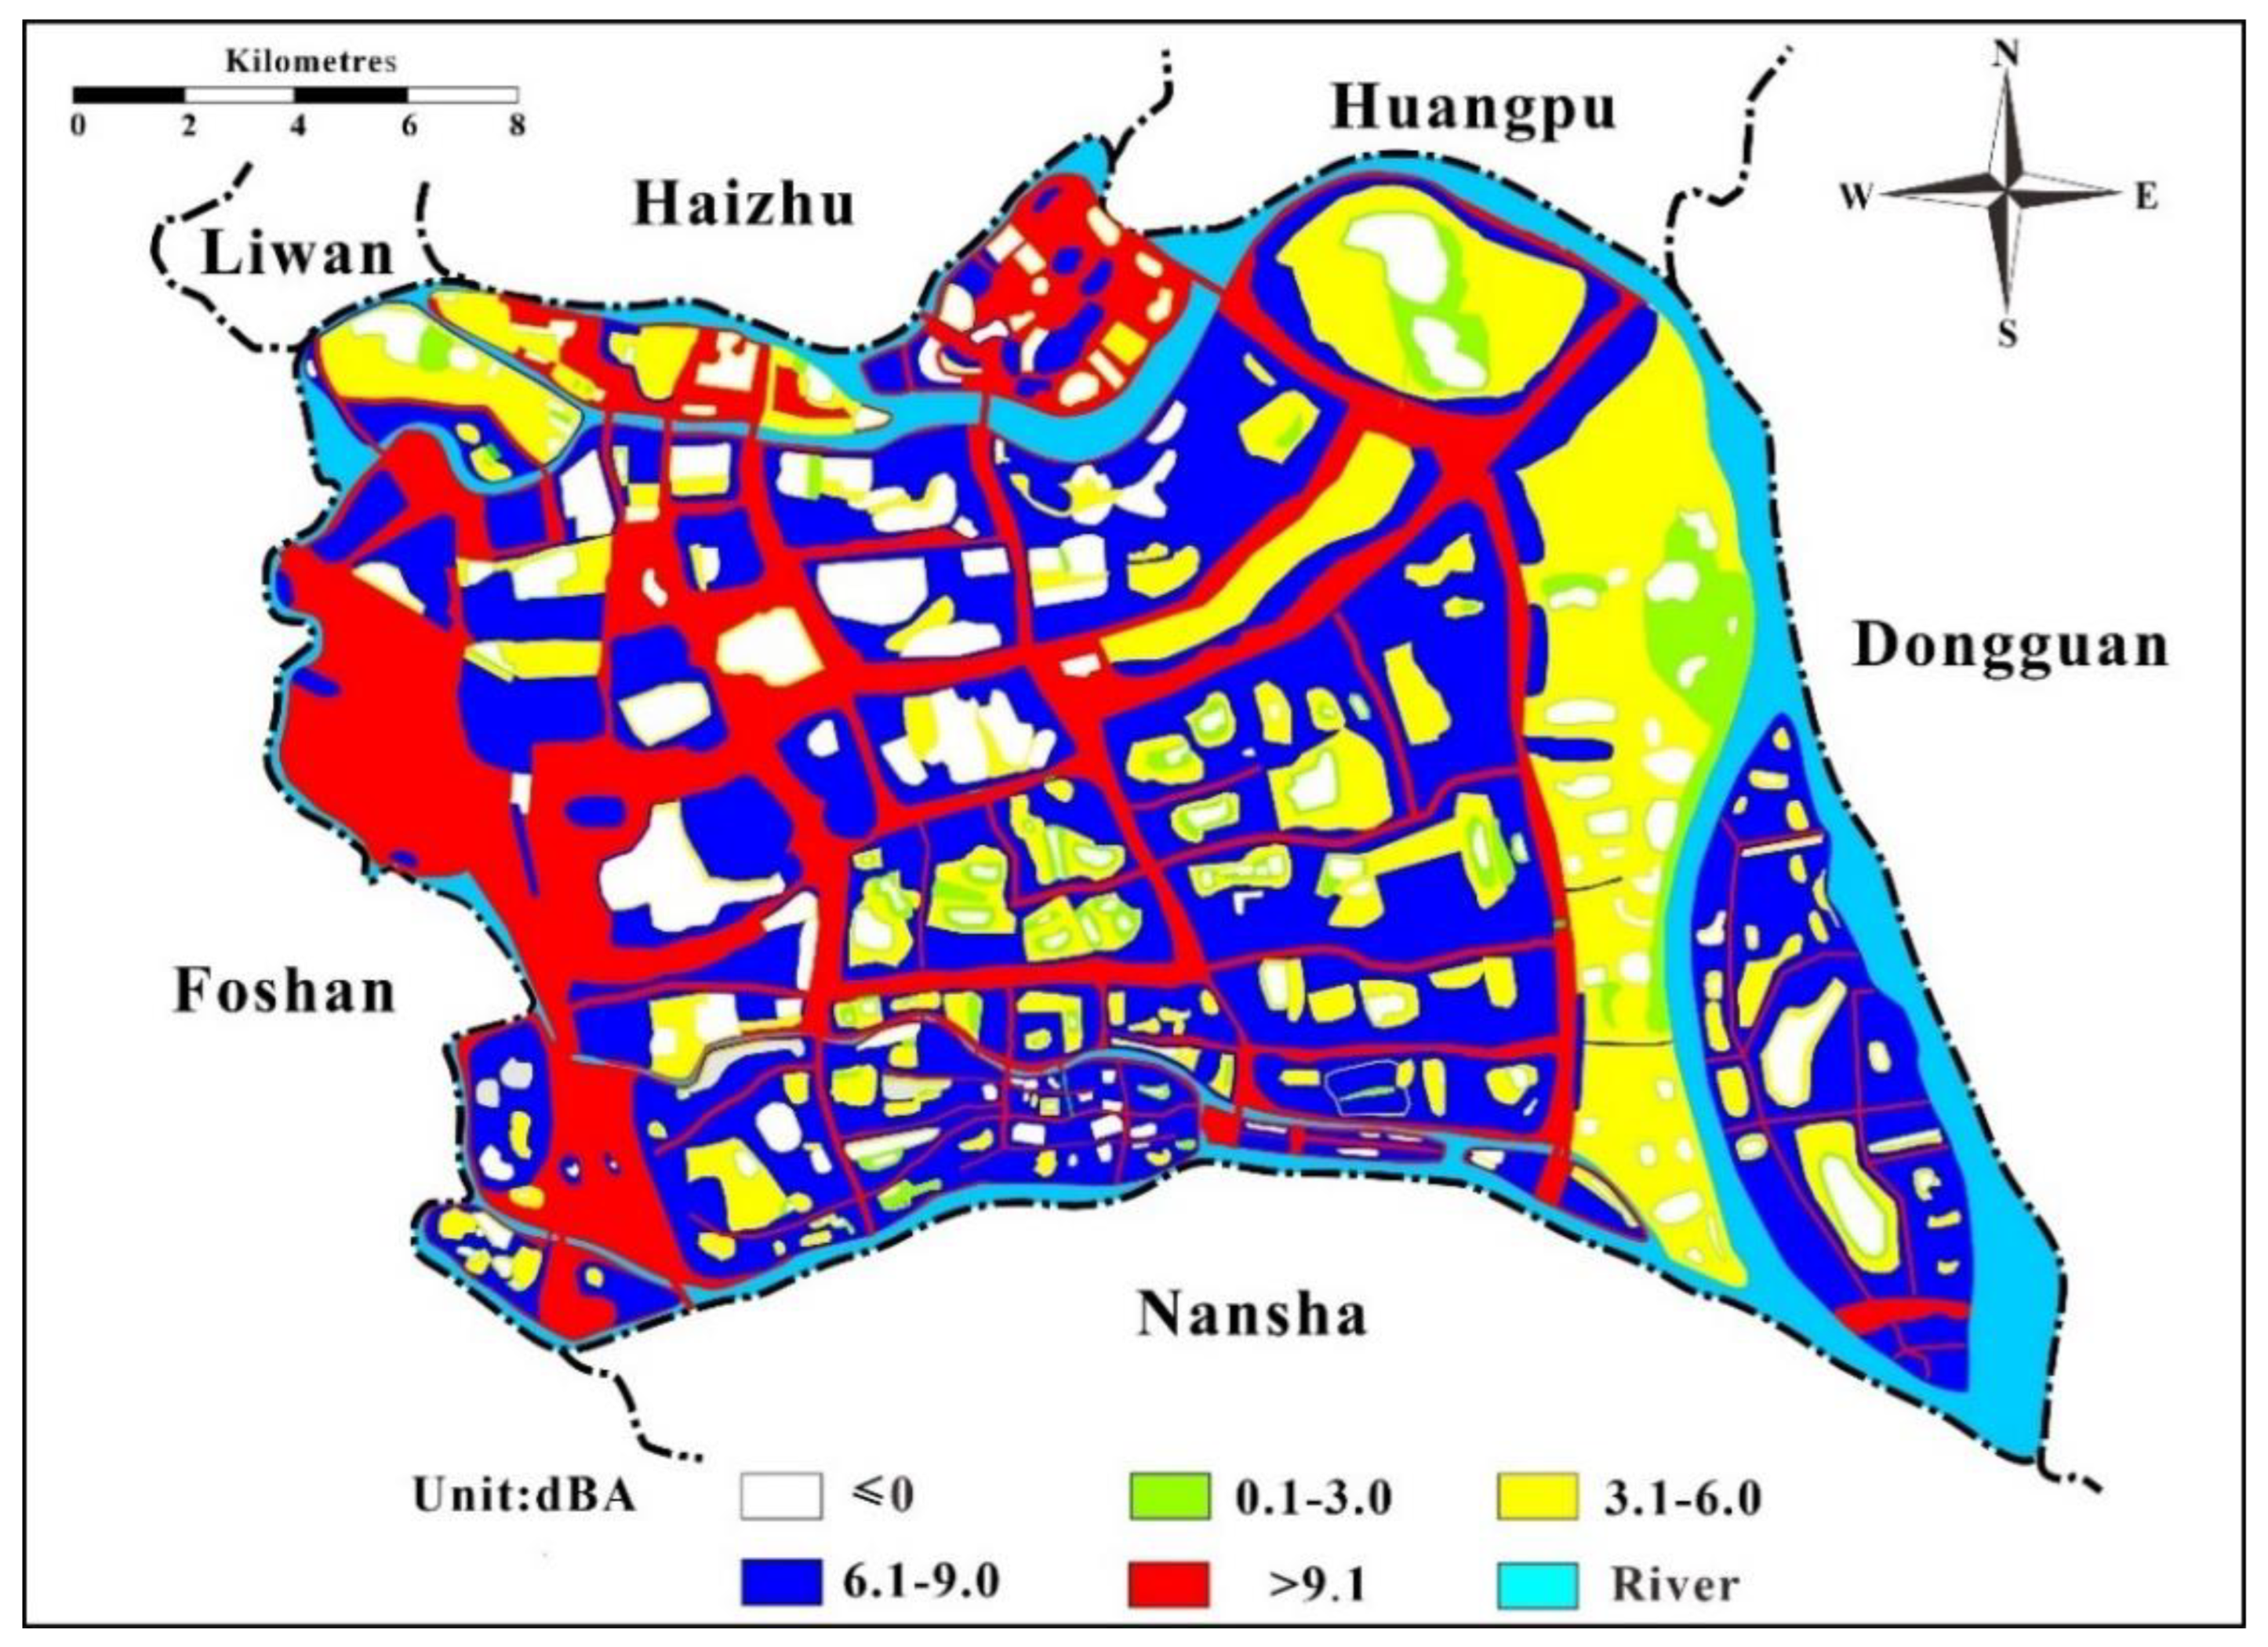
It can be seen in Figure 1 that, during the daytime, the areas with traffic noise levels exceeding the noise limit in Panyu District were mainly concentrated on the sides of traffic arteries. In particular, the areas along the expressways, highways, and railways suffered under high over-limit values (>9.1 dBA), and the over-limit values on both sides of the main roads with high traffic flows ranged from 6.1 to 9.0 dBA. By comparing Figure 1 and Figure 2, it can be found that the over-limit values during the nighttime were much higher than those during the daytime. Among all four classes, the class 4 functional area had the highest over-limit value (>9.1 dBA) in the nighttime. In addition, the traffic noise levels of about 266 km2 of class 2 functional areas exceeded the noise limit during the nighttime, and most of these areas are residential areas with over-limit values greater than 6.1 dBA.
2.2. Noise Reduction Scheme
Based on the pollution degrees obtained from Figure 1 and Figure 2, a numerical simulation was conducted to investigate the effects of noise barriers along the traffic arteries in order to protect the residential areas, cultural educational areas, and medical service areas on both sides of the traffic arteries from the interference from high levels of traffic noise. The following aspects were considered in the simulations:
- Firstly, noise barriers were built along all expressways and highways.
- Secondly, noise barriers were built in some sections of the arterial roads, where these sections referred to areas with high traffic noise levels and dense dwelling units, as shown in Figure 1, Figure 2 and Figure A5 in Appendix A.
2.3. Sound Absorption Material
As the noise over-limit values obtained in Section 2.1 were quite large, the concept of a high-performance absorptive barrier is proposed in the present study. Absorptive noise barriers are usually developed with the installation of sound absorption materials on the structures of normal noise barriers [35]. According to the “Standard requirement of acoustic design and measurement for noise barrier” (HJ/T90-2004) [37], the noise reduction coefficient of a sound absorption material for a noise barrier should be greater than 0.5. In the present study, four materials, namely, rock wool, slag wool, polyurethane foam, and superfine glass wool (5 mm thickness), were selected for comparison based on their good sound absorption performance with respect to what was provided in the “Optimization study of road noise barriers” [38]. As shown in Table 1, the noise reduction coefficients (NRCs) of rock wool, slag wool, and superfine glass wool are almost the same, while polyurethane foam has the smallest noise reduction coefficient. As the price of rock wool is much cheaper than that of the other wool materials, rock wool was selected as the sound absorption material for the noise barrier modeled in the present study, with an NRC of 0.75.
2.4. Geometry of the Noise Barrier
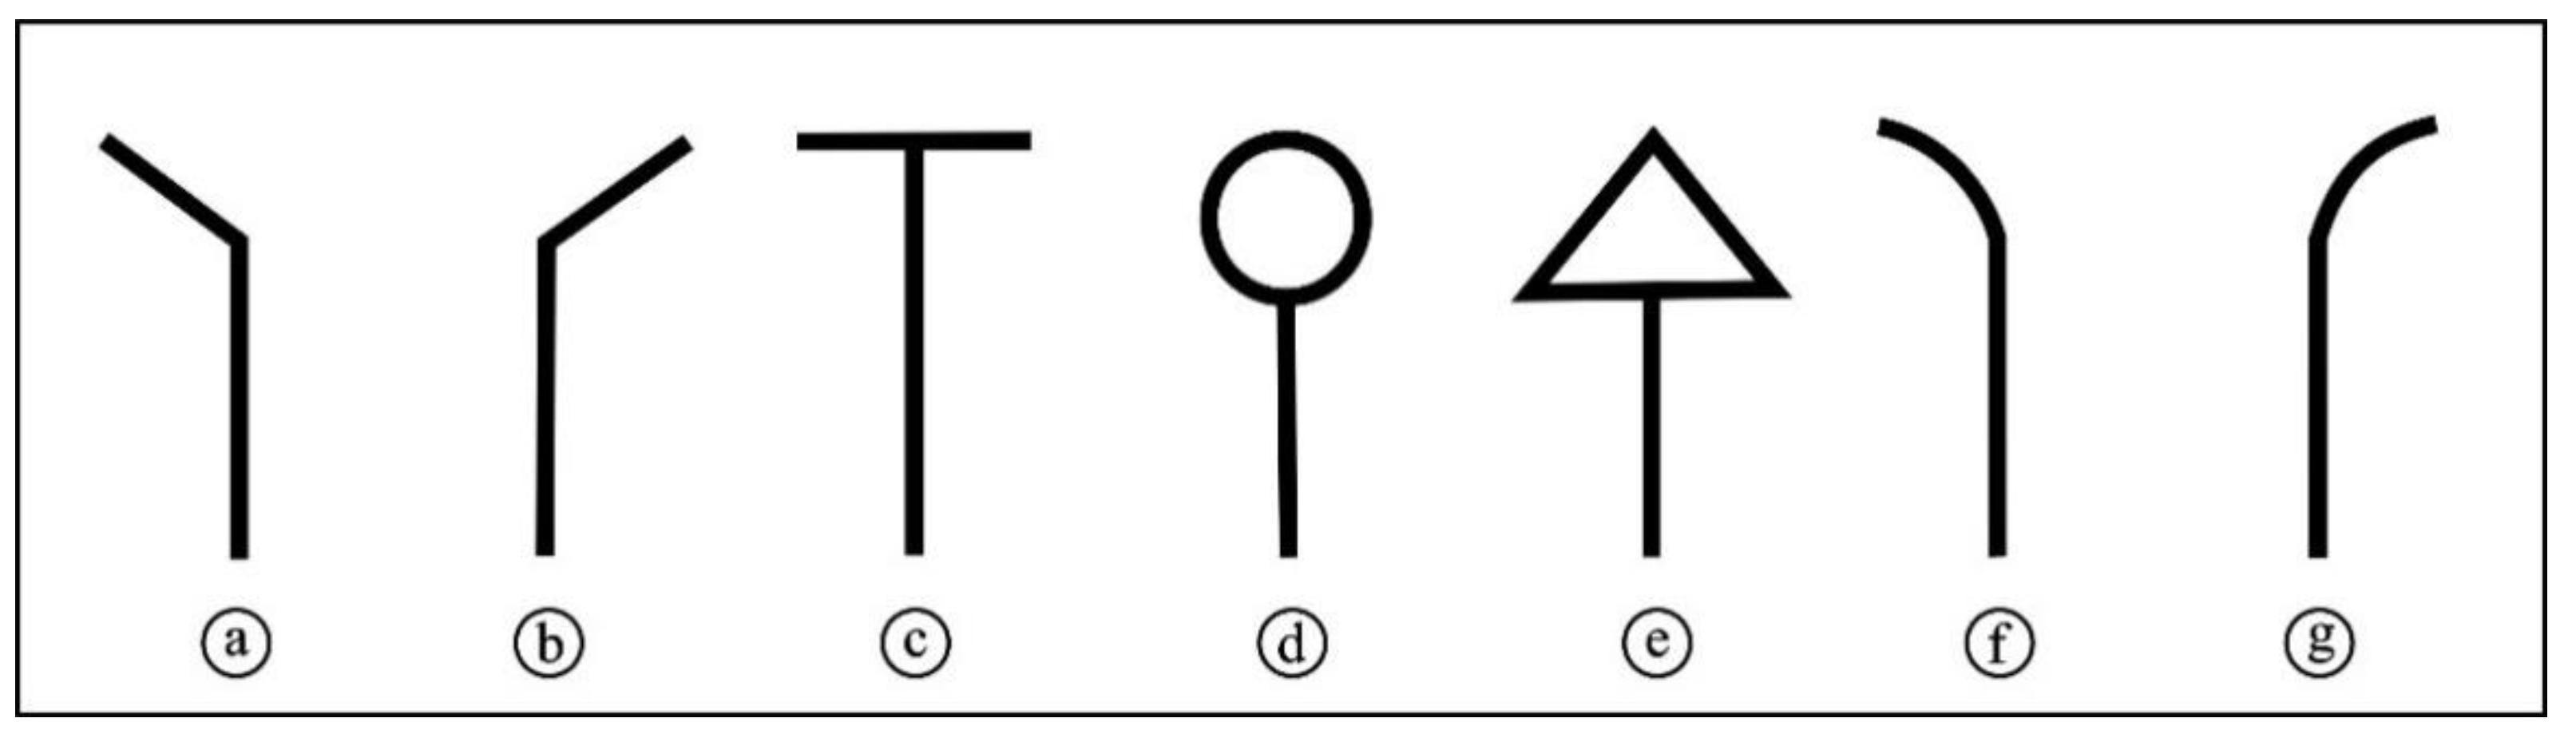
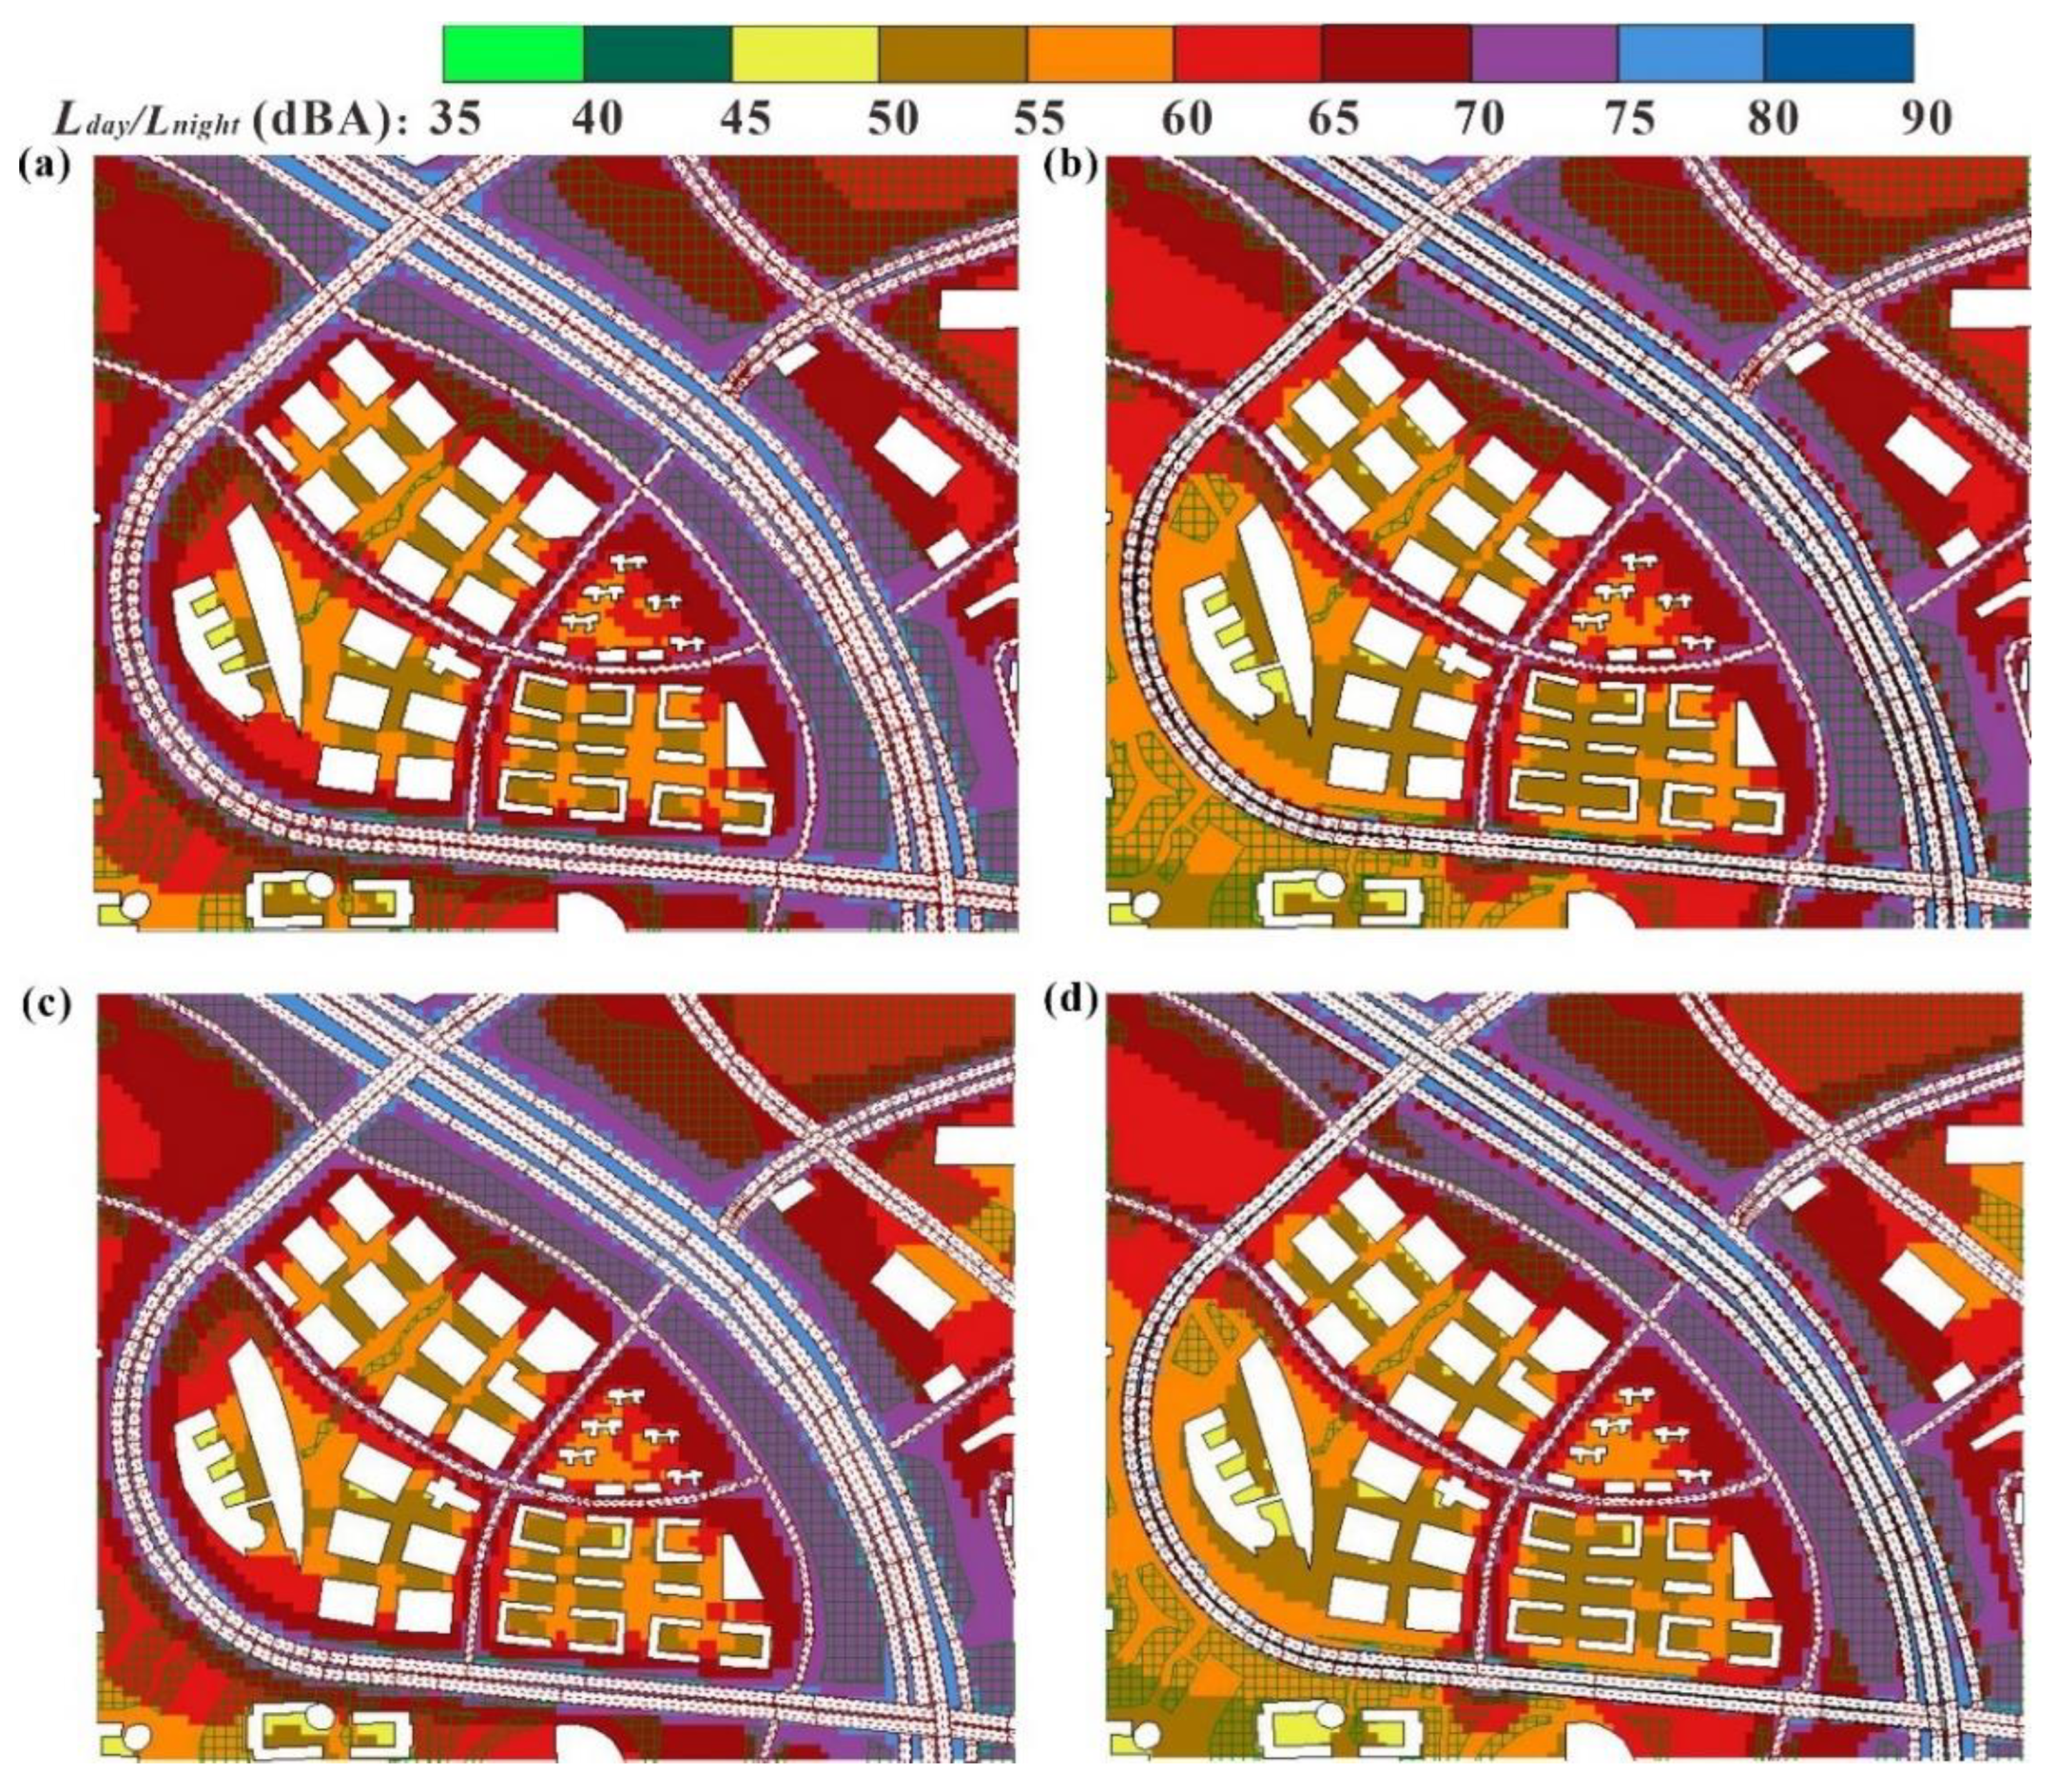
A literature review on the geometry of noise barriers is shown in Table 2. It was found that, in recent years, L-shaped has been the most common geometry to be used for road noise barriers, while curved cantilever and straight-edge noise barriers were also used by a small number of researchers. To investigate the effectiveness of different noise barriers, five types of noise barriers (see Figure 3) were modeled on both sides of the roads in a small area (0.785 km2) of Guangzhou University in Panyu District. The simulation was repeated six times (included the case without a noise barrier), and only the geometry of the noise barrier was changed during each simulation. Figure 4 shows the noise maps of the small area with and without L-shaped noise barrier during daytime and nighttime. It can be seen that the noise level of this area was significantly reduced after the construction of the L-shaped noise barrier in both daytime and nighttime.
In addition, areas with sound pressure levels (SPLs) lower than 60 and 50 dBA in the daytime and nighttime, respectively, were analyzed in order to compare the noise attenuation performance of different noise barriers, as shown in Table 3. It was noted that the noise reduction effects of T-shaped, cylindrical, and roof-edge noise barriers were slightly better than those of L-shaped and curved cantilever noise barriers in daytime. However, during the nighttime, the noise reduction effects of L-shaped and curved cantilever noise barriers were slightly better than those of T-shaped, cylindrical, and roof-edge noise barriers. This study focuses more on noise reduction in the nighttime because the noise compliance rate in the nighttime is much lower than that in the daytime (see the previous work of the authors [36] for more details). Thus, L-shaped noise barriers were selected in the present study to mitigate urban traffic noise.
2.5. Position and Height of Noise Barriers
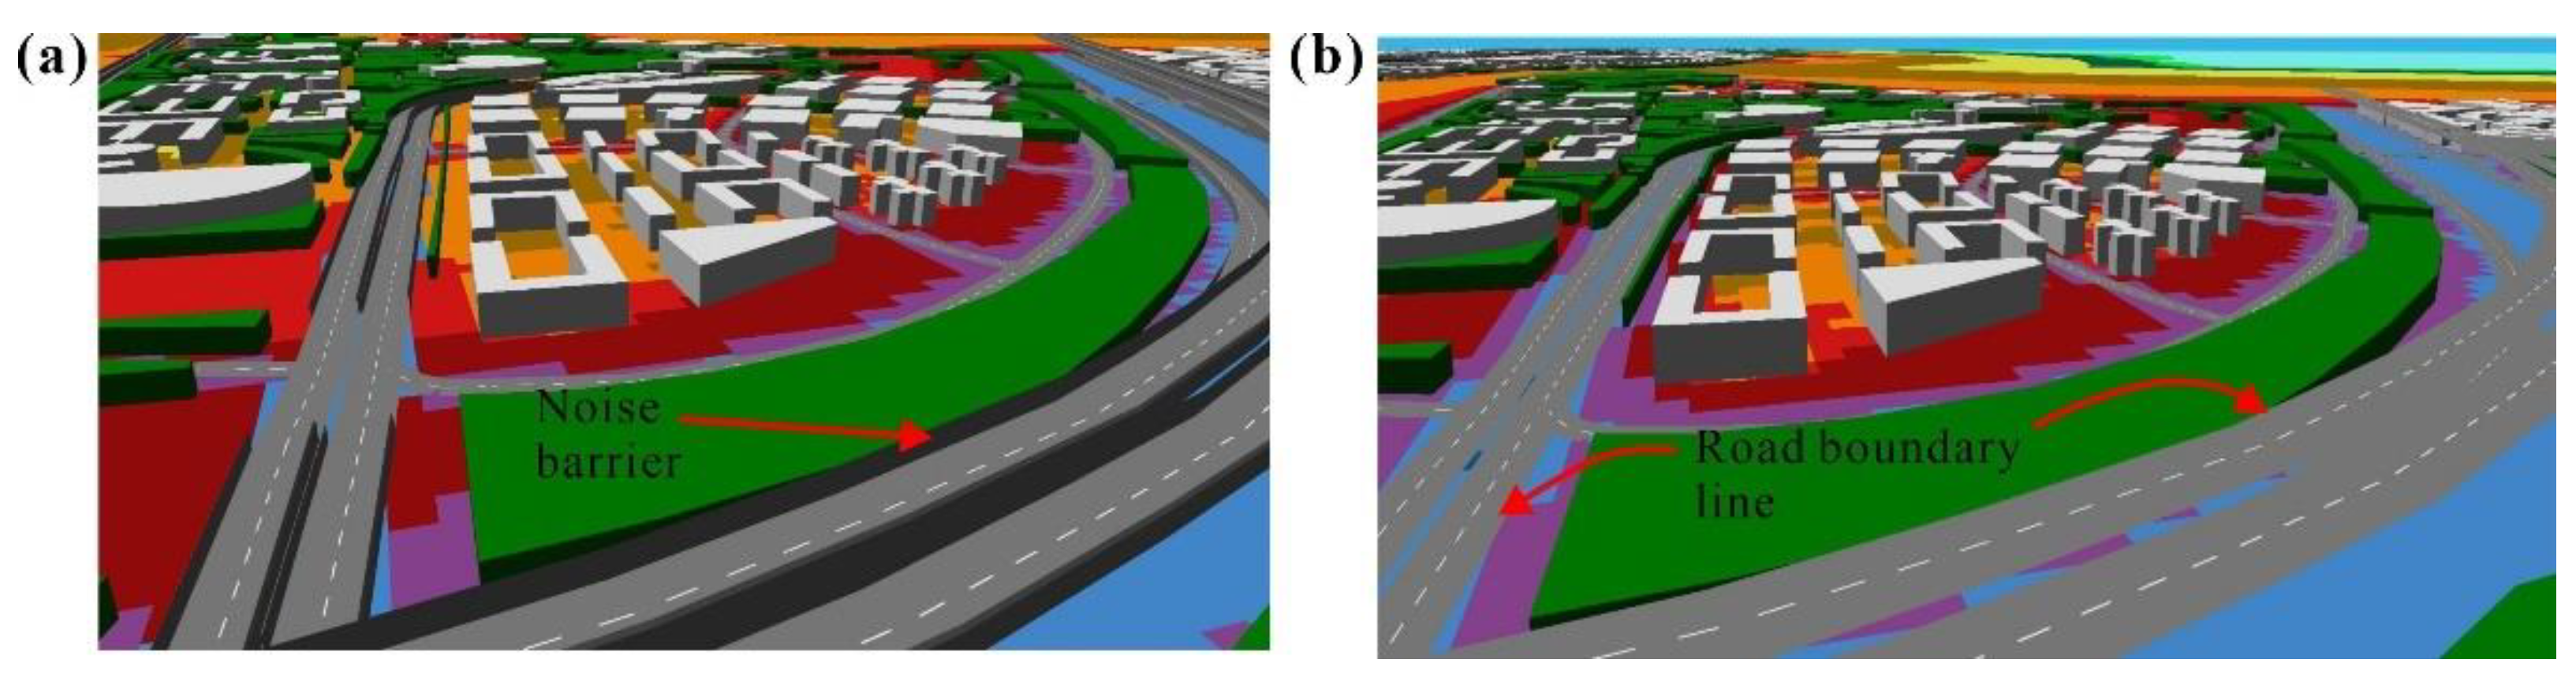
The location of noise barriers was determined based on two rules: (1) The noise barriers should be close to the noise source or the point of the receiver [36]; (2) the installation of noise barriers should not affect the daily life of the public. Hence, in the present study, the location of noise barriers was arranged close to the road boundary line, as shown in Figure 5a. The situation without noise barriers is shown in Figure 5b for comparison.
According to the preliminary simulation results, the traffic noise could be reduced by 3–5 dBA when the defined height of the noise barriers was less than 6 m. When the height of the noise barriers was larger than 6 m, the reduction of traffic noise was predicted to be more than 5 dBA. Since the noise over-limit values in Panyu District fall in different ranges, as shown in Figure 1 and Figure 2, specific heights of the noise barriers are proposed to meet the noise reduction requirements over different ranges. According to the “Standard requirement of acoustic design and measurement for noise barrier” (HJ/T90-2004) [37], the height of noise barriers on both sides of roads should be less than 6 m. Hence, in the present study, the proposed height of the noise barriers was set to 6 m when the noise over-limit value of the specific areas was greater than 5 dBA. However, in the areas where the noise over-limit values were less than 5 dBA, the heights of the noise barriers were selected according to a computation by the software. Finally, the simulation model was rebuilt with noise barriers installed along both sides of the main roads and then recomputed. In the new simulation model, the total length of noise barriers applied in Panyu District was calculated to be 169.3 km.
3. Results and Discussion
3.1. Distribution of Traffic Noise Levels with Noise Barriers
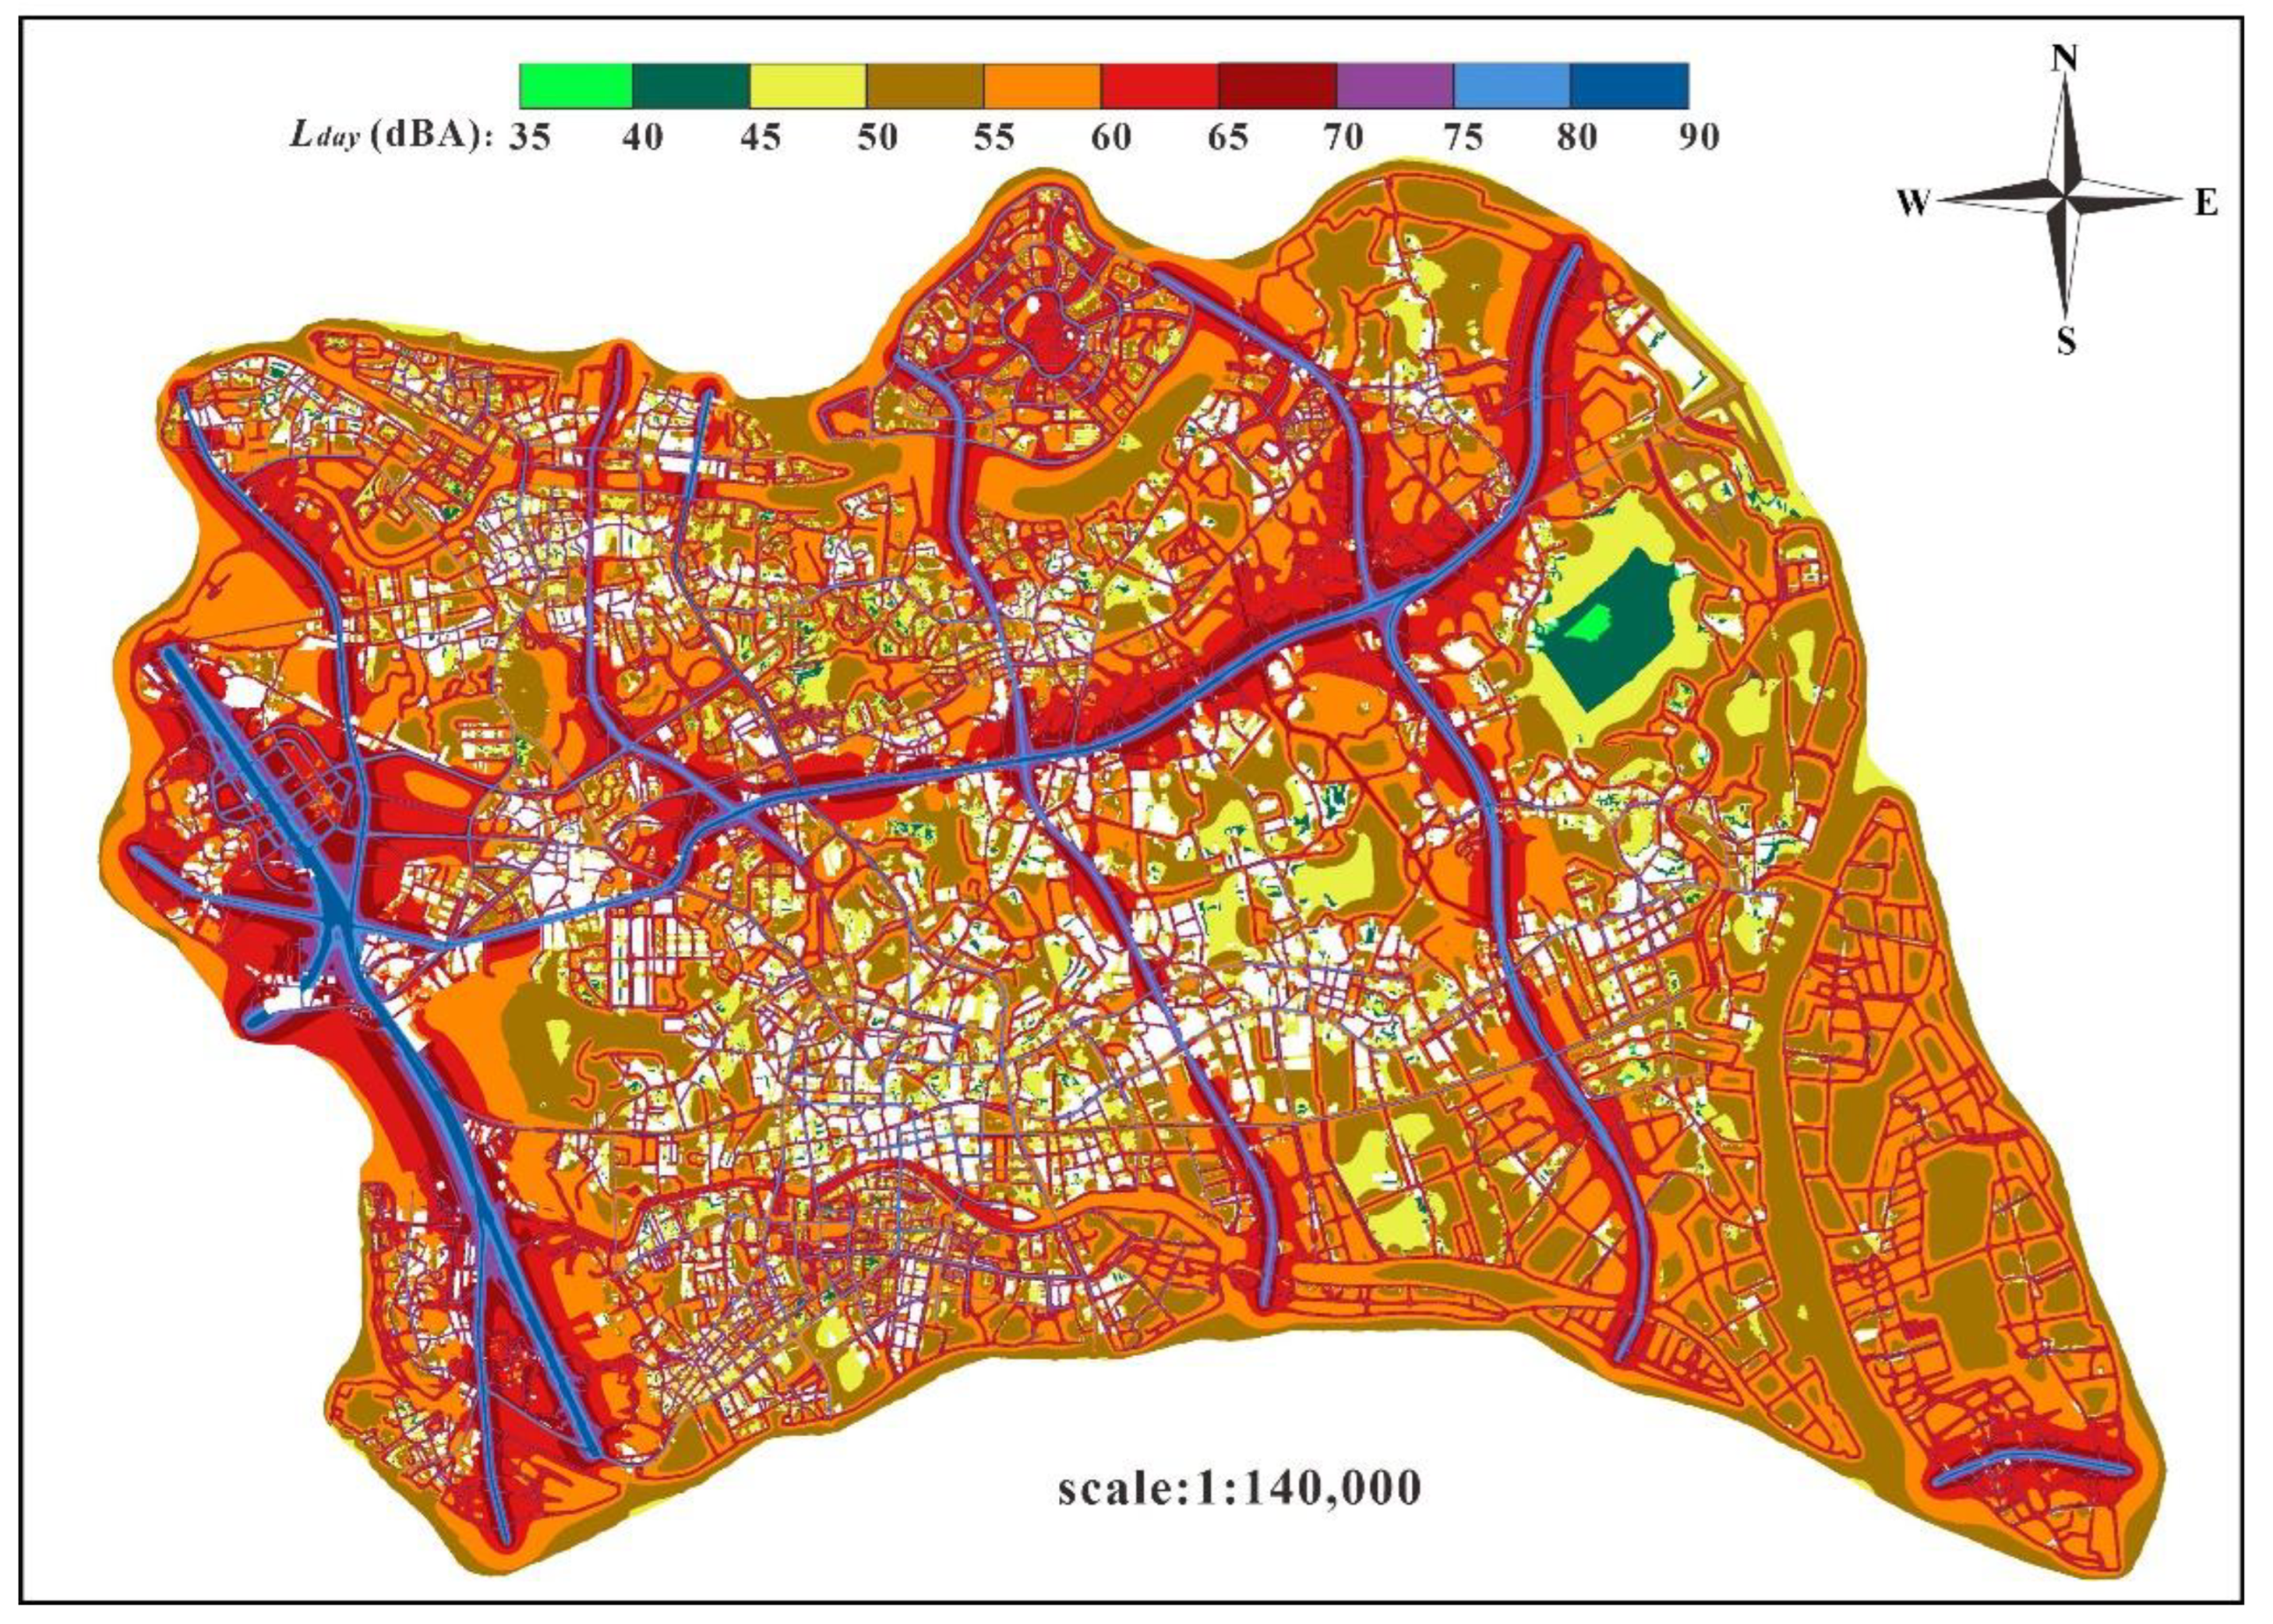
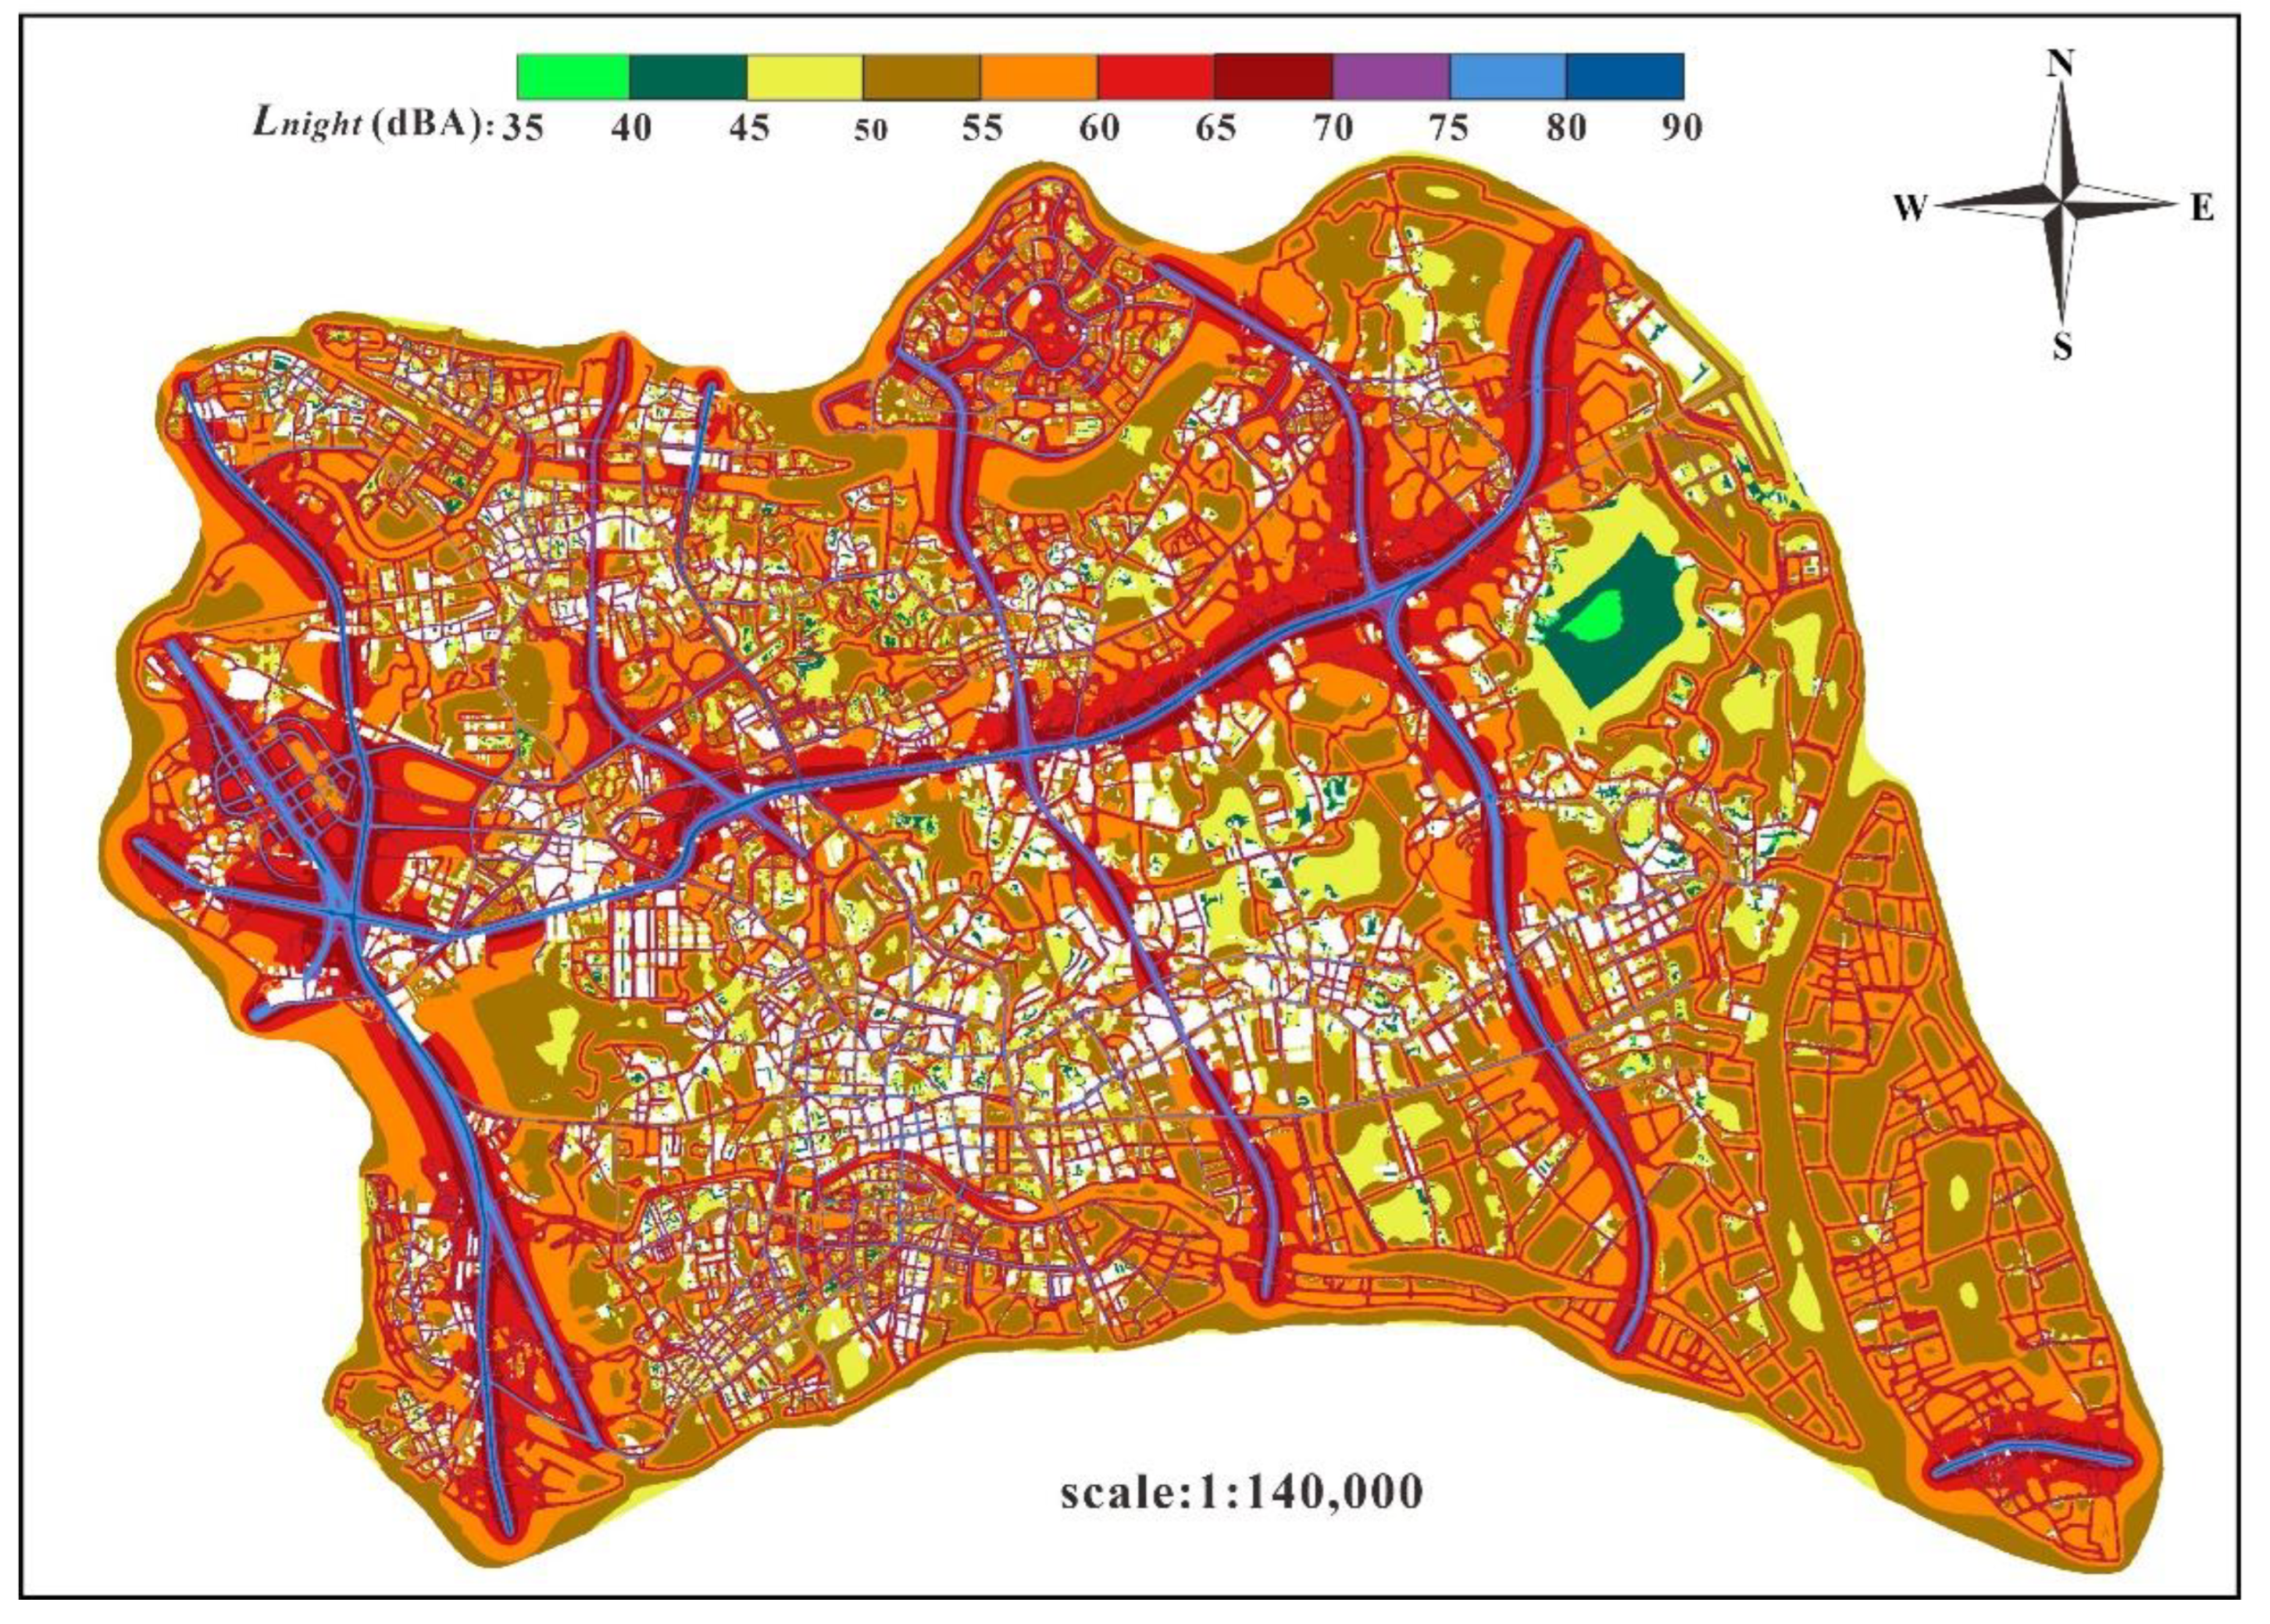
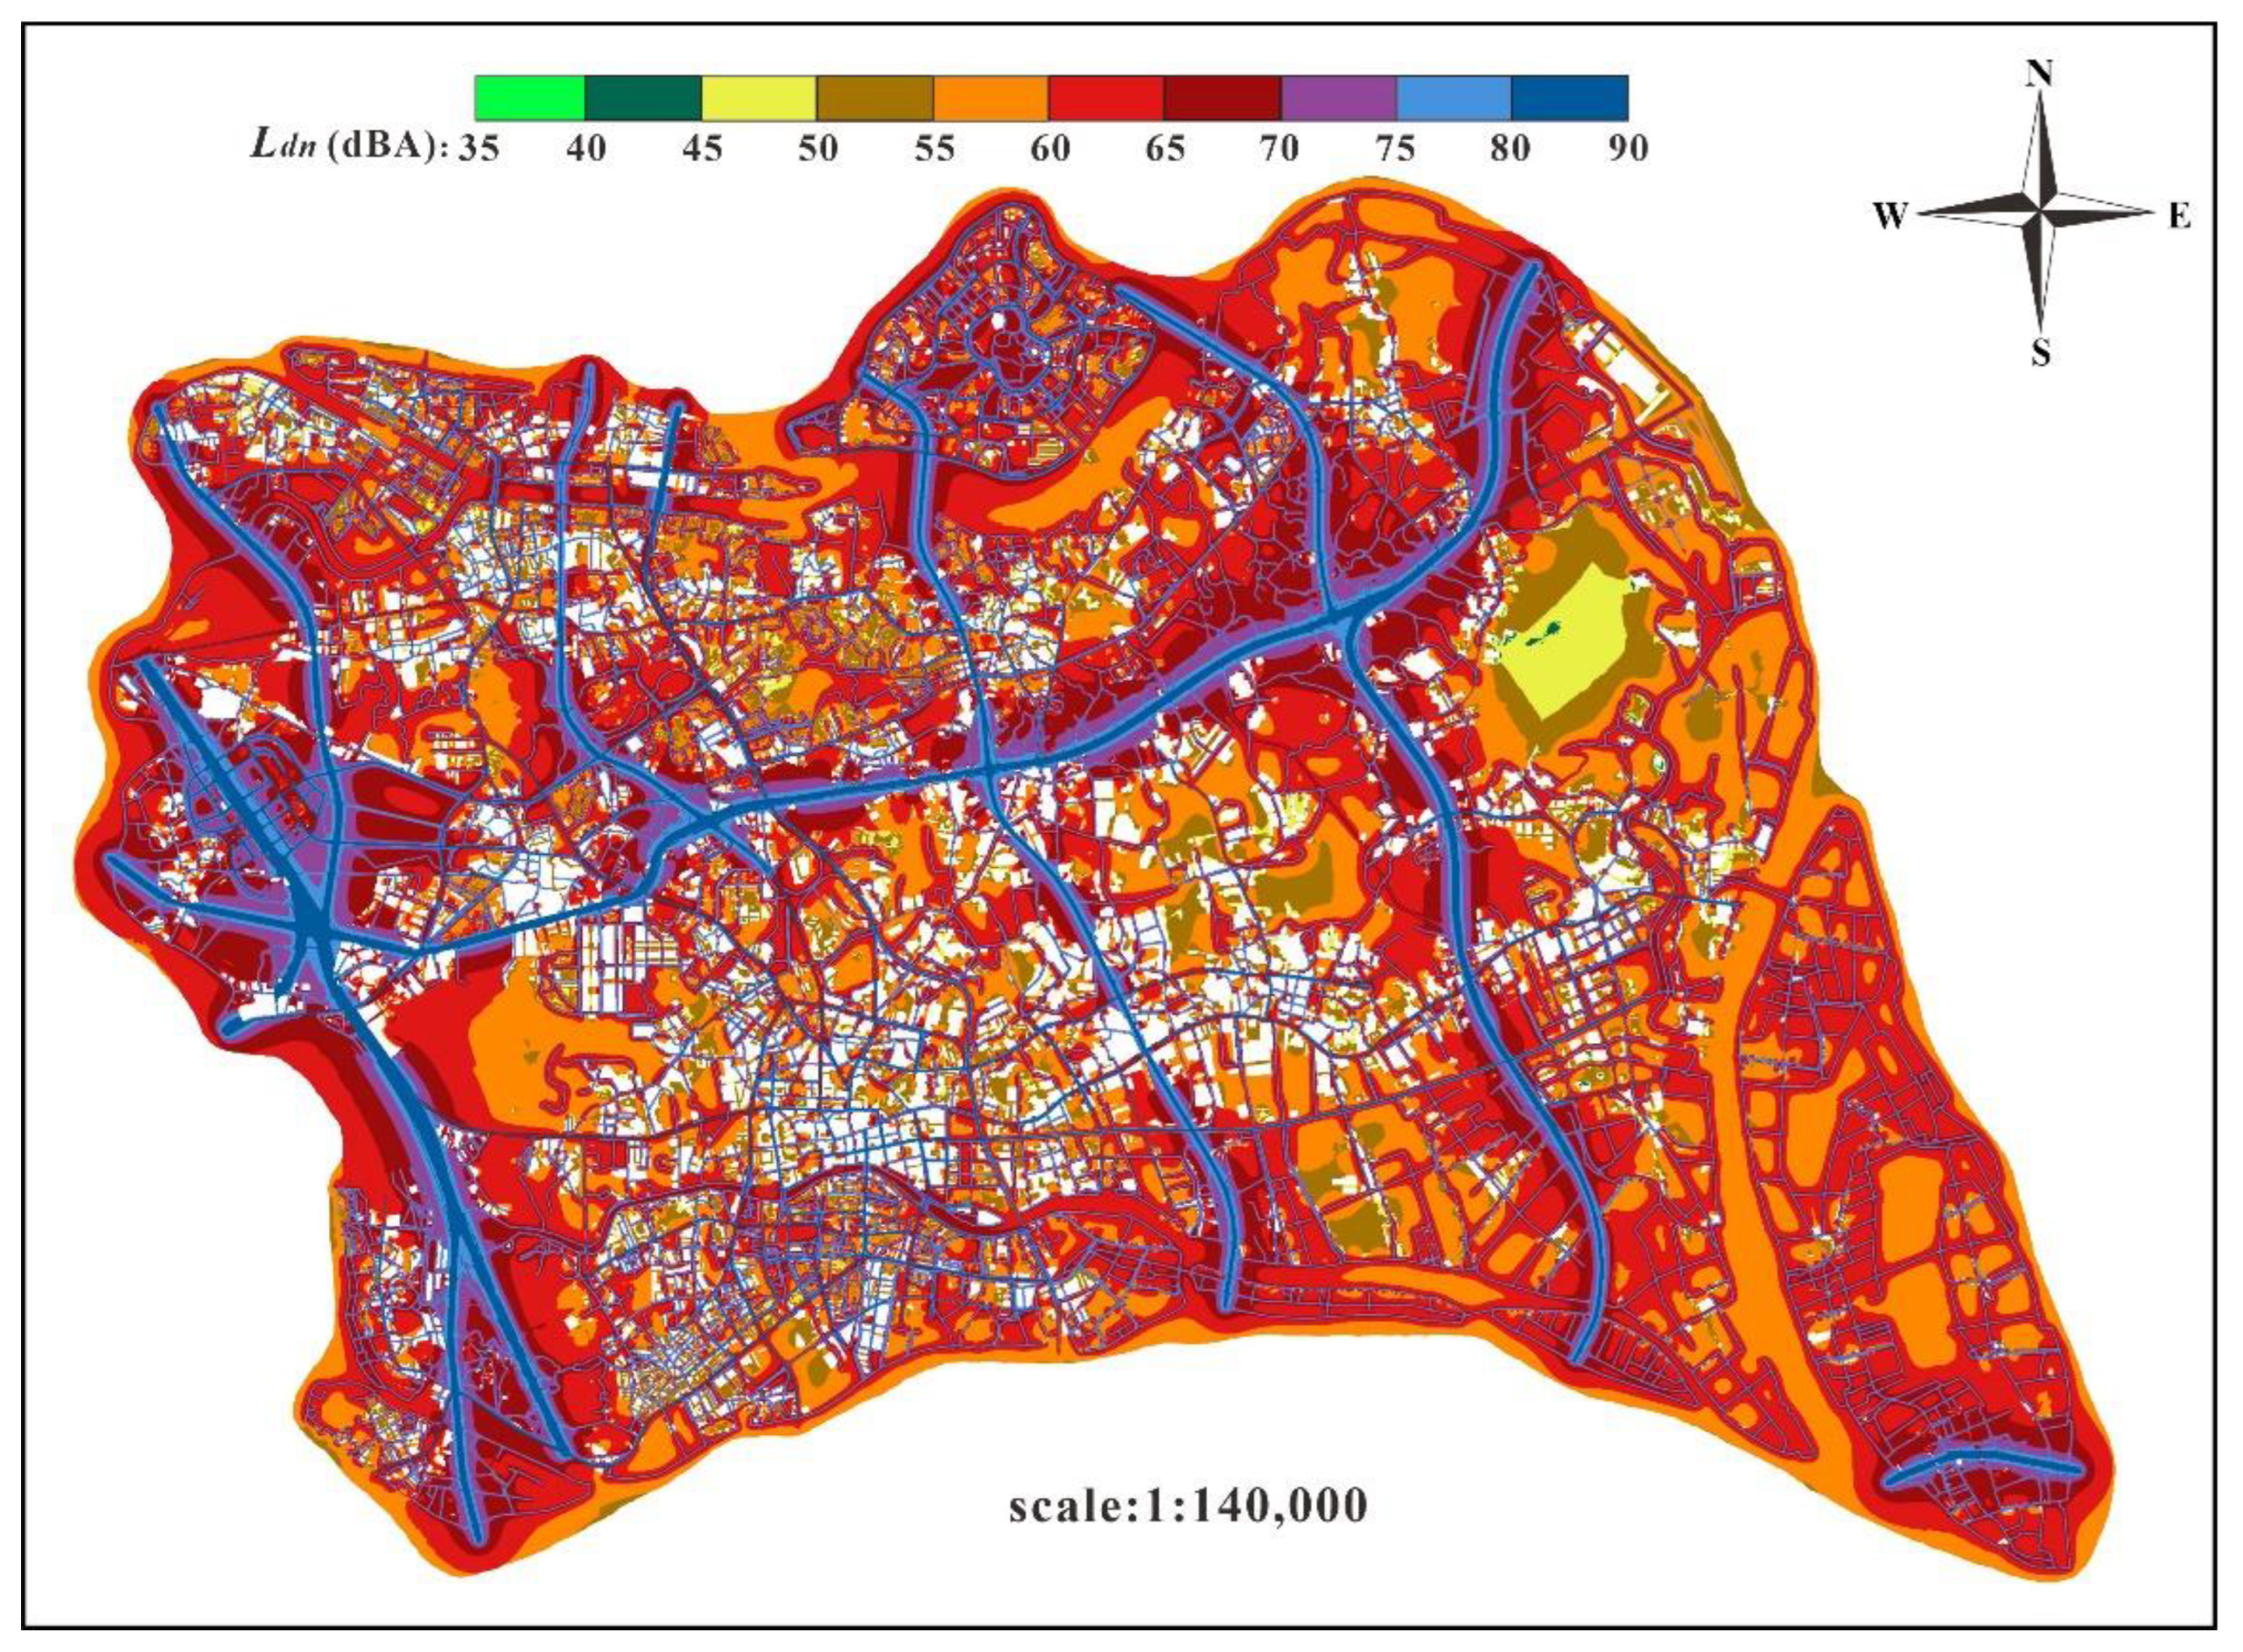
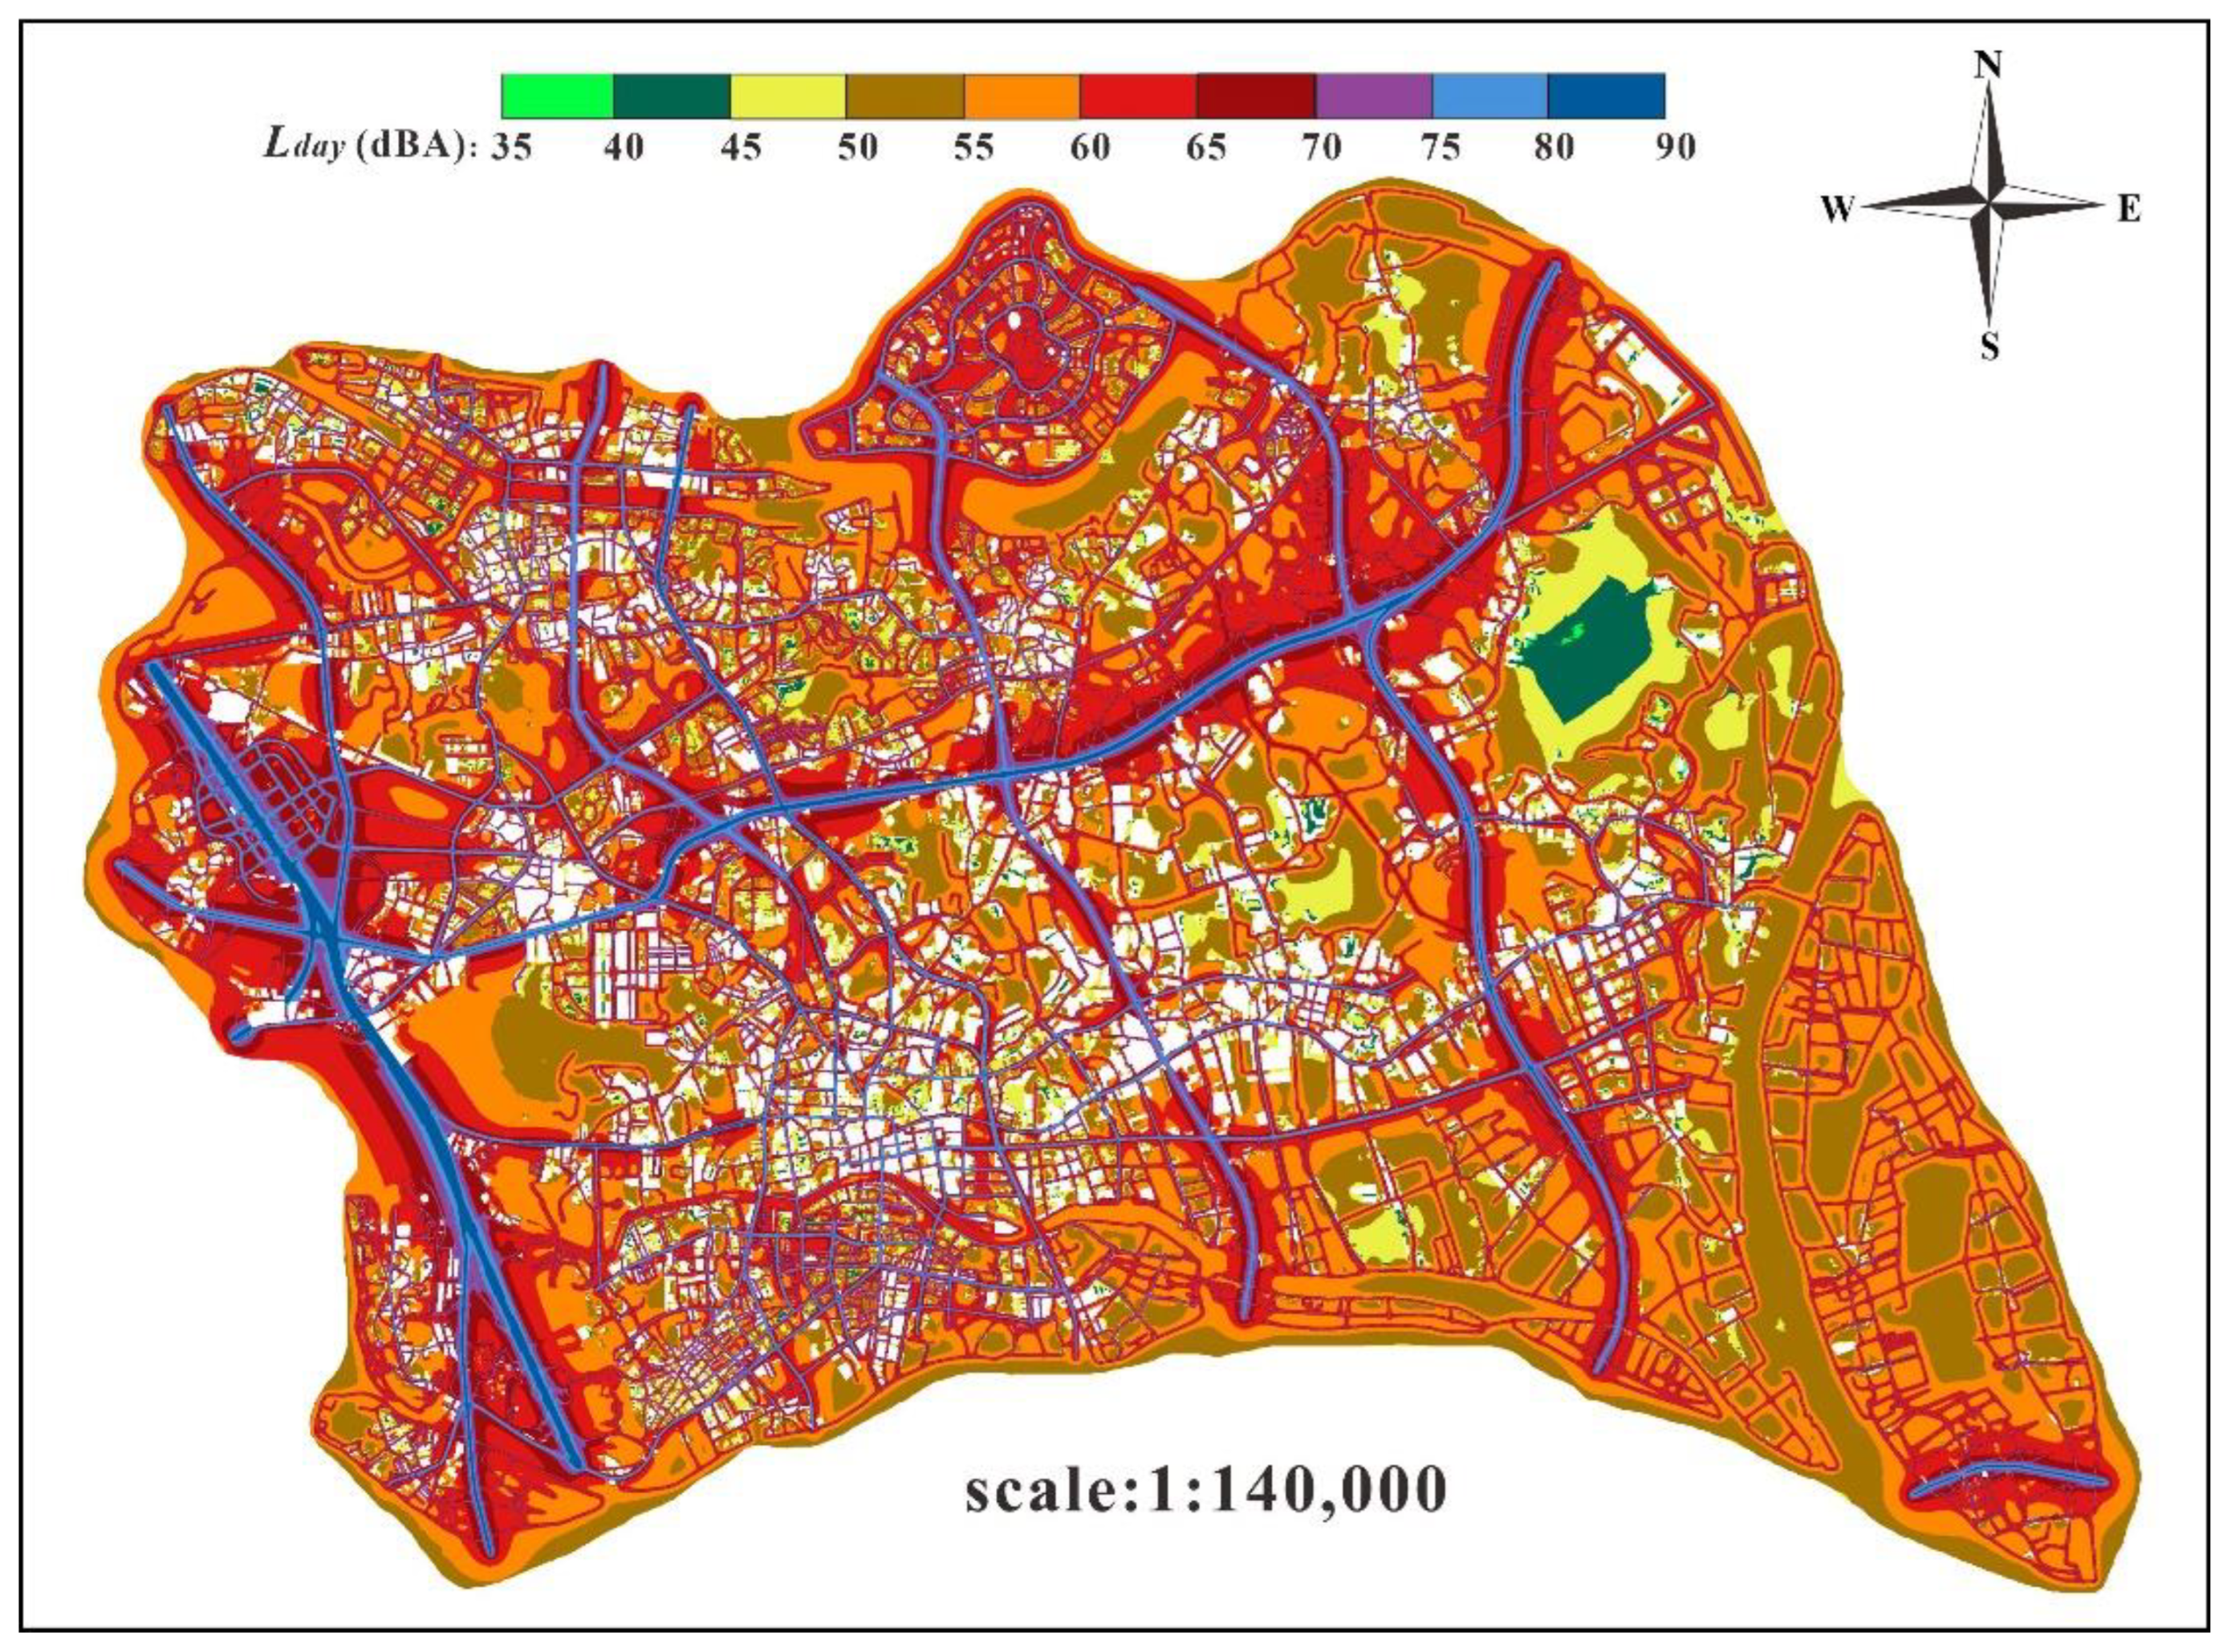
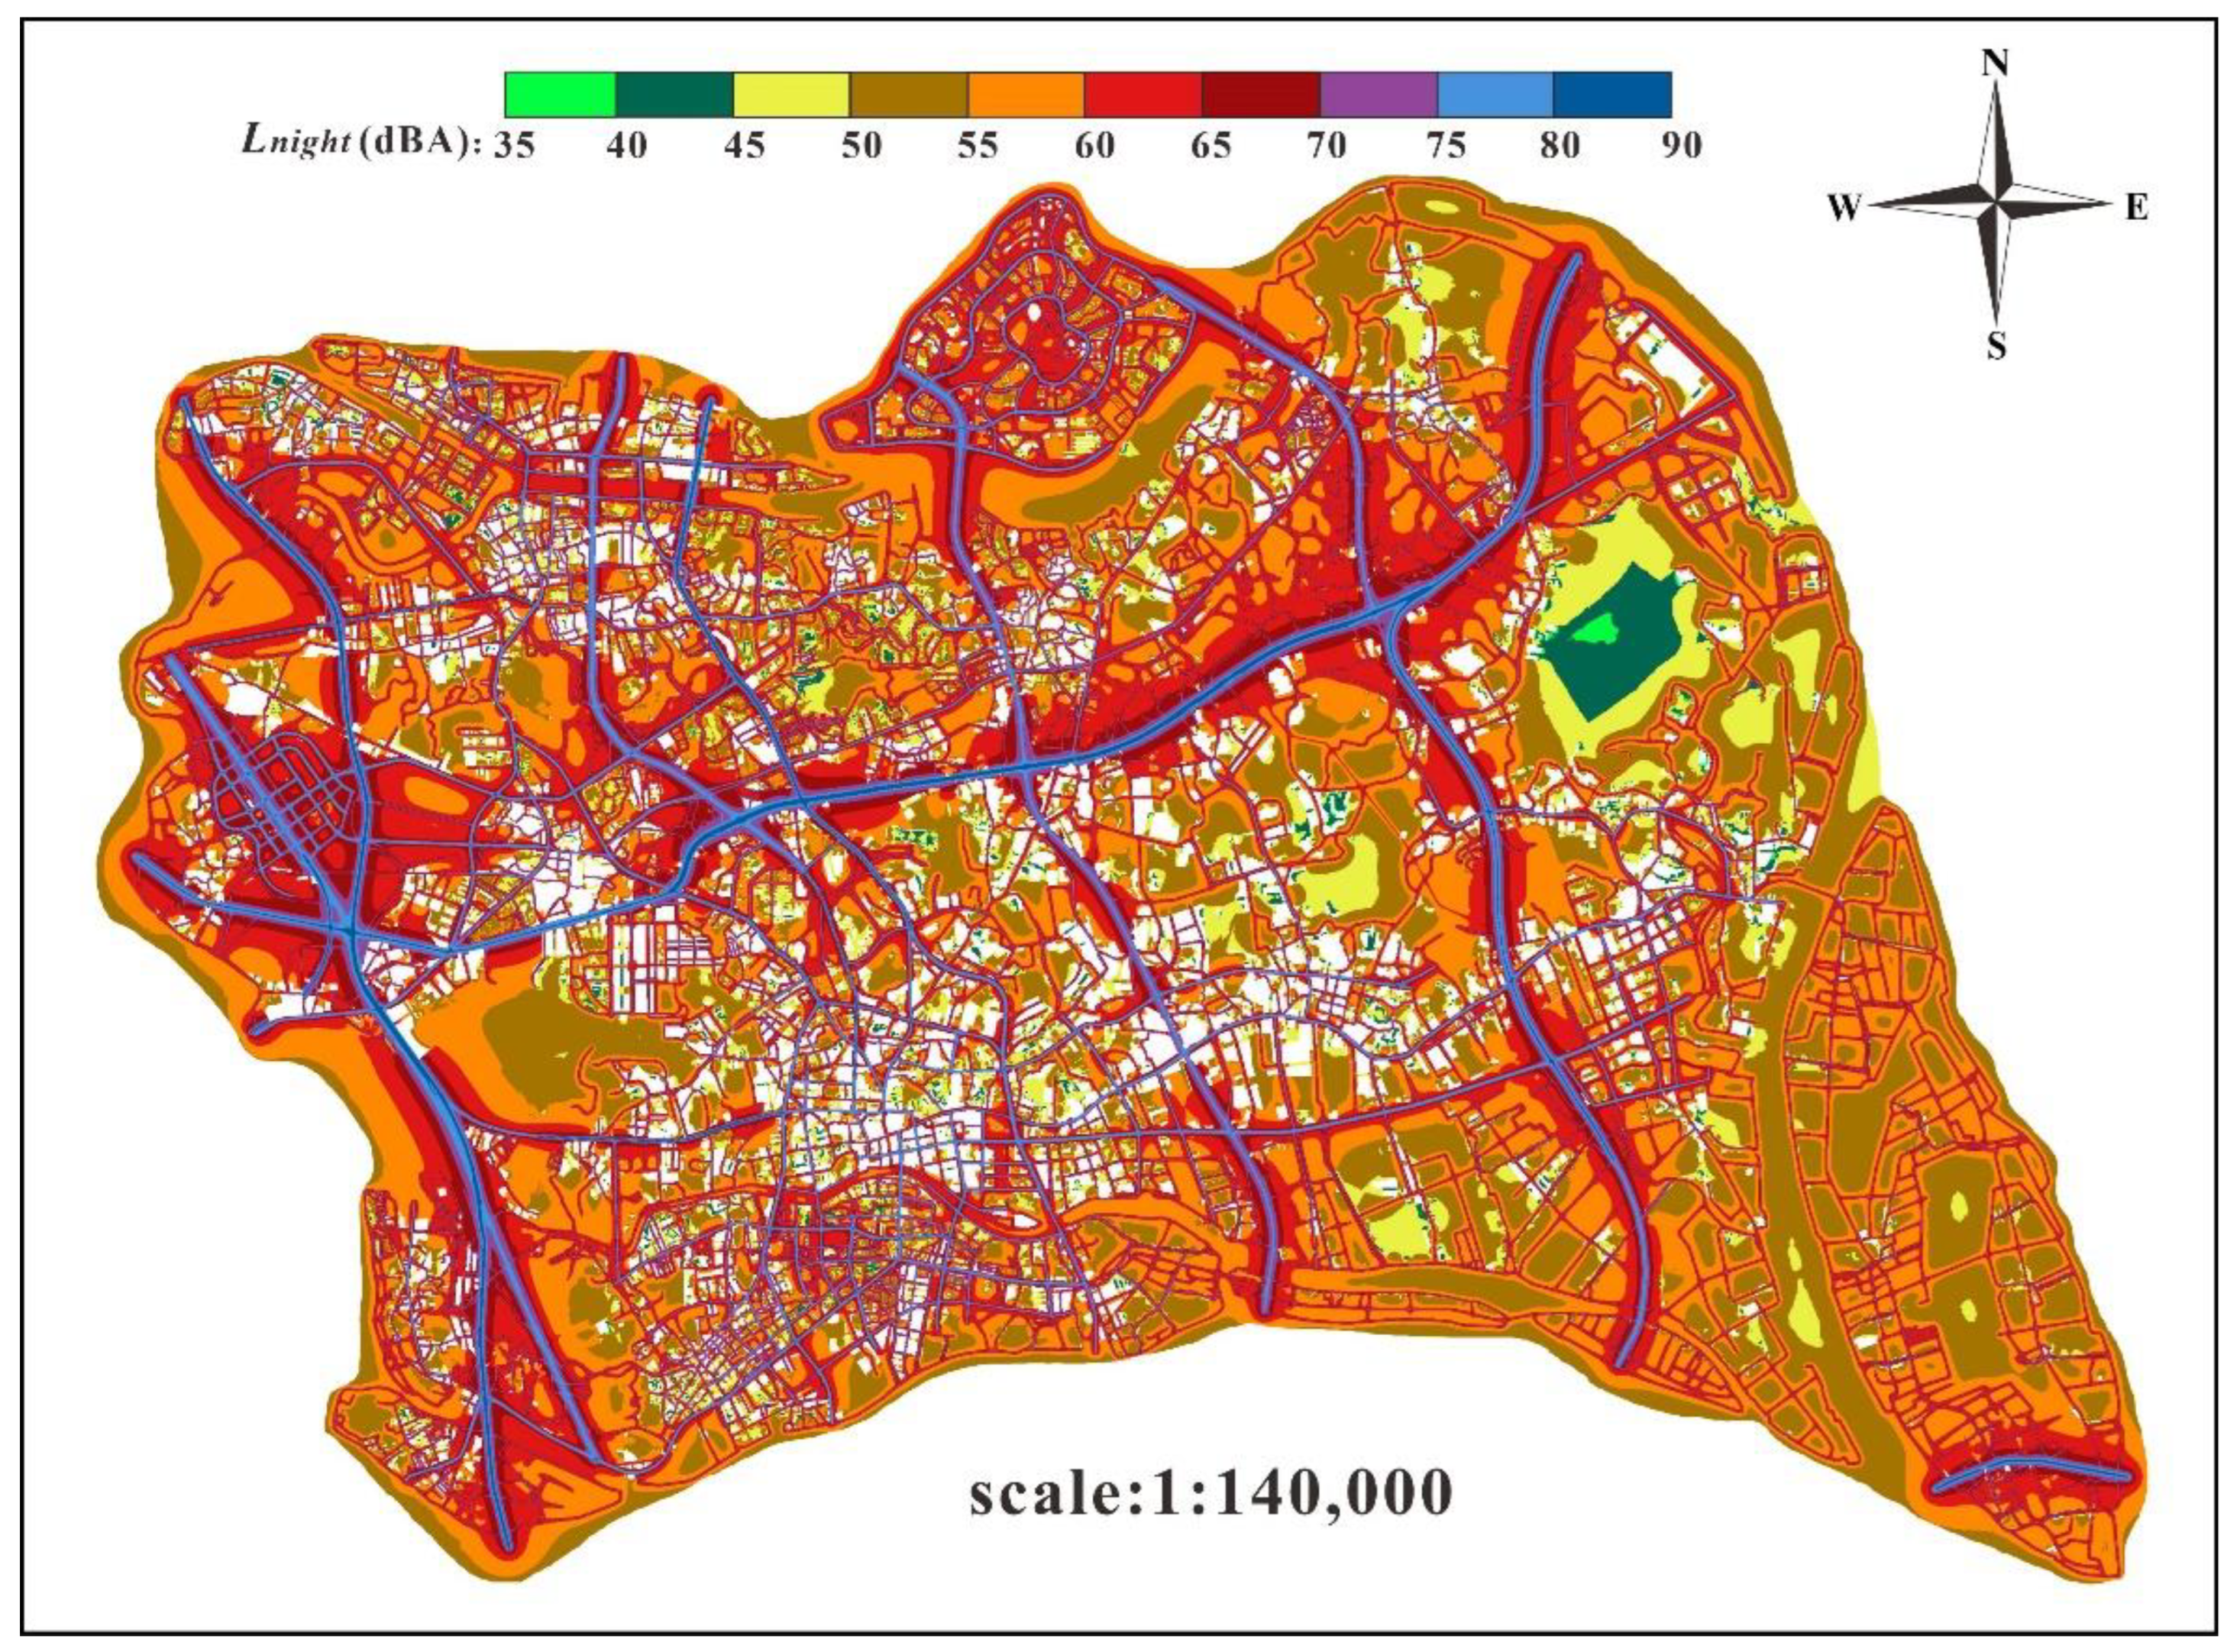
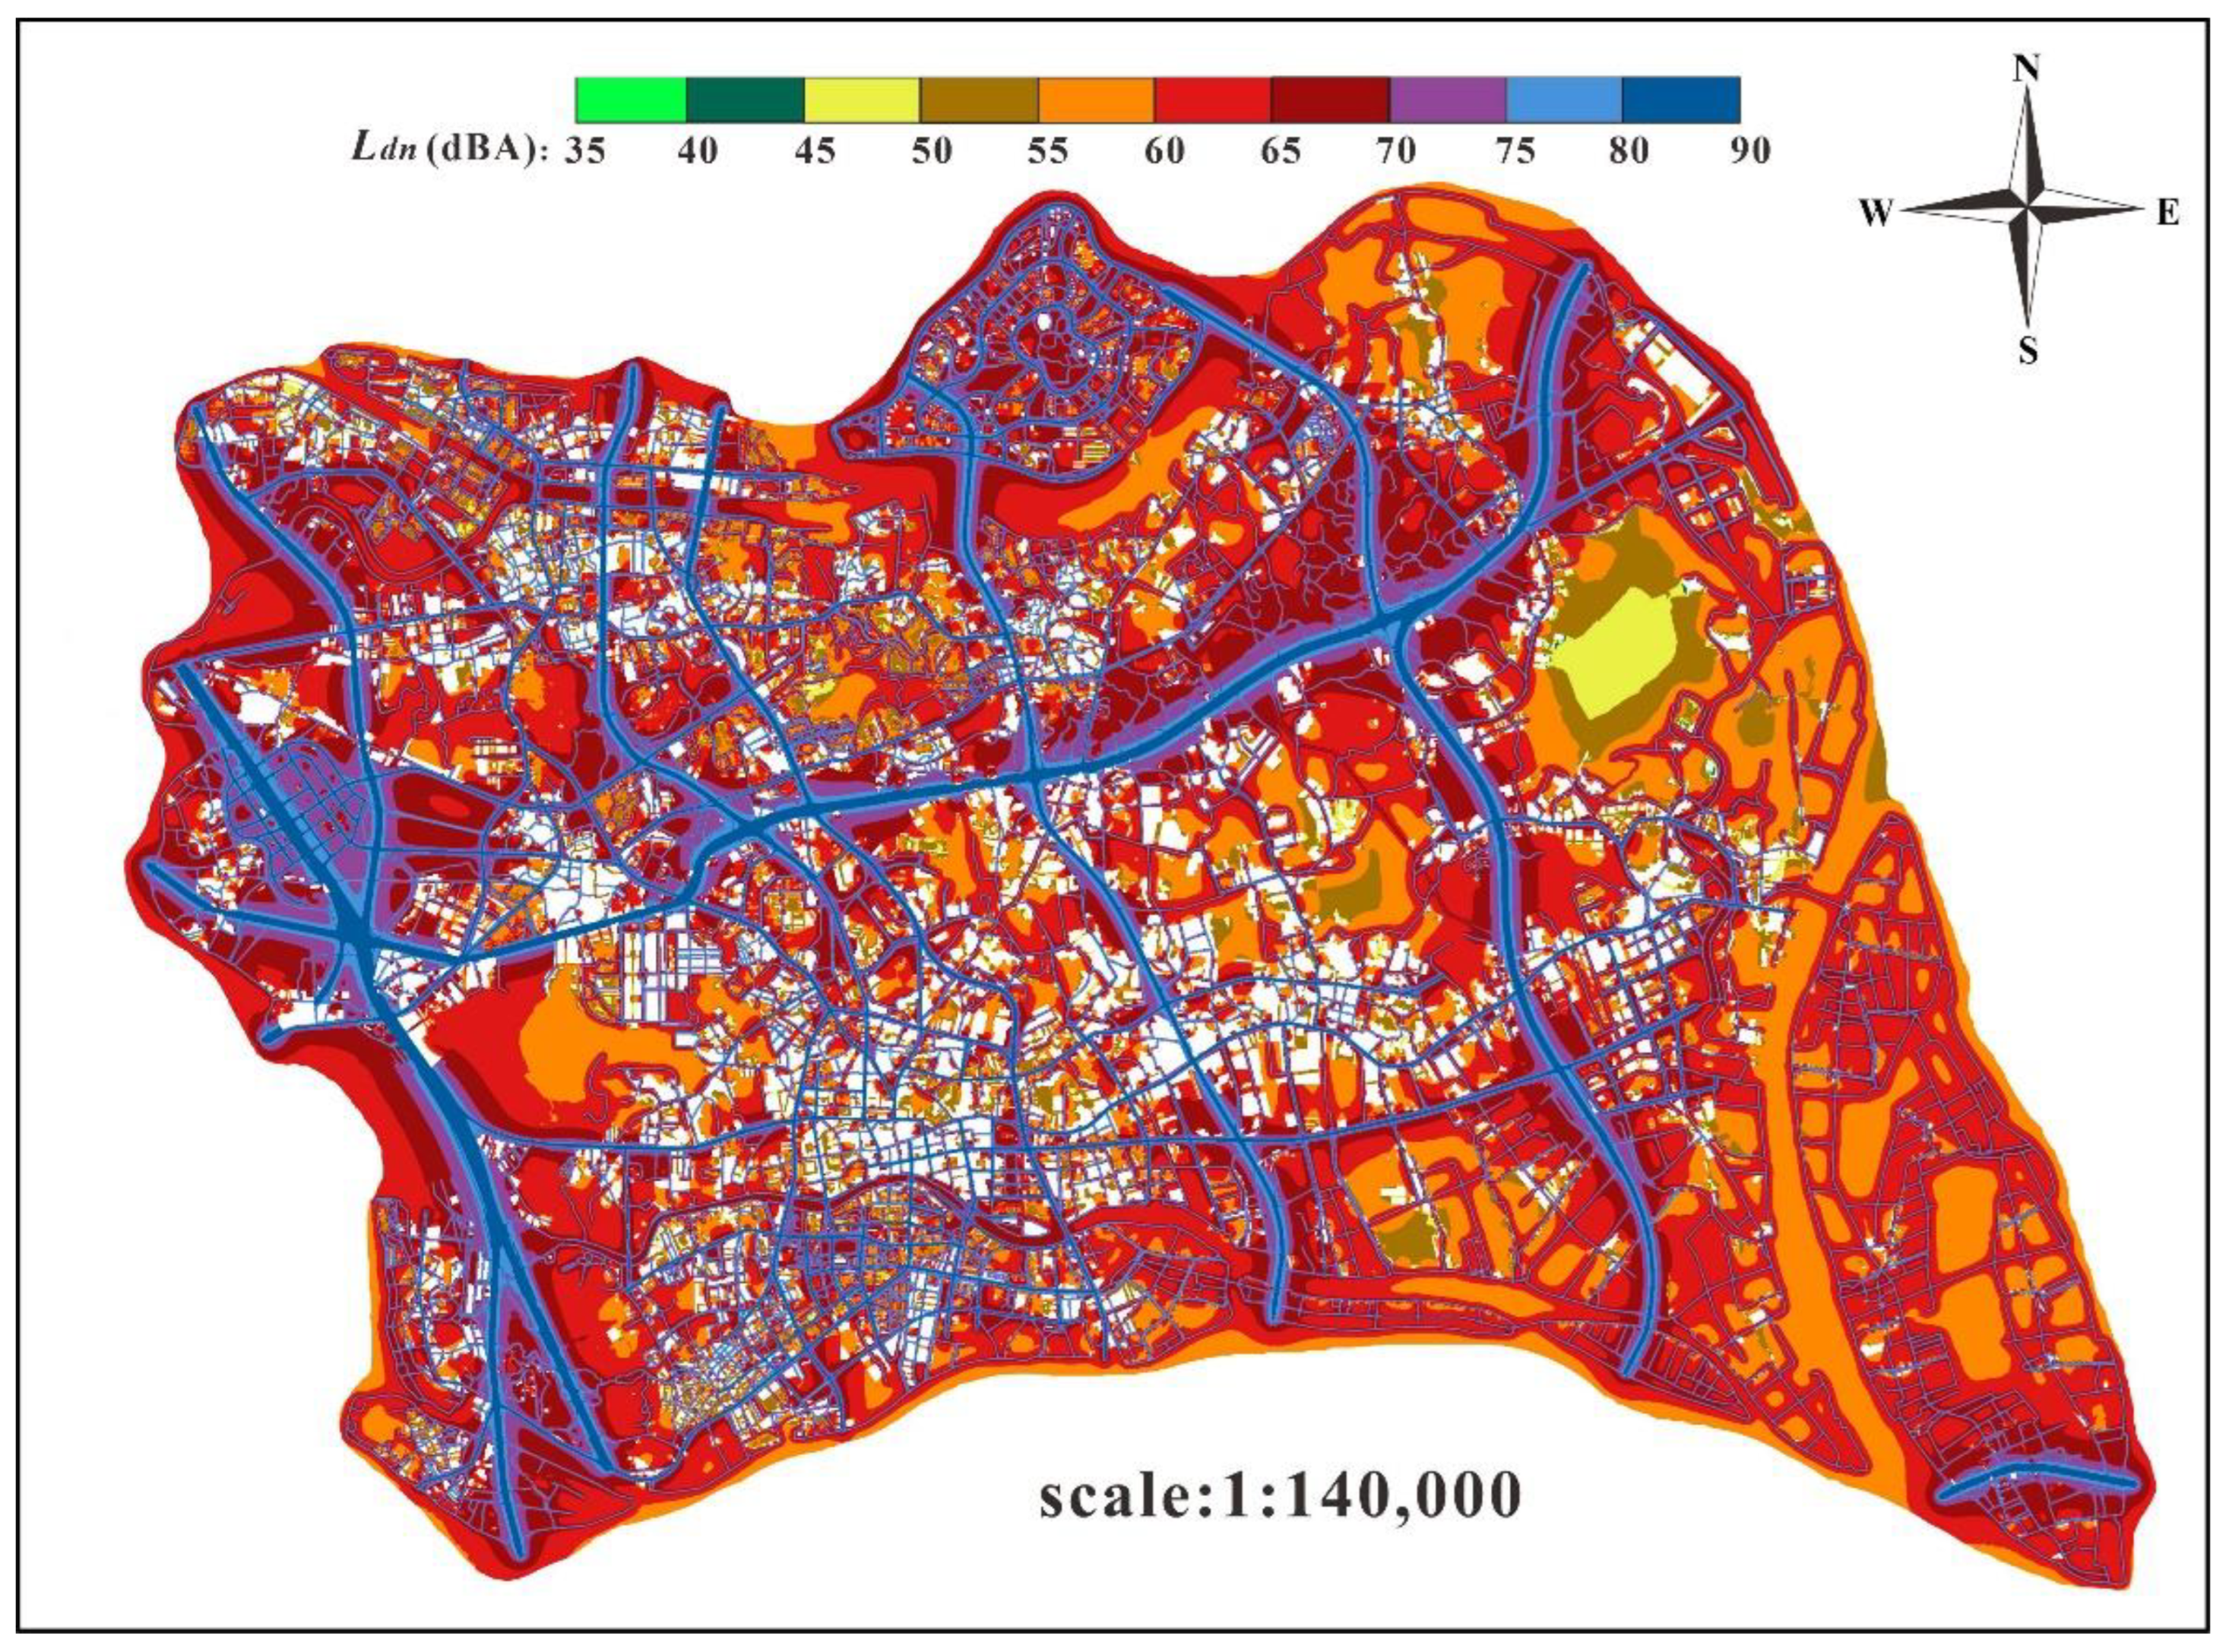
The urban traffic noise maps of Panyu District in daytime, nighttime, and day–night with noise barriers are shown in Figure 6, Figure 7 and Figure 8, respectively. By comparing Figure 6 and Figure A1 (see Appendix A), it is obvious that the area covered by high noise levels in the daytime was significantly reduced after the installation of the noise barriers. In particular, the total area exposed to the high noise levels (>65 dBA) was significantly reduced by 24.5 km2, while the total area that complied with the noise limit was increased by 97.4 km2 in the daytime. Among all of the classes of acoustic functional areas, the installation of noise barriers contributed the most to the class 2 functional area, which had an increment in the total area complying with the noise limit of up to 61.6 km2. By comparing Figure 7 and Figure A2, it can be found that, with the noise barriers implemented, the traffic noise level was obviously reduced in the nighttime as well. Similar findings were also observed in the day–night traffic noise maps, as shown in Figure 8 and Figure A3. By applying the noise barriers, the range of SPLs in most areas decreased from 65–70 to 60–65 dBA, while a few areas decreased from 60–65 to 55–60 dBA. Nonetheless, the range of SPLs in very few areas decreased from 55–60 to 50–55 dBA. This implies that the functions of the noise barriers were more efficient in mitigating the noise in areas with a higher noise level.
As shown in Table 4, the minimum and maximum noise levels in the daytime, nighttime, and day–night in Panyu District with and without noise barriers were summarized. As can be seen, the effect of the noise barriers on the maximum noise levels was more significant in the nighttime, and the maximum reduction of noise (SPL) could reach up to 6.1 dBA. Nevertheless, it is suggested that the noise barrier has little influence on the minimum noise level according to the noise mapping.
As shown in Table 5, the minimum and maximum noise levels of the different functional areas were tabulated. It can be seen that the maximum noise levels in the residential and industrial areas were reduced the most in the nighttime (up to 5.5 dBA). This was due to the fact that higher noise barriers were purposely arranged along the roads near the residential and industrial areas. However, in the forest and warehousing areas, the reduction of noise levels was the smallest, as no noise barriers were installed along the roads near these areas.
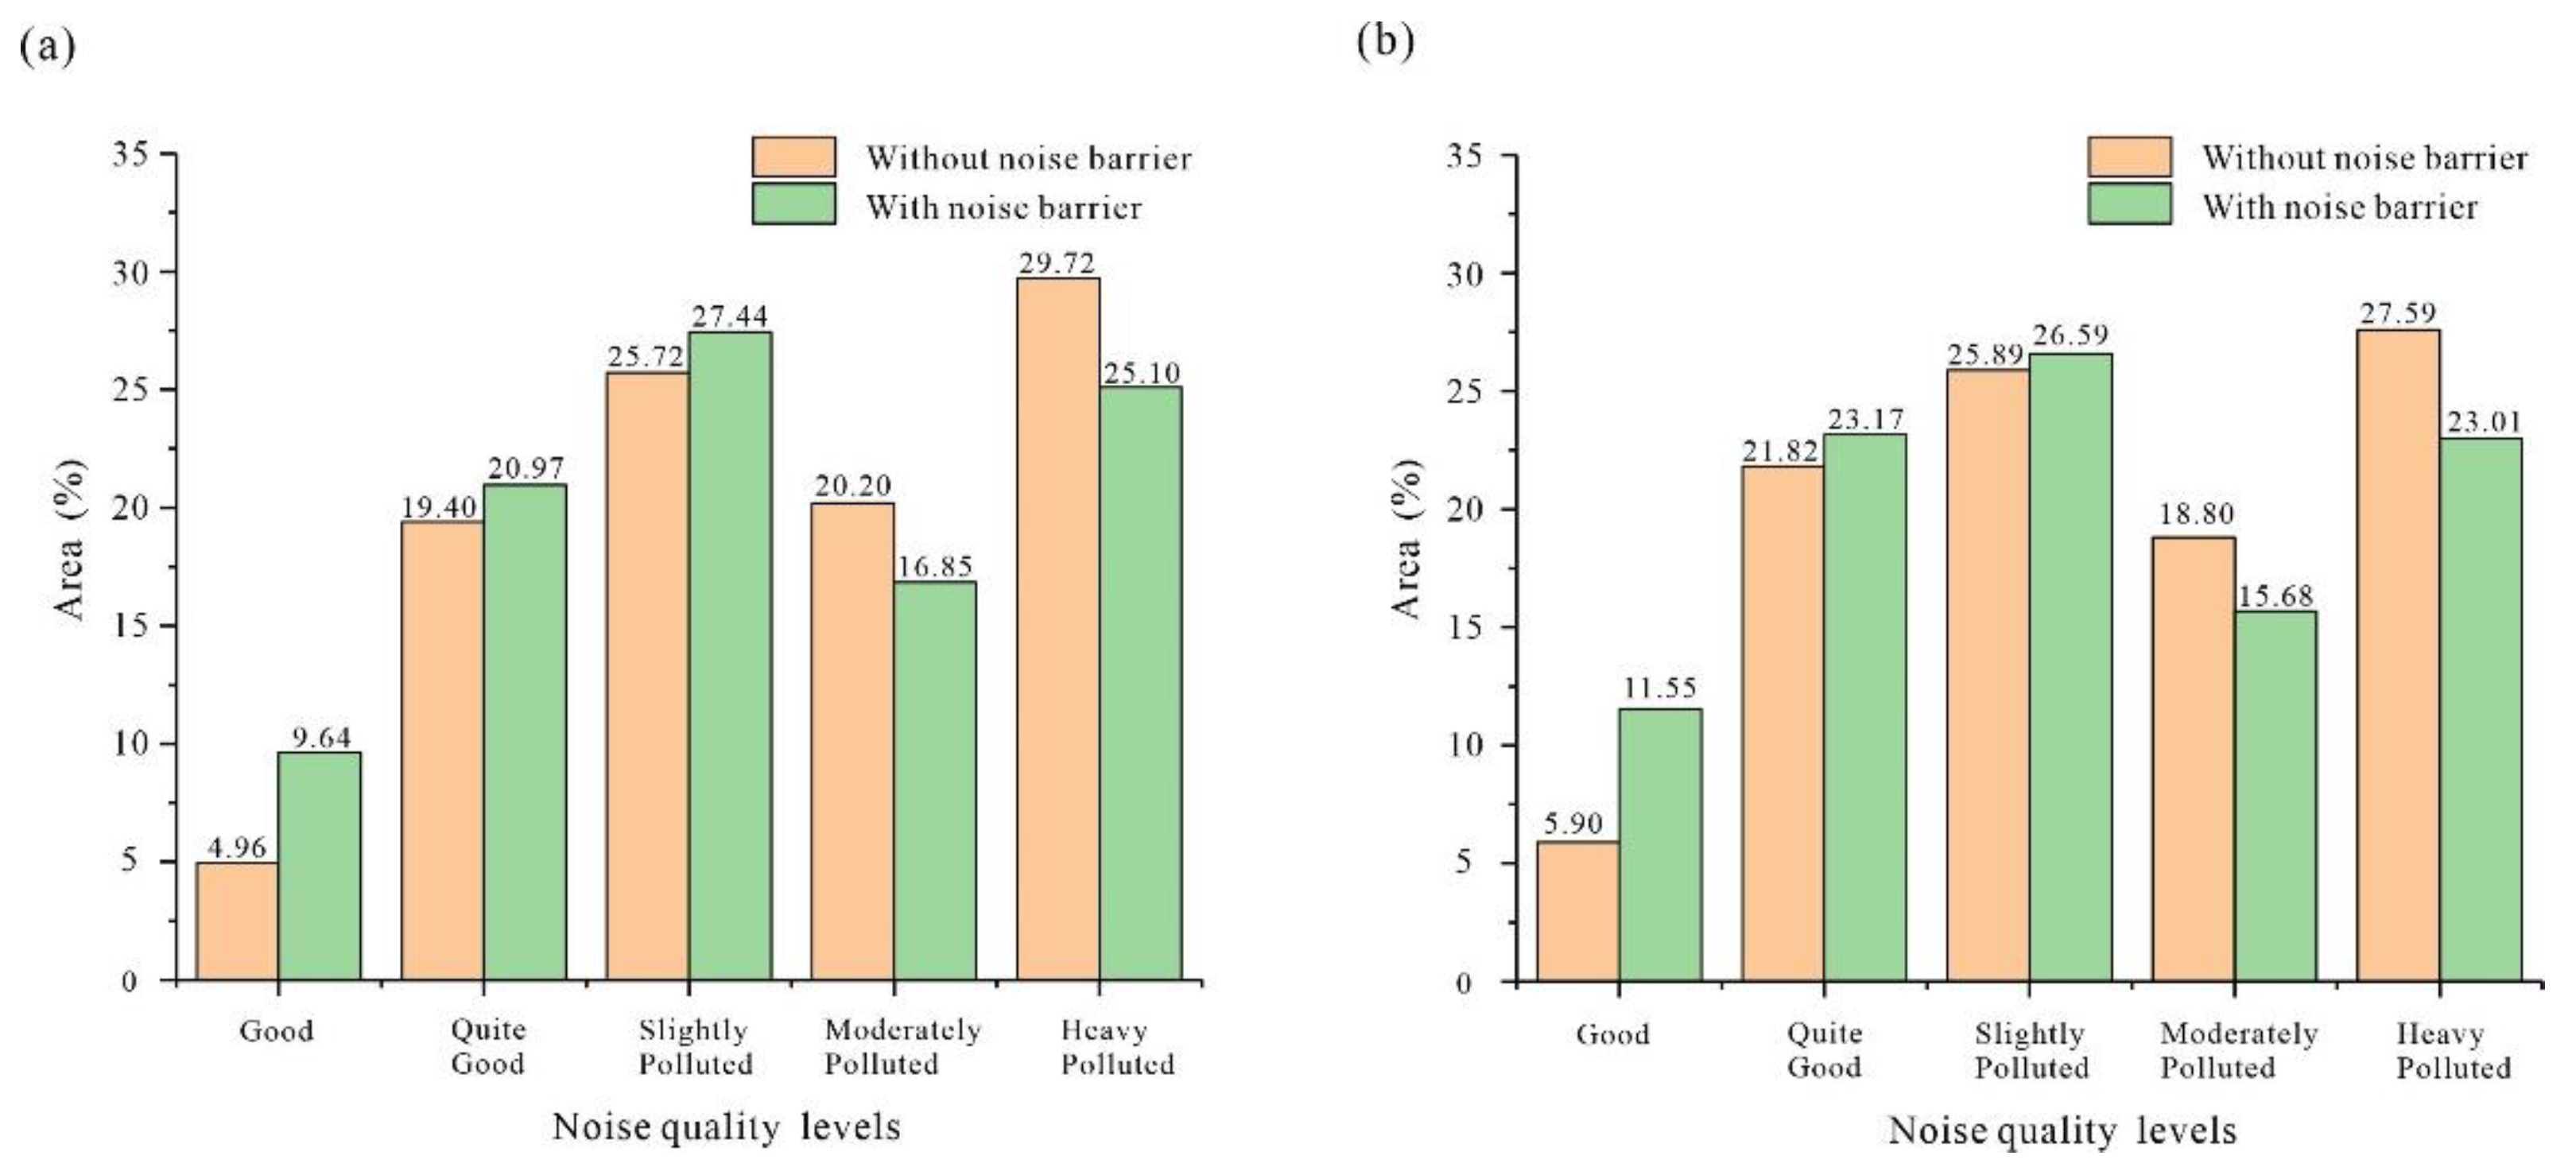
3.2. Noise Quality Levels with Noise Barriers
In order to further analyze the noise reduction effect of the noise barriers, Figure 9 compares the areas covered by traffic noise with different levels of quality between the cases with and without noise barriers. The definitions of the noise quality levels are given in Table A2 in Appendix A. It is noteworthy that, by applying noise barriers, the areas with a good noise quality level during the daytime and nighttime increased by about 4.68% and 5.65%, respectively. The areas with a quite good noise quality level increased by about 1.57% and 1.35%, respectively. The areas with slightly polluted noise quality level increased by about 1.72% and 0.7%, respectively. Correspondingly, the areas with moderate and heavy noise pollution were remarkably reduced by using noise barriers. Hence, it can be concluded that the overall noise quality level of Panyu District could be greatly improved by installing noise barriers along the traffic arteries in critical areas.
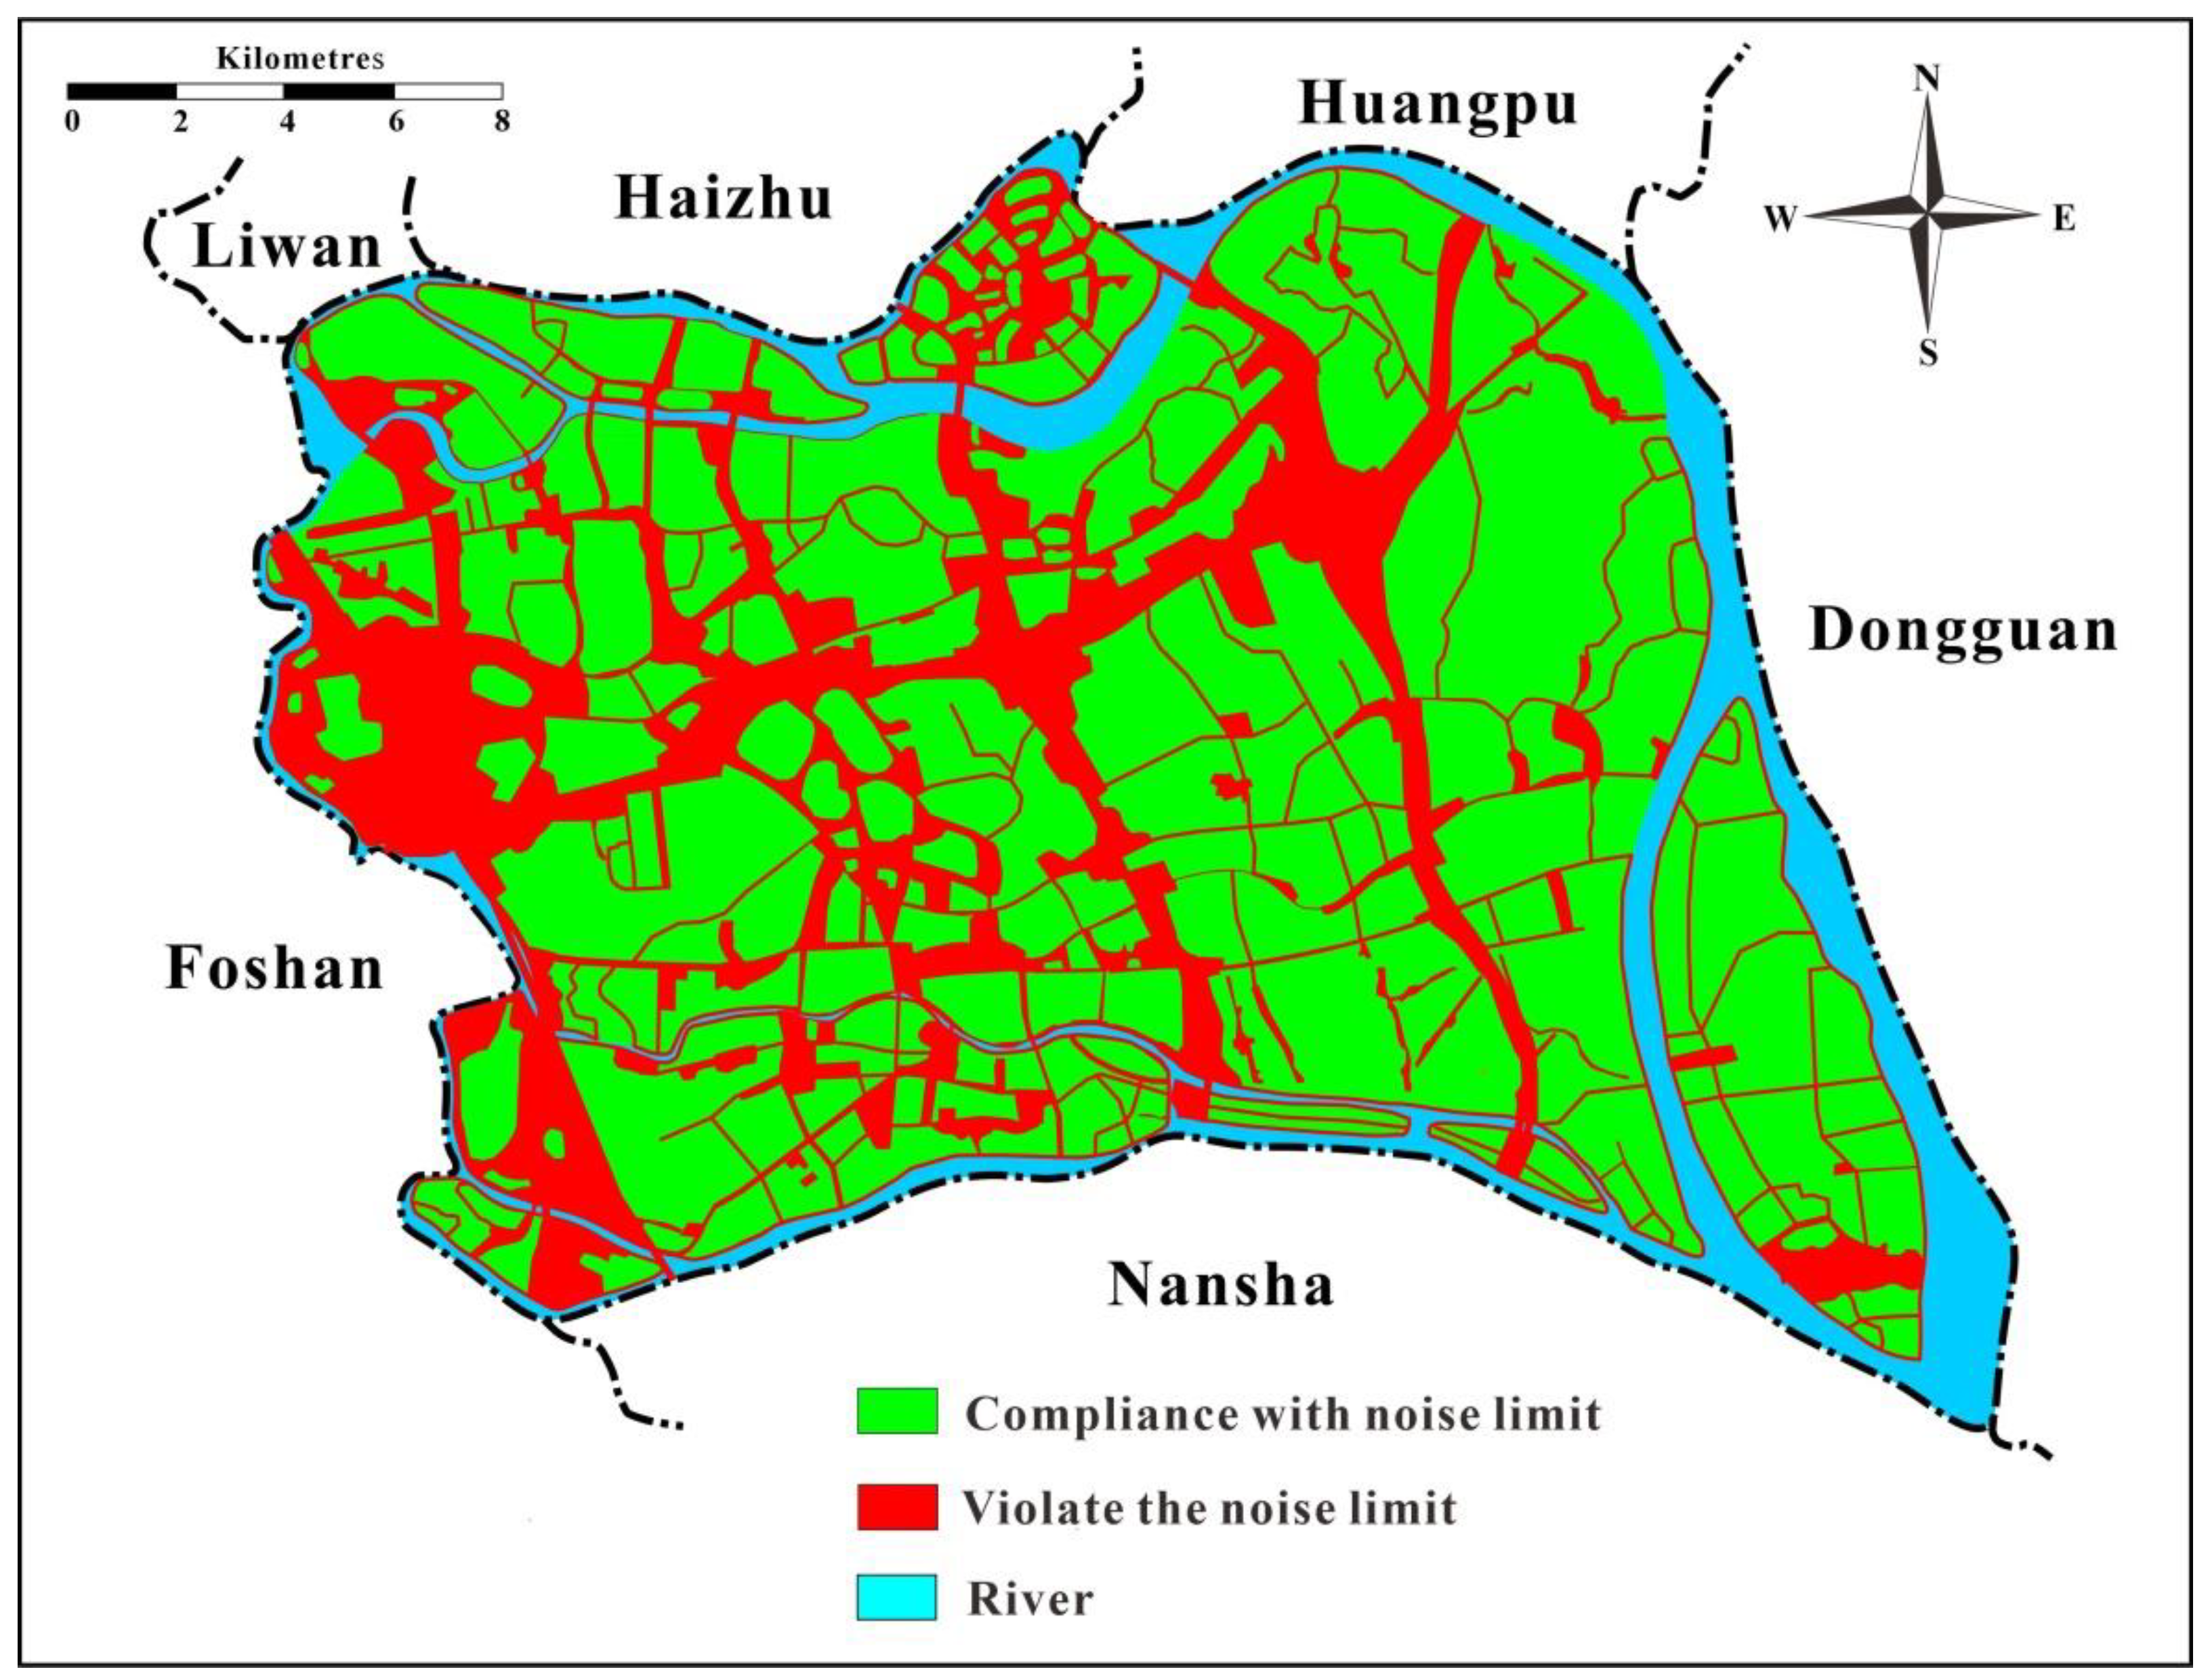
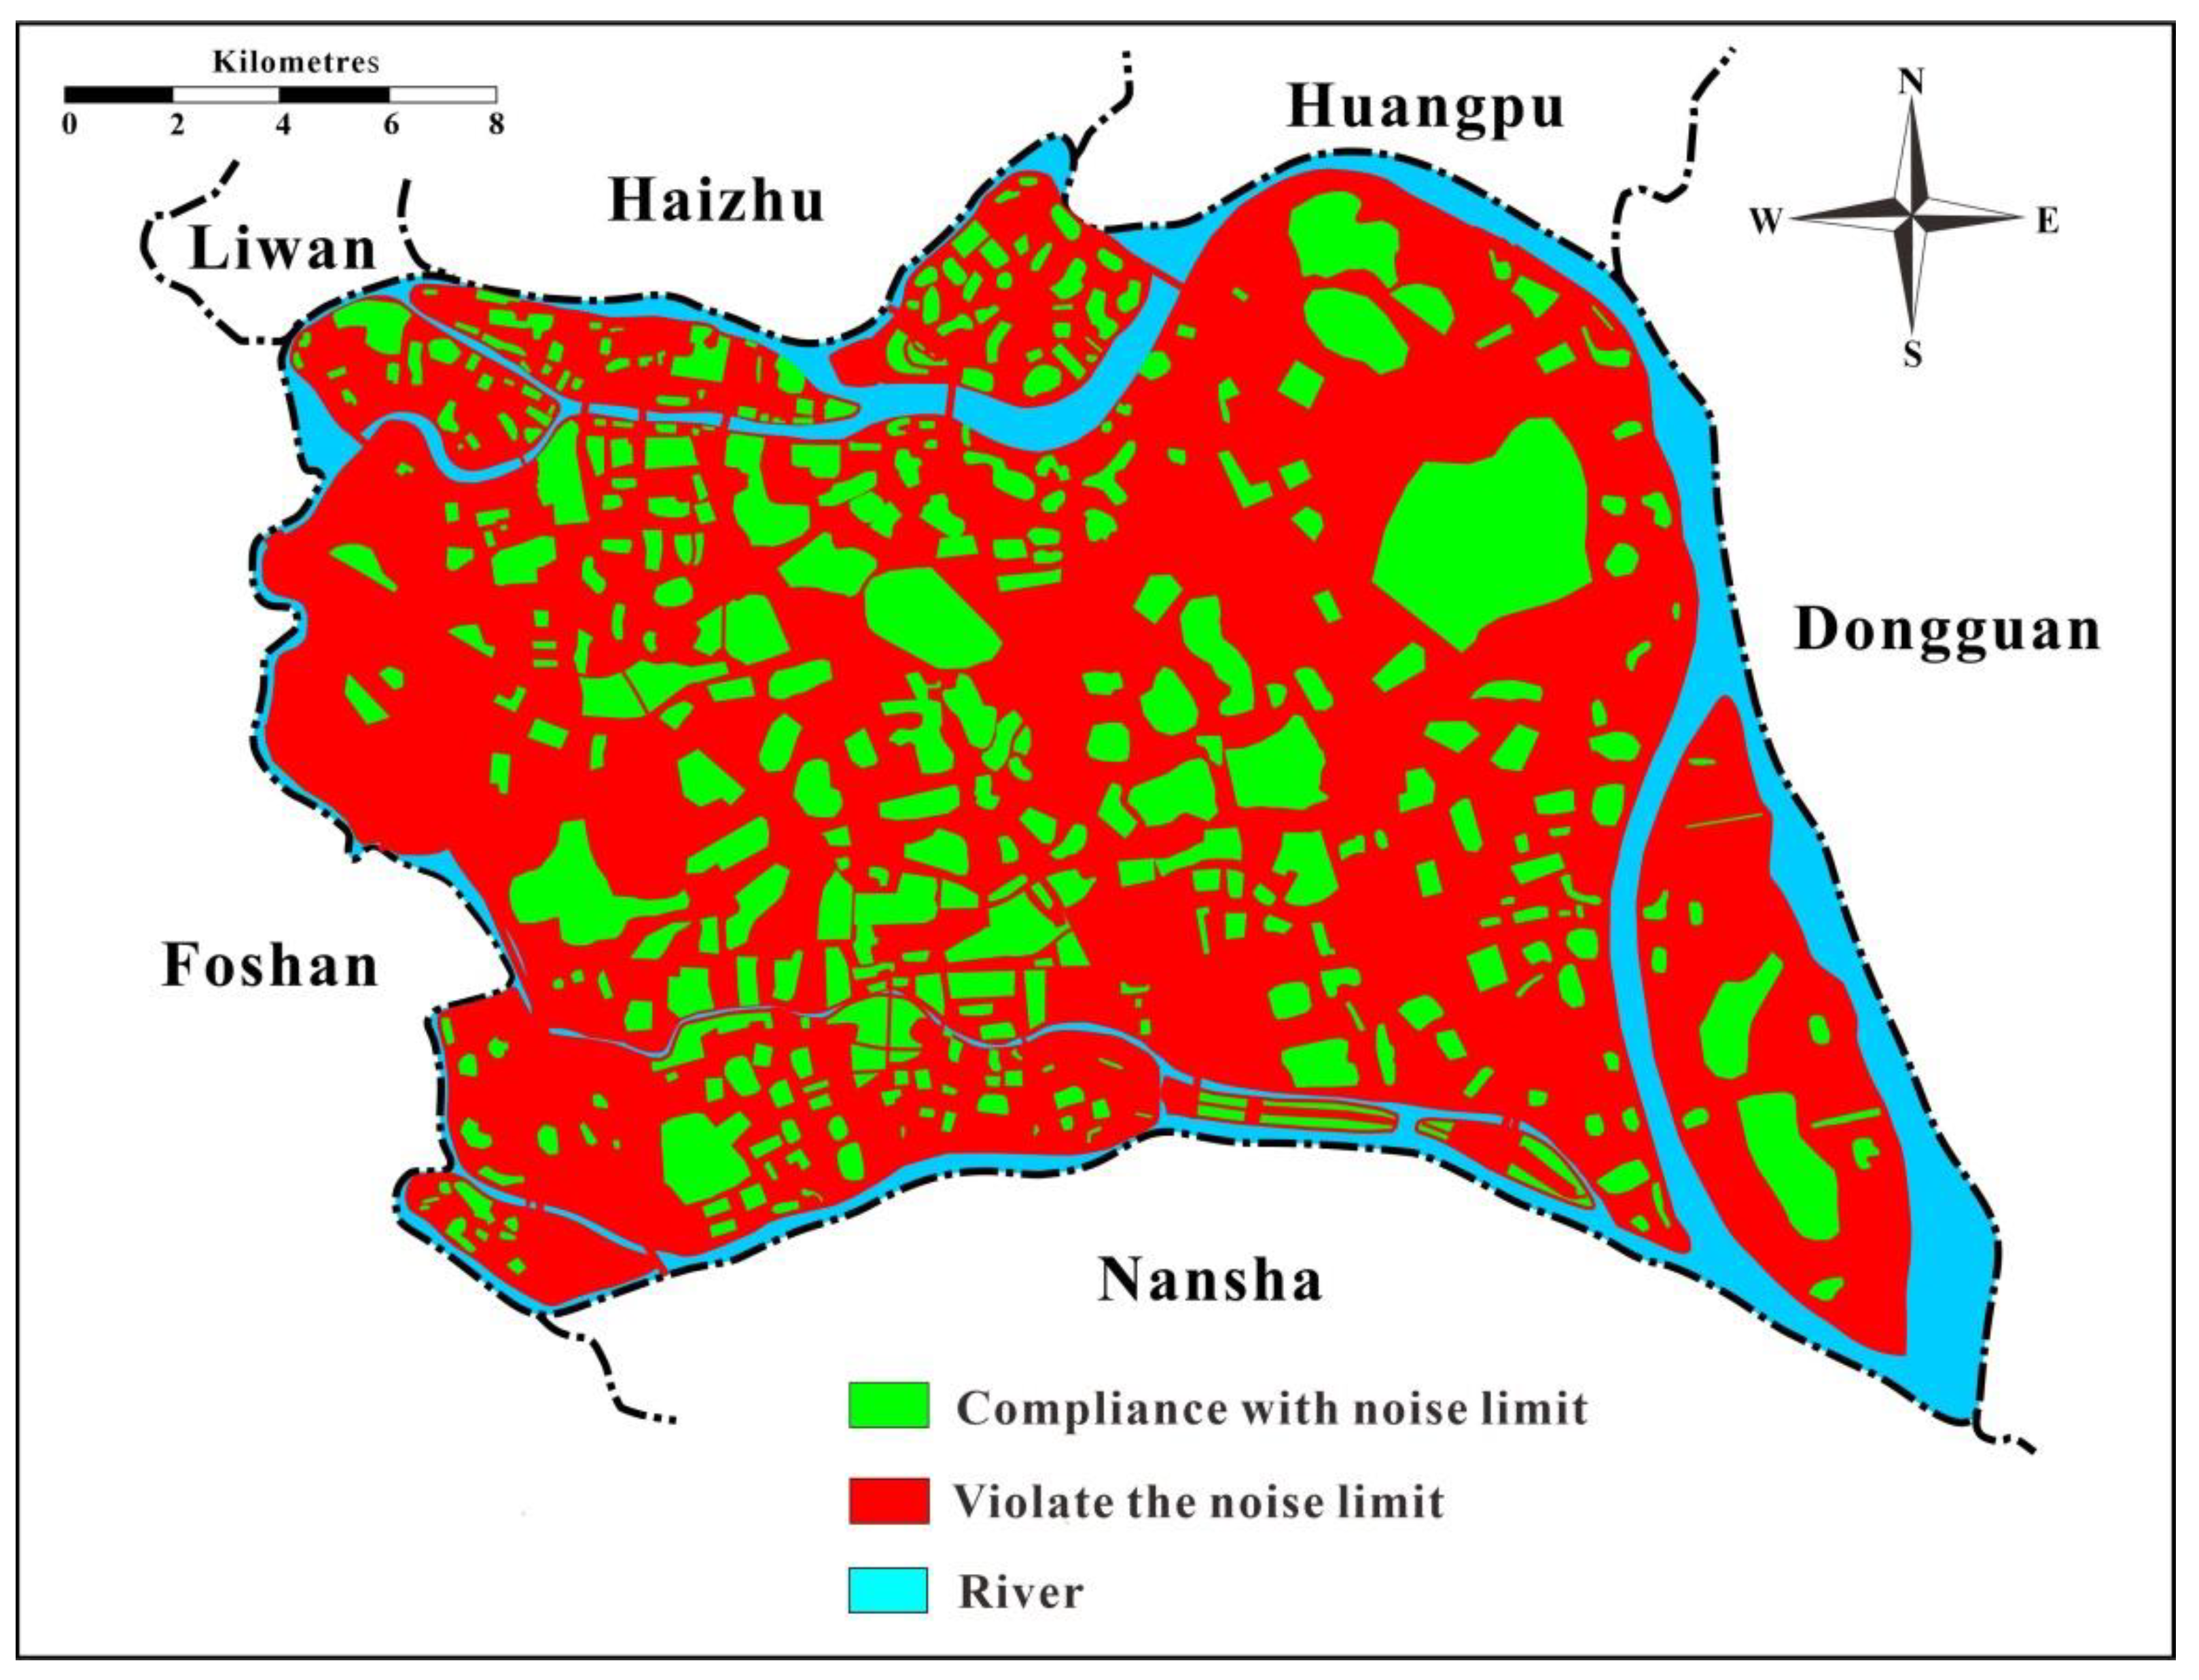
3.3. Noise Compliance Map with Noise Barriers
In addition to the normal traffic noise maps presented in Figure 6, Figure 7 and Figure 8, daytime and nighttime noise compliance maps of Panyu District were also developed, and they are shown in Figure 10 and Figure 11, respectively. By comparing them with the compliance maps without noise barriers from Lee et al. [36], it can be noted that by building noise barriers, the number of qualified areas in both the daytime and nighttime along the traffic arteries increases. Among them, the residential areas along the traffic arteries increase the most. Thus, it can be concluded that the implementation of noise barriers is an efficient approach to the reduction of the impact of traffic noise on the residents living along the traffic arteries. From Figure 10 and Figure 11, it can be calculated that, with noise barriers, the total compliance rates of Panyu District in daytime and nighttime are 80.00% and 29.08%, respectively.
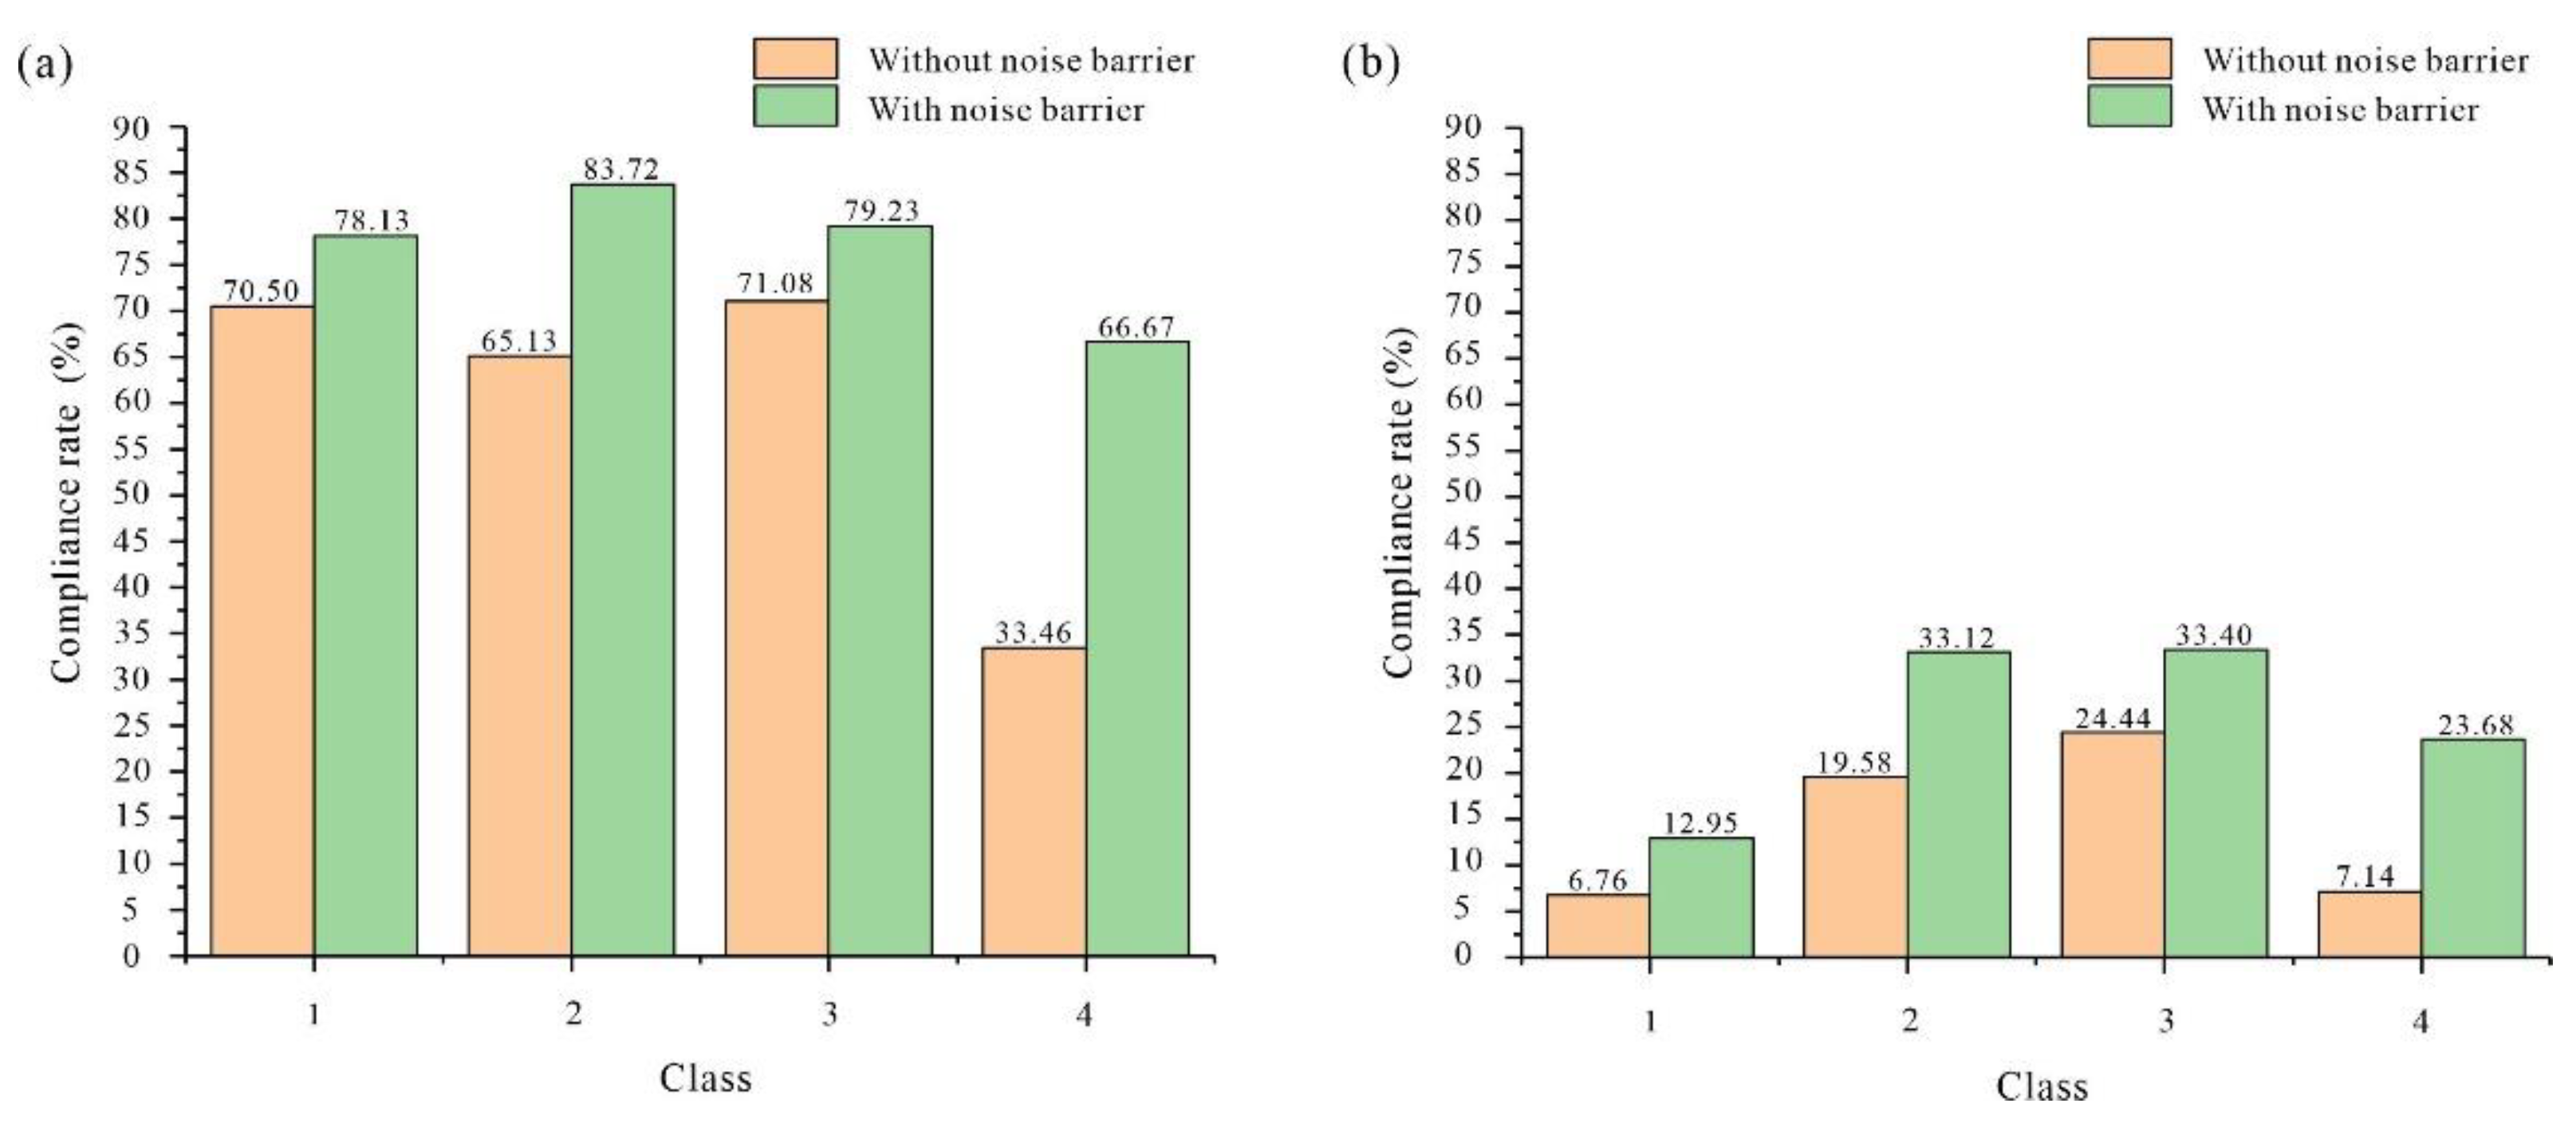
Figure 12 shows the comparison of the compliance rates of various acoustic environment functional areas between the cases with and without noise barriers. It could be found that, with noise barriers, the compliance rates of all acoustic environmental functional areas obviously increased in both daytime and nighttime. The compliance rates of class 4 acoustic environment functional areas were increased most significantly by 33.21% and 16.54%, respectively, in daytime and nighttime. However, the compliance rates of class 1 acoustic environment functional areas increased the least, with 7.63% and 6.19% in daytime and nighttime, respectively. Overall, it can be calculated that, with the application of noise barriers, the total compliance rates of Panyu District in daytime and nighttime could be increased by 18.38% and 12.62%, respectively.
3.4. Effects of Noise Barriers on the Populations Exposed to Traffic Noise
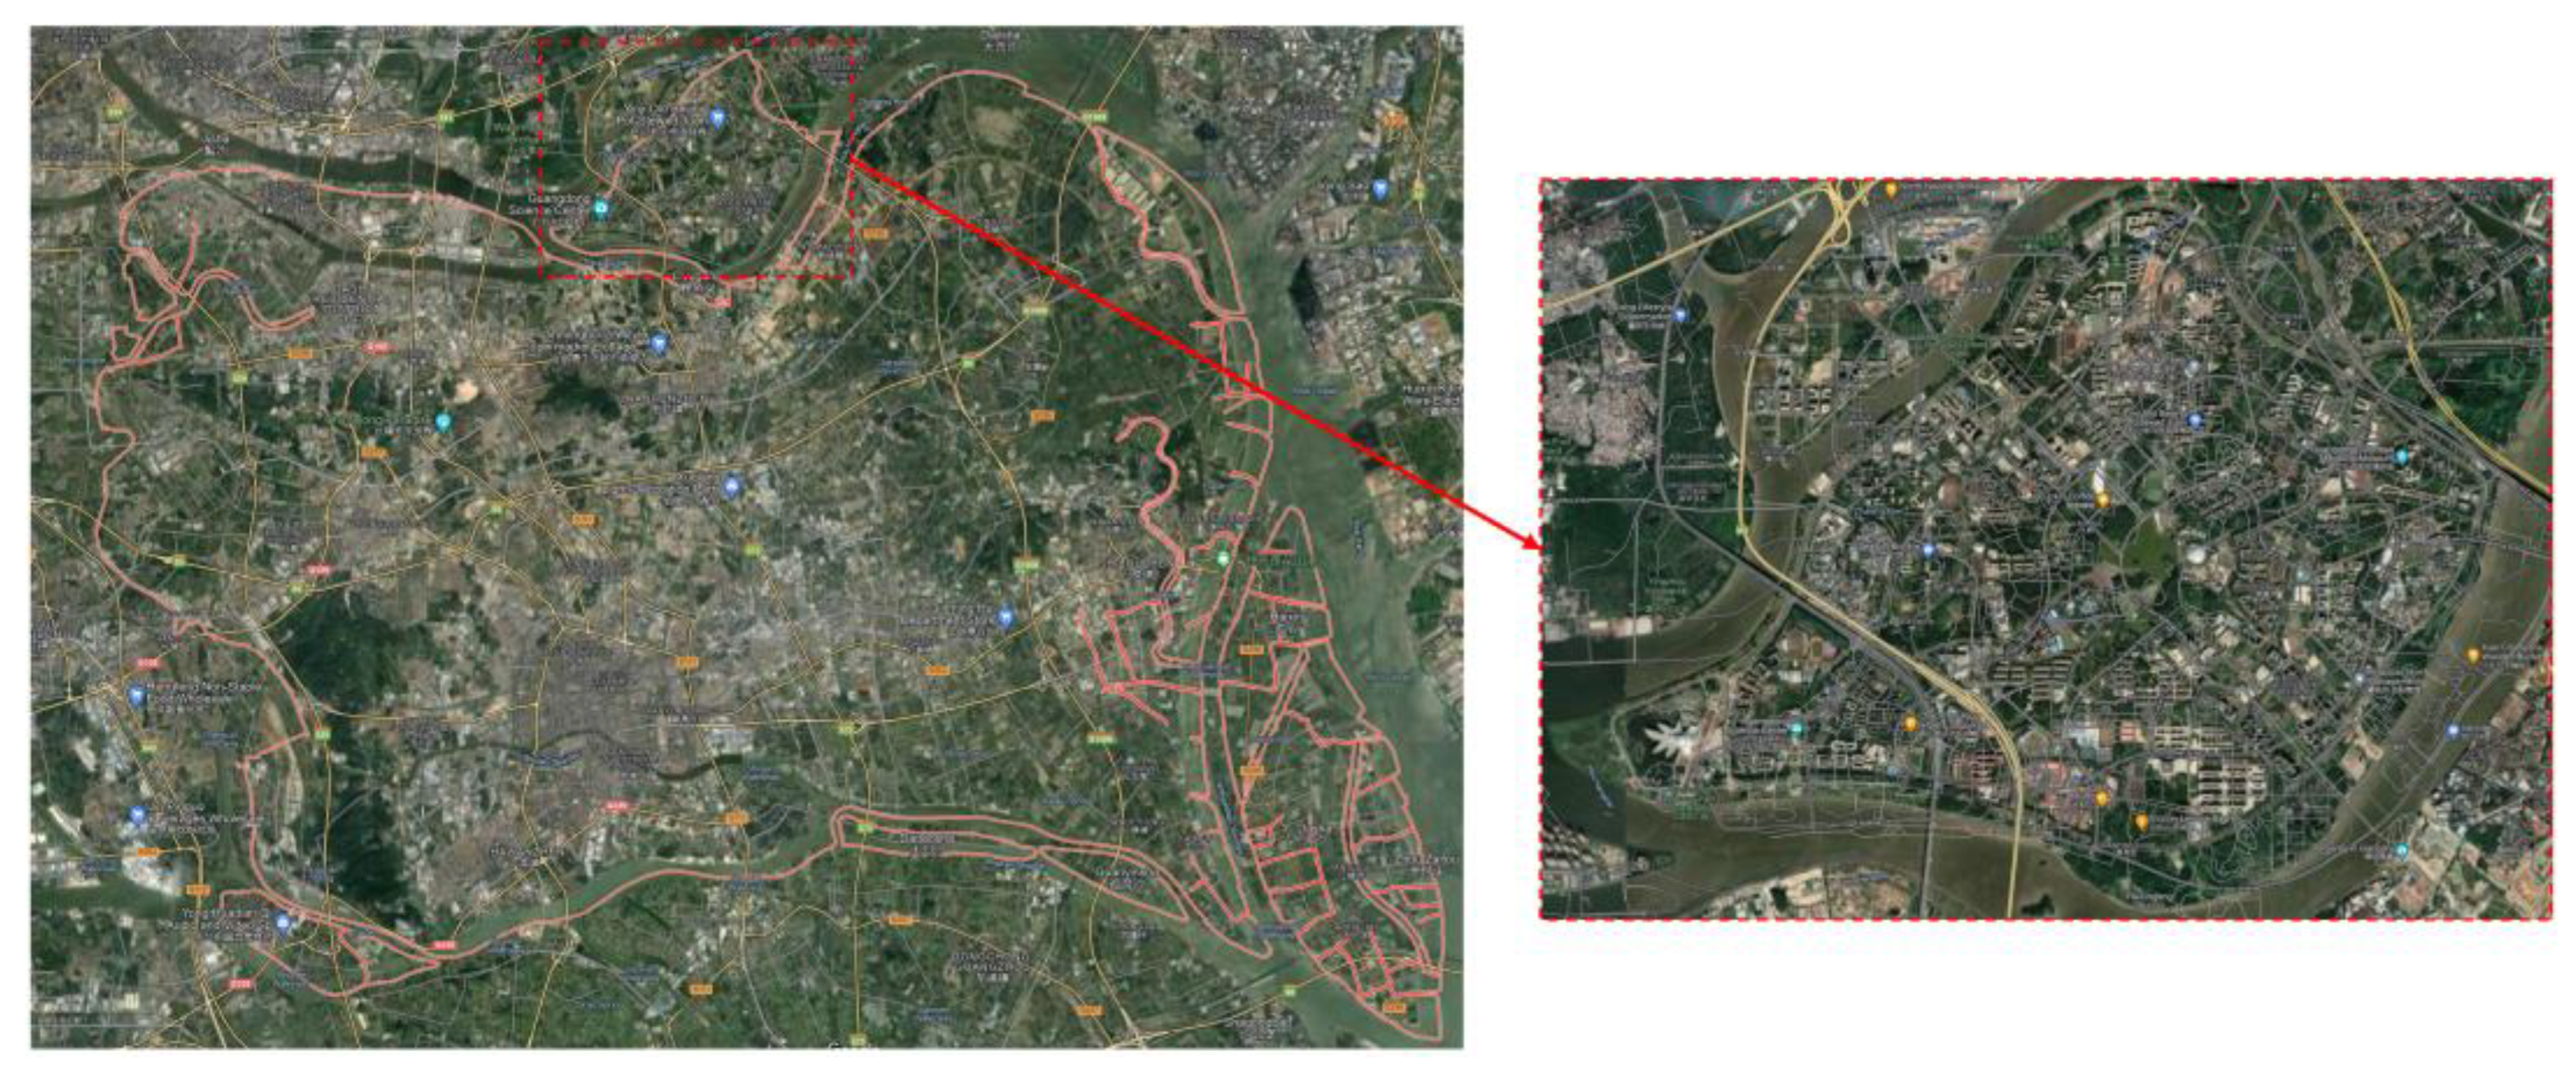
As discussed above, it is obvious that the application of noise barriers has significant impacts on the quality of the sound environment. To be more precise, it will be of interest to evaluate the effects of noise barriers on the populations exposed to traffic noise. As the area of Panyu District (about 530 km2) is too large, the computational cost of accounting for the exposed populations in Panyu District is tremendous. Therefore, as an alternative, the University Town, which is an isolated island in the north of Panyu District, was taken as the studied area to investigate the influence of noise barriers on the exposed population. As shown in Figure 13, the location and geographic information of the University Town in Panyu district are illustrated. According to data from the seventh census of Panyu District [45], the permanent population of the University Town was 142,550 by 2021. To realize the population distribution in the numerical model, the total population was assigned to each residential building in the University Town following the guidelines of [46], and then the populations exposed to different noise quality levels were calculated according to the developed noise map, as shown in Table 6. The final results of the populations exposed to different noise quality levels are summarized in Table 7. Therein, the classifications of noise quality levels follow the national standard [47], as shown in Table A2 in Appendix A. It could be found that the existence of noise barriers could significantly reduce the populations living in “light pollution”, “moderate pollution”, and “heavy pollution” areas during the daytime by 14.40%, 25.76%, and 26.42%, respectively. As a result, the populations living in areas that were under the noise quality rating of “good” were increased by 59.59%. Furthermore, the number of people living in the areas that were “heavily polluted” in the nighttime could be significantly decreased by up to 22.32% by applying noise barriers, while the number of people living in the “quite good” areas could be increased by as much as 85.07%. Hence, it is suggested that the installation of noise barriers is quite effective in improving the sound environment quality of residential areas, and thus, the detrimental impact of traffic noise on the health of residents can be alleviated.
3.5. Effects of Noise Barriers on the Populations of Highly Annoyed and Sleep-Disturbed Citizens
According to the practice of Licitra et al. [48] and Fredianelli et al. [49], the present study calculated two group noise indicators, “Gdn” and “Gnight” (dBA), for the exposed population in the University Town. These two group population noise indices, respectively, represent the nominal noise energy exposed to the population during day–night and nighttime. By combining the noise index in the present study, the group noise indices can, therefore, be calculated as follows:
where is the total population, is the population exposed to the i-th noise exposure level, is the representative value of the i-th noise exposure level in day–night, and is the representative value of the i-th noise exposure level in nighttime. Referring to [48], the representative values corresponding to different noise exposure levels are presented in Table 8.
Additionally, in order to assess the highly annoyed () and highly sleep-disturbed () populations under the conditions with and without noise barriers, the methodologies proposed in [49,50,51] were applied. The calculation of is in reference to [50], and the formula is shown below.
where is the total number of highly troubled people, and is the population exposed to the i-th noise exposure level. The calculation of is in reference to [49,51], and the formula can be written as
where is the population whose sleep is severely disturbed by traffic noises.
The results of the highly annoyed and sleep-disturbed populations are summarized in Table 9. With the application of noise barriers, Gdn and Gnight were reduced by 2.5 and 1.2 dBA, respectively. The smaller reduction of Gnight could be due to the fact that the traffic flow in nighttime was relatively lighter and, hence, the effects of the noise barriers were not as significant as those in the daytime in reducing the noise energy to which the population was exposed. Table 9 also shows that the highly annoyed population was reduced from 26,605 to 20,709, corresponded to a significant reduction of 22.16%. However, for the highly sleep-disturbed population, which was assessed only in the nighttime, the reduction is relatively smaller. The same reason as that explained above can be applied to this phenomenon as well.
4. Conclusions
Based on a traffic noise map of Panyu District (including road and railway traffic noise), noise barriers were proposed for implementation in areas that suffer from high traffic noise levels. The effects of noise barriers on the spatial noise distributions, noise quality levels, populations exposed to traffic noise, and populations of highly annoyed and sleep-disturbed people were analyzed. Noise compliance maps with and without noise barriers were compared. The results showed that, with the application of noise barriers, the coverage of areas with better traffic noise quality levels (good, quite good, and slight pollution) increased, while the coverage of areas with worse traffic noise quality levels (moderate and heavy pollution) decreased. Furthermore, the total noise level compliance rates during the daytime and nighttime were increased by about 18.38% and 12.62%, respectively. It was found that noise barriers were quite effective in improving the quality of the sound environment of residential areas, and thus, the populations exposed to detrimental traffic noise were significantly reduced. The group noise indicators Gdn and Gnight showed that the application of noise barriers could reduce the average noise energy to which the population was exposed, and thus, the population of highly annoyed people was significantly reduced. However, Gnight, which represented the population of sleep-disturbed people, indicated that the effect of noise barriers on the population of sleep-disturbed people was not as significant as that of the population under high annoyance. Nonetheless, noise barriers can still be considered as an effective noise reduction measure that can be applied in critical urban areas under high traffic noise exposure.
In the present study, the noise barriers studied were traditional ones that were built in commercial software for noise mapping. In fact, these types of noise barriers cannot reflect the performance of the latest concepts of noise barriers in real applications. In the future, with the collection of the design and performance parameters of newly optimized noise barriers, such as sonic crystal noise barriers [52], sonic crystal barriers with resonator holes [53], and metamaterial noise barriers [54,55], the methodologies proposed in this study can be applied to evaluate the effects of new types of noise barriers on the qualities of the sound environments of large cities with dense populations.
Author Contributions
Conceptualization, H.M.L.; methodology, H.M.L.; software, W.L. and H.P.L.; validation, W.L.; formal analysis, W.L.; investigation, W.L.; resources, H.M.L. and J.X.; data curation, W.L.; writing—original draft preparation, H.M.L.; writing—review and editing, H.M.L.; visualization, H.P.L.; supervision, H.M.L. and J.X.; project administration, H.M.L.; funding acquisition, H.M.L. and J.X. All authors have read and agreed to the published version of the manuscript.
Funding
This research was funded by the National Natural Science Foundation of China [51908142], Natural Science Foundation of Guangdong Province [2019A1515012223, 2021A1515012269], and Guangzhou Basic Research Program—City School (College) Joint Funding Project [202102010384, 202102010410].
Institutional Review Board Statement
Not applicable.
Informed Consent Statement
Not applicable.
Data Availability Statement
Data are available from the corresponding author on request.
Conflicts of Interest
The authors declare no conflict of interest.
Appendix A
Figure A1.
Daytime urban traffic noise map of Panyu District, Guangzhou City [36].
Figure A1.
Daytime urban traffic noise map of Panyu District, Guangzhou City [36].

Figure A2.
Nighttime urban traffic noise map of Panyu District, Guangzhou City [36].
Figure A2.
Nighttime urban traffic noise map of Panyu District, Guangzhou City [36].

Figure A3.
Day–night urban traffic noise map of Panyu District, Guangzhou City [36].
Figure A3.
Day–night urban traffic noise map of Panyu District, Guangzhou City [36].


Table A1.
Area, coverage, and noise limits of acoustic environment functional areas in Panyu District of Guangzhou City [50].
Table A1.
Area, coverage, and noise limits of acoustic environment functional areas in Panyu District of Guangzhou City [50].
| Class | Coverage | |||
|---|---|---|---|---|
| 1 | Nature conservation area, cultural education area, administrative area, and medical service area | 69.5 | 55 | 45 |
| 2 | Residential area and trade area | 331.5 | 60 | 50 |
| 3 | Warehouse and logistics area and industrial area | 49.1 | 65 | 55 |
| 4a, 4b | Areas on both sides of a traffic artery | 79.8 | 70 | 55, 60 |
Figure A4.
Acoustic environment functional areas in Panyu District of Guangzhou City [56].
Figure A4.
Acoustic environment functional areas in Panyu District of Guangzhou City [56].

Table A2.
Classification of environmental noise quality levels in urban areas [47].
Table A2.
Classification of environmental noise quality levels in urban areas [47].
| Quality Level | ||
|---|---|---|
| Good | ≤50 | ≤40 |
| Quite good | 50.1–55.0 | 40.1–45.0 |
| Slightly polluted | 55.1–60.0 | 45.1–50.0 |
| Moderately polluted | 60.1–65.0 | 50.1–55.0 |
| Heavily polluted | >65 | >55 |
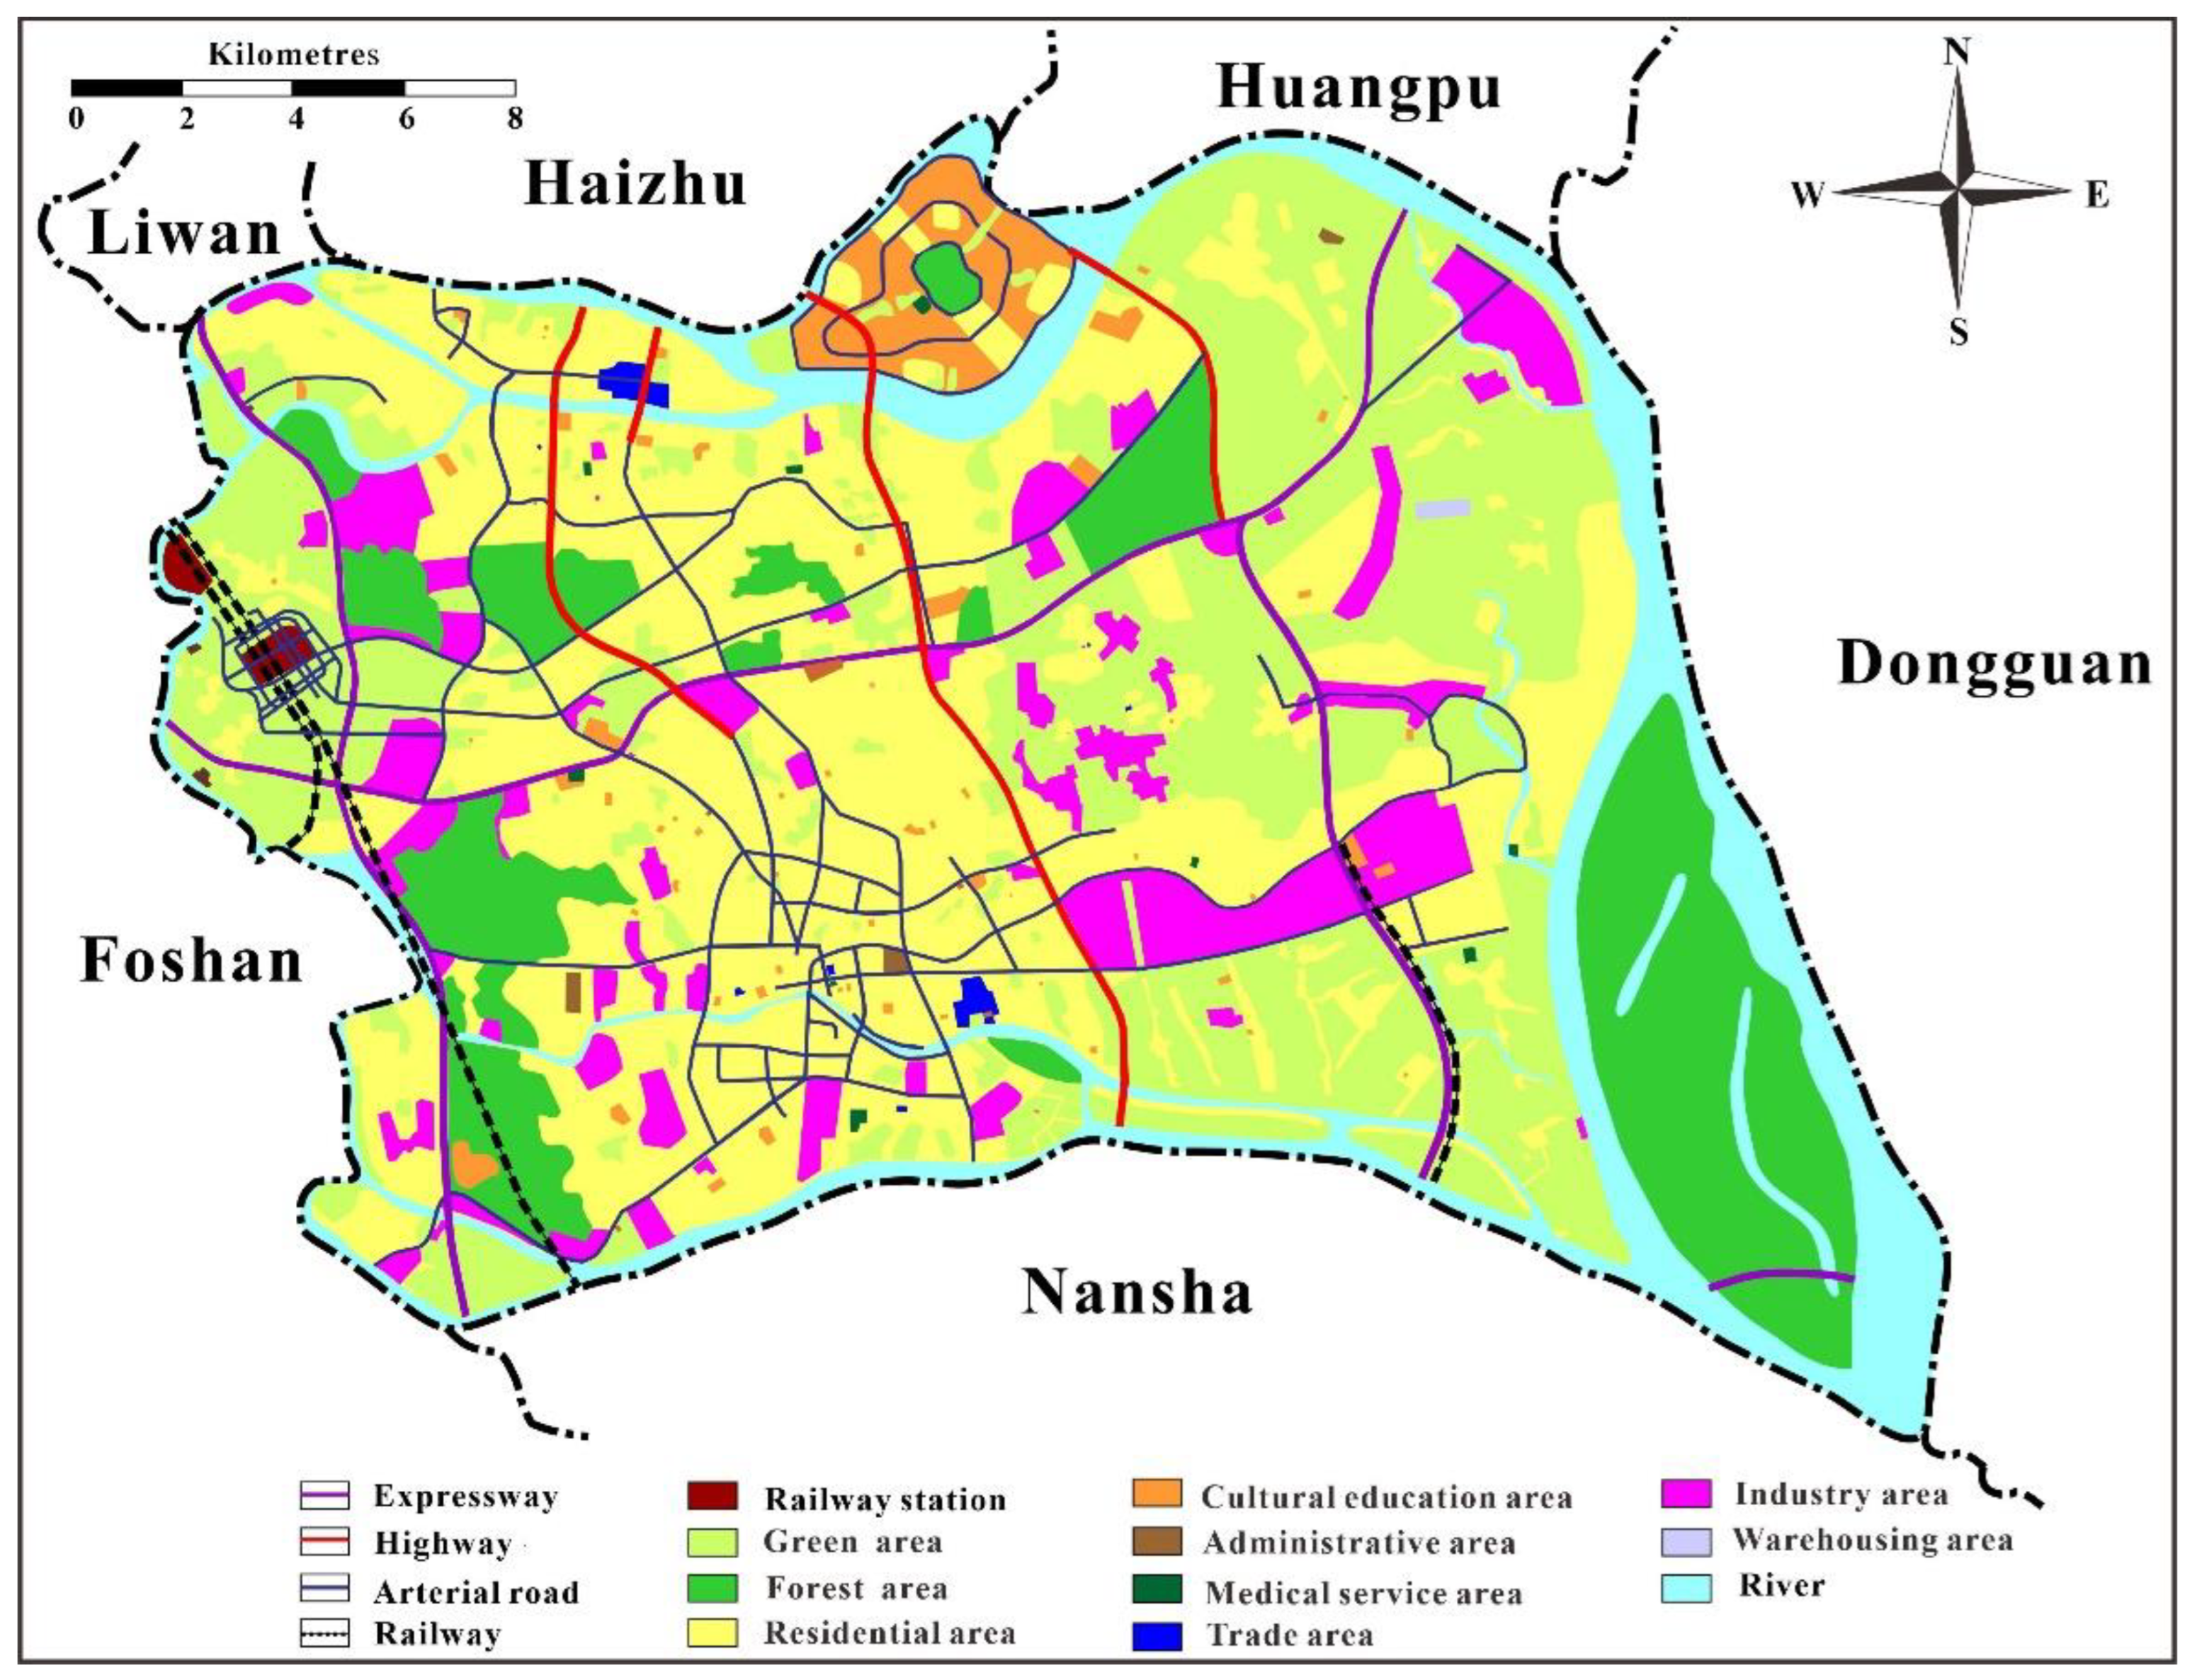
Figure A5.
Distribution of functional areas and traffic arteries in Panyu District of Guangzhou City [36].
Figure A5.
Distribution of functional areas and traffic arteries in Panyu District of Guangzhou City [36].

References
- Guski, R.; Schreckenberg, D.; Schuemer, R. WHO environmental noise guidelines for the European region: A systematic review on environmental noise and annoyance. Int. J. Environ. Res. Public Health 2017, 14, 1539. [Google Scholar] [CrossRef] [PubMed] [Green Version]
- European Commission. Report from the Commission to the European Parliament and the Council. On the Implementation of the Environmental Noise Directive in accordance with Article 11 of Directive 2002/49/EC; COM/2017/0151 Final; European Commission: Brussels, Belgium, 2017.
- Titu, A.M.; Boroiu, A.A.; Mihailescu, S.; Pop, A.B.; Boroiu, A. Assessment of Road Noise Pollution in Urban Residential Areas—A Case Study in Pite¸sti, Romania. Appl. Sci. 2022, 12, 4053. [Google Scholar] [CrossRef]
- Araújo Alves, J.; Neto Paiva, F.; Torres Silva, L.; Remoaldo, P. Low-frequency noise and its main effects on human health—A review of the literature between 2016 and 2019. Appl. Sci. 2020, 10, 5205. [Google Scholar] [CrossRef]
- Peris, E. Environmental noise in Europe: 2020. Eur. Environ. Agency 2020, 1, 104. [Google Scholar] [CrossRef]
- World Health Organization. Burden of Disease from Environmental Noise. In Quantification of Healthy Life Years Lost in Europe; WHO: Bonn, Germany, 2011. [Google Scholar]
- Muzet, A. Environmental noise, sleep and health. Sleep Med. Rev. 2007, 11, 135–142. [Google Scholar] [CrossRef]
- Babisch, W.; Beule, B.; Schust, M.; Kersten, N.; Ising, H. Traffic noise and risk of myocardial infarction. Epidemiology 2005, 16, 33–40. [Google Scholar] [CrossRef]
- Dratva, J.; Phuleria, H.C.; Foraster, M.; Gaspoz, J.-M.; Keidel, D.; Künzli, N.; Liu, L.-J.S.; Pons, M.; Zemp, E.; Gerbase, M.W. Transportation noise and blood pressure in a population-based sample of adults. Environ. Health Perspect. 2012, 120, 50–55. [Google Scholar] [CrossRef]
- Petri, D.; Licitra, G.; Vigotti, M.A.; Fredianelli, L. Effects of exposure to road, railway, airport and recreational noise on blood pressure and hypertension. Int. J. Environ. Res. Public Health 2021, 18, 9145. [Google Scholar] [CrossRef]
- Miedema, H.; Oudshoorn, C. Annoyance from transportation noise: Relationships with exposure metrics DNL and DENL and their confidence intervals. Environ. Health Perspect. 2001, 109, 409–416. [Google Scholar] [CrossRef]
- Licitra, G.; Fredianelli, L.; Petri, D.; Vigotti, M.A. Annoyance evaluation due to overall railway noise and vibration in Pisa urban areas. Sci. Total Environ. 2016, 568, 1315–1325. [Google Scholar] [CrossRef]
- Rossi, L.; Prato, A.; Lesina, L.; Schiavi, A. Effects of low-frequency noise on human cognitive performances in laboratory. Build. Acoust. 2018, 25, 17–33. [Google Scholar] [CrossRef]
- Erickson, L.C.; Newman, R.S. Influences of background noise on infants and children. Curr. Dir. Psychol. Sci. 2017, 26, 451–457. [Google Scholar] [CrossRef] [PubMed]
- Zacarías, F.F.; Molina, R.H.; Ancela, J.L.C.; López, S.L.; Ojembarrena, A.A. Noise exposure in preterm infants treated with respiratory support using neonatal helmets. Acta Acust. United Acust. 2013, 99, 590–597. [Google Scholar] [CrossRef]
- Minichilli, F.; Gorini, F.; Ascari, E.; Bianchi, F.; Coi, A.; Fredianelli, L.; Licitra, G.; Manzoli, F.; Mezzasalma, L.; Cori, L. Annoyance judgment and measurements of environmental noise: A focus on Italian secondary schools. Int. J. Environ. Res. Public Health 2018, 15, 208. [Google Scholar] [CrossRef] [PubMed] [Green Version]
- Wilhelmsson, M. The impact of traffic noise on the values of single-family houses. J. Environ. Plan. Manag. 2000, 43, 799–815. [Google Scholar] [CrossRef]
- Theebe, M.A. Planes, trains, and automobiles: The impact of traffic noise on house prices. J. Real Estate Financ. Econ. 2004, 28, 209–234. [Google Scholar] [CrossRef]
- Cohen, J.P.; Coughlin, C.C. Spatial hedonic models of airport noise, proximity, and housing prices. J. Reg. Sci. 2008, 48, 859–878. [Google Scholar] [CrossRef]
- Andersson, H.; Jonsson, L.; Ögren, M. Property prices and exposure to multiple noise sources: Hedonic regression with road and railway noise. Environ. Resour. Econ. 2010, 45, 73–89. [Google Scholar] [CrossRef] [Green Version]
- Mense, A.; Kholodilin, K.A. Noise expectations and house prices: The reaction of property prices to an airport expansion. Ann. Reg. Sci. 2014, 52, 763–797. [Google Scholar] [CrossRef]
- Swoboda, A.; Nega, T.; Timm, M. Hedonic analysis over time and space: The case of house prices and traffic noise. J. Reg. Sci. 2015, 55, 644–670. [Google Scholar] [CrossRef]
- Trojanek, R.; Tanas, J.; Raslanas, S.; Banaitis, A. The impact of aircraft noise on housing prices in Poznan. Sustainability 2017, 9, 2088. [Google Scholar] [CrossRef] [Green Version]
- Vogiatzis, K.; Remy, N. Soundscape design guidelines through noise mapping methodologies: An application to medium urban agglomerations. Noise Mapp. 2017, 4, 1–19. [Google Scholar] [CrossRef]
- Ramesh, B.R.; Bhaven, N.T. Urban road traffic noise monitoring, mapping, modelling, and mitigation: A thematic review. Noise Mapp. 2022, 9, 48–66. [Google Scholar] [CrossRef]
- Paschalidou, A.K.; Kassomenos, P.; Chonianaki, F. Strategic Noise Maps and Action Plans for the reduction of population exposure in a Mediterranean port city. Sci. Total Environ. 2019, 654, 144–153. [Google Scholar] [CrossRef] [PubMed]
- Lan, Z.; He, C.; Cai, M. Urban road traffic noise spatiotemporal distribution mapping using multisource data. Transp. Res. Part D Transp. Environ. 2020, 82, 102323. [Google Scholar] [CrossRef]
- do Nascimento, E.O.; de Oliveira, F.L.; de Oliveira, L.N.; Zannin, P.H.T. Noise prediction based on acoustic maps and vehicle fleet composition. Appl. Acoust. 2021, 174, 107803. [Google Scholar] [CrossRef]
- Zhao, W.J.; Liu, E.X.; Poh, H.J.; Wang, B.; Gao, S.P.; Png, C.E.; Li, K.W.; Chong, S.H. 3D traffic noise mapping using unstruc-tured surface mesh representation of buildings and roads. Appl. Acoust. 2017, 127, 297–304. [Google Scholar] [CrossRef]
- Bostanci, B. Accuracy assessment of noise mapping on the main street. Arab. J. Geosci. 2018, 11, 4. [Google Scholar] [CrossRef]
- Paschalidou, A.K.; Kassomenos, P.; Chonianaki, F.; Valkouma, T. 3-year noise monitoring and strategic noise mapping in an extended motorway. Environ. Sci. Pollut. Res. 2019, 26, 15608–15616. [Google Scholar] [CrossRef]
- Sonaviya, D.R.; Tandel, B.N. Integrated road traffic noise mapping in urban Indian context. Noise Mapp. 2020, 7, 99–113. [Google Scholar] [CrossRef]
- Alam, P.; Ahmad, K.; Khan, A.H.; Khan, N.A.; Dehghani, M.H. 2D and 3D mapping of traffic induced noise near major roads passing through densely populated residential area of South Delhi, India. PLoS ONE 2021, 16, e0248939. [Google Scholar] [CrossRef] [PubMed]
- Wosniacki, G.G.; Zannin, P.H.T. Framework to manage railway noise exposure in Brazil based on field measurements and strategic noise mapping at the local level. Sci. Total Environ. 2021, 757, 143721. [Google Scholar] [CrossRef] [PubMed]
- Laxmi, V.; Thakre, C.; Vijay, R. Evaluation of noise barriers based on geometries and materials: A review. Environ. Sci. Pollut. Res. 2022, 29, 1729–1745. [Google Scholar] [CrossRef] [PubMed]
- Lee, H.M.; Luo, W.; Xie, J.; Lee, H.P. Urban Traffic Noise Mapping Using Building Simplification in the Panyu District of Guangzhou City, China. Sustainability 2022, 14, 4465. [Google Scholar] [CrossRef]
- Standard Requirement of Acoustic Design and Measurement for Noise Barrier; Technical Report HJ/T 90-2004; Ministry of Environmental Protection of the People’s Republic of China: Beijing, China, 2004.
- Jiang, K. Optimization Study of Road Noise Barrier. Master’s Thesis, Chang’an University, Xi’an, China, 2008. [Google Scholar]
- Song, S. Analysis on noise reduction effect of expressway noise barrier and study on its applicability. Master’s thesis, Chang’an University, Xi’an, China, 2014. [Google Scholar]
- Wang, X. Design of noise barrier for expressway near urban area. Constr. Des. Proj. 2019, 7. [Google Scholar] [CrossRef]
- Wu, X.; Lu, Z.; Wu, X.; Yu, X.; Huang, X.; Shi, G. Effect analysis of noise barrier design on traffic noise in residential road. Urban. Archit. 2019, 11. [Google Scholar] [CrossRef]
- Chen, L.; Ye, Y.; Tang, Y.; Shi, Y. Analysis of the influence of expressway traffic noise on the acoustic environment of resi-dential area. Guangdong Highw. Commun. 2019, 45, 189–191. [Google Scholar]
- Sun, H. Study on the Characteristics of Noise Barriers with Different Structures. Master’s Thesis, Dalian Jiaotong University, Dalian, China, 2008. [Google Scholar]
- Zheng, Z. Study on Influence of Noise from Main Road on Campus and Design of Noise Barrier. Master’s Thesis, Jilin University, Changchun, China, 2008. [Google Scholar]
- Guangzhou Panyu District Statistics Bureau, Bulletin of the Seventh National Census of Panyu District, Guangzhou. Available online: http://www.panyu.gov.cn/gzpytj/gkmlpt/content/7/7325/post_7325645.html#1582 (accessed on 28 May 2022).
- Vorläufige Berechnungsmethode zur Ermittlung der Belastetenzahlen durch Umgebungslärm (VBEB); Technical Report; Bundesanzeiger: Dortmund, Germany, 2007.
- Technical Specification for Acoustic Environment Quality Evaluation; Technical Report; Ministry of Environmental Protection of the People’s Republic of China: Beijing, China, 2012.
- Licitra, G.; Ascari, E. Gden: An indicator for European noise maps comparison and to support action plans. Sci. Total Environ. 2014, 482, 411–419. [Google Scholar] [CrossRef]
- Fredianelli, L.; Carpita, S.; Bernardini, M.; Del Pizzo, L.G.; Brocchi, F.; Bianco, F.; Licitra, G. Traffic Flow Detection Using Camera Images and Machine Learning Methods in ITS for Noise Map and Action Plan Optimization. Sensors 2022, 22, 1929. [Google Scholar] [CrossRef]
- Position Paper on Dose Response Relationships between Transportation Noise and Annoyance; Technical Report; European Commission: Luxembourg, 2002.
- Basner, M.; McGuire, S. WHO Environmental Noise Guidelines for the European Region: A Systematic Review on Environmental Noise and Effects on Sleep. Int. J. Environ. Res. Public Health 2018, 15, 519. [Google Scholar] [CrossRef] [Green Version]
- Fredianelli, L.; Del Pizzo, A.; Licitra, G. Recent Developments in Sonic Crystals as Barriers for Road Traffic Noise Mitigation. Environments 2019, 6, 14. [Google Scholar] [CrossRef] [Green Version]
- Lee, H.M.; Hua, Y.; Xie, J.; Lee, H.P. Parametric Optimization of Local Resonant Sonic Crystals Window on Noise Attenuation by Using Taguchi Method and ANOVA Analysis. Crystals 2022, 12, 160. [Google Scholar] [CrossRef]
- Kumar, S.; Lee, H.P. The Present and Future Role of Acoustic Metamaterials for Architectural and Urban Noise Mitigations. Acoustics 2019, 1, 590–607. [Google Scholar] [CrossRef] [Green Version]
- Iannace, G.; Ciaburro, G.; Trematerra, A. Metamaterials acoustic barrier. Appl. Acoust. 2021, 181, 108172. [Google Scholar] [CrossRef]
- Division of Acoustic Environment Functional Area in Guangzhou; Technical Report; Environmental Protection Bureau of Guangzhou: Guangzhou, China, 2018.
Figure 1.
Daytime over-limit value map in Panyu District of Guangzhou City.

Figure 2.
Nighttime over-limit value map in Panyu District of Guangzhou City.

Figure 3.
Geometries of different noise barriers. (a) L-shape (left); (b) L-shape (right); (c) T-shape; (d) cylindrical; (e) roof edge; (f) curved cantilever (left); (g) curved cantilever (right).
Figure 3.
Geometries of different noise barriers. (a) L-shape (left); (b) L-shape (right); (c) T-shape; (d) cylindrical; (e) roof edge; (f) curved cantilever (left); (g) curved cantilever (right).

Figure 4.
A noise map of a small area of Guangzhou University. (a) Daytime without a noise barrier; (b) daytime with an L-shaped noise barrier; (c) nighttime without a noise barrier; (d) nighttime with an L-shaped noise barrier. Note that only a noise map with an L-shaped noise barrier is shown for brevity.

Figure 5.
Comparison of three-dimensional noise maps of the small area near Guangzhou University in the University Town. (a) With noise barriers; (b) without noise barriers.
Figure 5.
Comparison of three-dimensional noise maps of the small area near Guangzhou University in the University Town. (a) With noise barriers; (b) without noise barriers.

Figure 6.
Daytime urban traffic noise map of Panyu District, Guangzhou City with the existence of noise barriers. is the A-weighted equivalent noise level over the 16 h period of daytime (6:00 to 22:00).
Figure 6.
Daytime urban traffic noise map of Panyu District, Guangzhou City with the existence of noise barriers. is the A-weighted equivalent noise level over the 16 h period of daytime (6:00 to 22:00).

Figure 7.
Nighttime urban traffic noise map of Panyu District, Guangzhou City with the existence of noise barriers. is the A-weighted equivalent noise level over the 8 h period of nighttime (22:00 to 6:00).
Figure 7.
Nighttime urban traffic noise map of Panyu District, Guangzhou City with the existence of noise barriers. is the A-weighted equivalent noise level over the 8 h period of nighttime (22:00 to 6:00).

Figure 8.
Day–night urban traffic noise map of Panyu District, Guangzhou City with the existence of noise barriers. is the A-weighted equivalent noise level over a 24 h period.
Figure 8.
Day–night urban traffic noise map of Panyu District, Guangzhou City with the existence of noise barriers. is the A-weighted equivalent noise level over a 24 h period.

Figure 9.
Comparison of the areas covered by different noise quality levels between the cases with and without noise barriers: (a) daytime; (b) nighttime.
Figure 9.
Comparison of the areas covered by different noise quality levels between the cases with and without noise barriers: (a) daytime; (b) nighttime.

Figure 10.
Daytime noise level compliance map in Panyu District of Guangzhou City.

Figure 11.
Nighttime noise level compliance map in Panyu District of Guangzhou City.

Figure 12.
Comparison of the compliance rates of various acoustic environment functional areas between the cases with and without noise barriers. (a) Daytime; (b) nighttime.
Figure 12.
Comparison of the compliance rates of various acoustic environment functional areas between the cases with and without noise barriers. (a) Daytime; (b) nighttime.

Figure 13.
Location and geographic information of the University Town in Panyu District.

Table 1.
Sound absorption coefficients and noise reduction coefficients of different sound absorption materials [38].
Table 1.
Sound absorption coefficients and noise reduction coefficients of different sound absorption materials [38].
| Frequency (Hz) | Rock Wool | Slag Wool | Polyurethane Foam | Superfine Glass Wool |
|---|---|---|---|---|
| 250 | 0.32 | 0.39 | 0.31 | 0.35 |
| 315 | 0.46 | 0.52 | 0.32 | 0.60 |
| 400 | 0.74 | 0.71 | 0.46 | 0.80 |
| 500 | 0.82 | 0.78 | 0.63 | 0.88 |
| 630 | 0.87 | 0.85 | 0.75 | 0.86 |
| 800 | 0.92 | 0.88 | 0.92 | 0.85 |
| 1000 | 0.93 | 0.91 | 0.96 | 0.86 |
| 1250 | 0.93 | 0.92 | 0.93 | 0.65 |
| 1600 | 0.92 | 0.90 | 0.87 | 0.88 |
| 2000 | 0.94 | 0.92 | 0.70 | 0.91 |
| NRC | 0.75 | 0.75 | 0.65 | 0.75 |
Table 2.
Literature review of the geometry of noise barriers.
| Literatures | Geometry |
|---|---|
| “Analysis on noise reduction effect of expressway noise barrier and study on its applicability” [39] | L-shape |
| “Design of noise barrier for expressway near urban area” [40] | L-shape |
| “Effect analysis of noise barrier design on traffic noise in residential road” [41] | Curved cantilever |
| “Analysis of the influence of expressway traffic noise on the acoustic environment of residential area” [42] | L-shape |
| “Study on the characteristics of noise barriers with different structures” [43] | L-shape |
| “Study on influence of noise from main road on campus and design of noise barrier” [44] | Straight edge |
Table 3.
Area of the University Town that was covered by different sound pressure levels in the daytime (<60 dBA) and nighttime (<50 dBA) for the cases with and without noise barriers. Note that the percentage is defined as .
Table 3.
Area of the University Town that was covered by different sound pressure levels in the daytime (<60 dBA) and nighttime (<50 dBA) for the cases with and without noise barriers. Note that the percentage is defined as .
| Geometry | ||
|---|---|---|
| Without | 0.1226 (15.6%) | 0.0081 (1.0%) |
| L-shaped | 0.2131 (27.1%) | 0.0160 (2.0%) |
| T-shaped | 0.2150 (27.4%) | 0.0153 (1.9%) |
| Cylindrical | 0.2151 (27.4%) | 0.0153 (1.9%) |
| Roof edge | 0.2151 (27.4%) | 0.0153 (1.9%) |
| Curved cantilever | 0.2131 (27.1%) | 0.0160 (2.0%) |
Table 4.
Minimum (min) and maximum (max) noise levels of Panyu District in Guangzhou City with the existence of noise barriers. , where wo and w stand for without and with noise barriers, respectively. All units are in dBA.
Table 4.
Minimum (min) and maximum (max) noise levels of Panyu District in Guangzhou City with the existence of noise barriers. , where wo and w stand for without and with noise barriers, respectively. All units are in dBA.
| Noise Indicator | ||||
|---|---|---|---|---|
| 39.8 | 80.1 | 0.1 | 5.2 | |
| 39.2 | 72.0 | 0.2 | 6.1 | |
| 42.3 | 83.5 | 0.3 | 5.6 |
Table 5.
Minimum and maximum noise levels of different functional areas in Panyu District of Guangzhou City with the existence of noise barriers. The numbers 1 and 2 stand for minimum and maximum, respectively. All units are in dBA.
Table 5.
Minimum and maximum noise levels of different functional areas in Panyu District of Guangzhou City with the existence of noise barriers. The numbers 1 and 2 stand for minimum and maximum, respectively. All units are in dBA.
| Functional Area | ||||||||
|---|---|---|---|---|---|---|---|---|
| Forest area | 39.8 | 39.2 | 61.3 | 61.1 | 3.0 | 2.9 | 1.9 | 2.0 |
| Residential area | 42.8 | 42.6 | 65.4 | 63.6 | 0.6 | 0.5 | 5.1 | 5.5 |
| Cultural education area | 49.0 | 48.5 | 63.9 | 63.5 | 0.4 | 0.5 | 4.9 | 5.0 |
| Administrative area | 52.4 | 51.9 | 60.5 | 60.1 | 0.6 | 0.7 | 2.7 | 2.5 |
| Medical service area | 48.1 | 47.6 | 60.3 | 60.0 | 0.6 | 0.7 | 3.1 | 2.5 |
| Trade area | 52.1 | 51.5 | 64.2 | 63.4 | 1.5 | 1.5 | 2.8 | 2.9 |
| Industrial area | 53.1 | 53.3 | 65.2 | 65.1 | 1.8 | 0.3 | 5.8 | 5.5 |
| Warehousing area | 53.6 | 52.3 | 67.9 | 67.3 | 0.7 | 2.2 | 0.5 | 0.5 |
Table 6.
Populations under different noise exposure levels in the University Town.
| Noise Exposure Level (dBA) | <40 | 40~45 | 45~50 | 50~55 | 55~60 | 60~65 | 65~70 | 70~75 | >75 | |
|---|---|---|---|---|---|---|---|---|---|---|
| Without noise barrier | 105 | 1005 | 17,107 | 36,916 | 36,553 | 28,647 | 19,974 | 2231 | 11 | |
| 141 | 1862 | 20,310 | 37,951 | 35,713 | 27,640 | 17,077 | 1855 | 2 | ||
| 0 | 26 | 335 | 8632 | 31,124 | 39,916 | 30,097 | 25,688 | 6731 | ||
| With noise barrier | 116 | 1893 | 27,063 | 44,574 | 31,289 | 21,267 | 14,506 | 1842 | 0 | |
| 160 | 3446 | 30,466 | 44,557 | 29,442 | 21,152 | 11,788 | 1540 | 0 | ||
| 0 | 92 | 1171 | 23,553 | 44,117 | 33,749 | 21,452 | 16,002 | 2414 | ||
Table 7.
Population under different noise quality levels (“−” indicates a decrease).
| Noise Quality Level | Good | Quite Good | Slightly Polluted | Moderately Polluted | Heavy Polluted | |
|---|---|---|---|---|---|---|
| Day | Without noise barrier | 18,217 | 36,916 | 36,553 | 28,647 | 22,217 |
| With noise barrier | 29,072 | 44,574 | 31,289 | 21,267 | 16,347 | |
| Variation rate (%) | 59.59% | 20.74% | −14.40% | −25.76% | −26.42% | |
| Night | Without noise barrier | 141 | 1862 | 20,311 | 37,951 | 82,286 |
| With noise barrier | 160 | 3446 | 30,466 | 44,557 | 63,921 | |
| Variation rate (%) | 13.48% | 85.07% | 50.00% | 17.41% | −22.32% | |
Table 8.
The representative values corresponding to different noise exposure levels.
| Noise Exposure Level | |
|---|---|
| 40–45 | 43.5 |
| 45–50 | 47.5 |
| 50–55 | 53.5 |
| 55–60 | 57.5 |
| 60–65 | 63.5 |
| 65–70 | 67.5 |
| >75 | 77.5 |
Table 9.
, , , and for the University Town.
| Without noise barrier | 69.6 | 62.1 | 26,605 | 10,559 |
| With noise barrier | 67.1 | 60.9 | 20,709 | 10,052 |
| Difference | 2.5 | 1.2 | 5896 | 507 |
Publisher’s Note: MDPI stays neutral with regard to jurisdictional claims in published maps and institutional affiliations. |
© 2022 by the authors. Licensee MDPI, Basel, Switzerland. This article is an open access article distributed under the terms and conditions of the Creative Commons Attribution (CC BY) license (https://creativecommons.org/licenses/by/4.0/).
Share and Cite
MDPI and ACS Style
Lee, H.M.; Luo, W.; Xie, J.; Lee, H.P. Traffic Noise Reduction Strategy in a Large City and an Analysis of Its Effect. Appl. Sci. 2022, 12, 6027. https://doi.org/10.3390/app12126027
AMA Style
Lee HM, Luo W, Xie J, Lee HP. Traffic Noise Reduction Strategy in a Large City and an Analysis of Its Effect. Applied Sciences. 2022; 12(12):6027. https://doi.org/10.3390/app12126027
Chicago/Turabian StyleLee, Hsiao Mun, Wensheng Luo, Jinlong Xie, and Heow Pueh Lee. 2022. "Traffic Noise Reduction Strategy in a Large City and an Analysis of Its Effect" Applied Sciences 12, no. 12: 6027. https://doi.org/10.3390/app12126027
Note that from the first issue of 2016, this journal uses article numbers instead of page numbers. See further details here.