Article

Analysis of the Impact of Residential Property and Equipment on Building Energy Efficiency and Consumption—A Data Mining Approach

by
Mahsa Nazeriye
1,
Abdorrahman Haeri
1,* and
Francisco Martínez-Álvarez
2,*
1
School of Industrial Engineering, Iran University of Science and Technology (IUST), Tehran 1684613114, Iran
2
Data Science & Big Data Lab, Pablo de Olavide University, ES-41013 Seville, Spain
*
Authors to whom correspondence should be addressed.
Appl. Sci. 2020, 10(10), 3589; https://doi.org/10.3390/app10103589
Submission received: 14 February 2020 / Revised: 11 May 2020 / Accepted: 15 May 2020 / Published: 22 May 2020

Abstract

:
Human living could become very difficult due to a lack of energy. The household sector plays a significant role in energy consumption. Trying to optimize and achieve efficient energy consumption can lead to large-scale energy savings. The aim of this paper is to identify the equipment and property affecting energy efficiency and consumption in residential homes. For this purpose, a hybrid data-mining approach based on K-means algorithms and decision trees is presented. To analyze the approach, data is modeled once using the approach and then without it. A data set of residential homes of England and Wales is arranged in low, medium and high consumption clusters. The C5.0 algorithm is run on each cluster to extract factors affecting energy efficiency. The comparison of the modeling results, and also their accuracy, prove that the approach employed has the ability to extract the findings with greater accuracy and detail than in other cases. The installation of boilers, using cavity walls, and installing insulation could improve energy efficiency. Old homes and the usage of economy 7 electricity have an unfavorable effect on energy efficiency, but the approach shows that each cluster behaved differently in these factors related to energy efficiency and has unique results.

1. Introduction

In today’s world, supplying energy is done through various carriers such as oil and gas (and products derived from them), electricity and renewable energy. Given the limited resources of energy and the population growth, the increasing annual consumption of energy affects life, the economy, the environment, politics, and so on. So, managing energy is a complicated task and has become an important issue in the modern world. The home section has the largest share of energy consumption in most countries. As each house has its own behavior, energy consumption patterns rely on several factors. Hence, decision making concerning the domestic sector’s energy management and efficiency requires taking advantage of modern science capabilities to manage energy efficiency and consumption.
Data mining science can extract useful knowledge which is hidden in the data. Using its methods and algorithms, data mining techniques analyze huge amounts of data automatically [1,2]. In general, data mining is the process of Knowledge Discovery in Databases (KDD). Knowledge obtained from this fashionable science can be verified by conventional analysis [3]. As this science proves its potential in solving versatile problems [4], using it to extract knowledge in domestic buildings for managing energy is reasonable.
Scholars aim to develop innovation changes in the field of energy, so many studies have been conducted on the use of data mining science in energy management and efficiency. Energy performance certificates (EPCs) measure energy performance and give recommendations on how to improve energy efficiency [5,6]. They try to find inefficient building properties and improve them. In other words, they help to locate properties whose energy performance is effective and better them to improve their energy efficiency [7]. Pasichnyi et al. review existing applications of EPCs and present a method of EPC data quality assurance using data analytics [8]. Developments on EPCs have been done using data mining in recent years [9,10].
Some important insights related to the energy management requirement for buildings to save energy have been presented in [11,12]. Also, data mining tasks that can be used to mine building-related data have been shown in [13]. There are studies which focus on discovering factors which influence energy. Yan analyzed the impact of psychological, family and contextual aspects on residential energy consumption which indicate saving money, energy concern, and behavioral barriers which have a major impact on residential energy consumption behavior [14]. Effective factors on home electrical energy demand have been analyzed through developing a model using series prediction methods. The result demonstrates that houses using pool pumps and ducted air-conditioning have an increased electricity consumption, whereas houses with gas hot water systems have a lower power consumption than homes that do not use these systems [15]. The adaptive neuro-fuzzy inference system (ANFIS) has been used to discover major factors influencing energy consumption. This indicates that insulating materials are the most important parameters in building energy consumption. Attributes such as the type of materials and their thickness, wall structures, roofs and their ability to stay hot or cold, the location of walls and windows and geographic area have a major impact on energy saving [16]. The use of unsupervised learning has been applied to discover electricity consumption patterns in a Spanish public university. The authors found different clusters in which several buildings were identified. Such clusters were interpreted and rules for saving energy were proposed [17].
Clustering data is the process of putting data in a group so that they have the greatest similarity and are very dissimilar from data from other clusters. Many studies have been done in clustering [18,19,20,21]. Clustering is also used in the field of energy. The dataset has been classified into low, medium and high energy demand categories to show the factors influencing heating and hot water. A detailed analysis was performed using the k-means algorithm in the high consumption category. The output model presents good energy demand patterns and optimal ways to design buildings. The average U-value of the opaque envelope followed by the aspect ratio is the most important variable [22]. Characteristics of energy consumption examined have used cluster analysis for 134 LEED-NC certified office buildings. The buildings gathered into three clusters (low, medium and high) are very different and each one has a special attribute. The lower U-value of the roof and a lower ratio of windows are the factors which most influence a lower consumption. The HVAC system has a similar performance in all the clusters. The internal process load has a significant impact on clusters [23]. A framework based on data mining used CART classification and K-means clustering to analyze the pattern of energy consumption in a large data set of flats. Four influencing attributes (aspect ratio, U-value of vertical opaque envelope and windows, the average global efficiency of the system for space heating and DHW) were analyzed. High consumption flats were clustered and a reference flat was identified. These can be used to propose different energy retrofit actions [24].
The consumption of electricity and heating in six schools was studied using k-means clustering and self-organizing maps to evaluate energy efficiency. The schools have different construction years, areas, numbers of students and heating systems. Schools 1 and 4 have the highest cost of energy on working days and schools 2 and 3 have the lowest cost of energy at weekends compared to the others. The newest schools are generally better than the old ones in the field of energy efficiency [25]. A study of energy efficiency in 132 countries was estimated using a Data envelopment analysis model and then K-Means clustering, which specifies whether countries in a cluster are in the field of development or not. The results show that countries could develop energy efficiency by changing energy-related indicators [26]. A cluster analysis was used to analyze the regulations on energy efficiency of buildings of South America and Europe. This showed that buildings located in a similar climate zone but in different regions (countries) have different energy performances. It indicated that the tendencies of energy performance are different between various countries’ regulations and the climate zones. The results confirmed the ability of cluster analysis to highlight similarity patterns between various regions of the same climate [27]. In the field of energy management systems, ISO 50001:2011, a systematic approach to improve the energy performance, plays an important role in the energy field. A study which classified, gathered, clustered and then applied data analysis techniques showed strategic decisions for improving the energy performance. The idea is used in an oil refinery and outputs of better energy management are shown [28]. Also in [29,30], efforts were made to develop the energy efficiency in industrial buildings. A fuzzy clustering technique was developed to rate school buildings in Greece. The methodology demonstrates that the energy consumption and global environmental quality of school buildings can be significantly improved, but the indoor air quality of these buildings causes some problems for them [31]. Wind is an energy source whose identification and assessment in its training needs is very important. The Analytic Hierarchy Process has been used to specify the training of wind farm employees. The results of the research prioritized the tasks and appropriate training courses tailored to the indicators were provided [32].
Discovering the rules is very much challenged in data mining [33,34,35,36]. Yu et al. present associations between building operational data. The methodology used on HVAC system data offers some “if-then” rules that are useful in the energy conservation field. Finding faulty equipment and repairing it, offering cost-efficient conservation strategies and a better understanding of building operation are suitable solutions for energy saving [37]. In another research work, the geographical and temperature variables in the electricity energy consumption were analyzed. Energy consumption and monthly average temperature data were clustered using K-means and then the Apriori algorithm was employed to discover association rules. These made “if-then” rules to describe the influence of different regions and physiographic objects. It shows that the most important parameters to increase electricity consumption are highways and then the ground, whereas rivers and farms (natural elements) decrease electricity consumption [38]. A combined framework using clustering and association rules developed to discover unusual energy used patterns. Benchmarking the rules identifies different waste patterns for different lifestyles [39]. A multi-objective algorithm is proposed to mine rules without a need to determine a minimum support threshold and a confidence threshold. This algorithm was used in three different datasets and it demonstrates its ability to mine quantitative association rules [40]. A hybrid algorithm including the genetic algorithm and particle swarm optimization algorithm was used to discover rules in continuous numeric datasets. It shows its ability in five different numerical interval datasets compared to other algorithms [41].
Due to irregular growth in the energy consumption of homes, analyzing their energy efficiency homes is an unavoidable study. Each building has its unique attribute, function and energy-related behavior to improve the energy efficiency of buildings. It is necessary to identify which factors and properties influence it, considering the unique behavior of homes. Analyzing them together leads to a tendency to pay attention to certain information while ignore others, and the findings are applicable to fewer buildings. This article proposes a hybrid approach that includes clustering and decision trees to identify factors affecting energy efficiency and consumption in residential buildings, as well as the reduction of the loss of some important data. The idea is that by clustering houses and putting similar patterns in a cluster, and then analyzing the factors in each cluster separately, findings will be extracted with more detail and accuracy than by not using the approach and analyzing them all together.
The rest of this paper is as follows: The next section provides the methodology used and the approach presented. In order to set forth the paper’s purpose and also to examine the ability of the new approach, data analysis is done once without using the hybrid approach, provided in Section 3, and then again using the proposed approach in Section 4. Data clustering and also modeling each cluster separately will be done in this section. The evaluation and deployment are described in Section 5 and the conclusion is presented in Section 6, along with a discussion of the findings.

2. Methodology and Approach Presented
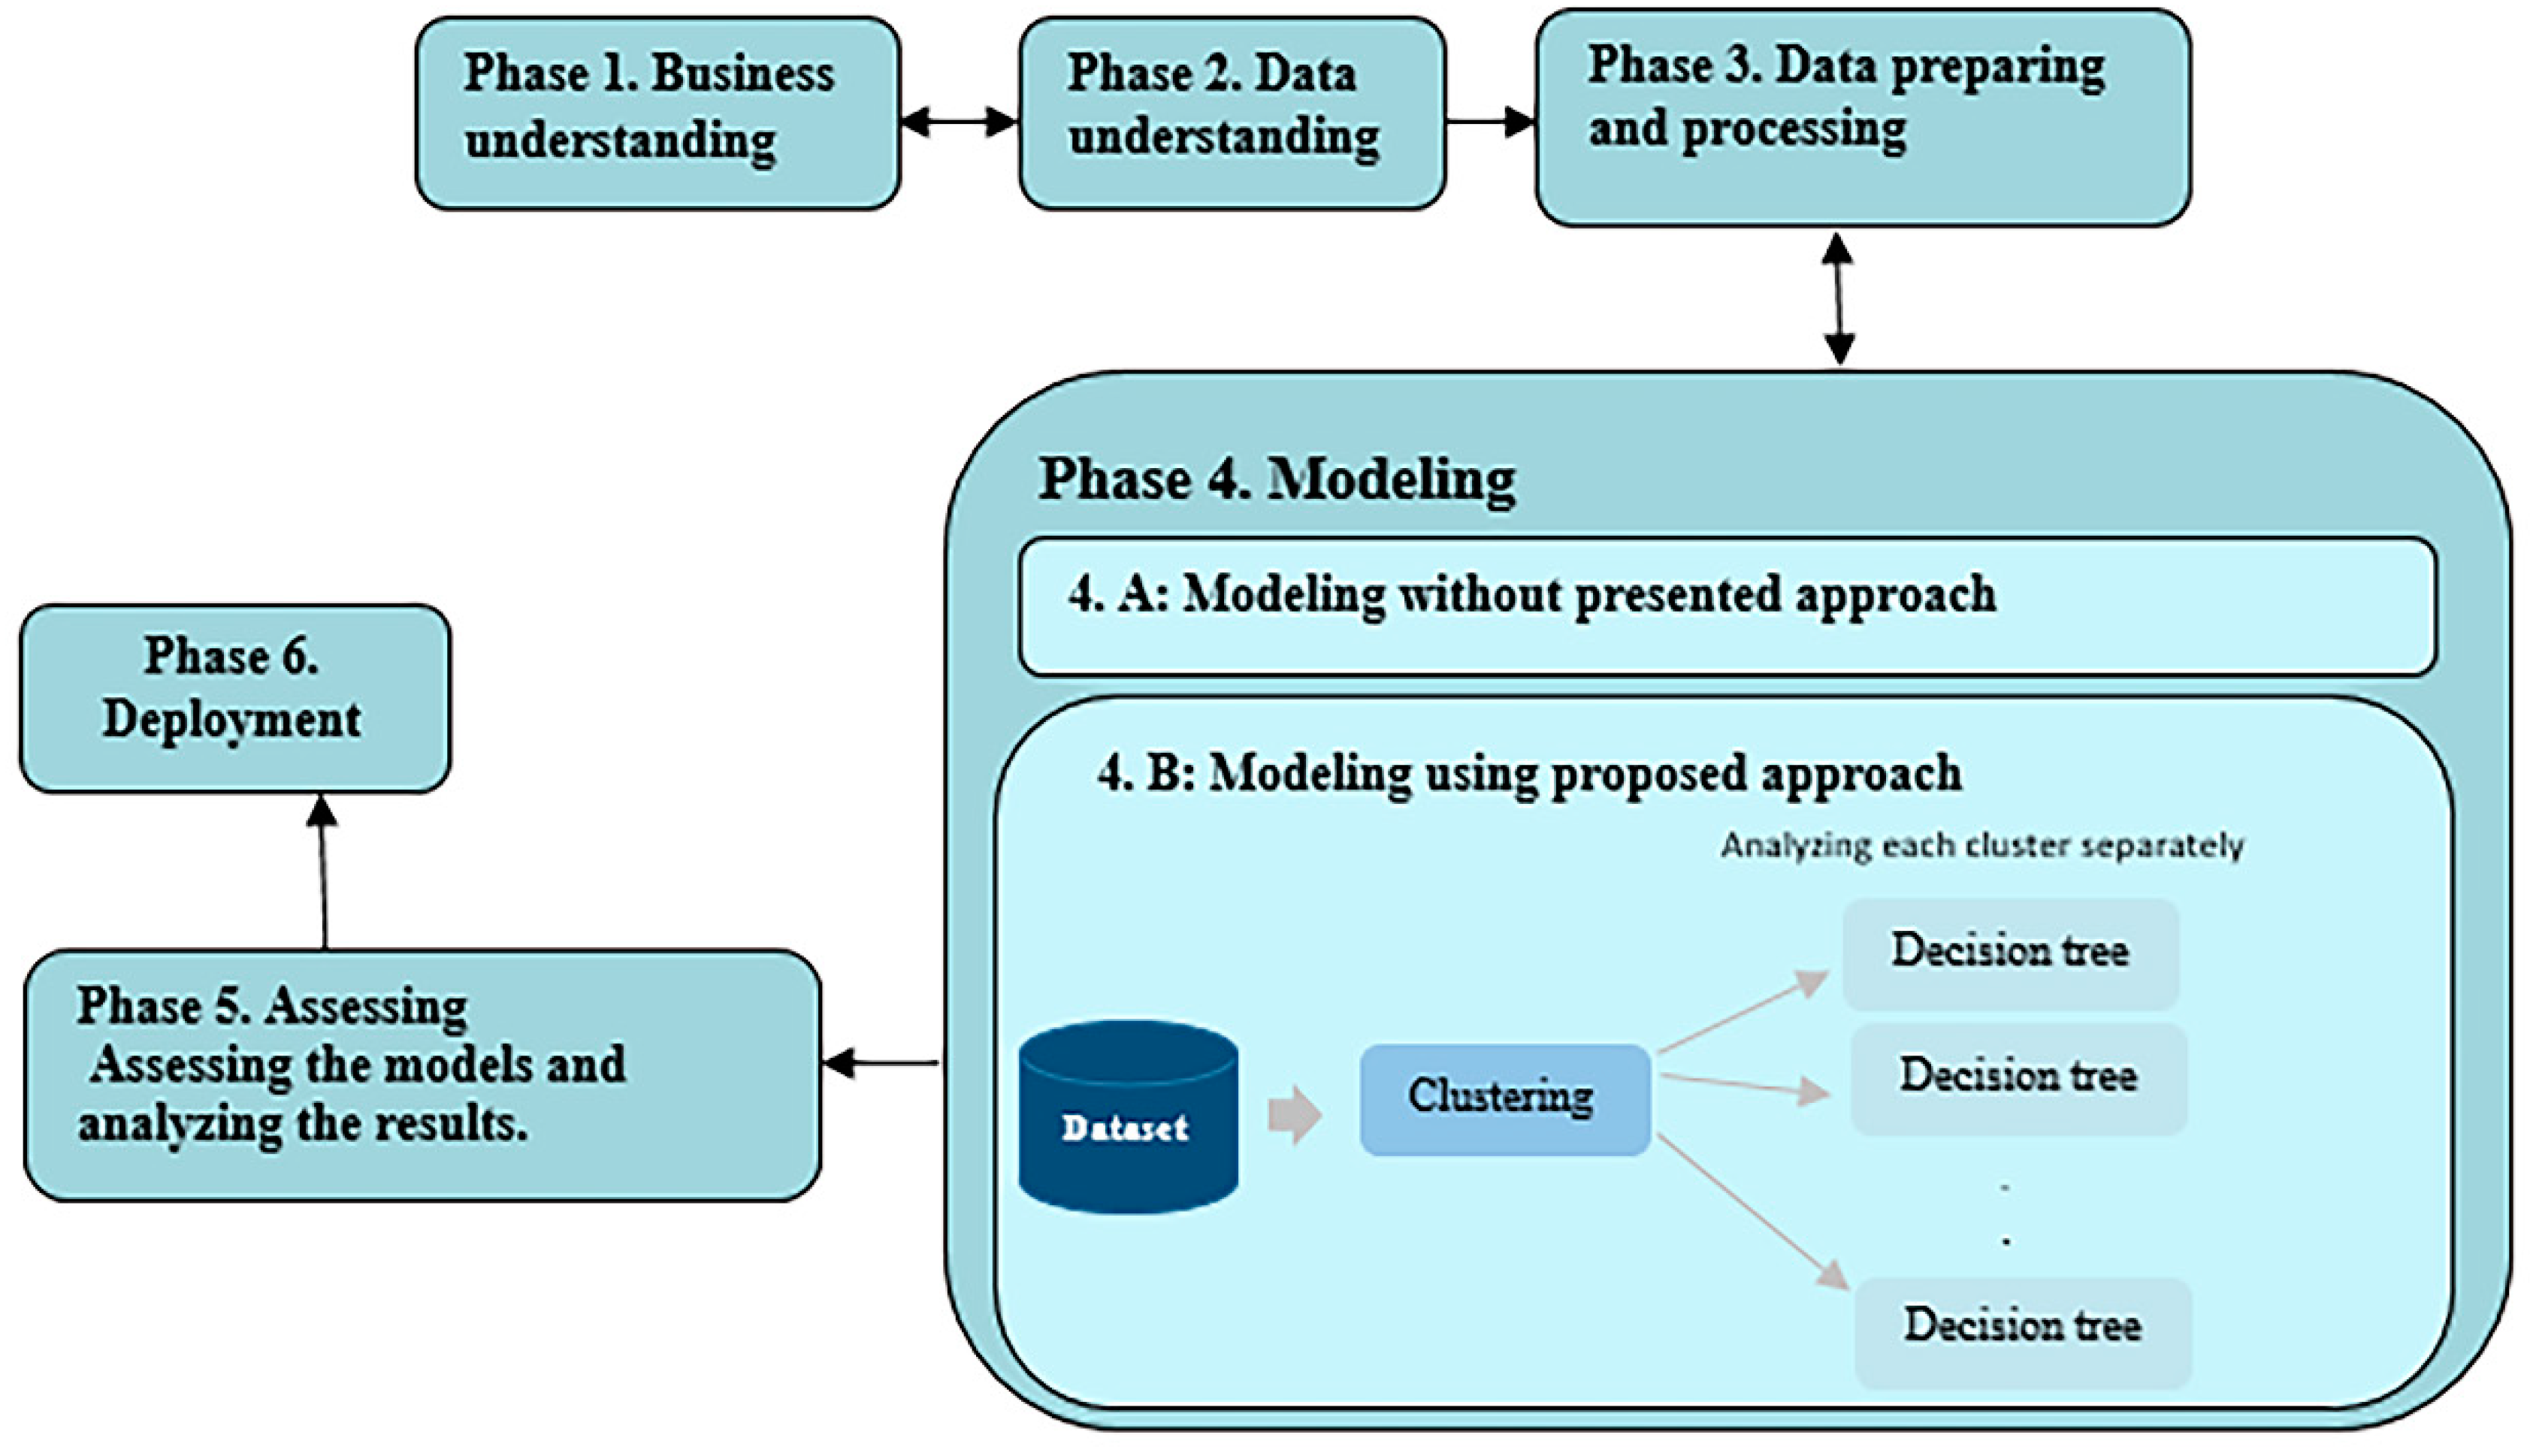
2.1. Methodology

Among the various methods of data mining science, such as [42], the Cross-Industry Standard Process for Data Mining (CRISP-DM) has been the one most widely used in data mining science. CRISP-DM is a global standard in project applications in data mining. This methodology consists of 6 phases, starting with the business understanding (problem definition) phase. The data understanding and the data preparation phases are done next. To achieve a basic understanding of the data, a cleaning and preparation of the data for modeling usage is done in these two phases. The modeling phase includes various techniques to analyze data and extract knowledge. The evaluation phase and then the deployment phase are the other phases of the CRISP-DM methodology [43]. In this methodology, phases could backtrack to previous phases. The SPSS Modeler of IMB [44] has been implemented with various tools and algorithms based on the CRISP-DM, The Clementine 12.0 released in Jan 2008 and IBM SPSS Modeler 18.0 released in March 2016 [45], software of IBM has been used to perform the data mining process.
Figure 1 shows the article methodology based on CRISP-DM. The article subject is defined in the first phase and it mainly discusses the problem definition. As expressed, the purpose is to identify properties affecting efficiency and also energy consumption in residential homes and also find out how to manage attributes and characteristics to achieve better energy management.
An understanding and preparation of the data is done in phase 2. A sample of 49,815 records of the housing stock of England and Wales has been selected. The Department of Energy and Climate Change has published this dataset [46]. Each record represented a region, a property age, a property type, the electricity and gas annual consumption from 2005 to 2012, the floor area band, etc. Table 1 describes the data set variables.
The data is processed in phase 3. Discrepancy detection is done in this phase and there is also a negative impact on data quality which should be identified and resolved. The variable is O in 226 record values of the GconsYEARValid, which means that the household has not a gas network, while the values of the MAIN_HEAT_FUEL variable is 1, which means that the main heating fuel is gas. The records have been deleted due to a contradiction of the information. When the values of the GconsYEARValid variable is v, gas consumption must be between 100 kWh to 5000 kWh, but in 1107 records (2% of the records) the value of gas consumption when the GconsYEARValid variable is v is not valid so these 2% of records were deleted. Most values are the same in some variables. These variables did not affect the analysis and can be removed from the data set. GconsYEARValid and EconsYEARValid are variables with such a case. Data preparation/Modeling without a presented approach/Modeling using a proposed approach:
As the houses have different areas, different members, etc., the energy consumption can be different. To assess the electricity and gas consumption, these variables need to have a specific unit. So, the energy consumption has been normalized, based on the floor area (kWh/m2). Since the exact area of each property is not available and the FLOOR_AREA_BAND variable is banded into four categories, the value of FLOOR_AREA_BAND variable is divided in the middle of each category of area variable to achieve a normal consumption based on kWh/m2.
The data set has at times some variables which have no value in some records and there are no missing values. In other words, some features should have no values. So, these values are replaced to resolve the problem of blank values and because the algorithms do not consider these values the same as they do missing data. In this case, a value other than the value which is defined for that feature is set for these blank values for them not to be confused with missing values. The replacement is 0.514% of records. At the end of this phase, 48,898 refined records and 33 variables were obtained for the analysis.
The next phase, the modeling, simulated the prepared data obtained from phase 3 to extract knowledge and reveal the influence of property. This phase consists of two parts (Figure 1). First, modeling and analyzing the entire data altogether. Second, clustering data and then analyzing each cluster separately (the proposed approach). In fact, the goal is to identify how the results and findings using a combining approach and without using it differ and how the differences are effective in planning and decision making for the future. The first part (phase 4.A) is described in Section 3 and the second part (phase 4.B) will be described in detail in Section 4.
The models are then assessed to choose the most efficient model. In the evaluation phase, the knowledge gained from the previous phase evaluated whether the result of data analyzing could lead to the article’s objectives or not. Also, the proposed approach’s findings will be assessed to ensure that the approach presented in phase 4.B is able to provide more accurate knowledge. These two phases are described in detail in Section 3 to Section 4.

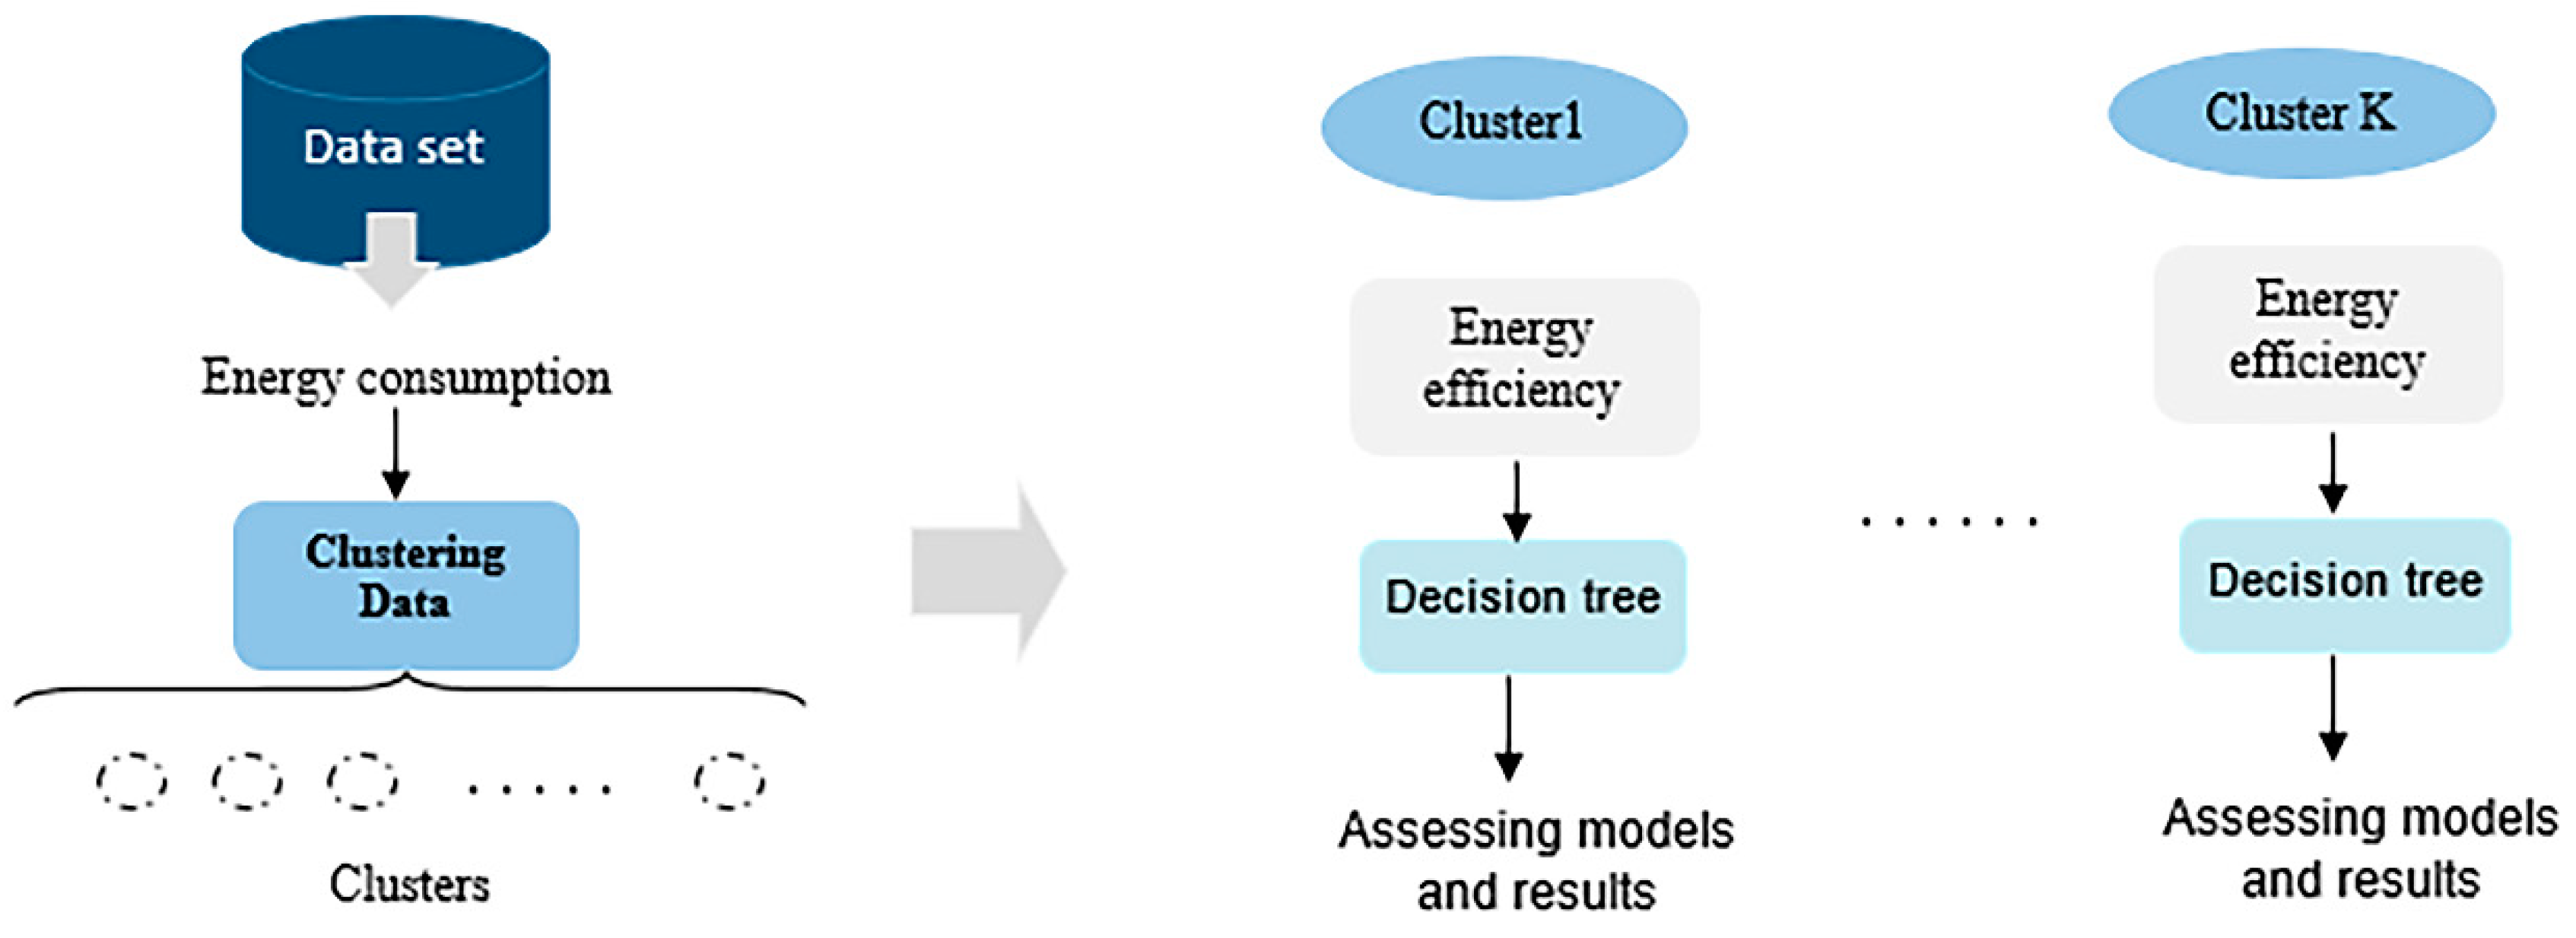
2.2. The Proposed Approach

Data mining is very powerful to discover unknowns in the absence of a prior knowledge of the data. Some minority records and their details are ignored, given that each record in the database has its unique attribute, and behavior modeling them all together causes data mining modeling and results which tend to yield a majority of records. By identifying records with similar patterns and grouping them in a cluster, and then analyzing each group separately, the results of the data mining tendency of a specific number of records, will be reduced to the minimum.
As each home has its unique attribute and property, analyzing all the data together yields a majority and some details are ignored. As shown in Figure 2, the idea is to put households with similar patterns (similar characteristics, attributes, and so on) in a cluster, and then evaluate the behavior and analyze the influential factors in each cluster separately. In this way, findings with more detail and accuracy are discovered. In fact, the article proposes a combined approach using the data mining technique with which data clustering will first be done and then each separate cluster will be modeled to identify more in depth the characteristics and factors influencing the energy efficiency.

3. Modeling and Analyzing the Energy Efficiency without the Proposed Approach

As mentioned, the purpose of the paper is to discover the factors affecting energy efficiency and consumption and also to assess the proposed approach. So, the properties are modeled once without using the approach and then using it to analyze the energy efficiency in the domestic sector. The energy efficiency rate for each record obtained from EPCs logged for dwelling. The EPCs gather information on physical characteristics of the property and the main heating fuel, and gives score based on standard assumptions about residents and behavior. Then quantifies a dwelling’s performance in terms of an efficiency rating (A the most efficient and G the less efficient). In this data set the most records’ energy efficiency band is D (42.92%) and fewer records are in band A, B (2.71%) and G (1.31%).
This section deals with modeling and assessing the impact of properties on energy efficiency without the proposed approach. The aim of using decision trees is to obtain the most effective factor target class for each case in the data. For this purpose, the C5.0 algorithm [47] is used and all the variables except energy consumption are employed as the input, the energy efficiency group being the target. It can be said that the biggest advantage of C5.0 is that it presents its classification model as a tree structure which can be easily interpreted as rules. An advanced classifier may have better accuracy in many datasets but they cannot be easily understood and visualized. Also, the C5.0 reduces the pruning errors and has the ability of feature selection [48]. In C5.0, the root node is the most important variable and the best predictor. The leaf nodes contain a class label of the classification target.
The percentage presented in the tables show Ptrgt/Prule, which are:
  • Ptrgt: Percentage of records that have the characteristics of the relevant rule and are also in the target energy efficiency group.
  • Prule: Percentage of records that have the characteristics of the relevant rule.
Table 2 includes the results of analysis using the C5.0 algorithm. In this table, the rules corresponding to the C5.0 tree branches, which have a significant difference in the percentage of the target class, are presented in no particular order. It can be said that houses, which have a large share of better energy efficiency groups ((A, B) or C) are good cases for improving energy efficiency in other homes with similar attributes.
According to the rules, some knowledge can be discovered.
  • Carefully scrutinizing the rules of rows 2 to 5, it is concluded that installing a boiler will result in better energy efficiency. Dwelling which install boilers in 2009 are in better energy efficiency group. They are followed by the boilers installed in 2005 and 2012. The homes whose boiler was installed in 2010 have not a good Energy Efficiency.
  • A comparison of rules 8 and 9 indicates that in area 1, tariffs do not yield an improved energy efficiency. Of course, this was seen among other households, but was not provided due to the low support value.
  • In the rules of rows 1, 11 and 13, the household energy efficiency group is very bad. The issue is their built year (built before 1930). Obviously, in old houses, the thermal performance and energy consumption of equipment are weak compared to new ones. In general, only 0.35% of the old homes of datasets have energy efficiency groups A and B, while nearly 52% of them are in weak energy efficiency groups (E, F, and G). But in newly-built houses (after 1996), these percentages reach 13.8% for the energy efficiency groups A and B, and only 2% for poor energy efficiency groups.
  • Rules 1, 10 and 11 refer to similar old houses that are located in different regions. Among these rules, the homes of Wales are in better condition in terms of energy efficiency.
  • Data set records are in different climate zones (Table 1) and same energy efficiency rating is not obtained with similar conditions in a cold climate zone or a warm climate zone. Region 7 has the most A, B rating (3.84%) and region 5 the least (1.99%). This difference should be referring to the buildings structure, different equipment, and surely the family lifestyle.
  • It is obvious that installing insulation on the ceiling and walls leads to a reduction of energy dissipation. Rules 12 and 13 show that an improvement in energy efficiency is achieved by installing insulation in the roof of residential buildings. Also, rules 6 and 7 state that the structure of the cavity wall is better than other structures. Policies to install new insulators in homes that do not have the proper equipment, especially among older homes, can lead to significant improvements in energy efficiency.
In general, old houses have a very bad energy efficiency. Installing proper insulation and using appropriate wall structure, also using equipment with energy efficiency grade of A or B can be effective in improving the efficiency of these homes. The installation of boilers and the non-use of electricity tariffs have led to better energy efficiency among households of this dataset. Various regions of England and Wales have more desirable homes in terms of energy efficiency than the rest.

4. Modeling and Analyzing the Energy Efficiency Using the Proposed Approach

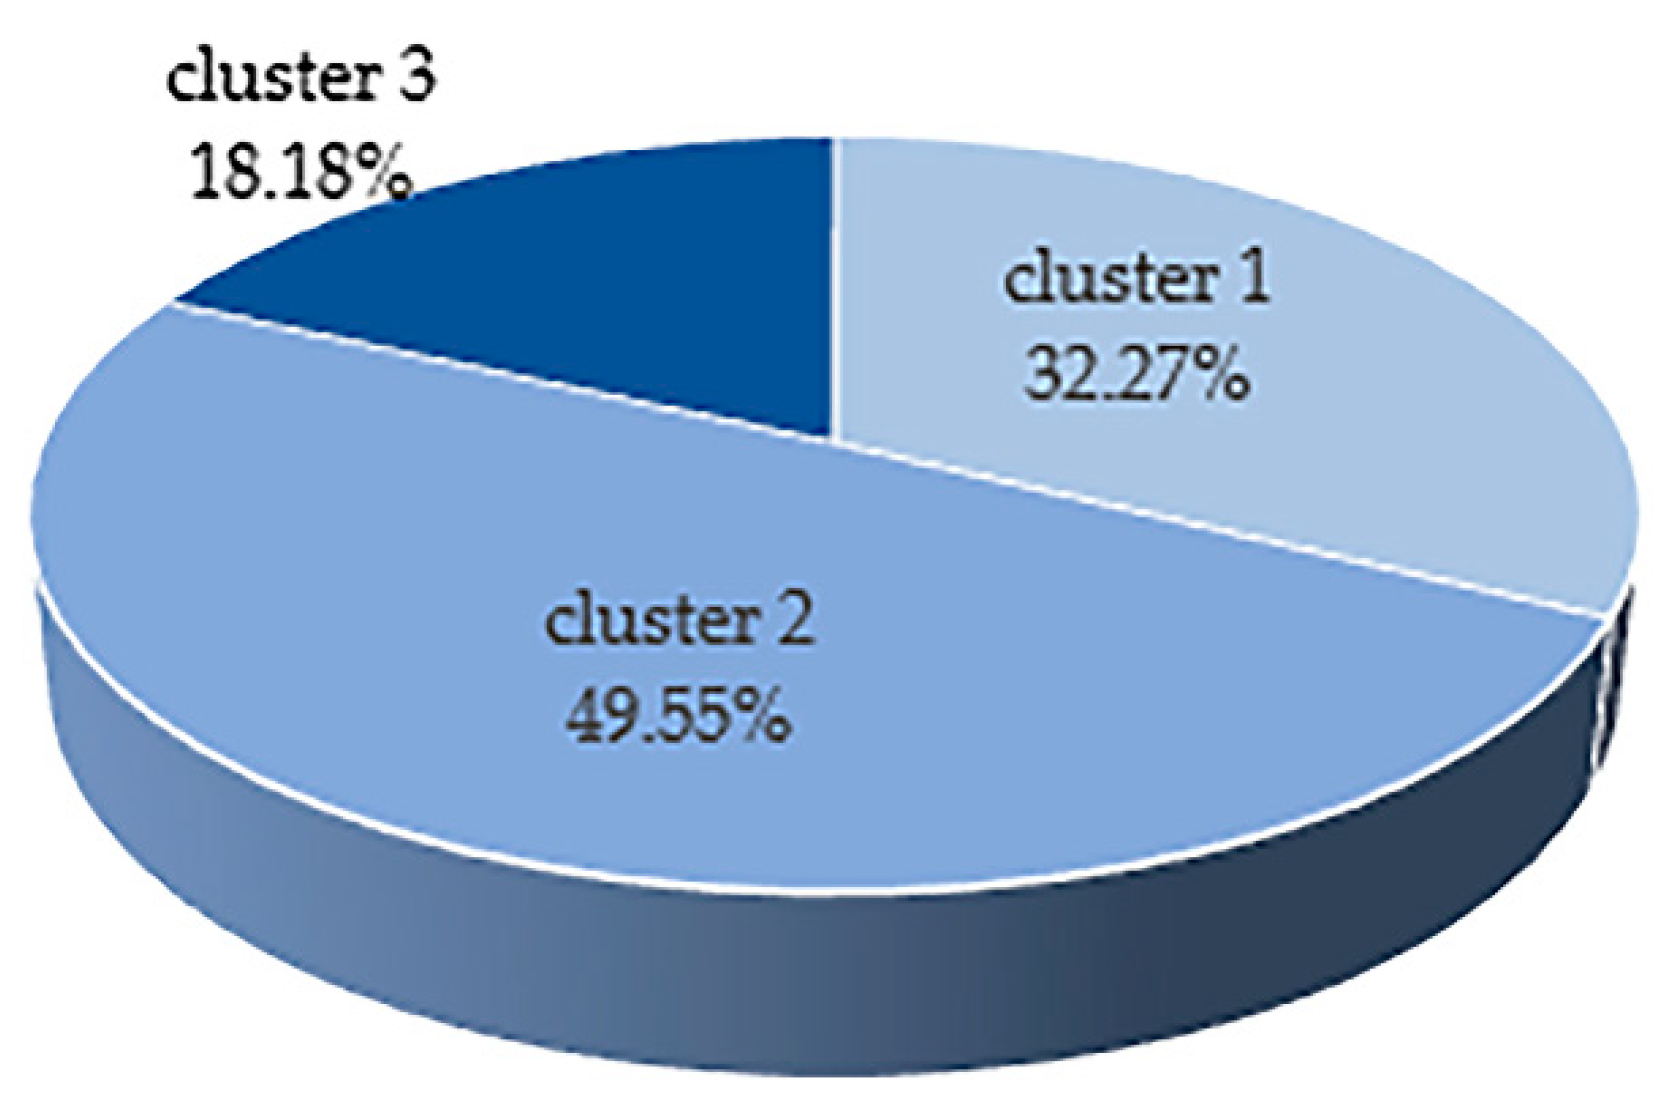
4.1. Clustering Data

Each home has different characteristics and energy consumption. Categorizing data based on the author’s opinion and the distribution of features is not very appropriate because it involves the author’s assumptions and speculation. In this type of category, the probability of error and inaccuracy increases, which is contrary to the purpose of the article, to achieve results with greater accuracy. Cluster analysis is an unsupervised learning technique which finds data that has the most similarity with each other, and also the greatest difference with other data, and places them in a group called a cluster.
Clustering algorithms have a wide range that can be named partitioning, hierarchical, density-based, and grid-based methods. The residential buildings of this article are clustered using the k-means algorithm. This algorithm is used for clustering in different data sets [49] and also in energy consumptions field for different datasets [50,51,52]. Among different indicators for estimating the optimal number of clusters [53,54], the silhouette index [55] has been selected to calculate with a different number of clusters. The silhouette has a range of −1 to 1, where 1 indicates the best matched and −1 indicates variables which are poorly matched to their cluster.
Table 3 shows the Silhouette index values of clustering data of this article. While this indicator is an important factor for clustering, it should be noted that in the real world and information retrieval, clusters must have a comprehensible interpretation (cluster labeling). So, the selection of the best number of clusters should be based on a combination of the index and the labeling. The silhouette value of 2 and 3 clusters is greater than others (Table 3), which means that these clusters have a better coherence, although these values are close together. Therefore, the appropriate value is that which has a better interpretation and labeling adequate to the cluster’s data attributes. Regarding the values of variables, in either case, three clusters have more interpretation and make a better differentiation within and between clusters. Hence, it was selected as the best number of clusters.
The three-clusters clustering results are as follows. Figure 3 indicates the size of these clusters. According to these characteristics and the average annual energy consumption of each cluster, cluster 1, cluster 2 and cluster 3 are labeled as medium-consumption, high-consumption and low-consumption clusters.
  • Cluster 1: This cluster’s homes are old (almost 68% built before 1930). Most of the households have a D label in the energy efficiency group and half of them have houses with an area of 51 m2 to 100 m2.
  • Cluster 2: 27.5% of the homes were built between 1968 and 1982. Most of the households have a D label in the energy efficiency group and 58.6% of them have houses with an area of 51 m2 to 100 m2. The households of this cluster have more energy consumption than those of the other clusters.
  • Cluster 3: Most of the households have a C label in the energy efficiency group. The cluster homes are small (59% of homes have an area less than 51 m2). In comparison to other clusters, this cluster contains more newly-built houses and these also have the lowest energy consumption.

4.2. Modeling the Energy Efficiency in Each Cluster

According to the approach presented, each cluster which includes records with the most similarity must be analyzed separately to identify factors which influence the energy efficiency group. The corresponding rules of the decision trees’ (C5.0) branches in the separate analysis of each cluster are given in Table 4. The percentage presented in the tables is explained in Section 3.
The findings of Table 4 show that:
In the Low-consumption cluster:
  • Economic tariff 7 Electricity in this cluster has also shown its impact. More than 34% of the homes that have this tariff have the D label, while more than 46% of the homes which do not use this tariff are labeled C. By comparing rules 2 and 3, it can also be concluded that the use of this tariff in small houses has a greater impact on poor energy efficiency.
  • Survey households in this cluster also state that a greater percentage of homes that do not use this electricity tariff 7 are better in energy efficiency than those using tariff 7. This different percentage in the small houses of this cluster (area less than 51 m2) is shown in Table 5.
  • Rules 4 and 5 stated that newly built houses are in good condition in terms of energy efficiency and old ones have a poor energy efficiency. The survey reveals that 36.9% of households living in newly built houses have an A or B label, and 3.28% of the old ones have a G label.
In the medium-consumption cluster:
  • Rules 6 and 8 stated that, firstly, large old houses have not a good energy efficiency. Also, they state that among these homes, the ones which use electricity tariff 7 are better off.
  • Rules 9 and 10 refer to the role of house structures in energy efficiency. So, in newly- constructed houses with a flat structure the energy efficiency groups are A and B, and other house structures have a C label.
  • In Wales, houses which have a detached structure, are old (built before 1930) and which have installed boilers have an energy efficiency group C (rule 7).
In the high-consumption cluster:
  • The good performance of boiler installation in the residential houses of this cluster is evident. In the 12th, 16th and 17th rules, the homes are not newly-built, but are located in the energy efficiency group C. The existence of a boiler in these houses, structured as mid-terrace and end-terrace, has diminished the role of the built-year.
  • A comparison of rules 11, 15 and, 18 shows that similar homes in different areas have different energy efficiencies. The study of climatic conditions shows that the groups of areas that are located in one rule are not similar in terms of temperature and have different climates. Thus, it cannot be said that just the similarity or the difference in weather has led to different energy efficiencies. However, in this cluster, households living in Wales have generally a better energy efficiency.
  • In the rules 13 and 14, newly-built houses are noted in good energy efficiency groups. It is important to say that newly-built flats have the best efficiency. In fact, the type of house structure is not ineffective in the energy performance.

5. Assessment and Deployment

5.1. Assessment

Phase 5 of the methodology measures the models evaluated in the previous sections and the accuracy of modeling. Using training and testing sets is an important step to evaluate the decision tree accuracy. The higher the accuracy of the model means that its performance is better. So, the data were divided into two groups (training and testing set). 70% of the records were taken as the training set and the remaining 30% as the testing set. In addition to accuracy, the lift criterion, which indicates the degree of correlation, was calculated for the C5.0 tree branches. If its value is greater than 1, this means a positive correlation. For all the branches presented in Table 2 and Table 4, the lift value was more than one, hence indicating a positive correlation.
As stated, the purpose of the proposed approach is to achieve results with more precision and details. Therefore, the accuracy of the models of Section 3 and Section 4 should be compared in order to assess the efficiency and effectiveness of this approach. In Table 6 the accuracy of the C5.0 tree in all the data and in each cluster is provided. As can be seen, the accuracy of modeling using the proposed approach (modeling in each cluster separately) is greater than analyzing all the data together. This means that the presented approach exposed unknown information more accurately and its tendency to a majority of records has declined.
Since this classification is of a multi-class type, the target feature (energy efficiency group) has six different modes ((A and B), C, D, E, F and G), the percentages obtained being acceptable. If the accuracy were by chance, as the target field has six different states, the accuracy of the tree would be about 17% (1/6). But Table 4 offers percentages other than this. The percentages indicate that the accuracy of the algorithm in the analysis of each cluster separately is greater than the total analysis of the data. This approach is capable of providing knowledge and discovering unknown information more accurately.
Data clustering is also evaluated through the silhouette index (Table 3). Based on the values of this index in different scenarios and the analysis of characteristics in different values of k, 3 clusters were selected as the most suitable number of clusters (mentioned in Section 4.1)

5.2. Deployment and Discussion

Leading research has been conducted to explore the factors affecting energy efficiency in residential homes. To this end, a hybrid approach was proposed to reveal findings with greater detail and accuracy. This section reviews the findings. These suggest that some were commonly found in modeling without using the proposed approach and using it. These findings are as follows.
  • In general, the installation of boilers will lead to an improved energy efficiency. Dwelling which installed boilers in 2009 have better energy efficiency than others and ones which install boiler in 2010 have the weakest performance, which is seen as an urgent need to replace or modify these boilers.
  • Most old homes suffer from unfavorable energy efficiency. This is also reflected in the proposed approach. Homes in the high-consumption cluster are older than those in the low-consumption cluster. In old houses, the appliances and structures have a poor energy efficiency performance. Therefore, planning for structural improvements, installing proper insulation and switching equipment, especially in high-consumption cluster houses, is a constructive way to improve energy efficiency.
  • Not using electricity tariffs 7 yields better energy efficiency group in most homes.
The interesting point is that the proposed approach, in addition to the results described above, could also reveal new findings. In fact, this approach offers more detailed results (Table 7). A scrutiny of the data through the proposed approach provides new findings, as follows.
  • In homes with similar attributes, not using this tariff has resulted in a better energy efficiency group. However, the electricity tariff 7 has different effects in each cluster. An analysis of the approach presented shows that in the low-consumption cluster, the energy efficiency is poor, particularly in small (less than 51 m2) and old houses which do not use this tariff.
It was especially seen in the medium-consumption cluster that big (over 151 m2) and old houses which use this tariff have a better energy efficiency.
  • The building structure influences different effects in the proposed approach. In the medium-consumption cluster, flats have a more favorable energy efficiency group than other structures, even among the newly built ones. Also, old homes which are structured as detached have a good energy efficiency group in this cluster. On the other hand, it has been seen before that old houses do not have a good energy efficiency.
In the high-consumption cluster, buildings with mid-terrace and end-terrace structures which have installed boilers belong to a better energy efficiency group.
  • In the high-consumption cluster, homes in Wales have better energy efficiency than homes with similar attributes but which are in different areas.
Table 7 shows the findings, analyzing the entire dataset and each cluster separately. New findings extracted which are obtained from the proposed approach are shown as new finding. This suggests that the approach presented can discover findings in more detail and this proves the ability and usefulness of this approach in discovering unknown information. These detailed findings can be very helpful for policy maker, architects, and engineers.

6. Conclusions

The excessive demand for energy is a major challenge for countries. Therefore, governments seek to improve energy management and efficiency to reduce energy waste. In this article, a hybrid approach based on clustering and classification proposes discovering factors affecting energy efficiency in the domestic sector.
49,815 examples of the housing stock of England and Wales were used. First, households were analyzed to identify the influence of factors using a decision tree (without using the proposed approach). Then, the proposed approach was used. The K-means algorithm yields three clusters (low-consumption, medium-consumption, and high-consumption clusters). Households in each cluster were analyzed using the C5.0 algorithm. Comparing the results and modeling accuracy, once without using the approach and then using it, showed the ability of the approach presented to identify the properties that affect energy efficiency and consumption in-depth and more accurately. The approach presented is adaptable to different data sets.
The results of not using the approach shown is that installing boilers has improved the energy efficiency, especially with respect to those that dwelling installed in 2009, followed by boilers installed in 2005 and 2012. Dwelling install boilers 2010 have the least performance. Using electricity tariff 7 results in poor efficiency. Also, in old homes the thermal equipment and energy consumption of the equipment are weak compared to newly-built houses, which results in in weaker energy efficiency. The data also showed that walls which have a cavity structure as well as insulating installation lead to improved energy efficiency. Of course, the cavity wall itself has different types, which produces comments on how these walls affect the energy efficiency. The need for information on the type of cavity wall used in the residential buildings is urgent to find out more thorough knowledge.
Besides the findings presented above, the proposed approach provides new and more detailed results. It is demonstrated that electricity tariff 7 has different behaviors in different clusters. Generally, it was seen that the use of this tariff is not good to improve energy efficiency. The approach shows that in the low-consumption cluster, old and small houses (less than 51 m2) that use this tariff have a poor energy efficiency. Also, among the old and big houses (over 151 m2) of the medium-consumption cluster using this tariff has a positive impact.
The approach shows that the home structure influences energy efficiency. In the high-consumption cluster, installing boilers in mid-terrace and end-terrace structures, and detached structures in Wales in the medium-consumption cluster, leads to better energy efficiency. In the medium-consumption cluster, it was seen that flats are better in energy efficiency than other structures, even compared to newly-built houses.
Different geographic regions also had a different behavior. The high-consumption cluster shows better energy efficiency in the houses in Wales. Definitely, having more comprehensive and adequate information of the different regions of England and Wales could extract more knowledge. The accuracy of modeling in the approach presented was better than modeling without it and detailed findings can be discovered.
Through its new and in-depth results, this approach has shown that it is capable and beneficial in the field of retrieval knowledge. These new findings demonstrate that we cannot make a similar decision for all homes. As homes in a cluster have their unique behavior, policies and decisions must be unique for them. The knowledge obtained is suitable and useful for residential buildings of similar features and nature to plan and upgrade energy efficiency, and also to improve EPCs.

Author Contributions

M.N. and A.H. proposed the idea; M.N. designed the model and the computational framework, also carried out the implementation and processed the experimental data, performed the analysis and designed the figures, interpreted the results and wrote the manuscript, performed the proofreading, discussed the results; A.H. verified the analytical methods and supervised the findings of this work, discussed the results; F.M.-Á. verified the analytical methods, discussed the proofreading, contributed in discussing the results. All authors have read and agreed to the published version of the manuscript.

Funding

This research received no external funding.

Acknowledgments

The authors thank the reviewers for their valuable suggestions for improving the manuscript. This research did not receive any specific grant from funding agencies in the public, commercial, or not-for-profit sectors.

Conflicts of Interest

The authors declare no conflict of interest.

References

  1. Han, J.; Pei, J.; Kamber, M. Data Mining Concepts and Techniques, 2nd ed.; Elsevier: Amsterdam, The Netherlands, 2006. [Google Scholar]
  2. Martínez-Álvarez, F.; Troncoso, A.; Asencio-Cortés, G.; Riquelme, J.C. A survey on data mining techniques applied to energy time series forecasting. Energies 2015, 8, 1–32. [Google Scholar] [CrossRef] [Green Version]
  3. Read, B.J. Data mining and science? Knowledge discovery in science as opposed to business. In Proceedings of the 12th ERCIM Workshop on Database Research, Amsterdam, The Netherlands, 2–3 November 1999. [Google Scholar]
  4. Yu, Z.; Fung, B.C.; Haghighat, F. Extracting knowledge from building-related data—A data mining framework. In Building Simulation; Tsinghua Press: Beijing, China, 2013; Volume 6, pp. 207–222. [Google Scholar]
  5. Watts, C.; Jentsch, M.F.; James, P.A. ‘Evaluation of domestic Energy Performance Certificates in use’. Build. Serv. Eng. Res. Technol. 2011, 32, 361–376. [Google Scholar] [CrossRef]
  6. Watson, P. An introduction to UK Energy Performance Certificates (EPCs). J. Build. Apprais. 2010, 5, 241–250. [Google Scholar] [CrossRef]
  7. Di Corso, E.; Cerquitelli, T.; Piscitelli, M.S.; Capozzoli, A. Exploring Energy Certificates of Buildings through Unsupervised Data Mining Techniques. In Proceedings of the 2017 IEEE International Conference on Internet of Things (iThings) and IEEE Green Computing and Communications (GreenCom) and IEEE Cyber, Physical and Social Computing (CPSCom) and IEEE Smart Data (SmartData), Exeter, UK, 21–23 June 2017; pp. 991–998. [Google Scholar]
  8. Pasichnyi, O.; Wallin, J.; Levihn, F.; Shahrokni, H.; Kordas, O. Energy performance certificates — New opportunities for data-enabled urban energy policy instruments? Energy Policy 2019, 127, 486–499. [Google Scholar] [CrossRef]
  9. Koo, C.; Hong, T. Development of a dynamic operational rating system in energy performance certificates for existing buildings: Geostatistical approach and data-mining technique. Appl. Energy 2015, 154, 254–270. [Google Scholar] [CrossRef]
  10. Liu, J.; Wang, J.; Li, G.; Chen, H.; Shen, L.; Xing, L. Evaluation of the energy performance of variable refrigerant flow systems using dynamic energy benchmarks based on data mining techniques. Appl. Energy 2017, 208, 522–539. [Google Scholar] [CrossRef]
  11. IEEE Industry Applications Society. Power Systems Engineering Committee. IEEE Recommended Practice for Electric Power Systems in Commercial Buildings; American National Standards Institute: New York, NY, USA, 1991. [Google Scholar]
  12. Danish, M.S.S.; Senjyu, T.; Ibrahimi, A.M.; Ahmadi, M.; Howlader, A.M. A managed framework for energy-efficient building. J. Build. Eng. 2019, 21, 120–128. [Google Scholar] [CrossRef]
  13. Yu, Z.J.; Haghighat, F.; Fung, B.C. Advances and challenges in building engineering and data mining applications for energy-efficient communities. Sustain. Cities Soc. 2016, 25, 33–38. [Google Scholar] [CrossRef] [Green Version]
  14. Yan, S.L. Influence of psychological, family and contextual factors on residential energy use behavior: An empirical study of China. Energy Procedia 2011, 5, 910–915. [Google Scholar] [CrossRef] [Green Version]
  15. Fan, H.; MacGill, I.F.; Sproul, A.B. Statistical analysis of driving factors of residential energy demand in the greater Sydney region, Australia. Energy Build. 2015, 105, 9–25. [Google Scholar] [CrossRef]
  16. Naji, S.S. Application of adaptive neuro-fuzzy methodology for estimating building energy consumption. Renew. Sustain. Energy Rev. 2016, 53, 1520–1528. [Google Scholar] [CrossRef]
  17. Pérez-Chacón, R.; Luna, J.M.; Troncoso, A.; Martínez-Álvarez, F.; Riquelme, J.C. Big data analytics for discovering electricity consumption patterns in smart cities. Energies 2018, 11, 683. [Google Scholar] [CrossRef] [Green Version]
  18. Kao, Y.T.; Zahara, E.; Kao, I.W. A hybridized approach to data clustering. Expert Syst. Appl. 2008, 34, 1754–1762. [Google Scholar] [CrossRef]
  19. Niknam, T.; Amiri, B.; Olamaei, J.; Arefi, A. An efficient hybrid evolutionary optimization algorithm based on PSO and SA for clustering. J. Zhejiang Univ. A 2009, 10, 512–519. [Google Scholar] [CrossRef]
  20. Fathian, M.; Amiri, B. A honey-bee mating approach on clustering. Int. J. Adv. Manuf. Technol. 2007, 38, 809–821. [Google Scholar] [CrossRef]
  21. Laszlo, M.; Mukherjee, S. A genetic algorithm that exchanges neighboring centers for k-means clustering. Pattern Recognit. Lett. 2007, 28, 2359–2366. [Google Scholar] [CrossRef]
  22. Capozzoli, A.G. Discovering knowledge from a residential building stock through data mining analysis for engineering sustainability. Energy Procedia 2015, 83, 370–379. [Google Scholar] [CrossRef] [Green Version]
  23. Heidarinejad, M.D. Cluster analysis of simulated energy use for LEED certified U.S. office buildings. Energy Build. 2014, 85, 86–97. [Google Scholar] [CrossRef] [Green Version]
  24. Capozzoli, A.; Serale, G.; Piscitelli, M.S.; Grassi, D. Data Mining for Energy Analysis of a Large Data Set of Flats; Thomas Telford Ltd.: London, UK, 2017. [Google Scholar]
  25. Raatikainena, M.S.-P. Intelligent analysis of energy consumption in school buildings. Appl. Energy 2016, 165, 416–429. [Google Scholar] [CrossRef]
  26. Jalali Sepehr, M.; Haeri, A.; Ghousi, R. A cross-country evaluation of energy efficiency from the sustainable development perspective. Int. J. Energy Sector Manag. 2019, 13, 991–1019. [Google Scholar] [CrossRef]
  27. Bienvenido-Huertas, D.; Oliveira, M.; Rubio-Bellido, C.; Marín, D. A Comparative Analysis of the International Regulation of Thermal Properties in Building Envelope. Sustainability 2019, 11, 5574. [Google Scholar] [CrossRef] [Green Version]
  28. Haeri, A.; Rezaie, K. An approach to evaluate resource utilization in energy management systems. Energy Sources Part B 2016, 11, 855–860. [Google Scholar] [CrossRef]
  29. Haeri, A. Proposing a quantitative approach to measure the success of energy management systems in accordance with ISO 50001: 2011 using an analytical hierarchy process (AHP). Energy Equip. Syst. 2017, 5, 349–355. [Google Scholar] [CrossRef]
  30. Haeri, A.; Jafari, M.; Danesh Asgari, S. A new approach for performance evaluation of energy-related enterprises. Energy Equip. Syst. 2018, 6, 16–26. [Google Scholar] [CrossRef]
  31. Santamouris, M.; Mihalakakou, G.; Patargias, P.; Gaitani, N.; Sfakianaki, K.; Papaglastra, M.; Pavlou, C.; Doukas, P.; Primikiri, E.; Geros, V. Using intelligent clustering techniques to classify the energy performance of school building. Energy Build. 2007, 39, 45–51. [Google Scholar] [CrossRef]
  32. Haeri, A. Identification and assessment of training needs for employees of wind farms’. Energy Equip. Syst. 2017, 5, 189–196. [Google Scholar] [CrossRef]
  33. Huang, M.-J.; Sung, H.-S.; Hsieh, T.-J.; Wu, M.-C.; Chung, S.-H. Applying data-mining techniques for discovering association rules. Soft Comput. 2019, 24, 8069–8075. [Google Scholar] [CrossRef]
  34. Zhang, C.; Xue, X.; Zhao, Y.; Zhang, X.; Li, T. An improved association rule mining-based method for revealing operational problems of building heating, ventilation and air conditioning (HVAC) systems. Appl. Energy 2019, 253, 113492. [Google Scholar] [CrossRef]
  35. Li, G.; Hu, Y.; Chen, H.; Li, H.; Hu, M.; Guo, Y.; Liu, J.; Sun, S.; Sun, M. Data partitioning and association mining for identifying VRF energy consumption patterns under various part loads and refrigerant charge conditions. Appl. Energy 2017, 185, 846–861. [Google Scholar] [CrossRef]
  36. Fan, C.; Xiao, F. Mining Gradual Patterns in Big Building Operational Data for Building Energy Efficiency Enhancement. Energy Procedia 2017, 143, 119–124. [Google Scholar] [CrossRef]
  37. Yu, Z.; Jerry, H.F. A novel methodology for knowledge discovery through mining associations between building operational data. Energy Build. 2012, 47, 430–440. [Google Scholar] [CrossRef]
  38. Rathod, R.R.; Garg, R.D. Regional electricity consumption analysis for consumers using data mining techniques and consumer meter reading data. Electr. Power Energy Syst. 2016, 78, 368–374. [Google Scholar] [CrossRef]
  39. Li, J.; Panchabikesan, K.; Yu, Z.; Haghighat, F.; Mankibi, M.; Corgier, D. Systematic data mining-based framework to discover potential energy waste patterns in residential buildings. Energy Build. 2019, 199, 562–578. [Google Scholar] [CrossRef]
  40. Moslehi, F.; Haeri, A. A Genetic Algorithm based framework for mining quantitative association rules without specifying minimum support and minimum confidence. Sci. Iran. 2019. [Google Scholar] [CrossRef] [Green Version]
  41. Moslehi, F.; Haeri, A.; Martínez-Álvarez, F. A novel hybrid GA–PSO framework for mining quantitative association rules. Soft Comput. 2019, 24, 4645–4666. [Google Scholar] [CrossRef]
  42. Shafique, U.; Qaiser, H. A comparative study of data mining process models (KDD, CRISP-DM and SEMMA). Int. J. Innov. Sci. Res. 2014, 12, 217–222. [Google Scholar]
  43. Wirth, R.; Hipp, J. CRISP-DM: Towards a standard process model for data mining. In Proceedings of the 4th International Conference on the Practical Applications of Knowledge Discovery and Data Mining, Manchester, UK, 11–13 April 2000. [Google Scholar]
  44. IBM SPSS Modeler-Data Mining, Text Mining, Predictive Analysis. Available online: http://www.spss.com.hk/software/modeler/ (accessed on 22 March 2020).
  45. SPSS Predictive Analytics. Announcing IBM SPSS Modeler 18 - SPSS Predictive Analytics. 2016. Available online: https://developer.ibm.com/predictiveanalytics/2016/03/15/announcing-ibm-spss-modeler-18/ (accessed on 18 May 2020).
  46. National Energy Efficiency Data-Framework (NEED): Anonymised Data 2014. Available online: https://www.gov.uk/government/statistics/national-energy-efficiency-data-framework-need-anonymised-data-2014 (accessed on 18 May 2020).
  47. Quinlan, J.R. Induction of decision trees. Mach. Learn. 1986, 1, 81–106. [Google Scholar] [CrossRef] [Green Version]
  48. Pandya, R.; Pandya, J. C5.0 algorithm to improved decision tree with feature selection and reduced error pruning. Int. J. Comput. Appl. 2015, 117, 18–21. [Google Scholar]
  49. Moslehi, F.; Haeri, A.; Gholamian, M. A novel selective clustering framework for appropriate labeling of the clusters based on K-means algorithm. Sci. Iran. 2019. [Google Scholar] [CrossRef] [Green Version]
  50. Gaitani, C.L. Using principal component and cluster analysis in the heating evaluation of the school building sector. Appl. Energy 2010, 87, 2079–2086. [Google Scholar] [CrossRef]
  51. Hsu, D. Characterizing Energy Use in New York City Commercial and Multifamily Buildings; ACEEE Summer Study on Energy Efficient in Buildings: Pacific Grove, CA, USA, 2012. [Google Scholar]
  52. Xiao, Q.W.H. The reality and statistical distribution of energy consumption in office buildings in China. Energy Build. 2012, 50, 259–265. [Google Scholar] [CrossRef]
  53. Dunn, J.C. A Fuzzy Relative of the ISODATA Process and Its Use in Detecting Compact Well-Separated Clusters; Taylor & Francis: Abingdon, UK, 1973. [Google Scholar]
  54. Davies, D.L.; Bouldin, D.W. A cluster separation measure. IEEE Trans. Pattern Anal. Mach. Intell. 1979, 2, 224–227. [Google Scholar] [CrossRef]
  55. Rousseeuw, P.J. Silhouettes: A graphical aid to the interpretation and validation of cluster analysis. J. Comput. Appl. Math. 1987, 20, 53–65. [Google Scholar] [CrossRef] [Green Version]
Figure 1. The methodology used—an overview.
Applsci 10 03589 g001
Figure 2. An overview of the proposed approach.
Applsci 10 03589 g002
Figure 3. Size of clusters.
Applsci 10 03589 g003
Table 1. Of variables.
VariableValueDescription
HH_ID1 to 49815Household identifier.
REGION(E12000001) North-East
(E12000002) North-West
(E12000003) Yorkshire and the Humber
(E12000004) Mid-East
(E12000005) Mid-West
(E12000006) East England
(E12000007) London
(E12000008) South-East
(E12000009) South-West
(W999999999) Wales
Former Government Office Regions (GORs) in England, and Wales.
IMD_ENG1 to 5Index of multiple deprivations 2010 for England. Households are allocated to five groups. (1) The least deprived and (5) the most deprived.
IMD_WALES1 to 5Welsh Index of multiple deprivations 2011. This has five groups. (1) The most deprived and (5) the least deprived.
GconsYEAR Annual gas consumption based on kWh.
GconsYEARValid Flag of households’ gas consumption.
Valid gas consumption (V), households off the gas network (O) and invalid consumption.
EconsYEAR Annual electricity consumption based on kWh.
EconsYEARValid Flag indicating households with a valid electricity consumption.
E7Flag2012(1) Households with Economy 7 electricity meters in 2012.
(0) Households without Economy 7 electricity meters in 2012.
Economy 7 electricity meters.
MAIN_HEAT_FUEL(1) gas
(2) other
Main heating fuel.
PROP_AGE(1) before 1930
(2) 1930 to 1949
(3) 1950 to 1966
(4) 1967 to 1982
(5) 1983 to 1995
(6) after 1996
Age of property construction.
PROP_TYPE(1) detached
(2) semi-detached
(3) end-terrace
(4) mid-terrace
(5) bungalow
(6) flat
Type of property.
FLOOR_AREA_BAND(1) less than 50 m2
(2) 51 m2 to 100 m2
(3) 101 m2 to 150 m2
(4) more than 150 m2
Floor area band.
EE_BAND(1) A and B
(2) C
(3) D
(4) E
(5) F
(6) G
Energy Efficiency Band.
(Six groups: A and B grouped).
LOFT_DEPTH(1) less than 150 mm
(2) 150 mm or more
Loft insulation depth.
WALL_CONS(1) other
(2) cavity wall
Wall construction.
CWI(0) no
(1) yes
Cavity wall insulation installed or not.
CWI_YEAR Year of installation of cavity wall insulation.
LI(0) no
(1) yes
Loft insulation installed or not.
LI_YEAR Year of installation of loft insulation
BOILER(0) no
(1) yes
Boiler installed in property or not.
BOILER_YEAR Year of installation of the boiler.
Table 2. The corresponding rules of the C5.0 tree (considering energy efficiency as the target).
RowRuleResult
(Energy Efficiency)
Percentage
1The built year is before 1930 and the home structure is semi-detached, has cavity walls, an insulation depth less than 150 mm and uses economy 7 electricity meters.G75%
2The home area is 51 m2 to 100 m2 and has a mid-terrace structure. The built year is 1966 and 1982, the home has cavity walls and its boiler was installed in 2009.C100%
3The home area is 51 m2 to 100 m2 and has a mid-terrace structure. The built-year is 1966 and 1982, the home has cavity walls and its boiler was installed in 2010.F100%
4The home area is 51 m2 to 100 m2 and has a mid-terrace structure. The built-year is 1966 and 1982, the home has cavity walls and its boiler was installed in 2006 or 2011.D80%
5The home area is 51 m2 to 100 m2 and has a mid-terrace structure. The built year is 1966 and 1982, the home has cavity walls and its boiler was installed in 2005 or 2012.E71.50%
6The region is 4 and the built year is 1930 to 1949, the home structure is a flat and which has cavity walls.C100%
7The region is 4 and the built year is 1930 to 1949, the home structure is a flat and it does not have cavity walls.D66.70%
8The region is 1 and the home structure is semi-detached, and the built year is after 1966. The homes have not installed wall insulation, and they use economy 7 electricity meters.D100%
9The region is 1 and the home structure is semi-detached, and the built year is after 1966. The homes have not installed wall insulation, and they do not use economy 7 electricity meters.C66.80%
10The houses are in Wales and their built-year is before 1930, the home structure is semi-detached and does not have cavity walls, their insulation depth is less than 150 mm, and a boiler has been installed.C100%
11The region is 1 and the built year is before 1930, the home structure is semi-detached, and does not have cavity walls, and a boiler has been installed and their insulation depth is less than 150 mmF100%
12The region is 3 and the built-year is before 1930, the home structure is semi-detached, and does not have cavity walls, the home’s boiler was installed in 2009 and loft insulation was used.D100%
13The region is 3 and the built-year is before 1930, the home structure is semi-detached, and does not have cavity walls, the home’s boiler was installed in 2009 and loft insulation was not used.E66.80%
Table 3. Silhouette index values.
Number of ClustersSilhouette Index Value
20.243
30.239
40.189
50.195
60.155
70.155
80.166
90.158
100.179
Table 4. The corresponding rules of the C5.0 tree in each cluster separately.
Cluster
Label
RowRuleResult
(Energy Efficiency)
Percentage
Low-consumption cluster1The home structure is a bungalow and uses economy 7 electricity meters and has installed a boiler.D80%
2The home structure is mid-terrace and the built-year is between 1950 and 1966, the floor area is less than 51 m2 and it uses economy 7 electricity meters. F75%
3The home is in region 2 and the floor area is between 51 m2 and 100 m2, the built-year is between 1950 and 1966 and it uses economy 7 electricity meters.D71.50%
4The home structure is detached houses built before 1930.G66.70%
5Homes built after 1996, having cavity walls, and whose floor area is between 51 m2 to 100 m2 and which do not use economy 7 electricity meters.A and B54.90%
Medium-consumption cluster6The home structure is detached and was built before 1930, does not have a cavity wall, and the floor area is more than 151 m2, it uses economy 7 electricity meters.E100%
7The region is Wales, and the home structure is semi-detached and built before 1930 and has a boiler installed.C100%
8The home structure is detached and built before 1930 and does not have a cavity wall, the floor area is more than 151 m2 and it does not use economy 7 electricity meters.F80%
9The home structure is a flat built after 1996, does not have a cavity wall and does not use economy 7 electricity meters.A and B67.90%
10The home structure is detached, semi-detached, mid-terrace, and end-terrace, built after 1996, does not have a cavity wall and does not use economy 7 electricity meters.C65.70%
High-consumption cluster11The home structure is detached and the region is Wales and it was built between 1983 and 1995, a boiler was installed in 2010 and the home does not use economy 7 electricity meters.A and B100%
12The home structure is detached and the region is Wales and it was built between 1983 and 1995, a boiler was installed in 2010 and the home uses economy 7 electricity meters.D100%
13The home structure is a flat, built after 1996 and the floor area is between 51 m2 and 100 m2.A and B100%
14Houses built after 1996, and the structure is mid-terrace.C81.40%
15The home structure is detached and the region is 4, 5 and 9, it was built in 1983 to1995, a boiler was installed in 2010 and it does not use economy 7 electricity meters.C80%
16The home structure is mid-terrace, it was built between 1983 and 1995 and has a boiler installed.C78.80%
17Houses built after 1996; the structure is semi-detached.C72.50%
18The home structure is mid-terrace, it was built between 1966 and 1982 and has boilers installed.C72.20%
Table 5. The percentages of homes located in different energy efficiency groups.
Household CharacteristicEnergy Efficiency Group
A, BCDEFG
The small homes which have tariff 76.92%40.34%32.54%13.51%5.47%1.50%
The small homes which do not have tariff 712.74%51.23%26.51%6.73%2.23%0.68%
Table 6. Accuracy of the C5.0 Algorithm in the entire data and also in each cluster.
Input DataThe C5.0 Accuracy
All the data54.4%
Cluster 1 (medium-consumption)51.5%
Cluster 2 (high-consumption)57.83%
Cluster 3 (low-consumption)69.3%
Table 7. Assessing the results of the proposed approach.
Evaluated DataFindings and Results
All Data (without using the approach)Installing boilers lead to better performance.Old homes (built before 1930) suffer from unfavorable energy efficiency.
Old homes in Wales have better energy efficiency.
Not using tariff 7 leads to better energy efficiency.Improving energy efficiency is achieved by installing insulation in the roof of residential buildings.
Low-consumption cluster Not using tariff 7 leads to better energy efficiency.
Using the tariff leads to poor energy efficiency in small and old houses (less than 51 m2).
(new finding)
Medium-consumption cluster Flats have a more favorable energy efficiency; even newly-built flats.
(new finding)
Old homes in Wales which have a detached structure, and have installed boilers have a good energy efficiency.
(new finding)
Using this tariff leads to a better energy efficiency in big (over 151 m2) and old houses.
(new finding)
High-consumption clusterInstalling boilers leads to a better energy efficiency.
In mid-terrace and end-terrace structures, boilers lead to better energy efficiency.
(new finding)
The newly constructed flats have the best efficiency.
(new finding)
Households living in Wales have better energy efficiency.
(new finding)

