Three-Dimensional Numerical Investigation on the Efficiency of Subsurface Drainage for Large-Scale Landslides


1
Department of Soil and Water Conservation, National Chung Hsing University, Taichung 40227, Taiwan
2
Center of Excellence for Ocean Engineering, National Taiwan Ocean University, Keelung 20224, Taiwan
3
Department of Civil Engineering, National Chung Hsing University, Taichung 40227, Taiwan
*
Authors to whom correspondence should be addressed.
Appl. Sci. 2020, 10(10), 3346; https://doi.org/10.3390/app10103346
Submission received: 20 April 2020
/
Revised: 2 May 2020
/
Accepted: 9 May 2020
/
Published: 12 May 2020
(This article belongs to the Special Issue Exploration and Sustainable Management of Groundwater Resources in Geologically Complex Terrain)
Abstract
:This paper presents a field monitoring study with emphasis on the design and construction of a subsurface drainage system and evaluation of its stabilization efficiency on the slope of You-Ye-Lin landslide using a three-dimensional finite element method program (Plaxis 3D) for the groundwater flow and slope stability analyses. The subsurface drainage system consists of two 4-m diameter drainage wells with multi-level horizontal drains and was installed to draw down the groundwater level and stabilize the unstable slope of the landslide. Results demonstrate that the subsurface drainage system is functional and capable of accelerating the drainage of the infiltrated rainwater during torrential rainfalls during the typhoon season. The large groundwater drawdown by the subsurface drainage system protects the slopes from further deterioration and maintains the slope stability at an acceptable and satisfactory level.
1. Introduction
The You-Ye-Lin landslide, a large scale landslide in a mountainous area of Taiwan, has a long history of intermittent large downslope ground movements during rainfall periods since Typhoon Morakot in 2008. To prevent the expansion and deterioration of the landslide, systematic field investigations, engineering designs, and emergency countermeasures for the slope stabilization have been implemented by public agencies and remain underway to date. The main remediation work for the You-Ye-Lin landslide is to lower the groundwater level through a deep subsurface drainage system composed of two drainage wells (a well shaft equipped with multi-level horizontal drains).
For subsurface drainage, the effectiveness of horizontal drains on lowering the groundwater level and improving the slope stability is closely related to the drainage length, spacing, number, and installation location [1,2,3,4,5]. The function and the effect of horizontal drains on the groundwater drawdown and the slope stabilization mechanism have also been investigated by several researchers using numerical methods [6,7,8,9,10,11,12]. Cai et al. concluded that lengthening a group of horizontal drains is more effective than shortening the spacing and increasing the number of a group of horizontal drains [6]. Rahardjo et al. found that the main benefit of using horizontal drains is lowering the groundwater table and the drains located at the bottom of the slope contribute the most [7,8,9]. Eberhardt et al. strongly suggested that a deep drainage system (a drainage gallery with sub-vertical drains) is the key measure to successfully stabilize large landslides [10]. Furthermore, the potential effect of sub-vertical drains drilled from drainage gallerys on slope stabilization has also been studied in large landslides using 3D numerical models [11,12]. Lin et al. demonstrated that a subsurface drainage system in a large landslide is capable of accelerating the drainage of the infiltrated rainwater induced from a high intensity and long duration rainfall during the typhoon season and protects the slope from a fast deterioration [13,14].
However, the parallel configuration of horizontal drains in previous studies was shallow and simple compared to the configuration of horizontal drains in the You-Ye-Lin landslide where the horizontal drains are installed on the drainage wells in a multi-level and fan-shape configuration. In particular, although a large number of drainage wells have been constructed to improve the stability of large scale landslides in Taiwan, none of their effects on the groundwater drawdown and the slope stabilization mechanism have ever been cautiously inspected up-to-date. In this study, the efficiency of the subsurface drainage system installed in the You-Ye-Lin landside is evaluated. Using monitoring data and numerical techniques, this study aims at proposing a practical and operative three-dimensional (3D) evaluation method to quantify the drainage efficiency of horizontal drains in response to the torrential rainfall during the typhoon season. In this method, the groundwater level variation evaluated using the complicated rainfall induced seepage analysis in the unsaturated soil is replaced by the monitoring groundwater level data.
2. You-Ye-Lin landslide
2.1. Location of the Landslide
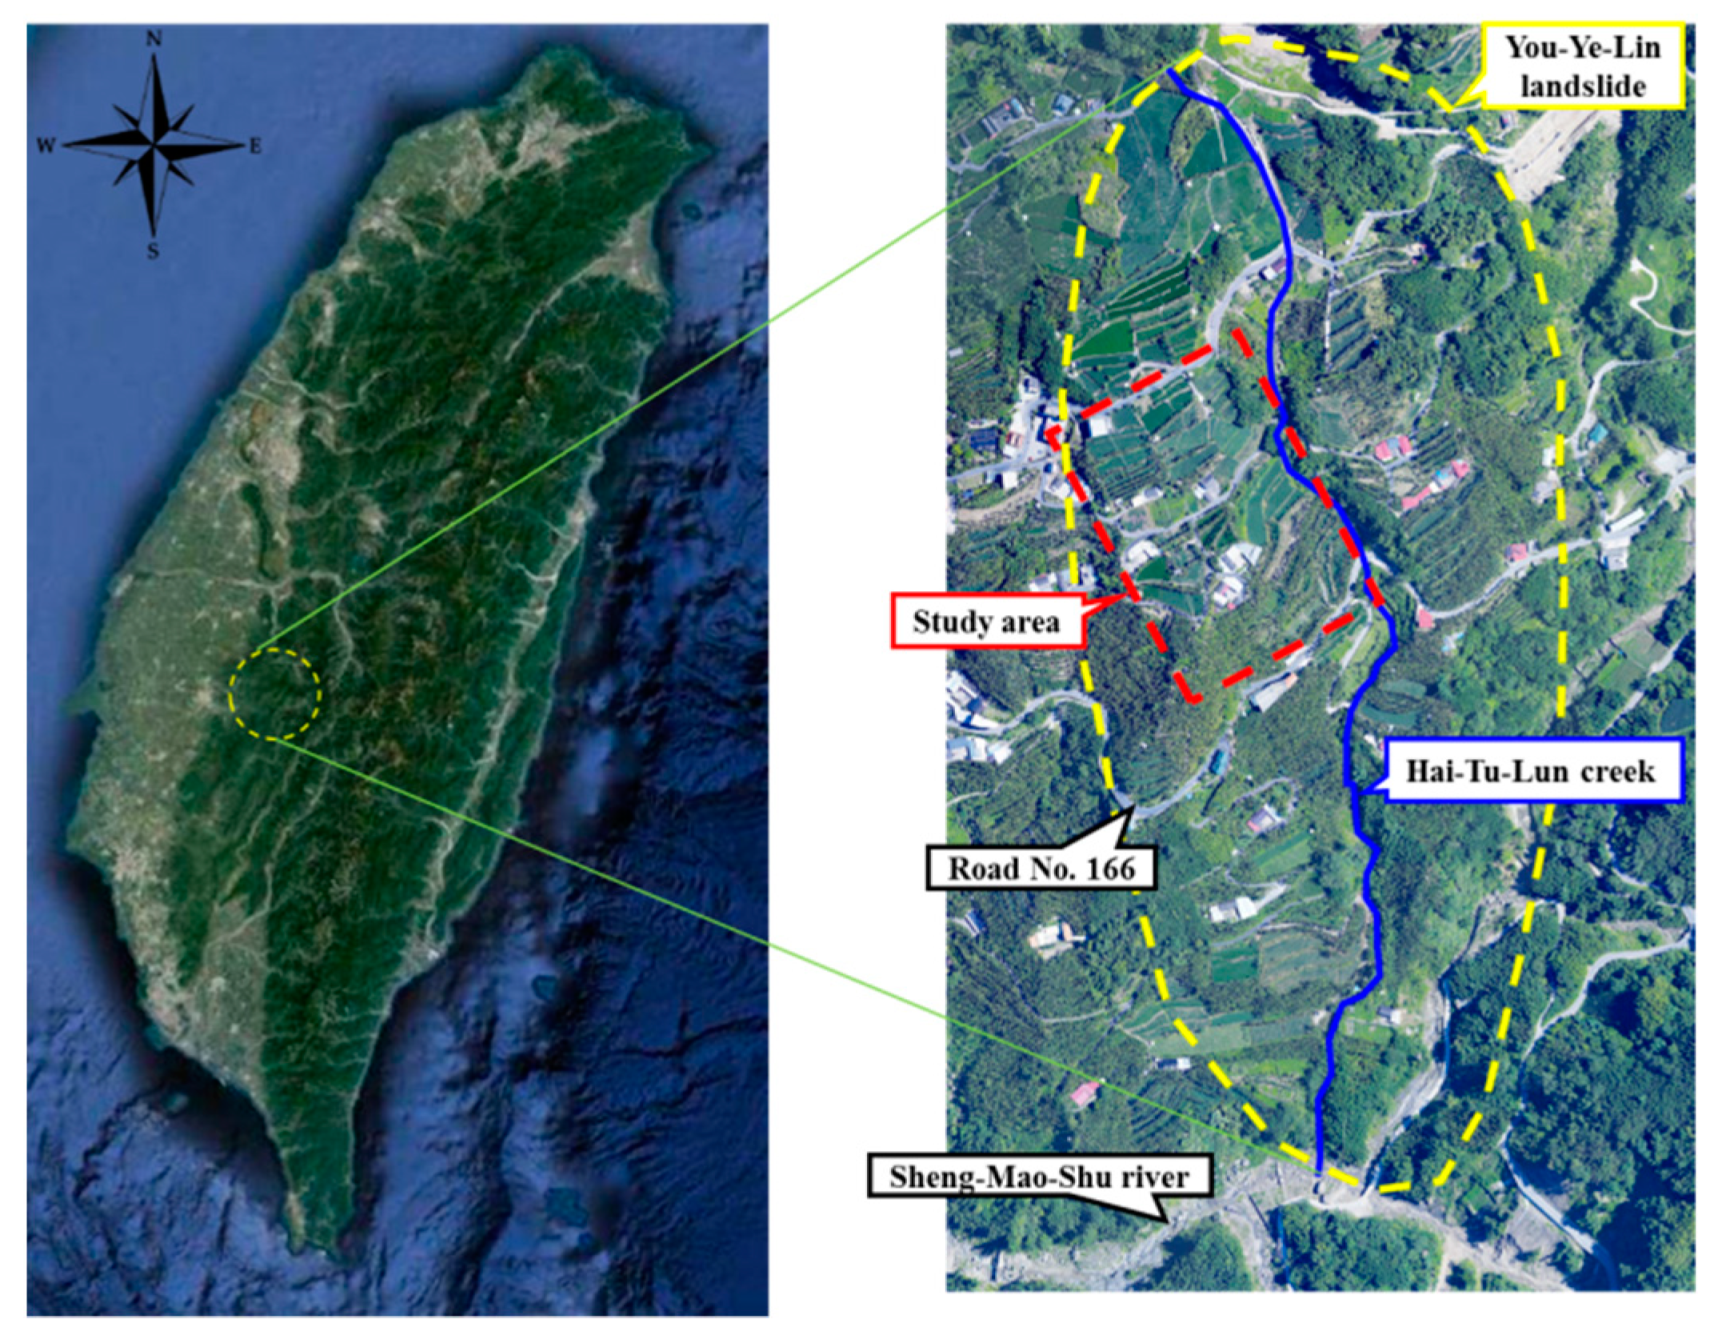
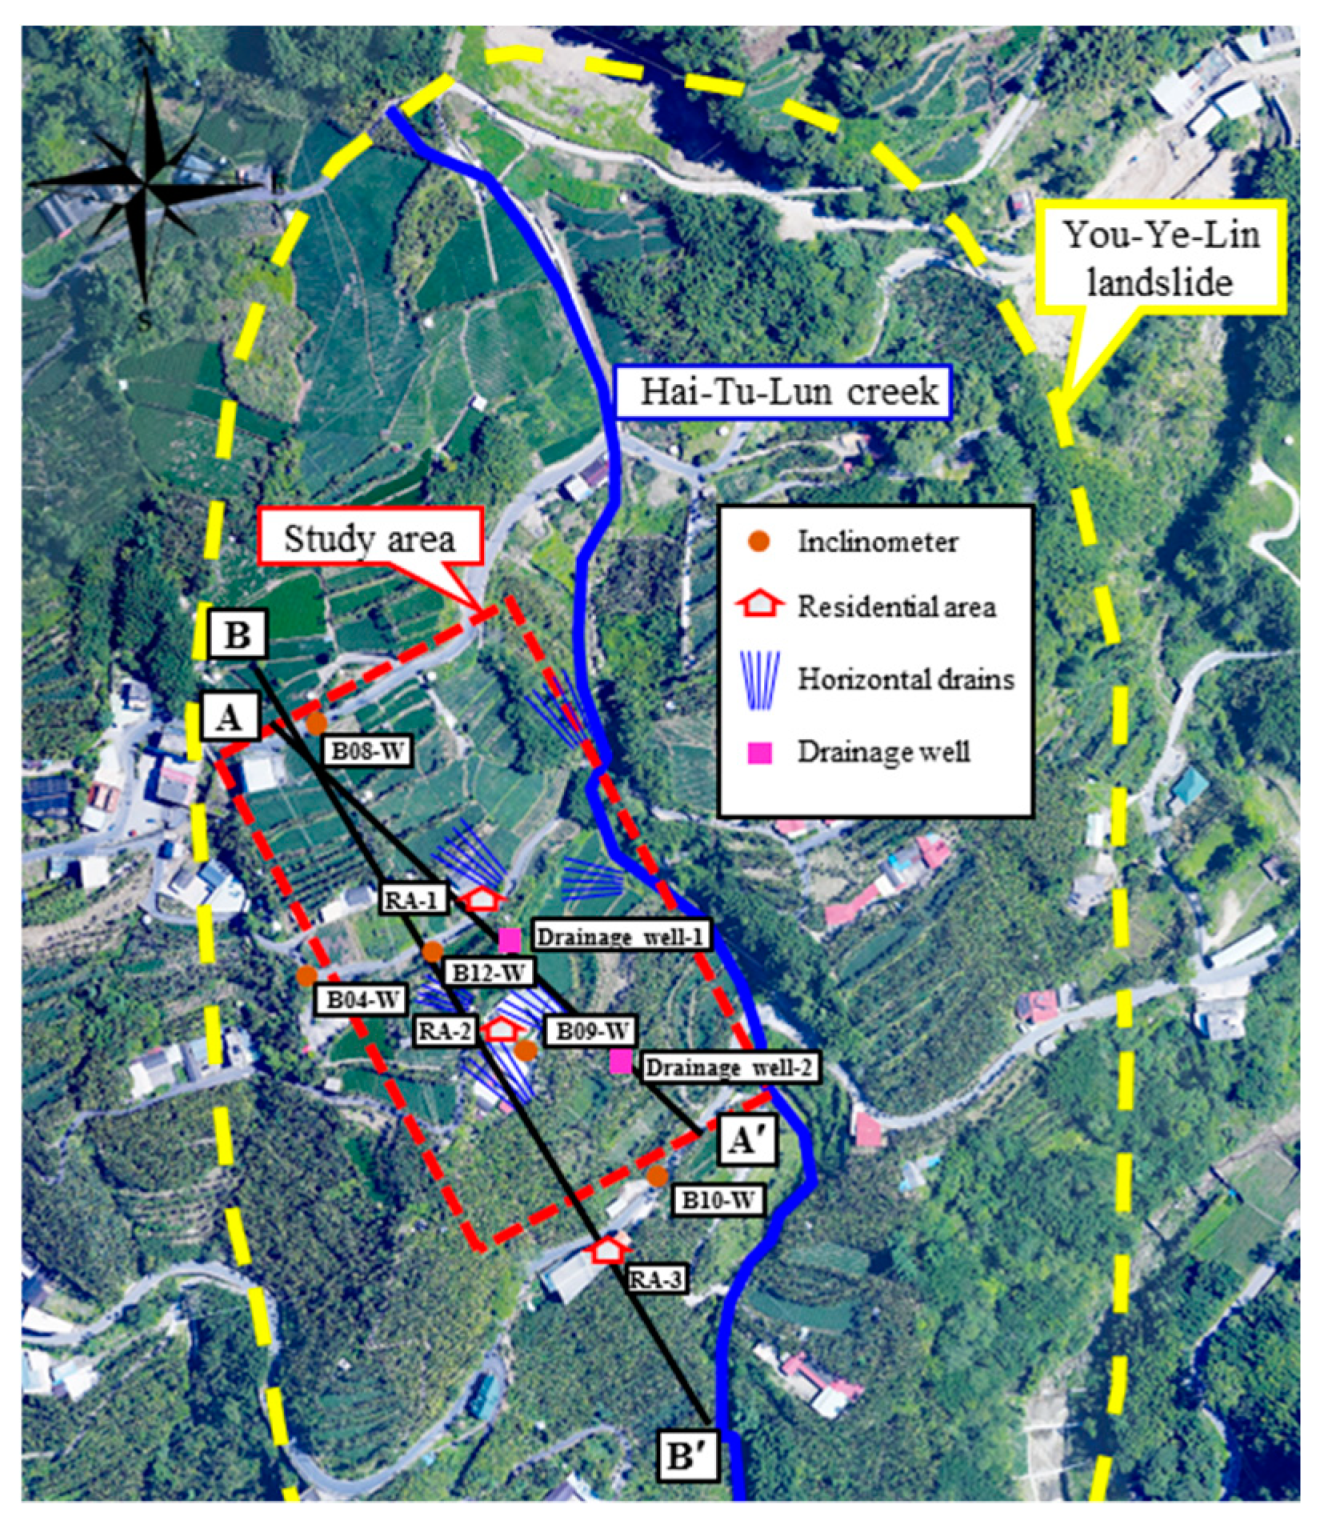
As shown in Figure 1, the You-Ye-Lin landslide is located in Chai-Yi County and covers an area of around 40 hectares. The main transportation route in this area is the county road Route-No. 166. The main business activities in this area are tea manufacture, bamboo shoot processing and tourism. The torrential rainfall during Typhoon Morakot (08/08–08/09) in 2008 triggered a massive landslide which endangered the safety of residential houses, agricultural crops and the transportation system. According to the long-term monitoring data and the distribution of residential areas, the study area of the You-Ye-Lin landslide selected for further investigation and advanced analysis is delineated in Figure 1.
2.2. Climate, Topography and Geology of the Landslide
The average temperature in You-Ye-Lin landslide area is about 23.0 °C. The annual average rainfall approximates 3050 mm and the annual average number of rainy days is 166 based on the rainfall records from 2003 to 2016. Most of the precipitation falls during summer (from May to September). From October to the following March, the weather turns into a dry season and the plum rain season starts from the end of May to the beginning of June.
The terrain of the landslide is wavy with a small flat ground area. The landslide area descends from north to south between the elevation of 820 m and 1110 m with an average elevation of 1000 m. The slope S (%) or slope angle β (degree°) of the landslide area varies from grade-3 (15% < S ≦ 30% or 8.53° < β ≦ 16.70°) to grade-6 (55% < S ≦ 100% or 28.81° < β ≦ 45°) and most of the landslide is at grade-5 (40% < S ≦ 55% or 21.80° < β ≦ 28.81°). The landslide area can be delineated in the watershed of the Shen-Mao-Shu River which flows through the southern valley of the landslide area (refer to Figure 1). The slope of the valley is steep, with well-developed ditch shape erosion gullies which are liable to collapse. Meanwhile, because of severe longitudinal and transverse erosions of the channel bed of Shen-Mao-Shu River, the slopes within the watershed become very unstable during the typhoon season. In addition, Hai-Tu-Lun Creek which flows through the landslide area from north to south cuts the landslide area into eastern and western topographic blocks (refer to Figure 1).
Due to the watershed boundaries formed by the eastern and western mountain ridges of Hai-Tu-Lun Creek, the run-off of watershed is collected into Hai-Tu-Lun Creek and drains southward into the Shen-Mao-Shu River. The removal of the slope toe of Hai-Tu-Lun Creek due to severe bank erosion may lead to a slope failure. This failure mechanism is verified by the wide spreading of scarps and tension cracks at the creek banks. Moreover, the construction disturbance of the county road Route-No. 166, which crosses through the entire hillside of You-Ye-Lin landslide, frequently triggers slope failures in the typhoon season. The sliding soil mass of You-Ye-Lin landslide can be conjectured as ancient colluviums underlain by the bedrock. The colluviums slide downward along the interface with the underlain sandstone because the soil mass absorbs the rainwater and increases the self-weight. After the inspection, there seems no indication that the sliding plane extends into the bedrock and as a consequence the ground movement is only within the uppermost colluviums.
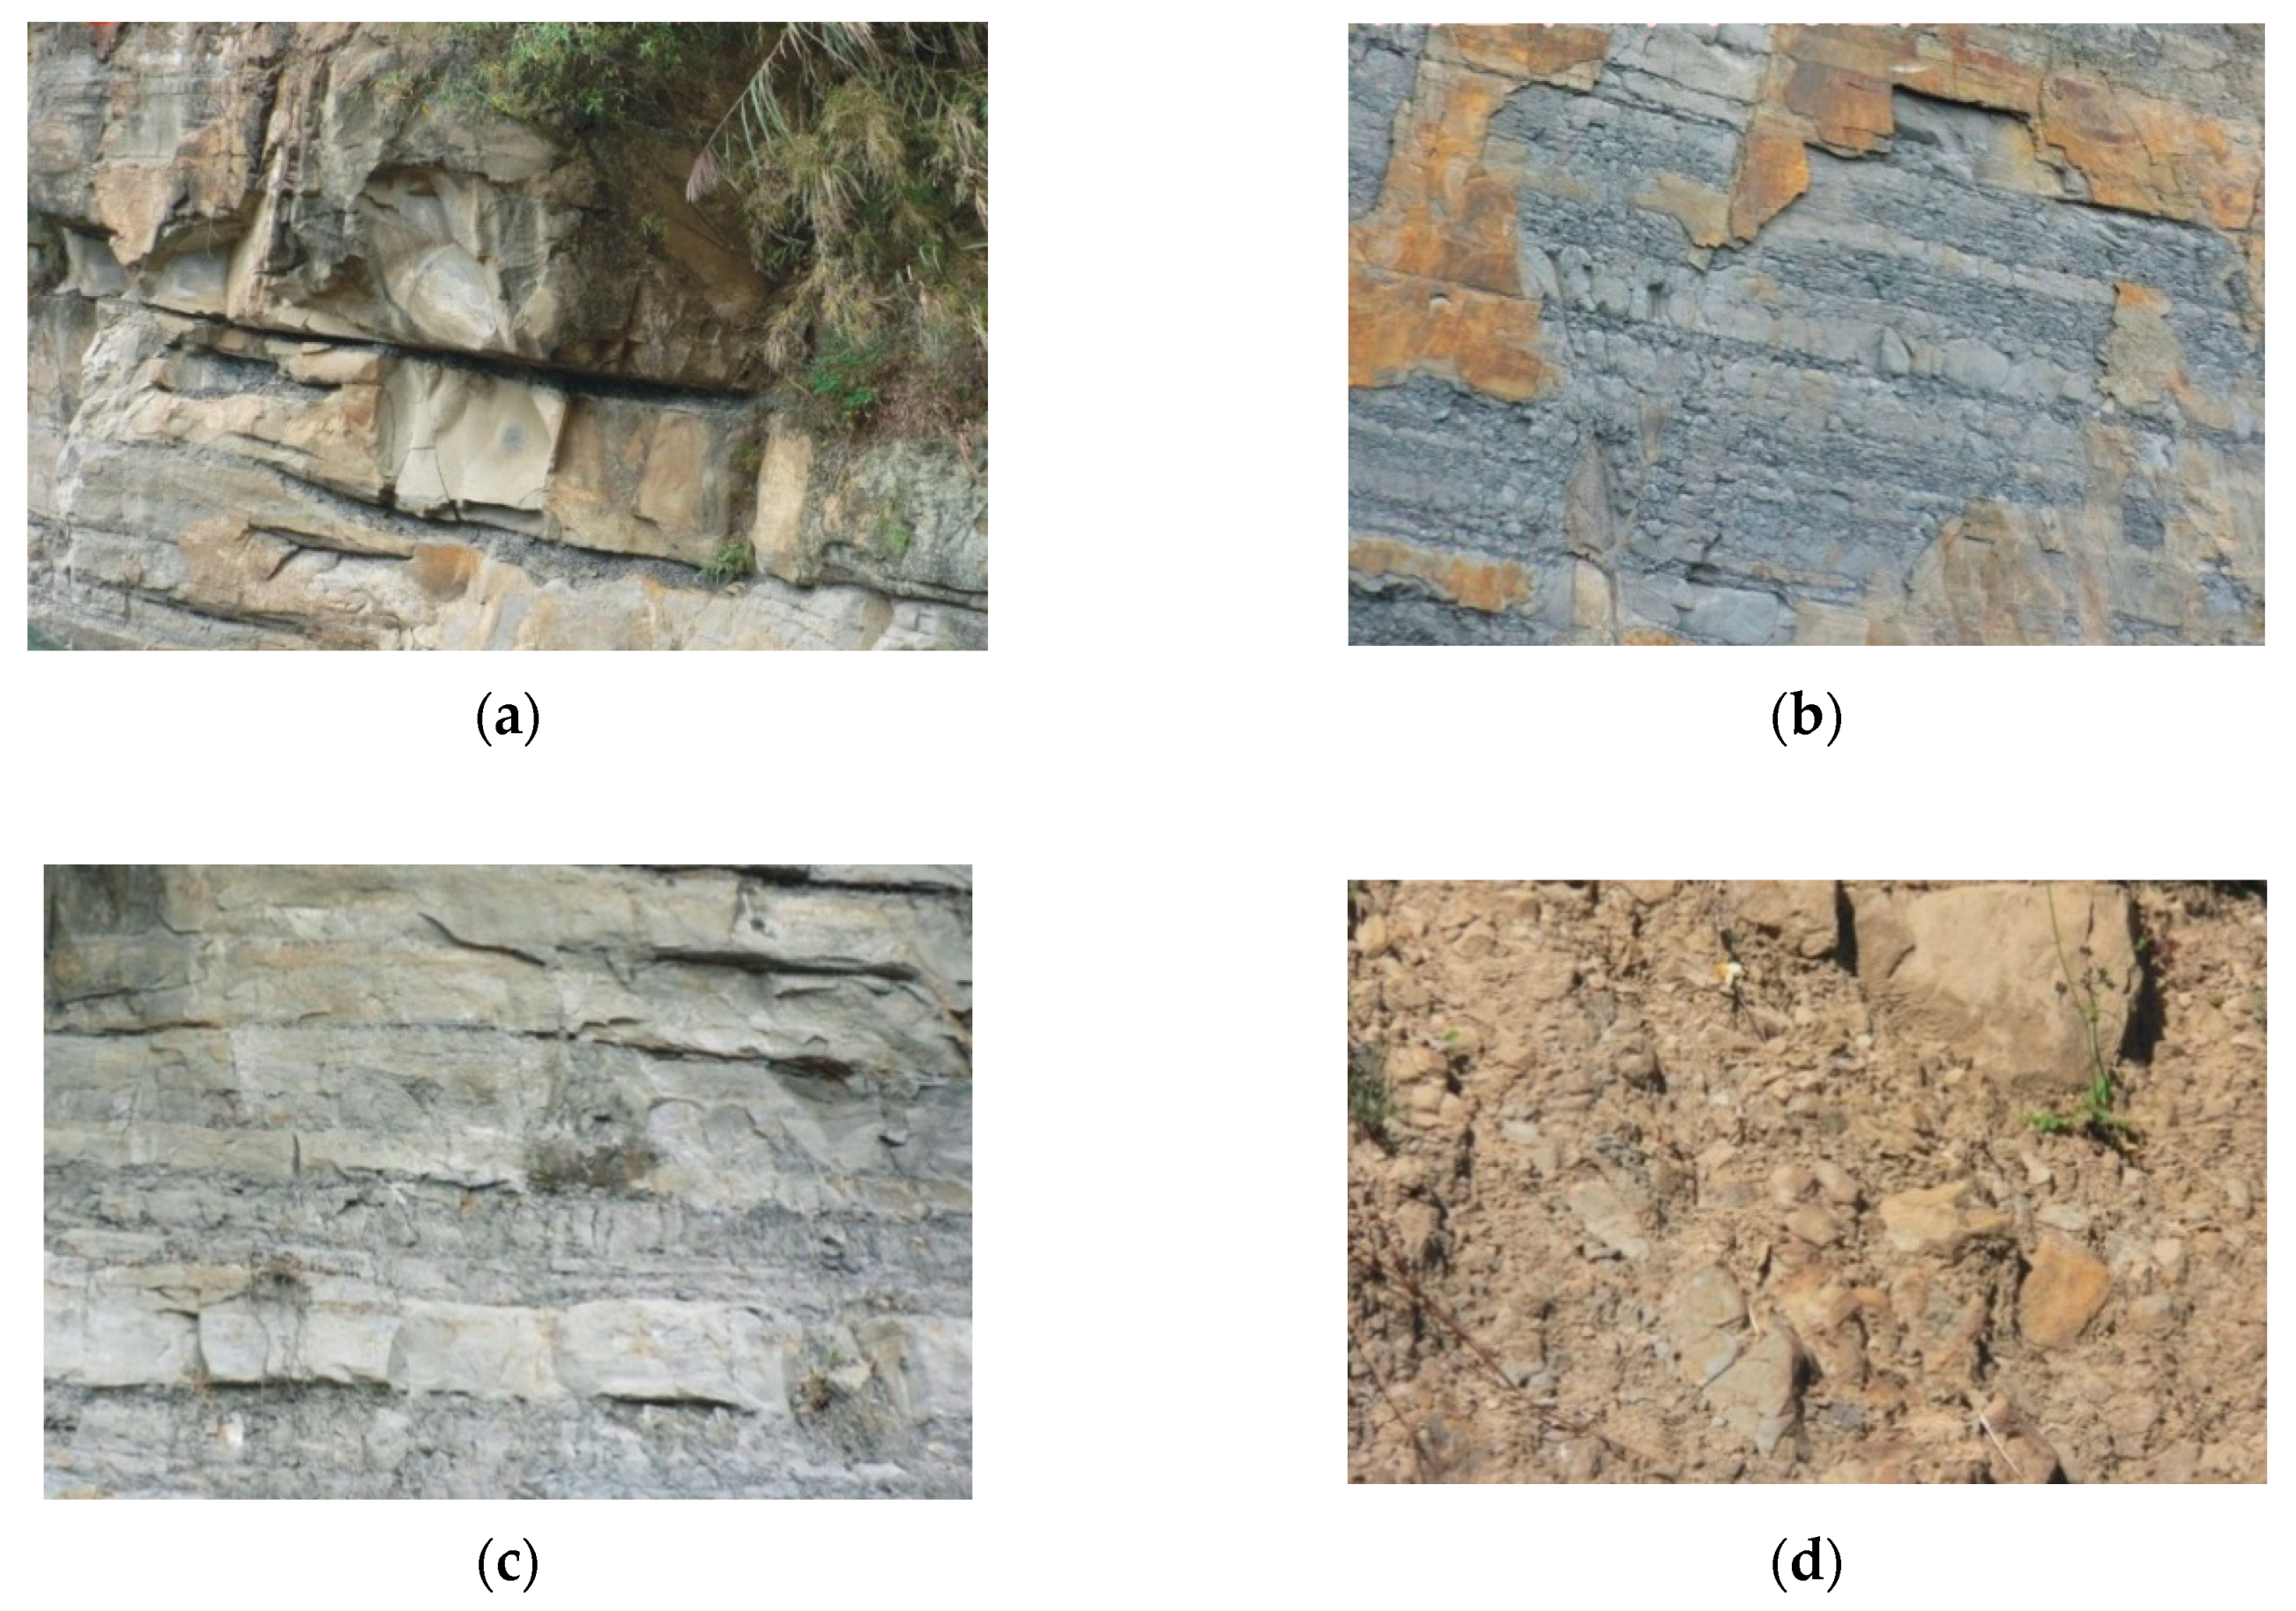
The strike of bedding plane of soil stratum in the You-Ye-Lin landslide directs towards north by east (NE) and topographically constitutes a dip slope. The Lu-Ku fault passes through the southern edge of the landslide with a strike of north by east (NE) and turns into a reverse fault inclined to the east with an inclination angle of 50°. The outcrops of the You-Ye-Lin landslide, which are situated on the western side of the Lu-Ku Fault, can be categorized as part of the Pliocene Cho-Lan Formation which consists of thick sandstone (Ss), shale (Sh), and sandstone/shale (Ss/Sh) alternating as shown in Figure 2a–c.
Field investigations and boring explorations indicate that the surficial colluvium of You-Ye-Lin landslide has a thickness of 8.65–35.8 m and is composed of unconsolidated sandy, silty, or clayey soil mixed with weathered rock or rock fragments as shown in Figure 2d. The bedding plane is not available in the weathered rock or rock fragment, as a result, the overall mechanical behavior of the colluvium is dominated by fine particle soils. The soil of the colluvium can be classified as clay or silt with low plasticity (CL or ML) or silty sand (SM) mixed with rock fragments. A thin grey-black color shale with intercalary strata (or inter-bed) of fine silty sandstone (Sh/Ss) is underlain by the colluvium. It is considered that a large ancient landslide occurred in You-Ye-Lin area and the potential sliding surface (PSS) developed along this thin shale layer. As a proof, the boring core of the shale layer taken from the landslide area frequently shows traces of shearing and fragmentation. The base bedrock in the landslide area is a thick and layered sandstone (Ss) with greyish white color and the thickness is more than 25 m.
2.3. Landslide of You-Ye-Lin
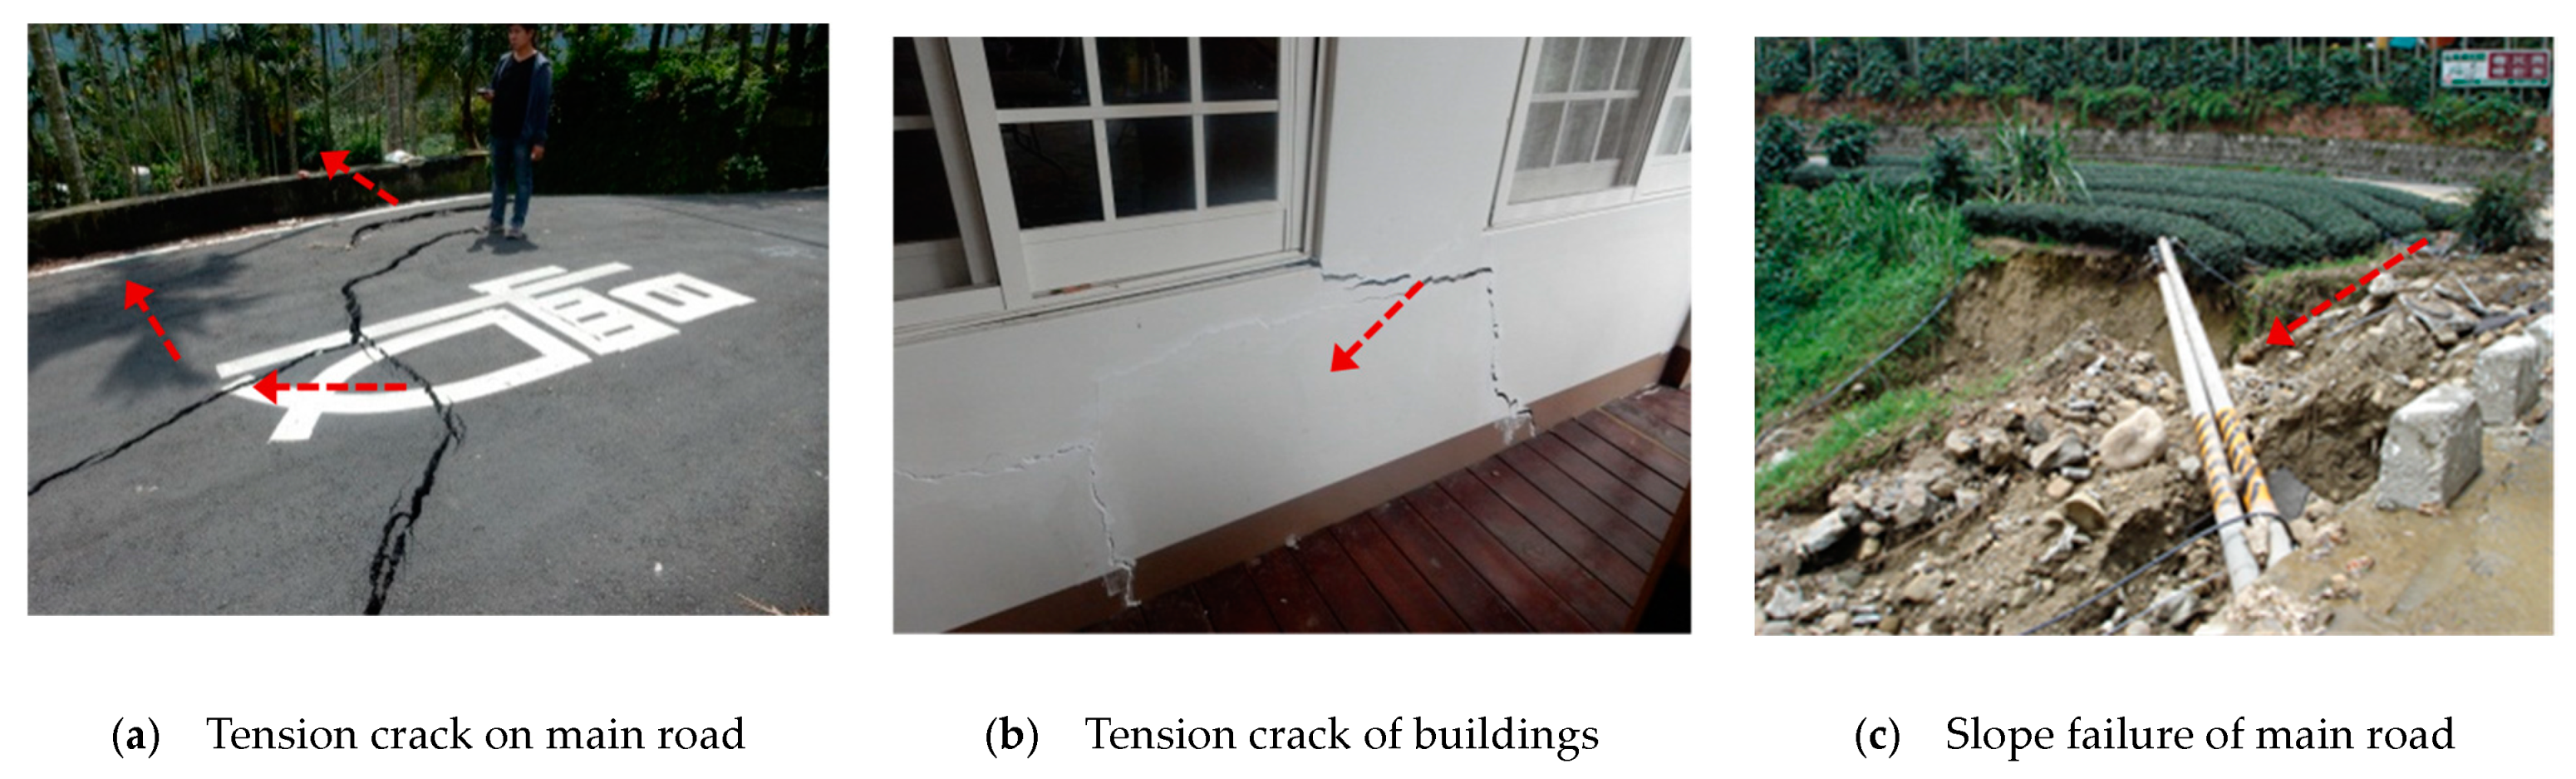
Slope failures occurred frequently in You-Ye-Lin landslide due to inherently adverse topographical, geological, and hydrological influence factors and poor drainage conditions. During the attack of Typhoon Morakot in 2009 (2009/08/06–08/09), the heavy rainfall (a maximum 24-hour cumulative rainfall of 1080 mm) caused serious damage to transportation routes, residential buildings and public facilities, as shown in Figure 3. A few years later, after a 3-day rainfall with a cumulative rainfall of 629 mm during the attack of Typhoon Soudelar (2015/08/06–08/09), another sequential precipitation lasting from 2015/08/09 to 2015/09/01 caused numerous tension cracks and subsidence of county road Route-No. 166. Recently, the rainfall from Typhoon Megi (2016/09/25–09/28) (a cumulative rainfall of 776 mm and maximum daily rainfall of 481 mm/day on 2106/09/26) enlarged the existing cracks again and caused many small scale slope failures. Even though the movement of the You-Ye-Lin landslide is relatively slow and minor compared to other severe landslide events occurred in Taiwan, the long-term displacement of the slope still causes damages to structures and maintenance and stabilization works are still needed.
2.3.1. Field Monitoring
After the large scale landslide in 2009, a remediation plan was initiated and approved by the Soil and Water Conservation Bureau (SWCB), Taiwan. The remediation works encompassed ground sills, retaining walls, revetments, check dams, shallow horizontal drains and surface drainages. In addition, in order to design a high efficiency subsurface drainage system (two drainage wells with horizontal drains), the SWCB implemented a systematic field monitoring to clarify the mechanism triggering the landslide. As shown in Figure 4, inclinometer and groundwater level monitoring stations (B04-W, B08-W, B09-W, B10-W, B12-W) were installed in the study area. Residential areas (RA-1, RA-2, and RA-3) are the main targets to be protected. In this study, the numerical results of drainage and slope stability analyses along A-A′ and B-B′ profiles are adopted for detailed discussions.
2.3.2. Groundwater Levels
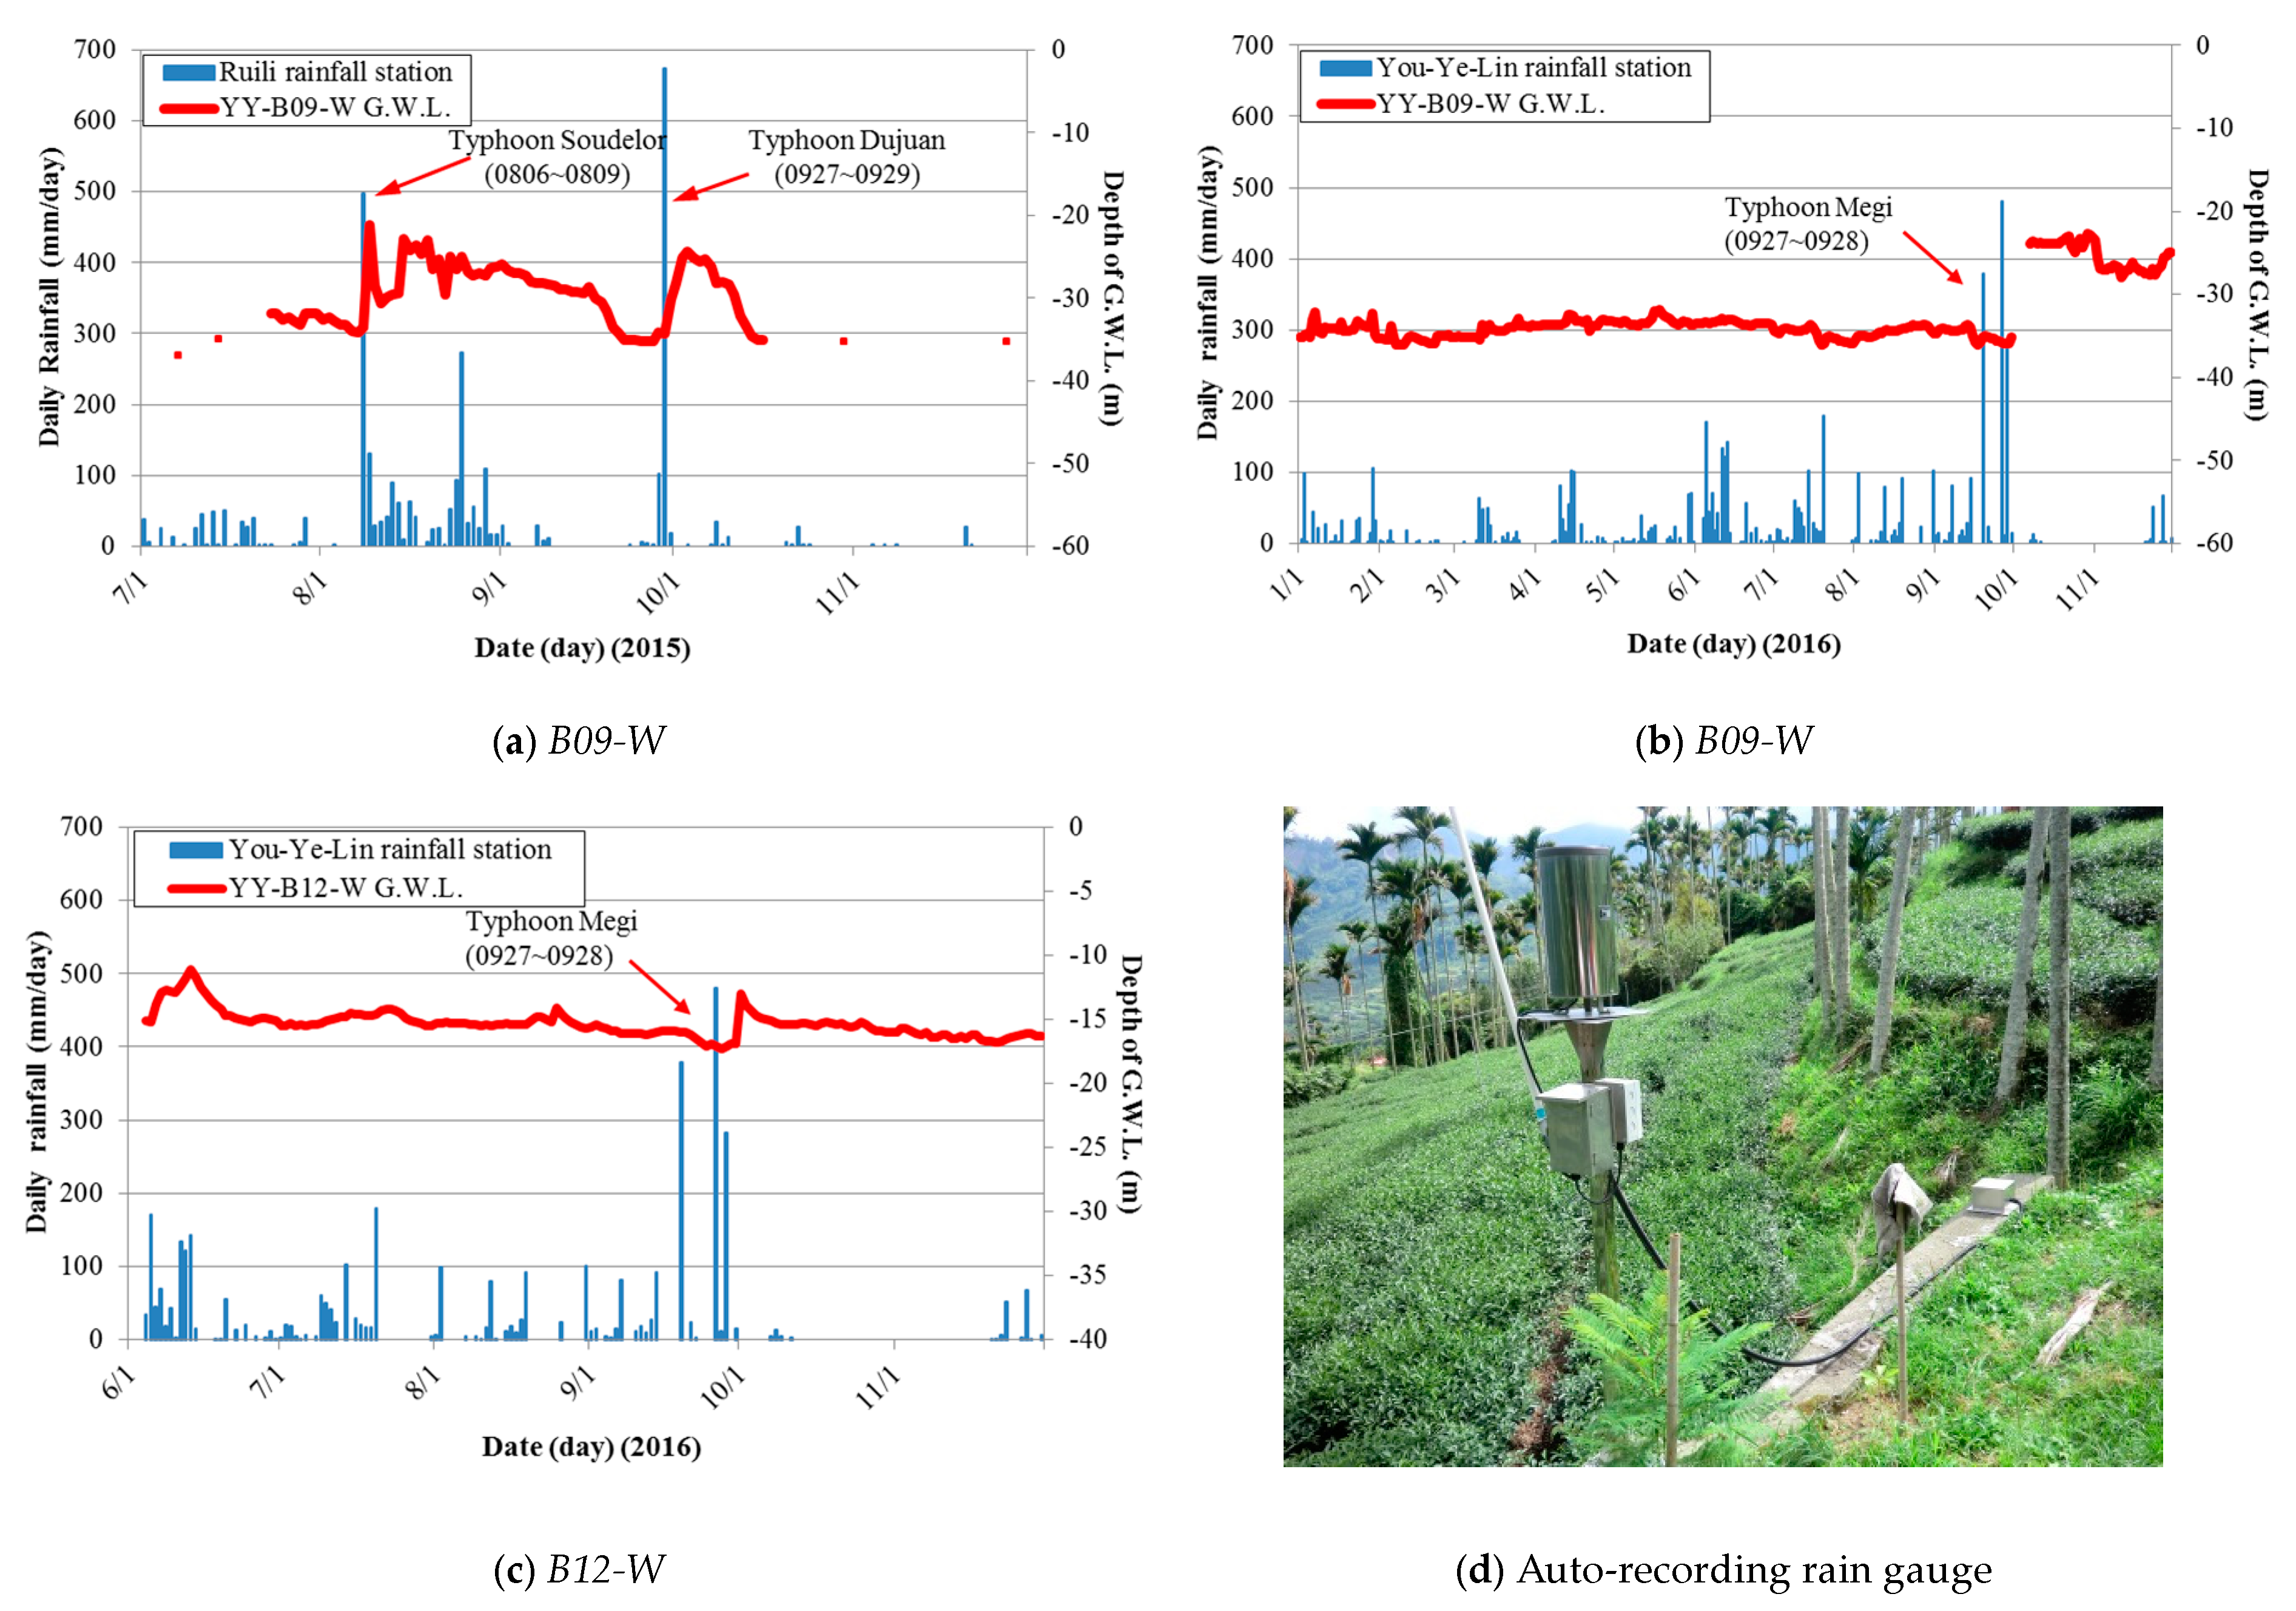
Figure 5 illustrates the variation of groundwater level with the rainfall hyetograph showing the groundwater rise/drawdown in response to the torrential rainfall during typhoons. As shown in Figure 5a, monitoring point B09-W indicates that the groundwater level gradually rose to the highest level 4–6 days after the attack of Typhoon Dujuan. Then, the groundwater level gradually decreased to the level before the attack of Typhoon Dujuan after 10–15 days. The time-lagging response of the groundwater level to the rainfall implies that the overall permeability of soil stratum in the landslide area is comparatively low and may be lower than the average rainfall intensity. As a consequence, the infiltrated rainwater is preserved in colluviums (CL–ML) due to the low permeability of fine soil particle. The preserved water becomes an adverse factor to the slope stability and causes the onset of the ground movement. Further on, at the middle to bottom slope of the study area, a thin shale layer of 2.0–4.5 m underlain by the colluvium is also impermeable and the infiltrated rainwater accumulates on top of this layer causing the ground movement of the slope (refer to Figure 6 for inclinometer measurement at B09-W borehole).
During Typhoon Megi (2016/09/25–09/28), as displayed in Figure 5b, the groundwater level at monitoring point B09-W was not immediately respond to the principal rainfall until 2016/10/01. This time-lag of the groundwater rise can be attributed to the installation of several groups of parallel shallow horizontal drains (see Figure 4) for subsurface drainage. Comparing the monitoring point of B12-W (Figure 5c) with B09-W (Figure 5b), it can be found that groundwater responses of these two monitoring points are correlated during Typhoon Megi (2016/09/25–09/28) and both have the time-lag responses.
According to the topographic and geologic features of the You-Ye-Lin landslide, it is estimated that a sequential rainfall after a principal rainfall with cumulative rainfall more than 800 mm may trigger ground movement locally. The auto-recording rain gauge used for the monitoring program is presented in Figure 5d. The monitoring results of groundwater during 3 typhoon events are summarized in Table 1.
Measurements of groundwater levels are directly adopted for the numerical analyses to include the rainfall effect instead of the infiltration and seepage analyses for unsaturated soil strata.
2.3.3. Ground Movements
During Typhoon Megi (2016/09/25–09/28), the monitoring points B12-W, B09-W, and B10-W arrayed from upslope to downslope indicated that the maximum lateral displacements were 138.96, 73.08 and 40.50 mm, respectively, and the corresponding depth of the potential sliding surface (PSS) is approximately 12, 36 and 21 m below ground surface. The direction of the potential sliding block movement is oriented to the southeast. As shown in Figure 6, mapping the displacement profiles of above monitoring points onto the B-B’ profile shows that most of the PSS is approximately located at the interface between the colluviums and the underlain thin shale layer. The thin shale layer is only found in the center of the study area ranged from the middle to the bottom of the slope. The existence of the thin shale layer makes the slope more active around this layer. The PSS of the You-Ye-Lin landslide in the study area is deep-seated approximately at a depth of 12–36 m and extends into a large area.
2.3.4. Geophysical Survey
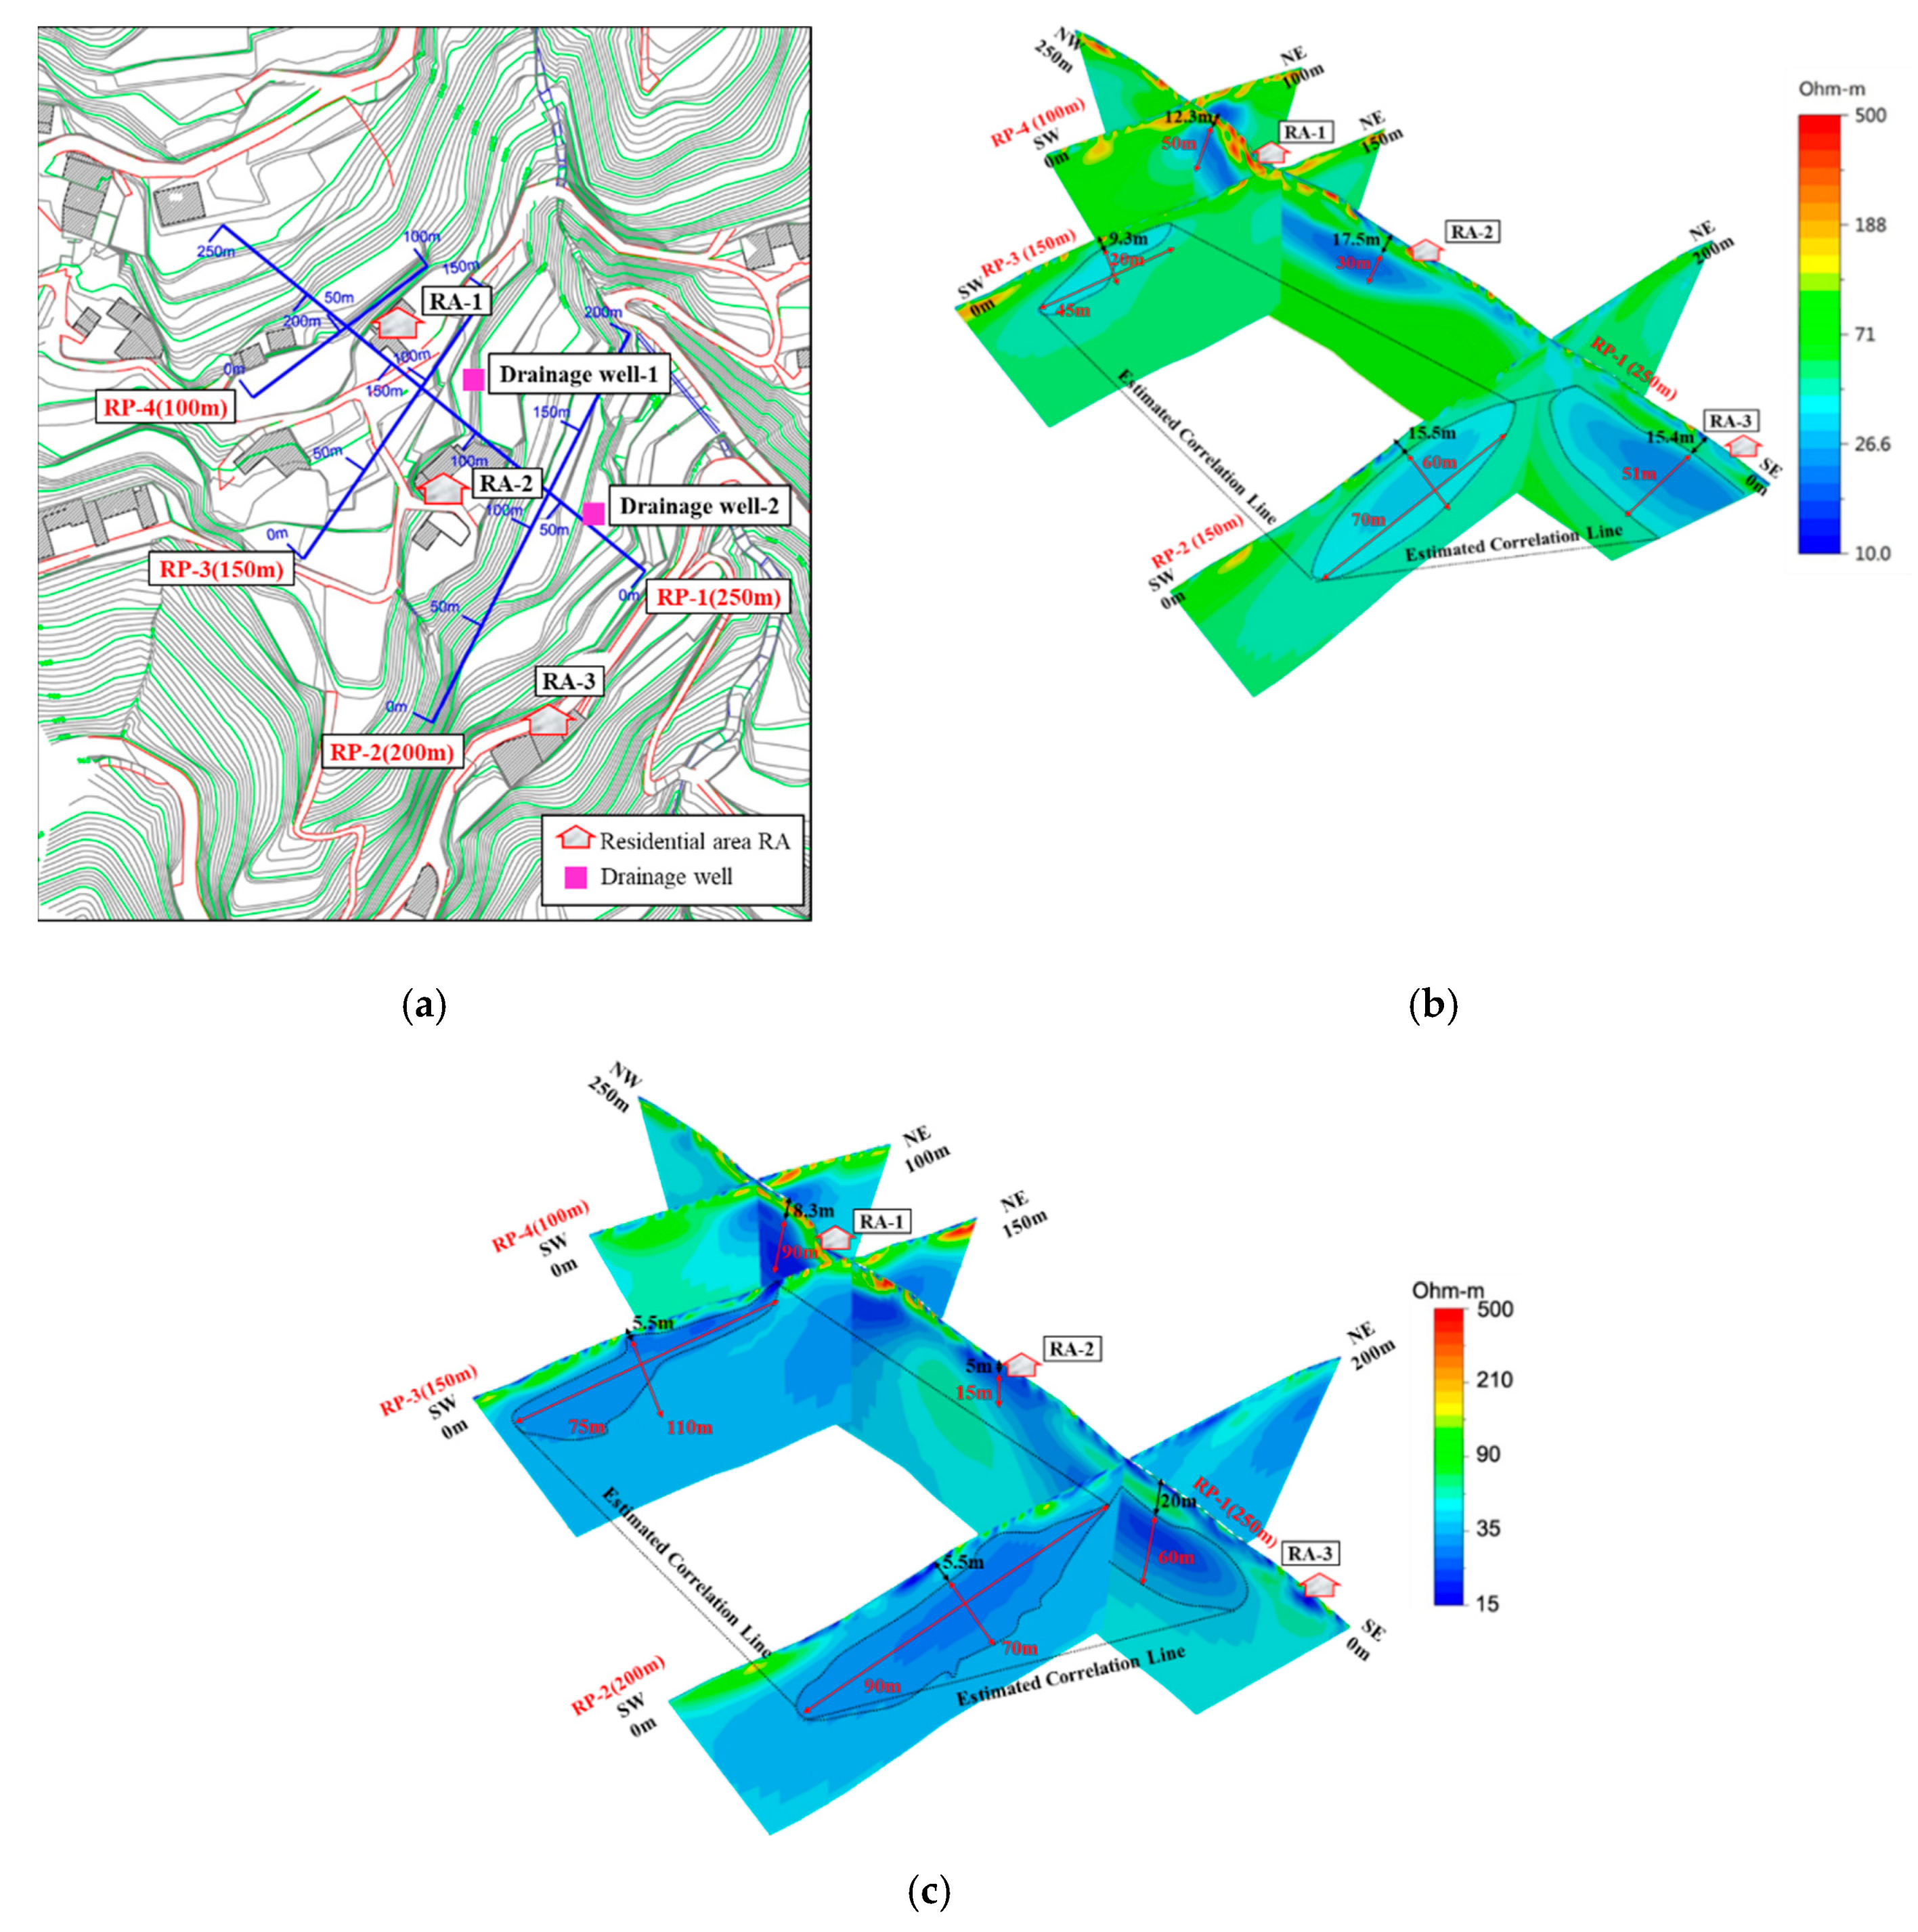
As illustrated in Figure 7a, four transects (RP-1: longitudinal transect and RP-2~RP-4: transverse transects) were set up for 2-D electrical resistivity imaging survey in the study area. The RP-1 (250 m long and adjacent to A-A′ profile in Figure 4) was aligned from SE to NW close to the monitoring point B09-W and B10-W. The purposes of the survey are to inspect the distribution pattern of the groundwater and to provide information for the design of the subsurface drainage system.
The resistivity profile (RP) before and after Typhoon Megi (2016/09/25–09/28) were established for comparisons to show the approximate accumulation pattern of the infiltrated rainwater and to be used as a design reference of drainage wells. Figure 7b,c display the pseudo 3D electrical model of the study area with electrical resistivity ρa (Ω-m) contours before and after Typhoon Megi. Because of the influence of building structures, groundwater, and rock fragments, the electrical resistivity distribution is rather scattered (ρa =15–500 Ω-m). Comparing Figure 7b,c, the groundwater level is most likely situated in the colluvium at a depth of 5.0–30.0 m. The water-bearing stratum might be situated at a depth around 5–17 m and the upper boundary of the sliding body might be close to the residential area RA-1 (near the monitoring point B12-W).
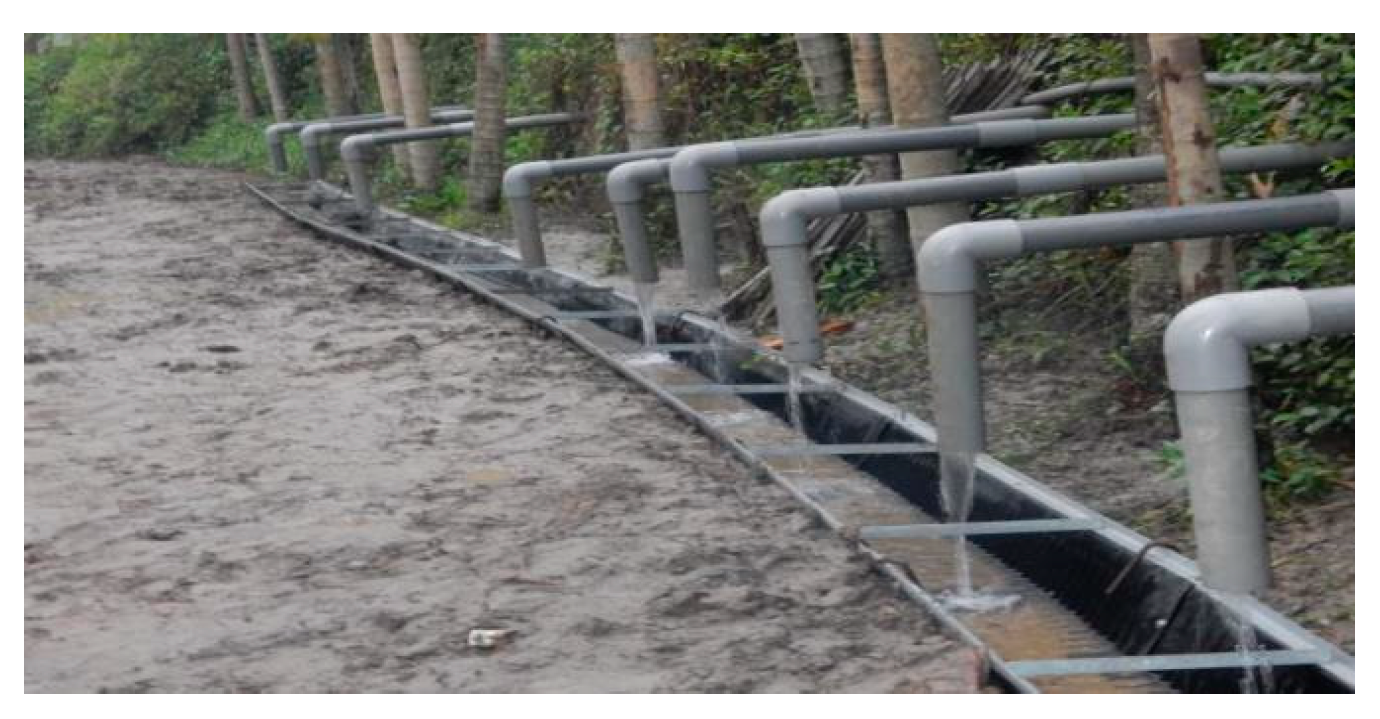
2.4. Shallow Horizontal Drains for Emergency Remediation
There are five groups of shallow horizontal drains installed in the study area (see Figure 4) as emergency drainage before the subsurface drainage system was installed, as shown in Figure 8. These horizontal drains (length = 30 m, spacing = 3.0 m, diameter = 6.2, 8.8 and 13 cm, elevation angle = 7.6°) collect the infiltrated rainwater and drain off the groundwater at a shallow depth. Most of the shallow horizontal drains are functional, with discharge rates in a range of 54.60~0.18 m3/day in dry season. A groundwater drawdown of 1~3 m is expected via the shallow horizontal drains and this promotes the slope stability. Nevertheless, the shallow horizontal drains are incapable of draining off the rising groundwater level caused by the torrential rainfall during the typhoon season. As a consequence, a deep subsurface drainage for groundwater drawdown becomes necessary to cope with the large amount of rainwater infiltrates into the colluvium.
2.5. Drainage Well for Long-Term Remediation
2.5.1. Design of Drainage Well
In Taiwan, the subsurface drainage is by far the most commonly used method for slope stabilization, either alone or in conjunction with other methods. Attempts have been made to provide a design procedure to optimize the number and spacing of horizontal drains [1,2,15]. The design length of the horizontal drain should not only extend to the sliding body but also penetrate through the potential sliding surface (PSS) for an additional 3–5 m [4,5,6,16]. Due to lack of the consistence of design standards, in general, the design spacing of horizontal drains shows large variation within a range of 3–30 m from the literature [1,17,18,19,20]. Crenshaw and Santi suggested that the drain spacing can be determined according to the in-situ drainage condition first and adjusted during the installation process [21].
Xanthakos et al. indicated that natural slopes are rarely homogeneous enough to allow reliable subsurface drainage design according to simple principles of dewatering [22]. In addition, Hausmann suggested that for a successful dewatering system, the designer must choose a drainage system layout that increases the probability of intersecting the major water-bearing stratum [23]. Rahardjo et al. (presented that the horizontal drain is most effective when it is installed at the bottom of a slope [7,8]. It was also indicated in Cornforth that the horizontal drain drilled toward the upslope can maximize the intersection area with the PSS and can effectively lower the groundwater level [20]. Meanwhile, Cook et al. indicated that a horizontal drain can function effectively if the horizontal drain can catch the groundwater flow before it seeps into the unstable area of the landslide [24]. Lin pointed out that to design the location of drainage well rationally, it is necessary to grasp the PSS, the main veins of groundwater flow and their flow mode within the sliding body in advance [11,12]. Conclusively, for the design of the subsurface drainage system in the You-Ye-Lin landslide, the locations and elevations of drainage wells accompanied with well-configured drainage boreholes (or horizontal drains) are crucial to the drainage efficiency.
The drainage well (well shaft with drainage boreholes) in the You-Ye-Lin Landslide was designed to remove the groundwater in the deep soil strata followed the configuration in Figure 9. A large amount of groundwater can be drained out from the slope through drainage wells lowering the groundwater level. For You-Ye-Lin landslide, two drainage wells (Drainage Well-1 and Drainage Well-2) were designed and the construction was completed in 2018.
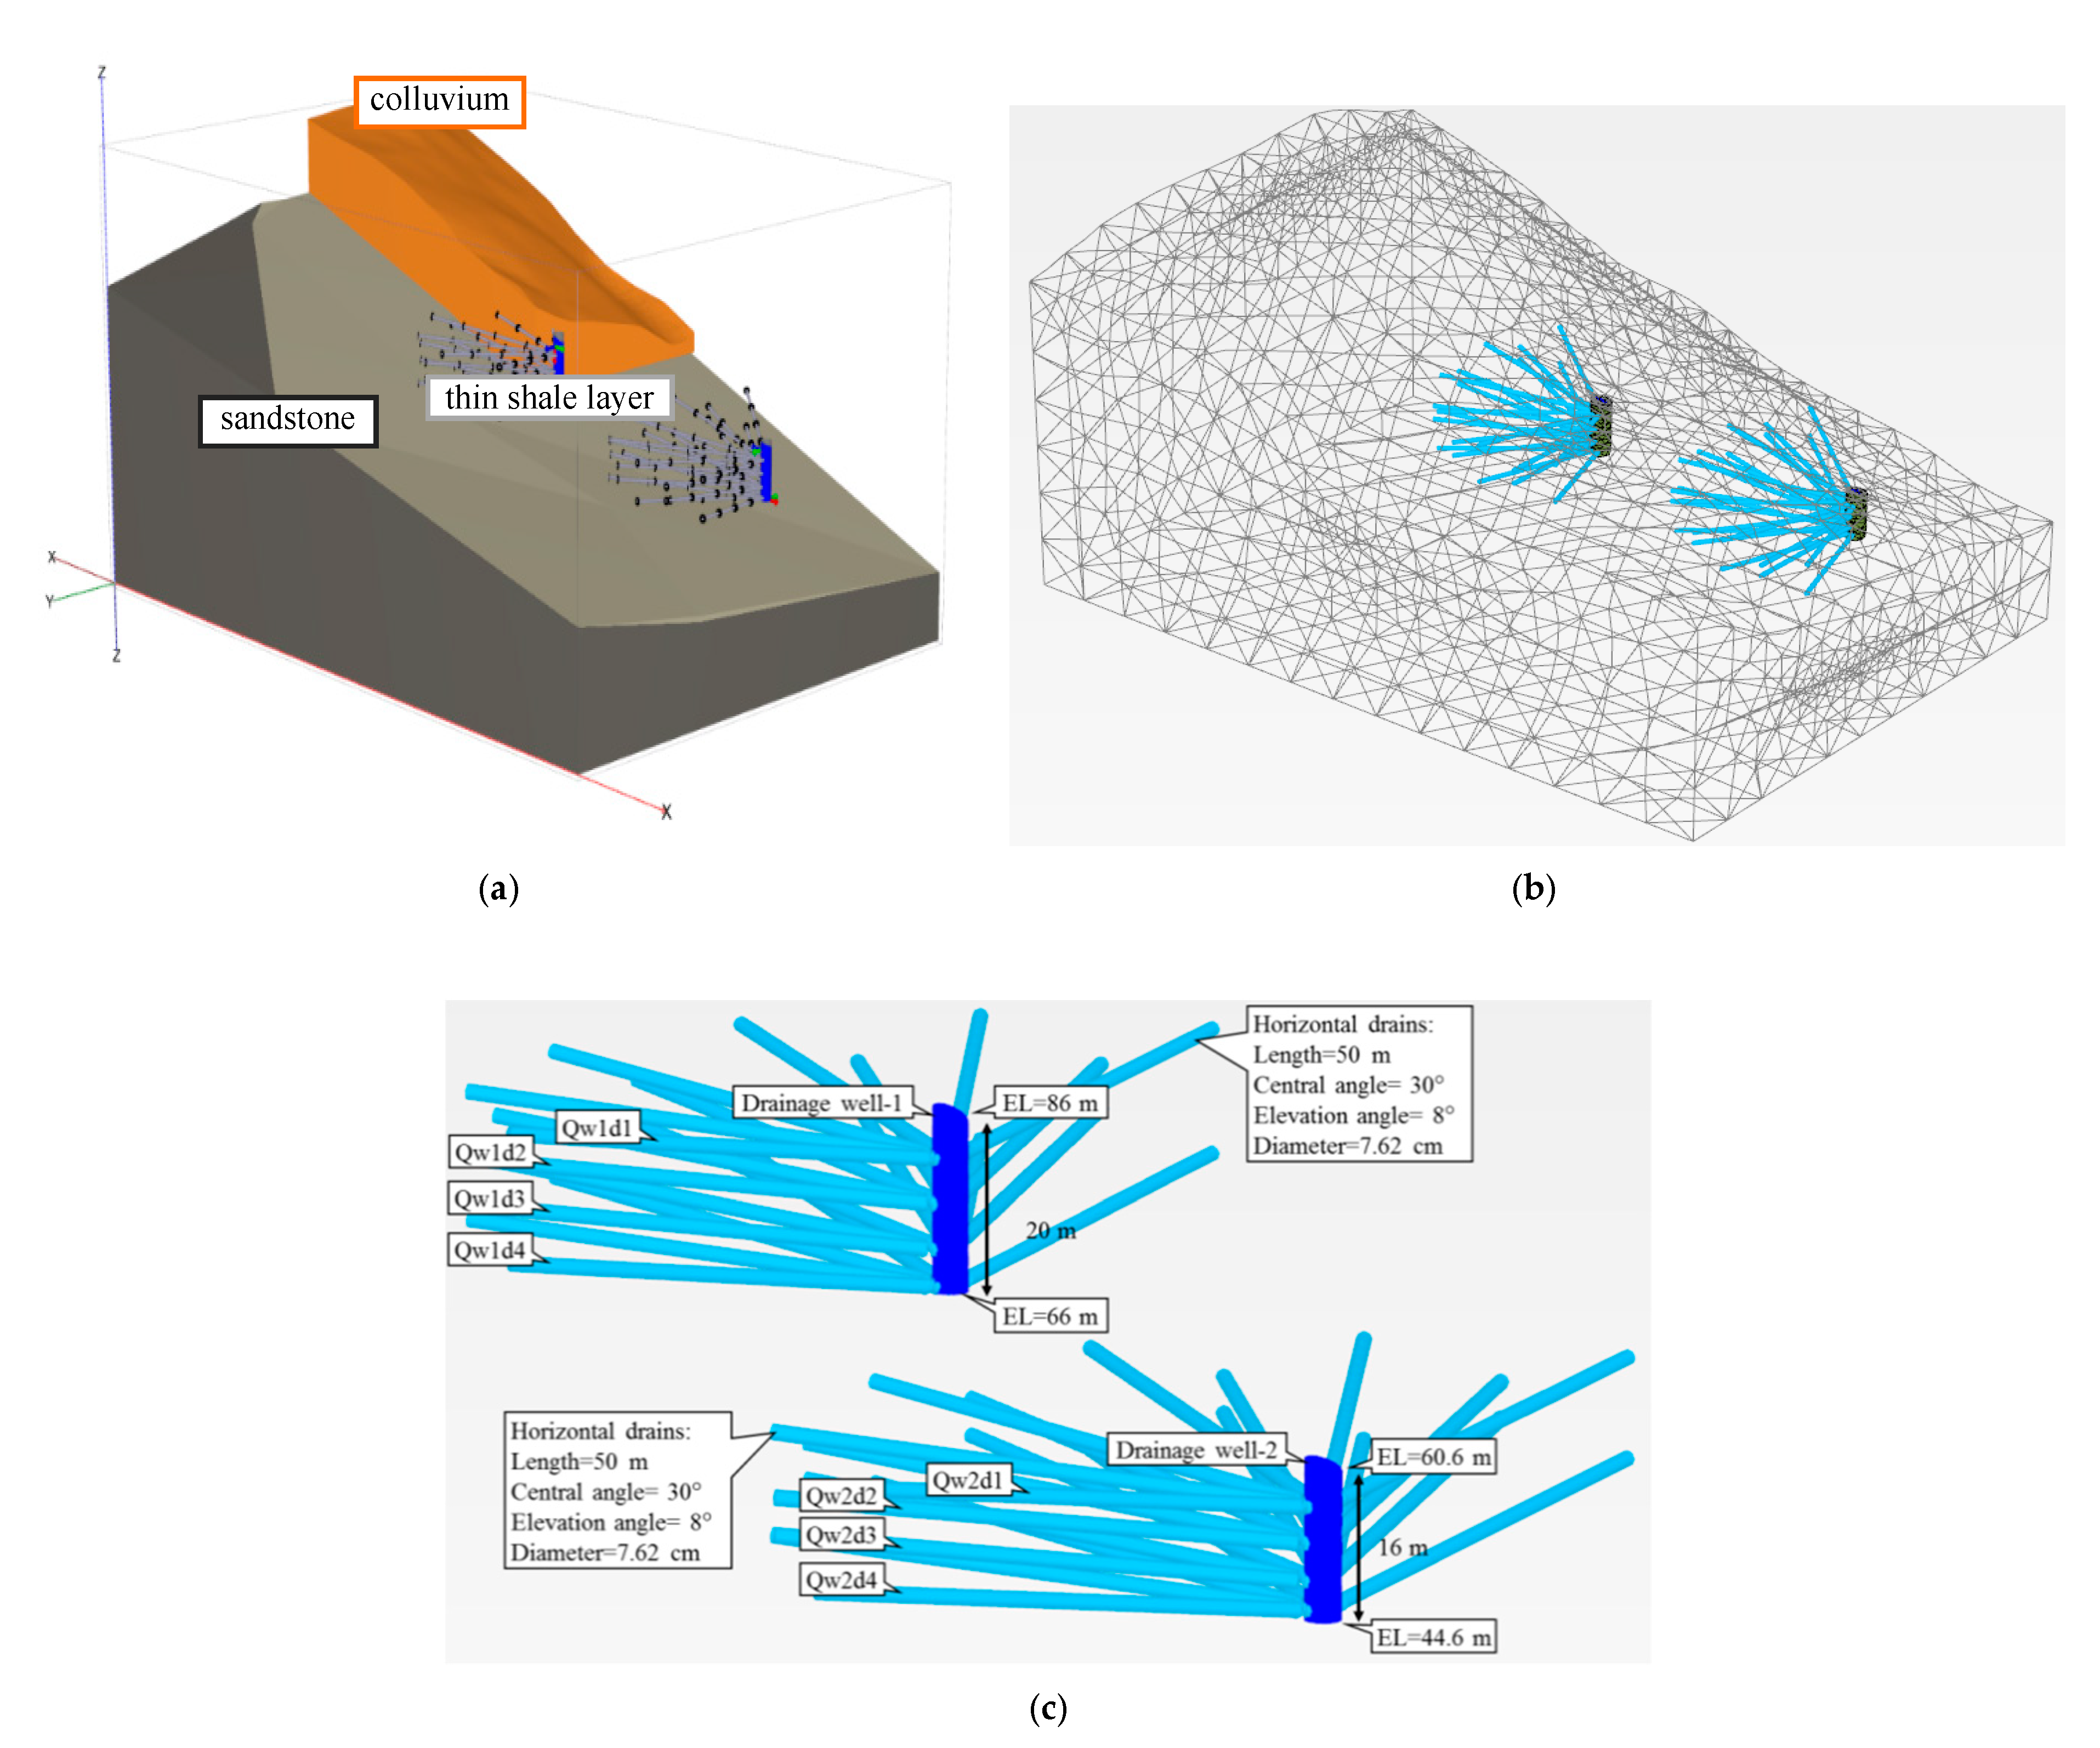
The drainage wells have a diameter of 4.0 m and the well shaft was assembled by galvanized corrugated steel ring liners. The drainage wells penetrated into the colluvium to a depth of 20 m and 16 m respectively and are close to the PSS. Along the well shaft, an array of 5–6 uncased drainage boreholes (with a diameter of 76.2 mm and length of 50 m radiating out of the well shaft) were drilled with an upward elevation angle of 8°~10° at 4 different elevations of the well shaft (multi-level horizontal drains with vertical spacing of 4.0 and 5.0 m). The horizontal drains are arrayed in a fan-shape configuration with a 30° interval central angle and a horizontal spacing of 1.0–2.5 m. Table 2 summarizes the design parameters of the drainage wells.
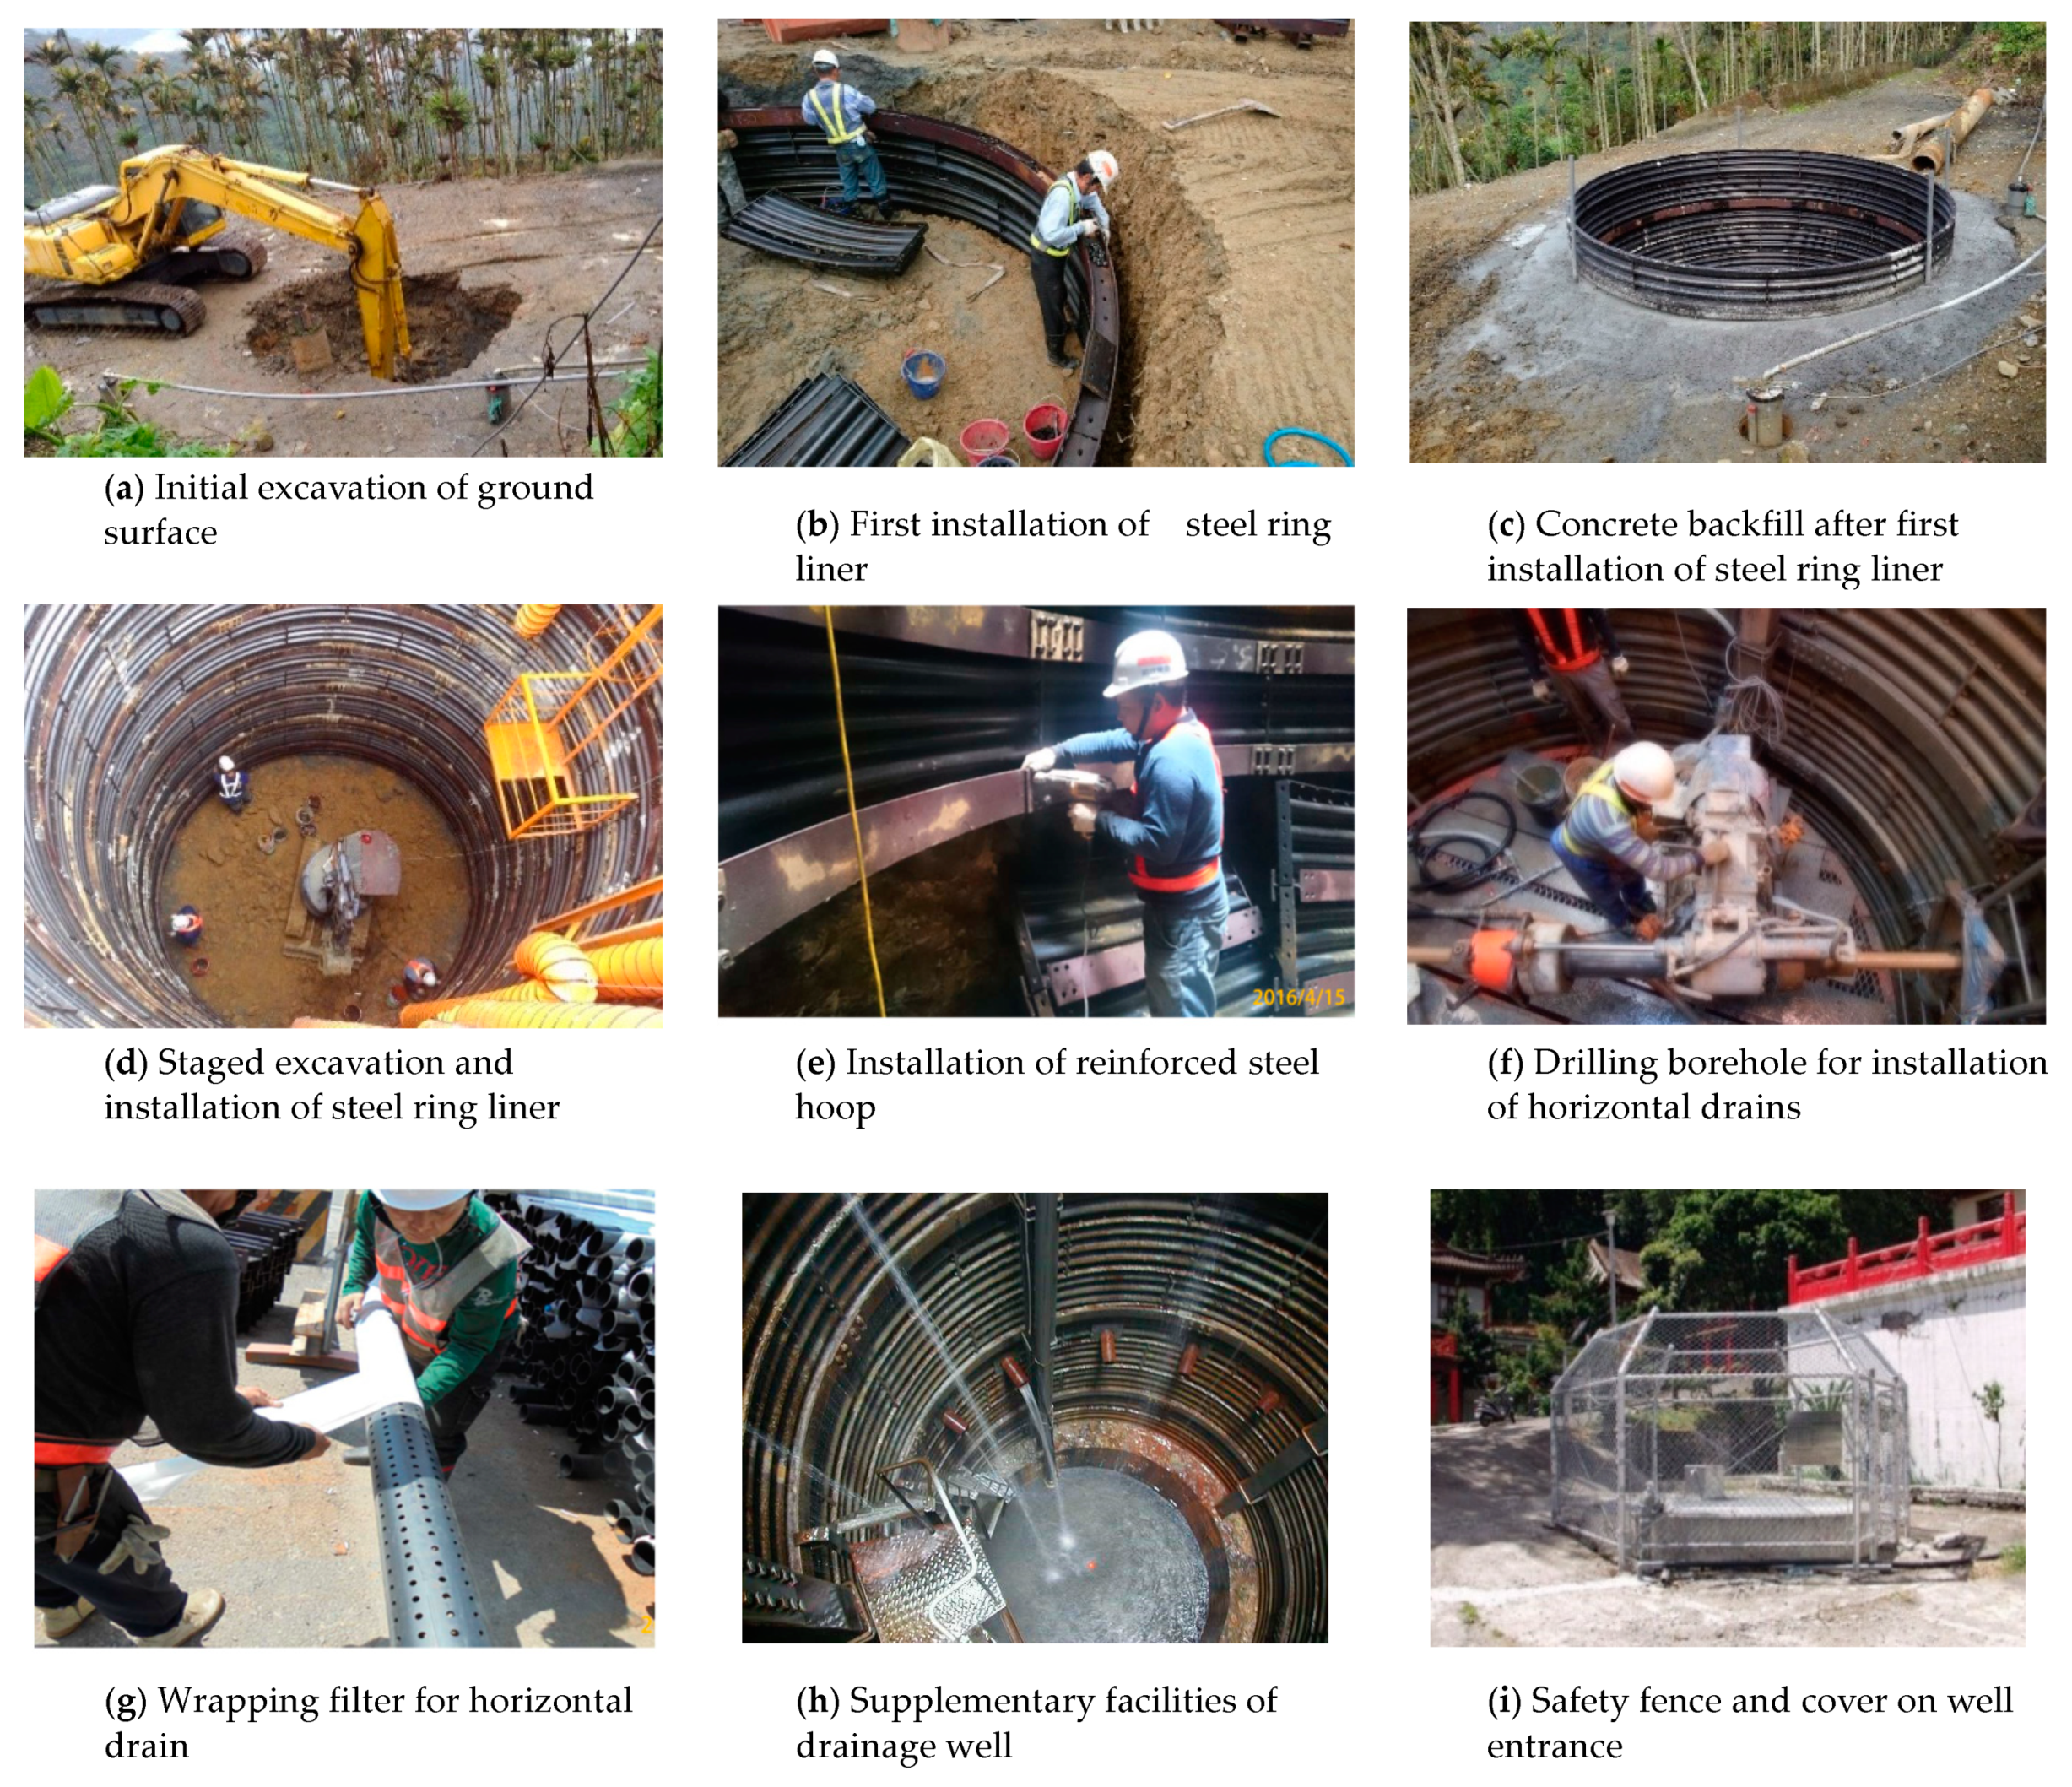
2.5.2. Construction of the Drainage Well
Figure 10 illustrates a typical construction sequence of a drainage well in Taiwan. The shaft is assembled by galvanized corrugated steel ring liners. One ring liner consists of seven segments and is erected every 0.5 m till the design depth. The completed liner is reinforced by steel hoop and the shaft entrance is also fixed by backfilling pure concrete. Then, PVC pipes with diameter of 100 mm are equipped at the bottom of the shaft to drain off the collected groundwater into the stilling pool. Subsequently, the auxiliary works such as maintenance ladder, entrance cover, and safety fence are setting up.
In Taiwan, a drainage well is usually designed with a diameter of 3.5 m or 4.0 m and a depth of 15–30 m or deeper. A drainage well should not penetrate through the PSS to avoid the shearing failure of well shaft caused by the downward sliding of soil mass. According to the past works and experiences, in case of the drainage capacity of PVC pipes at the shaft bottom is not enough to accommodate the collected inflow water from horizontal drains, water pumps are equipped to pump out water into the stilling pool.
3. Methodology
Through 3D numerical modelling, this paper investigates the efficiency of subsurface drainages and their effects on the groundwater drawdown (hwmax) and the corresponding factors of safety (FS) of potential sliding surface (PSS) in the You-Ye-Lin landslide. In the phase calculations, after a gravity loading calculation for in-situ stresses and a simulation of the construction of two subsurface drainage wells, a series of fully coupled flow-deformation analyses immediately followed by a safety calculation using phi/c reduction method (or strength reduction method, SRM) are performed to calculate the FS value in response to a groundwater drawdown due to horizontal drains. It should be pointed out that a more realistic and a higher value FS will be obtained for a fully coupled flow-deformation analysis when the suction of unsaturated soil is considered.
3.1. Numerical Model with Boundary and Initial Conditions
According to the design parameters of drainage wells (see Table 2), topographic, geological and hydrological data from long-term field surveys and tests of soil/rock samples taken from boreholes at the study area, the 3D numerical model of the You-Ye-Lin landslide is established and shown in Figure 11a. The soil strata are modeled by 10-node tetrahedral soil elements (or 10-node volumetric soil element, Plaxis 3D [26]) with four integration points and the elements have three degrees of freedom per node (or three displacement components per node) and provide a second-order interpolation of displacements (Figure 11b). The drainage well consists of the well shaft and multi-level horizontal drains. The well shaft is assembled by a continuous galvanized corrugated steel ring liner and is simulated by 6-node triangular plate elements (or 6-node structural area elements) with three integration points provide a second-order interpolation of displacements (Figure 11c). As the plate elements cannot sustain torsional moments, the plate elements have only five degrees of freedom per node (three translational and two rotational degrees of freedom). Plate elements are structural elements used to model thin two-dimensional shaft structure in ground with a significant flexural rigidity (bending stiffness) and based on Mindlin’s plate theory [26] which allows for plate deflections due to shearing as well as bending. Structural forces are evaluated at the plate element integration points and extrapolated to the element nodes. At last, the horizontal drains in the numerical model are simulated by a series of 3-node line drain elements with hydraulic condition or called line drains (Figure 11c), which is compatible with the side of a 6-node triangle plate elements and a 10-node tetrahedral soil elements since these elements also have three nodes on a side. 3-node line drain elements provide a second-order (quadratic) interpolation of groundwater discharge rate for horizontal drains.
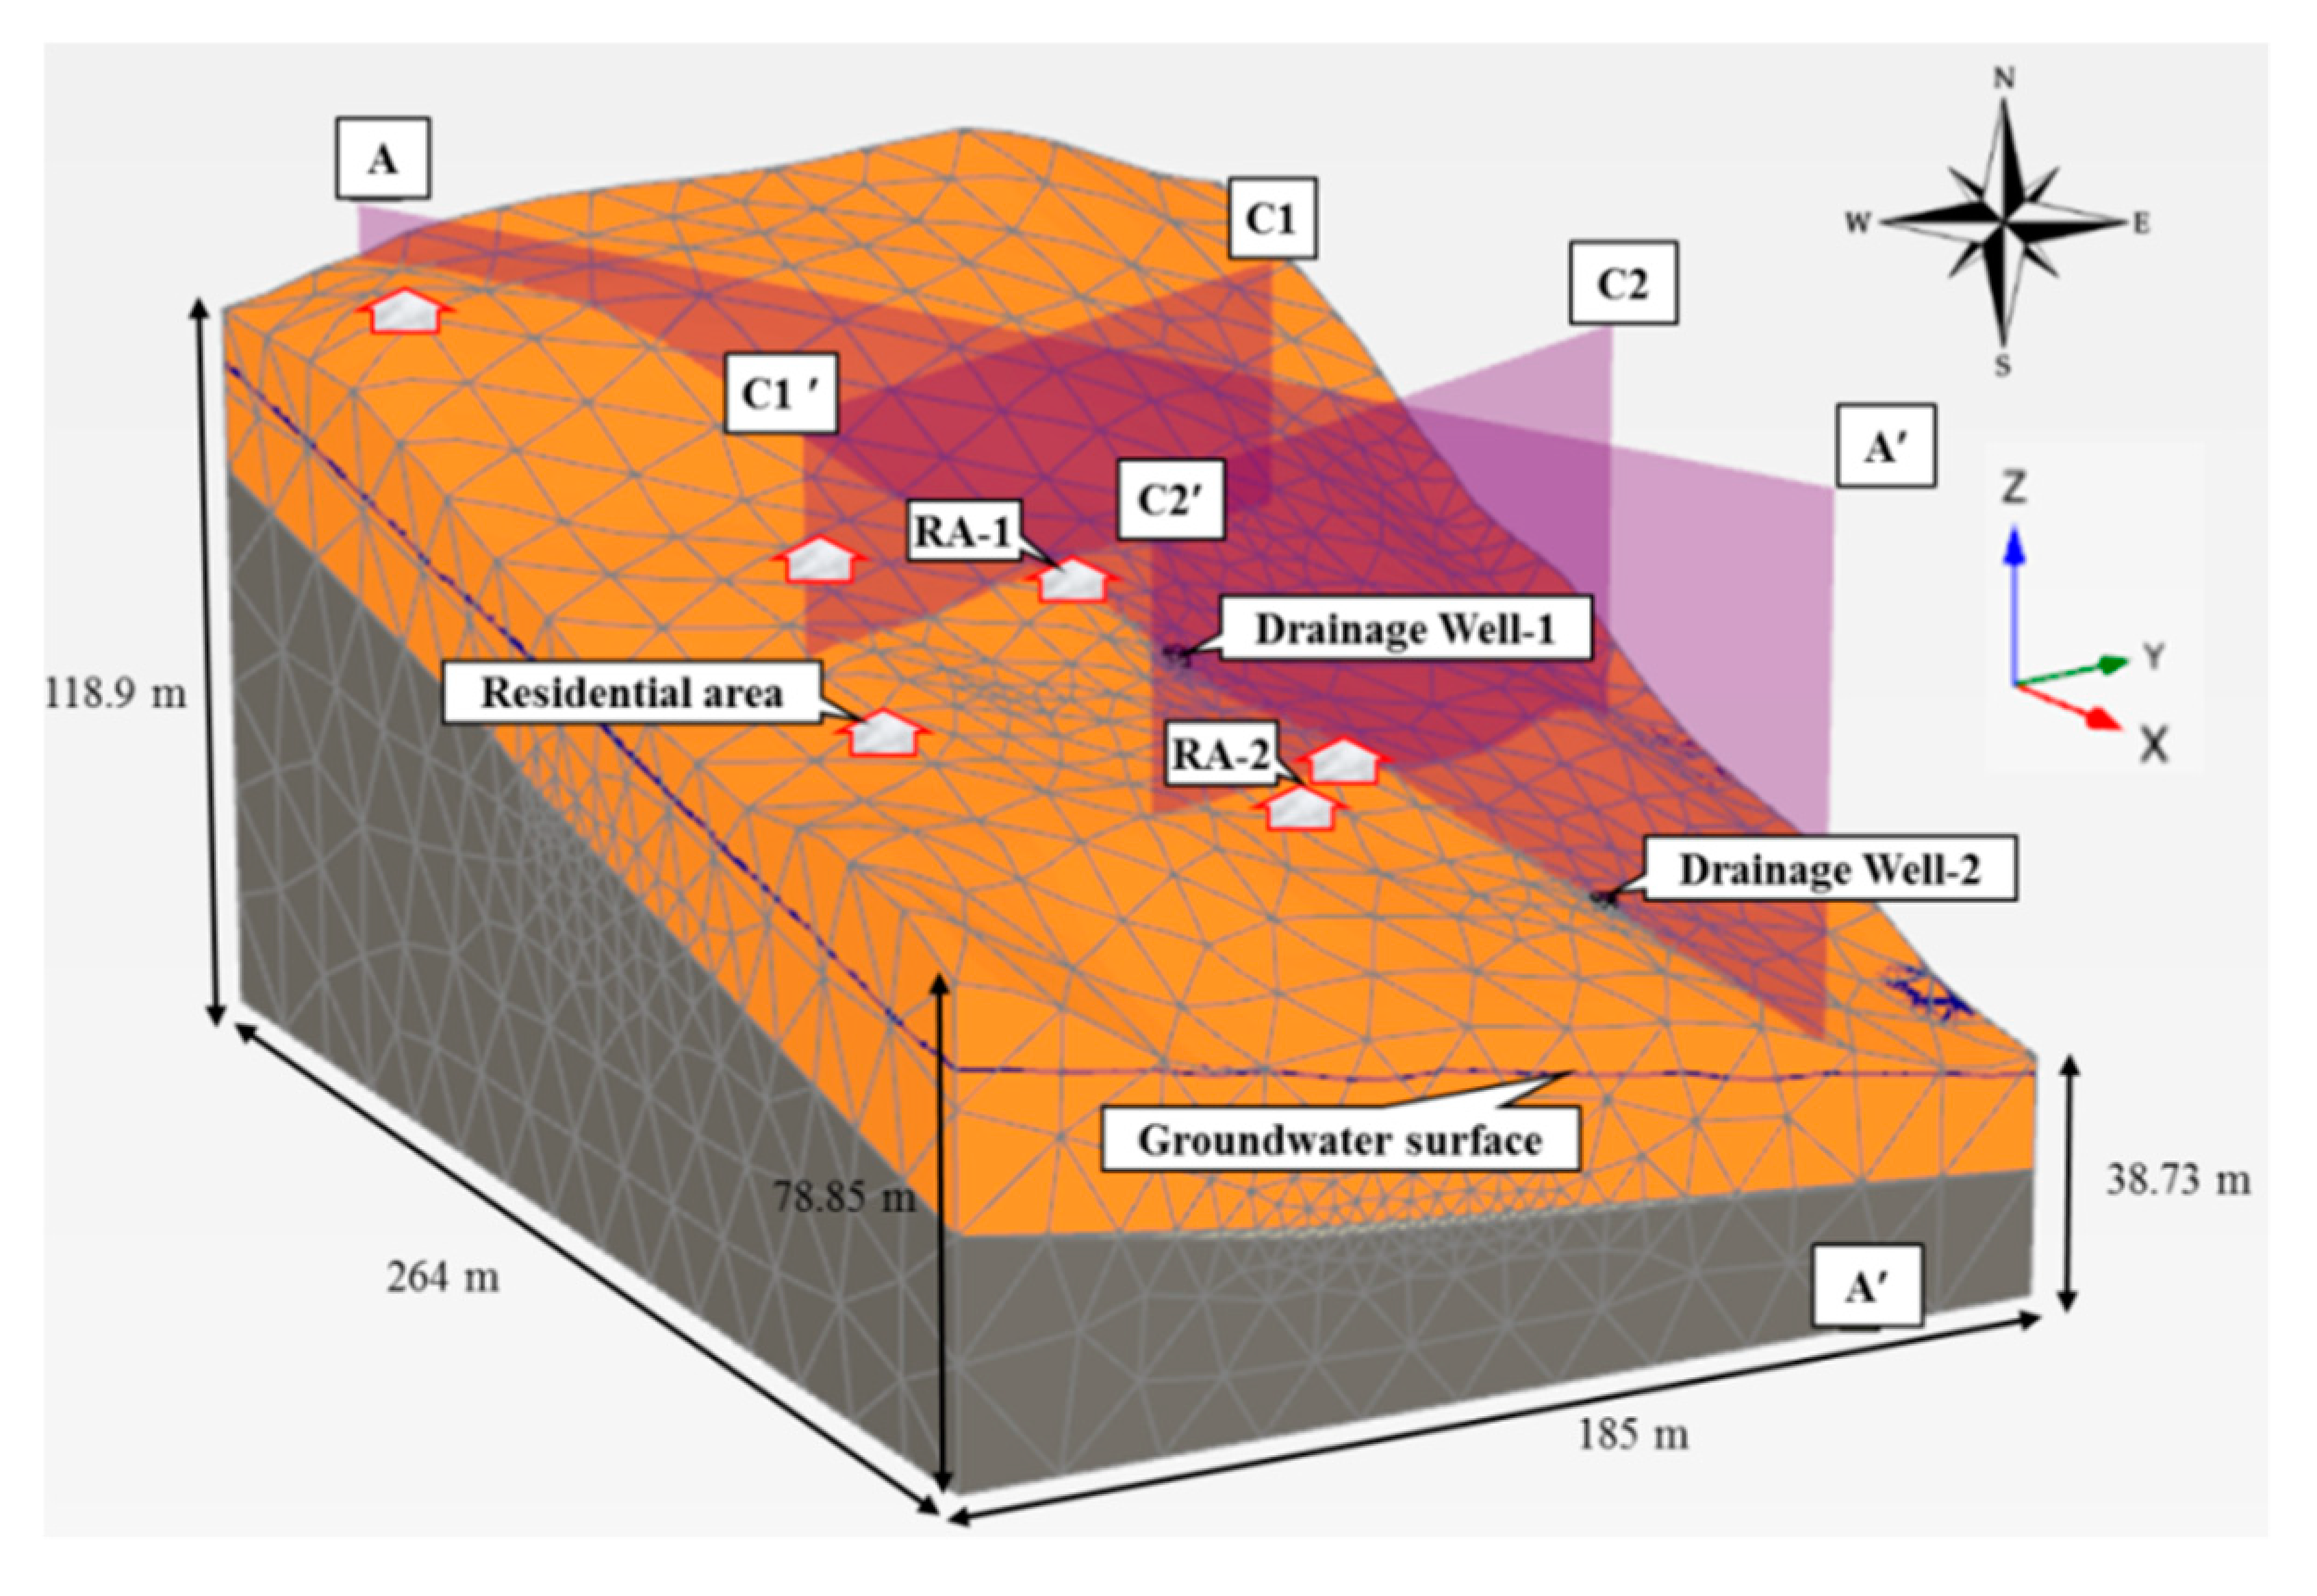
Ideally, the model boundaries are placed along natural hydrologic boundaries such as flow divides (or watershed boundaries), water bodies (creeks), and impermeable bedrock. The numerical model shown in Figure 12 places the model domain at the watershed boundary to reduce the amount of elements needed to define the model. Locations, thicknesses and hydraulic properties of each soil stratum are required for a groundwater flow calculation model. The initial groundwater level for the landslide is determined and set up by a steady-state groundwater flow calculation which is calibrated with the measured groundwater levels of observation well B08-W, B09-W, B10-W, and B12-W (Figure 4). For a steady-state groundwater flow calculation and fully coupled flow-deformation analysis, except the bottom boundary (x-y plane) which is specified as a close boundary (zero flux boundary), all the surrounding boundaries (x-z and y-z planes) are defined as constant head open boundaries. In addition, as shown in Figure 12, the A-A’ profile along which two drainage wells installed for subsurface drainage is selected to monitor the calculation results.
3.2. Drainage Simulation for Drainage Well and Horizontal Drains
In the slope stability analysis, interface elements (structural area elements) of zero thickness are added at the contact between well shaft (plate elements) and the surrounding soil to allow for a proper modelling of soil-plate (soil-structure) interaction. The plate elements are fully permeable by default in Plaxis 3D program and therefore the well shaft turns into permeable as well. However, in Taiwan, in order to increase the shear and moment resistance of well shaft to the downward force from the slope, the construction gap between the well shaft and the surrounding soil is frequently backfilled with pure concrete making the well shaft impermeable. Therefore, in the numerical simulation, the interface elements assigned to the well shaft are set to fully impermeable to block the flow from surrounding soil strata.
The drainage of horizontal drains in the numerical model is simulated by line drain elements (line drains). A series of line drains are imposed to the locations of horizontal drains to control the pore pressure distribution in the fully coupled flow-deformation analysis. Line drains are used to prescribe lines inside the geometry model where pore pressures are reduced. In fully coupled flow-deformation analysis, the pore pressures in all nodes of the line drain is reduced to a give head equivalent to zero for gravity drainage. The pore pressures in soil mass are not affected by the line drain anymore if the calculated pore pressures in soil mass are lower than the give head in line drains.
3.3. Material Model Parameters
A series of direct shear tests were carried out for soil and rock samples to determine the strength parameters. The soil samples collected from colluviums are classified as clayey or silt soils with low plasticity (CL, ML and CL~ML). The residual cohesions c′res and frictional angles φres′ are in a range of 15~35 kPa and 26°–30° respectively. In addition, the rock samples collected from the bedrock underlain the colluvium are classified as shale (Sh) and the residual strength parameters are c′res=0 and φ′res=23°~32° (uniaxial compressive strength qu=3060 kPa). For sandstone (Ss), the strength parameters are c′peak=0 and φ′peak=32°~35° at peak state and c′res=0 and φ′res= 25°~33° at residual state (uniaxial compressive strength qu=4,000 kPa). The shear strength of the interface between sandstone and shale was not tested in this study. The residual strengths of the colluvium and the underlain shale are used in the analysis to include the strength reduction from the large ground movement in the field. On the contrary, the sandstone was considered as the bedrock only undertaking slight shearing and assigned by peak shear strength. The linear-elastic perfectly-plastic model with Mohr-Coulomb failure criteria (Mohr-Coulomb model or M-C model) is used to simulate the mechanical behaviours of soil strata in You-Ye-Lin landslide. The input parameters of M-C model are summarized in Table 3. The linear isotropic material model parameters of corrugated steel ring liner used for numerical simulation are listed in Table 4.
The saturated conductivity of the colluviums KS were measured by in-situ borehole constant head permeability tests. KS varies between 2.08 × 10⁻⁵~1.04 × 10⁻⁴ cm/sec for tests performed in a depth of 3.0~4.0 m. In addition, in-situ Lugeon tests (or Packer tests) were carried out to determine the saturated conductivity of intact sandstone KSs=1.50 × 10⁻⁶ ~3.14 × 10⁻⁵ cm/sec and for sandstone with intercalary strata (or inter-bed) of thin shale KSs/sh=6.22 × 10−5~1.06 × 10⁻⁴ cm/sec. In the You-Ye-Lin landslide, the conductivity of the colluvium is crucial to the design (location of drainage well, drain length and drain spacing) of the subsurface drainage because the drainage mainly occurs in the colluvium. In numerical analyses, three conductivities of the colluvium, KS=1.0 × 10⁻³, 1.0 × 10⁻⁴, and 1.0 × 10⁻⁵ cm/sec are adopted to investigate their effects on the efficiency of the subsurface drainage whereas KSh=1.0 × 10⁻⁴ cm/sec and KSs=1.0 × 10⁻⁵ cm/sec are fixed.
4. Results and Discussion
4.1. Groundwater Drawdown
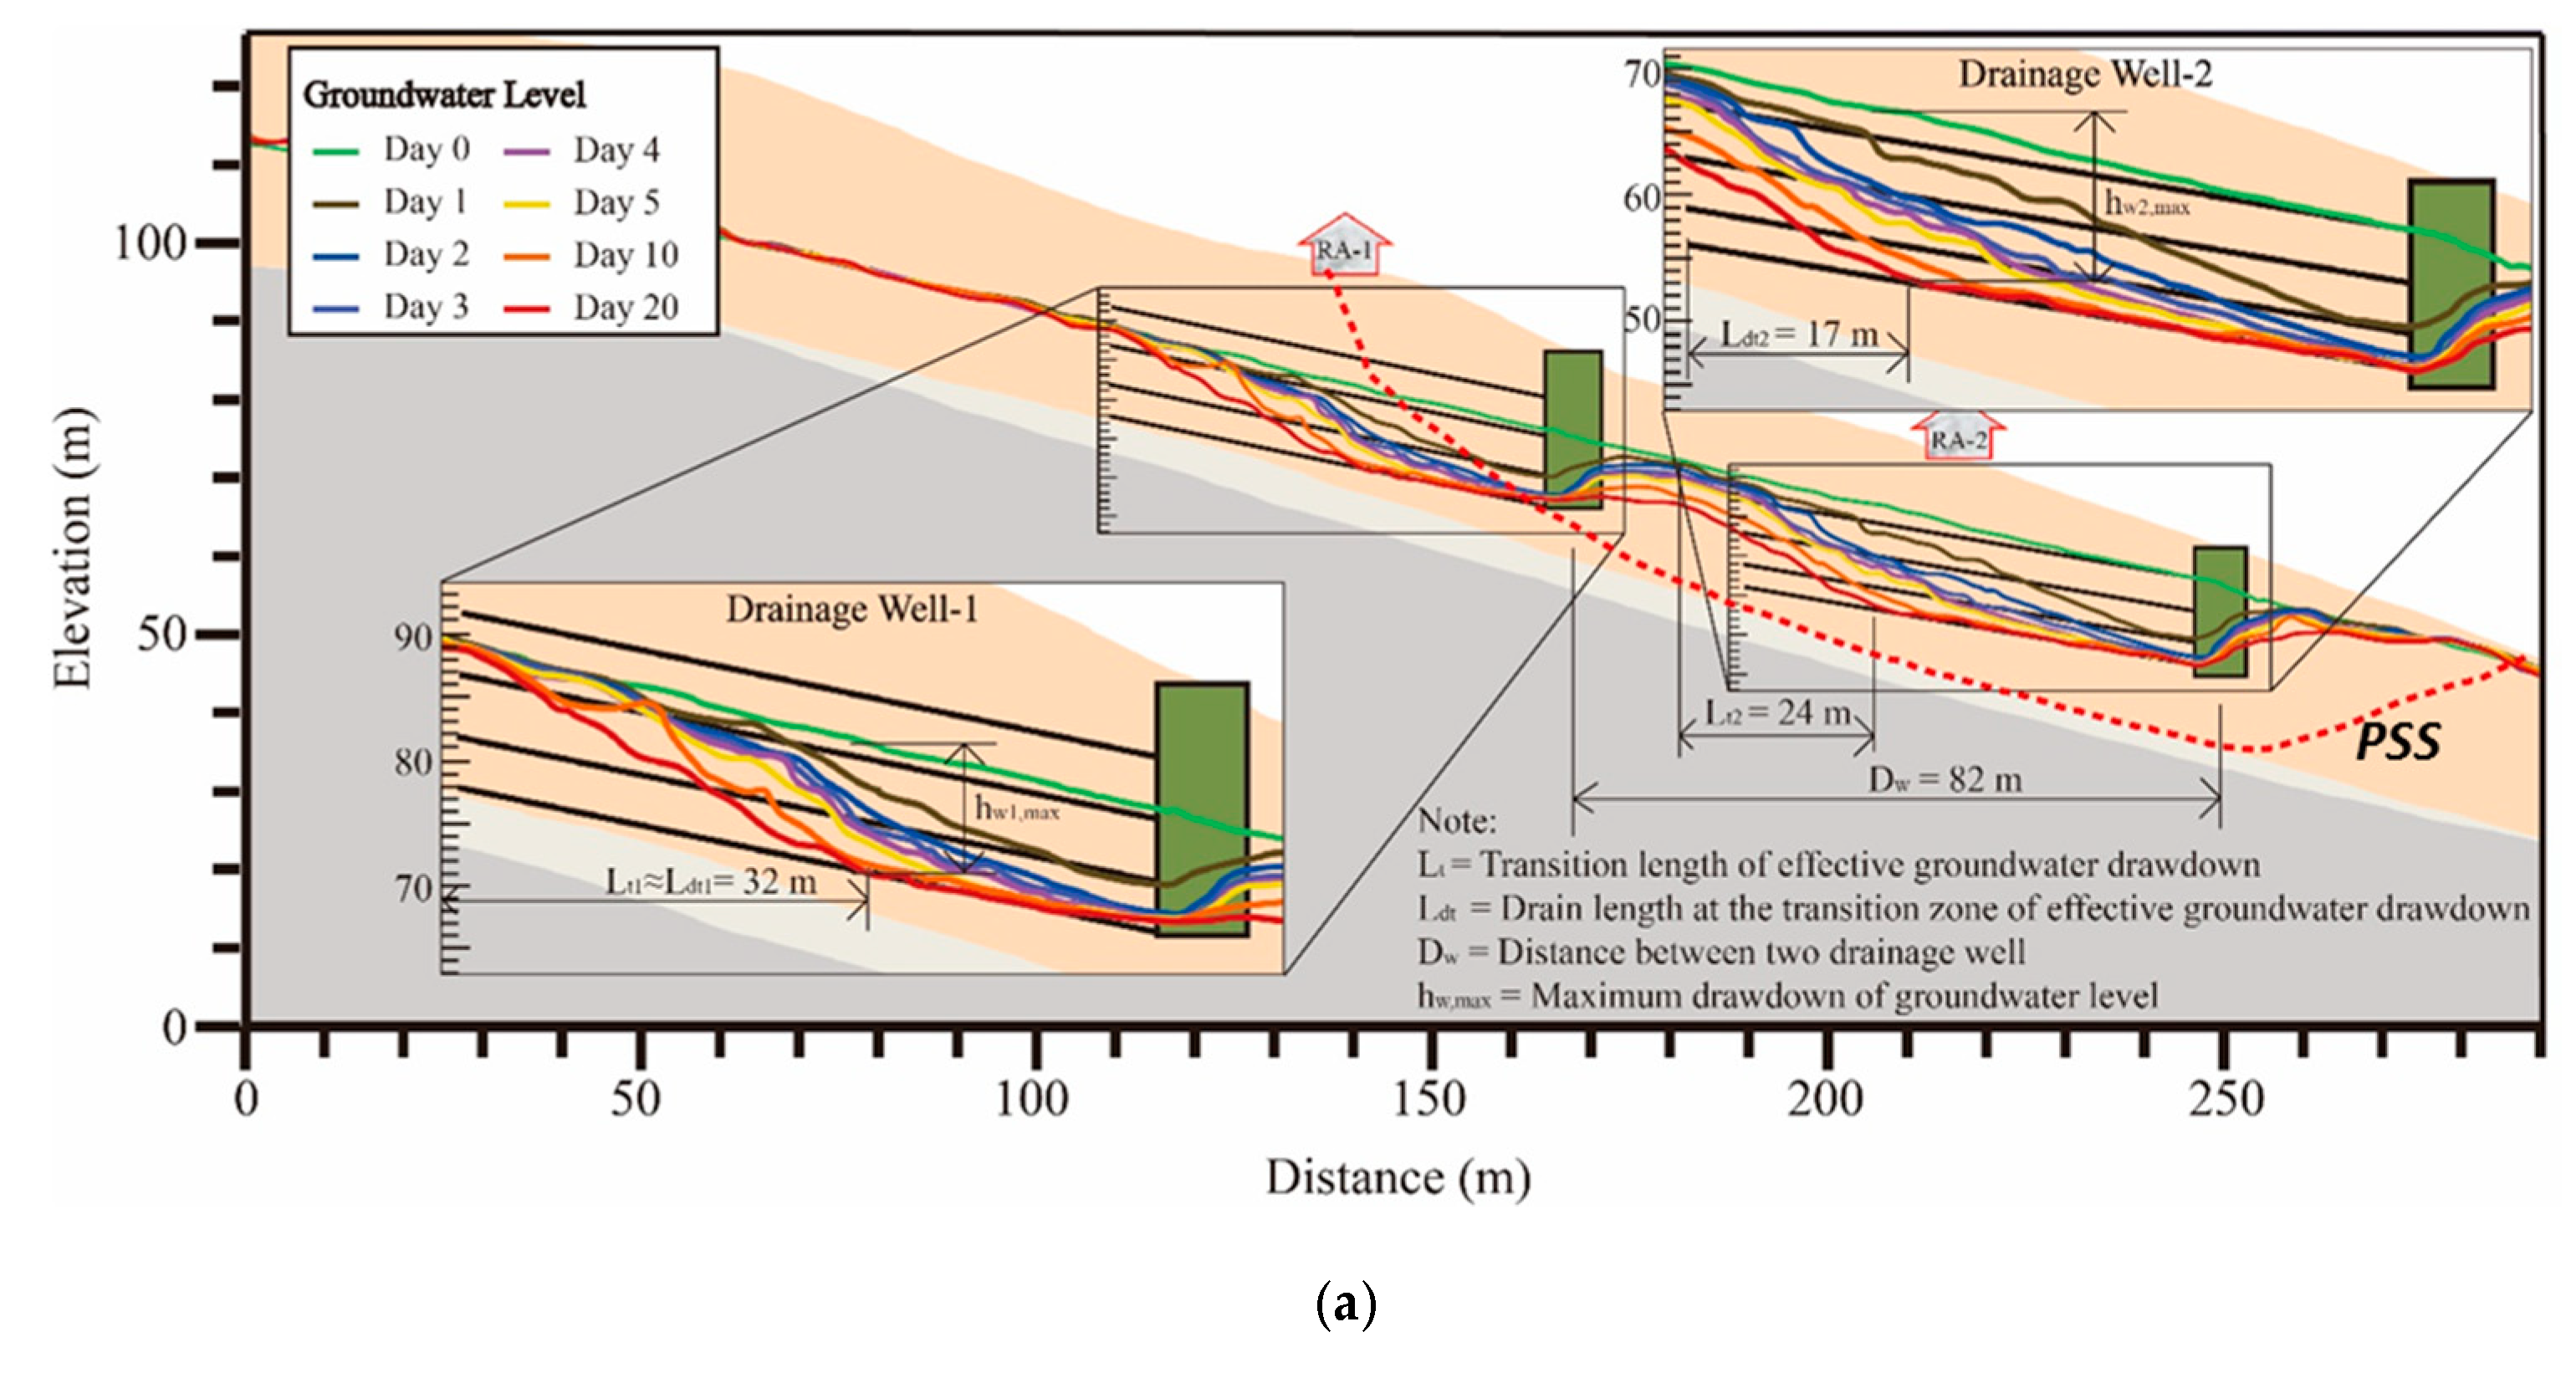
Three-dimensional finite element analyses are performed to investigate the groundwater drawdown due to subsurface drainage of horizontal drains. The variation of groundwater drawdown with elapsed times along the A-A′ profile (refer to Figure 4 and Figure 12) with two drainage wells for Ks=1.0 × 10⁻⁴ cm/sec case is illustrated in Figure 13a. The A-A′ profile approximates along the middle of the fan-shape array horizontal drains. As shown in the figure, for both two drainage wells, the final groundwater level (at Day 20) after drawdown descends to the elevation of the bottom horizontal drains (4th level in Table 2). After 20 days of the subsurface drainage, the groundwater level drops from the initial groundwater level at the end of horizontal drains of Drainage Well-1 (50 m away from Drainage Well-1) to the elevation of 4th level horizontal drains at approximately 32 m (=Lt1 in Figure 13a) from the end of the horizontal drains. The length Lt1 is defined as the transition length of effective groundwater drawdown (or transition length) of Drainage Well-1. Meanwhile, the corresponding maximum groundwater drawdown is equal to 10.19 m (=hw1,max). These calculated drawdown behaviours of groundwater levels are identical with those observed in engineering practice presented by Kleppe and Denby [27].
Theoretically, the design length of the horizontal drains Ld (=50 m in this study) should be extended beyond the potential sliding surface (PSS) to achieve the groundwater drawdown within the PSS. As shown in Figure 13a, the transition length Lt1 of Drainage Well-1 is located far beyond the PSS and the drawdown area (=the area between original and drawdown groundwater level) is only partially located inside the PSS. Meanwhile, the groundwater level at the downslope of Drainage Well-1 tends to recover gradually to the original level and only a slight drawdown of the groundwater level achieved by Drainage Well-2 after 10 days of the subsurface drainage.
Moreover, in Figure 13a, a length of Ldt2 for Drainage Well-2 is defined as the drain length at the transition zone of effective groundwater drawdown (or drain length of transition zone) of Drainage Well-2. Based on the definitions of Lt1 and Ldt2, it can be seen that the Lt1 approximates the Ldt1 for Drainage Well-1 (Lt1= Ldt1=32 m) whereas the Lt2 (=24 m) interrupted by the groundwater drawdown at the downslope of Drainage Well-1 is not coincident with Ldt2 (=17 m) for Drainage Well-2. Further on, the transition length Lt1 or Lt2 is dependent on the elevation difference between the initial groundwater table and the top drains, which is coincident with those presented by Klepp and Denby (1984). According to the field condition, the 1st level horizontal drains of Drainage Well-1 are entirely situated above the initial groundwater table under dry condition whereas the 1st level horizontal drains of Drainage Well-2 are fully submerged prior to the function of subsurface drainage.
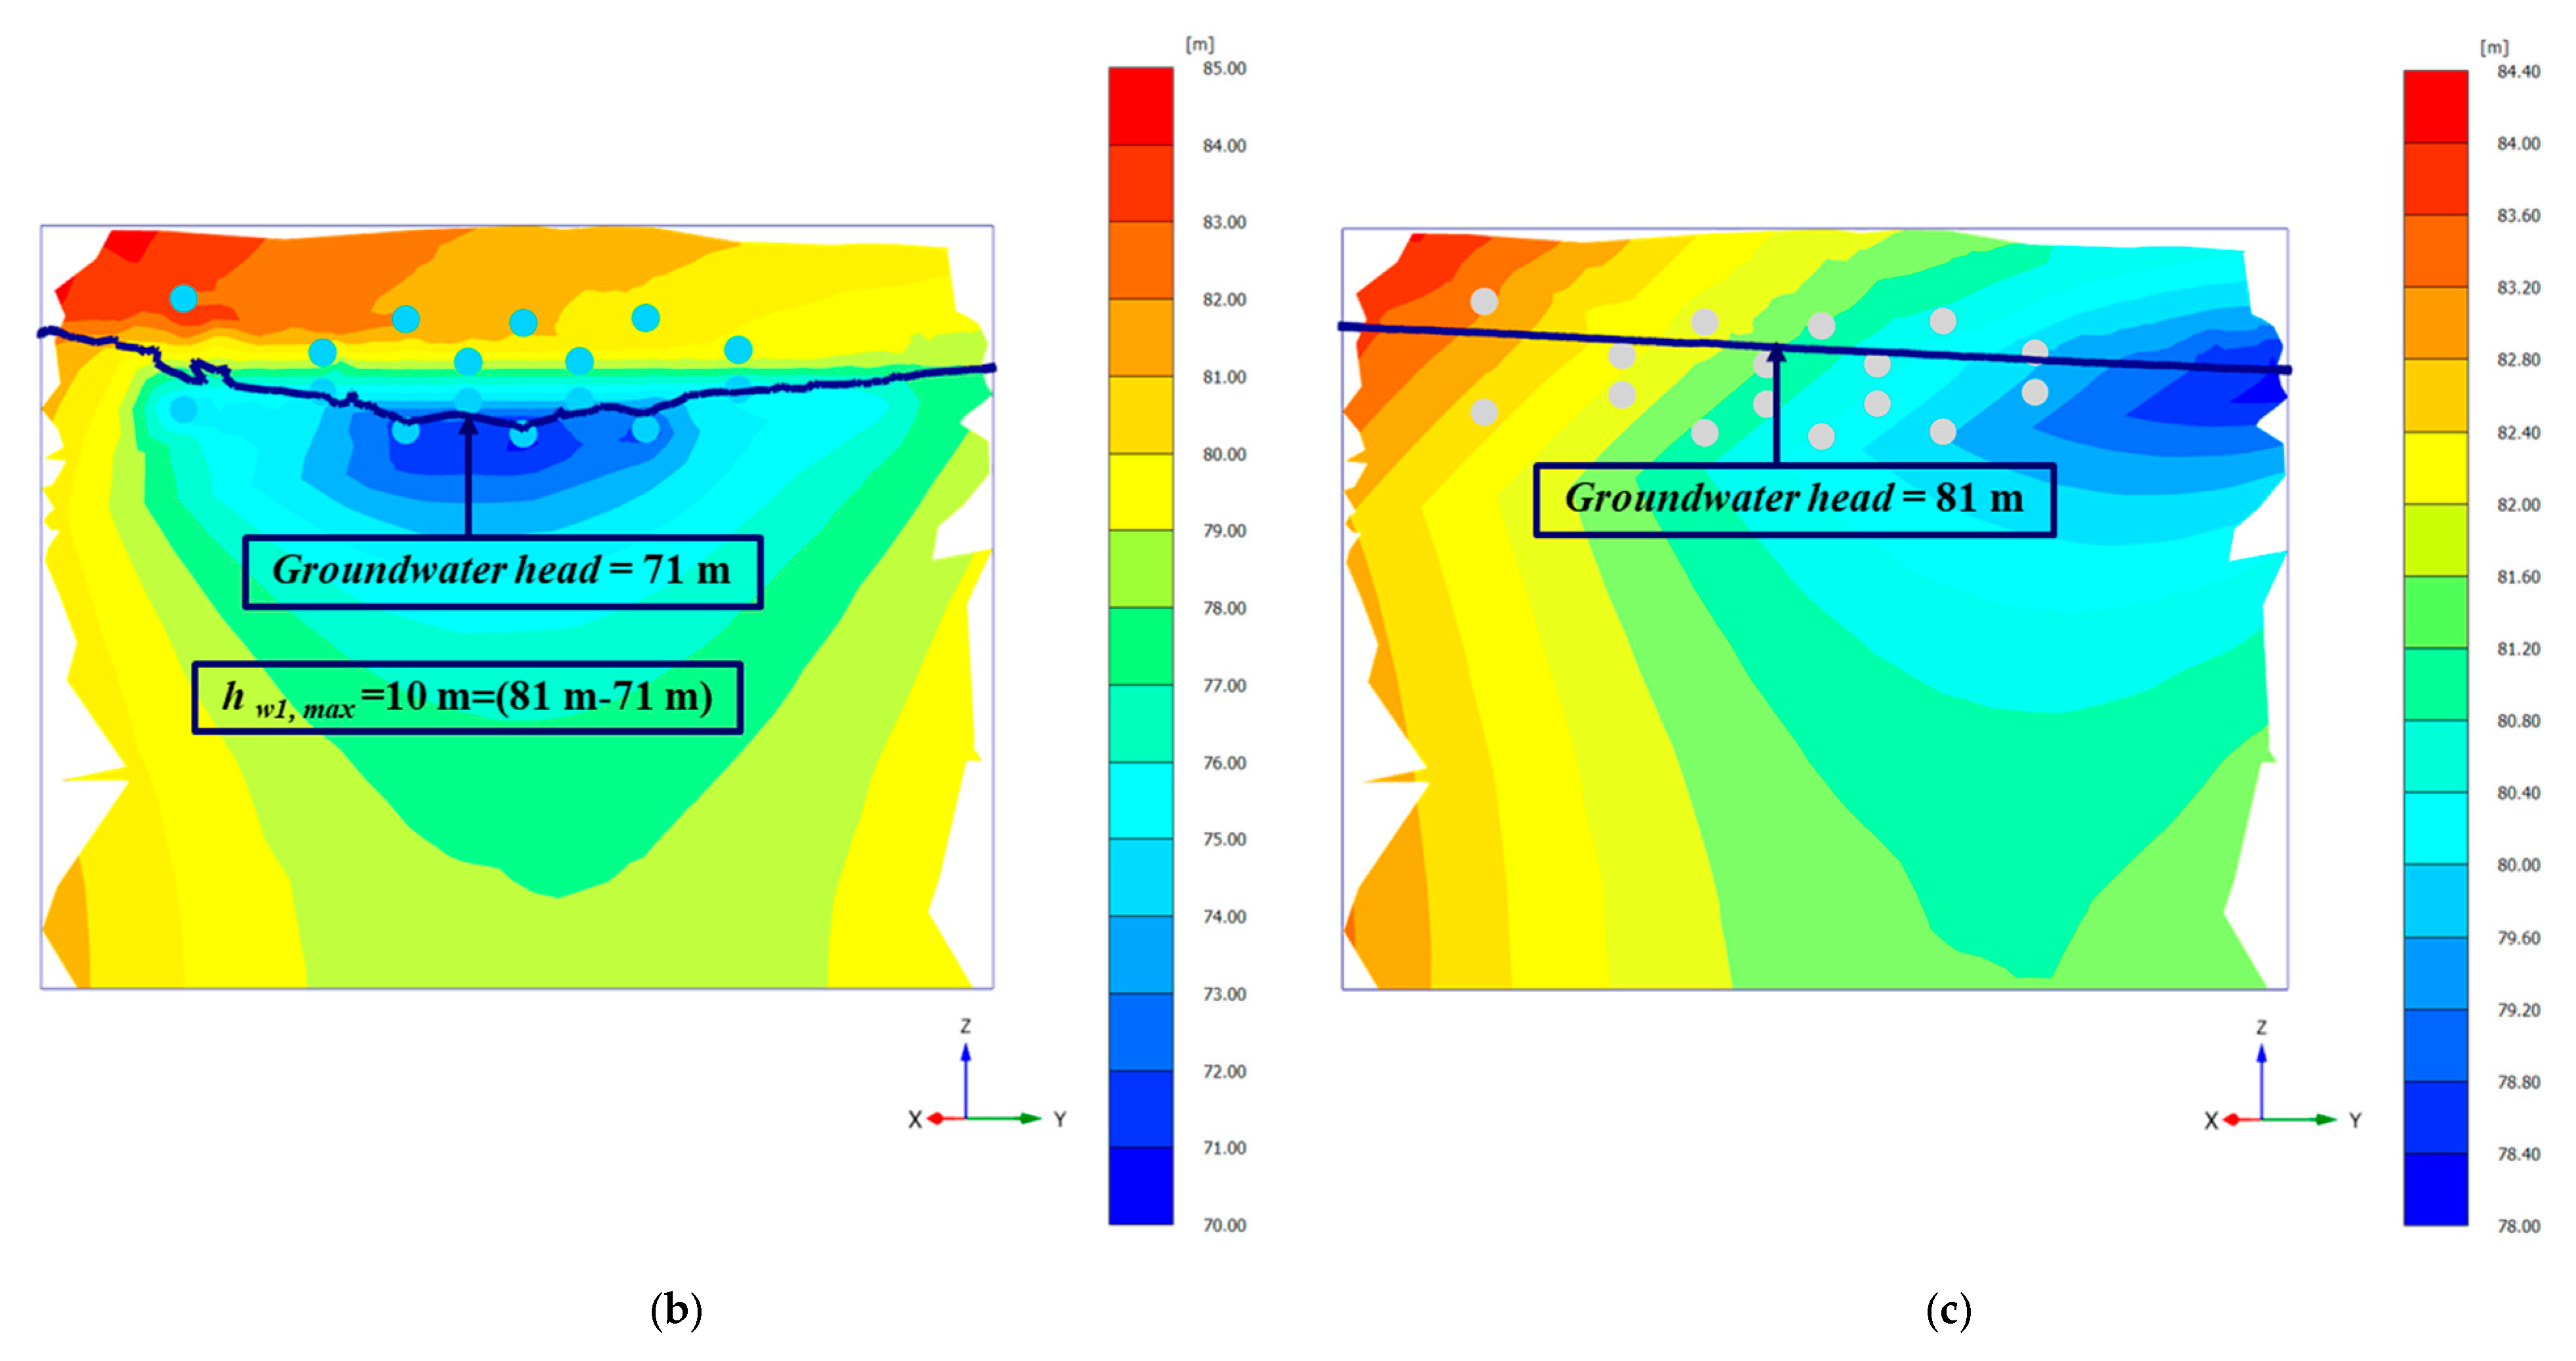
As listed in Table 5, the maximum groundwater drawdowns of Drainage Well-1 (hw1,max) and Drainage Well-2 (hw2,max) are 10.19 and 13.00 m, respectively, after 20 days of the subsurface drainage. Nevertheless, it should be noted that the groundwater flow remains at transient state after a 20-day drainage (t = 0→20 days) and the drawdown is continued with the increasing time till the steady-state (t = 0→∞ days) is reached. The drawdown rate and drainage efficiency of Drainage Well-2 is higher than those of Drainage Well-1 due to the fact that the horizontal drains of Drainage Well-2 are mainly placed at the middle-zone of PSS and extended across a large range of soil mass within PSS allowing more groundwater flowing into the drains. Figure 13b displays the transverse variation of groundwater level and colourful groundwater head (or total pore pressure head=steady-state pore pressures head+excess pore pressures head) contour along the C1-C1′ profile (Figure 12) which is perpendicular to the A-A′ profile and adjacent to residential area RA-1. In contrast, Figure 13c illustrates the groundwater level before the subsurface drainage starts. It can be found that after 20 days of the subsurface drainage, the groundwater level is dropped to the elevation of bottom drains. The groundwater head at the middle of the groundwater table along the C1-C1′ profile approximate 81.0 m (light yellow-green colour) and 71.0 m (light grey-blue colour) before and after the subsurface drainage and the difference of 10 m is very close to the groundwater drawdown of 10.19 m in Table 5.
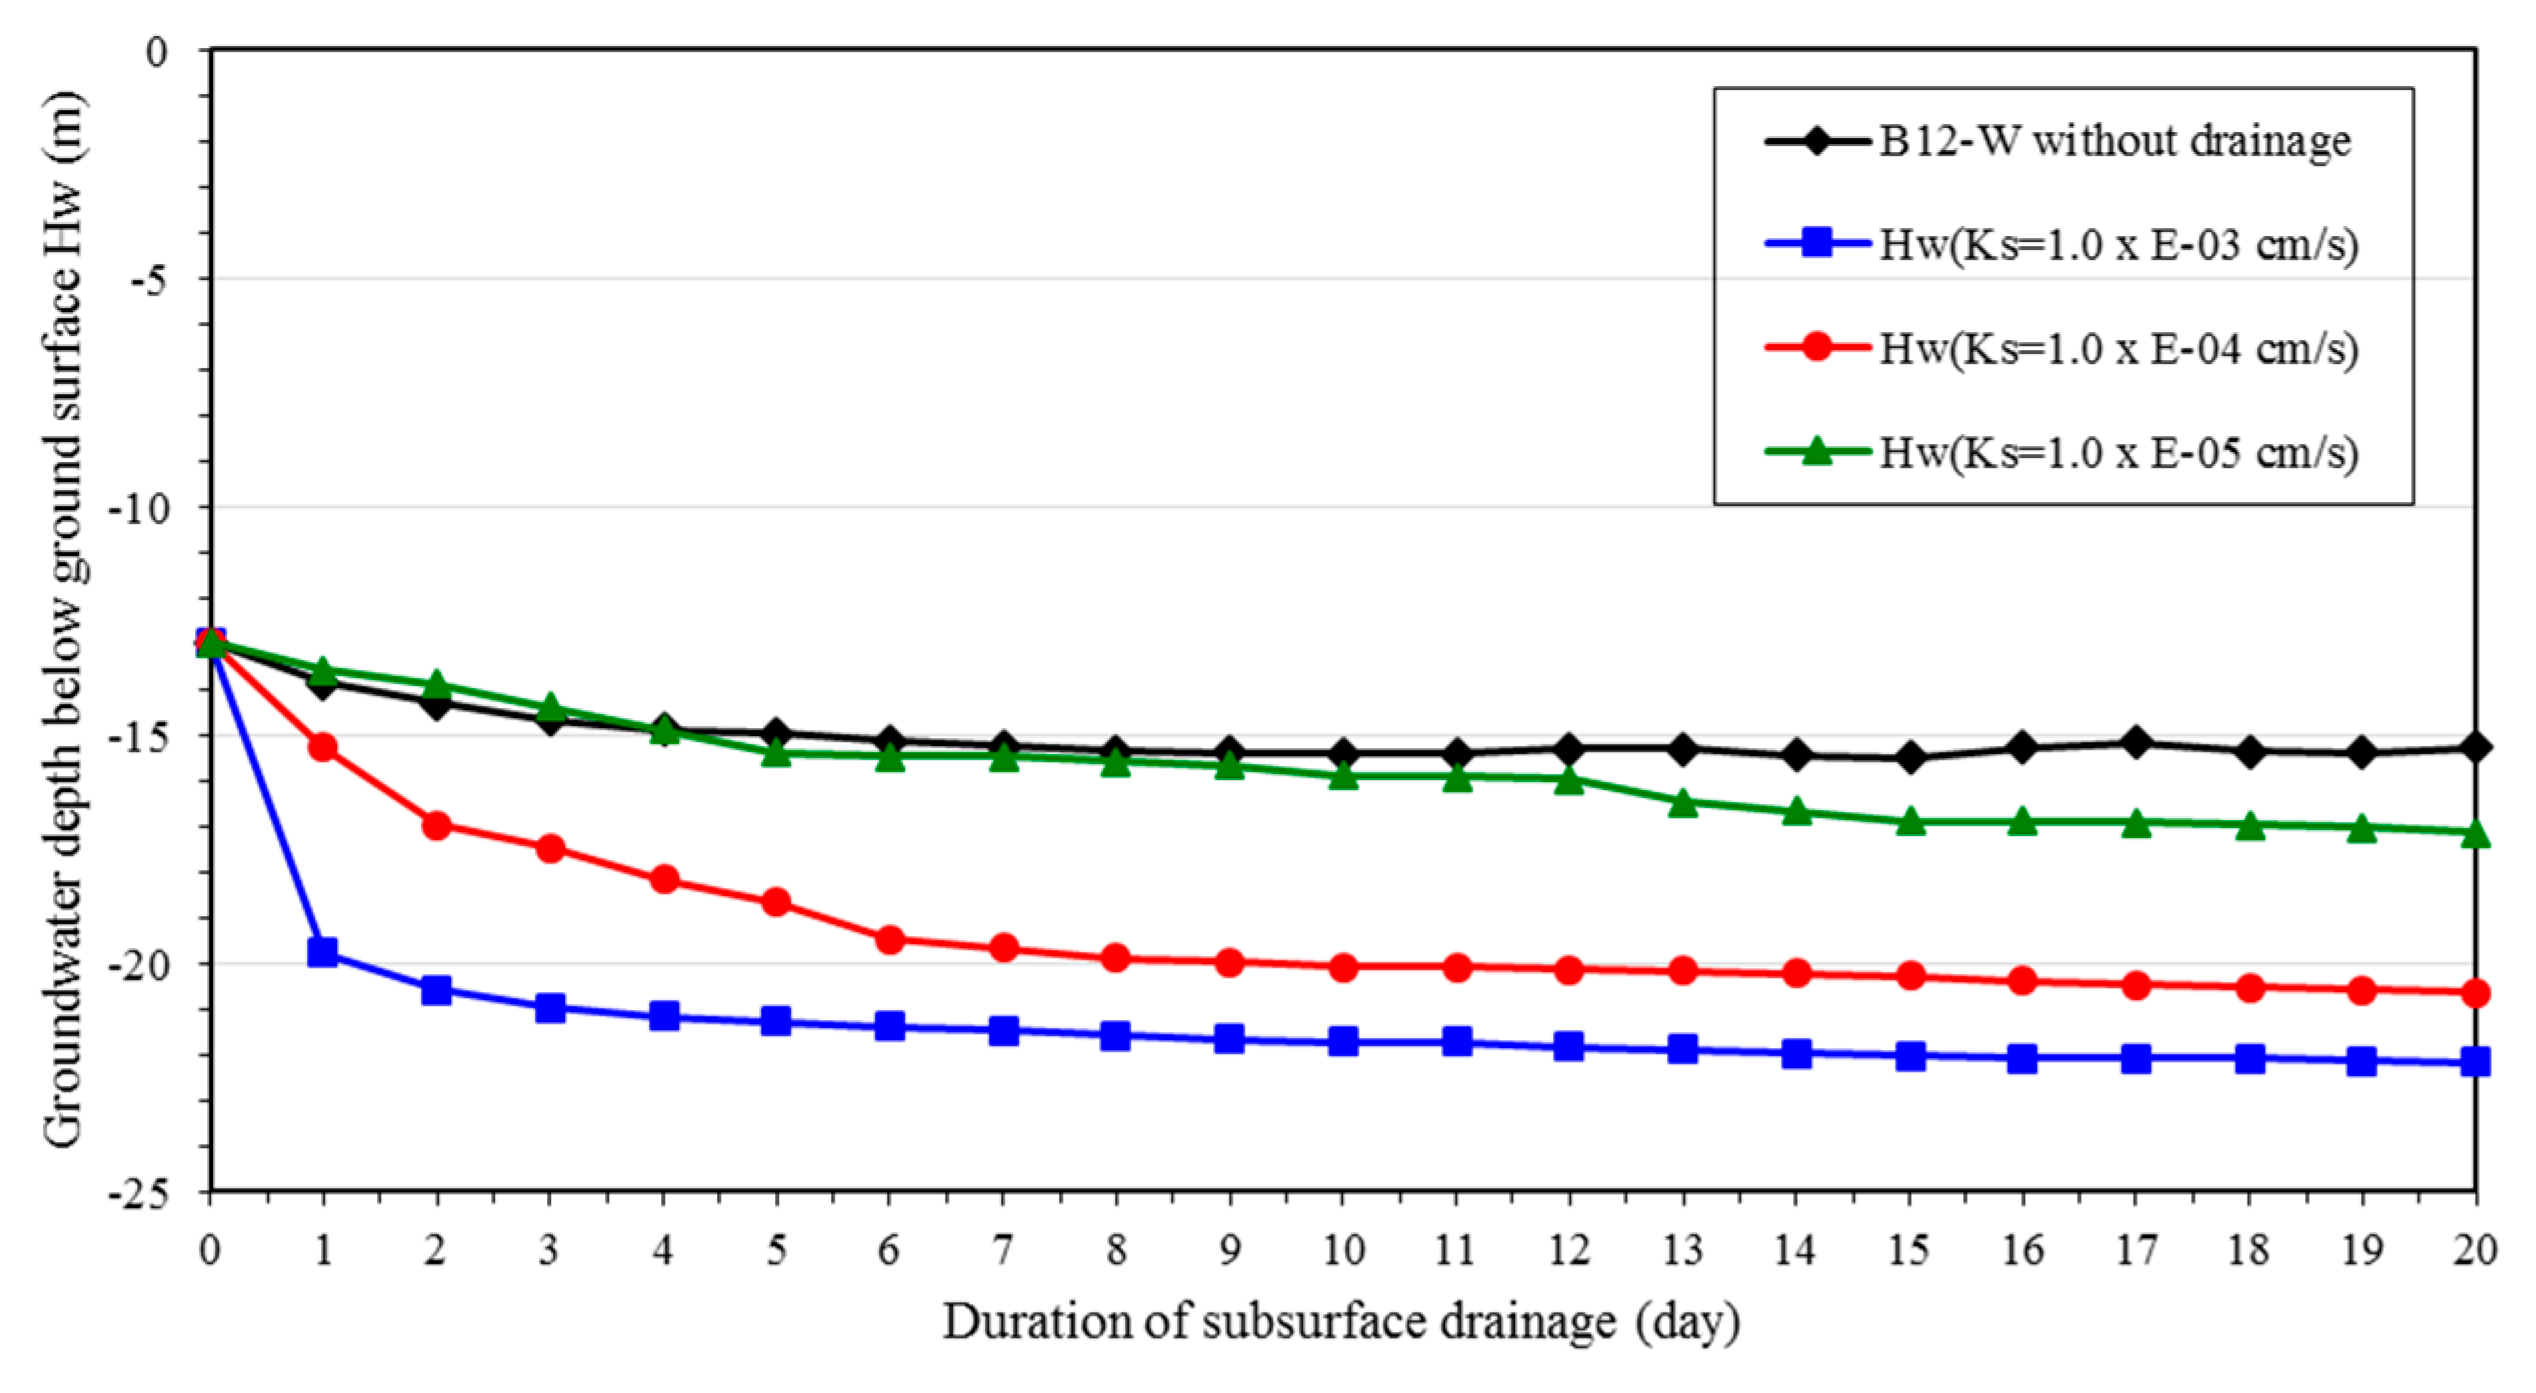
Figure 14 presents the calculated groundwater depth (Hw) of observation well B12-W (monitoring point B12-W in Figure 4) for a 20-day subsurface drainage in the You-Ye-Lin landslide. In Figure 14, the initial groundwater depth (−13.0 m for t = 0) of B12-W without the subsurface drainage is determined by a steady-state groundwater flow calculation under constant head boundary conditions assigned to represent the rainfall effect during Typhoon Megi. The initial groundwater depth of simulation (−13.0 m for t = 0 in Figure 14) is in excellent agreement with that of observation (−12.97 m in Table 1) and the validity of numerical model for hydraulic calculation can be verified. Subsequently, the groundwater depth of B12-W without the drainage remediation is monitored for 20 days (t = 0→20 days) and compared with those with the subsurface drainage with different hydraulic conductivities of the colluvium (KS =1.0 × 10⁻⁵, 1.0 × 10⁻⁴, and 1.0 × 10⁻³ cm/sec). For the three hydraulic conductivities of the colluvium, the maximum drawdown of the transient analysis approximates 1.84, 5.31, and 6.89 m for a 20-day subsurface drainage and it can reach a final drawdown of 9.50 m=(22.5 m−13.0 m) for a steady-state calculation. In general, the drawdown rate (or drainage efficiency) is promoted with an increasing permeability of the colluvium and estimated to be 2.67 m/day (within 3 days for KS =1.0 × 10⁻³ cm/sec), 1.50 m/day (within 6 days for KS =1.0 × 10⁻⁴ cm/sec), and 0.27 m/day (within 13 days for KS =1.0 × 10⁻⁵ cm/sec). For the colluvium with lower permeability (KS ≤ 1.0 × 10⁻⁵ cm/sec), the drainage efficiency of subsurface drainage can be comparatively uneconomical.
Table 6 summarizes the variations of the groundwater depth of observation well B12-W, Hw(t) and the factor of safety, FS(t) of the landslide with elapsed time in response to the subsurface drainage. For the three hydraulic conductivities of the colluvium, the variation tendency of Hw(t) and FS(t) are similar and only the calculation results of KS = 1.0 × 10⁻⁴ cm/sec are presented. It is found that the factor of safety increases steadily with the drawdown of groundwater level.
4.2. Verification of Potential Sliding Surface in Dry Season without Subsurface Drainage
Figure 15a displays the total incremental displacement field calculated by SRM slope stability analysis which directs to southeast and is similar to the main direction of ground movement estimated by the directions of tension cracks, slumps, and subsidence lines as shown in Figure 15b. In addition, the calculated potential sliding area as shown in Figure 15c also approximates the measured scope of ground movement delineated by the ellipse in Figure 15b. Further on, comparing Figure 15d with Figure 6, it can be seen the calculated (−11.4 m for B12-W and −35.6 m for B09-W) and measured (−12.0 m for B12-W and −36.0 m for B09-W) depth of potential sliding surface along B-B’ profile (see Figure 4) are in an excellent coincidence. As a result, the effectiveness of the numerical model can be verified once more.
4.3. Comparisons of Potential Sliding Surface with and without Subsurface Drainage
Figure 16 demonstrates the effectiveness of the subsurface drainage on improving the slope stability of the landslide. The potential sliding area (Figure 16a-1) without the drainage remediation spreads out to a large area in the downslope and the corresponding potential sliding surface (PSS) along A-A′ profile (Figure 4) is also deeply seated near the bottom of drainage wells (Figure 16a-2). The study area is situated in an instability condition during typhoon season with a lower factor of safety of (FS)t=0-day =1.383. A factor of safety FS<1.0 means that the slope is at failure and it was agreed that a FS=1.5 was required to meet long term stability of remedial works [28]. In Taiwan, three FS values were adopted as technical criteria for slope engineering design: (1) for ordinary time FS≥1.50, (2) for earthquake FS≥1.2, (3) for torrential rainfall FS≥1.10. Moreover, Popescu [29] proposed a three-stage continuous spectrum of FS to define the stability state of slopes: FS>1.3 (stable), 1.0<FS<1.3 (marginally stable), and FS<1.0 (actively unstable). On the contrary, after the function of subsurface drainage and groundwater drawdown, the potential sliding area (Figure 16b-1) is confined at a limited area at the downslope and the PSS merely mobilizes at a comparatively shallow depth (Figure 16b-2). Eventually, the slope is maintained in a more stable situation with a higher factor of safety of (FS)t=20-day=1.521.
4.4. Discharge Efficiency of Horizontal Drains
Figure 17 presents the discharge rate (or discharge capacity) of the two drainage wells in the typhoon season. The subscripts w1, w2 and d1~d4 represent the Drainage Well-1, Drainage Well-2, and 1st ~4th level of horizontal drains. In the typhoon season, the average initial groundwater level prior to the subsurface drainage approximates 11.0 m below ground surface for Drainage Well-1 and 5.0 m below ground surface for Drainage Well-2. For Drainage Well-1, 1st and 2nd level horizontal drains are placed at 5.0 m and 10.0 m below the ground surface which are above the average initial groundwater level (11.0 m below ground surface). Under such circumstances, the discharge rate of 1st and 2nd level horizontal drains (Qw1d1 and Qw1d2) becomes zero and ineffective for groundwater drawdown as shown in Figure 17a. Concurrently, the Drainage Well-2 (Qw2d1 and Qw2d2) possesses a similar situation to the Drainage Well-1 as shown in Figure 17b.
On the contrary, 4th level horizontal drains for both drainage wells (Qw1d4=163.104 m3/day and Qw2d4 =236.664 m3/day) exhibit the highest discharge rate. According to the parametric study and field monitoring results, Rahardjo et al. also indicated that the horizontal drain is most effective and beneficial for the subsurface drainage when it is located at the bottom zone of the slope [8,9]. However, the discharge rate of 3rd and 4th level horizontal drains decrease gradually with elapsed time due to the groundwater drawdown. The total discharge rate of Drainage Well-2 (Qw2) is higher than that of Drainage Well-1 (Qw1) because the horizontal drains of Drainage Well-2 are all located below the groundwater level (refer to t = 0 day in Figure 13a). Table 7 summarizes discharge rates of horizontal drains at different elevations of the well shaft and the total discharge rate of drainage wells. In You-Ye-Lin landslide, the discharge rate of a single shallow horizontal drain varies in a range of 54.60~0.18 m3/day in dry season.
4.5. Considerations to the Location Adjustment of Drainage Wells
As shown in Figure 18, the circular points represent the contact point of the horizontal drain. According to the calculated groundwater drawdown, it is obvious that both drainage wells (Drainage Well-1 and Drainage Well-2) can be moved down simultaneously to improve the drainage efficiency of horizontal drains within the main sliding body or within the potential sliding surface (PSS). Considering (1) the effective zone of groundwater drawdown with a range of 24 m at the upslope of Drainage Well-1 (2) the ineffective zone of groundwater drawdown with a range of 13.5 m at the downslope of Drainage Well-1, Drainage Well-1 and Drainage Well-2 can be moved a horizontal distance of 24 m and 10.5 m (=24 m–13.5 m) respectively to Adjusted Well-1 and Adjusted Well-2 as illustrated in Figure 18.
If Drainage Well-1 were substituted by Adjusted Well-1, the effective zone of groundwater drawdown at the upslope will be situated within the main sliding body of the landslide and compensates the ineffective zone of groundwater drawdown at the downslope. On the other hand, if Drainage Well-2 were substituted by Adjusted Well-2, the effective zone of groundwater drawdown at the upslope can shelter more unstable area within the main sliding body of the landslide. As a consequence, the overall drainage efficiency of the subsurface drainage system in the landslide can be greatly promoted.
5. Conclusions
Based on the field monitoring and 3D fully coupled flow-deformation numerical analyses, the appropriateness of the two deep drainage wells on the groundwater drawdown and slope stabilization are inspected. The slope stability is evaluated by the evolution of potential sliding area and the corresponding factor of safety using SRM. The two deep drainage wells with multi-level horizontal drains are effective to increase the slope stability and reduce the landslide potential. According to the numerical results, the following conclusions can be drawn:
- (1)
- The effectiveness of the fully coupled flow-deformation numerical model for steady-state and transient groundwater flow calculations and slope stability analyses using SRM is verified thru (a) the calibration of the initial groundwater depth of B12-W monitoring point (−13.0 m from simulation and −12.97 m from observation); (b) the ground movement direction of the landslide (toward southeast from simulation and observation); (c) the depth of potential sliding surface (PSS) along B-B′ profile (−11.4 m for B12-W and −35.6 m for B09-W from simulation) and (−12.0 m for B12-W and −36.0 m for B09-W from observation).
- (2)
- In general, the design of the drain length Ld should pass through the PSS for an additional length and the transition length Lt1 should be situated at the main part of the sliding body to achieve the maximum groundwater drawdown result within the PSS. However, in this study, the Lt1 length locates far beyond the PSS which lowers the effectiveness of the groundwater drawdown on promoting the stability of the PSS.
- (3)
- Drainage Well-1 and Drainage Well-2 can be moved toward downslope by a horizontal distance of 24 and 10.5 m, respectively, to improve the drainage efficiency. After such an adjustment, the groundwater drawdown and slope stabilization becomes more effective on the PSS due to the fact the Lt1 length is configured within the main sliding body. In addition, the groundwater level at the downslope of Drainage Well-1 can be effectively dropped by Drainage Well-2 because of the reduction of the distance between the two drainage wells.
- (4)
- Conclusively, the drainage well may exhibit higher drainage efficiency and groundwater drawdown rate if the corresponding horizontal drains are mainly placed at the middle-zone of PSS and extend across a large area of soil mass within PSS to allow for groundwater flow into the drains.
- (5)
- For the horizontal drains situated above the groundwater table, the subsurface drainage becomes ineffective to the groundwater drawdown. For both drainage wells, the bottom horizontal drains have the highest discharge rate. In addition, the groundwater drawdown rate (or drainage efficiency) of a subsurface drainage system can be promoted with an increasing hydraulic conductivity of the colluvium, however, it may turn into uneconomical for the colluvium with a lower permeability (KS < 1.0 × 10⁻⁵ cm/sec).
- (6)
- Eventually, it should be pointed out that the subsurface drainage remediation with high engineering cost remains necessary because of the unfeasibility of the relocation of the existing three residential communities. In addition, although the locations of the two drainage wells are not optimum, still it is considered to be appropriate because of the limitation of the land availability.
Author Contributions
D.-G.L. developed the conceptualization, and wrote the manuscript; K.-C.C. worked on the mathematical development, performed the numerical analysis; C.-Y.K. revised the manuscript; J.-C.C. analyzed the data and the data curation. All authors have read and agreed to the published version of the manuscript.
Funding
This research was supported by the Soil and Water Conservation Bureau, Taiwan, the Republic of China.
Conflicts of Interest
The authors declare no conflict of interest.
References
- Kenney, T.C.; Pazin, M.; Choi, W.S. Design of Drainage boreholes for Soil Slopes. J. Geotech. Eng. Div. ASCE 1977, 103, 1311–1323. [Google Scholar]
- Prellwitz, R.W. Analysis of Parallel Drains for Highway Cut Slope Stabilization. In Proceedings of the 16th Annual Engineering Geology and Soils Engineering Symposium, Boise, ID, USA, 5–7 April 1978; pp. 153–180. [Google Scholar]
- Nonveiller, E. Efficiency of horizontal drains on slope stability. In Proceedings of the 10th International Conference on Soil Mechanics and Foundation Engineering, Stockholm, Sweden, 15–19 June 1981; Volume 3, pp. 495–500. [Google Scholar]
- Lau, K.C.; Kenney, T.C. Horizontal drains to stabilize clay slopes. Can. Geotech. J. 1984, 21, 241–249. [Google Scholar] [CrossRef]
- Nakamura, H. Landslide control works by horizontal Drainage works. In Proceedings of the 5th International Symposium on Landslides, Lausanne, Switzerland, 10–15 July 1988; Volume 2, pp. 893–896. [Google Scholar]
- Cai, F.; Ugai, K.; Wakai, A.; Li, Q. Effects of horizontal drains on slope stability under rainfall by three-dimensional finite element analysis. Comput. Geotech. 1998, 23, 255–275. [Google Scholar] [CrossRef]
- Rahardjo, H.; Leong, E.C. Horizontal Drains in Unsaturated Soil Slopes. In Proceedings of the 3rd International Conference on Unsaturated Soils, Recife, Brazil, 10–13 March 2002; pp. 773–777. [Google Scholar]
- Rahardjo, H.; Hritzuk, K.J.; Leong, E.C.; Rezaur, R.B. Effectiveness of drainage boreholes for slope stability. Eng. Geol. 2003, 69, 295–308. [Google Scholar] [CrossRef]
- Rahardjo, H.; Satyanaga1, A.; Leong, E.C. Unsaturated Soil Mechanics for Slope Stabilization. Geotech. Eng. J. SEAGS AGSSEA 2012, 43, 48–58. [Google Scholar]
- Eberhardt, E.; Bonzanigo, L.; Loew, S. Long-term investigation of a deep-seated creeping landslide in crystalline rock. Part II. Mitigation measures and numerical modelling of deep drainage at Campo Vallemaggia. Can. Geotech. J. 2007, 44, 1181–1199. [Google Scholar] [CrossRef]
- Tacher, L.; Bonnard, C.; Laloui, L.; Parriaux, A. Modelling the behaviour of a large landslide with respect to hydrogeological and geomechanical parameter heterogeneity. Landslides 2005, 2, 3–14. [Google Scholar] [CrossRef] [Green Version]
- Matti, B.; Tacher, L.; Commend, S. Modelling the efficiency of a drainage gallery work for a large landsldie with respect to hydrological heterogeneity. Can. Geotech. J. 2012, 49, 968–985. [Google Scholar] [CrossRef] [Green Version]
- Lin, D.G. Design Guidelines of Subsurface Horizontal Drains Used for Slope Stabilization-Theory and Practice; Department of Soil and Water Conservation, National Chung Hsing University: Taichung, Taiwan, 2018. (In Chinese) [Google Scholar]
- Lin, D.G.; Chang, K.C.; Choo, E.; Su, M.B. Evaluating the Efficiency of Subsurface Drainage Systems during Large Landslides. J. Chin. Soil Water Conserv. 2018, 49, 199–213. (In Chinese) [Google Scholar]
- Long, M.T. Camp Five Slide−Exploration, Design and Construction of a Horizontal Drain Solution. In Proceedings of the 22nd Symposium on Engineering Geology and Soils Engineering, Boise, ID, USA, 24–26 February 1986; pp. 246–265. [Google Scholar]
- Royster, D.L. Horizontal Drains and Horizontal Drilling: An Overview. In Rock Classifications and Horizontal Drilling and Drainage: Transportation Research Record 783; Transportation Research Board, National Academy of Sciences: Washington, DC, USA, 1980; pp. 16–20. [Google Scholar]
- Smith, T.W.; Stafford, G.V. Horizontal drains on California highways. J. Soil Mech. Found. Div. ASCE 1957, 83, 1–26. [Google Scholar]
- Huculak, N.A.; Brawner, C.O. The use of horizontal drains in landslide stabilization. In Proceedings of the 42nd Annual Canadian Good Roads Conference, Toronto, ON, Canada, 12–16 September 1961; pp. 383–400. [Google Scholar]
- Hunt, R.E. Geotechnical Engineering Investigation Hand-Book, 2nd ed.; Taylor and Francis Group: Boca Raton, FL, USA, 2005; p. 1066. [Google Scholar]
- Cornforth, D.H. Landslides in Practice: Investigation, Analysis, and Remedial/Preventative Options in Soils; John Wiley & Sons, Inc.: Hoboken, NJ, USA, 2005; pp. 315–327. [Google Scholar]
- Crenshaw, B.A.; Santi, P.M. Water table profiles in the vicinity of horizontal drains. Environ. Eng. Geosci. 2004, 10, 191–201. [Google Scholar] [CrossRef] [Green Version]
- Xanthakos, P.P.; Abramson, L.W.; Bruce, D. Ground Control and Improvement; Wiley: New York, NY, USA, 1994. [Google Scholar]
- Hausmann, M.R. Slope Remediation. Proceedings: Stability and Performance of Slopes and Embankments-II. Geotechnical Special Publication No. 31; ASCE: Berkeley, CA, USA, 1992; pp. 1274–1317. [Google Scholar]
- Cook, D.; Santi, P.M.; Higgins, J.D. Horizontal landslide drain design: State-of-the-art and suggested improvements. Environ. Eng. Geosci. 2008, 14, 241–250. [Google Scholar] [CrossRef] [Green Version]
- Soil and Water Conservation Bureau, Taiwan. Handbook: A Brief Description of Remedial Plan for Li-Shan Landslide Area; Soil and Water Conservation Bureau: Taipei, Taiwan, 2003. [Google Scholar]
- Plaxis 3D. Scientific Manual; National Academies Press: Washington, DC, USA, 2016. [Google Scholar]
- Kleppe, J.H.; Denby, G.M. Design and Performance of Horizontal Drains. In First International Conference on Case Histories in Geotechnical Engineering; Missouri University of Science and Technology: Rolla, MO, USA, 1984; pp. 593–598. [Google Scholar]
- Hoek, E. Practical Rock Engineering; ResearchGate: Gatersleben, Germany, 2006; e-book; Available online: www.rocscience.com (accessed on 1 March 2020).
- Popescu, M.E. A suggested method for reporting landslide remedial measures. IAEG Bull. 2001, 60, 69–74. [Google Scholar] [CrossRef]
Figure 1.
Satellite image of the location of You-Ye-Lin landslide, study area, topography and flows in the landslide.
Figure 1.
Satellite image of the location of You-Ye-Lin landslide, study area, topography and flows in the landslide.

Figure 2.
Geological characteristics of You-Ye-Lin landslide (a) sandstone (b) shale (c) sandstone/shale alternative (d) colluvium.
Figure 2.
Geological characteristics of You-Ye-Lin landslide (a) sandstone (b) shale (c) sandstone/shale alternative (d) colluvium.

Figure 3.
Damages caused by Typhoons Morakot (2009/August/08–09) and Megi (2016/September/27–28) in You-Ye-Lin landslide.
Figure 3.
Damages caused by Typhoons Morakot (2009/August/08–09) and Megi (2016/September/27–28) in You-Ye-Lin landslide.

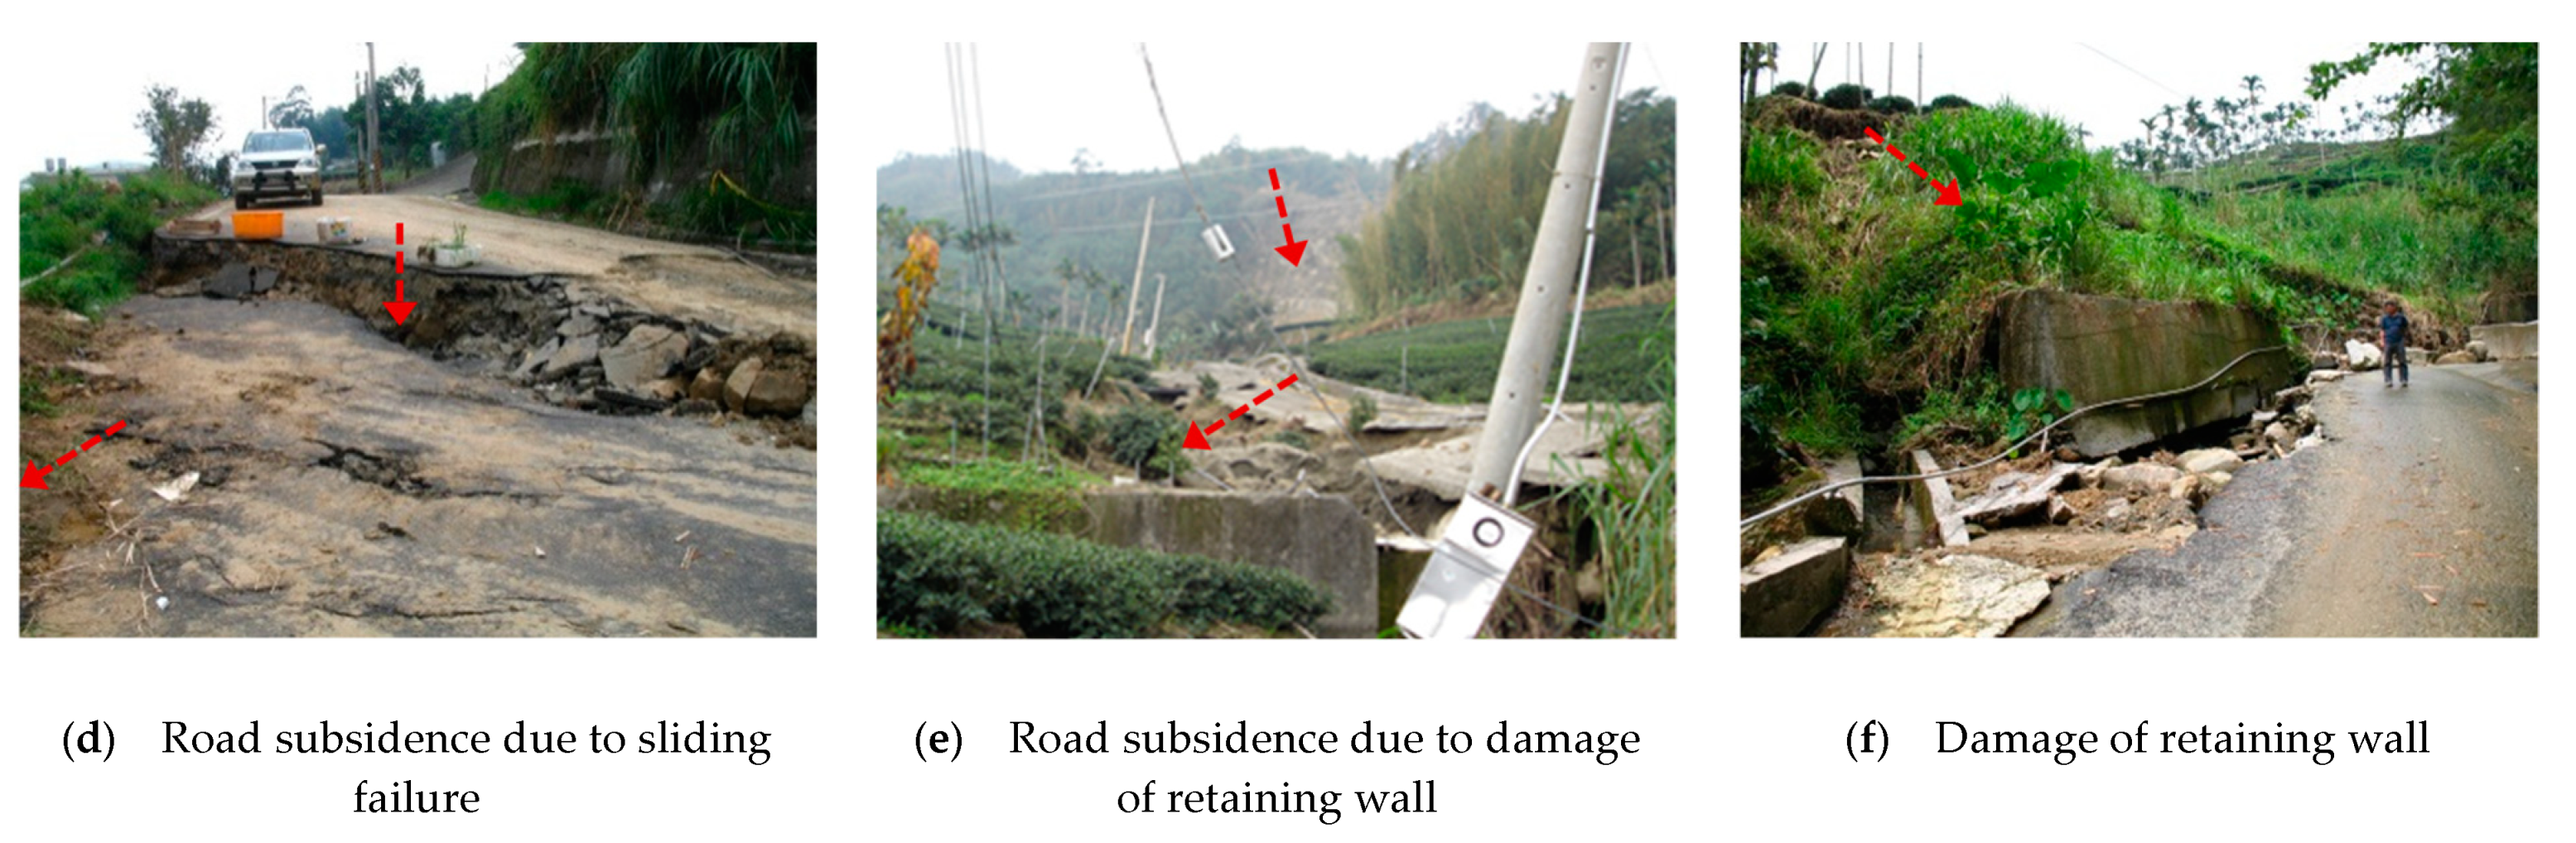
Figure 4.
Monitoring points and drainage systems in the You-Ye-Lin landslide.

Figure 5.
Groundwater level and rainfall time histories of monitoring points B09-W and B12-W.

Figure 6.
Displacement profiles of inclinometers and the potential sliding surface (PSS) along B-B′ profile (after Typhoon Megi, 2016/09/25–09/28).
Figure 6.
Displacement profiles of inclinometers and the potential sliding surface (PSS) along B-B′ profile (after Typhoon Megi, 2016/09/25–09/28).
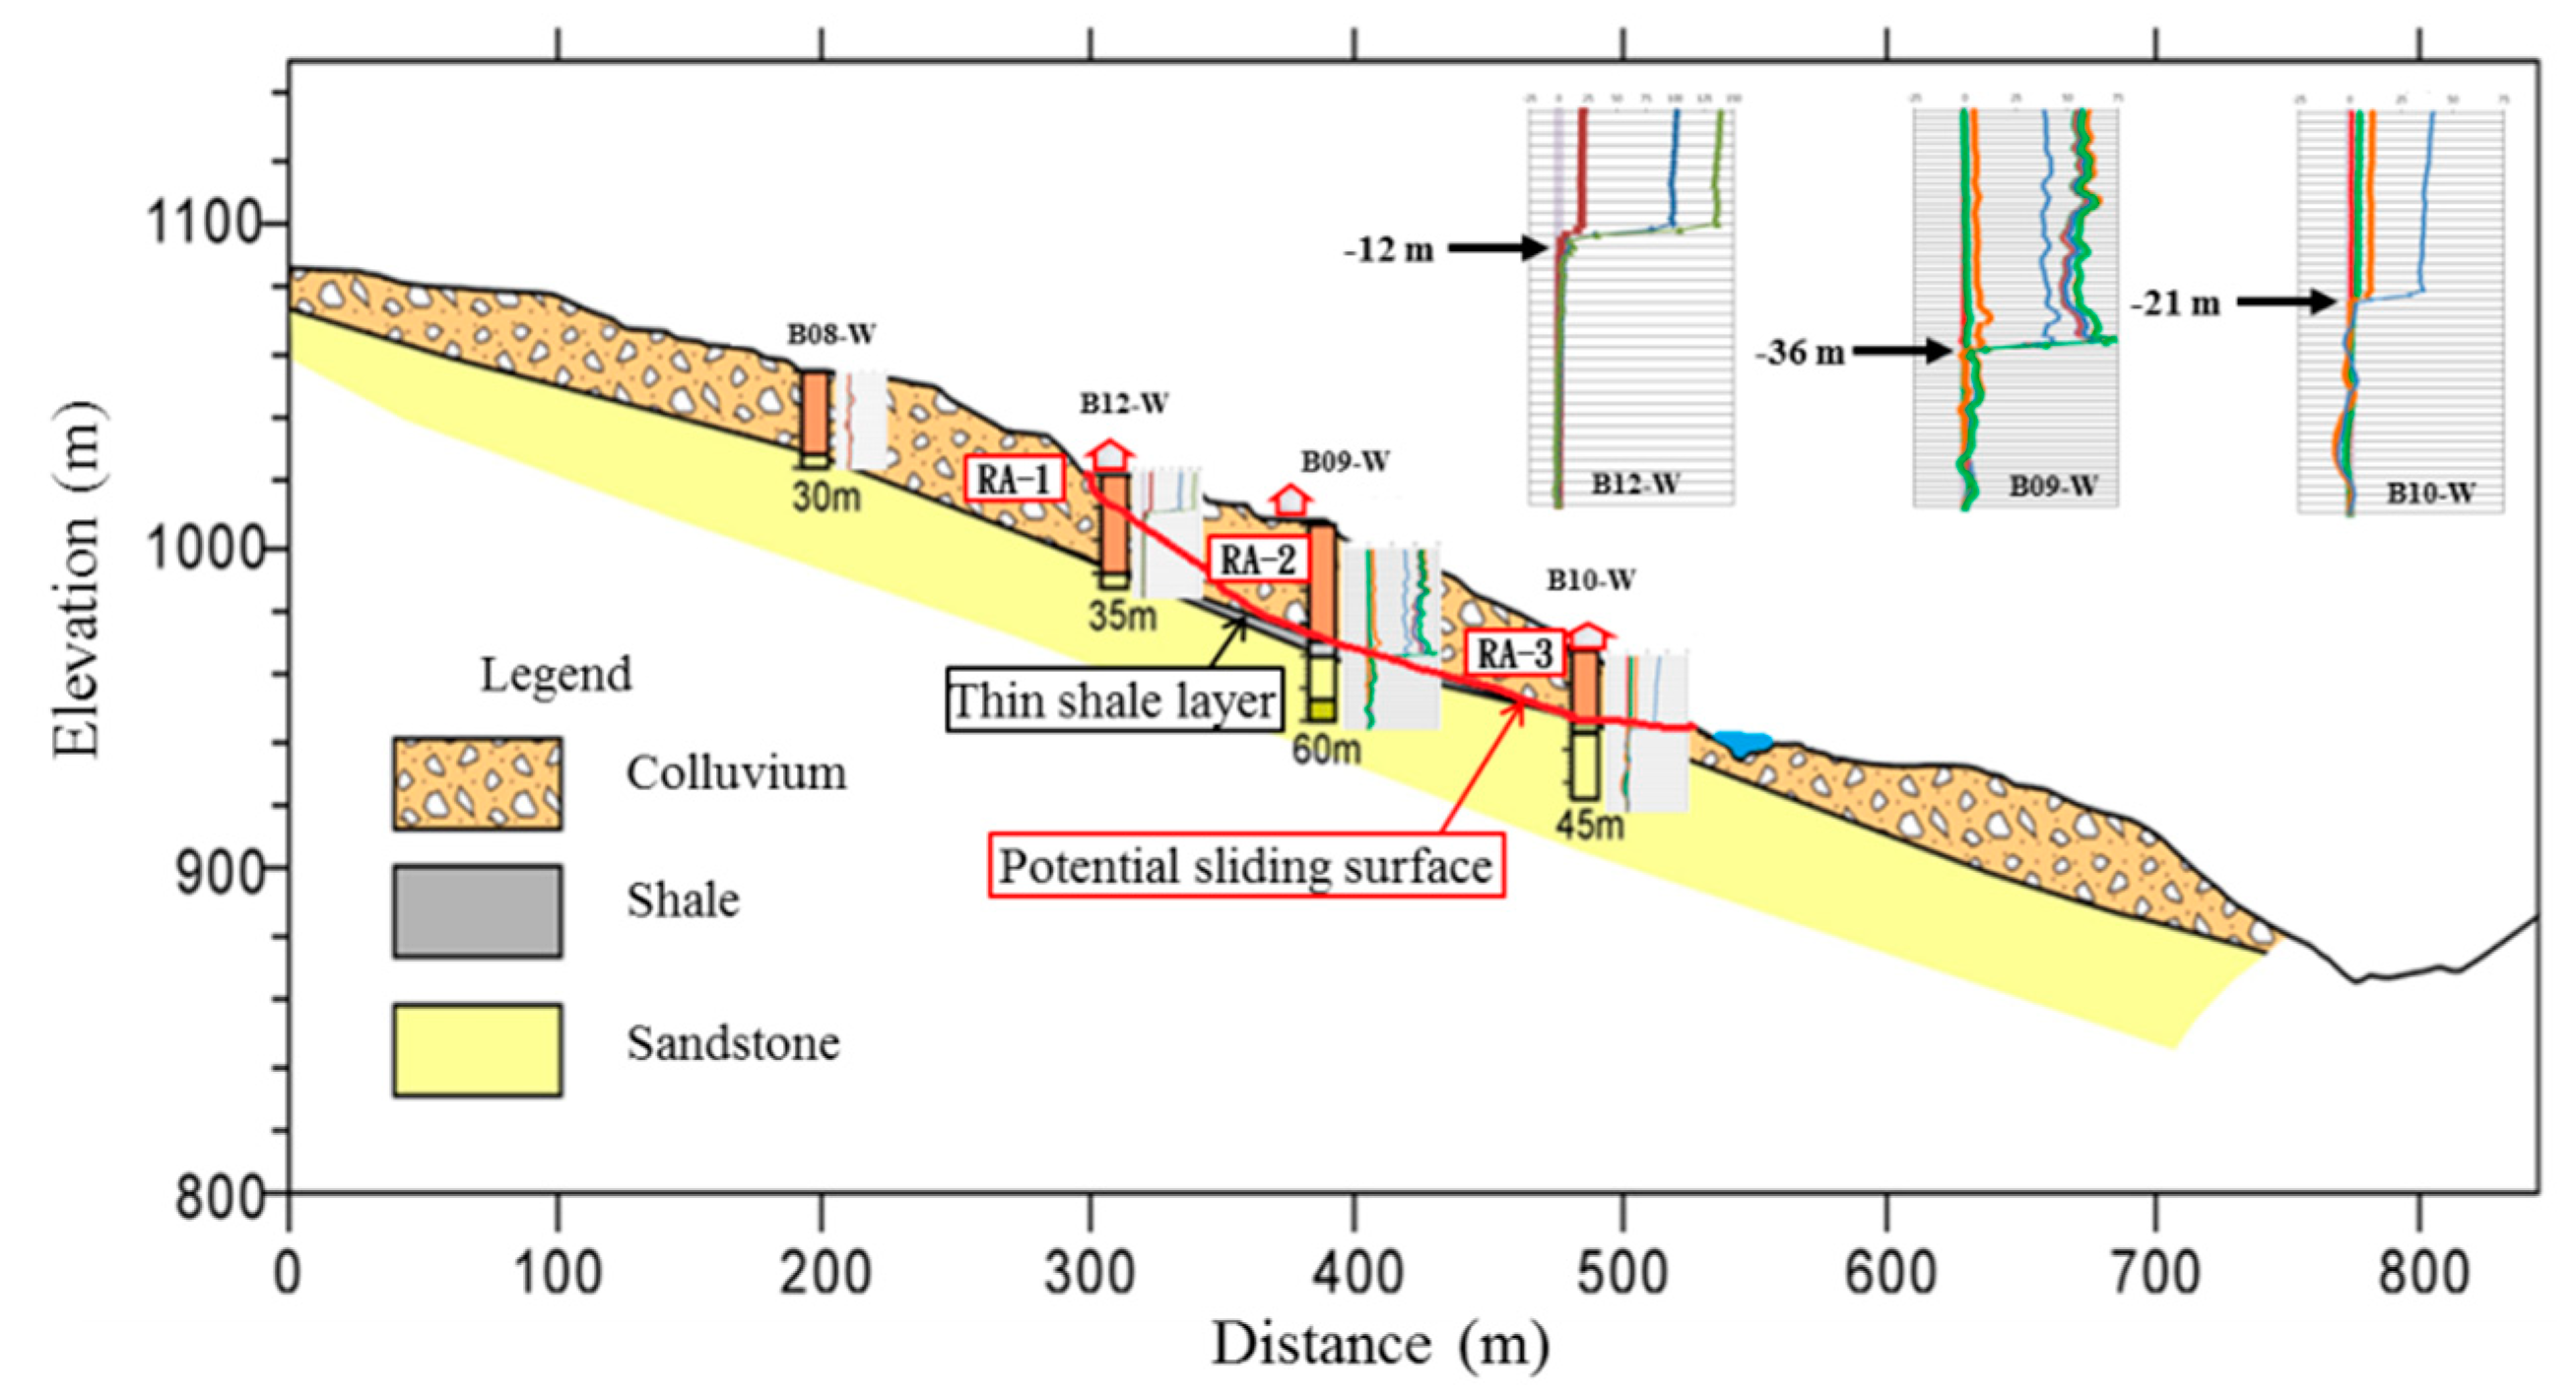
Figure 7.
Electrical resistivity survey of the You-Ye-Lin landslide. (a) Locations of resistivity profiles (RP); (b) electrical resistivity contour distribution before torrential rainfall (Typhoon Megi, 2016/09/27–09/28); (c) electrical resistivity contour distribution after torrential rainfall (Typhoon Megi, 2016/09/27–09/28).

Figure 8.
Shallow subsurface drainages of the You-Ye-Lin landslide.

Figure 9.
Typical configuration of well shaft with multi-level drainage boreholes (or horizontal drains) for large landslide (SWCB, 2003) [25].
Figure 9.
Typical configuration of well shaft with multi-level drainage boreholes (or horizontal drains) for large landslide (SWCB, 2003) [25].
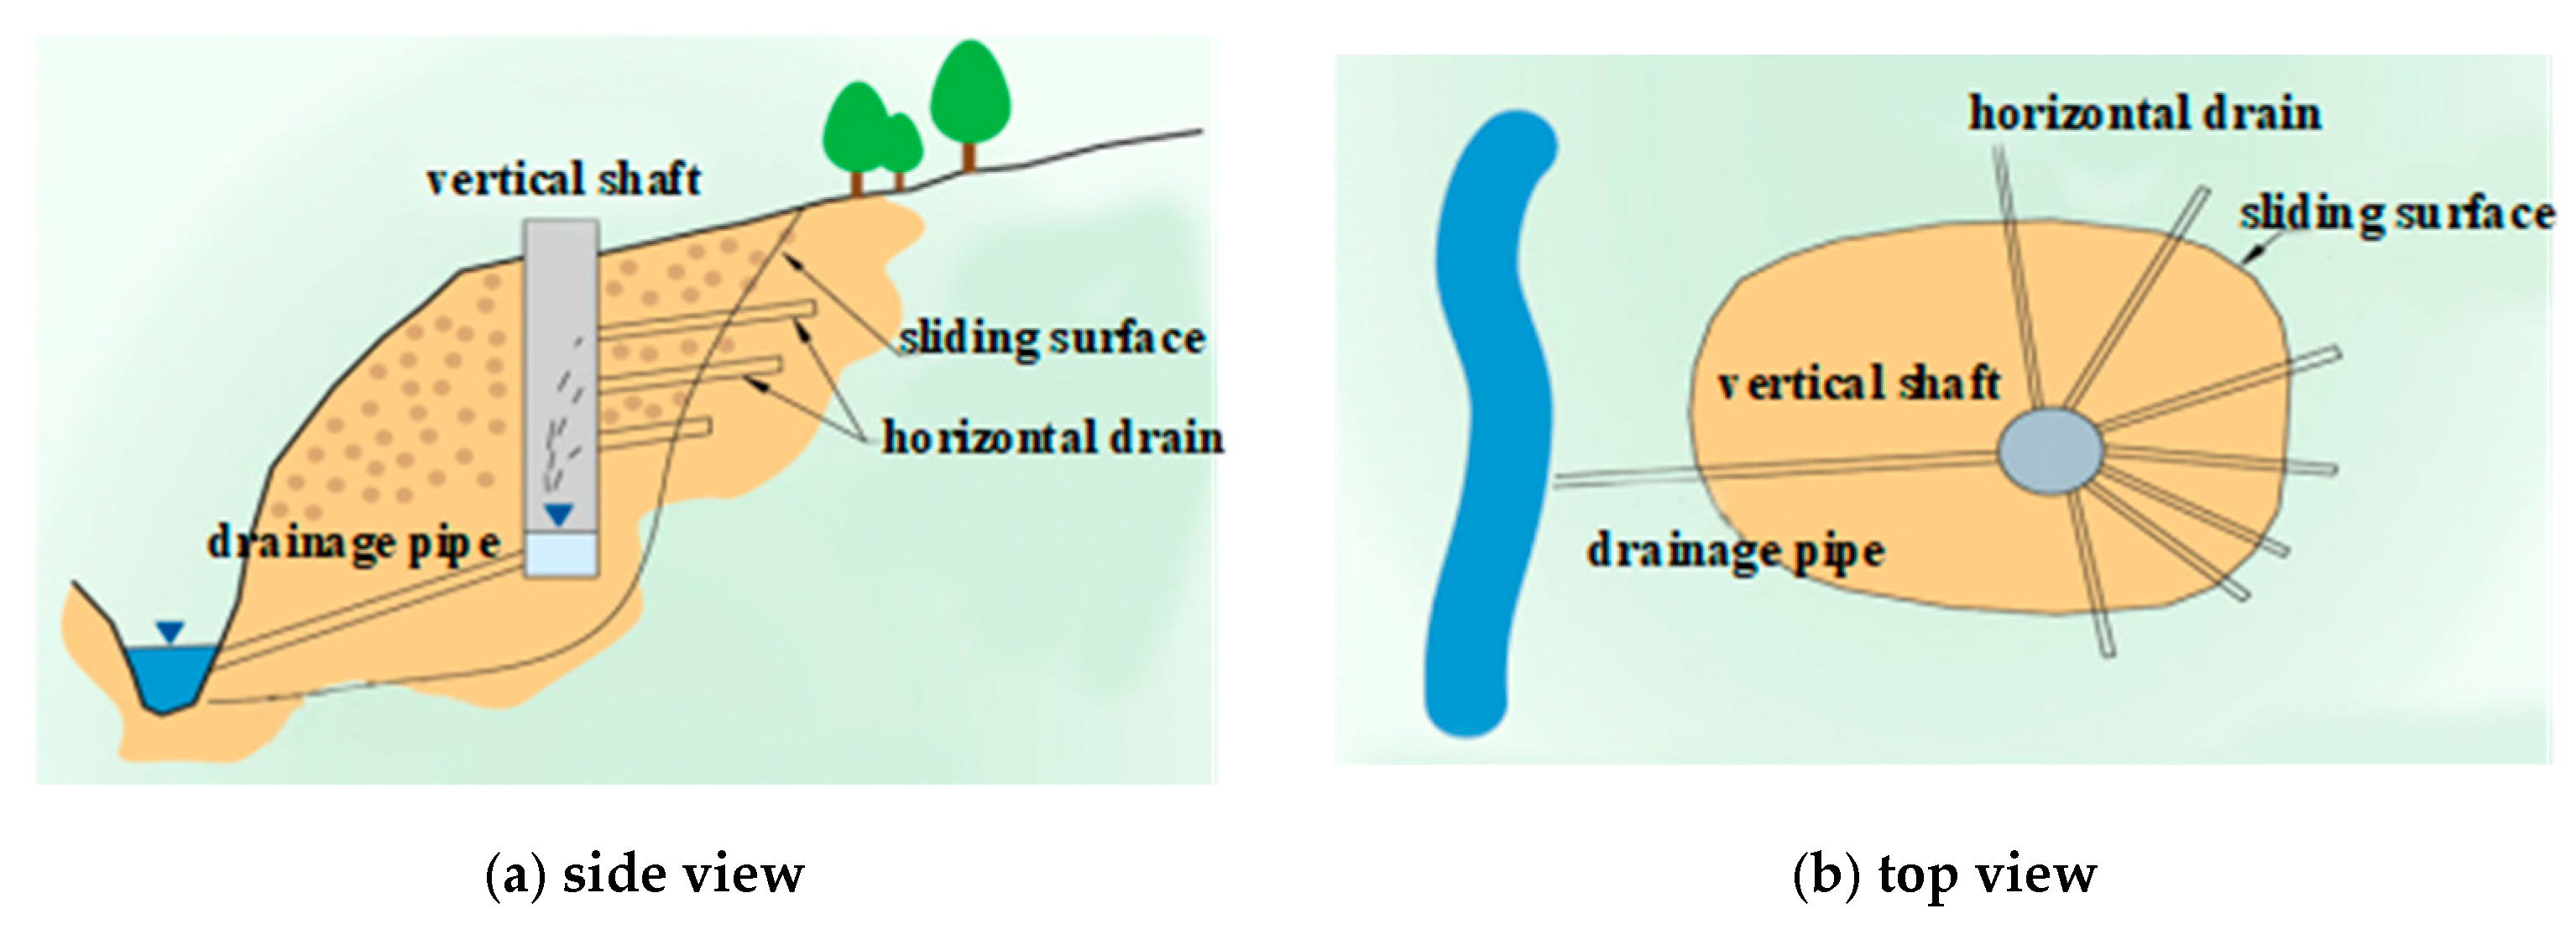
Figure 10.
Typical construction sequences of well shaft and multi-level horizontal drains in Taiwan.
Figure 10.
Typical construction sequences of well shaft and multi-level horizontal drains in Taiwan.

Figure 11.
Numerical model of You-Ye-Lin landslide with subsurface drainage system (a) peel-off view inside the numerical model (b) finite element mesh (c) well shaft with horizontal drains.
Figure 11.
Numerical model of You-Ye-Lin landslide with subsurface drainage system (a) peel-off view inside the numerical model (b) finite element mesh (c) well shaft with horizontal drains.

Figure 12.
Dimension of numerical model and locations of protective residential areas (RA1, RA2), drainage well-1 & well-2, and A-A′, C1-C1′, C2-C2′ profiles for numerical calculation monitoring.
Figure 12.
Dimension of numerical model and locations of protective residential areas (RA1, RA2), drainage well-1 & well-2, and A-A′, C1-C1′, C2-C2′ profiles for numerical calculation monitoring.

Figure 13.
For Ks=1.0 × 10⁻⁴ cm/sec case (a) variation of groundwater level along A-A’ profile with the subsurface drainage, (b) groundwater level and groundwater head contour of C1-C1’ profile after a 20-day subsurface drainage and (c) before the subsurface drainage.
Figure 13.
For Ks=1.0 × 10⁻⁴ cm/sec case (a) variation of groundwater level along A-A’ profile with the subsurface drainage, (b) groundwater level and groundwater head contour of C1-C1’ profile after a 20-day subsurface drainage and (c) before the subsurface drainage.


Figure 14.
Comparison of groundwater drawdown of observation well B12-W with and without subsurface drainage for different hydraulic conductivity of colluviums.
Figure 14.
Comparison of groundwater drawdown of observation well B12-W with and without subsurface drainage for different hydraulic conductivity of colluviums.

Figure 15.
Sliding mechanism of study area without subsurface drainage in dry season (a) total incremental displacement field (b) sliding direction based on surface surveys (c) potential sliding area and factor of safety (d) potential sliding surface along B-B′ profile.
Figure 15.
Sliding mechanism of study area without subsurface drainage in dry season (a) total incremental displacement field (b) sliding direction based on surface surveys (c) potential sliding area and factor of safety (d) potential sliding surface along B-B′ profile.
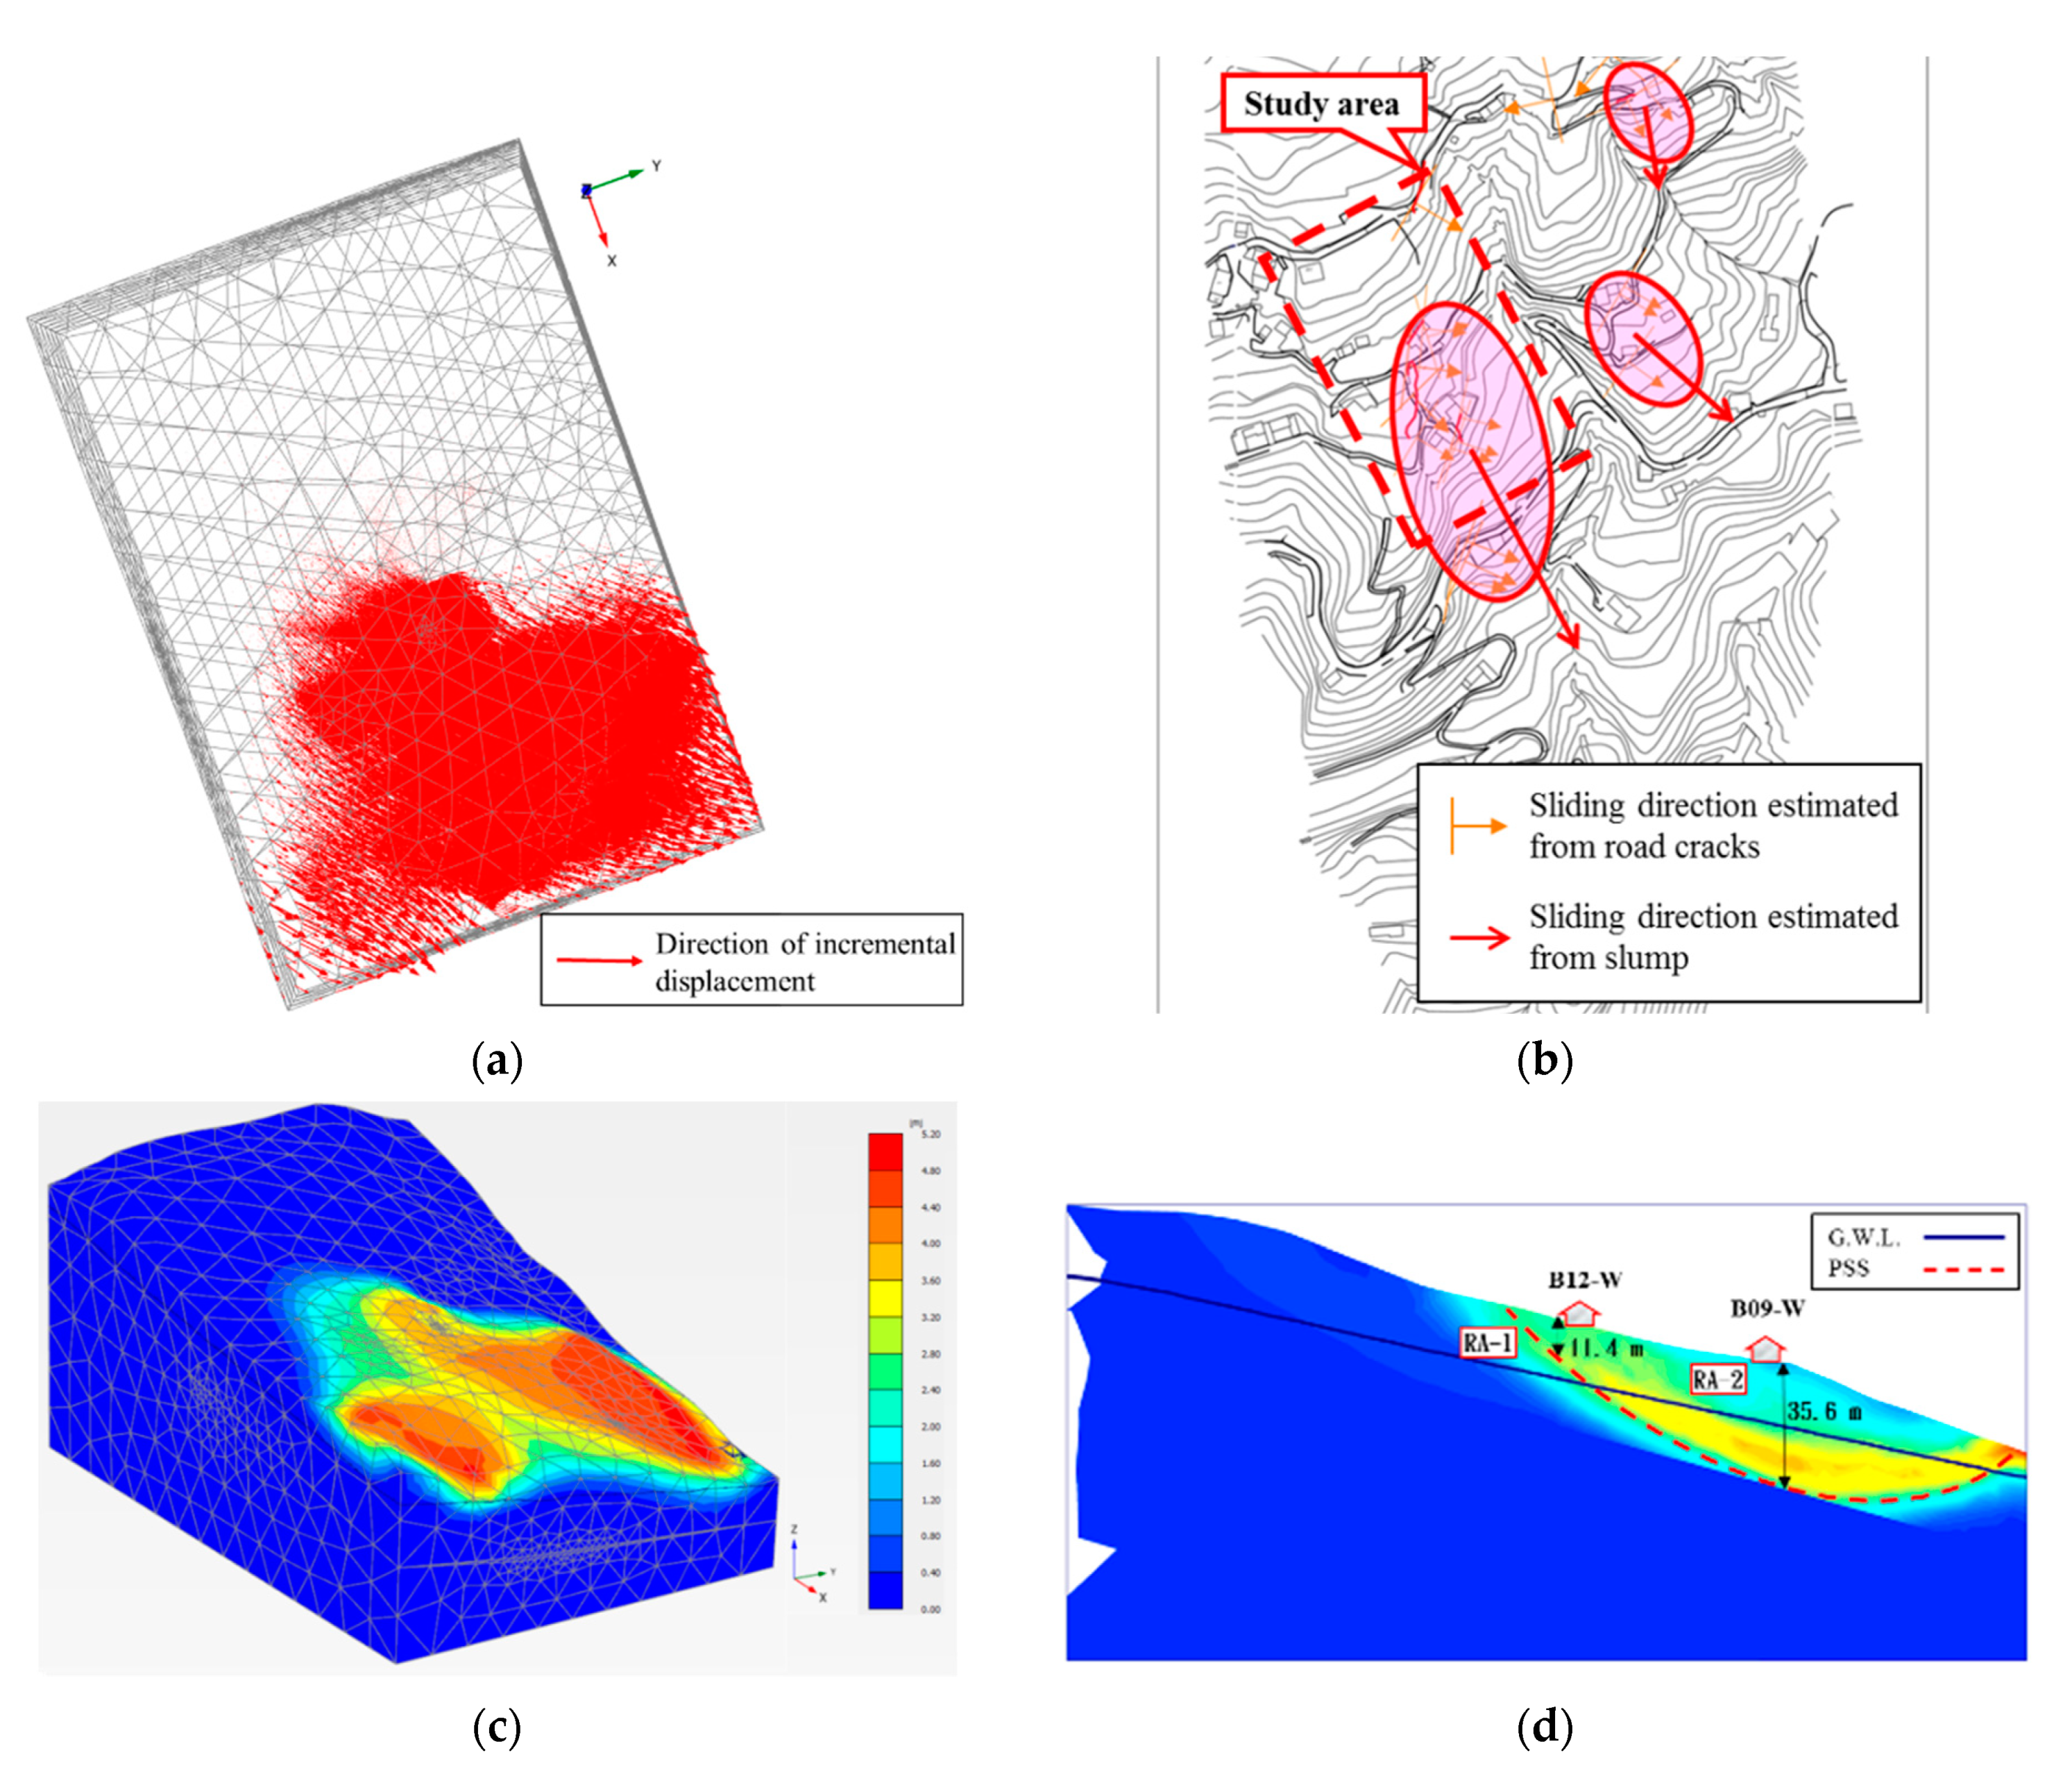
Figure 16.
Potential sliding area and potential sliding surface along A-A’ profile in typhoon season (a-1,a-2) without (b-1,b-2) with subsurface drainage.
Figure 16.
Potential sliding area and potential sliding surface along A-A’ profile in typhoon season (a-1,a-2) without (b-1,b-2) with subsurface drainage.
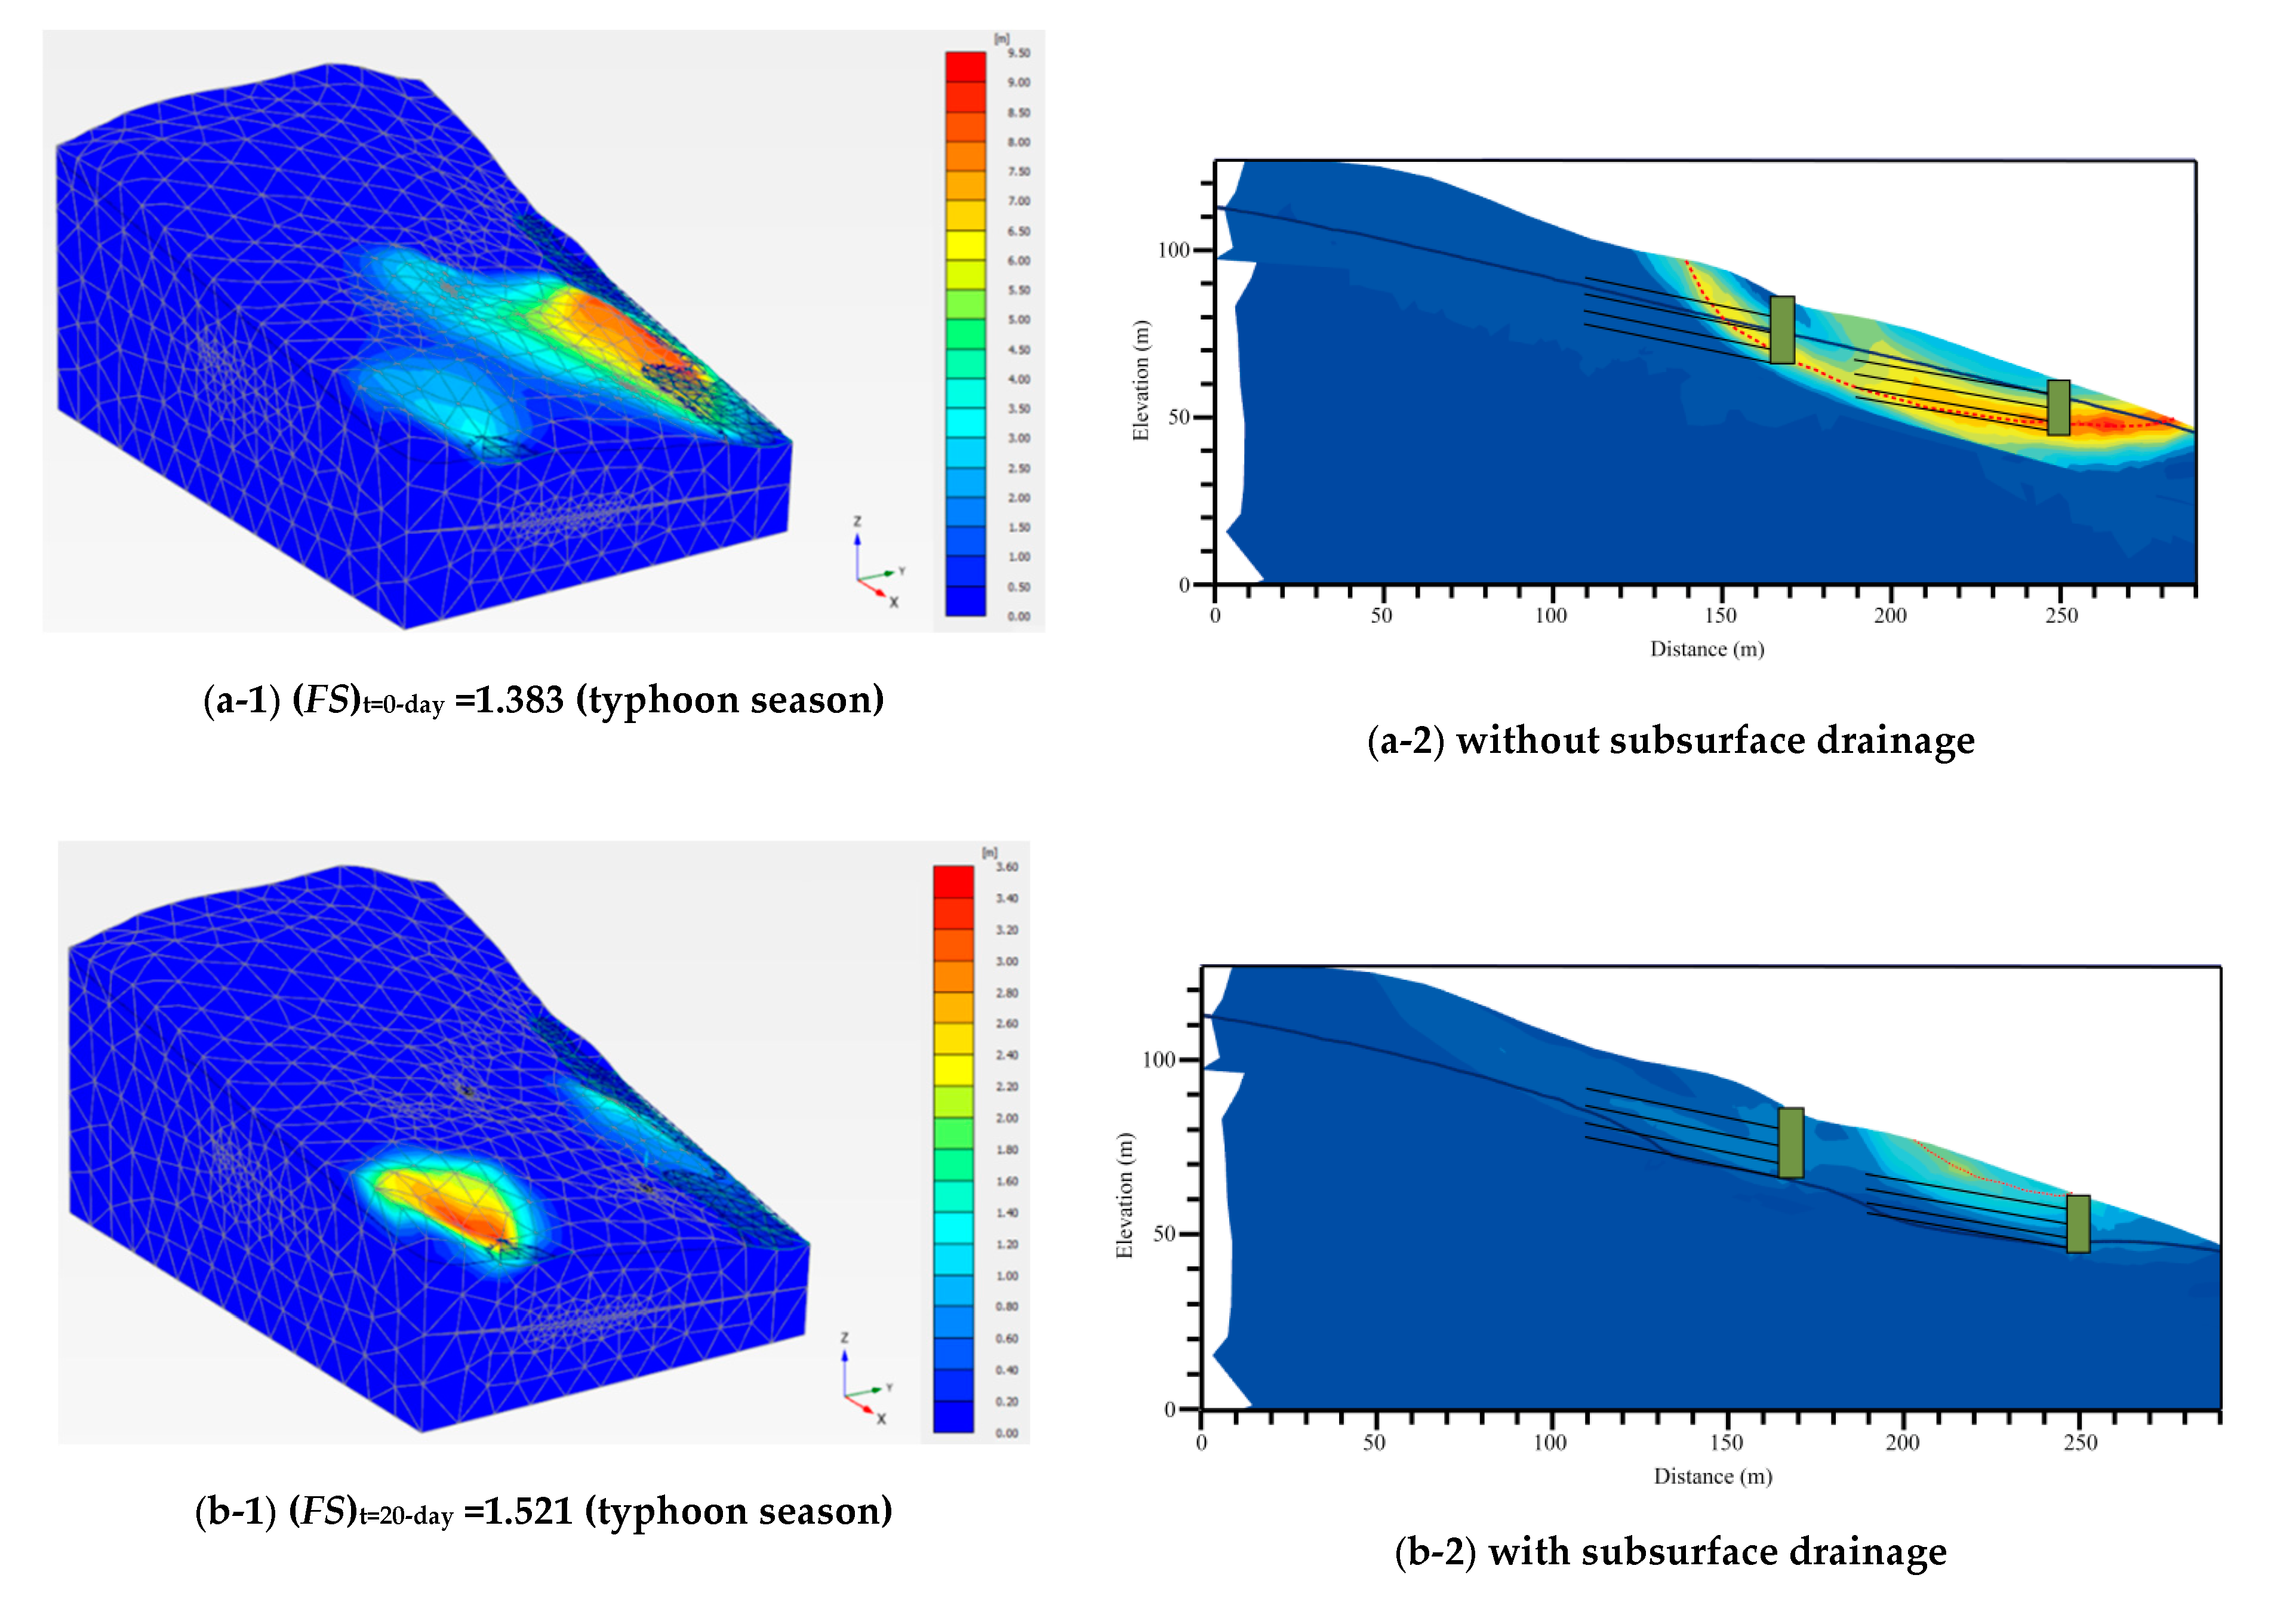
Figure 17.
Discharge rate of horizontal drains installed at different elevations of well shaft during 20-day subsurface drainage in typhoon season. (a) Drainage Well-1 (b) Drainage Well-2 (Ks=1.0 × 10⁻⁴ cm/sec).
Figure 17.
Discharge rate of horizontal drains installed at different elevations of well shaft during 20-day subsurface drainage in typhoon season. (a) Drainage Well-1 (b) Drainage Well-2 (Ks=1.0 × 10⁻⁴ cm/sec).
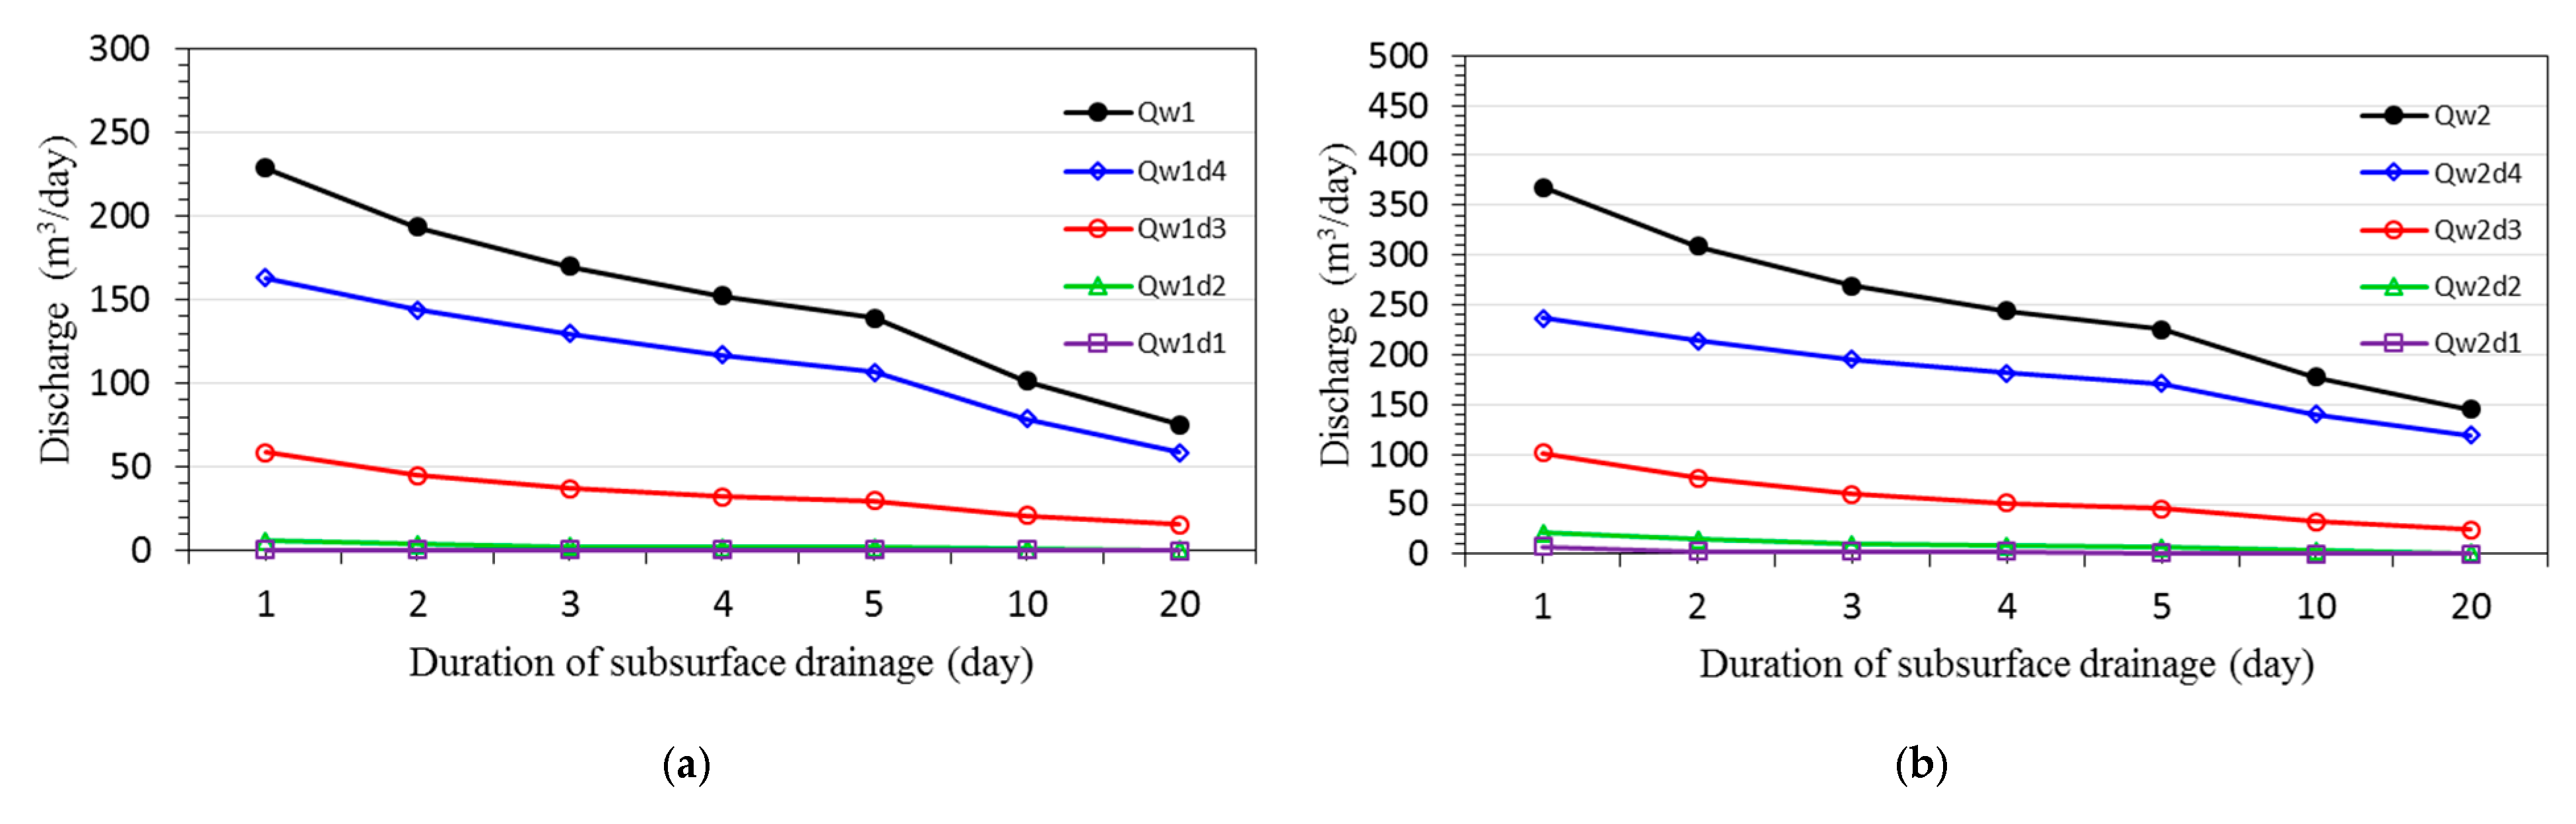
Figure 18.
Location adjustment of drainage well (circular point=contact point of horizontal drain, adjusted well with hatched line=drainage well after location adjustment).
Figure 18.
Location adjustment of drainage well (circular point=contact point of horizontal drain, adjusted well with hatched line=drainage well after location adjustment).


Table 1.
Groundwater rise during typhoon events.
| Typhoon | Observation Well | Initial Groundwater Level (m) | Maximum Groundwater Level (m) | Groundwater Level Rise (m) | Cumulative Rainfall (mm) |
|---|---|---|---|---|---|
| Soudelor (2015/Aug./06–09) | B08-W | −11.60 | −7.39 | 4.21 | 314 252 (mm/day) 44 (mm/hr) |
| B09-W | −34.00 | −21.19 | 12.81 | ||
| Dujuan (2015/Sep./27–29) | B08-W | −6.88 | −6.72 | 0.16 | 194 144 (mm/day) 33 (mm/hr) |
| B09-W | −35.22 | −24.32 | 10.90 | ||
| Megi (2016/Sep./27–28) | B08-W | −16.20 | −15.00 | 1.20 | 484 345 (mm/day) 49 (mm/hr) |
| B09-W | malfunction | malfunction | malfunction | ||
| B12-W | −16.90 | −12.97* | 3.93 |
−12.97 m* = the measured maximum groundwater level of B12-W during Typhoon Megi was used to calibrate the calculated initial groundwater level of numerical model.
Table 2.
The design parameters of drainage wells in You-Ye-Lin landslide.
| Design Parameters | Drainage Well-1 | Drainage Well-2 | ||||
| Depth of well shaft (m) | 20 | 16 | ||||
| Diameter of shaft (m) | 4 | 4 | ||||
| Length of horizontal drains (m) | 50 | 50 | ||||
| Elevation and number of horizontal drains installed at 1st~4th levels (Elevation below ground surface) | Level No. | Elevation (m) | Number of horizontal drains | Level No. | Elevation (m) | Number of horizontal drains |
| 1st level | 5 | 6 | 1st level | 4 | 6 | |
| 2nd level | 10 | 5 | 2nd level | 8 | 5 | |
| 3rd level | 15 | 5 | 3rd level | 12 | 5 | |
| 4th level | 19 | 6 | 4th level | 15 | 6 | |
| Elevation angle of horizontal drains (°) | 8°~10° | 8°~10° | ||||
| Central angle of horizontal drains with fan-shape radial array (°) | 120°, 150° | 120°, 150° | ||||
| Diameter of horizontal drains (mm) | 7.62 | 7.62 | ||||
| Diameter of drainage pipe (m) | 10 | 10 | ||||
| Depression angle of drainage pipe (°) | 8°~10° | 8°~10° | ||||
Table 3.
Input of M-C material model parameters of soil strata for slope stability analysis.
| Soil Type | γunsat (γsat) (kN/m³) | Young′s Modulus E′ (kN/m2) | Poisson′s Ratio ν′ | Cohesion c′ (kPa) | Friction Angle ϕ′ (°) | Dilatancy Angle ψ (°) |
|---|---|---|---|---|---|---|
| Colluvium | 20.89 (23.37) | 2.0 × 10⁵ | 0.30 | 10.0 | 28 | 0 |
| Shale | 21.88 (23.82) | 7.0 × 10⁵ | 0.35 | 39.0 | 29 | 0 |
| Sandstone | 23.44 (23.84) | 7.0 × 10⁶ | 0.30 | 0.0 | 35 | 0 |
Table 4.
Input of linear isotropic material model parameters of corrugated steel ring liner for slope stability analysis.
Table 4.
Input of linear isotropic material model parameters of corrugated steel ring liner for slope stability analysis.
| Material Type | Thickness t (m) | Unit weight γs (kN/m3) | Poisson′s Ratio νs | Young′s Modulus Es (GPa) |
|---|---|---|---|---|
| Steel liner | 3.2 × 10⁻³ | 77.0 | 0.30 | 200.0 |
Table 5.
Maximum groundwater drawdown in subsurface drainage system (KS =1.0 × 10⁻⁴ cm/sec).
| Time (day) | 1 | 2 | 3 | 4 | 5 | 10 | 20 |
|---|---|---|---|---|---|---|---|
| hw1,max (m) | 5.96 | 7.76 | 8.59 | 8.84 | 8.97 | 9.85 | 10.19 |
| hw2,max (m) | 7.96 | 9.40 | 10.24 | 10.66 | 10.93 | 11.88 | 13.00 |
Table 6.
Variations of groundwater drawdown and factor of safety with elapsed time during subsurface drainage (KS =1.0 × 10⁻⁴ cm/sec).
Table 6.
Variations of groundwater drawdown and factor of safety with elapsed time during subsurface drainage (KS =1.0 × 10⁻⁴ cm/sec).
| Drainage Duration t (day) | Groundwater Depth of B12-W Hw(t) (m) | Groundwater Drawdown Percentage Pdrawdown (%) | Variation of Factor of Safety FS(t) | Increasing Percentage of Factor of Safety PFS (%) |
|---|---|---|---|---|
| 0 → 1 | −12.97 → −15.27 | 17.73 | 1.383 → 1.443 | 4.34 |
| 1 → 2 | −15.27 → −16.97 | 30.84 | 1.443 → 1.479 | 6.94 |
| 2 → 3 | −16.97 → −17.47 | 34.70 | 1.479 → 1.489 | 7.66 |
| 3 → 4 | −17.47 → −18.17 | 40.09 | 1.489 → 1.499 | 8.39 |
| 4 → 5 | −18.17 → −18.67 | 43.95 | 1.499 → 1.501 | 8.53 |
| 9→ 10 | −19.97 → −20.07 | 54.74 | 1.501 → 1.510 | 9.18 |
| 19 → 20 | −20.57 → −20.62 | 58.98 | 1.520 → 1.521 | 9.98 |
Remarks: (1) The groundwater depth measured from the ground surface; (2) Pdrawdown (%) = [ΔHw(t)] × 100% / Hw(0 day) = [ Hw(t) − Hw(0 day)] × 100% /(−12.97); (3) PFS (%) = [ΔFS(t)] × 100% / FS(0 day) = [ FS(t) − FS(0 day)] × 100% / (1.383).
Table 7.
Discharge rate of horizontal drains of Ks=1.0 × 10⁻⁴ cm/sec case.
| Drainage Well-1 | |||||
| Drainage Duration t (day) | Discharge Rate of Horizontal Drains at Four Elevations Qi (m3/day) (i = w1d1~w1d4) | Total Discharge Rate of Drainage Well-1 QW1 (m3/day) | |||
| w1d1 | w1d2 | w1d3 | w1d4 | =ΣQi | |
| 1 | 0.648 | 5.808 | 59.016 | 163.104 | 228.576 |
| 2 | 0.456 | 3.864 | 44.904 | 144.072 | 193.296 |
| 3 | 0.456 | 2.664 | 37.128 | 129.576 | 169.824 |
| 4 | 0.456 | 2.160 | 32.616 | 117.120 | 152.352 |
| 5 | 0.480 | 1.896 | 29.832 | 106.728 | 138.936 |
| 10 | 0.624 | 1.032 | 21.312 | 78.648 | 101.616 |
| 20 | 0.048 | 0.480 | 16.008 | 58.848 | 75.384 |
| Drainage Well-2 | |||||
| Drainage Duration t (day) | Discharge Rate of Horizontal Drains at Four Elevations Qi (m3/day) (i = w2d1 − w2d4) | Total Discharge Rate of Drainage Well-2 QW2 (m3/day) | |||
| w2d1 | w2d2 | w2d3 | w2d4 | =ΣQi | |
| 1 | 7.848 | 21.696 | 101.760 | 236.664 | 367.968 |
| 2 | 2.808 | 14.592 | 76.704 | 214.440 | 308.544 |
| 3 | 2.424 | 10.368 | 60.432 | 195.696 | 268.920 |
| 4 | 2.544 | 8.208 | 51.456 | 182.112 | 244.320 |
| 5 | 1.488 | 6.984 | 45.816 | 171.552 | 225.840 |
| 10 | 0.384 | 3.408 | 32.832 | 140.736 | 177.360 |
| 20 | 0.240 | 1.296 | 24.264 | 119.112 | 144.912 |
(1 m3/day=1.157 × 10−5 cms (m3/sec), w1d1=horizontal drains of Drainage Well-1 installed at highest elevation d1), w2d4=horizontal drains of Drainage Well-2 installed at lowest elevation d4).
© 2020 by the authors. Licensee MDPI, Basel, Switzerland. This article is an open access article distributed under the terms and conditions of the Creative Commons Attribution (CC BY) license (http://creativecommons.org/licenses/by/4.0/).
Share and Cite
MDPI and ACS Style
Lin, D.-G.; Chang, K.-C.; Ku, C.-Y.; Chou, J.-C. Three-Dimensional Numerical Investigation on the Efficiency of Subsurface Drainage for Large-Scale Landslides. Appl. Sci. 2020, 10, 3346. https://doi.org/10.3390/app10103346
AMA Style
Lin D-G, Chang K-C, Ku C-Y, Chou J-C. Three-Dimensional Numerical Investigation on the Efficiency of Subsurface Drainage for Large-Scale Landslides. Applied Sciences. 2020; 10(10):3346. https://doi.org/10.3390/app10103346
Chicago/Turabian StyleLin, Der-Guey, Kuo-Ching Chang, Cheng-Yu Ku, and Jui-Ching Chou. 2020. "Three-Dimensional Numerical Investigation on the Efficiency of Subsurface Drainage for Large-Scale Landslides" Applied Sciences 10, no. 10: 3346. https://doi.org/10.3390/app10103346
Note that from the first issue of 2016, this journal uses article numbers instead of page numbers. See further details here.