Article

Using Tourist Diver Photos to Assess the Effects of Marine Heatwaves on Central Red Sea Coral Reefs

by
Anderson B. Mayfield
Coral Reef Diagnostics, Miami, FL 33129, USA
Environments 2025, 12(7), 248; https://doi.org/10.3390/environments12070248
Submission received: 14 May 2025 / Revised: 14 July 2025 / Accepted: 15 July 2025 / Published: 18 July 2025

Abstract

As marine heatwaves increase in frequency, more rapid means of documenting their impacts are needed. Herein, several thousand coral reef photos were captured before, during, and/or after high-temperature-induced bleaching events in the Central Red Sea, with a pre-existing artificial intelligence (AI), CoralNet, trained to recognize corals and other reef-dwelling organisms. The AI-annotated images were then used to estimate coral cover and bleaching prevalence at 22 and 11 sites in the Saudi Arabian and Egyptian Red Sea, respectively. Mean healthy coral cover values of 12 and 9%, respectively, were documented, with some sites experiencing >60% bleaching during a summer 2024 heatwave that was associated with 21–22 and 25 degree-heating weeks at the Saudi Arabian and Egyptian reefs, respectively. As a result of this mass bleaching event, coral cover at the survey sites has declined over the past 5–10 years by upwards of 6-fold in the most severely impacted regions. Although some recovery is likely, these Central Red Sea sites do not appear to constitute “climate refugia,” as may be the case for some reefs farther north.

1. Introduction

Given the rapid rise in seawater temperatures on account of global climate change, coral bleaching events are becoming increasingly common [1]; 2023 sadly marked the fourth global bleaching event [2]. Although tools exist for predicting the timing of bleaching [3], it may still be difficult for scientists to find sufficient time to schedule field trips to track their impacts, especially when they occur unexpectedly. In some parts of the world, little (if any) monitoring may occur at all [4], despite the need to assess how the changing climate is affecting local reefs [5]. In contrast, PADI estimates that there are several million certified SCUBA divers, many of whom are interested in both photography and supporting marine conservation efforts. Could coral reef photos taken by these tourist divers actually be of use in marine monitoring? After all, Roberts et al. [6] found that 90% of these divers’ photos contain key habitat features and hence potentially usable benthic data.
Citizen science efforts have proven useful in an array of coral reef conservation and even restoration activities [7,8], with agencies such as Reef Check helping fill data gaps in many areas [9]. However, these approaches still require some degree of training in survey methodologies as well as carrying scientific equipment like transect tapes and slates on dives. This could limit the involvement of the general public. If, on the other hand, coral reef photos alone could be submitted, albeit preferably alongside the entry of key meta-data (e.g., date, depth, GPS coordinates), then participation levels may be higher, especially considering the popularity of underwater photography amongst certified divers and the recent ability to take smart phones on dives within cheap (USD 10), waterproof pouches.
Although systemic, side-by-side comparisons of citizen science data vs. “gold standard” benthic ecology data obtained from highly trained marine biologists are generally lacking, progress has been made in validating both manual and artificial intelligence (AI)-based image classification accuracy from citizen-science-program-derived photos [10]. Furthermore, Done et al. [11] found that one of the most common citizen science monitoring programs, the aforementioned ReefCheck, was 93% accurate when compared to surveys carried out by coral reef scientists on Australia’s Great Barrier Reef. Given these findings, I hypothesized that I could use a citizen science approach to document both coral abundance and % bleaching at select reef sites off both the Saudi Arabian and Egyptian Central Red Sea coastlines, which experienced back-to-back summer bleaching in 2023 and 2024 (Figure 1). As local scientists had not planned to conduct bleaching surveys at these times, given that such extensive bleaching was not hypothesized to occur, the goal was to fill a key coral resilience data gap. Although unlikely to yield identical data to formal point-intercept or other transect- or photo-quadrat-based survey methods, these data could nevertheless help with assessing the relative impacts of these thermal stress events, thereby potentially promoting such a citizen science + AI approach [12] for more widespread coral reef monitoring in this formerly coral-rich region (and likely beyond [13]). They could also be used to assess, more simply, regional variation in coral thermo-sensitivity since the same method was used at all sites.

2. Materials and Methods

2.1. Image Surveys

Between September 2023 and October 2024, 33 coral reefs were visited across a relatively narrow latitudinal gradient in the Central Red Sea (Table 1): from ~19° N at Qunfudah, Saudi Arabia, to nearly 25° N at Marsa Nakari, Egypt. Note that exact GPS coordinates could not be obtained for some sites, so some positions are approximate. Sites within two regions, Thuwal and Yanbu (both in Saudi Arabia), were visited multiple times before, during, and after bleaching, whereas others were visited only during the 2024 bleaching event; in total, 60 dives were made (48 and 12 in Saudi Arabia and Egypt, respectively), during which photos were taken by myself from the surface down to a maximum depth of 35 m. Although depth was not generally recorded, most usable photos were taken <20–25 m. At greater depths, image resolution was lower due to a lack of light (no strobes were used).
With this approach, I sought to emulate a tourist without knowledge of coral reef ecology other than the fact that corals occupy a portion of the benthos. I swam 1–2 m above the reefs and attempted to encompass primarily reef habitat in each image; on average, 84 ± 16% (std. dev. for this and all subsequent error terms) of the area in each image comprised benthos. The average image encompassed 10 m (width) × 5 m (depth) (~50 m2) of reef area, and images were taken every ~20–30 s while swimming continuously over ~30 to 70 min on each dive. Of the ~7173 photos taken with an Olympus TG6 or TG7 underwater camera (with in situ white-balancing according to the manufacturer’s recommendations, using stark white sand as the balancing reference point), 173 either did not include any visible reef structure (including artificial reefs) or were characterized by too poor lighting to accurately discern corals from other reef-dwelling organisms; only the remaining 7000 (~30–40 ha of reef area) were used for benthic characterization (Table 2).
Table 1. Site information. GPS coordinates were approximated for regions denoted by asterisks (*). Boreal winter, spring, summer, and fall correspond January–March, April–June, July–September, and October–December, respectively. Although 24 images of Yanbu’s reefs were taken in early October 2023, I grouped the corresponding data with the summer 2023 data, since temperatures were >30 °C and corals were still bleaching. KSA = Kingdom of Saudi Arabia.
RegionCountry# Sites# Survey DivesLatitudinal RangeLongitudinal RangeDates Visited
ThuwalKSA72522°18′–22°26′ N38°47′–39°00′ E2023: summer–fall
2024: winter–summer
YanbuKSA6923°06′–24°09′ N37°50′–38°02′ E2023: summer
2024: spring–summer
Qunfudah *KSA2218°55′–19°15′ N40°43′–41°00′ E2024: summer only
Jeddah *KSA61021°43′–22°00′ N38°49′–39°03′ E2024: summer only
RabighKSA2222°55′–22°57′ N38°05′–38°51′ E2024: summer only
Marsa NakariEgypt4424°51′–24°57′ N34°57′–35°08′ E2024: summer only
Wadi LahamiEgypt7824°11′–24°15′ N35°25′–35°35′ E2024: summer only
Table 2. Summary of bleaching data from assessment of 7000 “tourist diver” photos. CoralNet was used to predict both coral cover and % bleaching from images taken between ~1 and ~25 m (CoralNet accession #5546 (https://coralnet.ucsd.edu/source/5546/, accessed on 13 May 2025)) after manual training at various stages. Error terms represent standard deviation. FNR = false-negative rate. FPR = false-positive rate.
MetricValueNotes/Details
# images taken for informal “tourist diver” analysis7173
# images used in tourist diver CoralNet analysis7000173 images failed quality control
# images used for initial CoralNet AI training450Scored 13,500 features manually
CoralNet-calculated classification accuracy (%)81–83%See “Classifier Overview” for details
# images for post-hoc accuracy verification150Scored 4500 features manually
Manually calculated classification accuracy (%)87 ± 9.4%
# images for assessment of FPR and FNR150Scored 4500 features manually
Total # images scored manually for CoralNet training750
Total # images classified automatically by CoralNet6250
Total # features scored by CoralNet187,500
Total # features scored by human and CoralNet210,000
# coral colonies scored for assessment of FPR and FNR769
Overall accuracy of coral bleaching analysis (%)90.3%
Bleaching classification FPR (%)2.2%
Bleaching classification FNR (%)12.6%

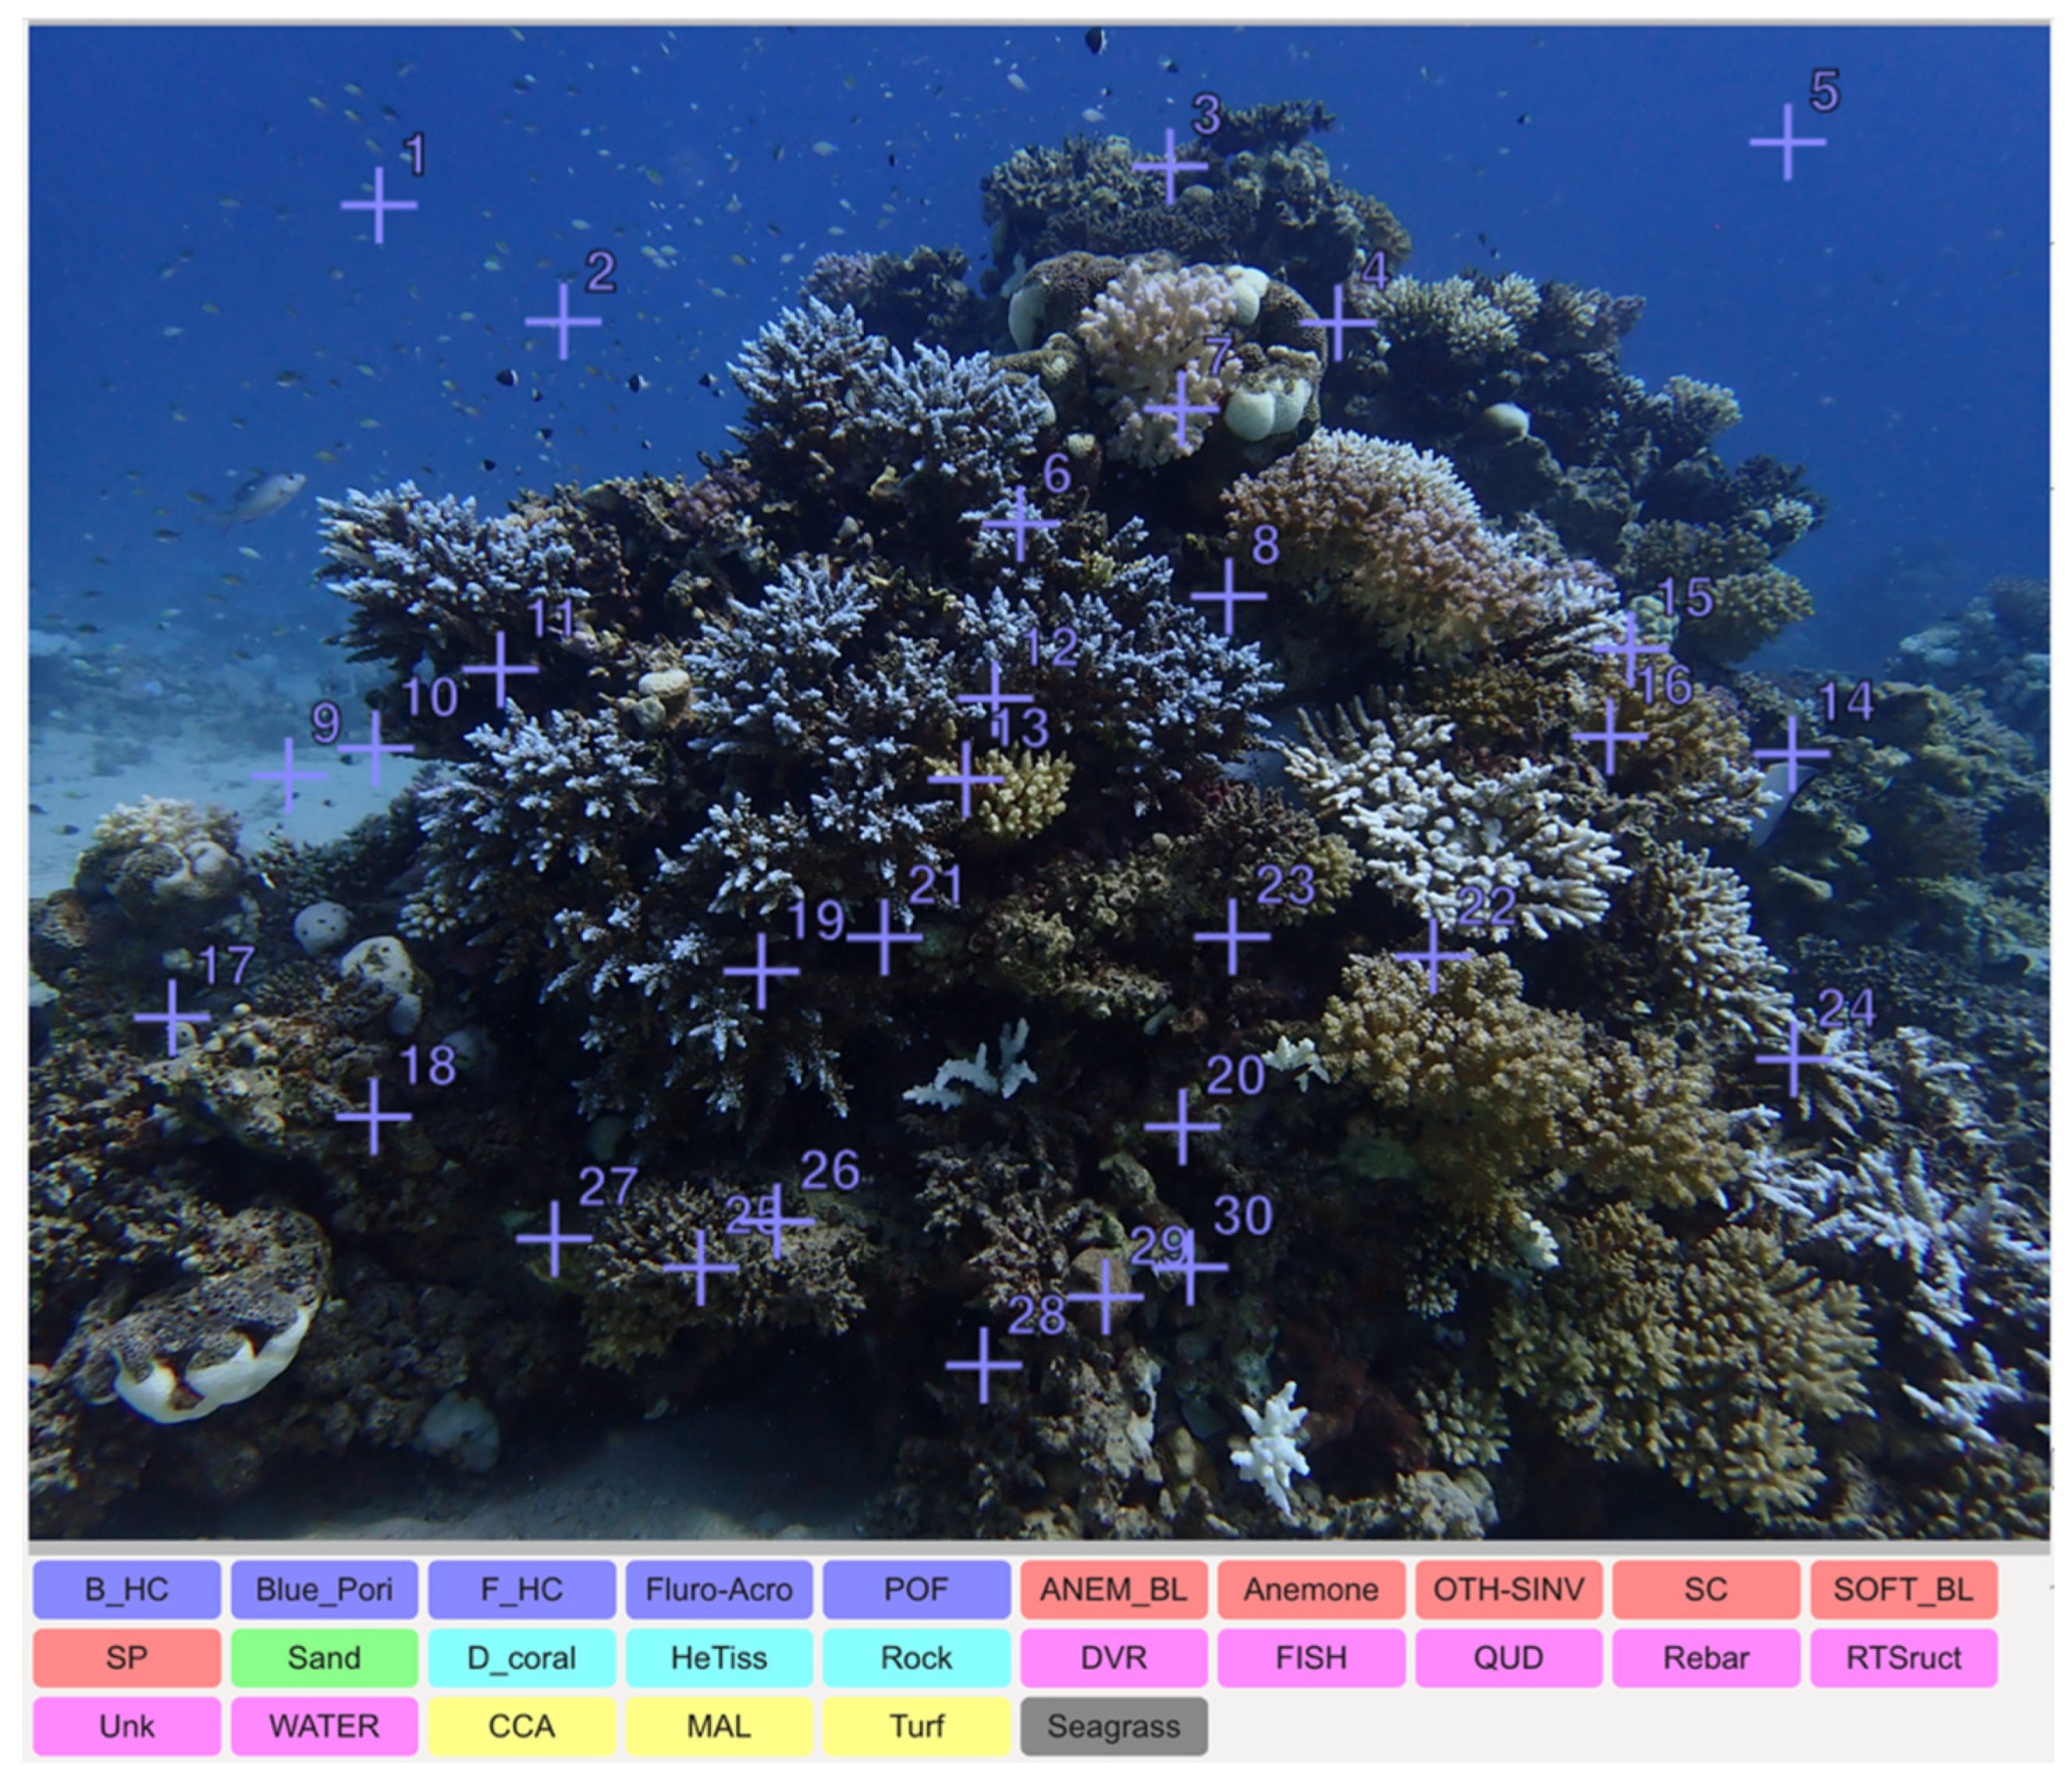
2.2. CoralNet AI Training

A 26-category “lableset” was used for benthic characterization in CoralNet; see the online supplemental data file (Supplementary File S1) and Figure 2 for the complete list. Briefly, I considered water, divers, sand, several types of algae (mainly turf and macroalgae), sponges, soft corals (as healthy or bleached), noncoral invertebrates, and scleractinian corals as either healthy (“HeTiss”) or bleached (“B_HC”). For corals that fluoresce or change colors prior to bleaching, the following additional labels were considered: fluorescent pocilloporids (“POF”), blue poritids (“Blue_Pori”), fluorescent acroporids (“Fluro-Acro”), and all other fluorescing coral genera (“F_HC”). Several additional abiotic categories were considered: quadrats or other survey gear, rebar, and artificial reef structures (which could include shipwrecks); these were later combined into a single category: “human-made structures.” As seagrass was not seen, the final lableset used to annotate the 7000 images included 22 categories, of which 3 were not associated with the benthos: divers, water, and fish. When CoralNet overlaid one of the 30 random points on a black region of the image, an “unknown” (“Unk”) label was applied. Coral cover (%) and % bleaching values were calculated from the portion of the image that actually featured benthos; in other words, water, divers, fish, and nonbenthic features were excluded. If, for instance, an image featured 50% water and 50% benthos, and 20% of the coral reef area comprised hard corals, the image would be said to be characterized by a coral cover of 20% (vs. 10% were the 50% of the image that was water also used in the calculation).
Coral cover has been presented as either “total coral cover,” which included both healthy (normally pigmented) and bleached (but still alive) corals, or “healthy coral cover,” in which the bleaching ones were excluded. The latter was calculated relative to the entire benthos (e.g., “transect A was characterized by 10% healthy coral cover, 5% bleached coral cover, and 85% other benthic features.”). The bleaching data were instead presented in two ways: as a percentage of the entire benthos (“bleached coral cover;” see prior example) or as the percentage of all corals that were bleached. For instance, if the total coral cover was 20% and the bleached coral cover was 10%, the percentage of all corals that were bleached would be 50% (and the healthy coral cover would be 10%).
To train the CoralNet AI, I manually annotated 30 randomly placed “features” (see Figure 2 for an example.) in each of 450 randomly selected images from the collective 7000-imageset that passed quality control (Table 2); this randomization was essential to ensuring that the AI’s accuracy was similar for images taken at different times and, specifically, was not significantly less accurate for images taken during the earliest surveys (during which the AI would be more error-prone). CoralNet then proceeded to annotate the remaining images. To then verify the accuracy of these annotations, an additional 150 images were chosen for validation, with corrections made when necessary. This helped further train the AI. A second set of 150 images from bleaching reefs was used to calculate both false-positive and false-negative bleaching rates. In contrast to a more formal image analysis method, such as measurements of brightness or whiteness [14], I classified bleaching in white-balanced images only by comparing to CoralWatch cards [15] after scaling and normalizing to the whitest object in each image (typically either sand or a completely bleached coral) in Adobe Photoshop (CS, USA); this ensured that images that were not perfectly white-balanced relative to the light spectrum at that depth could be compared to those that were. A false-positive was defined as when CoralNet predicted that the feature corresponded to a bleaching coral (CoralWatch color score = 1) when in fact it was a normally pigmented coral (CoralWatch color score > 1). This was rare (though see Figure 2 for an example). What was more common, however, was a false-negative: predicting that a coral was normally pigmented when it was actually bleached.
Overall, bleaching prediction accuracy, false-positive bleaching rate, and false-negative bleaching rate were all calculated. Kruskal–Wallis (nonparametric ANOVA) tests were performed in JMP® Pro (ver. 18; Cary, NC, USA) to assess differences in coral cover and % bleaching (alpha = 0.01) over space, and, when possible, time, with nonparametric post-hoc tests used to test for differences among means (residuals were non-normally distributed, nor were variances equal across regions and time.). Unfortunately, there were no formally acquired data against which to compare these tourist diver-simulating results, since local scientists were unprepared to conduct surveys at those times; it will be important to assess the degree of congruency between this unstructured approach and a “gold standard” one (sensu [16]) in the future. That being said, a typical point-intercept survey might involve 4–5 10-m transects at a site. This means that about 5 m2 of coral (0.1 m [width about transect] × 10 m/transect × 5 transects) would be assessed on a given dive, about the same as was captured in a single image herein. In other words, while the point-intercept method is of superior resolution, it is associated with a ~100-fold lower number of scored benthic features (assuming roughly 100 50-m2 images taken on a typical dive). I opted for the low-resolution/large dataset option vs. the high-resolution/small dataset one because I was mainly interested in healthy vs. bleached coral abundance. Those instead interested in species-specific responses to marine heatwaves may perform better with a high-resolution approach.
Figure 2. Manual validation of a representative CoralNet-annotated image. Thirty points or “features” (plus [“+”] signs) were randomly overlaid on each image by CoralNet, with several hundred such images first manually annotated to train the AI. The accuracy across the 30 points in this example was 97%; the lone point misclassified, #6, was predicted to be a bleached coral when it was actually fluorescing (i.e., a false-positive bleaching classification). The lableset can be seen below the image; as discussed in the main text, a subset of 22 of these was ultimately used.
Environments 12 00248 g002
In addition to quantifying bleaching and live coral cover at the survey sites with this citizen science approach, a secondary goal of this work was to determine how live coral cover has changed over time. This involved a meta-analysis of other studies in the area, both peer-reviewed and those found on websites and in published online reports from either government or nongovernmental agencies (e.g., ReefCheck). Unfortunately, formal, gold-standard surveys in the region are lacking for all but a handful of sites, hence the need to consult citizen science campaigns’ data (“grey literature”) for comparison.

3. Results and Discussion

3.1. CoralNet Training

The AI accuracy improvement over time can be seen on the CoralNet page hosting 161 this data: https://coralnet.ucsd.edu/source/5546/, accessed on 13 May 2025. Briefly, accuracy rose from 75% after 121 images to 80% after 284. By the time the initial 450 training images had been manually annotated, accuracy had further improved to 81–82% (Table 2), and the remaining images were annotated automatically by CoralNet. A subset of 150 of these was manually verified and reannotated, and the CoralNet accuracy further increased to 87% (Table 2). This is similar to values obtained by CoralNet’s developers (83%) in their initial tests of this image classification AI [17].
I next sought to ensure that CoralNet could accurately differentiate normally pigmented corals from bleaching ones by manually annotating another 150 images; a false-positive bleaching rate of 2.2% was calculated (Table 2). Note that this does not mean that 2.2% of colonies were deemed to be bleaching when they were not, but instead 2.2% of the total coral tissue surface area (which spanned 769 colonies in this analysis) was incorrectly classified as bleached when these tissues were actually normally pigmented (healthy). In contrast, the false-negative bleaching rate was far higher: 12.6% of coral tissue surface area was predicted by CoralNet to be normally pigmented when it was actually bleaching. These instances were normally those in which the corals were only partially bleaching, and so the AI would be expected to be less accurate.

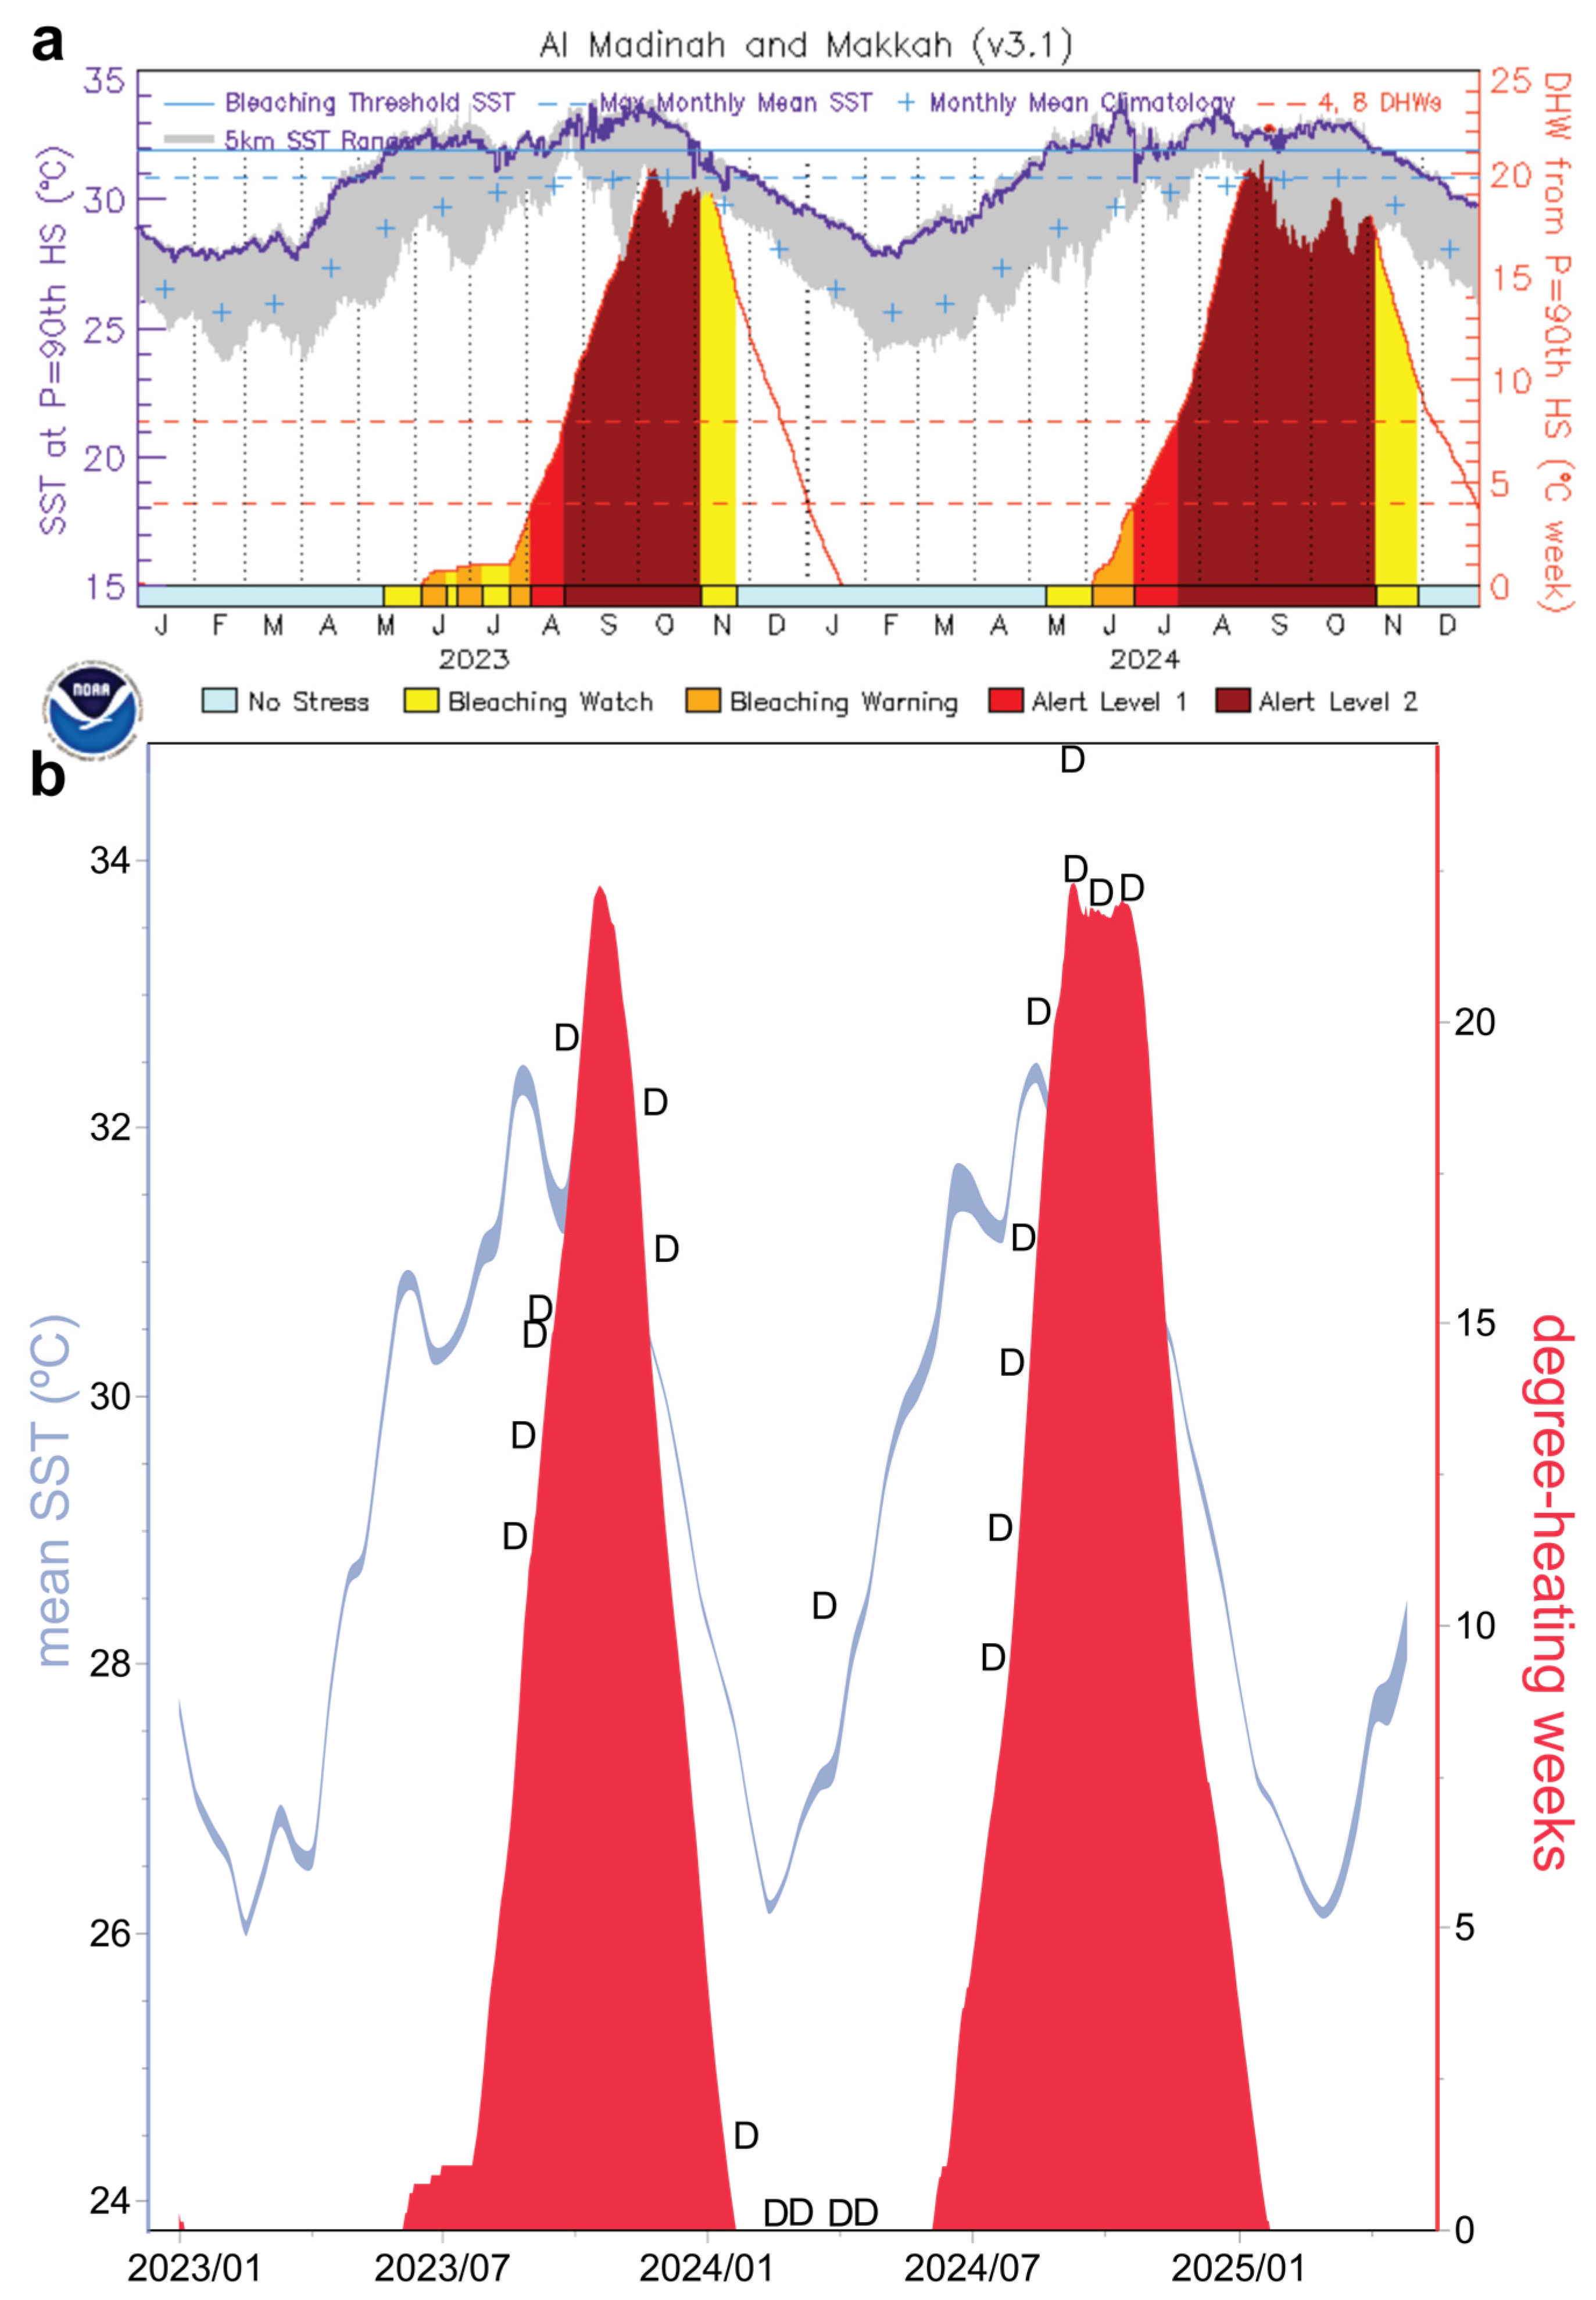
3.2. Temperature Comparison

NOAA’s Coral Reef Watch sea surface temperature (SST) data as well as degree-heating weeks (DHWs) based on daily 90th percentile “Hot Spot” values for the Madinah-Makkah region of Saudi Arabia are both shown in Figure 3a. Coral reef images were taken at points spanning the entire temperature spectrum (Figure 3b), from a minimum of 24 °C in January–February of 2024 to 35 °C in the boreal summer of 2024 at Rabigh. At 1–2 m at Rabigh, the temperature was 38 °C. The bleaching response elicited by these extreme temperatures is discussed below. Reliable in situ temperature data were not collected in Egypt, and the NOAA SST data from there are instead discussed alongside the bleaching data for Egypt.
Although a comprehensive characterization of the temperature regime was not a major goal of this work, a brief treatise on the degree of congruency between in situ temperatures (assessed with an Oceanic OCi dive computer) and NOAA’s SST is worth mentioning (Figure 4a). When regressing the two measures of temperature against each other using data from Saudi Arabia only, an R2 of 0.88 was obtained (p < 0.001). What is more telling, however, is the relationship between the mean temperature of both approaches and the absolute temperature difference (Figure 4b); during cooler months, NOAA’s SST tended to be higher than the actual temperatures, whereas during the warm summer months, NOAA’s satellite data underestimated the actual temperatures. Across an entire year, NOAA’s temperature estimates were off by ~0.1 °C (Figure 4c), but the standard deviation was high: 1.5 °C. Given that a primary aim of this work is to advocate cheap, simple methods to characterize coral reefs, this margin of error may be acceptable, though those with well-calibrated laboratory-grade temperature sensors, or even HOBO loggers (USA), would be remiss in not using them. This is even more critical in areas with strong upwelling, where temperature may vary greatly over short-term timescales. Red Sea coral reefs, in contrast, do not experience strong temperature contrasts over the diel cycle, nor do temperatures even decrease dramatically at depth [18]. This is not to say that upwelling is uncommon [19], only that the resulting temperature changes are small (1–3 °C) vs. 6–10 °C observed over only several hours in other coral-rich upwelling systems [20].
Figure 3. Saudi Arabia seawater temperature data. A plot from NOAA’s Coral Reef Watch encompassing the 2023–2024 survey period (a). Note that these are sea surface temperatures (SST) and do not necessarily correspond to those documented at depth, which are instead shown in Figure 4. A subset of the NOAA climatology dataset has been replotted in (b) to denote the times at which coral reef imagery was acquired (“D” for survey “dive”). The total number (22) does not equal the total number of Saudi Arabian survey dives (48) since 2–3 sites were typically surveyed on a given field day.
Environments 12 00248 g003
Figure 4. Comparison between NOAA’s satellite-derived sea surface temperatures (SST) and in situ temperatures recorded at depth by an Oceanic OCi dive computer. NOAA’s Madinah-Makkah, Saudi Arabia SST dataset was downloaded from their Middle East webpage (https://coralreefwatch.noaa.gov/product/vs/timeseries/middle_east.php#jazan, accessed on 13 May 2025) and plotted against in situ temperatures (temp.) from 48 Saudi Arabian reef sites only (a). The difference between the NOAA SST and in situ temp. vs. the mean temp. across both methods was also plotted (b), with overestimates from the former method falling above the horizontal black line (and underestimates below it). In both panels (a,b), the correlations were statistically significant (p < 0.0001). As another means of depicting the inter-method temp. variation, a simple histogram of these differences has been shown (c), and the mean difference across methods was 0.12 °C.
Environments 12 00248 g004

3.3. Coral Cover and Bleaching Dynamics (2023–2024): Thuwal, Saudi Arabia

Herein, an opportunistic survey regime was employed; ideally, each of the study sites would have been surveyed before, during, and after the 2023 and 2024 bleaching events. However, this was only possible at Thuwal and, to a lesser extent, Yanbu (Figure 5a–j). Seawater temperatures were 33 °C at Thuwal in early September 2023, a full degree higher than the predicted NOAA SST (Figure 3 and Figure 4). This resulted in bleaching that continued through the final quarter of the year (Figure 5f,g); approximately 35% of the total coral tissue surface area was bleached in September 2023 (Table 3), and healthy coral cover was only 12% (Figure 6a). This value dropped to 10% by November 2023 (Figure 6a), at which point nearly 40% of the corals were still bleached. As a comparison, healthy (unbleached) coral cover of these reefs was nearly 45% in 2015 [21] and 25% in 2020 [22].
Corals recovered over the course of December 2023 and early January 2024 (Figure 5c,h and Figure 6a); only 16% of corals remained bleached by February (Figure 6a), and total coral cover had risen significantly from 16% in boreal fall 2023 to 19% in early 2024. Healthy coral cover also increased significantly from 10 to 16%, respectively, over this interval (Figure 6a), before then decreasing significantly to 8% by the boreal spring (Figure 5d,i). This is possibly because many of the corals that remained bleached in the boreal winter finally perished (Figure 6a); then again, roughly 20% of corals remained bleached in both seasons. By August 2024, temperatures reached 33 °C (significantly higher than the ~32 °C estimated by NOAA; p < 0.01), and over half of the corals were actively bleaching (Figure 5e,j and Figure 6a). To what degree this bleaching event led to further coral mortality in the region, whose healthy coral cover was only 6% by early October 2024 (Figure 6a), will be determined in follow-up surveys conducted by scientists at the King Abdullah University of Science and Technology and other local coral-reef-focused agencies (e.g., SHAMS, CORDAP). As of my final survey dive there, healthy coral cover had declined by >~4-fold since the 2020 surveys of Dunne et al. [22]: from 25 to 6%. Note that, because the AI’s accuracy was 87%, if the most conservative estimate of coral cover derived from AI-based image classifications is instead taken, then the coral cover of Thuwal’s reefs in the summer of 2024 would be better stated as a range from 5% (all instances in which the AI predicted a feature to be a coral when it was actually something else) to 7% (all possible instances in which the AI predicted a feature to be something other than a coral when it was actually a coral). Therefore, the 4-fold decrease could actually be as low as a 3.5-fold decrease.

3.4. Coral Cover and Bleaching Dynamics (2023–2024): Yanbu, Saudi Arabia

Despite experiencing a similar temperature regime (p > 0.05), the coral bleaching dynamics were very different at Yanbu, ~250 km to the north of Thuwal (Figure 4). In summer 2023 (Figure 5a,f), total coral cover was >25%, which falls within the range of values of 2008–2009 surveys from Bruckner and Dempsey [23] of ~20% and Riegl et al. [24] of ~35%. Although a 2015 survey documented coral cover at >50% [21], this likely represents an overestimate, as sites with high cover were possibly targeted. Of the 25% cover in summer 2023, however, 36% of the corals were bleached (Figure 6b). This is statistically similar to the 35% bleaching documented at Thuwal (p > 0.05).
Total coral cover decreased significantly to only 17% by the boreal spring of 2024 (Figure 5d,i), and 27% of corals remained bleached at that time (Figure 6b). Healthy coral cover continued to decrease over the course of the 2024 summer to only 14% (Figure 5e,j), though the overall bleaching percentage was similar (26%; p > 0.05; Figure 6b) in September 2024 (vs. 24% in spring 2024), even as temperatures reached ~34 °C. This is roughly half the percentage documented at this same time at Thuwal (56–57%; Table 3), and this difference was statistically significant (Figure 6d). The surveyed sites are regularly explored by tourists, and so I should have the opportunity to assess recovery, or lack thereof, over the course of late 2025 and beyond. Perhaps these thermal stress events will lead to acclimatization, or even adaptation, responses in the resident corals [25], though at present, healthy cover has declined by at least 2-fold since 2008–2009 (from 25–30% [23,24] to 11%).

3.5. 2024 Coral Bleaching: Remaining Saudi Arabian Sites

Unlike for Thuwal and Yanbu, the remaining Saudi Arabian sites were only surveyed during the 2024 boreal summer, when upwards of 20 DHWs had transpired (Figure 3a,b), even when using the lower NOAA SST estimates (~1 °C less than the in situ temperatures; Figure 4). Reefs of Jeddah averaged 21.6% total coral cover (Table 3), but 36% of these were bleaching (Figure 5j and Figure 6d). This summer bleaching percentage is significantly higher than at Yanbu but significantly lower than at Thuwal (Figure 6d). The healthy coral cover at Jeddah of 13.8% (Table 3) was significantly higher than at Thuwal (6%; p < 0.01) and Yanbu (11%; p < 0.01) by the boreal fall of 2024 and is similar to values of ~15% documented by Gonzalez et al. [26] in a 2019 survey. This is the only region that did not experience at least a 2-fold decline in healthy coral cover over the past 5–10 years.
Figure 5. Spatio-temporal trends in coral cover and bleaching prevalence. Healthy (nonbleached) coral cover was plotted over time for study sites of Thuwal (all seasons; (ae)) and Yanbu (three of the five seasons; (a,d,e)), Saudi Arabia. Coral cover data have also been presented for sites assessed only during the summer of 2024 (e). The legend can be found within panel (c). Coral bleaching (as % of all scleractinian coral tissue surface area bleached) has also been plotted for these sites (fj), with the legend for the % bleaching data instead found in panel (h). Note that the two legends are inverted relative to one another.
Environments 12 00248 g005
Figure 6. Coral bleaching in the Central Red Sea. Healthy (green) and bleached (red) coral cover have been plotted over time for Thuwal (a) and Yanbu (b), and the lowercase letters, uppercase Roman numerals, and lowercase Roman numerals represent nonparametric post-hoc differences (p < 0.05) in total coral cover, healthy coral cover, and bleached coral cover, respectively, over time (Kruskal–Wallis p < 0.001 in all cases); the black lines instead signify mean % of all coral tissues bleached (right y-axes). The overall % of all coral tissues bleached for Saudi Arabia over this period (blue line), alongside degree-heating weeks (DHWs), has been shown in panel (c). Mean percentages of all coral tissues bleaching in summer 2024 have also been plotted by survey region (d-left half) and country (d-right half); lowercase letters in the former, and uppercase letters in the latter, denote nonparametric post-hoc differences (p < 0.05) as both Kruskal–Wallis and Wilcoxon sign-rank tests, respectively, revealed significant spatial differences (p < 0.01).
Environments 12 00248 g006
In contrast to the previous sites, reefs of Rabigh have not been surveyed extensively. The seawater temperature there in summer 2024 was 34 °C, with the surface water (0–1 m) at ~38 °C; this is significantly higher than NOAA’s ~32 °C SST estimate. Healthy coral cover in summer 2024 (Figure 5e) was <9% (Table 3), despite corals occupying nearly 25% of the benthos (i.e., >60% bleaching). Bleaching at Rabigh was worse than at all other Saudi Arabian sites and was only matched by levels documented in Egypt (Figure 6d; discussed below). Rabigh’s corals also bleached significantly in response to the 1998 bleaching event that affected reefs around the globe [27], though neither coral cover nor degree of bleaching was documented then. In that instance, corals recovered, though whether or not they can do so again is uncertain, especially given the large amount of macroalgae that was engulfing the two sites at the time of surveying (mid-August 2024; author’s observations (https://andersonblairmay.myportfolio.com/red-sea-dive-39-north-rabigh-2-shore, accessed on 13 May 2025)).
Table 3. Data summary. Note that the coral cover (%) values are shown as “healthy” (excluding bleaching) and with the bleached (but still alive) corals (in parentheses, i.e., “total”). For the two regions surveyed at multiple times, Thuwal and Yanbu (both in the Kingdom of Saudi Arabia (KSA)), the % healthy (total) cover values for 2023 represent the data pooled across boreal summer and fall (see Figure 4 for unpooled data). Percent bleaching values (relative to all coral tissue area) are given as ranges, not to display spatial or temporal variability but instead to highlight slight differences across methods: the lower and upper values are derived from the raw and summarized data, respectively. Lowercase letters in the “% healthy (total) cover summer 2024” column reflect nonparametric post-hoc differences (p < 0.05) of the healthy coral cover only, as a Kruskal–Wallis test determined a significant effect of region (X2 = 293, p < 0.0001). NA = not assessed (see Table 1).
Region, Country% Healthy (Total) Cover 2023 (Pooled)% Bleaching Summer 2023 &% Healthy + (Total) Cover Summer 2024% of All Coral Tissues Bleached-Summer 2024 *
Thuwal, KSA11.2 (17.2)34.9–37.66.0 c (13.6)53.9–56.0
Yanbu, KSA17.1 (26.1)34.0–34.512.3 b (16.1)23.6–25.8
Qunfudah, KSANANA14.7 a (16.5)11.1–15.3
Jeddah, KSANANA13.8 a (21.6)35.6–36.4
Rabigh, KSANANA8.8 b (23.6)62.6–64.8
Marsa Nakari, EgyptNANA9.4 b (21.4)56.0–57.4
Wadi Lahami, EgyptNANA9.2 b (22.1)58.4–59.3
& See Figure 5f. + See Figure 5e. * See Figure 6d.
Although coral cover and bleaching percentages were not reported before for Qunfudah, Bruckner [28] provided a brief description of these reefs. Despite temperatures of > 31 °C in late August 2024, at which point extensive bleaching was documented at Rabigh and other sites farther north, the mean % of all coral tissues bleached at Qunfudah (Figure 5j) was only ~11–15% (Table 3 and Figure 6d); this is significantly lower than all other sites. Healthy coral cover (~15%) was higher than all other sites when considering all survey times (Table 4), though not significantly higher than at Yanbu and Jeddah. When looking only at the healthy cover from the summer 2024 surveys (Table 3), only that of Jeddah was statistically similar to the Qunfudah percentage. Why, at the moment, Qunfudah’s reefs are faring better than those farther north is unknown, but could be related to the more turbid water there (<5 m visibility), which resulted in a shading effect that may have thwarted bleaching. It is also possible that the dive operator deliberately avoided sites with more extensive bleaching (albeit this is a concern for many other sites).

3.6. Coral Bleaching 2024: Egyptian Sites

Although the mean September water temperature was similar between Saudi Arabia (31.0 °C) and Egypt (31.3 °C; Wilcoxon rank-sum test, p > 0.05), the mean monthly maximum estimated by NOAA for the latter was ~1 °C lower: 30 °C for Egypt vs. 31 °C for Saudi Arabia (i.e., bleaching thresholds of 31 °C and 32 °C, respectively; compare Figure 3 and Figure 7). This resulted in over 25 DHWs for Southern Egypt’s reefs (Figure 7) vs. closer to 21–22 DHWs for Saudi Arabia. The two Egyptian survey regions, Marsa Nakari and Wadi Lahami, were characterized by similar healthy coral covers of ~9% in September 2024 (Figure 5e and Table 3 and Table 4); as total coral cover was 21–22% (Table 3), this corresponds to 50–60% bleaching (Figure 8). Only Rabigh experienced a comparable bleaching percentage (Figure 6d). The mean percentage of all coral tissues bleached across all 11 Egyptian survey sites of ~60% was significantly higher than the 40–45% across all 22 Saudi sites (Figure 6d). These data represent the only documentation of the 2024 bleaching event to date at these Egyptian sites.
The Egyptian bleaching percentages are similar to those documented in 2020, farther north near Marsa Alam (63% [29]). Of note, not a single living Millepora sp. colony was seen at any of the 11 survey sites in 2024 (which spanned 12 dives), amidst hundreds of recently dead milleporid skeletons. Although Dosoky et al. [29] also found Millepora to be the most sensitive genus, they documented a percent bleaching of 62%, versus 100% mortality observed herein. Possibly the starkest difference with the Dosoky et al. [29] survey is in the unbleached coral cover; they documented a mean healthy coral cover of 56% across six major regions of the Egyptian Red Sea, with values approaching 60% in the area closest to where my 2024 surveys took place. Another team documented a similar healthy coral cover of 52% at Marsa Nakari between 2017 and 2019 [30]. This represents a ~6-fold loss of hard coral cover from 2017 to 2024 (~52% in 2017 to 9% in 2024 [Table 3 and Table 4]). Coral cover at Wadi Lahami was approximately 41% in 2009–2012 [31], with severe bleaching reported anecdotally in the months leading up to my surveys [32]; this represents a ~4.5-fold decrease in coral cover over a 12-year period. In addition to Millepora, few montiporids or acroporids were observed at Marsa Nakari or Wadi Lahami, and although coral diversity was not assessed herein, it is likely that the loss of acroporids and milleporids contributed significantly to this dramatic decline in coral abundance [33].
Figure 8. A severely bleached coral reef near Wadi Lahami, Egypt. Photo by the author. The large black patch in the middle of the photo is dead coral covered in cyanobacteria.
Environments 12 00248 g008

4. Conclusions

Across the five Saudi Arabian and two Egyptian coral reef survey regions, the overall mean total coral cover was just above 20% (Table 4); however, only 11.5% of these were unbleached when pooling the data across all survey times. In other words, on average, 43% of the corals were bleached at any given time, and bleaching was not only observed during the warmest months, but for many weeks (and sometimes months) thereafter in the cases of Thuwal and Yanbu. Although some corals will undoubtedly recover, the fact that reefs of Thuwal, Yanbu, and Southern Egypt have undergone ~4-fold, ~2-fold, and ~6-fold decreases in live coral cover, respectively, over the past 5–10 years is concerning. Thankfully, reports from farther north, such as the Gulf of Aqaba, have documented more impressive degrees of coral thermotolerance to marine heatwaves [34,35], meaning there might still be hardy source populations that could seed these highly degraded reefs [36]. Those interested in further contributing to these monitoring efforts in the Red Sea can email observations, photos, or data to the Saudi Arabian General Organization for the Conservation of Coral Reefs and Turtles in the Red Sea (redseareefratch@shams.gov.sa), who produce a monthly or bimonthly bleaching report during the warmest months of the year. Popular citizen scientist websites, such as iNaturalist, as well as CoralNet itself (which is open-access), could also host images. In this way, nonscientists need not even annotate the submitted photos themselves; either coral scientists (assuming relatively small numbers of images) or the CoralNet AI (for 100s–1000s of pictures) can do so.
This citizen science and open-source AI approach could ultimately allow us to monitor the ecological condition of a far larger reef area than what is normally covered by scientists alone, and is particularly attractive since it only requires SCUBA certification and the ability to white-balance photos while underwater. Popular cameras like the GoPro (USA) can theoretically white balance automatically as divers descend and ascend, and while, in my experience, the image quality is currently too low for AI-based image classification at recreational diving depths (<40 m), this will surely improve as GoPro and other camera manufacturers, including smart phone companies, improve their devices’ abilities to obtain high-resolution photos (even at light-limited depths). With nothing more than a cell phone, a waterproof container/pouch, and an Internet connection, millions of divers could become our collective “eyes on the reef.”

Supplementary Materials

The following supporting information can be downloaded at: https://www.mdpi.com/article/10.3390/environments12070248/s1, Supplementary File S1: Comparison between NOAA’s satellite-derived sea surface temperatures (SST) and in situ temperatures (temp.) recorded at depth by an Oceanic OCi dive computer. Supplementary File S1 is tab-delineated Microsoft Excel spreadsheet featuring all data analyzed in the manuscript.

Funding

This work was generously funded by the Coral Research and Development Accelerator Platform (CORDAP; Thuwal, Saudi Arabia), which is hosted by the King Abdullah University of Science and Technology.

Data Availability Statement

All images analyzed have been submitted to the website used to analyze them: CoralNet (https://coralnet.ucsd.edu/source/4963, accessed on 13 May 2025). They are freely accessible and downloadable by all. All quantitative data featured in the article have been included in a supplemental Excel file (Supplementary File S1). Supplemental Red Sea imagery can be found on coralreefdiagnostics.com, and edited versions of all analyzed photos can be accessed here (https://andersonblairmay.myportfolio.com/, accessed on 13 May 2025). Finally, the dataset has been submitted to the Global Coral Reef Monitoring Network for inclusion in their forthcoming global coral reef status report and is also downloadable here: https://coralreefdiagnostics.com/red-sea, accessed on 13 May 2025.

Acknowledgments

Thanks are given to King Abdullah University of Science and Technology for hosting my stay in the Kingdom of Saudi Arabia. I am also indebted to Red Sea Diving Safari, who sponsored my trips to Marsa Nakari and Wadi Lahami (Egypt) and contributed citizen science data against which I could compare my own findings.

Conflicts of Interest

The author declares no conflicts of interest. The funders had no role in the design of the study; in the collection, analyses, or interpretation of data; in the writing of the manuscript; or in the decision to publish the results.

Abbreviations

The following abbreviations are used in this manuscript:
AIArtificial intelligence
DHWDegree-heating weeks
FNRFalse-negative rate
FPRFalse-positive rate
SSTSea surface temperatures

References

  1. Hughes, T.P.; Kerry, J.T.; Álvarez-Noriega, M.; Álvarez-Romero, J.G.; Anderson, K.D.; Baird, A.H.; Babcock, R.C.; Beger, M.; Bellwood, D.R.; Berkelmans, R.; et al. Global Warming and Recurrent Mass Bleaching of Corals. Nature 2017, 543, 373–377. [Google Scholar] [CrossRef] [PubMed]
  2. Reimer, J.D.; Peixoto, R.S.; Davies, S.W.; Traylor-Knowles, N.; Short, M.L.; Cabral-Tena, R.A.; Burt, J.A.; Pessoa, I.; Banaszak, A.T.; Winters, R.S.; et al. The Fourth Global Coral Bleaching Event: Where Do We Go from Here? Coral Reefs 2024, 43, 1121–1125. [Google Scholar] [CrossRef]
  3. Liu, G.; Heron, S.F.; Eakin, C.M.; Muller-Karger, F.E.; Vega-Rodriguez, M.; Guild, L.S.; Cour, J.L.; Geiger, E.F.; Skirving, W.J.; Burgess, T.F.R.; et al. Reef-Scale Thermal Stress Monitoring of Coral Ecosystems: New 5-Km Global Products from NOAA Coral Reef Watch. Remote Sens. 2014, 6, 11579–11606. [Google Scholar] [CrossRef]
  4. Mayfield, A.B.; Dempsey, A.C.; Chen, C.S. Predicting the Abundance of Corals from Simple Environmental Predictors with a Machine-Learning Approach. Platax 2022, 19, 43–57. [Google Scholar]
  5. Head, C.E.I.; Bayley, D.T.I.; Rowlands, G.; Roche, R.C.; Tickler, D.M.; Rogers, A.D.; Koldewey, H.; Turner, J.R.; Andradi-Brown, D.A. Coral Bleaching Impacts from Back-to-Back 2015–2016 Thermal Anomalies in the Remote Central Indian Ocean. Coral Reefs 2019, 38, 605–618. [Google Scholar] [CrossRef]
  6. Roberts, C.J.; Vergés, A.; Poore, A.G.B. A New Resource for Monitoring Reef Ecosystems: The Background of Recreational Diver Photographs Contains Valuable Habitat Data. J. Appl. Ecol. 2023, 60, 2688–2698. [Google Scholar] [CrossRef]
  7. Marshall, N.J.; Kleine, D.A.; Dean, A.J. CoralWatch: Education, Monitoring, and Sustainability through Citizen Science. Front. Ecol. Environ. 2012, 10, 332–334. [Google Scholar] [CrossRef]
  8. Licuanan, W.Y.; Mordeno, P.Z.B.; Go, M.V. C30—A Simple, Rapid, Scientifically Valid, and Low-Cost Method for Citizen-Scientists to Monitor Coral Reefs. Reg. Stud. Mar. Sci. 2021, 47, 101961. [Google Scholar] [CrossRef]
  9. Reverter, M.; Helber, S.B.; Rohde, S.; de Goeij, J.M.; Schupp, P.J. Coral Reef Benthic Community Changes in the Anthropocene: Biogeographic Heterogeneity, Overlooked Configurations, and Methodology. Glob. Change Biol. 2022, 28, 1956–1971. [Google Scholar] [CrossRef] [PubMed]
  10. Lawson, C.L.; Chartrand, K.M.; Roelfsema, C.M.; Kolluru, A.; Mumby, P.J. Broadscale Reconnaissance of Coral Reefs from Citizen Science and Deep Learning. Environ. Monit. Assess. 2025, 197, 814. [Google Scholar] [CrossRef] [PubMed]
  11. Done, T.; Roelfsema, C.; Harvey, A.; Schuller, L.; Hill, J.; Schläppy, M.-L.; Lea, A.; Bauer-Civiello, A.; Loder, J. Reliability and Utility of Citizen Science Reef Monitoring Data Collected by Reef Check Australia, 2002–2015. Mar. Pollut. Bull. 2017, 117, 148–155. [Google Scholar] [CrossRef] [PubMed]
  12. Branchini, S.; Pensa, F.; Neri, P.; Tonucci, B.M.; Mattielli, L.; Collavo, A.; Sillingardi, M.E.; Piccinetti, C.; Zaccanti, F.; Goffredo, S. Using a Citizen Science Program to Monitor Coral Reef Biodiversity through Space and Time. Biodivers. Conserv. 2015, 24, 319–336. [Google Scholar] [CrossRef]
  13. Obura, D.O.; Aeby, G.; Amornthammarong, N.; Appeltans, W.; Bax, N.; Bishop, J.; Brainard, R.E.; Chan, S.; Fletcher, P.; Gordon, T.A.C.; et al. Coral Reef Monitoring, Reef Assessment Technologies, and Ecosystem-Based Management. Front. Mar. Sci. 2019, 6, 580. [Google Scholar] [CrossRef]
  14. Winters, G.; Holzman, R.; Blekhman, A.; Beer, S.; Loya, Y. Photographic Assessment of Coral Chlorophyll Contents: Implications for Ecophysiological Studies and Coral Monitoring. J. Exp. Mar. Biol. Ecol. 2009, 380, 25–35. [Google Scholar] [CrossRef]
  15. Siebeck, U.; Marshall, N.; Klüter, A.; Hoegh-Guldberg, O. Monitoring Coral Bleaching Using a Colour Reference Card. Coral Reefs 2006, 25, 453–460. [Google Scholar] [CrossRef]
  16. Carlton, R.; Dempsey, A.C.; Lubarsky, K.; Akao, I.; Faisal, M.; Purkis, S. Global Reef Expedition: Solomon Islands. Final Report; Khaled bin Sultan Living Oceans Foundation: Tire Hill, PA, USA, 2020. [Google Scholar]
  17. Beijbom, O.; Edmunds, P.J.; Roelfsema, C.; Smith, J.; Kline, D.I.; Neal, B.P.; Dunlap, M.J.; Moriarty, V.; Fan, T.-Y.; Tan, C.-J.; et al. Towards Automated Annotation of Benthic Survey Images: Variability of Human Experts and Operational Modes of Automation. PLoS ONE 2015, 10, e0130312. [Google Scholar] [CrossRef] [PubMed]
  18. Yao, F.; Hoteit, I. Rapid Red Sea Deep Water Renewals Caused by Volcanic Eruptions and the North Atlantic Oscillation. Sci. Adv. 2018, 4, eaar5637. [Google Scholar] [CrossRef] [PubMed]
  19. DeCarlo, T.M.; Carvalho, S.; Gajdzik, L.; Hardenstine, R.S.; Tanabe, L.K.; Villalobos, R.; Berumen, M.L. Patterns, Drivers, and Ecological Implications of Upwelling in Coral Reef Habitats of the Southern Red Sea. J. Geophys. Res. Oceans 2021, 126, e2020JC016493. [Google Scholar] [CrossRef]
  20. Mayfield, A.B.; Chan, P.H.; Putnam, H.M.; Chen, C.S.; Fan, T.Y. The Effects of a Variable Temperature Regime on the Physiology of the Reef-Building Coral Seriatopora Hystrix: Results from a Laboratory-Based Reciprocal Transplant. J. Exp. Biol. 2012, 215, 4183–4195. [Google Scholar] [CrossRef] [PubMed]
  21. Aeby, G.S.; Shore, A.; Jensen, T.; Ziegler, M.; Work, T.; Voolstra, C.R. A Comparative Baseline of Coral Disease in Three Regions along the Saudi Arabian Coast of the Central Red Sea. PLoS ONE 2021, 16, e0246854. [Google Scholar] [CrossRef] [PubMed]
  22. Dunne, A.F.; Tietbohl, M.D.; Nuber, C.; Berumen, M.; Jones, B.H. Fish-Mediated Nutrient Flows from Macroalgae Habitats to Coral Reefs in the Red Sea. Mar. Environ. Res. 2023, 185, 105884. [Google Scholar] [CrossRef] [PubMed]
  23. Bruckner, A.W.; Dempsey, A.C. The Status, Threats, and Resilience of Reef-Building Corals of the Saudi Arabian Red Sea. In The Red Sea: The Formation, Morphology, Oceanography and Environment of a Young Ocean Basin; Rasul, N.M.A., Stewart, I.C.F., Eds.; Springer: Berlin/Heidelberg, Germany, 2015; pp. 471–486. ISBN 978-3-662-45201-1. [Google Scholar]
  24. Riegl, B.M.; Bruckner, A.W.; Rowlands, G.P.; Purkis, S.J.; Renaud, P. Red Sea Coral Reef Trajectories over 2 Decades Suggest Increasing Community Homogenization and Decline in Coral Size. PLoS ONE 2012, 7, e38396. [Google Scholar] [CrossRef] [PubMed]
  25. Fox, M.D.; Cohen, A.L.; Rotjan, R.D.; Mangubhai, S.; Sandin, S.A.; Smith, J.E.; Thorrold, S.R.; Dissly, L.; Mollica, N.R.; Obura, D. Increasing Coral Reef Resilience through Successive Marine Heatwaves. Geophys. Res. Lett. 2021, 48, e2021GL094128. [Google Scholar] [CrossRef]
  26. Gonzalez, K.; Daraghmeh, N.; Lozano-Cortés, D.; Benzoni, F.; Berumen, M.L.; Carvalho, S. Differential Spatio-Temporal Responses of Red Sea Coral Reef Benthic Communities to a Mass Bleaching Event. Sci. Rep. 2024, 14, 24229. [Google Scholar] [CrossRef] [PubMed]
  27. DeVantier, L.; Pilcher, N. The Status of Coral Reefs in Saudi Arabia. In Status of Coral Reefs of the World; Australian Institute of Marine Science: Townsville, Australia, 2000. [Google Scholar]
  28. Bruckner, A.W. Habitat Mapping and Characterization of Coral Reefs of the Saudi Arabian Red Sea: 2006–2009; Final Report Part II, Ras Qisbah, Al Wajh, Yanbu, Farasan Banks and Farasan Islands; Panoramic Press: Phoenix, AZ, USA, 2011. [Google Scholar]
  29. Dosoky, Y.A.; Ahmed, M.I.; Madkour, F.F.; Hanafy, M.H. Coral Bleaching Occurrence along the Egyptian Coast of the Red Sea during the Summer Heat Stress Period, 2020. Egypt J. Aquat. Biol. Fish. 2021, 25, 17–37. [Google Scholar] [CrossRef]
  30. Ghallab, A.; Hussein, H.N.M.; Madkour, H.; Osman, A.; Mahdy, A. Status of Coral Reefs along the Egyptian Red Sea Coast. In Coral Reefs and Associated Marine Fauna Around the Arabian Peninsula; CRC Press: Boca Raton, FL, USA, 2024; ISBN 978-1-003-32139-2. [Google Scholar]
  31. Moldrizio, S. Annual Report of RSDS Reef Monitoring Programme. Reef Check. 2012. Available online: https://www.redsea-divingsafari.com/downloads/eco-article/988ed-Reef_Check_Annual_Report_2012.pdf (accessed on 15 May 2025).
  32. Sharaka, T.M.A. Scientific Review for the Coral Reef Bleaching Event (2023) along the Egyptian Coast of The Red Sea. Ministry (sp.) Environment Report. 2024. Available online: https://icriforum.org/wp-content/uploads/2024/04/Scientific-Review-for-the-Coral-Reef-Bleaching-Event-2023-along-the-Egyptian-Coast-of-The-Red-Sea.pdf (accessed on 15 May 2025).
  33. Furby, K.A.; Bouwmeester, J.; Berumen, M.L. Susceptibility of Central Red Sea Corals during a Major Bleaching Event. Coral Reefs 2013, 32, 505–513. [Google Scholar] [CrossRef]
  34. Fine, M.; Gildor, H.; Genin, A. A Coral Reef Refuge in the Red Sea. Glob. Change Biol. 2013, 19, 3640–3647. [Google Scholar] [CrossRef] [PubMed]
  35. Lin, Y.-J.; Heinle, M.J.; Al-Musabeh, A.; Gopalan, J.; Vasanthi, T.D.; Panickan, P.; Hamade, T.; Pulido, B.; Joydas, T.V.; Shepherd, B. Coral Reefs in the Northeastern Saudi Arabian Red Sea Are Resilient to Mass Coral Mortality Events. Mar. Pollut. Bull. 2023, 197, 115693. [Google Scholar] [CrossRef] [PubMed]
  36. Osman, E.O.; Smith, D.J.; Ziegler, M.; Kürten, B.; Conrad, C.; El-Haddad, K.M.; Voolstra, C.R.; Suggett, D.J. Thermal Refugia against Coral Bleaching throughout the Northern Red Sea. Glob. Change Biol. 2018, 24, e474–e484. [Google Scholar] [CrossRef] [PubMed]
Figure 1. A severely bleached coral reef in the Red Sea. This photo was taken by the author on 31 August 2024 at “Shark Reef” (inshore), near Thuwal, Saudi Arabia. At this point, nearly 22 degree-heating weeks had passed, and seawater temperature was >32 °C.
Environments 12 00248 g001
Figure 7. NOAA Coral Reef Watch report for Egypt (2023–2024). Surveys at Marsa Nakari and Wadi Lahami were conducted in late September 2024, at which point over 25 degree-heating weeks had transpired.
Environments 12 00248 g007
Table 4. Summary of data across the survey period. The values in the “% total coral cover” column include bleaching corals that had not yet died. The “% healthy coral cover” column instead includes only unbleached corals. Lowercase letter, Roman numeral, and uppercase letter superscripts denote nonparametric post-hoc differences in total coral cover, healthy coral cover, and mean % of all coral tissues bleached (all p < 0.05), respectively, as Kruskal–Wallis tests detected effects of region in all cases (X2 = 271, 221, and 688, respectively, all p < 0.0001). Error terms for the seven sites and global mean (last row; “Mean”) represent inter-image (n = 173–2567) and inter-site (n = 7) standard deviations, respectively.
RegionCounty# of Photos% Total Coral Cover ± Std. Dev. % Healthy Coral Cover ± Std. Dev.Mean % Bleaching &
ThuwalSaudi Arabia256716.1 ± 15.2 b10.2 ± 12.3 II*36.6–37.1 B
YanbuSaudi Arabia103620.3 ± 15.7 a14.3 ± 12.7 I*29.5–29.7 C
QunfudahSaudi Arabia21016.5 ± 16.2 b14.7 ± 15.6 I11.1–15.3 D
JeddahSaudi Arabia116021.6 ± 16.8 a13.8 ± 13.9 I35.6–36.4 B
RabighSaudi Arabia17323.6 ± 16.4 a8.8 ± 11.9 II62.6–64.8 A
Marsa NakariEgypt67421.4 ± 15.0 a9.4 ± 10.3 II56.0–57.4 A
Wadi LahamiEgypt118022.1 ± 15.8 a9.2 ± 10.3 II58.5–59.3 A
Mean20.2 ± 2.9%11.5 ± 2.6%42.8–43.1%
& See Figure 6d for these data from 2024 only. * See Figure 6a for these data plotted over time.
Disclaimer/Publisher’s Note: The statements, opinions and data contained in all publications are solely those of the individual author(s) and contributor(s) and not of MDPI and/or the editor(s). MDPI and/or the editor(s) disclaim responsibility for any injury to people or property resulting from any ideas, methods, instructions or products referred to in the content.

