Aeolian Ripple Migration and Associated Creep Transport Rates
by
 , ,
, ,
Douglas J. Sherman
1, 
Pei Zhang
1,
Raleigh L. Martin
2,
Jean T. Ellis
3,
Jasper F. Kok
2,
Eugene J. Farrell
4 and
Bailiang Li
5,* 1
Department of Geography, The University of Alabama, Tuscaloosa, AL 35487, USA
2
Department of Atmospheric and Oceanic Sciences, University of California, Los Angeles, CA 90095, USA
3
Department of Geography, University of South Carolina, Columbia, SC 29208, USA
4
Department of Geography & Archaeology, National University Ireland Galway, Galway, H91 TK33 Ireland
5
Department of Health and Environmental Sciences, Xi’an Jiaotong-Liverpool University, Suzhou 215123, China
*
Author to whom correspondence should be addressed.
Geosciences 2019, 9(9), 389; https://doi.org/10.3390/geosciences9090389
Submission received: 9 July 2019
/
Revised: 27 August 2019
/
Accepted: 3 September 2019
/
Published: 5 September 2019
(This article belongs to the Special Issue Aeolian Processes and Geomorphology)
Abstract
:Wind-formed ripples are distinctive features of many sandy aeolian environments, and their development and migration are basic responses to sand transport via saltation. Using data from the literature and from original field experiments, we presented empirical models linking dimensionless migration rates, ( is the ripple migration speed, is the gravity acceleration, and is the grain diameter) with dimensionless shear velocity, u*/u*t (u* is shear velocity and u*t is fluid threshold shear velocity). Data from previous studies provided 34 usable cases from four wind tunnel experiments and 93 cases from two field experiments. Original data comprising 68 cases were obtained from sites in Ceará, Brazil (26) and California, USA (42), using combinations of sonic anemometry, sand traps, photogrammetry, and laser distance sensors and particle counters. The results supported earlier findings of distinctively different relationships between and u*/u*t for wind tunnel and field data. With our data, we could also estimate the contribution of creep transport associated with ripple migration to total transport rates. We calculated ripple-creep transport for 1 ≤ u*/u*t ≤ 2.5 and found that this accounted for about 3.6% (standard deviation = 2.3%) of total transport.
1. Introduction
Ripples are near-ubiquitous features of sandy aeolian environments on Earth and elsewhere. The regularity of their morphology and the complex patterns that they form make them objects of visual and scientific interest. The movement of a ripple form represents a mode of sand transport that occurs at a rate proportional to the speed and height of the bed form, and thus contributes to the portion of sand moving as creep/reptation rather than saltation. Creep is normally referred to as the movement of grains in continuous or near-continuous contact with a sand bed [1] and reptation is the movement of low-energy hopping particles with no ability to rebound or to eject other grains [2]. In this paper, we defined creep to be synonymous with reptation, as the terms are often used interchangeably [2,3,4,5,6] and there is no protocol for distinguishing the grain hops of creep from the grain hops of reptation. Compared to saltation, creep still remains an understudied transport phenomenon [7,8,9,10].
Understanding the dynamics of wind ripples is important for many reasons; for example, when sand is being blown and wind conditions change, modifications of ripple length, height, and migration rates are among the first elements of surface response to relax to a new equilibrium, making such relationships ideal for experiments to understand process-response relationships. Understanding ripple migration can also facilitate the understanding and modeling of the evolution of different scales of bedforms. The preservation of the stratigraphic signatures of aeolian ripples in the rock record make them valuable tools for the reconstruction of paleo-environments on Earth [11] and on other planets [12].
Some of the earliest—somewhat nascent—explanations for ripple development began in the late 19th and early 20th Centuries [13,14,15,16,17,18]. King [19] appears to have been the first to perform (quasi) controlled experiments on aeolian ripple formation. Although there have been many attempts to understand the nature of ripple formation, there have been relatively few field or wind tunnel experiments designed to measure the geometries and kinematics of aeolian ripples, their response to changing wind conditions, and their contribution to total sand flux during transport events. The lack of data representing this fundamental boundary response motivated the research projects reported in this study, where the goals were: 1) to measure ripple lengths and heights, coincident shear velocities and total sand transport rates, 2) to incorporate our observations with those from other studies, and 3) to derive statistical models of key process-response relationships between wind speed, ripple migration, and sand transport. This work was focused on typical aeolian ripples with heights and lengths of the orders of 0.01 and 0.1 m, respectively, with mean grain sizes (d) between about 0.1 and 0.5 mm that we believe to be in equilibrium or near equilibrium with the wind. We did not consider megaripples [20,21,22] or transverse aeolian ridges [23,24,25], although both of these bed forms have received considerable and appropriate attention in the literature.
Much of the literature concerned with aeolian ripples addresses their formation, their geometry, the sedimentary structures that they produce, or the implications of their presence on extraterrestrial surfaces such as that of Mars. Aspects of these themes have been reviewed or described extensively elsewhere, and we offer only a few examples here. Many papers have addressed the nature of ripples and the dynamics of ripple formation [8,26,27,28,29,30]. Aspects of ripple geometry, especially key relationships between length, height, sand grain size, and migration rates, have also received considerable attention [31,32,33,34,35,36,37,38], as have sedimentary structures caused by aeolian ripple migration [39,40,41]. Finally, there has been substantial interest in ripple formation and migration on Mars [12,20,42,43,44], although much of the interest in Martian bedforms involves the afore-mentioned larger aeolian forms of megaripples, transverse aeolian ridges, and dunes. Only recently have researchers found the co-existence of both meter- and centimeter-scale ripples on Mars [45] and started to study their formation mechanisms [45,46], however, there were no detailed observations on ripple migration. There is also a handful of papers that reported ripple migration rates but did not relate those data to comparable wind data. Typically, these studies aimed to establish statistical relationships between ripple migration rates and the size of the ripple [47,48,49,50,51]. The physical reasoning is straightforward: the larger the ripple, the greater the mass of sand contained within it. Therefore, for a given sand transport rate, the larger the ripple, the slower it must move. As shear velocity increases, however, ripple size and migration speed should both increase, leading to faster transport rates. Jerolmack et al. [48] adapted Bagnold’s [52] model for sand transport, measured using triangular dune migration rates, as an analog for transport associated with ripple migration:
where qr is the mass of sand transported by ripple movement, P is porosity, ρs is sand density (2650 kgm−3), ur is the ripple migration rate, and H is ripple height. We assume P = 0.40 based on the data presented in Louge et al. ([53], Figure 3). Several have equated qr with the rate of transport via creep, qc [48]. More generally, we posit that qr ≤ qc to allow for conditions where some creep may move through a system faster than the bedforms move. Previous studies have found the proportion of creep transport to total transport to vary across a range from 2% [54] to 57% [55] on Earth. Bridges et al. [50], based on image analysis, estimated that relationship to be about 25% for megaripple migration on Mars. In wind tunnel and field experiments, Bagnold [56,57] found the proportion to be 25%, and this value has been widely accepted as a reasonable approximation.
Given the extensive literature concerning the formation and behavior of aeolian ripples, there is a paucity of work that documents the basic relationships between wind speed (or shear velocity), ripple size and migration rates, and the sand transport accounted for by ripple migration during a blowing sand event. After a careful search of the literature, we could identify only ten studies that reported some quantitative attributes of ripple migration and coincident wind in either wind tunnel or natural environments. Only six of these studies reported observations and measurements in detail sufficient for us to confidently use them in a comparative analysis. The studies that we found are described below, briefly and chronologically, and all relevant data from those studies and this are summarized in Supplementary Materials Table S1 and accessible online via the Zenodo data repository [58].
2. Previous Studies
Cornish [15], in a field study, reported five measurements of migration rates for 0.10 m long ripples in about 0.5 mm diameter sand. He reported only one wind speed, estimated at about 12 ms−1, but did not include a corresponding elevation. We averaged the migration rate measurements to obtain a single value, 0.18 ms−1, to use with the one wind speed and used the Law of the Wall to convert the wind speed measurement to an equivalent shear velocity, :
where κ is the von Kármán constant (0.4), is the wind speed, u, at elevation z above the surface, and is the saltation-induced roughness length. To use Cornish’s data, we estimated that wind speed was measured at an elevation of 1.2 m because we assumed that he used a hand-held anemometer, and because an elevation error of +/- 25% produces a shear velocity error of less than 10%. To estimate roughness length, we used the relationship between shear velocity and roughness length according to a Charnock-type model [59]:
where c is the Charnock constant with a value of 0.085 for general field applications and 0.0099 for wind tunnel applications and is the gravity constant. For this and other studies, we also needed to estimate the threshold shear velocity, . We used Bagnold’s [60] model to accomplish this:
where A is an empirical constant (0.1 for the fluid threshold), ρ is fluid density (1.22 kgm−3), and is sand grain size.
Kindle [61] published the second-oldest data set we could find a pair of field observations of ripple migration of about 0.03 with a gentle breeze, and about 0.17 with a wind speed of about 6 . Presumably, the gentle breeze was much slower than 6 given the reduced migration rate. In place of this qualitative term, we used 4.4 based on an approximation from the Beaufort wind scale. No grain size data were provided. Instead, he stated that “My observations with reference to the slight variation in the amplitude of sand ripple-mark within the limits of an area of the same degree of fineness of sand grains coincide with those of W. W. Strickland” ([61] p. 10). Strickland [62] did not report a specific grain size, making reference only to “fine sand.” We therefore used 0.19 mm, the average size for fine sand grains according to the Wentworth [63] scale. Both of the migration rates were anomalously fast for the wind speeds (compared to other studies) unless, for example, the wind speeds were measured quite near the surface and our shear velocity estimates are greatly erroneous. There is no evidence of this, so we once again assumed that wind speeds were measured at 1.2 m above the surface and converted his data as described above.
Sharp [26], in a classic study, reported 18 measurements of ripple migration rates and wind speeds for ripples that averaged 0.10 m in length with a grain size of about 0.33 mm. We obtained that data by digitizing his Figure 9 ([26] p. 631) using Origin® Pro 2015 (Originlab Corporation, Northampton, MA, USA). This was the earliest comprehensive field data set we could find and it included a range of wind speeds from 7.1 to 17.9 ms−1, which we converted to shear velocities and threshold shear velocities using Equations (2)–(4).
Stone and Summers [64] reported one incidental field observation of ripple motion with a measured wind speed. They found 0.1 m ripples in 0.26-mm sand moving at about 0.06 mms−1 in winds of about 9 ms−1. They did not report the wind measurement height, so we again assumed that it was at 1.2 m above the sand surface and used this value for our assessments.
Borsy [65] published the first detailed wind tunnel study focused on ripple migration and wind speed. The lengths of the ripples in the experiments ranged from about 0.07 to 0.28 m, in 0.18-mm sand. We digitized the data presented in his Figure 3 ([65] p. 112) and obtained ten measurements that we used for conversions to shear velocity and threshold shear velocity, as described above.
Seppälä and Lindé [28] conducted wind tunnel experiments to study ripple formation. Ripple migration information was presented, but it was not the focus of their work. They reported a range of migration speeds that occurred at one wind speed (4.3 ms−1 measured at 0.10 m height) associated with ripples approaching equilibrium. For this study we used the averaged migration rate data (0.03 mms−1) from the longest duration (30 min) to represent conditions closest to equilibrium. Mean grain size in this study was 0.15 mm.
Ling et al. [66] used high precision (±0.5 mm) photogrammetry to measure ripple movement in their wind tunnel. We obtained six data points by digitizing their Figure 1. The mean grain size was estimated as 0.18 mm based on information presented in a related study [67]. The mean ripple wavelengths and heights were 0.07–0.14 m and 3.3–7.2 mm, respectively. The ripple migration rates reported are anomalously slow relative to the other wind tunnel data. This has been treated as a result of an order of magnitude error in the ordinate label for Figure 1 [38], and we made a similar assumption based on comparing the data in the figure with the range of migration rates reported in the text. Ling et al. [66] did not report the measurement height for wind speed, but for the shear velocity conversions, we specified the elevation as 0.5 m based on information from Cheng (personal communication, April 2019).
Andreotti et al. [68] conducted experiments on ripple development and migration in a wind tunnel and in the field. We digitized the data for equilibrium ripple movement from their Figure 5c (11 wind tunnel measurements and 75 field measurements). Mean grain size in the wind tunnel was 0.12 mm and 0.18 mm for the field site. They reported that the threshold shear velocity was about 0.22 ms−1 in both environments. This is a well-constrained data set and the authors were the first, that we are aware of, to recognize a systematic bias in ripple response between wind tunnel and field experiments, although they did not develop arguments describing why this occurs. For a given shear velocity, they found that wind tunnel ripples typically migrate at rates 3 or more times faster than their natural counterparts. Their wind tunnel data were used by Durán et al. [29] in the development of a simulation model, discussed below.
Zhu [69] measured ripple motion in a wind tunnel and in the field. Wind speeds were reported as 30-s averages measured with a hand-held anemometer at a 1-m elevation. He used an empirical model based on wind tunnel experiments to convert wind speed to shear velocity. The mean grain size in the field experiments was 0.31 mm and there was no report for the grain size for wind tunnel study. We digitalized data from his Figure 2.5b to obtain nine field observations and nine wind tunnel observations.
Cheng et al. [38] performed a set of wind tunnel experiments with 0.15 mm sands that included measuring equilibrium ripple migration rates at four different shear velocities. Relevant to this study, they found that equilibrium ripple length increased linearly with shear velocity and the ripple migration rate increased exponentially with shear velocity. They reported four migration speeds and shear velocities for equilibrium ripples developed in 0.15-mm sand.
3. Study Sites and Field Methods
One set of field experiments was carried out in late October, 2008, near the village of Jericoacoara, Ceará, Brazil (2.7968° S, 40.4847° W). We were located near the downwind end of a 40-m wide deflated parabolic dune trough (AKA Cow Splat Flat, cf. [70,71]) with a near horizontal unobstructed fetch of approximately 100 m. During the experiments, winds were out of the ENE at speeds of about 8–12 ms−1 and blowing parallel with the long axis of the trough. The sands were dry and unconsolidated, with grain sizes averaging about 0.3 mm. The equilibrium ripple lengths were about 90–110 mm, and the heights were about 6–8 mm. More information about this field site can be found in [72] or [73].
As shown in Figure 1, wind speeds were measured with an R.M. Young Model 8100 ultrasonic anemometer. Depending on the particular deployment, the sampling volume was centered at an elevation of either 0.50 or 0.75 m above the surface, depending on the sample run, but within the constant stress layer in either instance, with data recorded at 64 Hz. Ripple movement was documented using time series oblique photography that was scaled to sets of pins installed at known distances parallel to the wind (thus perpendicular to ripple crests). An anemometer was located either 2 or 3 m away from and behind one of these pin configurations to minimize the disruption of ripples. Cameras were mounted to a tripod or steel pipe, depending on location, and triggered manually at recorded intervals (typically of about one minute). The ripple heights were measured with a straight edge and ruler and average wavelength was determined by counting the number of ripples (including partial ripples) between pins. Vertical arrays of hose-type sand traps [74,75] were used to measure the transport rates and to obtain samples for size analysis.
A second set of experiments was performed in May–June 2015 at Oceano, California, U.S.A. (35.0287° N, 120.6277° W). The Oceano site is located on a gently sloped sand patch approximately 300 m downwind of coastal foredunes and 650 m from the shoreline. Sand transport at the site was driven predominantly by a westerly sea breeze across a surface of dry, medium sand (median diameter, d50 = 0.40 mm). The equilibrium ripple wavelengths were about 0.1 m and the heights averaged about 8 mm. The field site and sediment characteristics are further described in [76].
As shown in Figure 2, near-surface wind speeds at Oceano were measured at 50 Hz by a Campbell CSAT3 sonic anemometer mounted at 0.64 m above the bed surface. Shear velocities were determined through application of the Reynolds stress method over successive 30-min intervals [77]. High-frequency (25 Hz) saltation fluxes over corresponding 30-min intervals were measured by an array of Wenglor laser particle counters roughly co-located with the sonic anemometer at heights ranging from 0.06 to 0.47 m above the bed surface, and calibrated to saltation fluxes measured by an array of nearby Big Spring Number Eight saltation traps [76,78]. Methods for obtaining shear velocity and saltation flux values are detailed in [76,77], and the accompanying data are publicly accessible [79]. The threshold shear velocities were previously calculated over multi-day intervals [80] through application of the time-frequency equivalence method [81]. These threshold values, along with corresponding median surface grain diameters (which remained mostly constant over each multi-day interval), are shown in Table 2 of [80]. A pair of laser distance sensors (Sick DT35), spaced 60 mm apart in the streamwise direction and co-located with the wind and saltation measurements, were pointed downward toward the surface to measure changes in bed elevation and associated ripple migration through time. The bed elevations measured by the distance sensors were recorded on a Campbell CR1000 datalogger at 1 Hz.
4. Data Analysis
The Jericoacoara field experiments provided usable ripple migration, ripple geometry, sand transport, and wind data obtained from four days of experiments (10/21, 10/22, 10/24, 10/26). The three-dimensional flow data from the anemometers were used to derive estimates of shear velocity. The calibrated wind data were digitally oriented using a three step rotation [82] to obtain instantaneous u, v, and w winds and these were used to solve the Reynolds stress equation to estimate u*. Sand captured in the traps was weighed and the data converted to total transport rate q in gm−1s−1 based on the trap size and sample duration. The sand samples were returned to the laboratory for ¼ phi dry sieving and the derivation of grain-size statistics using GRADISTAT [83].
Ripple migration rates were estimated using the photograph time series and ArcMap 10.4 software. On 21, 22 and 24 October, the distance between pairs of pins (0.40 m) was used to establish the scale in the images for measurement (Figure 1). The location of the ripple crest that was the nearest downwind neighbor of the upwind pin was digitally referenced to that pin. The same ripple crest was identified and registered in subsequent photos to provide a distance traveled and this was converted to a migration rate using the time elapsed between images. The scaled images were also used to obtain estimates of ripple wavelength based on the number of ripples between the pins. Care was taken to select ripples that appeared to be of equilibrium form, i.e., they were not at or near defects caused by bifurcation or coalescence. On October 26, the pin array was in a square configuration (0.80 × 0.80 m) with pins, and the ripples within the array were intentionally disturbed (Figure 1). In this case, ArcMap was used to extend a pair of lines using pairs of wind-perpendicular pins from the four-pin array for orientation. Those lines were extended toward the background of the images until they reached undisturbed ripples. The ends of those lines were used as virtual pin locations and measurements were made as described above. We checked these measurements for accuracies using cross-correlation in Matlab (described in Appendix A), also with good results.
The sample frequencies and durations of the photograph and wind speed time series were different and we needed to determine appropriate averaging intervals for a statistical analysis of cause and effect because there was substantial variability in wind conditions and ripple migration rates during the data acquisition runs. After testing (see Appendix A and Figure A1) we found the optimal averaging interval to be eight minutes. The sample design for grain sizes and transport rates did not, however, produce a unique sample for each of the eight-minute averaging intervals. We used time-weighted linear interpolation to obtain the best estimates for each interval. When an interval occurred before the first or after the last sample in a series, we used time-weighted, linear extrapolation for estimation.
At the Oceano Dunes site, ripple migration rates, were calculated by tracking the propagation of ripple crests and troughs under the distance sensors and using the elapsed times from the time series of bed elevation, generated by the upwind-downwind pair of distance sensors. Ripple amplitudes were calculated from elevation differences between adjacent ripple crests and troughs. Because of superimposed high-frequency noise and low-frequency drift in the measured elevations, pre-processing was applied to the raw bed elevation time series to extract only the part of the time series that represented ripple migration. Values for and were calculated from the processed time series. The pre-processing and processing steps, which were adapted from [84], are described in Appendix B. We note that only a subset of the measurement times during which appreciable ripple migration was apparent were included in this analysis, and that noise in the bed elevation time series caused some uncertainties in 30-min values for and (uncertainty values are provided in the spreadsheet accessible online via the Zenodo data repository [58].
5. Results
During the 2008 experiments at Jericoacoara, wind speeds were measured for 92 min on 21 October, 80 min on 22 October, 116 min on 24 October, and 48 min on 26 October. Data acquisition issues on the 22nd and 24th caused those records to be discontinuous, with runs of 20 and 18 min on the 22nd and 21, 22, 24, and 9 min on the 24th. Photos were taken with an average temporal frequency of one minute or less: 98 images for the 21st, 71 on the 22nd, 167 for the 24th, and 114 on the 26th. From these records, we were able to extract 26 sample records of 8-min intervals each.
At Oceano Dunes, we computed 30-min ripple migration speeds and ripple fluxes to correspond with previously obtained concurrent 30-min shear velocity and saltation flux measurements [79]. Since the timing of individual migration speeds and amplitude measurements was sporadic (i.e., associated with identification of individual crests and troughs, as described in “Data Analysis”), we binned together all and values in each 30-min interval to obtain a mean and for the interval. In the subsequent figures, the values shown are 30-min averages. To compute ripple transport rates for successive 30-min intervals, we applied Equation (1) to the corresponding 30-min and values.
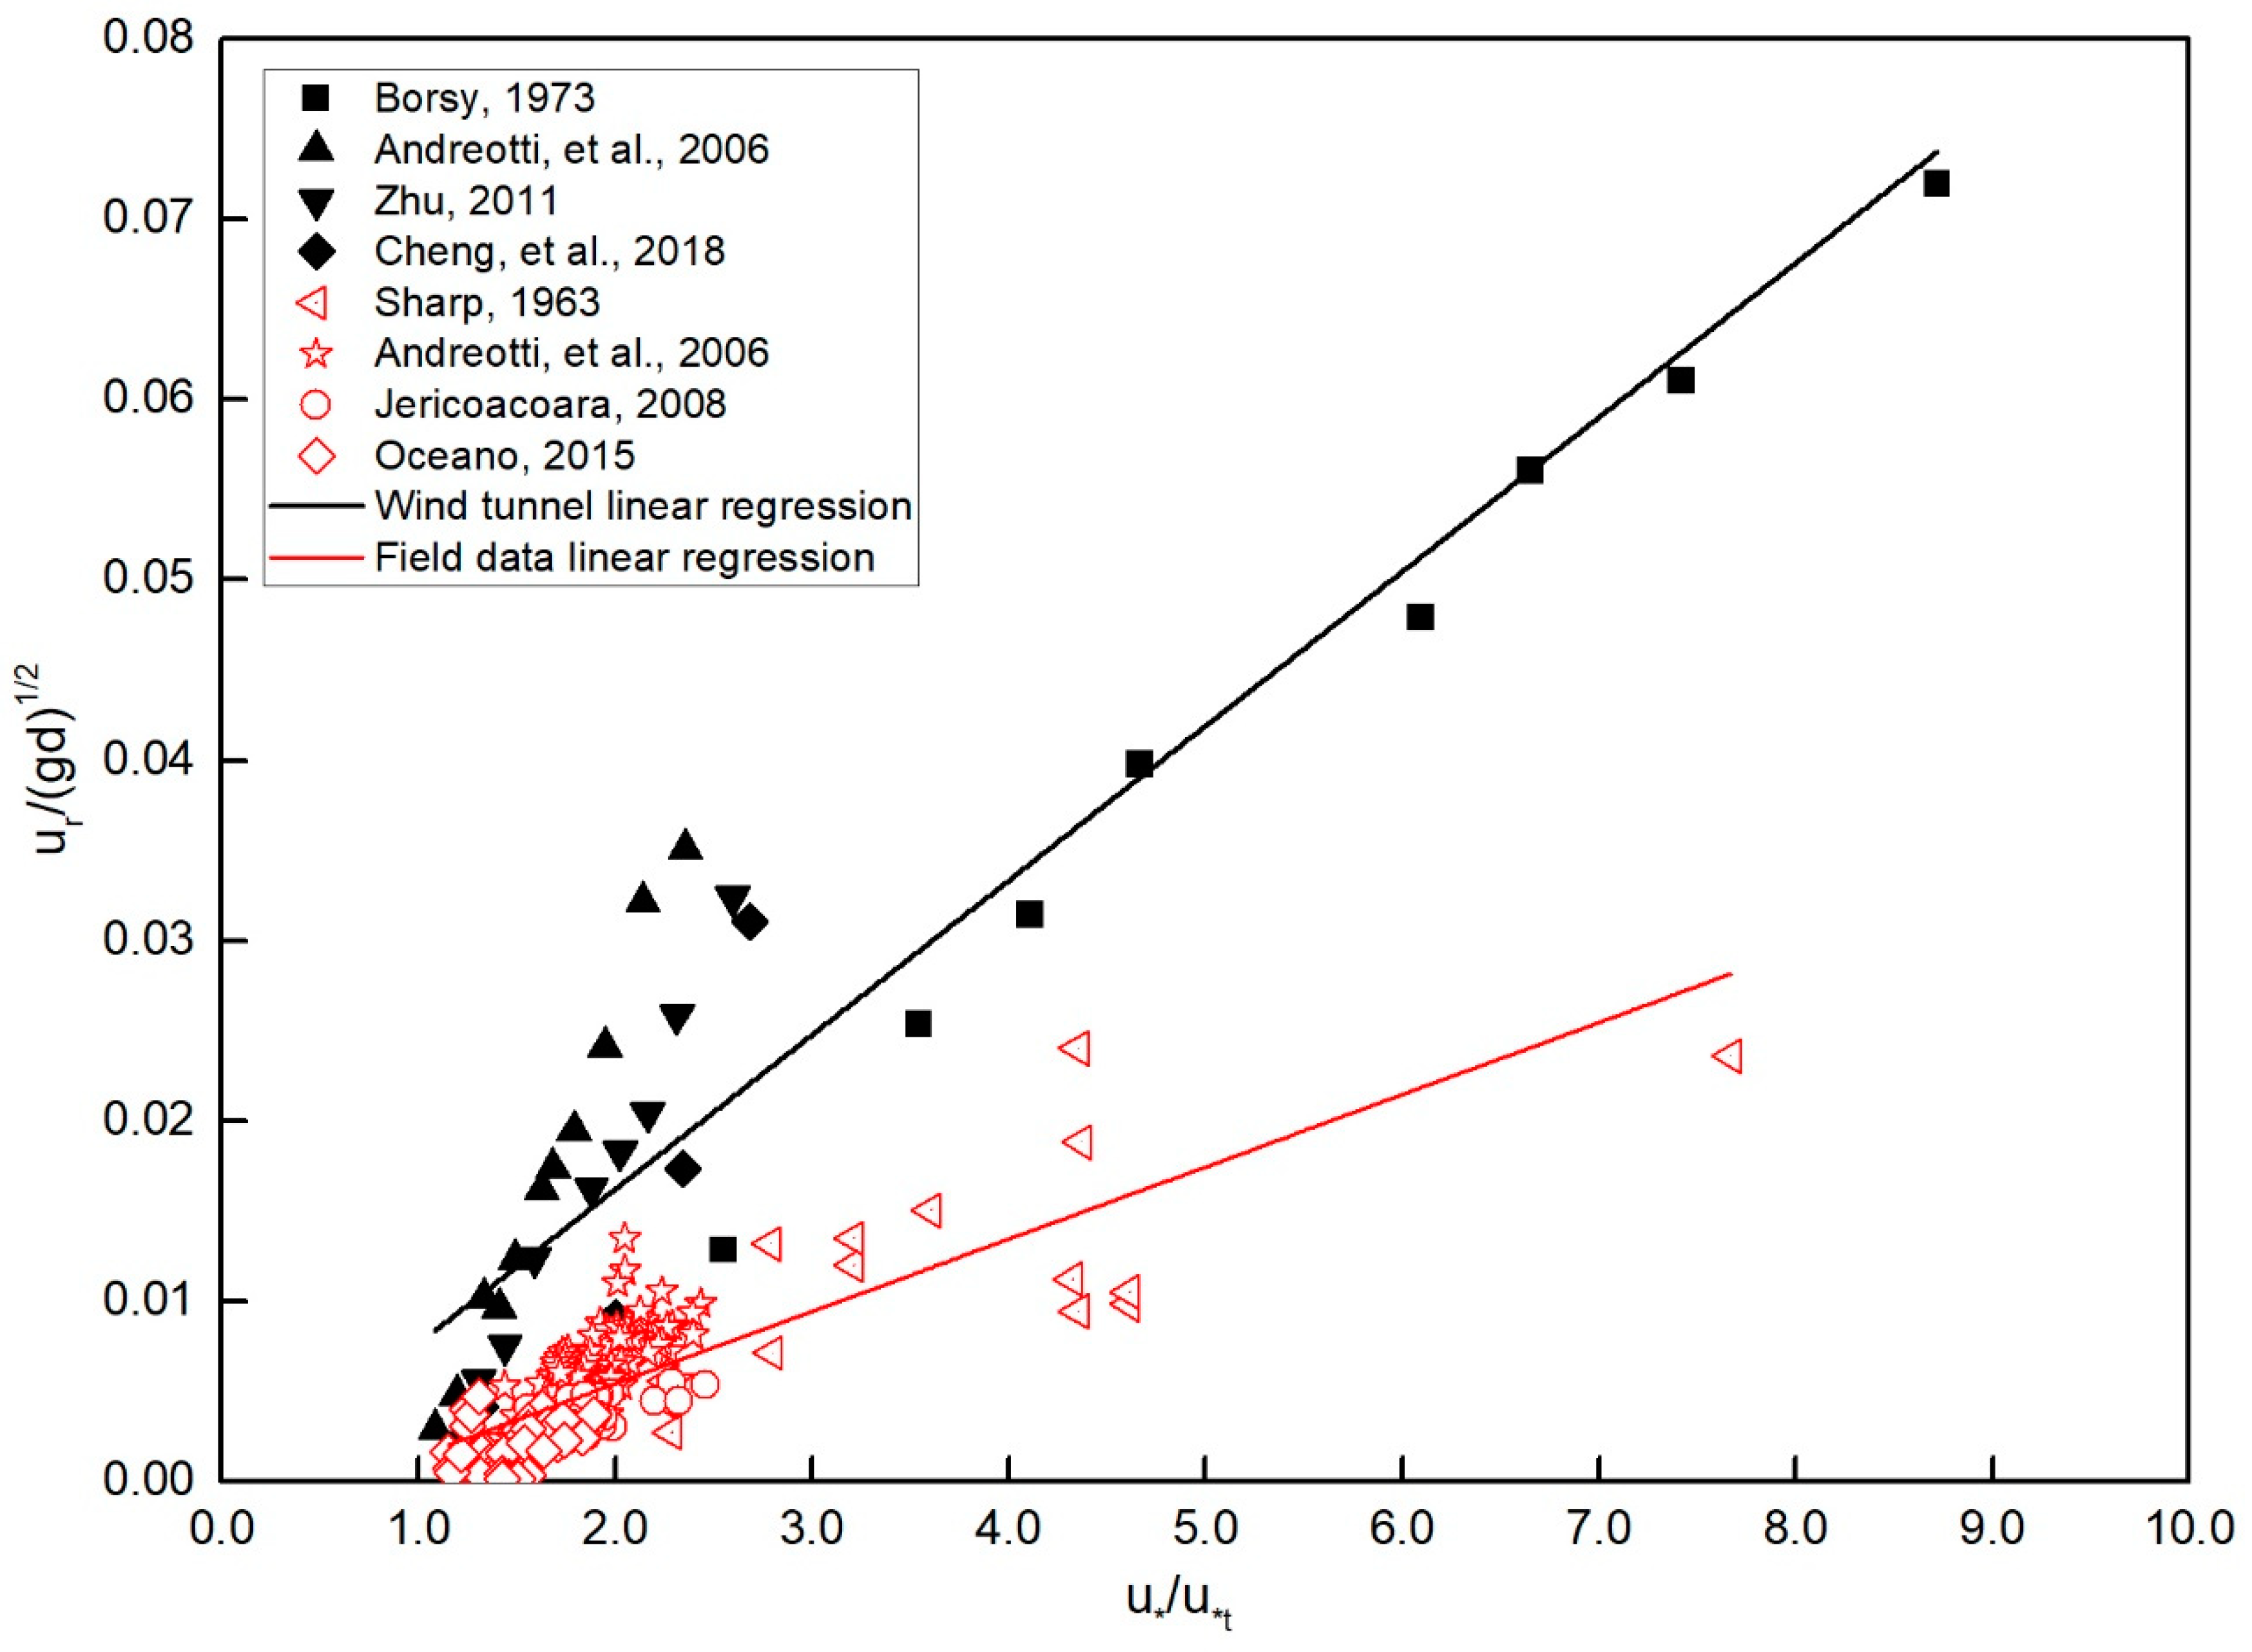
In Figure 3, we plotted all of the data for migration rates of equilibrium ripples and coincident shear velocities that we could find from the literature and from our field experiments, without any application of quality control criteria. The 215 observations are represented in dimensionless form as u*/u*t and ur/(gd)1/2 and are segregated into wind tunnel and field measurements following precedent [68]. Linear regression analysis was used to test for statistically significant relationships. We found a wind tunnel relationship where , with , 2 and . For the field data, the model was , with 4, 2 and . We calculated 99.9% confidence limits for the two regression slopes, finding 0.0030 and 0.0049 for the field data, and 0.0069 and 0.011 for the wind tunnel data. Because the confidence bands do not overlap, these results support a conclusion that field conditions were not replicated at a one-to-one scale in the wind tunnels and the samples that we compared were not drawn from the same general population. We also performed a number of non-linear regression analyses to determine if there was an alternative distribution that improved the statistical strength of both models. The only improvement in the coefficients of determination was when logging u*/ut. For the wind tunnel data, R2 = 0.85, and for the field data, R2 = 0.57.
Our next step was to re-evaluate the wind tunnel and field relationship (Figure 3) using only data that fit a set of necessary quality control criteria, which included reliable data for sand gain size or threshold shear velocity, for equilibrium ripple migration-rates and geometry, and for shear velocity or wind speed data that could be reasonable converted to shear velocity. The majority of the exclusions occurred because of a lack of reporting of the wind speed measurement. For the wind tunnel experiments, six points from Ling et al.’s [66] wind tunnel studies were removed because wind speed elevations were not reported. A second reason was that there was an order-of-magnitude error based on their Figure 1 ([47] p. 120) and description. We also removed the one data point of Seppälä and Lindé [28] because it was an estimation of an unstable ripple migration rate. For the field experiments, we removed Cornish’s [15] and Stone and Summers’s [64] data because they did not report the wind speed elevation. We also removed Kindle’s [61] data because he did not report measurement height or grain size and he used ambiguous language to report wind speeds. Finally, we removed Zhu’s [69] field data points because of what we consider to be a methodological error. Specifically, Zhu [69] measured wind speeds at one elevation and used an empirical model developed from his wind tunnel studies to estimate a roughness length term and then convert wind speeds to shear velocities. This approach produces the same roughness length for all wind tunnel and field studies. It is well known, however, that the apparent roughness length increases with sand transport and at rates that are different in the wind tunnel and field environments [59,85]. One consequence of his assumptions was the near-parallel slopes of his wind tunnel and field data sets. Since he did not report his original data, we could not reconstruct better estimates of shear velocity, but we did include his wind tunnel data.
Figure 4 presents the quality-controlled data and the regression results for the wind tunnel and field experiments. For the quality wind tunnel data, we obtained a model where with n = 34, R2 = 0.86 and P < 0.0001. These results, other than the offset, are essentially unchanged from the previous analysis. For the field data, the new model was with n = 161, R2 = 0.63 and P < 0.0001, only modestly different. The 99.9% confidence limits for the regression slopes were 0.0064 and 0.0108 for the wind tunnel data and 0.0032 and 0.0048 for the field data. These uncertainty estimates are also similar to the estimates based on all data. We also performed regression analysis using just the new (Jericoacoara and Oceano) field data and obtained with n = 68, R2 = 0.44 and P < 0.0001, suggesting that our data conformed to the relationship indicated by Sharp’s observations; i.e., the slope of the relationship was almost the same with all data and with just the Jericoacoara and Oceano data. As mentioned above, we performed non-linear regression analyses to determine if there was an alternative distribution that improved the statistical strength of both models for all quality-controlled data. Logging u*/u*t produced the only improvement for both data sets, increasing the coefficients of determination to 0.87 for the wind tunnel data and 0.68 for the field data.
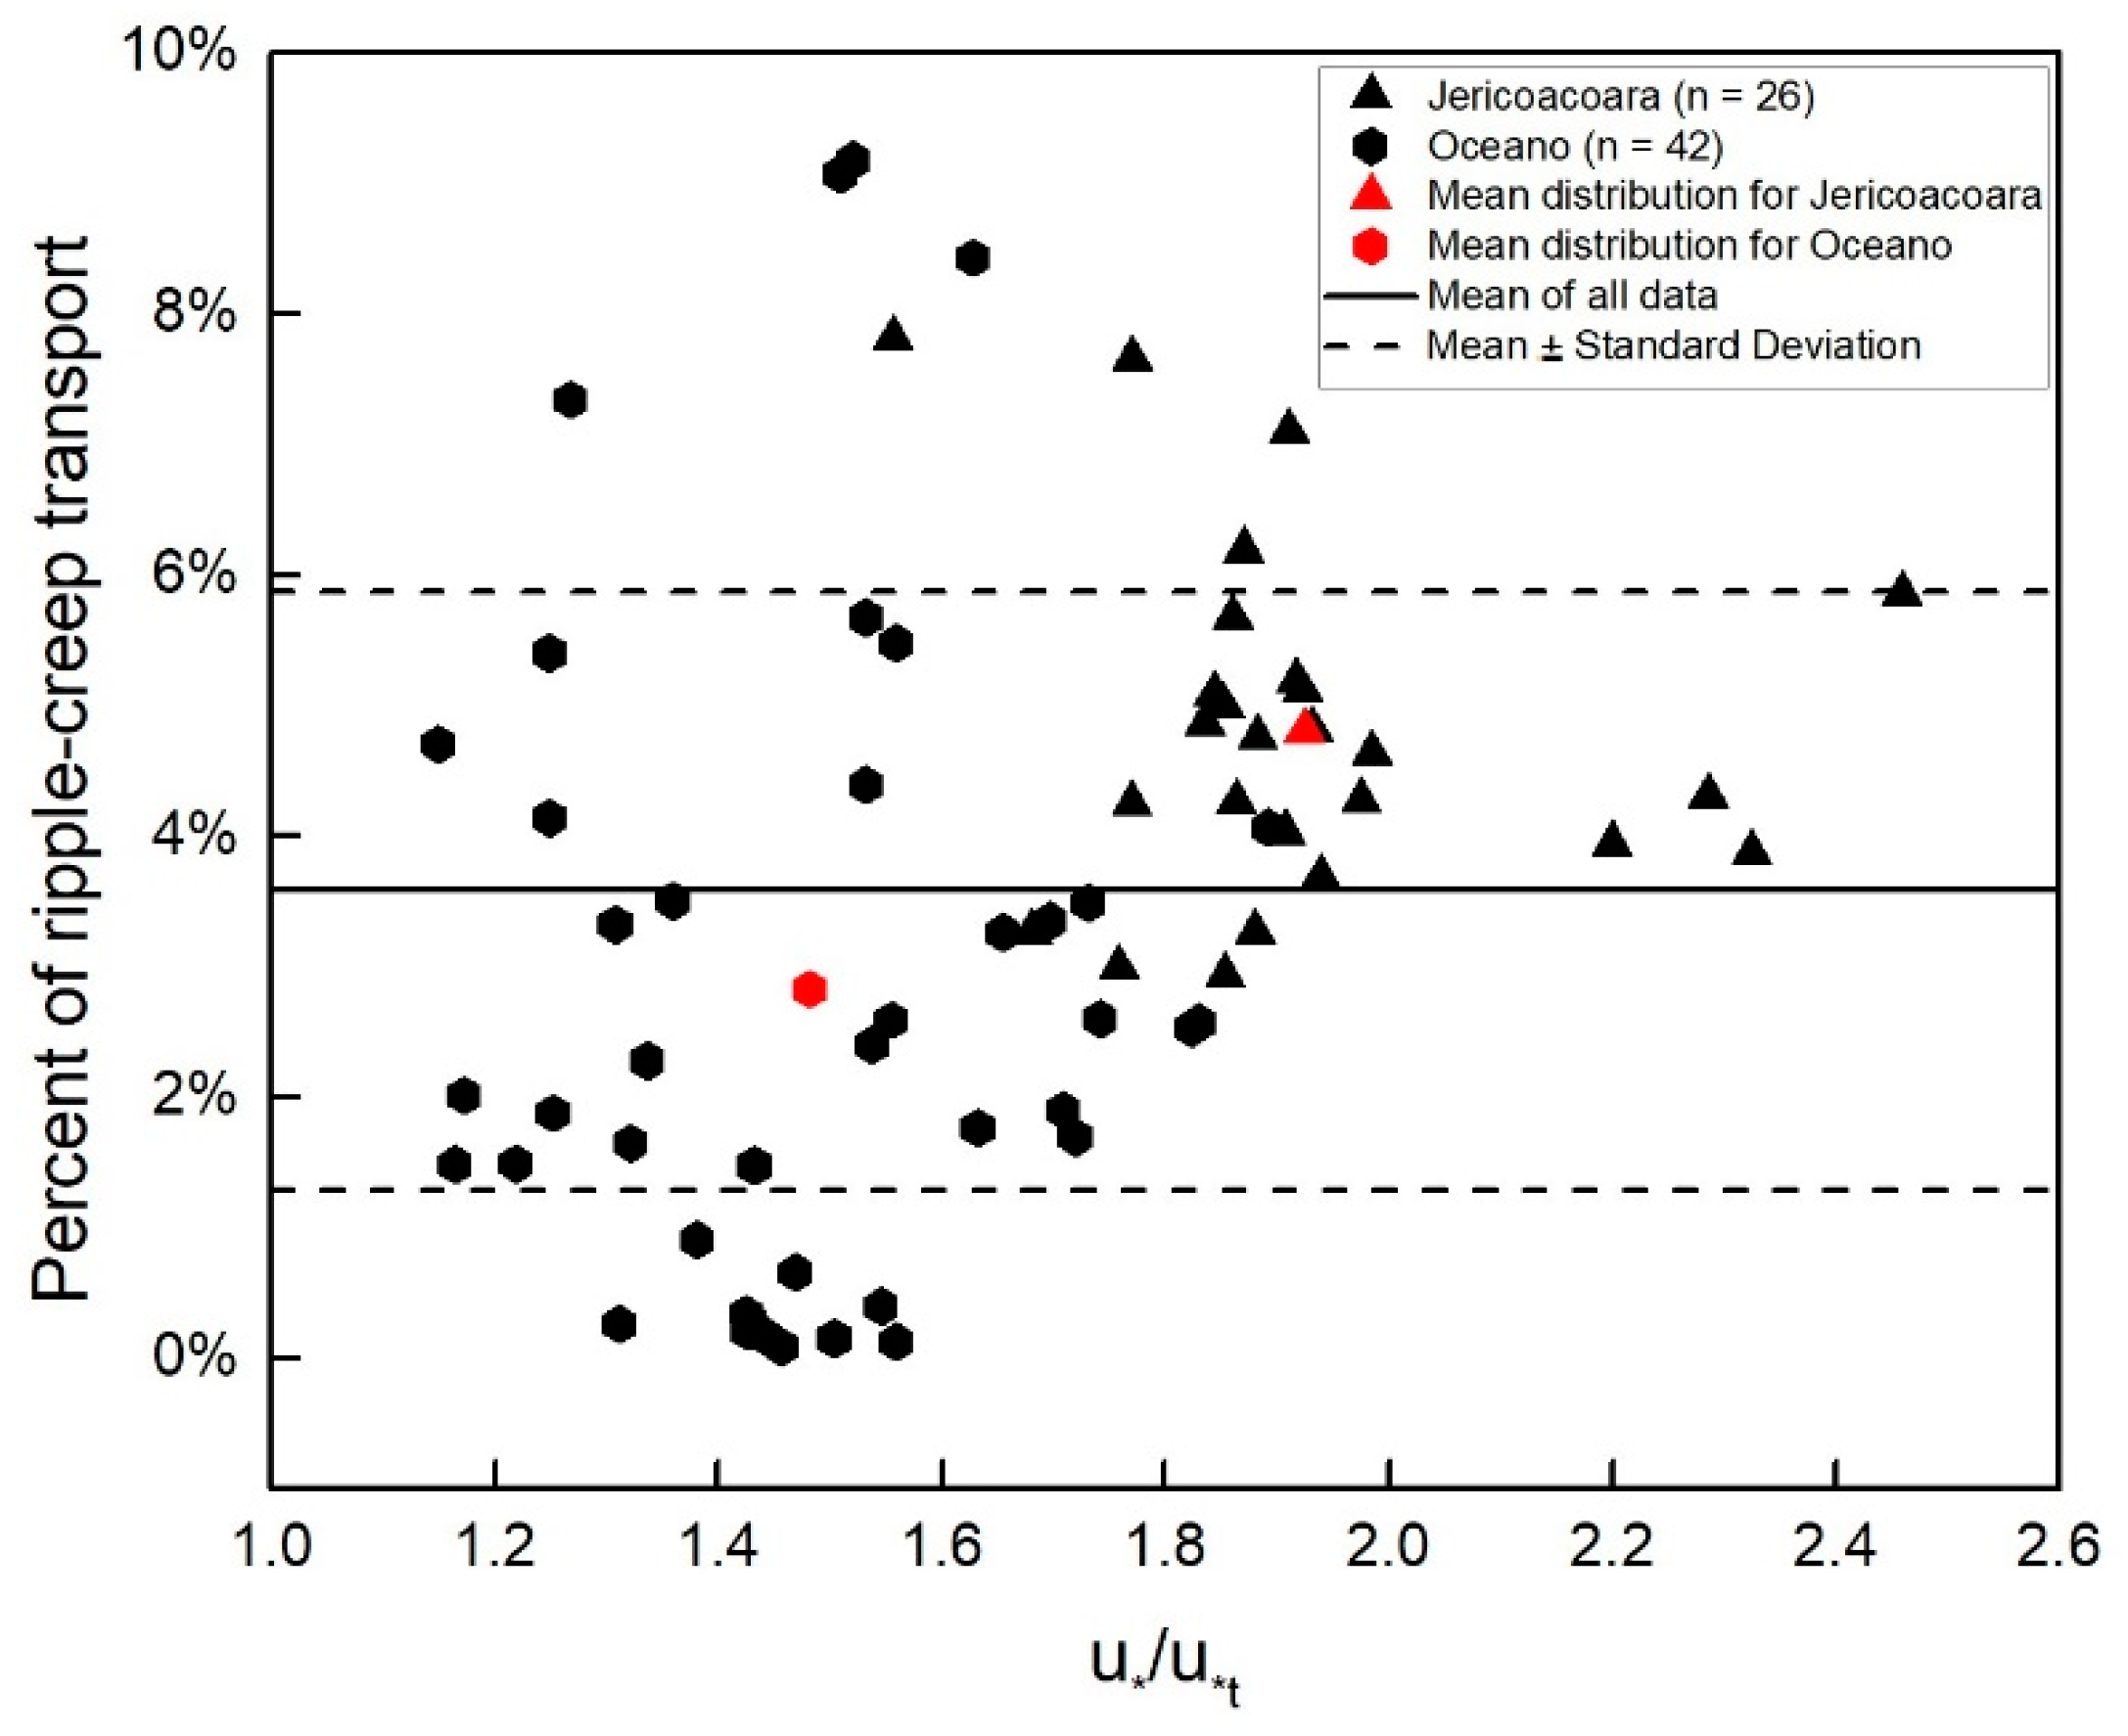
We calculated the contribution of sand transport via ripple movement to total transport in our field studies using ripple migration and geometry data with Equation (1) and transport rate data from the sand traps and particle counters. We assumed P = 0.40 based on the data presented in Louge et al. ([53], Figure 3). For all cases, the proportion, , ranged from about 0% to 10%, with a mean of 3.6% and standard deviation of 2.3%. There were differences between the two field sites, with mean and standard deviation of 4.8% and 1.3% at Jericoacoara and 2.8% and 2.4% at Oceano. We used a Welch’s two-tailed t-test to evaluate the likelihood that the Jericoacoara and Oceano and u*/ut data were drawn from the same population and the probability in both cases was found to be less than 0.0001. It is not known if the differences can be ascribed to the different methods used at the two field sites, differences in grain sizes, some combination of the above, or other unknown factors. We plotted % transport against dimensionless shear velocity (Figure 5). Regression analysis suggests a weak positive relationship ( = 0.025 u*/u*t - 0.006; R2 = 0.10, p < 0.01), although the basic linear regression requirement of homoscedasticity was violated by our data set, bringing the finding into question. That there is a trend is supported, however, by the differences in means of the two data sets.
6. Discussion
The results lead us to three main points for discussion, and many questions regarding the controls on aeolian ripple migration and related sand transport rates remain unanswered. First, our data confirm the scaling differences between wind tunnel and field data [68]. The phenomenon of such scaling differences has been recognized and described for several aeolian transport systems, but without a unifying process explanation or a corresponding correction factor. Ideally, rigorous scientific experimentation in aeolian studies needs to be controllable, repeatable and reproducible. These criteria remain elusive senso stricto in field experiments. Therefore, wind tunnels have been indispensable to explore and elucidate some of the fundamental wind/surface interactions, as researchers can control some or all of the environmental variables to reduce the complexity and uncertainty (e.g., nonstationarity effects such as those reported in [86,87]) in refining our understanding of flux relationships. There are, however, critical scaling constraints on the replication of physical processes in wind tunnels. Increasing efforts have been directed at probing and modeling the dynamics of the boundary layer in wind tunnels [88,89,90,91,92,93,94]. Equivalent attention has not been paid to scaling constraints associated with sand transport, saltation, and ripple dynamics. The empirical relationships established in wind tunnel experiments are typically substantially different from those found in the field, even though they are based on similar analytical or theoretical treatment. One consequence is the inconsistent prediction of key relationships and the failure of laboratory-based models to replicate conditions found in nature. Indeed, close inspection of Figure 4 reveals that the observations from the four wind tunnel experiments trace out slopes that are at least slightly different from one another.
It has been proposed [8] that the ripple wavelengths reported in Andreotti et al. [68] were observed in a wind tunnel that was one half of the length needed to attain equilibrium between the wind and saltation flux, implying that the reported migration rates would be faster than an equilibrium rate for a given shear velocity. Martin and Kok [77] noted that results reported in past wind tunnel studies observing grain speeds [95] and saltation heights [96,97] were likely impacted by using erodible sand beds of insufficient length in the wind tunnels [98,99]. Liu et al. [100] used CFD to confirm that several flow characteristics near obstacles (e.g., windbreak fences) cannot be captured in a reduced-scale wind tunnel or numerical models and thus, results should not be extrapolated directly to natural landscapes. Sherman and Farrell [59] and Farrell [101] formalized an approach to partly test these scaling differences by evaluating two fundamental interactions between wind and sand: the apparent enhancement of the boundary roughness length associated with the presence of a saltation layer and the vertical distribution of mass flux. They found that the saltation layer roughness form was about an order of magnitude higher in the field than in wind tunnels and that small wind tunnels had statistically significant faster decay rates of mass flux with elevation above the bed. The differences are magnified in wind tunnels with small working cross section areas and in wind tunnel experiments that use extreme environmental conditions, e.g., hurricane wind speeds [101]. McKenna Neuman and Maljaars [102] also surmised that these differences between saltation dynamics in wind tunnel and field experiments may have scaled with wind tunnel dimensions, but because this facet of wind tunnel modeling has received little attention [38], substantive differences will continue to occur in reported findings. These scaling differences in boundary layer–surface interactions may provide the key to understanding some of the inconsistencies of saltation models [77] and ripple dynamics reported in field and wind tunnels. For example, Durán et al. [29] used the Andreotti et al. [68] wind tunnel data for derivation of their numerical model for ripple development and migration based on the relationship:
We used our results to obtain constants of proportionality for this relationship. For wind tunnel data, we found (R2 = 0.94); for field data, the relationship was substantially different, (R2 = 0.70). We also used regression forced through the origin (i.e., forcing at ) to represent the constraint that ripple migration should cease when the threshold of motion is not exceeded, and found that the relationship for wind tunnel observations was (R2 = 0.90); for field data (R2 = 0.66). In each instance, the laboratory and field relationships were statistically distinct. Our findings here, coupled with those of Andreotti et al. [68] demonstrate once again the scaling dichotomy and reemphasize the importance of using field data for the derivation of models. We found that wind tunnel data indicated ripple migration rates that were about two to three times faster than field equivalents. Because of the relatively constant scaling of ripple-migration creep transport with total transport, this also indicates that wind tunnel data predict sand transport rates that are two to three times greater than those produced by comparable conditions in nature, at least over the range of u*/ut from about 1 to 2.5. Scaling issues such as these may be especially important when using wind tunnel data to predict aeolian transport on extra-terrestrial surfaces, an approach that we recognize as substantially flawed.
A second issue concerns the proportion of ripple transport compared to total transport. It has been suggested that transport by ripple migration can be considered synonymous with creep transport [48,50]. Our field observations confirm that some individual grains move as reptation across ripples surfaces faster than ripples migrate, although the proportion that does so is not known and may be quite small; but certainly qr ≤ qc. The literature reports substantial variability in . Bagnold [56,57], in wind tunnel and field experiments, and Willetts and Rice [7], in wind tunnel experiments, among others, found that creep comprised about 25% of total transport. From field data, Chepil [103] reported as 15.7% for fine dune sand. In wind tunnel experiments, Horikawa and Shen [104] found 20%, and they cited the results of Ishihara and Iwagaki [105] who found a range from 6.5 to 16.6% in field experiments. From their wind tunnel data, Dong et al. [106] estimated the creep transport fraction to range from about 4% to 29%, depending on grain size, and averaging 9%. In field studies, Nickling [107] found to be about 1.3%–3.6%, averaging 2.3%, and Kang et al. [108] indicated that the proportion of creep transport was about 4%–11%. Wang and Zheng [54] modeled creep flux and their results indicated creep fractions usually in the range of 2% to 14%. The wind tunnel research of Cheng et al. [55] indicated that decreased as shear velocity increased, falling from 57% at u* = 0.26 ms−1 to 19% at u* = 0.56 ms−1. In studies of ripple migration and creep (reptation) transport on Mars, Bridges et al. [50] estimated at 25%. Yizhaq et al. [109] used the transport rate model of Kok and Renno [110] to estimate at Eagle Crater on Mars, with a result that the proportion should rise from about 3% to 7% over approximately the range of u*/u*t covered in this study. It has been indicated, however, that this scaling relationship has been found to be highly variable on Mars, ranging from 5% to 91% [111]. Our results compare favorably with those of other field studies on Earth, especially if we consider our to represent minimum estimates for . Our regression results, supported by our difference of means tests, indicate a weak positive relationship with u*/u*t explaining, statistically, 14% of the variability in when we combine data from our two field experiments. The slope of the regression line, if it is reliable, matches closely with the Yizhaq et al. [109] model results. More field observations are needed to validate or refute the relationship.
Two other issues associated with the use of Equation (1) might bear on estimations of . The first is the assumption that ripple morphology is sufficiently represented, volumetrically, by H/2. An error of 50% in this approximation still leaves our average field proportion in the range of about 1.8 to 5.4%. The second is the assumption that a ripple porosity of 0.40 is a correct attribute, rather than 0.35, for example. Note that this magnitude of error would still translate into a relatively small absolute error in . If, however, either ripple form, or porosity, or both, changed as a function of shear velocity, then such changes might influence a potential trend.
Our results confirm findings that ripple migration rates increase as a linear function of shear velocity [28,68] rather than at a second or third power. The near constant ratio implies that the total sand transport rate is also a near linear function of shear velocity. In the Oceano experiments, both ripple migration heights and rates were measured and variability in sand porosity and fluid and sediment densities were likely trivial in obtaining transport estimates using Equation (1). In the Jericoacoara analysis, a mean value was used for H, but individual measurements varied by maxima of about 20%, apparently randomly. This too would have introduced only a very small difference in estimates of , and more importantly, would not have produced a trend with shear velocity.
7. Conclusions
We compiled a quality-controlled ripple migration data base comprising, from previous studies, 34 sets of observations from four wind tunnel experiments and 93 sets from two field experiments. To these data, we added 68 sets of observations from our two field experiments. From our analyses of these data, we drew the following conclusions:
- There is a linear relationship between shear velocity and ripple migration rate. This is evidenced in the regression analyses performed with the dimensionless variable pairs u*/ut and ur/(gd)1/2, and for the dimensional variable pairs and .
- The dimensionless and dimensional migration rates from wind tunnel studies are statistically distinct from those found in field experiments. For a given shear velocity, ripple migration rates in wind tunnels are about two to three times faster than those found in the field.
- The proportion of total sand transport that can be attributed to ripple migration (creep) averages 3.6% in our field studies, comparable to findings in other field studies. We found evidence that increases weakly with shear velocity.
Andreotti et al. ([68] p. 028001-4) concluded their paper with the statement: Finally, ripples could be of practical interest for field experimentalist as a nonintrusive measurement of the reptation sand flux. This is a deceptively simple, but very important statement. The non-intrusive measurement of ripple geometry and movement has been demonstrated with several different methods reported in the literature and herein, and there are others, such as terrestrial laser scanning and structure from motion using Unmanned Aerial Vehicles (UAVs), for example. Improved migration rate data, especially with better time control, and with perhaps a better coincident representation of ripple volume than H/2, will improve the predictions made with Equation (1). If we are correct in our finding that was approximately constant, in an absolute sense, then this means that we can predict total sand transport rates based on simple ripple measurements. It is similarly important to link such ripple measurements with wind characteristics, such as shear velocity, and perhaps sediment characteristics. It is accepted that some physical mechanism must operate that couples the wind flow and topography, resulting in one-dimensional ripple bedforms that are locked in phase “with only small modulations in the direction transverse to the wind” [22] (p.60). If the empirical relationships reported in this paper are validated or improved upon, especially through additional quality field data, aeolian scientists and engineers will have another important tool for understanding sand transport. This also means that we can gain deep insight into aeolian processes and sedimentation in environments where process measurement may be difficult or impossible, such as those of extraterrestrial surfaces, but where in situ or remotely sensed ripple measurement data can be acquired.
Supplementary Materials
The following is available online at https://www.mdpi.com/2076-3263/9/9/389/s1, Table S1: all data described in the manuscript.
Author Contributions
Conceptualization: J.T.E., J.F.K., R.L.M., D.J.S.; Methodology: J.T.E., J.F.K., B.L., R.L.M., D.J.S., P.Z.; Validation: E.J.F., B.L., R.L.M., P.Z.; Formal Analysis: R.L.M., D.J.S., P.Z.; Investigation: J.T.E., E.J.F., J.F.K., B.L., R.L.M., D.J.S.; Resources: J.T.E., J.F.K., D.J.S.; Data Curation: D.J.S., P.Z.; Writing – Original Draft Preparation: E.J.F., R.L.M., D.J.S., P.Z.; Writing – Review & Editing: J.T.E., E.J.F., J.F.K., B.L., R.L.M., D.J.S., P.Z.; Funding Acquisition: J.T.E., J.F.K., R.L.M., D.J.S.
Funding
Work at Jericoacoara was supported by a U.S. National Science Foundation (NSF) grants #1063441 to JTE and #1061335 to DJS. Data analysis was partly supported by National Natural Science Foundation of China, grant number 41771006. Work at Oceano was supported by NSF Postdoctoral Fellowship EAR-1249918 to R.L.M. and NSF grant AGS-1358621 to J.F.K. Research was also sponsored by the Army Research Laboratory and was accomplished under grant number W911NF-15-1-0417.
Acknowledgments
This project is registered with the Brazilian Ministry of the Environment, Sistema de Autorização e Informação em Biodiversidade, Number 18038-1. The initial Oceano ripple analyses were executed by Kenyon Chow. The views and conclusions contained in this document are those of the authors and should not be interpreted as representing the official policies, either expressed or implied, of the Army Research Laboratory or the U.S. Government. The U.S. Government is authorized to reproduce and distribute reprints for Government purposes notwithstanding any copyright notation herein.
Conflicts of Interest
The authors declare no conflict of interest.
Appendix A. Assessing Ripple Measurement Accuracy and Optimal Averaging Intervals for Linking Ripple Migration Rates with Shear Velocity Estimates
We conducted cross correlation in Matlab to independently derive the ripple migration and length data to test the quality of our measurements. This Matlab routine measures data for all ripples between the designated pins and produces an average movement rate for all ripples rather than for a single ripple, as is calculated with the ArcMap procedure. The results of the two methods were almost identical for each set of measurements. The Matlab routine is easier and more efficient to use, but we found two issues that led us to work with ArcMap. First, ripple defects along the registration line, especially defects that either formed or disappeared during a time series, were measured as if they were equilibrium wave lengths and this biased the migration rate statistics. Second, when shadows appeared within the measurement range, their presence degraded the cross-correlation calculations between pairs of images and produced spurious statistics. These comparisons, however, indicated that our measurement techniques were accurate at millimeter-scale.
In the field experiments carried out at Jericoacoara, the sample frequencies and durations of the photograph and wind speed time series were different, and we needed to determine appropriate averaging intervals for a statistical analysis of cause and effect because there was substantial variability in wind conditions and ripple migration rates during the data acquisition runs. We could find no commonly accepted averaging interval in the literature, nor could we find a protocol for establishing an optimal interval for linking shear velocity with ripple migration, so we began with an exploratory analysis for the Jericoacoara data.
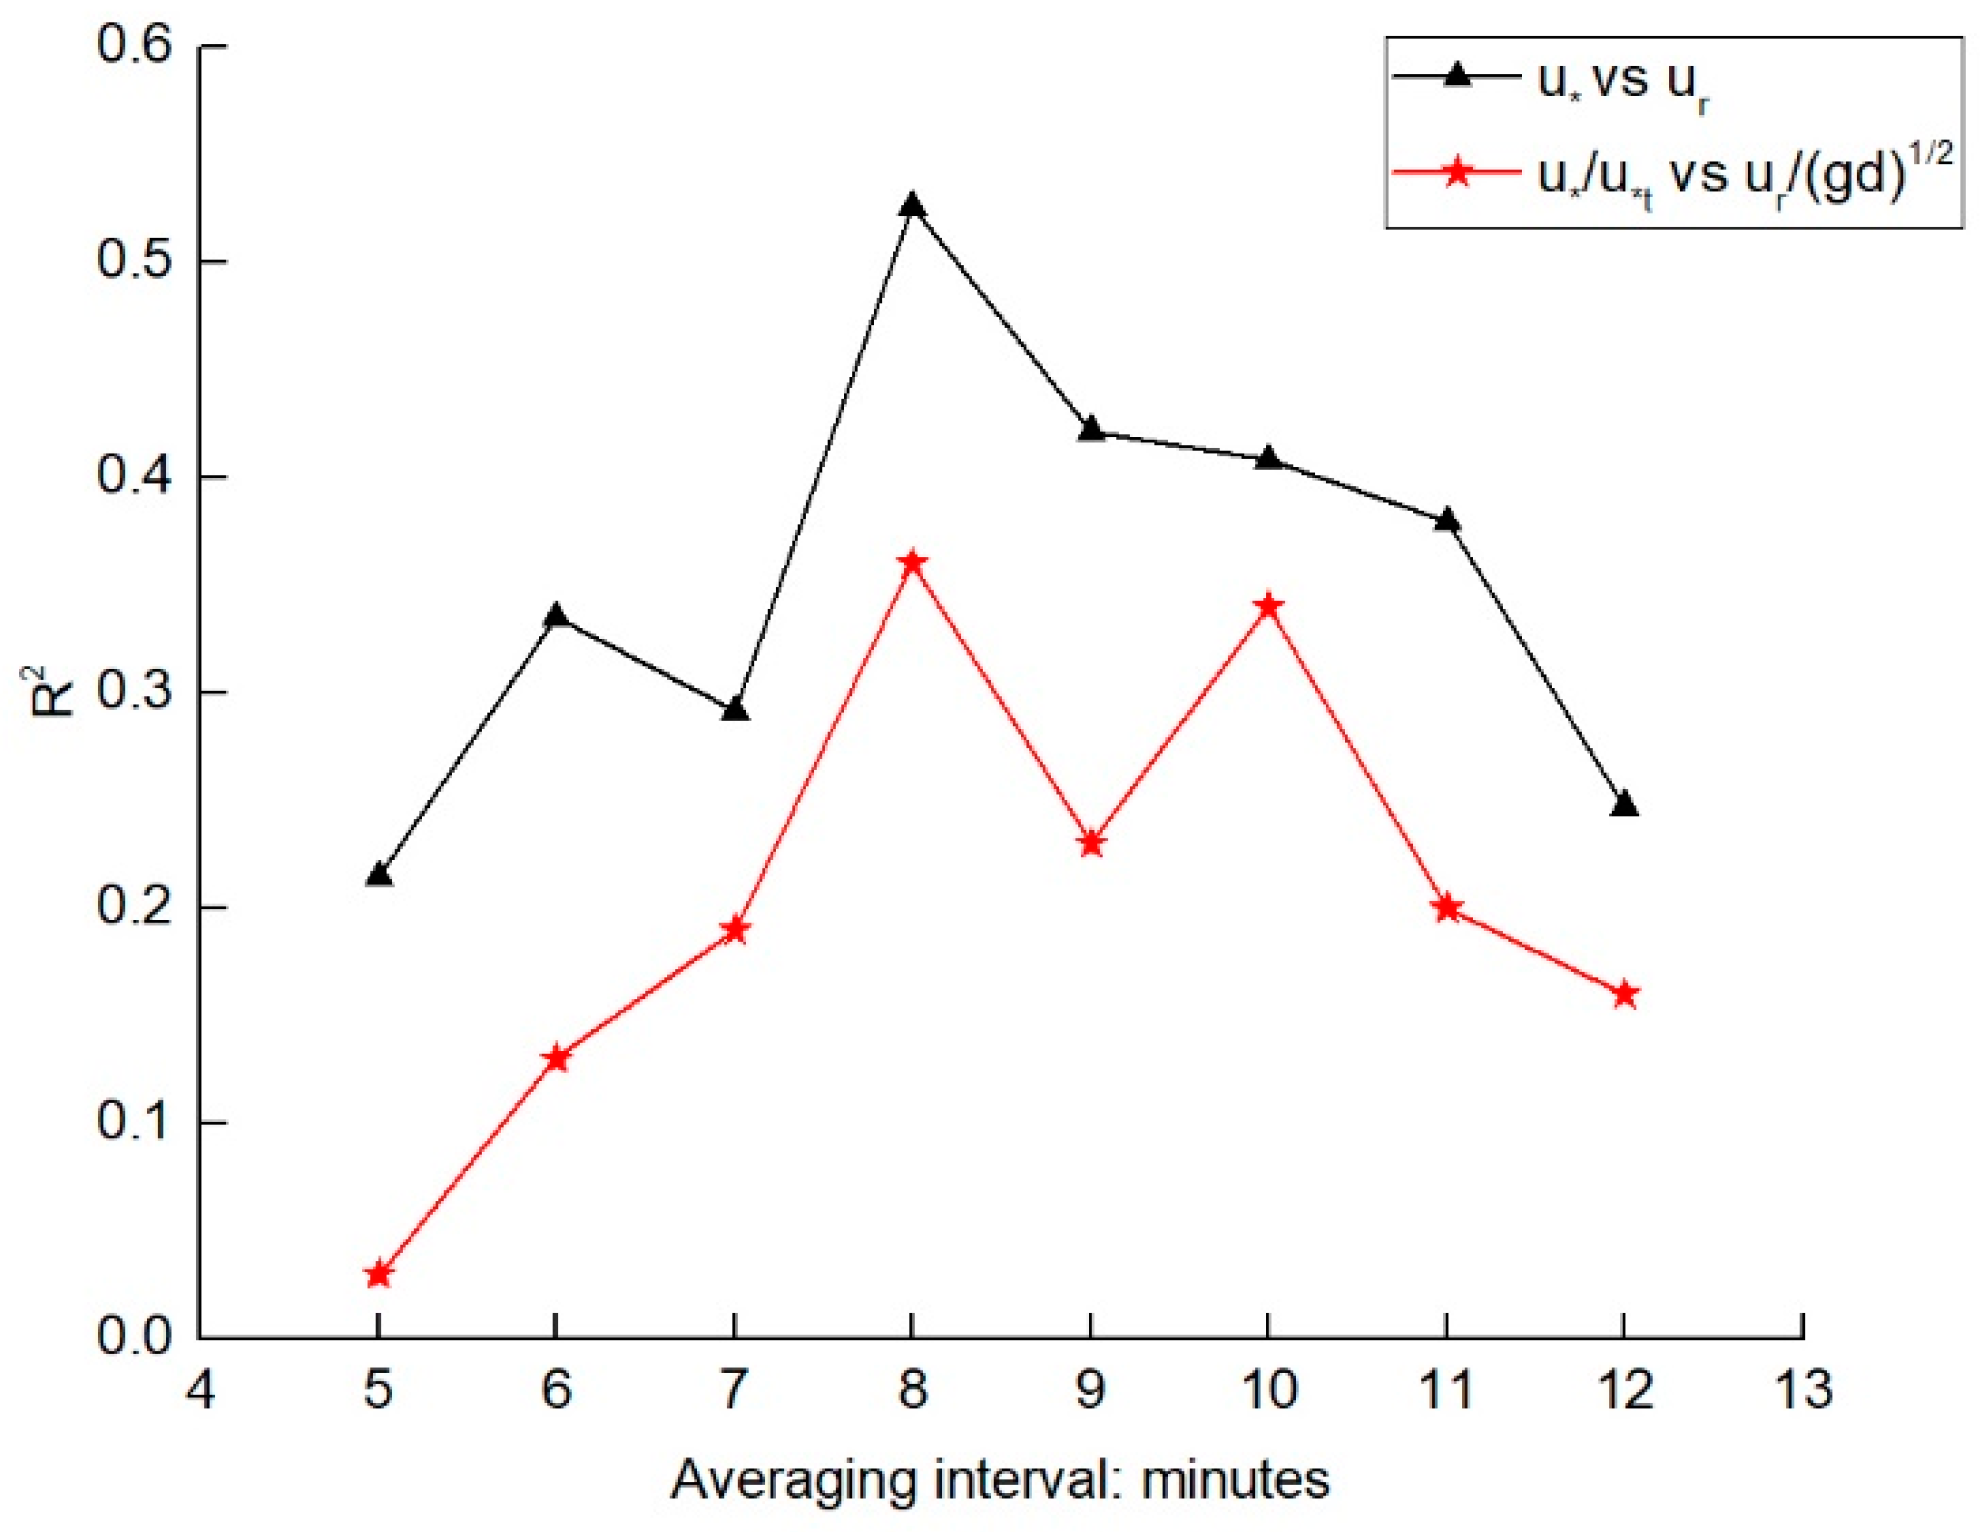
A conservative estimate of averaging interval for shear velocity can be obtained from graphs presented by van Boxel et al. [112]. For the anemometer heights, sampling frequencies and typical wind speeds during our first experiments, sample durations of the order of one minute should provide robust u* estimates. Averaging ripple migration rates over such a short period, however, had the effect of making small absolute measurement errors (one or two millimeters) into larger relative errors (10 – 20%, or more) of migration rates. Averaging over excessively long periods, on the other hand, had the effect of masking the dynamic response of the ripples to changes in wind conditions. Therefore, we tested the influence of shear velocity on ripple migration using averaging intervals of 5, 6, 7, 8, 9, 10, 11, and 12 minutes using linear regression analysis.
We performed the analysis in two ways, using either as the independent variable with ur, or, following the parameterizations of [59], with ur/(gd)0.5. In both cases we found the optimal averaging interval to be eight minutes based on the coefficients of determination found with the eight intervals tested (Figure A1). When comparing just with ur/(gd)0.5 a ten minute interval produced results that were almost as strong as those from eight minutes, but the longer interval was not as strong with and ur, and it also reduced the number of samples available for analysis.
Figure A1.
Comparison of coefficients of determination (R2) found using or as independent variables with ur or ur/(gd)0.5 as the respective dependent variables, for averaging intervals of 5 to 12 min. The 8 min interval produced the strongest results in both cases.
Figure A1.
Comparison of coefficients of determination (R2) found using or as independent variables with ur or ur/(gd)0.5 as the respective dependent variables, for averaging intervals of 5 to 12 min. The 8 min interval produced the strongest results in both cases.
Appendix B. Processing the Laser Distance Sensor (Sick Dt35) Time Series to Resolve Ripple Heights and Migration Rates
Starting from the raw bed elevation time series acquired with a pair of laser distance sensors (Sick DT35), a “detrending” was first performed to remove low-frequency drift in the time series. Such low-frequency drift is most likely associated with gradual change in the underlying bed elevation and/or settling of the instrument arrays. For each raw elevation time series, a long-term drift component was calculated as the moving average at a detrending time scale = 3000 s. The long-term drift component was then subtracted from the raw time series to generate a detrended time series, centered around bed elevation = 0. We chose to be double the characteristic ripple migration time scale s: long enough to preserve the underlying ripple migration signal but short enough to filter out the underlying drift in the time series. We estimated s from the first peak in the autocorrelation in the raw bed elevation time series.
We then applied a “smoothing” to the detrended elevation time series to eliminate high-frequency noise, most likely associated with limitations in sensor accuracy and the presence of saltating particles in the field of view of the sensors. Smoothed time series were calculated as moving averages of detrended time series at a smoothing time scale = 120 s. We chose to be long enough to adequately filter out the high-frequency noise but short enough to preserve the ripple migration signal.
From these processed (i.e., detrended and smoothed) time series, we identified ripple troughs and crests as local maxima and minima between zero crossings in the respective bed elevation time series. Crests and troughs were then matched between the upwind and downwind time series, and migration speeds were then calculated as , where cm is the fixed distance between the sensors and is the time for an individual crest or trough to migrate from the upwind sensor to the downwind sensor. An absolute time was associated with each individual calculation as the mean time between the occurrence of the crest or trough in the upwind and downwind time series. An amplitude was calculated for each crest as the mean of the absolute elevation differences between the crest and the preceding and succeeding troughs in the time series; the converse was also calculated for each trough (i.e., elevation difference with preceding and succeeding crest). An absolute time was associated with each individual value as the time of occurrence of the middle crest or trough from which was calculated. For quality control, we discarded all and calculations that included inferred crests or troughs for which cm, as these likely reflected noise in the time series rather than actual ripple migration.
References
- Walker, J.D. An Experimental Study of Wind Ripples. Master’s Thesis, Massachusetts Institute of Technology, Cambridge, MA, USA, January 1981. [Google Scholar]
- Ungar, J.E.; Haff, P.K. Steady state saltation in air. Sedimentology 2006, 34, 289–299. [Google Scholar] [CrossRef]
- Mitha, S.; Tran, M.Q.; Werner, B.T.; Haff, P.K. The grain-bed impact process in aeolian saltation. Acta Mech. 1986, 63, 267–278. [Google Scholar] [CrossRef]
- Werner, B.T.; Haff, P.K. The impact process in aeolian saltation: Two-dimensional simulations. Sedimentology 2010, 35, 189–196. [Google Scholar] [CrossRef]
- Welland, M. Sediment transport by wind and water: The pioneering work of ralph bagnold. In Macro-engineering Seawater in Unique Environments; Badescu, V., Cathcart, R.B., Eds.; Springer-Verlag: Berlin, Germany, 2010; pp. 399–429. [Google Scholar]
- Lämmel, M.; Rings, D.; Kroy, K. A two-species continuum model for aeolian sand transport. New J. Phys. 2012, 14, 093037. [Google Scholar] [CrossRef]
- Willets, B.; Rice, M. Collisions in aeolian transport: the saltation/creep link. In Proceedings of The Binghamton Symposium in Geomorphology. Aeolian Geomorphology; Nicking, W.G., Ed.; Allen & Unwin: London, UK, 1986; Volume 18, pp. 1–17. [Google Scholar]
- Manukyan, E.; Prigozhin, L. Formation of aeolian ripples and sand sorting. Phys. Rev. E 2009, 79, 031303. [Google Scholar] [CrossRef] [Green Version]
- Wang, Y.; Wang, D.; Wang, L.; Zhang, Y. Measurement of sand creep on a flat sand bed using a high-speed digital camera. Sedimentology 2009, 56, 1705–1712. [Google Scholar] [CrossRef]
- Cheng, H.; Liu, C.; Zou, X.; Li, J.; He, J.; Liu, B.; Wu, Y.; Kang, L.; Fang, Y. Aeolian creeping mass of different grain sizes over sand beds of varying length. J. Geophys. Res. Earth Surf. 2015, 120, 1404–1417. [Google Scholar] [CrossRef] [Green Version]
- Brookfield, M.E. The origin of bounding surfaces in ancient aeolian sandstones. Sedimentology 1977, 24, 303–332. [Google Scholar] [CrossRef]
- Lapotre, M.; Ewing, R.; Lamb, M.; Fischer, W.; Grotzinger, J.; Rubin, D.; Lewis, K.; Ballard, M.; Day, M.; Gupta, S. Large wind ripples on Mars: A record of atmospheric evolution. Science 2016, 353, 55–58. [Google Scholar] [CrossRef] [Green Version]
- Wessely, J. Der Europaische Flugsand Und Seine Kultur: Besprochen Im Hinblike Auf Ungarn Und Die Banater Wuste Insbesondere; Faesy & Frick: Wien, Österreich-Ungarn, 1873; pp. 48–72. [Google Scholar]
- Sokolow, N.A. Die Dünen: Bildung, Entwickelung und innerer Bau; Julius Springer: Berlin, Germany, 1894. [Google Scholar]
- Cornish, V. On the formation of sand-dunes. Geogr. J. 1897, 9, 278–302. [Google Scholar] [CrossRef]
- Joly, J. Formation of sand-ripples. Sci. Proc. R. Dublin Soc. 1904, 10, 328–330. [Google Scholar]
- Ayrton, H.; Ayrton, W.E. The origin and growth of ripple-mark. Proc. R. Soc. Lond. Ser. A Contain. Pap. Math. Phys. Character 1910, 84, 285–310. [Google Scholar] [CrossRef] [Green Version]
- Free, E.E.; Stuntz, S.C. The Movement of Soil Material by the Wind; US Government Printing Office: Washington, DC, USA, 1911. [Google Scholar]
- King, W.H. The nature and formation of sand ripples and dunes. Geogr. J. 1916, 189–207. [Google Scholar] [CrossRef]
- Yizhaq, H.; Isenberg, O.; Wenkart, R.; Tsoar, H.; Karnieli, A. Morphology and dynamics of aeolian mega-ripples in Nahal Kasuy, southern Israel. Israel J. Earth Sci. 2009, 57, 149–165. [Google Scholar] [CrossRef]
- Lämmel, M.; Meiwald, A.; Yizhaq, H.; Tsoar, H.; Katra, I.; Kroy, K. Aeolian sand sorting and megaripple formation. Nat. Phys. 2018, 14, 22–30. [Google Scholar] [CrossRef]
- Yizhaq, H.; Bel, G.; Silvestro, S.; Elperin, T.; Kok, J.F.; Cardinale, M.; Provenzale, A.; Katra, I. The origin of the transverse instability of aeolian megaripples. Earth Planet. Sci. Lett. 2019, 512, 59–70. [Google Scholar] [CrossRef]
- Balme, M.; Berman, D.C.; Bourke, M.C.; Zimbelman, J.R. Transverse Aeolian Ridges (TARs) on Mars. Geomorphology 2008, 101, 703–720. [Google Scholar] [CrossRef] [Green Version]
- Foroutan, M.; Zimbelman, J.R. Mega-ripples in Iran: A new analog for transverse aeolian ridges on Mars. Icarus 2016, 274, 99–105. [Google Scholar] [CrossRef]
- Geissler, P.E. The birth and death of transverse aeolian ridges on Mars. J. Geophys. Res. Planets 2014, 119, 2583–2599. [Google Scholar] [CrossRef]
- Sharp, R.P. Wind ripples. J. Geol. 1963, 71, 617–636. [Google Scholar] [CrossRef]
- Wilson, I.G. Aeolian bedforms—their development and origins. Sedimentology 1972, 19, 173–210. [Google Scholar] [CrossRef]
- Seppälä, M.; Lindé, K. Wind tunnel studies of ripple formation. Geogr. Ann. Ser. A Phys. Geogr. 1978, 60, 29–42. [Google Scholar] [CrossRef]
- Durán, O.; Claudin, P.; Andreotti, B. Direct numerical simulations of aeolian sand ripples. Proc. Natl. Acad. Sci. 2014, 111, 15665–15668. [Google Scholar] [CrossRef] [PubMed] [Green Version]
- Siminovich, A.; Elperin, T.; Katra, I.; Kok, J.; Sullivan, R.; Silvestro, S.; Yizhaq, H. Numerical study of shear stress distribution over sand ripples under terrestrial and Martian conditions. J. Geophys. Res. Planets 2019, 124, 175–185. [Google Scholar] [CrossRef]
- Anderson, R.S. A theoretical model for aeolian impact ripples. Sedimentology 1987, 34, 943–956. [Google Scholar] [CrossRef]
- Valance, A.; Rioual, F. A nonlinear model for aeolian sand ripples. Eur. Phys. J. B-Condensed Matter Complex Syst. 1999, 10, 543–548. [Google Scholar] [CrossRef]
- Pelletier, J.D. Controls on the height and spacing of eolian ripples and transverse dunes: A numerical modeling investigation. Geomorphology 2009, 105, 322–333. [Google Scholar] [CrossRef]
- Qian, G.; Dong, Z.; Zhang, Z.; Luo, W.; Lu, J. Granule ripples in the Kumtagh Desert, China: Morphology, grain size and influencing factors. Sedimentology 2012, 59, 1888–1901. [Google Scholar] [CrossRef]
- Ewing, R.C.; Mcdonald, G.D.; Hayes, A.G. Geomorphology Multi-spatial analysis of aeolian dune-field patterns. Geomorphology 2015, 240, 44–53. [Google Scholar] [CrossRef]
- Field, J.P.; Pelletier, J.D. Controls on the aerodynamic roughness length and the grain-size dependence of aeolian sediment transport. Earth Surf. Process. Landf. 2018, 43, 2616–2626. [Google Scholar] [CrossRef]
- Wang, P.; Zhang, J.; Huang, N. A theoretical model for aeolian polydisperse-sand ripples. Geomorphology 2019, 335, 28–36. [Google Scholar] [CrossRef]
- Cheng, H.; Liu, C.; Li, J.; Liu, B.; Zheng, Z.; Zou, X.; Kang, L.; Fang, Y. Experimental study of aeolian sand ripples in a wind tunnel. Earth Surf. Process. Landf. 2018, 43, 312–321. [Google Scholar] [CrossRef]
- Hunter, R.E. Basic types of stratification in small eolian dunes. Sedimentology 1977, 24, 361–387. [Google Scholar] [CrossRef]
- Fryberger, S.G.; Schenk, C. Wind sedimentation tunnel experiments on the origins of aeolian strata. Sedimentology 1981, 28, 805–821. [Google Scholar] [CrossRef]
- Bristow, C.; Mountney, N. Aeolian stratigraphy. In Treatise on Geomorphology; Shroder, J., Lancaster, N., Sherman, D.J., Baas, A.C.W., Eds.; Academic Press: San Diego, CA, USA, 2013; Volume 11, pp. 246–268. [Google Scholar]
- Sullivan, R.; Banfield, D.; Bell III, J.F.; Calvin, W.; Fike, D.; Golombek, M.; Greeley, R.; Grotzinger, J.; Herkenhoff, K.; Jerolmack, D. Aeolian processes at the Mars exploration rover Meridiani Planum landing site. Nature 2005, 436, 58. [Google Scholar] [CrossRef] [PubMed]
- Bridges, N.; Geissler, P.; Silvestro, S.; Banks, M. Bedform migration on Mars: Current results and future plans. Aeolian Res. 2013, 9, 133–151. [Google Scholar] [CrossRef]
- Weitz, C.M.; Sullivan, R.J.; Lapotre, M.G.; Rowland, S.K.; Grant, J.A.; Baker, M.; Yingst, R.A. Sand grain sizes and shapes in eolian bedforms at Gale Crater, Mars. Geophys. Res. Lett. 2018, 9471–9479. [Google Scholar] [CrossRef]
- Lapotre, M.; Ewing, R.; Weitz, C.; Lewis, K.; Lamb, M.; Ehlmann, B.; Rubin, D. Morphologic diversity of Martian ripples: Implications for large-ripple formation. Geophys. Res. Lett. 2018, 45, 10229–10239. [Google Scholar] [CrossRef]
- Vinent Durán, O.; Andreotti, B.; Claudin, P.; Winter, C. A unified model of ripples and dunes in water and planetary environments. Nat. Geosci. 2019, 12, 345. [Google Scholar] [CrossRef]
- Evier, E.L.; Landry, W.; Werner, B.T. Computer simulations of self-organized wind ripple pattern. Physica D Nonlinear Phenom. 1994, 77, 238–260. [Google Scholar]
- Jerolmack, D.J.; Mohrig, D.; Grotzinger, J.P.; Fike, D.A.; Watters, W.A. Spatial grain size sorting in eolian ripples and estimation of wind conditions on planetary surfaces: Application to Meridiani Planum, Mars. J. Geophys. Res. Planets 2006, 111, 1–14. [Google Scholar] [CrossRef]
- Lorenz, R.D.; Valdez, A. Variable wind ripple migration at Great Sand Dunes National Park and Preserve, observed by timelapse imaging. Geomorphology 2011, 133, 1–10. [Google Scholar] [CrossRef]
- Bridges, N.T.; Ayoub, F.; Avouac, J.-p.; Leprince, S.; Lucas, A.; Mattson, S. Earth-like sand fluxes on Mars. Nature 2012, 485, 339–342. [Google Scholar] [CrossRef] [PubMed] [Green Version]
- Lorenz, R.D. Observations of wind ripple migration on an Egyptian seif dune using an inexpensive digital timelapse camera. Aeolian Res. 2011, 3, 229–234. [Google Scholar] [CrossRef]
- Bagnold, R. The physics of blown sand and desert dunes: New York. William Morrow Co. 1941, 1, 91–96. [Google Scholar]
- Louge, M.Y.; Valance, A.; Ould el-Moctar, A.; Dupont, P. Packing variations on a ripple of nearly monodisperse dry sand. J. Geophys. Res. Earth Surf. 2010, 115, F02001. [Google Scholar] [CrossRef]
- Wang, Z.T.; Zheng, X.J. Theoretical prediction of creep flux in aeolian sand transport. Powder Technol. 2004, 139, 123–128. [Google Scholar] [CrossRef]
- Cheng, H.; Zou, X.; Liu, C.; He, J.; Wu, Y. Transport mass of creeping sand grains and their movement velocities. J. Geophys. Res. Atmos. 2013, 118, 6374–6382. [Google Scholar]
- Bagnold, R.A. The size-garding of sand by wind. Proc. R. Soc. Lond. Ser. A-Math. Phys. Sci. 1937, 163, 250–264. [Google Scholar]
- Bagnold, R.A. The measurement of sand storms. Proc. R. Soc. Lond. Ser. A-Math. Phys. Sci. 1938, 167, 282–291. [Google Scholar] [Green Version]
- Sherman, D.J.; Zhang, P.; Martin, R.L.; Ellis, J.T.; Kok, J.F.; Farrell, E.J.; Li, B. Data for Aeolian Ripple Migration and Associated Creep Transport Rates (Dataset). Zenodo, 2019. Available online: https://doi.org/10.5281/zenodo.3378825 (accessed on 4 September 2019).
- Sherman, D.J.; Farrell, E.J. Aerodynamic roughness lengths over movable beds: Comparison of wind tunnel and field data. J. Geophys. Res. Earth Surf. 2008, 113, F02S08. [Google Scholar] [CrossRef]
- Bagnold, R.A. The movement of desert sand. Proc. R. Soc. Lond. Ser. A-Math. Phys. Sci. 1936, 157, 594–620. [Google Scholar] [CrossRef]
- Kindle, E.M. Recent and fossil ripple-mark; Canada Department of Mines, Geological Survey: Ottawa, ON, Canada, 1917; pp. 9–29. [Google Scholar]
- Strickland, W.W. Notes and Observations on Forms of Sand; Smithson, R.H., Ed.; Blanchard: London, UK, 1915; pp. 16–20. [Google Scholar]
- Wentworth, C.K. A scale of grade and class terms for clastic sediments. J. Geol. 1922, 30, 377–392. [Google Scholar] [CrossRef]
- Stone, R.O.; Summers, H.J. Study of Subaqueous and Subaerial Sand Ripples; University of Southern California: Los Angeles, CA, USA, 1972. [Google Scholar]
- Borsy, Z. A homokfodrok. Fldrajzi rtesito 1973, 22, 109–115. [Google Scholar]
- Ling, Y.; Qu, J.; Li, C. Study on sand ripple movement with close shoot method. J. Desert Res. 2003, 23, 118–120. [Google Scholar]
- Ling, Y.; Wu, Z.; Liu, S. A wind tunnel simulation of aeolian sand ripple formation. Acta Geogr. Sin. 1998, 53, 527–534. [Google Scholar]
- Andreotti, B.; Claudin, P.; Pouliquen, O. Aeolian sand ripples: experimental study of fully developed states. Phys. Rev. Lett. 2006, 96, 028001. [Google Scholar] [CrossRef] [PubMed]
- Zhu, W. Investigations on the Formation and Evolution of Aeolian Sand Ripples. Ph.D. Thesis, Lanzhou University, Lanzhou, China, June 2011. [Google Scholar]
- Farrell, E.; Sherman, D.; Ellis, J.; Li, B. Vertical distribution of grain size for wind blown sand. Aeolian Res. 2012, 7, 51–61. [Google Scholar] [CrossRef]
- Barrineau, C.P.; Ellis, J. Sediment transport and wind flow around hummocks. Aeolian Res. 2013, 8, 19–27. [Google Scholar] [CrossRef]
- Jimenez, J.A.; Maia, L.P.; Serra, J.; Morais, J. Aeolian dune migration along the Ceara coast, north-eastern Brazil. Sedimentology 1999, 46, 689–701. [Google Scholar] [CrossRef]
- Maia, L.; Freire, G.; Lacerda, L. Accelerated dune migration and aeolian transport during El Nino events along the NE Brazilian coast. J. Coast. Res. 2005, 1121–1126. [Google Scholar] [CrossRef]
- Pease, P.; Lecce, S.; Gares, P.; Lange, M. Suggestions for low-cost equipment for physical geography II: field equipment. J. Geogr. 2002, 105, 199–206. [Google Scholar] [CrossRef]
- Sherman, D.J.; Swann, C.; Barron, J.D. A high-efficiency, low-cost aeolian sand trap. Aeolian Res. 2014, 13, 31–34. [Google Scholar] [CrossRef]
- Martin, R.L.; Kok, J.F.; Hugenholtz, C.H.; Barchyn, T.E.; Chamecki, M.; Ellis, J.T. High-frequency measurements of aeolian saltation flux: Field-based methodology and applications. Aeolian Res. 2018, 30, 97–114. [Google Scholar] [CrossRef] [Green Version]
- Martin, R.L.; Kok, J.F. Wind-invariant saltation heights imply linear scaling of aeolian saltation flux with shear stress. Sci. Adv. 2017, 3, e1602569. [Google Scholar] [CrossRef] [PubMed]
- Fryrear, D.W. A field dust sampler. J. Soil Water Conserv. 1986, 41, 117–120. [Google Scholar]
- Martin, R.L.; Kok, J.F. Aeolian saltation fieldwork 30-minute wind and saltation values (Dataset). Zenodo, 2017. Available online: https://doi.org/10.5281/zenodo.291798 (accessed on 4 September 2019).
- Martin, R.L.; Kok, J.F. Distinct thresholds for the initiation and cessation of aeolian saltation from field measurements. J. Geophys. Res. Earth Surf. 2018, 123, 1546–1565. [Google Scholar] [CrossRef]
- Stout, J.; Zobeck, T. Intermittent saltation. Sedimentology 1997, 44, 959–970. [Google Scholar] [CrossRef] [Green Version]
- Lee, Z.S.; Baas, A.C.W. Streamline correction for the analysis of boundary layer turbulence. Geomorphology 2012, 171, 69–82. [Google Scholar] [CrossRef]
- Blott, S.J.; Pye, K. GRADISTAT: a grain size distribution and statistics package for the analysis of unconsolidated sediments. Earth Surf. Process. Landf. 2001, 26, 1237–1248. [Google Scholar] [CrossRef]
- Martin, R.L.; Jerolmack, D.J. Origin of hysteresis in bed form response to unsteady flows. Water Resour. Res. 2013, 49, 1314–1333. [Google Scholar] [CrossRef] [Green Version]
- Sherman, D.J. An equilibrium relationship for shear velocity and apparent roughness lenght in aeolian saltation. Geomorphology 1992, 5, 419–431. [Google Scholar] [CrossRef]
- Sterk, G.; Jacobs, A.; Van Boxel, J. The effect of turbulent flow structures on saltation sand transport in the atmospheric boundary layer. J. Br. Geomorphol. Group 1998, 23, 877–887. [Google Scholar] [CrossRef]
- Baas, A.C. Wavelet power spectra of aeolian sand transport by boundary layer turbulence. Geophys. Res. Lett. 2006, 33, L05403. [Google Scholar] [CrossRef]
- Spies, P.-J.; McEwan, I.K.; Butterfield, G.R. On wind velocity profile measurements taken in wind tunnels with saltating grains. Sedimentology 1995, 42, 515–521. [Google Scholar] [CrossRef]
- Butterfield, G.R. Near-bed mass flux profiles in aeolian sand transport: high-resolution measurements in a wind tunnel. J. Br. Geomorphol. Res. Group 1999, 24, 393–412. [Google Scholar] [CrossRef]
- Bauer, B.; Houser, C.; Nickling, W. Analysis of velocity profile measurements from wind-tunnel experiments with saltation. Geomorphology 2004, 59, 81–98. [Google Scholar] [CrossRef]
- Mikami, M.; Yamada, Y.; Ishizuka, M.; Ishimaru, T.; Gao, W.; Zeng, F. Measurement of saltation process over gobi and sand dunes in the Taklimakan desert, China, with newly developed sand particle counter. J. Geophys. Res. Atmos. 2005, 110, D18S02. [Google Scholar] [CrossRef]
- Creyssels, M.; Dupont, P.; El Moctar, A.O.; Valance, A.; Cantat, I.; Jenkins, J.T.; Pasini, J.M.; Rasmussen, K.R. Saltating particles in a turbulent boundary layer: experiment and theory. J. Fluid Mech. 2009, 625, 47–74. [Google Scholar] [CrossRef] [Green Version]
- McKenna Neuman, C.; Bédard, O. A wind tunnel study of flow structure adjustment on deformable sand beds containing a surface-mounted obstacle. J. Geophys. Res. Earth Surf. 2015, 120, 1824–1840. [Google Scholar] [CrossRef]
- Pähtz, T.; Valyrakis, M.; Zhao, X.-H.; Li, Z.-S. The critical role of the boundary layer thickness for the initiation of aeolian sediment transport. Geosciences 2018, 8, 314. [Google Scholar] [CrossRef]
- Dong, Z.; Liu, X.; Wang, X.; Li, F.; Zhao, A. Experimental investigation of the velocity of a sand cloud blowing over a sandy surface. Earth Surf. Process. Landf. 2004, 29, 343–358. [Google Scholar] [CrossRef]
- Dong, Z.; Qian, G.; Luo, W.; Wang, H. Analysis of the mass flux profiles of an aeolian saltating cloud. J. Geophys. Res. Atmos. 2006, 111, 1–11. [Google Scholar] [CrossRef]
- Liu, X.; Dong, Z. Experimental investigation of the concentration profile of a blowing sand cloud. Geomorphology 2004, 60, 371–381. [Google Scholar] [CrossRef]
- Rasmussen, K.R.; Valance, A.; Merrison, J. Laboratory studies of aeolian sediment transport processes on planetary surfaces. Geomorphology 2015, 244, 74–94. [Google Scholar] [CrossRef]
- Shao, Y.; Raupach, M. The overshoot and equilibration of saltation. J. Geophys. Res. Atmos. 1992, 97, 20559–20564. [Google Scholar] [CrossRef]
- Liu, B.; Qu, J.; Zhang, W.; Tan, L.; Gao, Y. Numerical evaluation of the scale problem on the wind flow of a windbreak. Sci. Rep. 2014, 4, 6619. [Google Scholar] [CrossRef]
- Farrell, E. Characterizing vertical mass flux profiles in aeolian saltation systems. PhD Thesis, Texas A & M University, College Station, TX, USA, May 2012. [Google Scholar]
- Mckenna Neuman, C.; Maljaars, M. Wind tunnel measurement of boundary-layer response to sediment transport. Bound. Layer Meteorol. 1997, 84, 67–83. [Google Scholar] [CrossRef]
- Chepil, W. Dynamics of wind erosion: II. Initiation of soil movement. Soil Sci. 1945, 60, 397. [Google Scholar] [CrossRef]
- Horikawa, K.; Shen, H.W. Sand Movement by Wind Action: on the Characteristics of Sand Traps; USACE, Beach Erosion Board: Denver, CO, USA, 1960. [Google Scholar]
- Ishihara, T.; Iwagaki, Y. Studies on the counter-measures to prevent ajiro-harbour from filling up with sand-drift. Bull. Comm. Count. -Meas. Sand Drift, Tot tori Prefect. 1950, 2, 1–32. [Google Scholar]
- Dong, Z.; Liu, X.; Wang, H.; Zhao, A.; Wang, X. The flux profile of a blowing sand cloud: A wind tunnel investigation. Geomorphology 2002, 49, 219–230. [Google Scholar] [CrossRef]
- Nickling, W. Eolian sediment transport during dust storms: Slims River valley, Yukon Territory. Can. J. Earth Sci. 1978, 15, 1069–1084. [Google Scholar] [CrossRef]
- Kang, Y.; He, Q.; Yang, X.; Yang, F.; Ali, M.; Huo, W. Research on saltation and creeping laws of wind-blown currents based on field observations. J. Arid Land Resour. Environ. 2017, 31, 119–127. [Google Scholar]
- Yizhaq, H.; Kok, J.F.; Katra, I. Basaltic sand ripples at Eagle Crater as indirect evidence for the hysteresis effect in martian saltation. Icarus 2014, 230, 143–150. [Google Scholar] [CrossRef]
- Kok, J.F.; Renno, N.O. A comprehensive numerical model of steady state saltation (COMSALT). J. Geophys. Res. Atmos. 2009, 114, D17204. [Google Scholar] [CrossRef]
- Runyon, K.D.; Bridges, N.T.; Newman, C.E. Martian sand sheet characterization and implications for formation: A case study. Aeolian Res. 2017, 29, 1–11. [Google Scholar] [CrossRef]
- Van Boxel, J.; Sterk, G.; Arens, S. Sonic anemometers in aeolian sediment transport research. Geomorphology 2004, 59, 131–147. [Google Scholar] [CrossRef] [Green Version]
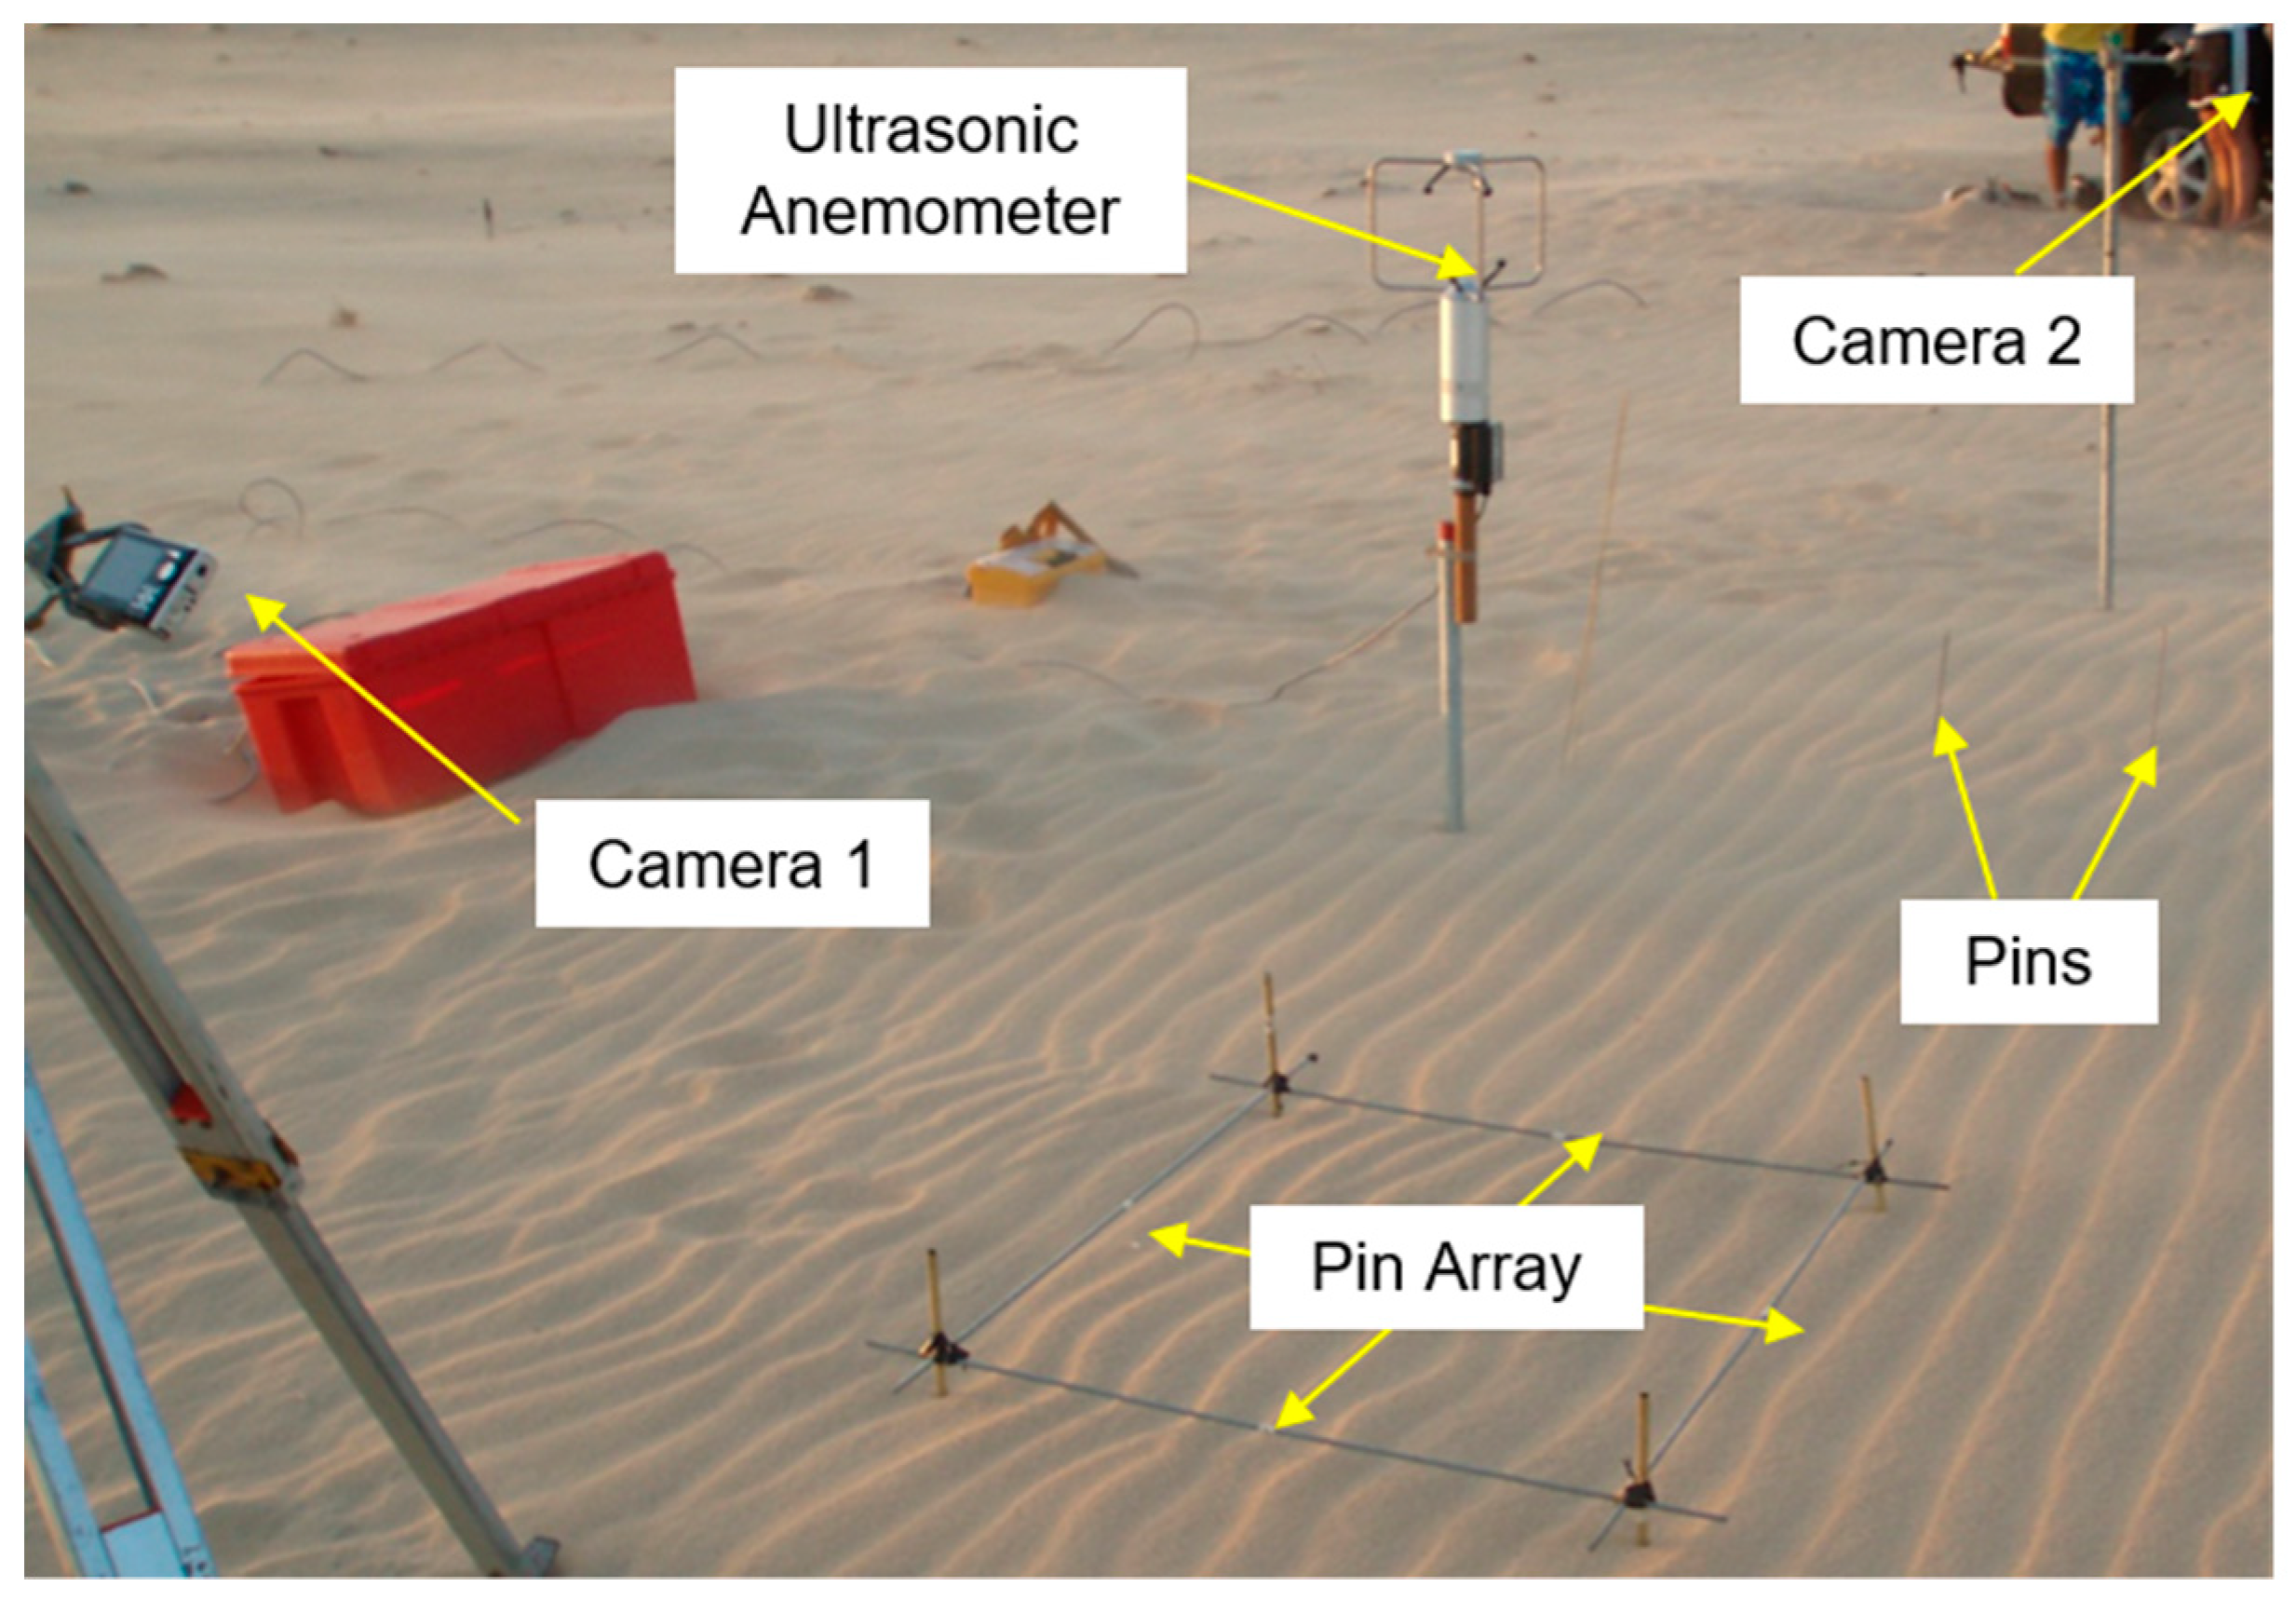
Figure 1.
Basic configuration for ripple migration study at Jericoacoara, Brazil, October 2008. Wind direction was right to left. The 0.80 × 0.80 m ripple reference grid is in the center of the photograph and at center right are the 0.40-m spaced pair of reference pins.
Figure 1.
Basic configuration for ripple migration study at Jericoacoara, Brazil, October 2008. Wind direction was right to left. The 0.80 × 0.80 m ripple reference grid is in the center of the photograph and at center right are the 0.40-m spaced pair of reference pins.

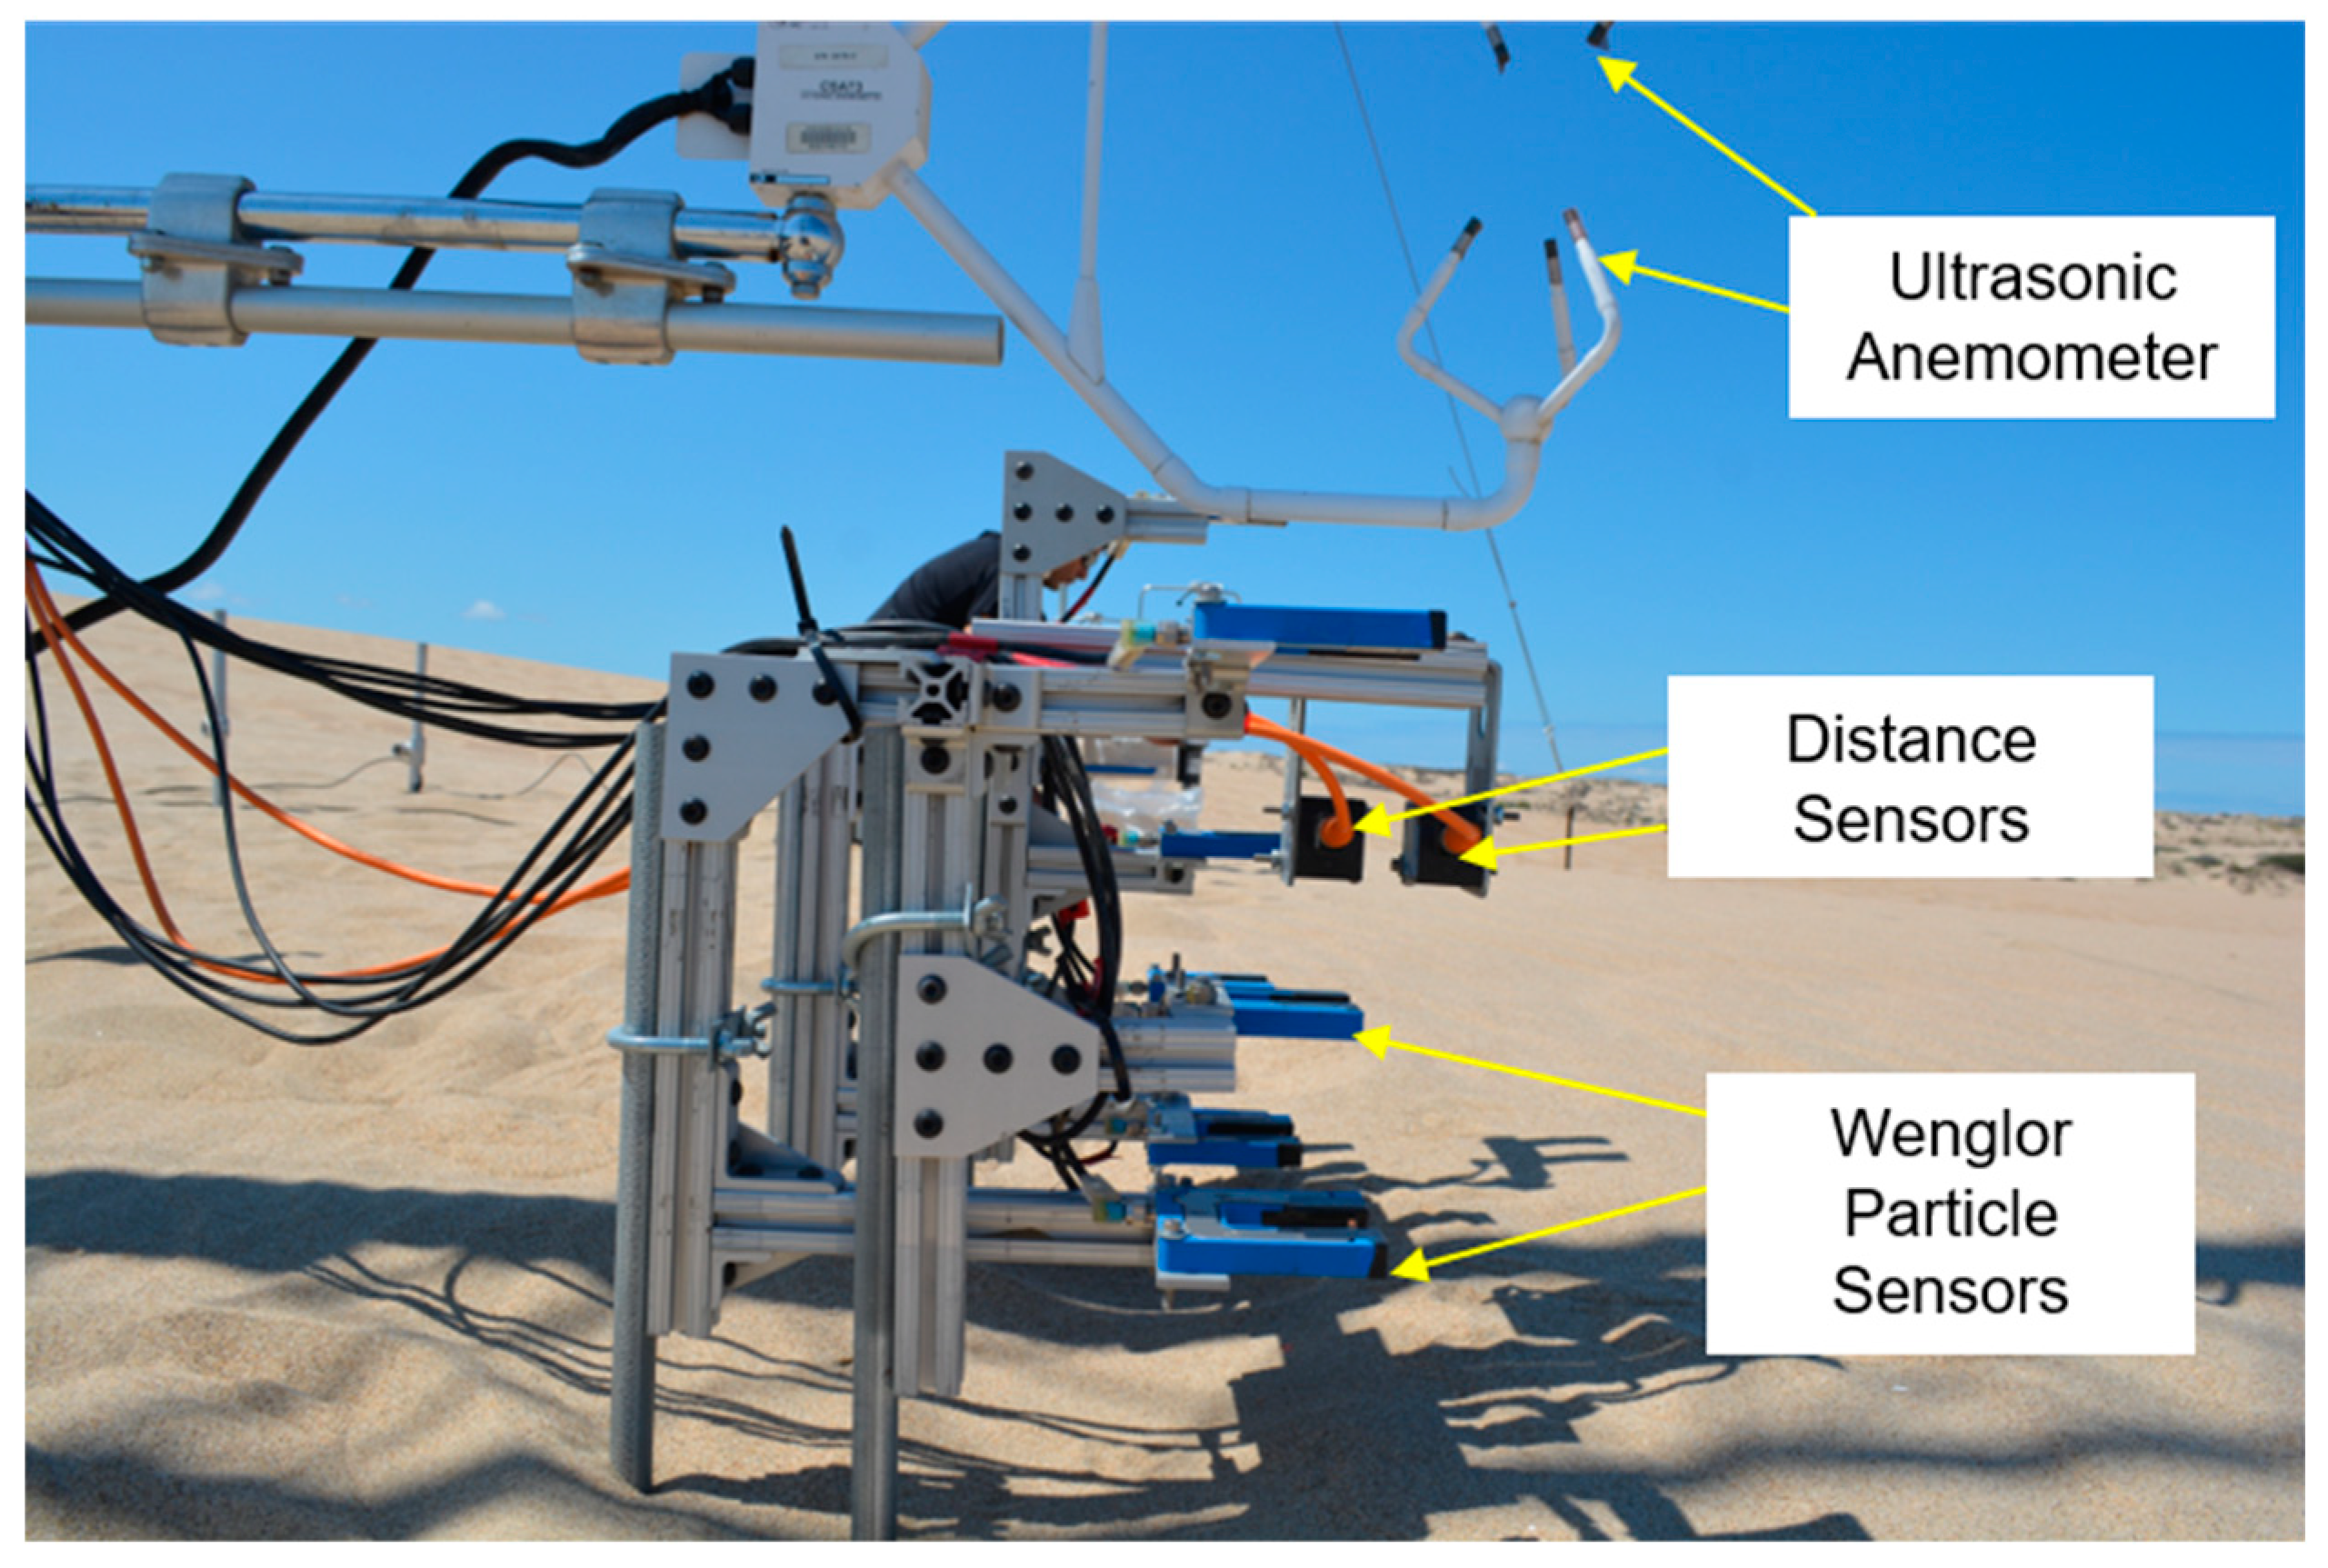
Figure 2.
Configuration for ripple migration study at Oceano, USA, May–June 2015. Wind direction was right to left. The distance sensors are in the center of the photograph with orange cables.
Figure 2.
Configuration for ripple migration study at Oceano, USA, May–June 2015. Wind direction was right to left. The distance sensors are in the center of the photograph with orange cables.

Figure 3.
Dimensionless migration rates for equilibrium ripples as a function of dimensionless shear velocity, segregated as wind tunnel (black symbols: n = 41; R2 = 0.85) or field data (red symbols: n = 174; R2 = 0.52).
Figure 3.
Dimensionless migration rates for equilibrium ripples as a function of dimensionless shear velocity, segregated as wind tunnel (black symbols: n = 41; R2 = 0.85) or field data (red symbols: n = 174; R2 = 0.52).
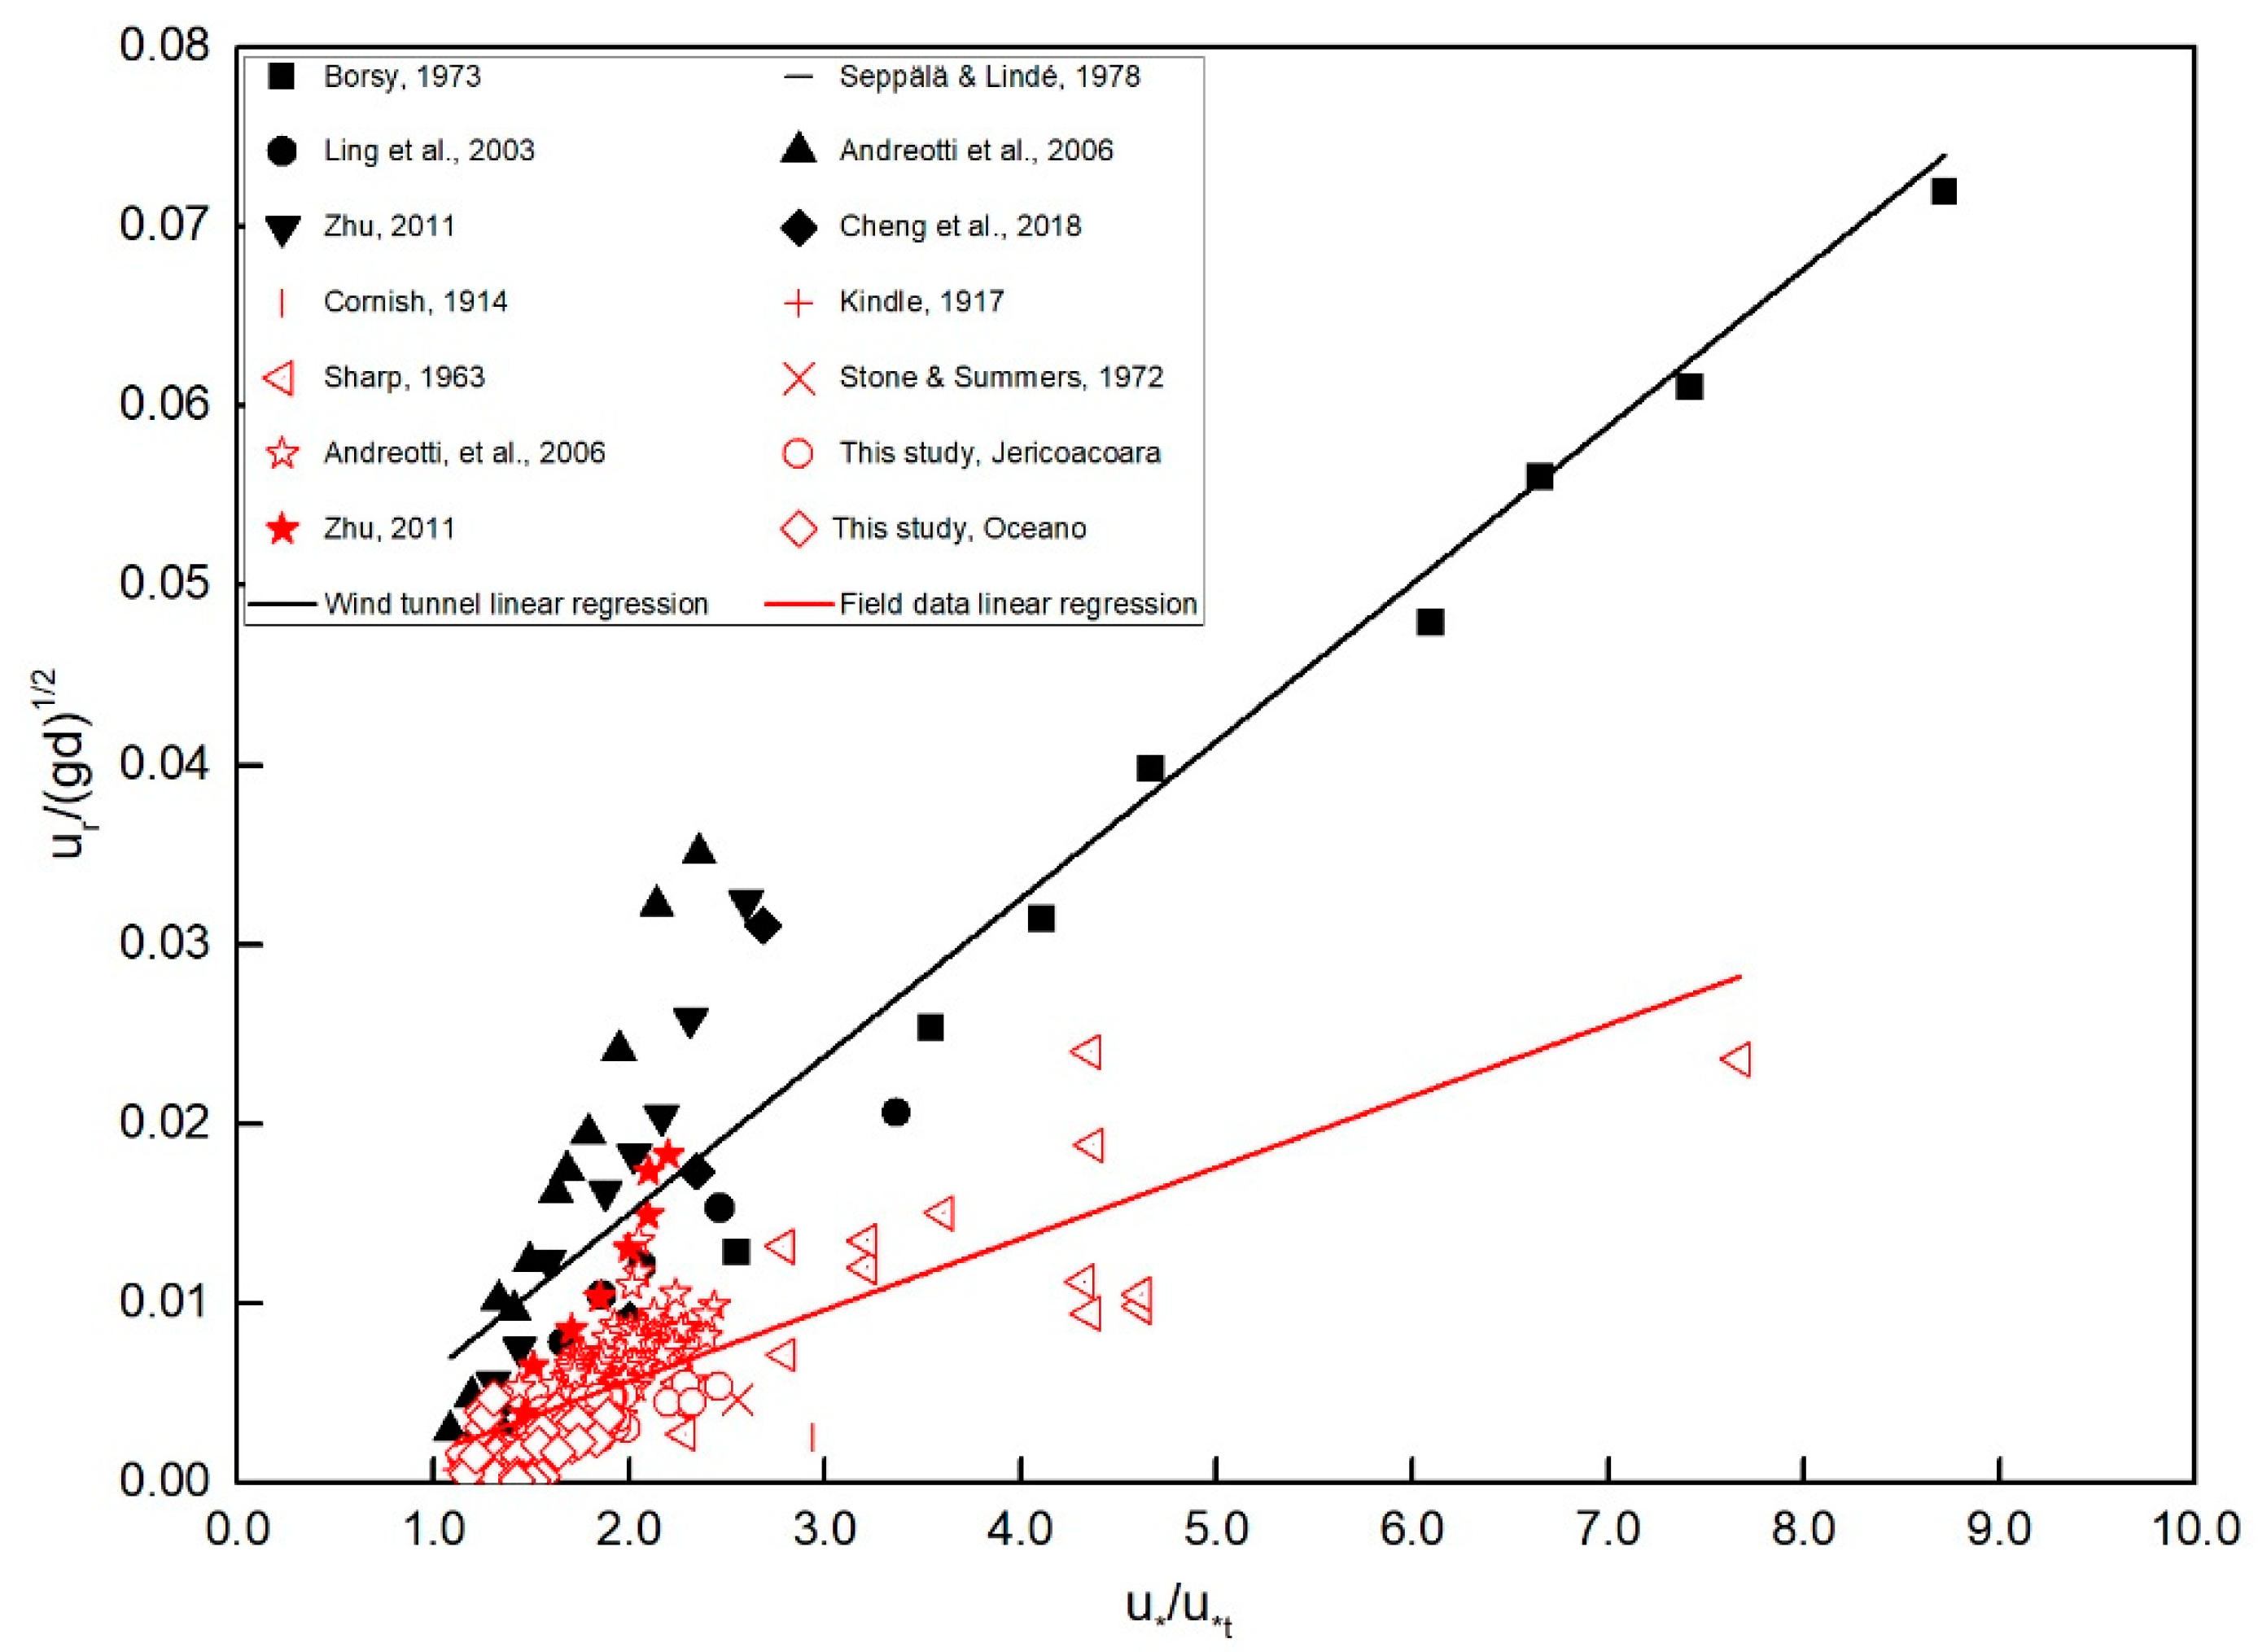
Figure 4.
These analyses included only data that met the quality control criteria. The dimensionless migration rates for equilibrium ripples as a function of dimensionless shear velocity, segregated as wind tunnel (black symbols: n = 34; R2 = 0.86) or field data (red symbols: n = 161; R2 = 0.63).
Figure 4.
These analyses included only data that met the quality control criteria. The dimensionless migration rates for equilibrium ripples as a function of dimensionless shear velocity, segregated as wind tunnel (black symbols: n = 34; R2 = 0.86) or field data (red symbols: n = 161; R2 = 0.63).

Figure 5.
The percent of total transport carried by ripples compared to dimensionless shear velocity. The proportion was approximately independent of u*/u*t for the independent data sets but may indicate a weak dependence for the combined data based on the means of the two populations.
Figure 5.
The percent of total transport carried by ripples compared to dimensionless shear velocity. The proportion was approximately independent of u*/u*t for the independent data sets but may indicate a weak dependence for the combined data based on the means of the two populations.
© 2019 by the authors. Licensee MDPI, Basel, Switzerland. This article is an open access article distributed under the terms and conditions of the Creative Commons Attribution (CC BY) license (http://creativecommons.org/licenses/by/4.0/).
Share and Cite
MDPI and ACS Style
Sherman, D.J.; Zhang, P.; Martin, R.L.; Ellis, J.T.; Kok, J.F.; Farrell, E.J.; Li, B. Aeolian Ripple Migration and Associated Creep Transport Rates. Geosciences 2019, 9, 389. https://doi.org/10.3390/geosciences9090389
AMA Style
Sherman DJ, Zhang P, Martin RL, Ellis JT, Kok JF, Farrell EJ, Li B. Aeolian Ripple Migration and Associated Creep Transport Rates. Geosciences. 2019; 9(9):389. https://doi.org/10.3390/geosciences9090389
Chicago/Turabian StyleSherman, Douglas J., Pei Zhang, Raleigh L. Martin, Jean T. Ellis, Jasper F. Kok, Eugene J. Farrell, and Bailiang Li. 2019. "Aeolian Ripple Migration and Associated Creep Transport Rates" Geosciences 9, no. 9: 389. https://doi.org/10.3390/geosciences9090389
Note that from the first issue of 2016, this journal uses article numbers instead of page numbers. See further details here.