Article

Crystal Digital PCR™ Enables Precise Quantification of Species Abundance in Microbial Mixtures

1
LISM, IMM, Aix-Marseille Univ and CNRS, 13402 Marseille, France
2
BIP, IMM, Aix-Marseille Univ and CNRS, 13402 Marseille, France
3
LCB, IMM, Aix-Marseille Univ and CNRS, 13402 Marseille, France
4
Platform Transcriptome, IMM, Aix-Marseille Univ and CNRS, 13402 Marseille, France
*
Authors to whom correspondence should be addressed.
Microorganisms 2025, 13(11), 2592; https://doi.org/10.3390/microorganisms13112592
Submission received: 30 September 2025 / Revised: 31 October 2025 / Accepted: 3 November 2025 / Published: 14 November 2025
(This article belongs to the Section Molecular Microbiology and Immunology)

Abstract

Accurate bacterial quantification is critical in many biological fields, from clinical diagnostics to environmental microbiology. Here, we establish a robust workflow for absolute quantification of bacterial species within mixed communities using Crystal Digital PCRTM. Using a synthetic consortium of Clostridium acetobutylicum and Nitratidesulfovibrio vulgaris, we optimized primer design for species-specific detection and demonstrated that Crystal Digital PCRTM enables reliable quantification of low-abundance species, down to a 1:10,000 ratio. We further show that the presence of one species does not interfere with the quantification of another. Finally, we demonstrate that Crystal Digital PCRTM can also be used to determine plasmid-to-chromosome copy number ratios in bacteria carrying megaplasmids.

1. Introduction

Performing bacterial counting plays a crucial role in environmental management, industrial biotechnology, and public health by providing essential information about bacterial populations and their impact on different systems. In environmental science, bacterial quantification is fundamental for monitoring the quality of treated wastewater and drinking water, ensuring they remain free from hazardous bacterial contaminations. Moreover, tracking microbial communities involved in pollutant bioremediation is critical for assessing and optimizing their role in breaking down harmful substances, such as hydrocarbons, plastics, or heavy metals. Beyond environmental applications, bacterial communities are important for industrial biotechnology [1,2]. Multi-species microbial consortia can be engineered to harness beneficial interactions, leading to systems with emergent properties such as enhanced metabolic functionality, stability, or productivity. For example, synthetic microbial communities have been increasingly used for their ability to accumulate, metabolize, and degrade various compounds, including cellulose [3], plastics, and toxic heavy metals [4]. Additionally, they play a crucial role in the sustainable production of commodity chemicals [5] and pharmaceuticals [6], offering eco-friendly alternatives to traditional chemical synthesis. A remarkable example of microbial cooperation is biomass degradation in anoxic environments, where diverse microorganisms work together to break down complex organic matter and generate biogas. Inspired by this natural process, a simplified bacterial consortium was developed, consisting of Clostridium acetobutylicum and Nitratidesulfovibrio vulgaris. This engineered microbial system fosters synergistic interactions that enhance biohydrogen production, highlighting the potential of microbial communities in advancing sustainable energy solutions [7,8,9].
Thus, bacterial communities constitute a valuable resource in biotechnology, with tremendous potential for driving sustainable innovation. Their exceptional metabolic versatility and adaptability enable a wide range of applications, from vaccine development and environmental cleanup to bioplastic production and biofuel synthesis. However, although the significance of multispecies communities in various applications is well-established, understanding these communities remains challenging. The lack of detailed knowledge about microbial communities, particularly regarding their composition, stability, and evolution, remains a major obstacle to fully understanding their functions, thereby hindering rational engineering and better control of synthetic ecosystems. Indeed, microbial diversity, which defines the genetic potential within an ecosystem, is a key factor influencing its function, stability, and evolution. In addition to genetic diversity, bacterial evenness—the relative abundance of each species—an important aspect of ecological diversity, also plays a crucial role in shaping ecosystem dynamics [10,11]. It is therefore crucial to accurately quantify the different species within an ecosystem—whether natural, clinical, or industrial—in order to monitor changes in population sizes over time and/or in response to environmental fluctuations. This provides valuable insights into the dynamics of bacterial communities and their interactions, helping to improve our understanding of ecosystem function, optimize biotechnological processes, and ensure safety and quality across various sectors. The main methods of bacterial quantification include culture on solid media, quantitative PCR (qPCR), flow cytometry, and metagenomics, each with distinct advantages and limitations [12,13,14,15]. Culture on solid media is one of the oldest methods, involving the growth of bacteria on nutrient-rich surfaces and counting the resulting colonies [16]. This method is simple, cost-effective, permits identification of living bacteria in samples and allows visual differentiation of bacteria. However, it is a time-consuming approach since many bacteria can exhibit long generation times and is, of course, limited to cultivable bacteria [17,18] and complex to implement in anaerobic or extremophilic growth conditions [19]. A second method very frequently used for counting bacteria in a sample is qPCR that measures the number of copies of specific bacterial genes, offering precise, rapid quantification and high sensitivity [20,21]. However, in qPCR, the quantification relies on a standard curve generated from known concentrations of a DNA. This curve is essential for converting the fluorescence signal into quantitative data, but it requires meticulous preparation and validation [22]. Variations in PCR efficiency and amplification conditions can affect the accuracy of the standard curve, leading to potential inaccuracies in quantification [23]. Moreover, qPCR is susceptible to inhibition from contaminants or complex sample matrices, which can further impact the reliability of results [20]. These factors restrict the sensitivity and precision of qPCR, particularly when quantifying low-abundance targets or when dealing with challenging sample types. Additionally, qPCR cannot differentiate between live and dead bacteria, as it quantifies DNA regardless of cell viability [24]. Flow cytometry is another powerful method for quantifying bacterial populations, offering rapid analysis and multiparametric capabilities to measure various physical and biological characteristics of cells simultaneously and can distinguish live from dead cells using specific dyes [25]. Flow cytometry’s high sensitivity allows detection of rare events, making it effective for quantifying bacteria even at low concentrations [26]. However, this counting method is facing challenges when distinguishing between closely related bacteria solely based on cell shape and granularity [27]. To overcome this limitation, specific fluorescent labeling is crucial. This method involves tagging bacterial cells with fluorescent markers that bind to particular cell surface antigens or components, enabling differentiation based on unique fluorescence patterns [28,29]. However, the effectiveness of these markers can vary depending on the bacterial species and the conditions of the sample (anaerobic conditions for example) [25]. Another drawback of fluorescence-based cell counting is that developing species-specific antibodies is costly and time-consuming, which can limit its practical application. Despite these limitations, flow cytometry remains widely used to analyze mixed microbial communities, which is a primary goal in many studies. Nevertheless, a key limitation of the technique is that distinguishing closely related species or accurately identifying multiple species in complex mixtures can be challenging, as overlapping fluorescent signals may complicate precise species discrimination [30]. Finally, Metagenomics is a powerful approach for studying bacterial diversity and composition in complex environmental samples and offers comprehensive insights into bacterial diversity and potential metabolic capabilities [31]. However, it is costly, generating large datasets requiring advanced bioinformatics and cannot distinguish between viable and non-viable bacteria [32].
Over the past two decades, various PCR-based techniques have been developed, including a new approach known as Digital PCR (dPCR) [33,34,35]. dPCR is a DNA quantification method that enables extremely precise and sensitive detection and quantification of nucleic acid molecules. This makes it particularly useful for detecting low-abundance targets. Unlike quantitative PCR (qPCR), which measures the accumulation of an amplified product in real time, digital PCR partitions a DNA sample into thousands of small individual reactions, some containing target DNA molecules and others not. Each partition acts as an independent PCR reaction. This partitioning process ensures that some reactions contain the target DNA molecules, while others do not. After amplification, the positive partitions, which emit a fluorescent signal, are counted to determine the absolute quantity of the target DNA initially present. One of the key advantages of dPCR is its precision and sensitivity; it provides absolute quantification without the need for standard curves, which is a requirement in traditional qPCR. Additionally, dPCR is less affected by PCR inhibitors, which are common in complex samples, leading to higher accuracy and reliability. Digital PCR (dPCR) could be divided into main methods: Digital PCR using droplets and Well-based digital PCR. Digital using droplet (ddPCR) divides the sample into thousands of nanoliter-sized droplets which can be separated and stabilized in an oil-based emulsion. After thermal cycling, the droplets pass through a capillary or detection system where they are individually counted and analyzed to determine whether they are positive (containing the target DNA) or negative (no target DNA). Well-based digital PCR, on the other hand, partitions the sample into hundreds or thousands of individual wells (e.g., on a chip or plate), with each well-functioning as a separate PCR microreaction. Fluorescence is then measured to determine which wells show successful amplification of the target sequence. Regardless of whether droplet-based or well-based digital PCR is used, the fundamental process is the same: the sample is partitioned into individual reaction units, and fluorescence is evaluated to identify positive reactions, highlighting the methodological similarity between the two approaches.
In this study, we aim to establish best practices for employing Crystal Digital PCRTM to provide a quantitative and absolute assessment of the number of individuals within a bacterial community, using the consortium formed by N. vulgaris and C. acetobutylicum as models. This work includes establishing quantification limits for a species within the population, investigating the impact of one species on the quantification of another, and finally utilizing this technique to measure the number of plasmids and chromosomes found in the cytoplasm of a bacterial species.

2. Materials and Methods

2.1. Strains, Media and Growth Conditions

N. vulgaris Hildenborough and C. acetobutylicum ATCC824 strains used in this study were sourced from NCIMB biotechnology (NCIMB 8303) and Henry-Pierre Fierrobe’s lab (LCB, UMR7283 CNRS-AMU, Marseille, France), respectively. Strains were grown to steady state in Hungate tubes under anaerobic conditions at 37 °C, in Starkey medium (SKY) containing 40 mM lactate and 28 mM sulfate for N. vulgaris [36] and 2YTG medium for C. acetobutylicum [7]. The growth medium glucose–yeast extract (GY) used for the consortium was prepared with 14 mM glucose and 0.1% yeast extract, supplemented with the same inorganic nutrients as in SKY medium [7]. GY medium was inoculated with either washed N. vulgaris, C. acetobutylicum, or both strains to reach different ratios based on their absorbance at 600 nm. All experiments were performed at least in triplicate.

2.2. DNA Extraction from Bacterial Culture

DNA from N. vulgaris and C. acetobutylicum pure cultures were extracted using the Wizard® Genomic DNA Purification Kit (Promega A1120, Promega Corporation, Madison, WI, USA). Briefly, 10 mL of each culture was centrifuged at 10,000× g for 10 min. The resulting pellet was resuspended in 600 µL of 50 mM EDTA (ethylenediaminetetraacetic acid) with 10 mg·mL−1 lysozyme and incubated at 37 °C for 1 h. DNA extraction was then carried out according to the manufacturer’s instructions. The final elution step was performed with 100 µL of pre-heated (55 °C) nuclease-free water. DNA extraction from the Controlled Mixed Community was performed using the GenEluteTM Bacterial Genomic DNA Kit (Sigma-Aldrich, NA2110, Saint Louis, MO, USA) following the manufacturer’s recommendations. Briefly, 1 mL of the mixed community was centrifuged at 10,000× g for 15 min directly after inoculation. The supernatants were removed, and the pellets were stored at −20 °C until use. To improve the lysis step, the Gram-Positive Bacterial Preparation protocol was selected and optimized as follows: (1) 200 µL of lysozyme solution (human lysozyme L1667, Sigma, Saint Louis, MO, USA) at a concentration of 10 mg·mL−1 was used; (2) the incubation with lysis solution C was extended to 20 min during the “Lyse Cells” step; and (3) elution was performed using 50 µL of pre-heated nuclease-free water (55 °C). DNA concentrations (in ng·µL−1) and quality were determined, using a NanodropTM 2000c spectrophotometer (Thermo Scientific, Waltham, MA, USA).

2.3. Identification of Species-Specific Genes and Primer Design

Species-specific genes for C. acetobutylicum and N. vulgaris were identified using OrthoFinder (version 3.1; https://github.com/OrthoFinder/OrthoFinder installed locally, accessed on 26 October 2025). Protein sequences were extracted from GenBank files AE001437.1 (C. acetobutylicum) and AE017285.1 (N. vulgaris) using Biopython and converted to FASTA format. OrthoFinder grouped proteins into orthologous clusters, and genes unique to each genome were identified from clusters containing proteins from only a single genome. DNA sequences of these unique genes were then used to design specific primers with Primer-BLAST (version 2.5.0; https://www.ncbi.nlm.nih.gov/tools/primer-blast/, accessed on 26 October 2025), selecting oligonucleotides with similar melting temperatures to ensure consistent amplification under identical PCR conditions.

2.4. PCR Experiment

Conventional PCR assays were carried out using a T100TM thermocycler (BioRad, Hercules, CA, USA) with 75 ng·µL−1 of bacterial DNA, 10 units of GO-Taq® polymerase, 1 mM dNTPs (New England Biolabs, Ipswich, MA, USA), and 0.5 µM of the primers specified in Table 1. The PCR reaction was conducted with the following cycling parameters: 95 °C for 2 min, followed by 40 cycles of 95 °C for 30 s, 58 °C for 30 s, and 72 °C for 30 s, followed by a final extension at 72 °C for 3 min. PCR products were separated on an agarose gel, stained with GelRed® (Hayward, CA, USA), and visualized under UV light. Quantitative PCR (qPCR) assays were performed on CFX96 TouchTM Real-Time PCR Detection System using SsoAdvancedTM Universal SYBR Green® Supermix (Bio Rad, Hercules, CA, USA) and 0.5 µM of the primers. The cycling parameters for the qPCR were as follows: 98 °C for 2 min, followed by 45 cycles of 96 °C for 20 s and 60 °C for 10 s. This was concluded with a final step at 95 °C for 3 min prior to establishing the melting curves. Crystal Digital PCRTM reactions were conducted in the GeodeTM thermocycler (Stilla Technologies, Villejuif, France), associated with the Fluigent® FLPG pressure generator (Fluigent, Le Kremlin-Bicêtre, Franc). In a final volume of 25 µL, the DNA samples were mixed with 9.375 µL of 2× PerfeCTa® qPCR ToughMix® (Quantabio, Beverly, MA, USA) solution, supplemented with 1 µL of Alexa 647 (Thermo Scientific, Waltham, MA, USA) at a concentration of 0.02 mg·mL−1, 1.9 µL of 20X EvaGreen® DNA-binding dye (Biotium, Fremont, CA, USA), and 0.5 µL of primers at a concentration of 20 µM. Once the reagents were added to the samples, a 25 µL deposit was made in the chamber entries of the Sapphire ChipsTM (Stilla Technologies, Villejuif, France). The amplification steps include partitioning the samples at 40 °C, followed by denaturation at 95 °C for 3 min. This is followed by 45 cycles of denaturation at 95 °C for 10 s, then a hybridization/elongation step at 60 °C for 15 s. After amplification, three cycles of pressure at 50 mbar to better separate the droplets were made and the Sapphire ChipsTM were carefully transferred to the Prism3 chipTM reader (Stilla Technologies, Villejuif, France) for analysis. The Crystal ReaderTM and Crystal MinerTM software (version 4.0.10.3) were used for reading and analyzing the chips.

3. Results

3.1. Primer Selection and Specificity Testing for Crystal Digital PCRTM

Crystal Digital PCRTM belongs to endpoint PCR techniques, where the final product is detected by a fluorescent intercalating molecule, such as EVAGreen, embedded in the double-stranded DNA obtained at the end of the PCR reaction. Nowadays, high-sensitivity fluorescence cameras permit the detection of weak fluorescence emissions, and methods like Crystal Digital PCRTM require very well-designed primers to avoid any nonspecific PCR products or primer dimer formation that could combine with the fluorescence dye and create false-positive results. Moreover, in the objective of using this technique to quantify bacterial species in a multispecies population, it is also crucial to avoid any cross-hybridization of primers between bacterial genomes. To demonstrate the utilization of Crystal Digital PCRTM for absolute quantification of a mixed bacterial population, we used a synthetic consortium composed of Gram-negative N. vulgaris and the Gram-positive C. acetobutylicum as a study model. In this consortium, the two bacteria can interact and exchange metabolites, allowing them to survive under nutritional stress [9].
Firstly, to limit primer cross-hybridization between bacterial genomes, we began by identifying specific genes of each bacterium using the OrthoFinder v3.1 [37], which allows the identification of common, orthologous, paralogous and unique genes between the genomes of N. vulgaris and C. acetobutylicum (see Section 2). Through this approach, we identified DVU_0169 (ABC transporter substrate-binding protein) and CA_C0825 (glycoside hydrolase family 5 protein) genes as specific to N. vulgaris and C. acetobutylicum genomes, respectively. These genes lack paralogs within their own genomes and do not have orthologs in other genomes. The DNA sequences of these genes were then used to design specific primers using the Primer-BLAST website, with careful attention to selecting oligonucleotides with similar melting temperatures to ensure consistent amplification under identical reaction conditions during Crystal Digital PCRTM. Even though PCR efficiency and amplicon product size are less restrictive as for Crystal Digital PCRTM than they are for qPCR, we chose primers yielding amplicon sizes around 200–250 bp and showing no homodimerization (Table 1).
Once the primers were designed, we began to verify their specificity to detect only their target genomes, as well as the absence of nonspecific PCR products including primer dimers. To validate our primer pairs, the genomic DNA of N. vulgaris and C. acetobutylicum were purified and used as templates for PCR, qPCR, and Crystal Digital PCRTM approaches. In the PCR, a concentration of 75 ng·µL−1 of genomic DNA from N. vulgaris and C. acetobutylicum was used as the template for amplification with the designed primers oLDDVU_0169 and oLDCA_C0825 (see Section 2). Subsequently, the PCR products were analyzed by agarose gel electrophoresis and visualized under UV light using GelRed dye. As shown in Figure 1, the primers for N. vulgaris and C. acetobutylicum successfully amplified only their respective target genomes, with no cross-amplification observed on the other genome. Furthermore, no amplification was observed in the water control, suggesting that none of the primer pairs formed dimers during the reaction.
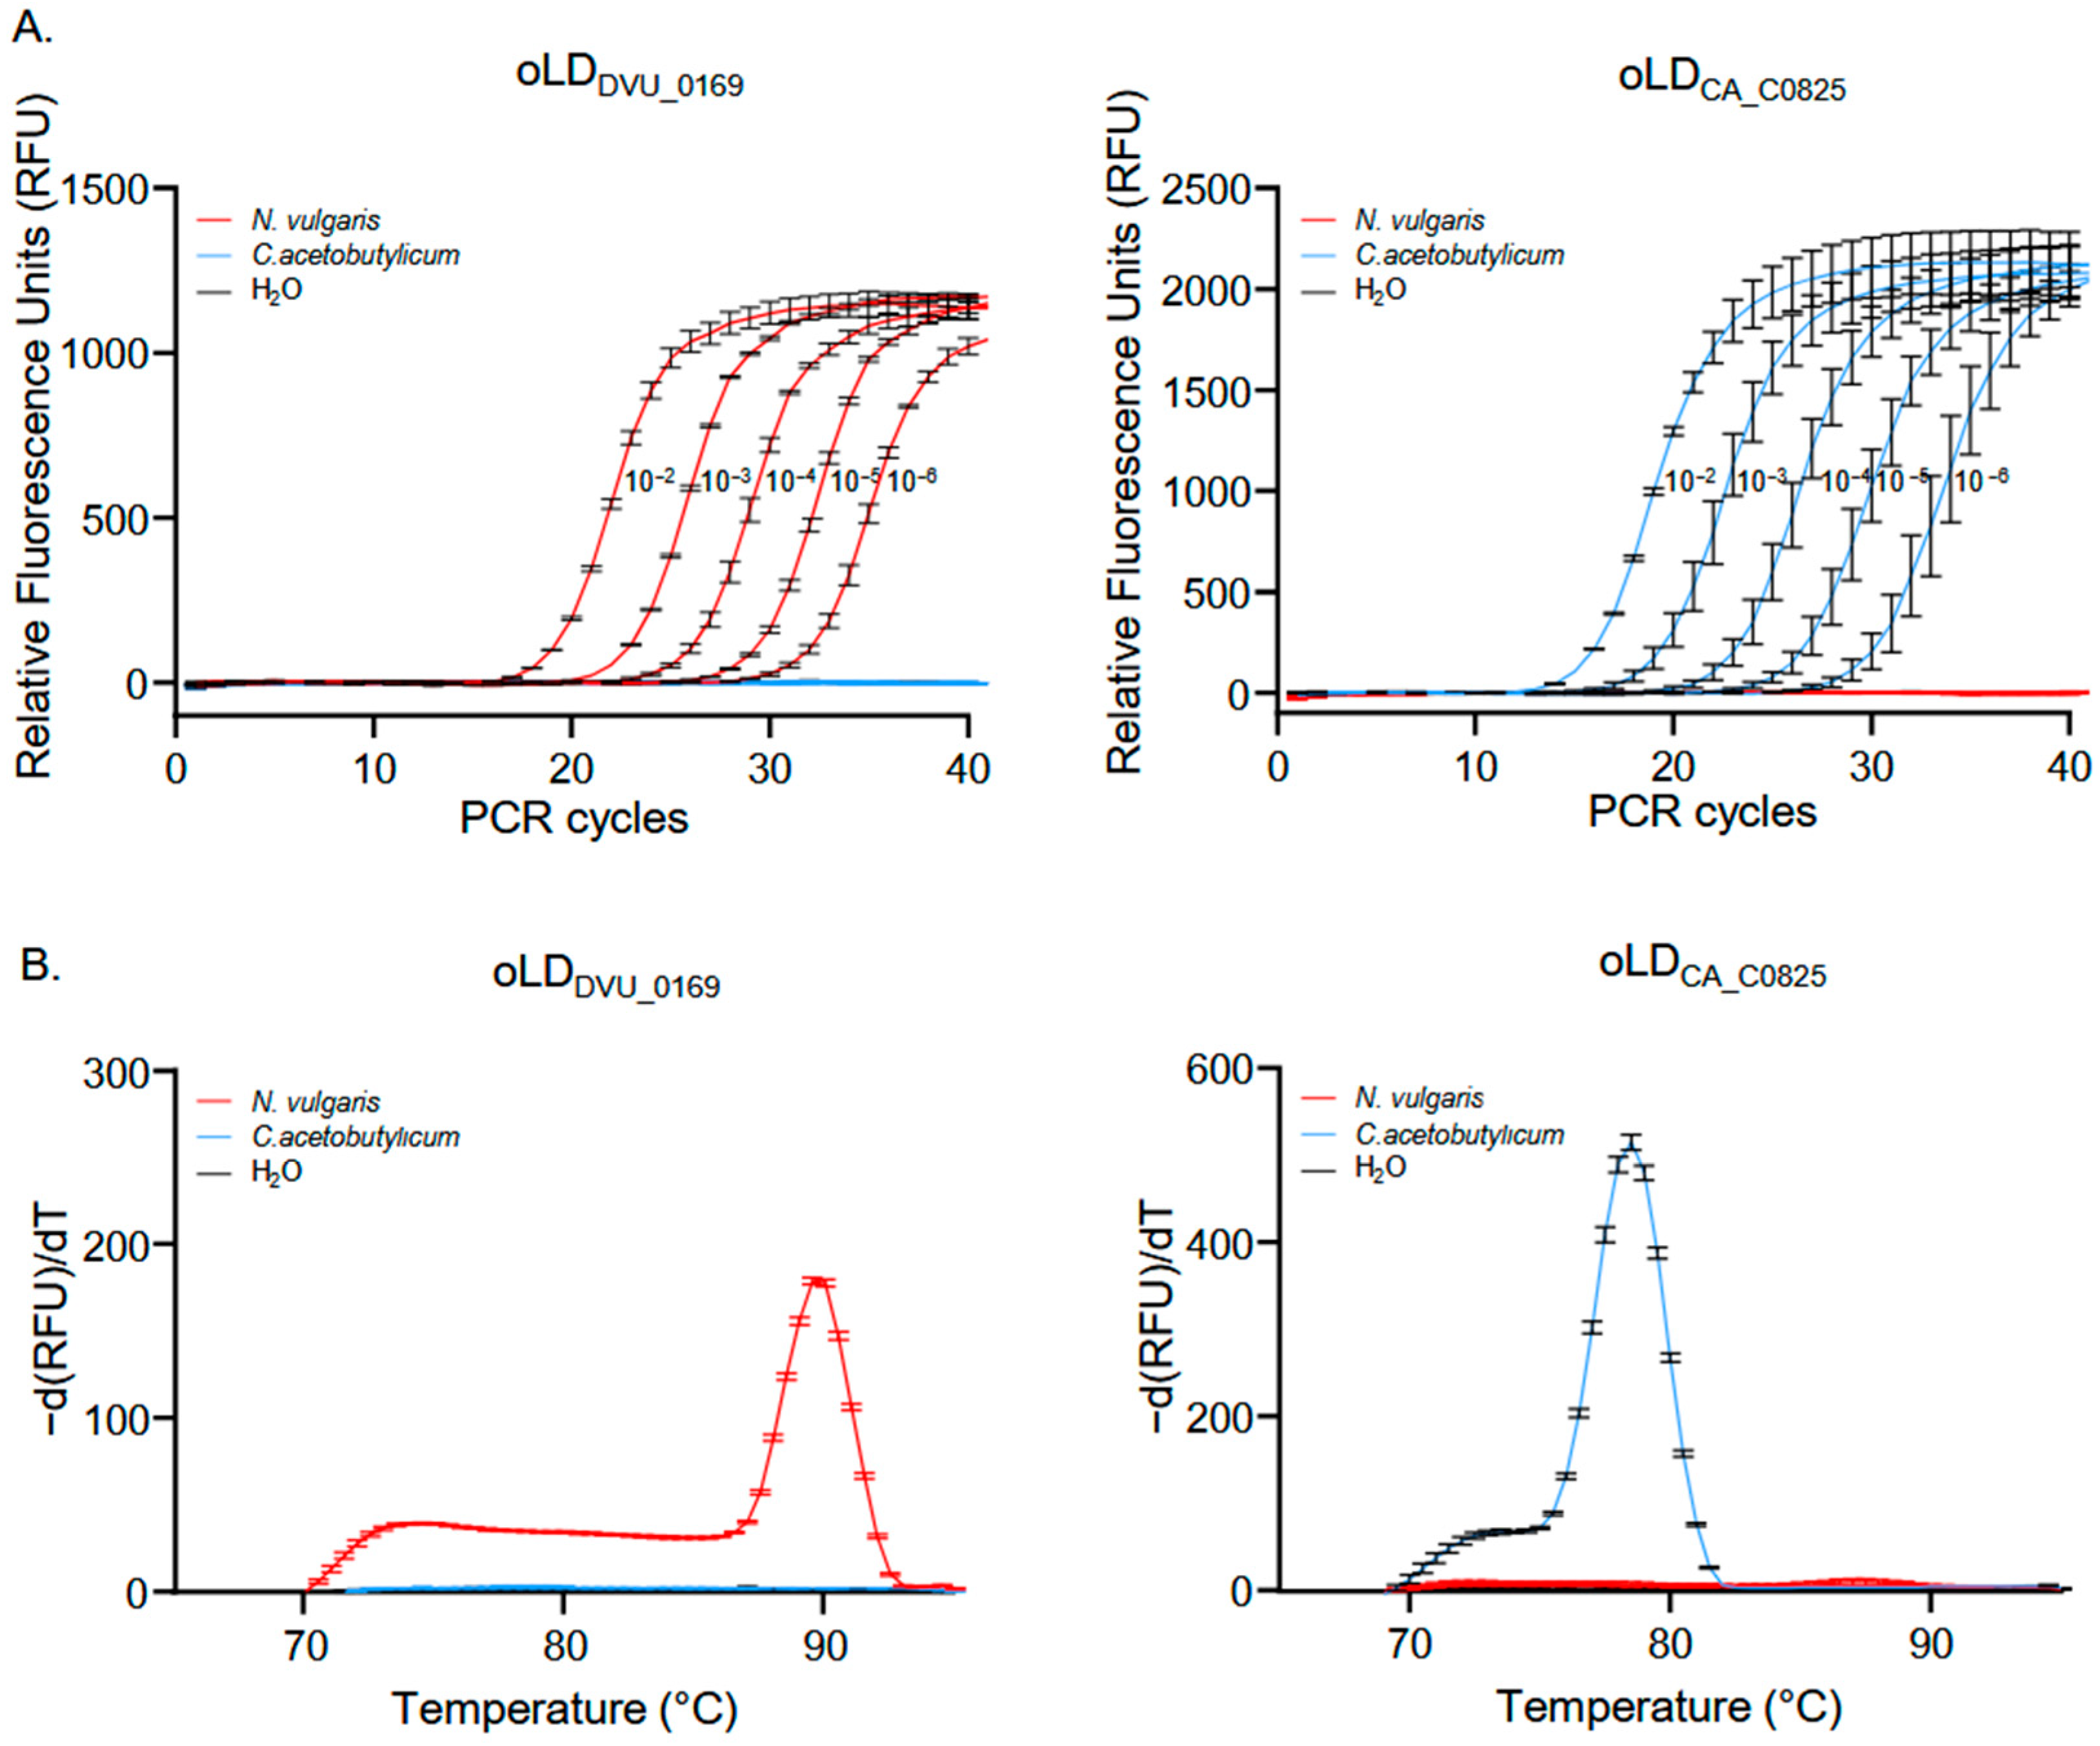
To validate these results and to assess whether DNA concentration affects the specificity and selectivity of our primers, a qPCR was conducted. An initial concentration of 500 ng·µL−1 of N. vulgaris and C. acetobutylicum DNA genomes was serially diluted from 10−2 to 10−6, followed by qPCR using our primers (see Section 2). As shown in Figure 2A, the N. vulgaris and C. acetobutylicum primers produce PCR products only in the presence of their target genomes, regardless of the initial DNA concentration, while no PCR products were detected in the water control. Furthermore, the analysis of the melting curves (Figure 2B) for the final PCR products reveals that only one PCR product is detected in the presence of the target genomes corresponding to our primers.
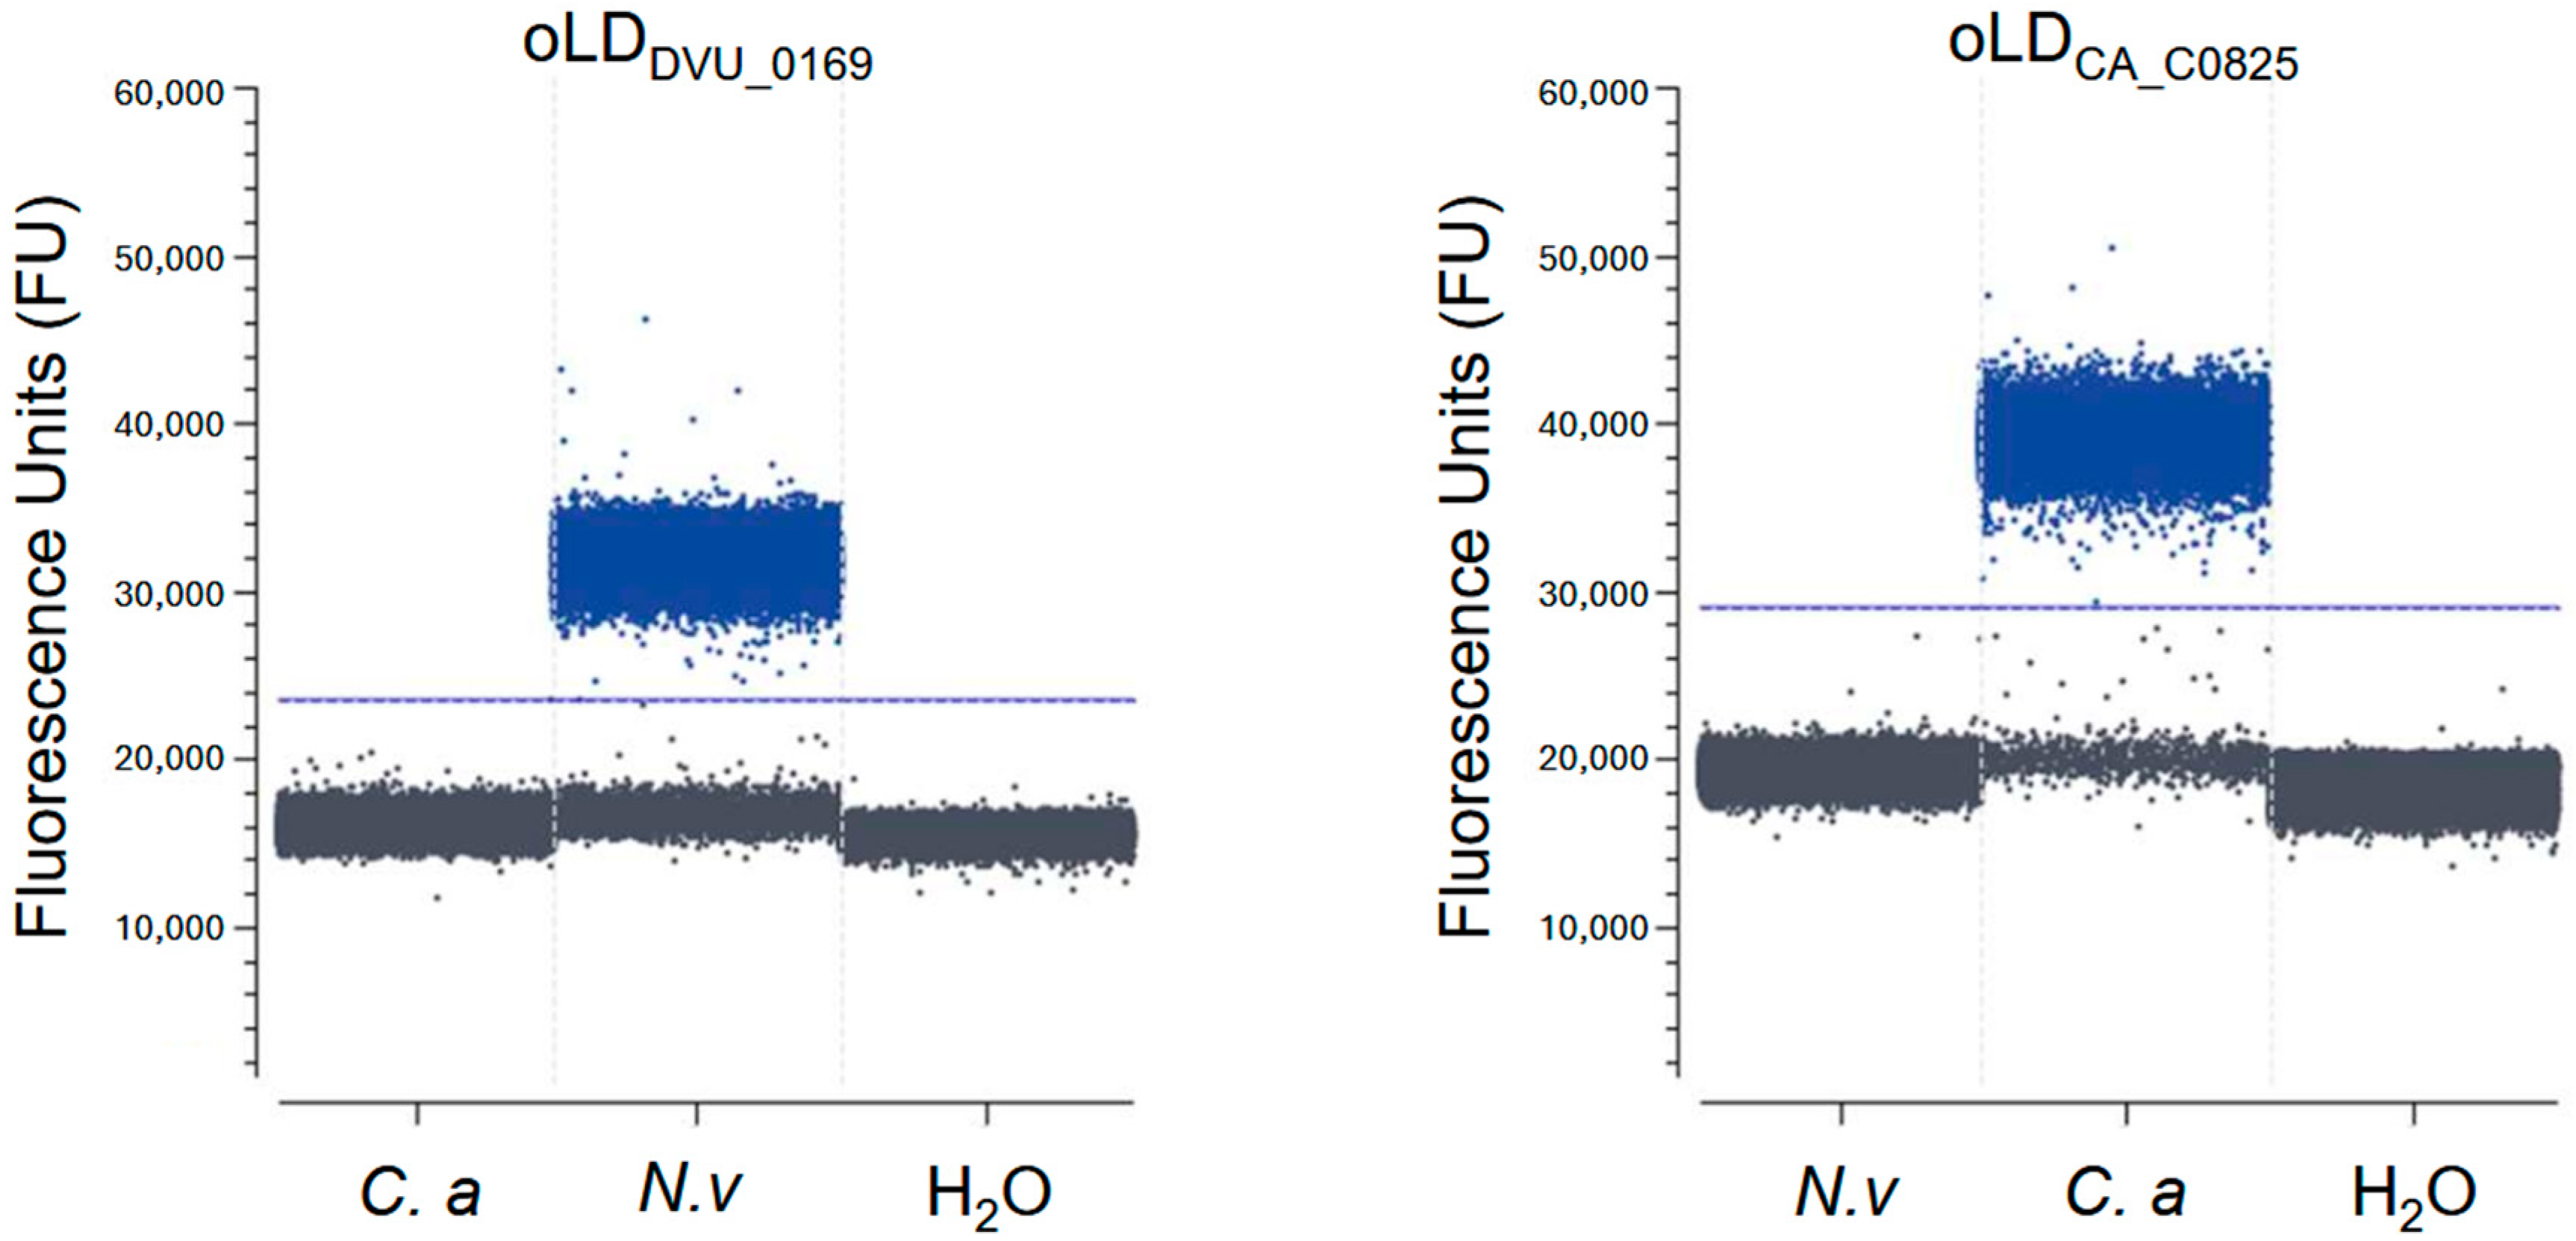
Moreover, no significant PCR products or primer dimerization were observed in the water control or in the presence of non-target genomic DNA. Finally, to evaluate the specificity of our primers in detecting only their target genomes, a Crystal Digital PCRTM was conducted. Our primer pairs were mixed with either water or bacterial genomes, and positive droplets were fluorescently detected and counted (Figure 3). The presence of positive droplets only when the primers are in the presence of their target genome confirms that the designed primers can specifically detect their target genome (N. vulgaris or C. acetobutylicum) without generating any non-specific amplicons or primer dimers detectable by digital PCR on the other genome.

3.2. Assessment of Crystal Digital PCRTM Sensitivity for Quantifying Mixed Genomes in Samples

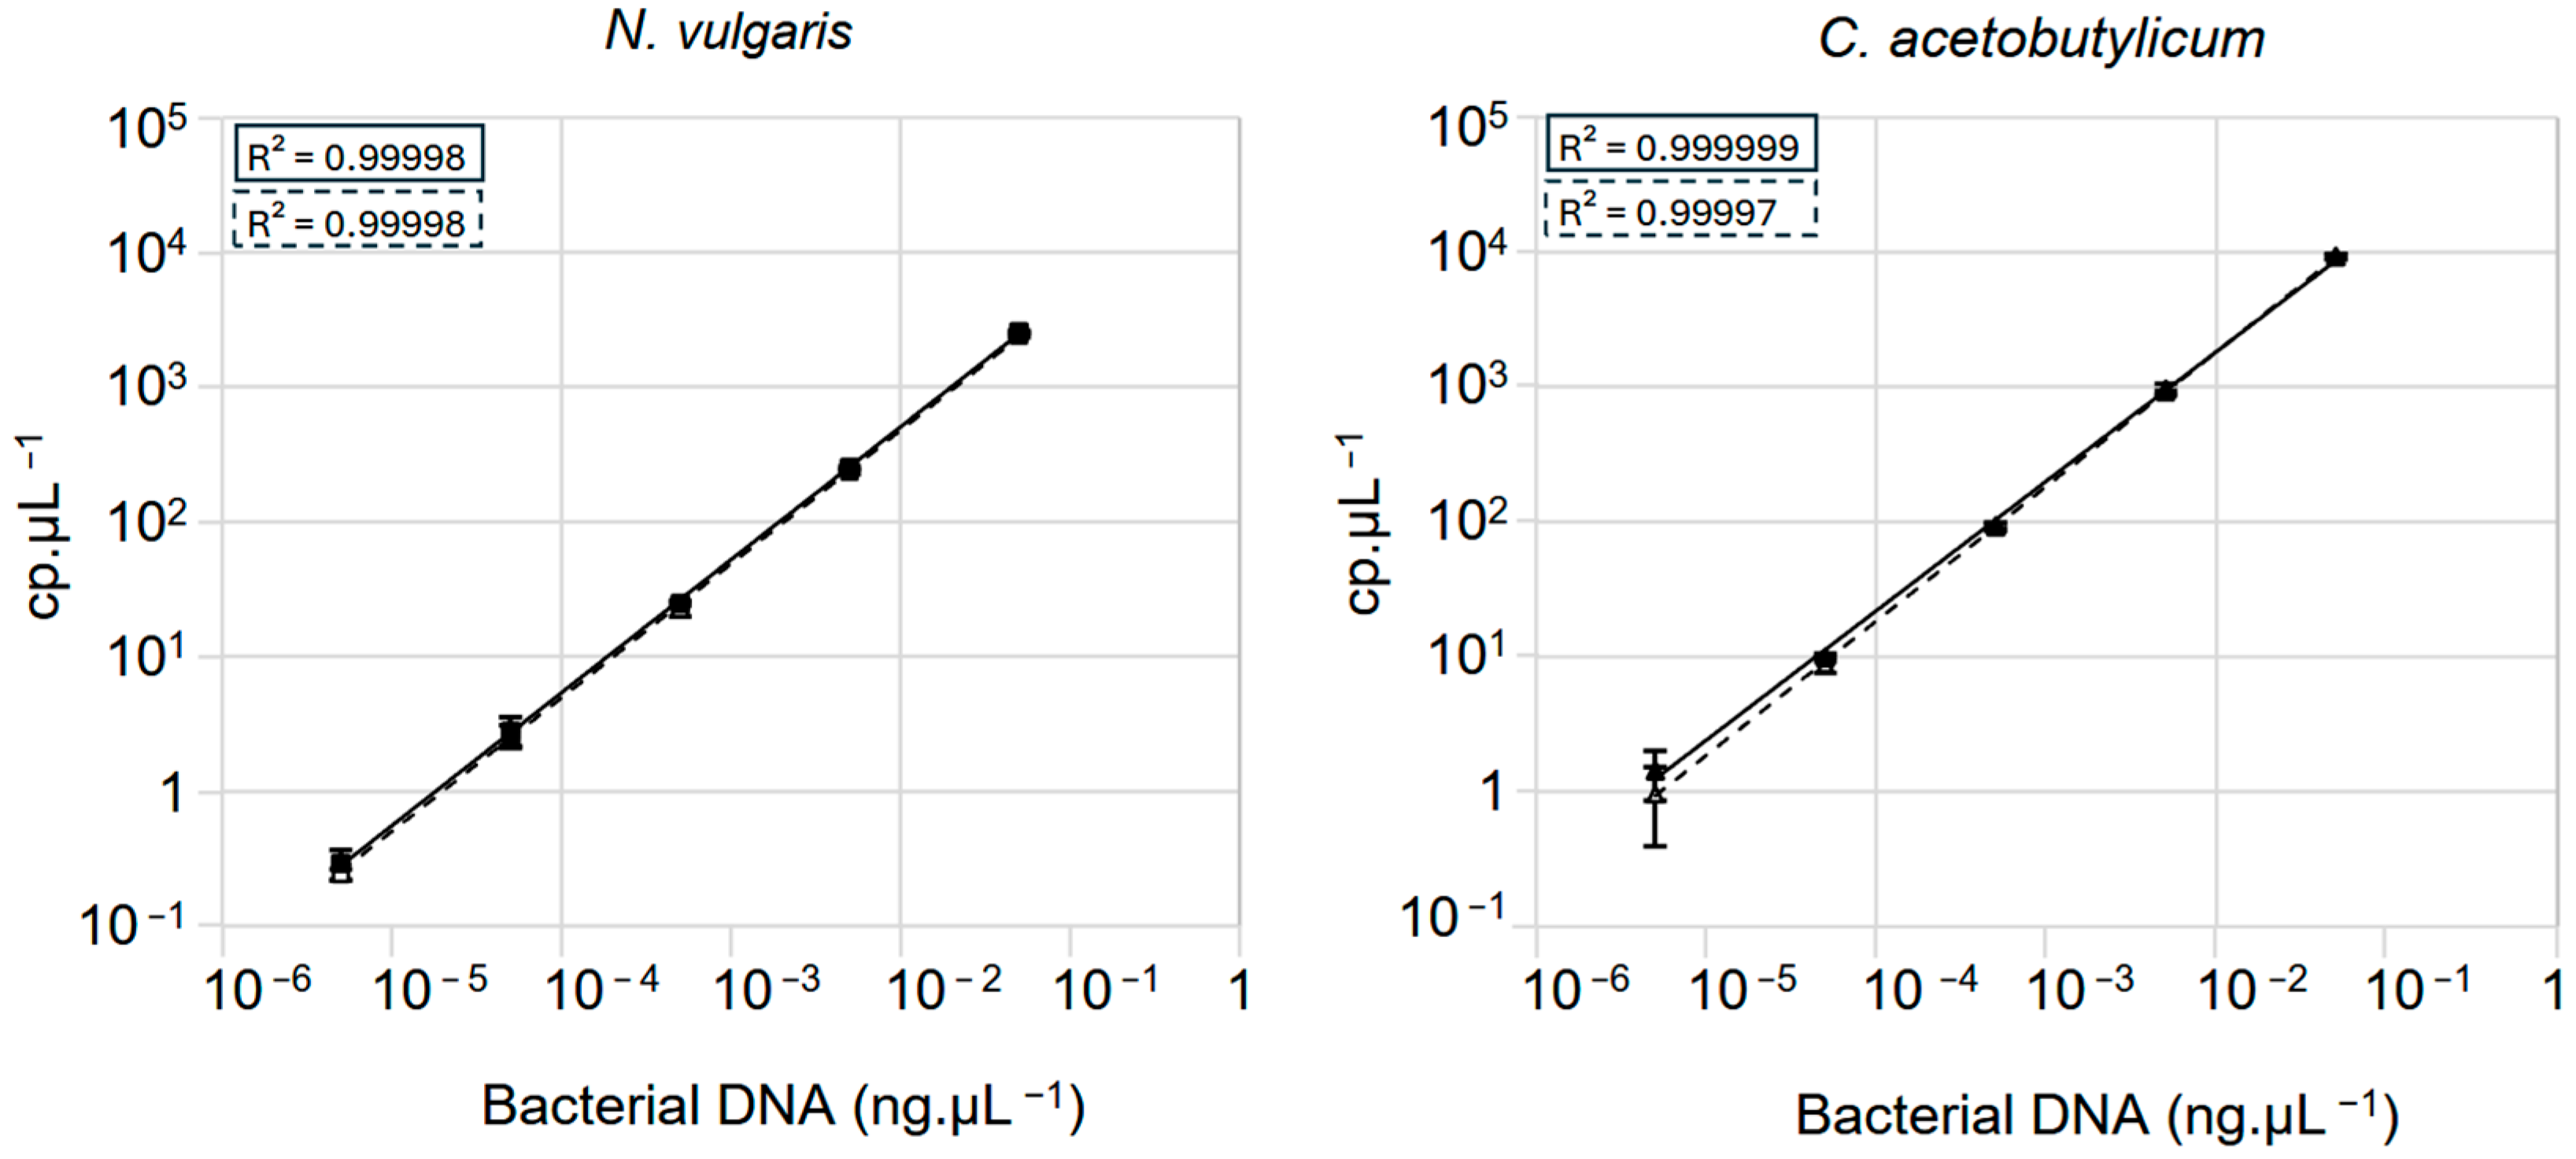
In mixed bacterial populations, the relative abundance of each species may vary, and some of them may be in the minority, present in only a few individuals among the others. Digital PCR technologies such as Crystal Digital PCRTM are described as being able to quantify genome copy numbers as low as 2 cp·µL−1 [38]. We therefore assessed the detection limit of Crystal Digital PCRTM for quantifying pure or mixed DNA samples, using our primer pairs on N. vulgaris and C. acetobutylicum DNA. We began by serially diluting, in tenfold steps, an initial quantity of 0.05 ng·µL−1 of N. vulgaris and C. acetobutylicum DNA until reaching a final concentration of 5 fg·µL−1. Then, these DNA samples were quantified by Crystal Digital PCRTM using the appropriate primers. The results demonstrate that for both primer pairs, we can detect a number of genome copies in the samples as low as 0.29 cp·µL−1 for N. vulgaris and 1.43 cp·µL−1 for C. acetobutylicum (Figure 4 solid line). Additionally, we also observe excellent linearity in DNA quantity in the samples, with a regression line showing an R2 value close to 1 (Figure 4). To determine whether the presence of another DNA genome in the reaction could alter the number of genome quantifications in the samples, we started to dilute the N. vulgaris genome to an amount ranging from 0.05 ng·µL−1 to 5 fg·µL−1 in a solution containing a fixed amount of C. acetobutylicum genome at 0.05 ng·µL−1. We then quantified the N. vulgaris DNA in these samples using oLDDVU_0169 by Crystal Digital PCRTM. As shown in Figure 4 (left panel, dashed line) the number of copies of the N. vulgaris genome in the presence of fixed amount C. acetobutylicum DNA is identical to the results obtained with N. vulgaris alone in the reaction, regardless of the ratio between the amount of N. vulgaris and C. acetobutylicum DNA in the reaction. A similar result was obtained when the C. acetobutylicum genome was diluted from 0.05 ng·µL−1 to 5 fg·µL−1 in a solution containing 0.05 ng·µL−1 of N. vulgaris DNA (Figure 4; right panel, dashed line).
Overall, our results demonstrate that Crystal Digital PCRTM technology can detect low quantities of DNA, down to 2 cp·µL−1, in mixed bacterial population samples. Furthermore, the presence of another DNA species in the reaction does not impact the quantification of the target DNA, highlighting the effectiveness of Crystal Digital PCRTM for accurately quantifying genomes in complex samples.

3.3. Bacterial Quantification in a Controlled Mixed Community

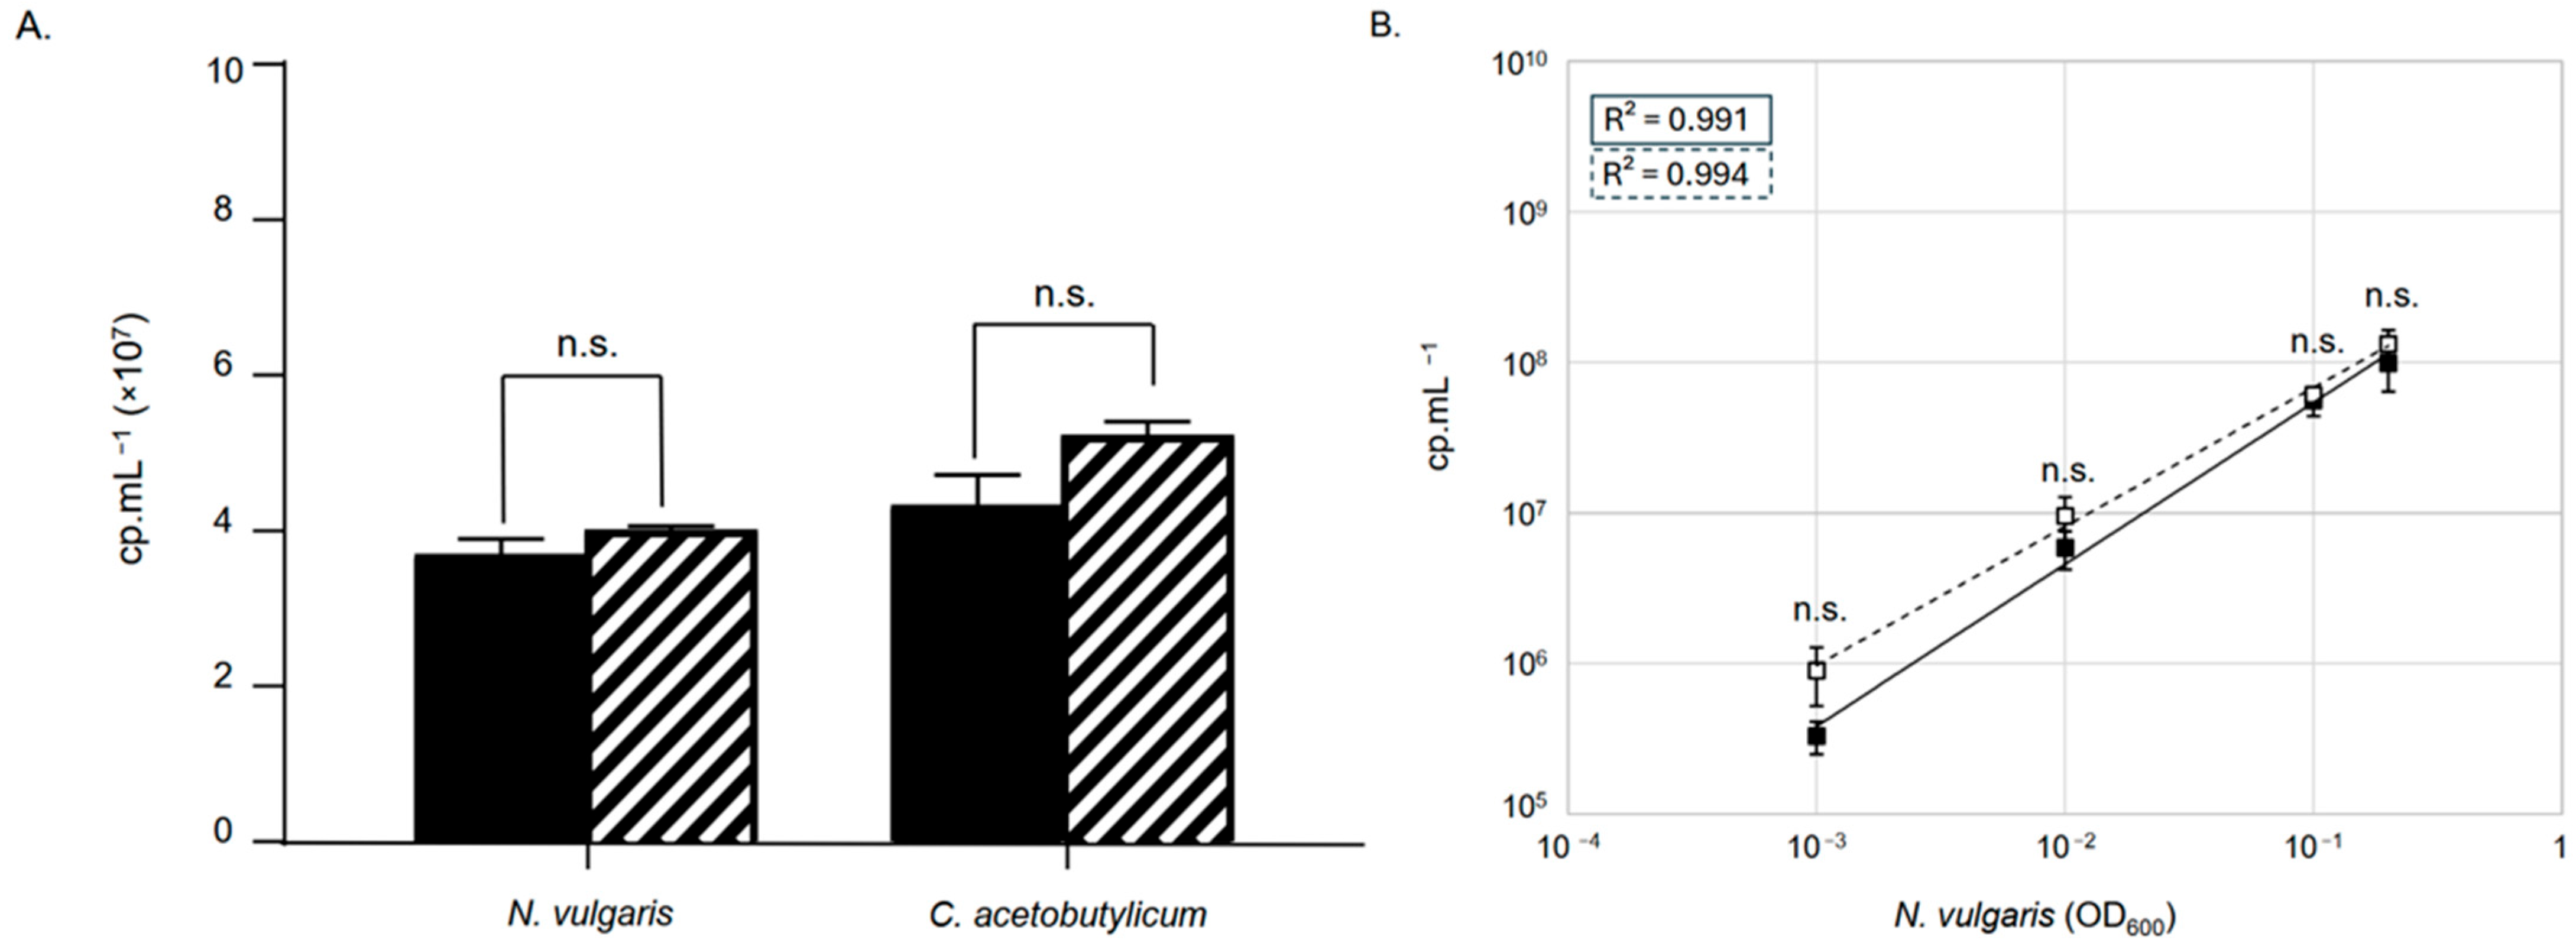
To determine whether the Crystal Digital PCRTM approach allows the quantification of different bacterial species within a bacterial consortium, we used the synthetic model consortium made of N. vulgaris and C. acetobutylicum. The aim is to assess whether we could quantify each bacterial species within the consortium and whether the presence of one organism influenced the detection of the other. For this, we created consortia with controlled bacterial proportions and tested their quantification using Crystal Digital PCRTM. Thus, the bacteria N. vulgaris and C. acetobutylicum were grown in SKY and 2YTG media, respectively, for 10 h until they reached the stationary growth phase (see Section 2). The optical density at 600 nm of each culture was measured, and then, they were diluted to an OD600 of 0.1 in a final volume of 10 mL GY medium. Three controlled consortia of N. vulgaris and C. acetobutylicum were prepared, each with a final volume of 10 mL and containing 0.1 units of optical density at 600 nm of each organism. Additionally, three tubes of 10 mL of pure cultures of N. vulgaris and C. acetobutylicum at 0.1 OD600 were prepared as controls. Then, the total DNA from 1 mL of pure and mixed cultures was extracted using the GenElute Bacterial Genomic DNA kit, following the manufacturer’s instructions. Then, the primer pairs oLDDVU_0169 and oLDCA_C0825 were used to quantify the genome copy number of N. vulgaris and C. acetobutylicum, both in pure cultures and in 1:1 co-culture. As shown in Figure 5A, mean genome quantities of 3.7 × 10⁷ cp·mL−1 and 4.3 × 10⁷ cp·mL−1 were detected in pure cultures at an OD600 of 0.1 for N. vulgaris and C. acetobutylicum, respectively. Similar quantification performed on the co-culture yielded mean values of 4.0 × 10⁷ cp·mL−1 and 5.2 × 10⁷ cp·mL−1 for N. vulgaris and C. acetobutylicum, respectively (Figure 5A). Thus, there is no significant difference in the number of genomes detected for each of the two organisms, whether in pure culture or co-culture, suggesting that the presence of one does not influence the quantification of the other. Next, we determined the detection limit for bacteria in culture and whether this detection is influenced by the presence of the other member of the consortium. We prepared several co-cultures, each with a final volume of 10 mL. These co-cultures contained a fixed OD600 of 1 for C. acetobutylicum along with a serial dilution of N. vulgaris, with OD600 values ranging from 0.2 to 0.001. For comparison, we also prepared control reaction tubes of 10 mL containing only N. vulgaris, serially diluted from 0.2 to 0.001. Subsequently, we extracted the total DNA from 1 mL of both the pure and mixed cultures and evaluated the number of N. vulgaris genomes using the primers oLDDVU_0169 (Figure 5B). The results obtained show a linear quantification with a regression coefficient R2 close to 1 for the number of N. vulgaris genomes present in the cultures, whether they contain a fixed amount of C. acetobutylicum or not. We do not observe a significant difference in the quantification of N. vulgaris genomes between the presence and absence of C. acetobutylicum in proportions of 1:1 and 1:1000.

3.4. Plasmid Quantification in N. vulgaris and C. acetobutylicum Cultures

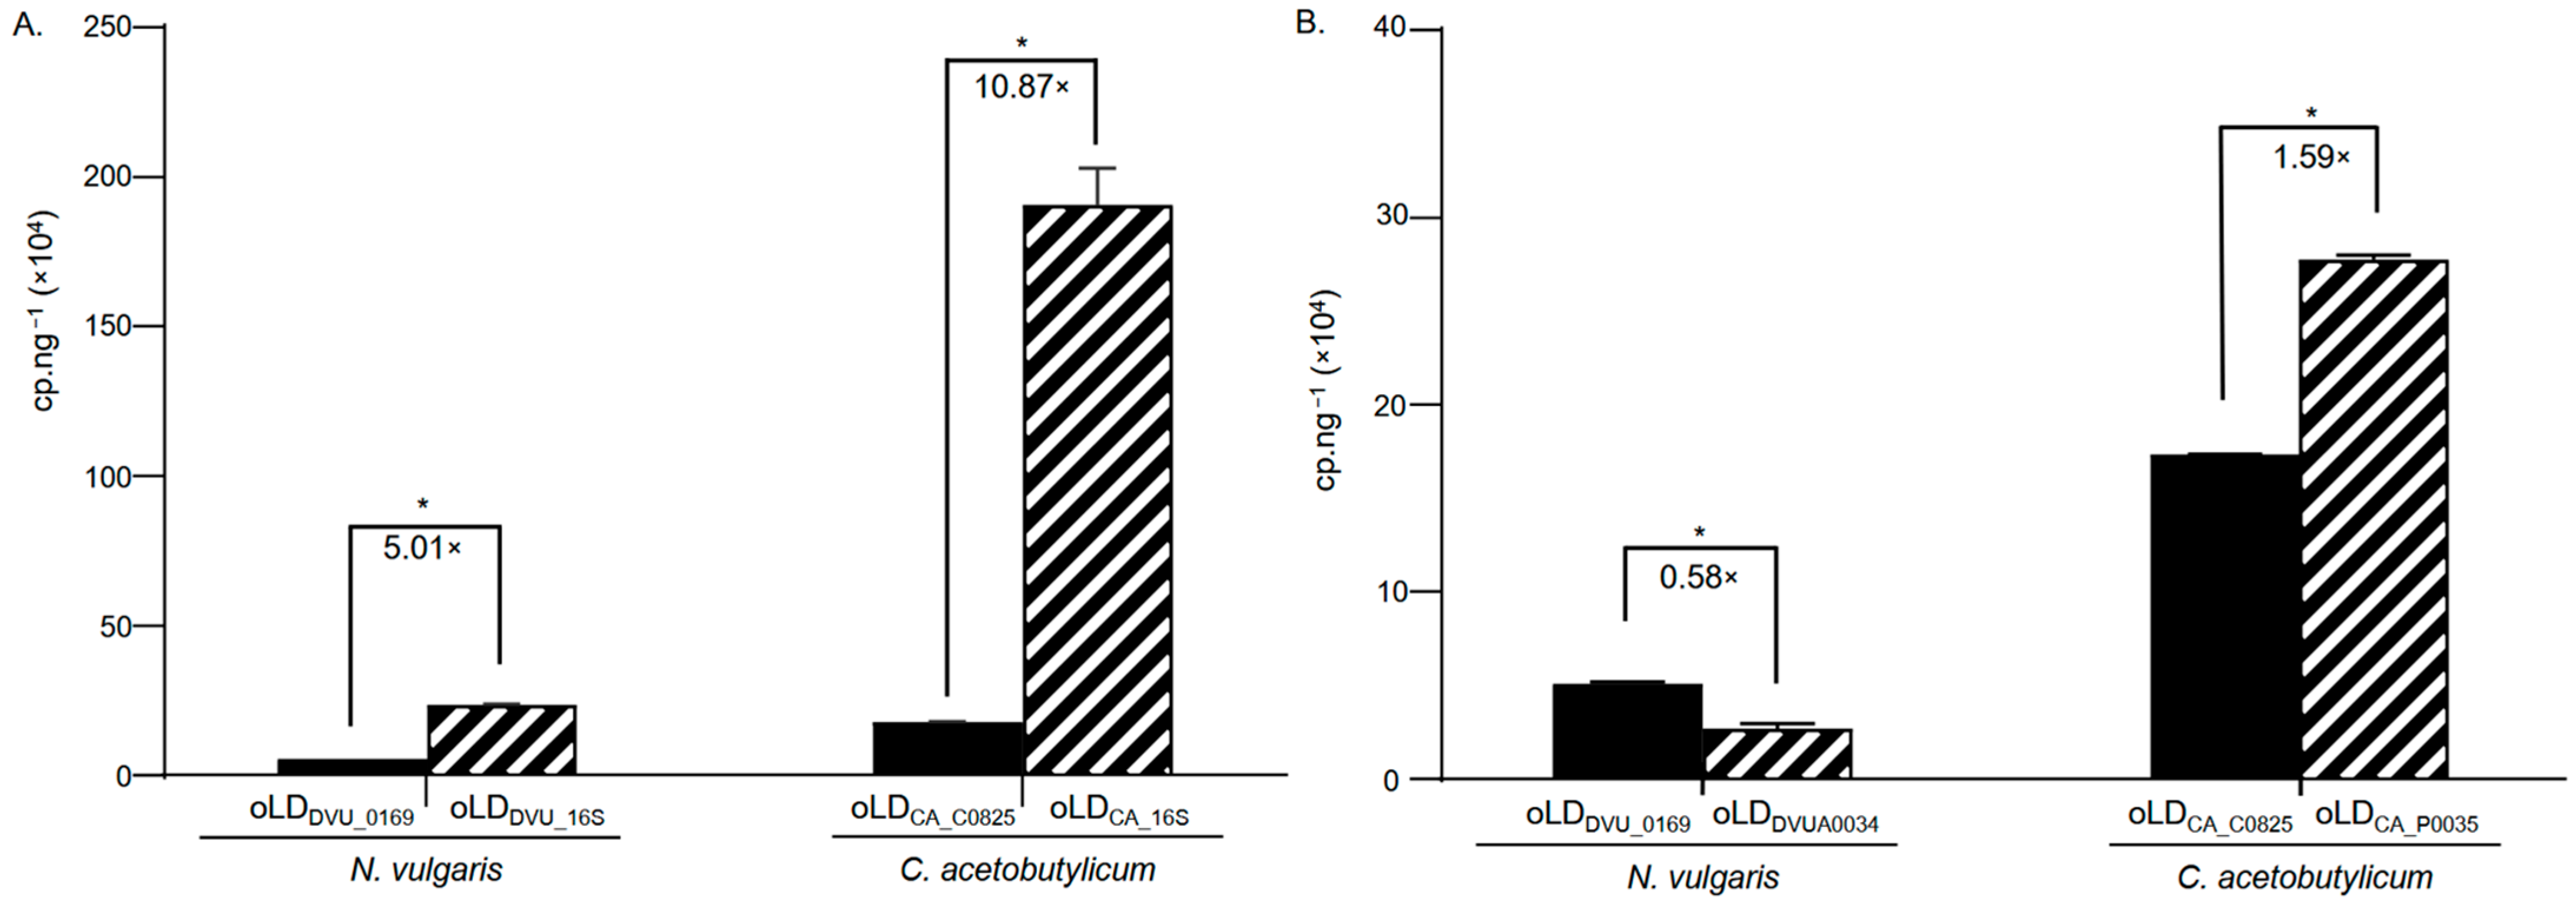
Genome sequencing of N. vulgaris and C. acetobutylicum revealed the presence of a megaplasmid in each strain, with a respective size of 202,301 bp and 192,000 bp, respectively [39,40]. However, the ratio between the number of plasmids and the number of chromosomes in the cytoplasm of these bacteria remains unknown. Indeed, qPCR quantification approaches are limited for reliably comparing two different DNA sequences within the same sample due to the necessity that the targeted sequences are amplified with comparable efficiency. Additionally, this method requires calibration curves to estimate copy numbers, which may introduce biases, making it difficult to directly compare the copy number of one gene to another. Crystal Digital PCRTM, which offers absolute quantification independent of calibration curves and PCR efficiency, appears to be a highly suitable tool for addressing this type of question. To verify this, we used Crystal Digital PCRTM to quantify the relative copy number of plasmids in N. vulgaris and C. acetobutylicum compared to the copy number of their respective genomes. We first validated the ability of Crystal Digital PCRTM to detect differences in copy number between a single-copy gene and genes present in multiple copies on the same chromosome. Thus, we measured and compared the copy numbers of the DVU_0169 and CA_C0825 single copy genes of N. vulgaris and C. acetobutylicum relative to the multicopy numbers of their respective 16S rRNA encoding genes. A pair of PCR primers targeting the 16S rRNA of N. vulgaris (oLDDVU_16S) and C. acetobutylicum (oLDCA_16S) was designed and verified for specificity, following the different PCR approaches conducted for the primer pairs targeting DVU_0169 and CA_C0825 genes (Table 1). Then, an amount of 0.005 ng·µL−1 of DNA extracted from the strains of N. vulgaris and C. acetobutylicum was used, respectively, with primers oLDDVU_0169 and oLDDVU_16S, and oLDCA_C0825 and oLDCA_16S, to compare the copy number of the single-copy genes DVU_0169 and CA_C0825 to the copy number of the multicopy genes DVU_16S and CA_16S. As shown in Figure 6A, there is an average ratio of 5.02 and 10.87, respectively, for N. vulgaris and C. acetobutylicum between the copy number of unique genes and the copy number of multicopy genes. These results correspond to the expected ratios, since N. vulgaris and C. acetobutylicum have 5 and 11 copies of the gene encoding for 16S rRNA in their respective genomes. Since Crystal Digital PCRTM allows for determining the quantitative ratio between different DNA sequences in the same sample, we used it to assess the ratio between the number of plasmids, and the number of chromosomes present in the cytoplasm of N. vulgaris and C. acetobutylicum. By following the same approach that allowed us to design the primer pairs oLDDVU_0169 and oLDCA_C0825, we designed the primers oLDDVUA0034 and oLDCA_P0035, targeting the genes DVUA0034 and CA_P0035 present on the megaplasmids of N. vulgaris and C. acetobutylicum, respectively (Table 1). These primers were then used in Crystal Digital PCRTM on an extract of 0.05 ng·µL−1 of DNA from each bacterium to determine the quantitative ratio between the copy number of chromosomes and the copy number of plasmids. As shown in Figure 6B, there is an average ratio of 0.58 between the number of plasmids and the number of chromosomes in the cytoplasm of N. vulgaris and an average ratio of 1.59 for C. acetobutylicum, respectively.

4. Discussion

Bacterial consortia are involved in the major processes of life. In consequence a reliable, fast and efficient counting method is essential to understand and decipher the behavior of these consortia and to use them in biotechnological developments [41]. However, while it might seem like a straightforward task, it can prove to be quite challenging in certain contexts. This is particularly true when working with non-culturable bacteria, extremophiles, mixed cultures, or those forming aggregates or biofilms, which are often difficult to analyze using conventional techniques [19,42]. The results of this study demonstrate that the Crystal Digital PCRTM method is an effective tool for detecting and quantifying bacterial populations within mixed communities. In this work, we demonstrated that it is possible to quantify down to a single bacterial genome per µL of sample. We also showed that this quantification is not affected by the presence of DNA from another organism, even when the ratio between the DNA quantities of the organisms is as low as 1:10,000 with using only biological triplicate. However, like all PCR-based techniques, this method requires attention to two key aspects to ensure robust results. The first point is the reproducibility of DNA extraction across different bacterial strains to ensure accurate and comparable quantification. This requires efficient and consistent bacterial lysis, as well as careful attention to avoid overloading silica membrane columns, which can become saturated and lead to underestimation of DNA yield. Maintaining extractions within a validated input range is key to preserving linearity between the number of cells and the amount of recovered DNA. Furthermore, when aiming to correlate genome copy number with actual cell counts, it is important to ensure that the quantified DNA truly reflects cellular DNA and not extracellular contamination. In this context, the removal of free DNA prior to extraction, for instance by DNase I treatment, can help improve the specificity of the measurement [24]. The second point of vigilance is that this method requires an extremely rigorous design of oligonucleotides following a highly stringent pipeline. Indeed, it is crucial that the oligonucleotides specifically hybridize to their target organism and do not form primer dimers. Here, we ensured specificity by selecting unique genes for each organism based on genomes comparison. However, this approach can also be applied to DNA sequences that are specific to a species and absent from other organisms, without targeting a particular gene. It can thus be used for intergenic regions or genetically added markers in a chromosome, allowing differentiation between different strains. This strategy can be particularly useful in Crystal Digital PCRTM experiments to assess fitness differences between two variants of the same species, for example. The importance of this design increases with the complexity of the environment, particularly when many different organisms are present. Indeed, Crystal Digital PCRTM, as a final-point PCR technique, only provides information on the presence or absence of DNA amplification in a droplet. It does not allow for determining the size of the product, or the melting temperature of the amplification product within the droplet. Consequently, even minimal nonspecific amplification, caused by the formation of primer dimers or nonspecific primer hybridization to different genomes in the sample, can result in fluorescent droplets that skew the quantification results. However, this technique offers significant advantages over qPCR. Firstly, Crystal Digital PCRTM demonstrates greater resistance to inhibitors, such as proteins or chemical compounds present in the sample, making it a reliable method for analyzing complex matrices [43,44,45]. Additionally, its capacity for absolute quantification enables direct comparison of different experiments without the need for normalization using standard curves, as required in qPCR. This feature also simplifies data comparison between laboratories or across extended time periods, as it eliminates the need for standardization using specific calibration curves. At last, dPCR offers higher sensitivity, enabling highly precise quantification at very low concentrations from a limited number of measurements in small samples, whereas qPCR, although theoretically capable of absolute quantification, requires a substantially larger number of data points to achieve comparable precision. In this study, we used the bacterial consortium composed of N. vulgaris and C. acetobutylicum as models. However, the quantification of organisms by Crystal Digital PCRTM on populations can be adapted to various contexts, including, for example, bacterial competition experiments to evaluate interactions between different species, as well as fitness studies to determine if a strain that has acquired or lost a fragment of DNA or single nucleotide polymorphisms (SNPs) exhibits a fitness difference when co-cultured with the wild-type strain from which it is derived [46].
This work also demonstrates that Crystal Digital PCRTM is an effective technique for quantifying the number of gene copies within the same genome, as illustrated by our results on the quantification of the 16S gene in the C. acetobutylicum and N. vulgaris strains. Thanks to Crystal Digital PCRTM, we were able to confirm, in accordance with predictions based on the genome annotations of these two organisms, the existence of a 5:1 ratio for N. vulgaris and an 11:1 ratio for C. acetobutylicum between the number of copies of the 16S genes and the single-copy genes DVU_0169 and CA_C0825. This allowed us to determine for the first time the plasmid copy number in C. acetobutylicum and N. vulgaris relative to the chromosome copy number. The results show that the proportion between the number of plasmids and chromosomes is not equivalent in the cytoplasm and may, in some cases, reflect variability in the ratio of plasmid copies to chromosome copies within individuals of the same population. For C. acetobutylicum, an average plasmid-to-chromosome ratio of 1.5 was observed. This imbalance may reflect heterogeneity in plasmid copy number among cells within the population for instance, some cells may maintain a 1:1 ratio of plasmid to chromosome, while others contain additional plasmid copies. Another plausible explanation involves differences in replication timing between the chromosome and the plasmid. Plasmid replication is known to occur independently and asynchronously with the bacterial cell cycle [47,48], meaning that plasmid duplication is not strictly coordinated with chromosomal replication. As a result, cells at different stages of growth may transiently contain more or fewer plasmid copies relative to their chromosomal content. When measured across an entire population, this asynchrony can lead to apparent deviations from a 1:1 ratio even if each cell maintains a stable average number of plasmids. Such variability is consistent with population-level measurements, which integrate signals from cells in diverse replication states. For N. vulgaris, the observed ratio of 0.5 could arise from several non-exclusive explanations. One possibility is that cells harbor multiple chromosomal copies per cell, as previously estimated for N. vulgaris (~4 genomes per cell) [49] when the bacteria are grown under specific culture conditions, leading to a lower apparent plasmid-to-chromosome ratio even if each cell contains at least one plasmid. This study also indicates that the copy number can vary depending on the growth phase, highlighting that plasmid-to-chromosome ratios are influenced by both chromosomal multiplicity and the physiological state of the cells. Alternatively, population heterogeneity or asynchronous replication between the chromosome and plasmid could result in transient variations in plasmid copy number.
Crystal Digital PCRTM is an effective technique for quantifying gene copy numbers and has the potential to be widely applied in various areas, including the quantification of transposable element copies, copy number of genes encoding rRNA, etc. Transposable elements, which replicate through a copy-paste mechanism, are often present in large numbers within genomes. This abundance makes their accurate quantification challenging but now Crystal Digital PCRTM can address this issue. At least, as Crystal Digital PCRTM allows for the quantification of gene copies relative to the number of chromosomes, this technique can be applied to measure horizontal gene transfer (HTG) and can be useful for studying, for example, the transfer of ICEs (Integrative and Conjugative Elements), plasmids via conjugation, and the dissemination of these genetic elements within a bacterial population.

5. Conclusions

In conclusion, the Crystal Digital PCRTM method is a powerful and reliable approach for quantifying bacterial populations, even in complex settings such as mixed communities. Its high sensitivity and precision make it particularly well suited for synthetic microbial consortia, where the species composition is predefined and primers can be carefully designed to target specific sequences. This targeted approach allows for accurate quantification and monitoring of each member within the consortium, facilitating detailed studies of microbial interactions and dynamics. However, when applying dPCR to natural or environmental consortia, its utility becomes more limited. The inherent complexity and diversity of these communities, combined with incomplete or insufficient knowledge of the species present, pose significant challenges for primer design. Without comprehensive genomic information, there is an increased risk of cross-hybridization and non-specific amplification, which can lead to erroneous quantification and misinterpretation of species abundance. Moreover, as dPCR relies on DNA amplification, it cannot differentiate between DNA originating from live, metabolically active cells and DNA from dead or dormant bacteria. Consequently, dPCR may detect residual DNA from species that are no longer viable or actively participating in the community, thus reflecting historical presence rather than current activity. This limitation is particularly critical in environments where DNA persists for extended periods after cell death, potentially biasing assessments of community structure and functional dynamics.

Author Contributions

Conceptualization C.B., M.R. (Magali Roger), M.-T.G.-O. and J.S.; methodology Y.D. and L.B.; validation, L.B.; formal analysis L.B., L.D. and Y.D.; investigation, L.D., M.R. (Magali Roger), L.B., M.R. (Mila Reset); writing—original draft preparation C.B., M.R. (Magali Roger), M.-T.G.-O. writing—review and editing, C.B., M.R. (Mila Reset), M.R. (Magali Roger), M.-T.G.-O., J.S., L.B., Y.D. and L.D.; supervision, C.B. and M.R. (Magali Roger); funding acquisition, C.B. and M.-T.G.-O. All authors have read and agreed to the published version of the manuscript.

Funding

C.B., M.R (Magali Roger)., J.S., L.B., Y.D. and M.-T.G.-O. are supported by the CNRS, the AMIDEX foundation from Aix-Marseille University, and the Microbiology, Bioenergies, and Biotechnology Institute (IM2B). LD is supported by a PhD grant from the IM2B Institute (AO-IM2B-CD-2021-DELECOURT). M.R (Mila Reset) is supported by a PhD grant from CNRS-Africa Joint Research Programme. This work was supported by a French government grant managed by the Agence Nationale de la Recherche under the France 2030 program reference ANR-22-PEBB-0004, and the CNRS-Africa Joint Research Programme.

Institutional Review Board Statement

Not applicable.

Informed Consent Statement

Not applicable.

Data Availability Statement

The original contributions presented in this study are included in the article. Further inquiries can be directed to the corresponding authors.

Conflicts of Interest

The authors declare no conflicts of interest.

References

  1. Bramucci, M.; Nagarajan, V. Bacterial Communities in Industrial Wastewater Bioreactors. Curr. Opin. Microbiol. 2006, 9, 275–278. [Google Scholar] [CrossRef] [PubMed]
  2. Jiang, L.-L.; Zhou, J.-J.; Quan, C.-S.; Xiu, Z.-L. Advances in Industrial Microbiome Based on Microbial Consortium for Biorefinery. Bioresour. Bioprocess. 2017, 4, 11. [Google Scholar] [CrossRef]
  3. Wang, D.; Hunt, K.A.; Candry, P.; Tao, X.; Wofford, N.Q.; Zhou, J.; McInerney, M.J.; Stahl, D.A.; Tanner, R.S.; Zhou, A.; et al. Cross-Feedings, Competition, and Positive and Negative Synergies in a Four-Species Synthetic Community for Anaerobic Degradation of Cellulose to Methane. mBio 2023, 14, e03189-22. [Google Scholar] [CrossRef]
  4. Contreras-Salgado, E.A.; Sánchez-Morán, A.G.; Rodríguez-Preciado, S.Y.; Sifuentes-Franco, S.; Rodríguez-Rodríguez, R.; Macías-Barragán, J.; Díaz-Zaragoza, M. Multifaceted Applications of Synthetic Microbial Communities: Advances in Biomedicine, Bioremediation, and Industry. Microbiol. Res. 2024, 15, 1709–1727. [Google Scholar] [CrossRef]
  5. Mittermeier, F.; Bäumler, M.; Arulrajah, P.; García Lima, J.d.J.; Hauke, S.; Stock, A.; Weuster-Botz, D. Artificial Microbial Consortia for Bioproduction Processes. Eng. Life Sci. 2023, 23, e2100152. [Google Scholar] [CrossRef]
  6. Sgobba, E.; Wendisch, V.F. Synthetic Microbial Consortia for Small Molecule Production. Curr. Opin. Biotechnol. 2020, 62, 72–79. [Google Scholar] [CrossRef]
  7. Benomar, S.; Ranava, D.; Cárdenas, M.L.; Trably, E.; Rafrafi, Y.; Ducret, A.; Hamelin, J.; Lojou, E.; Steyer, J.-P.; Giudici-Orticoni, M.-T. Nutritional Stress Induces Exchange of Cell Material and Energetic Coupling between Bacterial Species. Nat. Commun. 2015, 6, 6283. [Google Scholar] [CrossRef] [PubMed]
  8. Marbehan, X.; Roger, M.; Fournier, F.; Infossi, P.; Guedon, E.; Delecourt, L.; Lebrun, R.; Giudici-Orticoni, M.T.; Delaunay, S. Combining Metabolic Flux Analysis with Proteomics to Shed Light on the Metabolic Flexibility: The Case of Desulfovibrio vulgaris Hildenborough. Front. Microbiol. 2024, 15, 1336360. [Google Scholar] [CrossRef] [PubMed]
  9. Ranava, D.; Backes, C.; Karthikeyan, G.; Ouari, O.; Soric, A.; Guiral, M.; Cárdenas, M.L.; Giudici-Orticoni, M.T. Metabolic Exchange and Energetic Coupling between Nutritionally Stressed Bacterial Species: Role of Quorum-Sensing Molecules. mBio 2021, 12, e02758-20. [Google Scholar] [CrossRef]
  10. Daly, A.J.; Baetens, J.M.; De Baets, B. The Impact of Initial Evenness on Biodiversity Maintenance for a Four-Species in Silico Bacterial Community. J. Theor. Biol. 2015, 387, 189–205. [Google Scholar] [CrossRef]
  11. Ehsani, E.; Hernandez-Sanabria, E.; Kerckhof, F.-M.; Props, R.; Vilchez-Vargas, R.; Vital, M.; Pieper, D.H.; Boon, N. Initial Evenness Determines Diversity and Cell Density Dynamics in Synthetic Microbial Ecosystems. Sci. Rep. 2018, 8, 340. [Google Scholar] [CrossRef]
  12. Ferrari, A.; Lombardi, S.; Signoroni, A. Bacterial Colony Counting by Convolutional Neural Networks. In Proceedings of the 2015 37th Annual International Conference of the IEEE Engineering in Medicine and Biology Society (EMBC), Milan, Italy, 25–29 August 2015; pp. 7458–7461. [Google Scholar] [CrossRef]
  13. Kerstens, M.; Boulet, G.; Tritsmans, C.; Horemans, T.; Hellings, M.; Delputte, P.; Maes, L.; Cos, P. Flow Cytometric Enumeration of Bacteria Using TO-PRO®-3 Iodide as a Single-Stain Viability Dye. J. Lab. Autom. 2014, 19, 555–561. [Google Scholar] [CrossRef]
  14. Inoue, Y.; Nakaho, K. Sensitive Quantitative Detection of Ralstonia Solanacearum in Soil by the Most Probable Number-Polymerase Chain Reaction (MPN-PCR) Method. Appl. Microbiol. Biotechnol. 2014, 98, 4169–4177. [Google Scholar] [CrossRef]
  15. Lee, J.; Kim, H.S.; Jo, H.Y.; Kwon, M.J. Revisiting Soil Bacterial Counting Methods: Optimal Soil Storage and Pretreatment Methods and Comparison of Culture-Dependent and -Independent Methods. PLoS ONE 2021, 16, e0246142. [Google Scholar] [CrossRef]
  16. Madigan, M.T.; Bender, K.S.; Buckley, D.H.; Sattley, W.M.; Stahl, D.A. Brock Biology of Microorganisms, 16th ed.; Prentice Hall: Upper Saddle River, NJ, USA, 2020. [Google Scholar]
  17. Amann, R.I.; Ludwig, W.; Schleifer, K.H. Phylogenetic Identification and in Situ Detection of Individual Microbial Cells without Cultivation. Microbiol. Rev. 1995, 59, 143–169. [Google Scholar] [CrossRef] [PubMed]
  18. Lewis, W.H.; Tahon, G.; Geesink, P.; Sousa, D.Z.; Ettema, T.J.G. Innovations to Culturing the Uncultured Microbial Majority. Nat. Rev. Microbiol. 2021, 19, 225–240. [Google Scholar] [CrossRef] [PubMed]
  19. Vartoukian, S.R.; Palmer, R.M.; Wade, W.G. Strategies for Culture of “unculturable” Bacteria. FEMS Microbiol. Lett. 2010, 309, 1–7. [Google Scholar] [CrossRef]
  20. Smith, C.J.; Osborn, A.M. Advantages and Limitations of Quantitative PCR (Q-PCR)-Based Approaches in Microbial Ecology. FEMS Microbiol. Ecol. 2009, 67, 6–20. [Google Scholar] [CrossRef]
  21. Green, M.R.; Sambrook, J. Analysis and Normalization of Real-Time Polymerase Chain Reaction (PCR) Experimental Data. Cold Spring Harb. Protoc. 2018, 2018, pdb-top095000. [Google Scholar] [CrossRef]
  22. Bustin, S.A.; Benes, V.; Garson, J.A.; Hellemans, J.; Huggett, J.; Kubista, M.; Mueller, R.; Nolan, T.; Pfaffl, M.W.; Shipley, G.L.; et al. The MIQE Guidelines: Minimum Information for Publication of Quantitative Real-Time PCR Experiments. Clin. Chem. 2009, 55, 611–622. [Google Scholar] [CrossRef] [PubMed]
  23. Ruijter, J.M.; Ramakers, C.; Hoogaars, W.M.H.; Karlen, Y.; Bakker, O.; van den Hoff, M.J.B.; Moorman, A.F.M. Amplification Efficiency: Linking Baseline and Bias in the Analysis of Quantitative PCR Data. Nucleic Acids Res. 2009, 37, e45. [Google Scholar] [CrossRef]
  24. Nocker, A.; Camper, A.K. Selective Removal of DNA from Dead Cells of Mixed Bacterial Communities by Use of Ethidium Monoazide. Appl. Environ. Microbiol. 2006, 72, 1997–2004. [Google Scholar] [CrossRef]
  25. Müller, S.; Nebe-von-Caron, G. Functional Single-Cell Analyses: Flow Cytometry and Cell Sorting of Microbial Populations and Communities. FEMS Microbiol. Rev. 2010, 34, 554–587. [Google Scholar] [CrossRef] [PubMed]
  26. Wang, Y.; Hammes, F.; Boon, N.; Chami, M.; Egli, T. Isolation and Characterization of Low Nucleic Acid (LNA)-Content Bacteria. ISME J. 2009, 3, 889–902. [Google Scholar] [CrossRef]
  27. Veal, D.A.; Deere, D.; Ferrari, B.; Piper, J.; Attfield, P.V. Fluorescence Staining and Flow Cytometry for Monitoring Microbial Cells. J. Immunol. Methods 2000, 243, 191–210. [Google Scholar] [CrossRef]
  28. Power, A.L.; Barber, D.G.; Groenhof, S.R.M.; Wagley, S.; Liu, P.; Parker, D.A.; Love, J. The Application of Imaging Flow Cytometry for Characterisation and Quantification of Bacterial Phenotypes. Front. Cell. Infect. Microbiol. 2021, 11, 716592. [Google Scholar] [CrossRef]
  29. Hammes, F.; Berney, M.; Wang, Y.; Vital, M.; Köster, O.; Egli, T. Flow-Cytometric Total Bacterial Cell Counts as a Descriptive Microbiological Parameter for Drinking Water Treatment Processes. Water Res. 2008, 42, 269–277. [Google Scholar] [CrossRef] [PubMed]
  30. Props, R.; Monsieurs, P.; Mysara, M.; Clement, L.; Boon, N. Measuring the Biodiversity of Microbial Communities by Flow Cytometry. Methods Ecol. Evol. 2016, 7, 1376–1385. [Google Scholar] [CrossRef]
  31. Quince, C.; Walker, A.W.; Simpson, J.T.; Loman, N.J.; Segata, N. Shotgun Metagenomics, from Sampling to Analysis. Nat. Biotechnol. 2017, 35, 833–844, Erratum in Nat. Biotechnol. 2017, 35, 1211. [Google Scholar] [CrossRef]
  32. Emerson, J.B.; Adams, R.I.; Román, C.M.B.; Brooks, B.; Coil, D.A.; Dahlhausen, K.; Ganz, H.H.; Hartmann, E.M.; Hsu, T.; Justice, N.B.; et al. Schrödinger’s Microbes: Tools for Distinguishing the Living from the Dead in Microbial Ecosystems. Microbiome 2017, 5, 86. [Google Scholar] [CrossRef]
  33. Fang, W.; Liu, X.; Maiga, M.; Cao, W.; Mu, Y.; Yan, Q.; Zhu, Q. Digital PCR for Single-Cell Analysis. Biosensors 2024, 14, 64. [Google Scholar] [CrossRef]
  34. Zhang, L.; Parvin, R.; Fan, Q.; Ye, F. Emerging Digital PCR Technology in Precision Medicine. Biosens. Bioelectron. 2022, 211, 114344. [Google Scholar] [CrossRef]
  35. Quan, P.-L.; Sauzade, M.; Brouzes, E. dPCR: A Technology Review. Sensors 2018, 18, 1271. [Google Scholar] [CrossRef]
  36. Starkey, R.L. Characteristics and Cultivation of Sulfate-Reducing Bacteria. J. Am. Water Works Assoc. 1948, 40, 1291–1298. [Google Scholar] [CrossRef]
  37. Emms, D.M.; Kelly, S. OrthoFinder: Phylogenetic Orthology Inference for Comparative Genomics. Genome Biol. 2019, 20, 238. [Google Scholar] [CrossRef] [PubMed]
  38. Poggio, P.; Songia, P.; Vavassori, C.; Ricci, V.; Banfi, C.; Barbieri, S.S.; Garoffolo, G.; Myasoedova, V.A.; Piacentini, L.; Raucci, A.; et al. Digital PCR for High Sensitivity Viral Detection in False-Negative SARS-CoV-2 Patients. Sci. Rep. 2021, 11, 4310. [Google Scholar] [CrossRef] [PubMed]
  39. Heidelberg, J.; Seshadri, R.; Haveman, S.; Hemme, C.; Paulsen, I.; Kolonay, J.; Eisen, J.; Ward, N.; Methe, B.; Brinkac, L.; et al. The Genome Sequence of the Anaerobic, Sulfate-Reducing Bacterium Desulfovibrio Vulgaris Hildenborough. Nat. Biotechnol. 2004, 22, 554–559. [Google Scholar] [CrossRef]
  40. Mo, X.; Pei, J.; Guo, Y.; Lin, L.; Peng, L.; Kou, C.; Fan, D.; Pang, H. Genome Sequence of Clostridium Acetobutylicum GXAS18-1, a Novel Biobutanol Production Strain. Genome Announc. 2015, 3, e00033-15. [Google Scholar] [CrossRef]
  41. Cavaliere, M.; Feng, S.; Soyer, O.S.; Jiménez, J.I. Cooperation in Microbial Communities and Their Biotechnological Applications. Environ. Microbiol. 2017, 19, 2949–2963. [Google Scholar] [CrossRef]
  42. Stewart, E.J. Growing Unculturable Bacteria. J. Bacteriol. 2012, 194, 4151–4160. [Google Scholar] [CrossRef]
  43. Sidstedt, M.; Rådström, P.; Hedman, J. PCR Inhibition in qPCR, dPCR and MPS—Mechanisms and Solutions. Anal. Bioanal. Chem. 2020, 412, 2009–2023. [Google Scholar] [CrossRef]
  44. Dingle, T.C.; Sedlak, R.H.; Cook, L.; Jerome, K.R. Tolerance of Droplet-Digital PCR vs Real-Time Quantitative PCR to Inhibitory Substances. Clin. Chem. 2013, 59, 1670–1672. [Google Scholar] [CrossRef]
  45. Liu, H.; Shi, K.; Feng, S.; Yin, Y.; Long, F.; Si, H. Development of a Crystal Digital RT-PCR for the Detection of Atypical Porcine Pestivirus. Vet. Sci. 2023, 10, 330. [Google Scholar] [CrossRef] [PubMed]
  46. Pinheiro, L.B.; Coleman, V.A.; Hindson, C.M.; Herrmann, J.; Hindson, B.J.; Bhat, S.; Emslie, K.R. Evaluation of a Droplet Digital Polymerase Chain Reaction Format for DNA Copy Number Quantification. Anal. Chem. 2012, 84, 1003–1011. [Google Scholar] [CrossRef] [PubMed]
  47. del Solar, G.; Giraldo, R.; Ruiz-Echevarría, M.J.; Espinosa, M.; Díaz-Orejas, R. Replication and Control of Circular Bacterial Plasmids. Microbiol. Mol. Biol. Rev. MMBR 1998, 62, 434–464. [Google Scholar] [CrossRef] [PubMed]
  48. Nordström, K.; Dasgupta, S. Copy-Number Control of the Escherichia Coli Chromosome: A Plasmidologist’s view. EMBO Rep. 2006, 7, 484–489. [Google Scholar] [CrossRef]
  49. Postgate, J.R. The Sulfate-Reducing Bacteria, 2nd ed.; Cambridge University Press: Cambridge, UK; Scientific Research Publishing: Wuhan, China, 1984; Available online: https://www.scirp.org/reference/referencespapers?referenceid=1617902 (accessed on 31 October 2025).
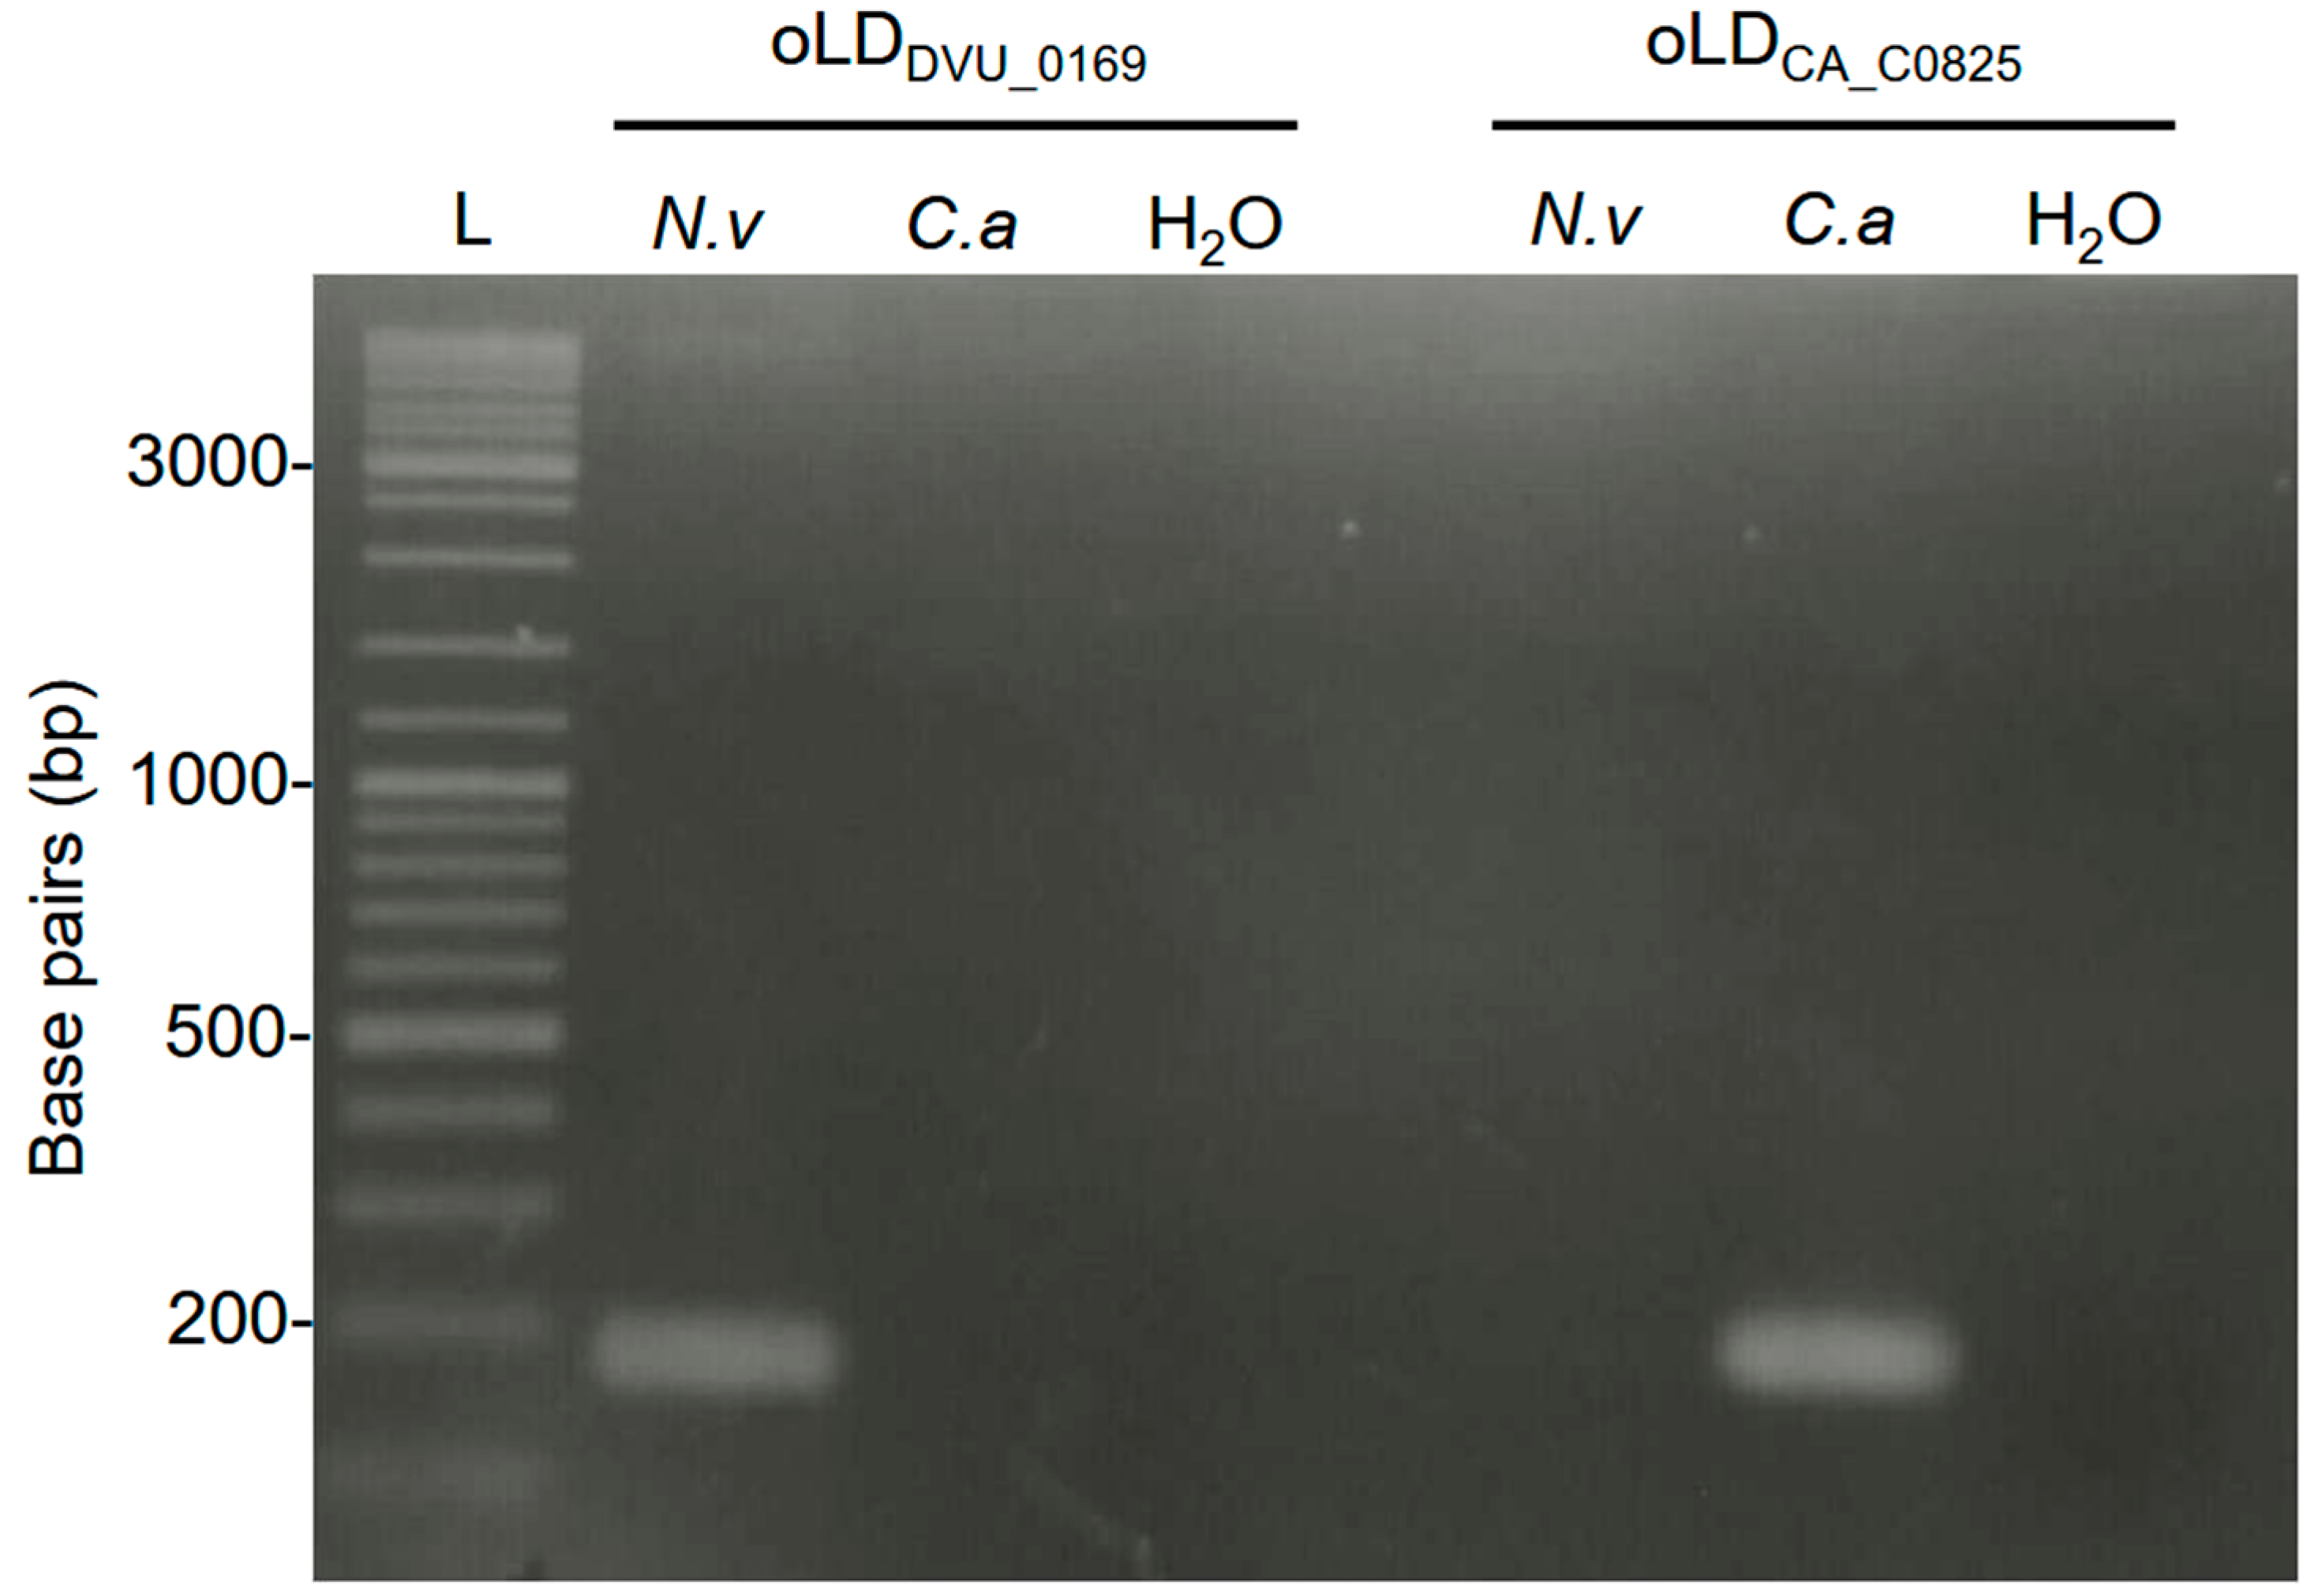
Figure 1. Agarose gel electrophoresis (2% agarose) of PCR-amplified products using species-specific primer sets. Results obtained with the oLDDVU_0169 primer pair on N. vulgaris (N.v), C. acetobutylicum (C.a), and water (H2O) are shown, together with those from the oLDCA_C08025 primer pair under identical conditions. Lane L contains 5 µL of Thermo Scientific™ GeneRuler™ DNA Ladder Mix.
Microorganisms 13 02592 g001
Figure 2. Verification of primers pair specificity using qPCR. (A) Amplification curves generated by oLDDVU_0169 (left panel) and oLDCA_C0825 (right panel) on N. vulgaris and C. acetobutylicum genomes at different concentrations, with water (H2O) as a negative control. (B) Melting curves of the PCR products obtained at the end of qPCR with primers on N. vulgaris, C. acetobutylicum, and water (H2O) with oLDDVU_0169 (left panel) and oLDCA_C0825 (right panel). Mean values and standard deviations (error bars) are shown, calculated from three independent biological replicates.
Microorganisms 13 02592 g002
Figure 3. Specificity assay of primer pairs using Crystal Digital PCRTM. Number and fluorescence intensities of droplets at the end of the Crystal Digital PCRTM reaction generated by oLDDVU_0169 (left panel) and oLDCA_C0825 (right panel) on N. vulgaris (N.v) and C. acetobutylicum (C.a) genomes at different concentrations, with water (H2O) as a negative control.
Microorganisms 13 02592 g003
Figure 4. Detection threshold test in the presence or absence of exogenous DNA. The linearity of Crystal Digital PCRTM quantification was evaluated by analyzing serial dilutions of DNA extracted from N. vulgaris (left panel) and C. acetobutylicum (right panel). Results are presented for both the presence (dashed line/box) and absence (solid line/box) of exogenous DNA at a fixed concentration of 0.05 ng/µL. Mean values and standard deviations (error bars) are shown, calculated from three independent biological replicates.
Microorganisms 13 02592 g004
Figure 5. Bacterial quantification in pure or mixed culture. (A) Quantification of 0.1 OD600 units of N. vulgaris and C. acetobutylicum in pure cultures (black bar) or in mixed cultures at a 1:1 ratio (hashed bars). (B) Quantification of varying amounts of N. vulgaris, ranging from 0.2 to 0.001 OD600 units, in pure culture (solid line/box) or mixed with a fixed amount of 1 OD600 unit of C. acetobutylicum (dashed line/box). Mean values and standard deviations (error bars) are shown, calculated from three independent biological replicates. Statistical significance was assessed using the Wilcoxon–Mann–Whitney test; n.s. referred as not-significant.
Microorganisms 13 02592 g005
Figure 6. Quantitative comparison of the copy numbers of two distinct DNA sequences within the same DNA sample from N. vulgaris and C. acetobutylicum. (A) Quantification of unique genes (black bar) and multicopy 16S encoding genes (hashed bar) present in the same bacterial genome. (B) Quantification of chromosome copy numbers (black bar) and plasmid copy numbers (hashed bar). Mean values and standard deviations (error bars) are shown, calculated from three independent biological replicates. Statistical significance was assessed using the Wilcoxon–Mann–Whitney test, * referred p < 0.05.
Microorganisms 13 02592 g006
Table 1. Oligonucleotides used for DNA quantification.
N. vulgarisPrimer NameSequence
Genes
DVU_16SoLDDVU_16S_FwdTCTGGCTCAGATTGAACGCT
oLDDVU_16S_RevGCAAGCAGAGGCCACCTTTC
DVU_0169oLDDVU_0169_FwdAAGAAGTTCCCCCAGTTCGC
oLDDVU_0169_RevTTGTCGAGATTGTAGCGGGG
DVUA0034oLDDVUA0034_FwdGGGTTGGTCGAGAAGTGGTT
oLDDVUA0034_RevAGTTGCAGGAGAAGTACGGC
C. acetobutylicumPrimer NameSequence
Genes
CA_16SoLDCA_16S_FwdCAGGATGACAGGTGGTGCAT
oLDCA_16S_RevAGCCCTAGACATAAGGGGCA
CA_C0825oLDCA_C0825_FwdAGAGACACCGGTGCAAAGAA
oLDCA_C0825_RevCTTTGCGCTTCCCCAAGATG
CA_P0035oLDCA_P0035_FwdAGTGCCGCATCCAAGAGTAA
oLDCA_P0035_RevATGCCTTCTTCACAGGGAGC
Disclaimer/Publisher’s Note: The statements, opinions and data contained in all publications are solely those of the individual author(s) and contributor(s) and not of MDPI and/or the editor(s). MDPI and/or the editor(s) disclaim responsibility for any injury to people or property resulting from any ideas, methods, instructions or products referred to in the content.