1. Introduction
The primary function of footwear design is to protect human feet and provide posture stability during daily activities [
1]. However, some scholars have proven that the function of conventional shoes could lead to overprotection in humans [
2,
3]. These researches indicated that the function of conventional shoes may degrade the function of human lower limb muscle groups, which means conventional shoes could lead to potential risks of injury. During the early stages of human evolution, there was no footwear available that humans could use to protect their feet [
4,
5]. To date, there are still certain indigenous populations that walk or run barefoot, without using any footwear. This suggests that from a necessity viewpoint, shoes are not essential for human survival or deemed to be a priority. Currently, studies have demonstrated that traditional shoes are impacting on lower limb function, causing gradual degeneration.
With the evolution of human beings and the use of shoes over many years, the cuticle of the foot has not enabled humans to return to the state of barefoot walking. Based on considerations of unstable barefoot conditions, reflex control (RC) shoes and the Masai Barefoot Technology (MBT) have stimulated considerable research interest [
6]. According to previous studies, the main functions of unstable shoes can be summarized as follows: (1) the mechanism of the unstable sole is used to activate the muscle passively, so that more muscles can be engaged in the movement [
7]; (2) lower limb muscles are strengthened [
7]; (3) the ability of the lower limbs is increased to dissipate the impact of ground reaction forces [
8]; (4) muscle control is enhanced, and movement ability is improved [
9]. However, the research by Nigg proved that after six weeks of training in normal shoes (NSs) and MBT shoes, the MBT shoes showed no significant improvements in balance [
10].
From the perspective of the sole structure of the MBT, the instability conditions are close to the instability of ankle plantarflexion and dorsiflexion. On the other hand, from the human plantar structure, this unstable structure is more prone to medial and lateral problems. Thus, we can conclude that perhaps unstable MBT and RC shoes did achieve the effect of instability but did not achieve the desired increase in balance even after six weeks of training. This may be because they did not consider the unstable condition of the human body when standing. Therefore, some of the studies have focused on bionic shoes (BSs) [
11,
12,
13], and the original idea of BS involves combining the function of unstable conditions and the structure of the human plantar. They further mentioned that BS may actually reduce injury risk in the lower limbs. The most interesting aspect of BS is the combination of the human condition and the design of a shoe, which may be more suitable for training or rehabilitation than MBT and RC shoes.
Walking and running are the most basic daily movements of humans. From a biomechanics point of view, there are many similarities between walking and running [
14,
15]. On the other hand, the biggest difference between walking and running is the strike pattern. Running has a swing phase, whereas walking has two support phases. This means that the impact force and load on the lower limbs are greater when running on the ground or during the support period. Thus, although walking and running do not appear to be fundamentally different from each other, their novelty can be found through kinematic and kinetic analysis. Kotaro et al. have published a paper that investigated the difference between walking and running [
16], and they found muscle force and activation vary with different strike patterns. This also shows that on the basis of the analysis of the movement, combined with the analysis of the muscles, we can better and fully understand the internal mechanism characteristics in the process of movement.
OpenSim is free, open-source software. It can be used in many fields, such as walking dynamics analysis, motion performance research, surgical process simulation, and medical device design. In OpenSim, a musculoskeletal model consists of multiple bones connected by joints, where muscles attach to the bones and force the joints to move [
17,
18]. Combined with the BS mentioned above, the range of motion of muscle force can be truly simulated through this simulation software, which is of great significance to our in-depth discussion of BSs. Many of the previous studies believed that the analysis of muscle force can reflect the internal mechanism of injury, find prevention methods and make rehabilitation plans [
17,
18]. The concept of applying simple basic walking and running principles to explore the inner muscle changes often can more truly reflect the difference between the NS and the BS. To our knowledge, there are no studies that have investigated the differences in muscle force between the NS and the BS during the walking and running stance phases.
Therefore, the purpose of this study was to investigate the differences between the NS and the BS during the stance phases of walking and running. We hypothesized that the muscle force of the BS will be bigger than that of the NS during the stance phases of walking and running. We further hypothesized the muscle force of the BS will be bigger than that of the NS during the toe-off phase.
2. Materials and Methods
2.1. Participants
A total of 15 Chinese males from Ningbo University were recruited for this study (age: 24.3 ± 2.01 years; height: 176.25 ± 7.11 cm; body weight (BW): 75.75 ± 8.35 kg). They all had sports three times a week at least for one hour at a time. No surgical injuries were found in the past six months prior to this study, and none of the participants had any kind of lower limb medical issues that could impact the results of this study. Written informed consent was obtained from all participants, when they were informed about the purpose, procedures, conditions, and requirements of this study. The Ethics Committee of Ningbo University approved this study (protocol code: RAGH 20210106).
2.2. Shoes
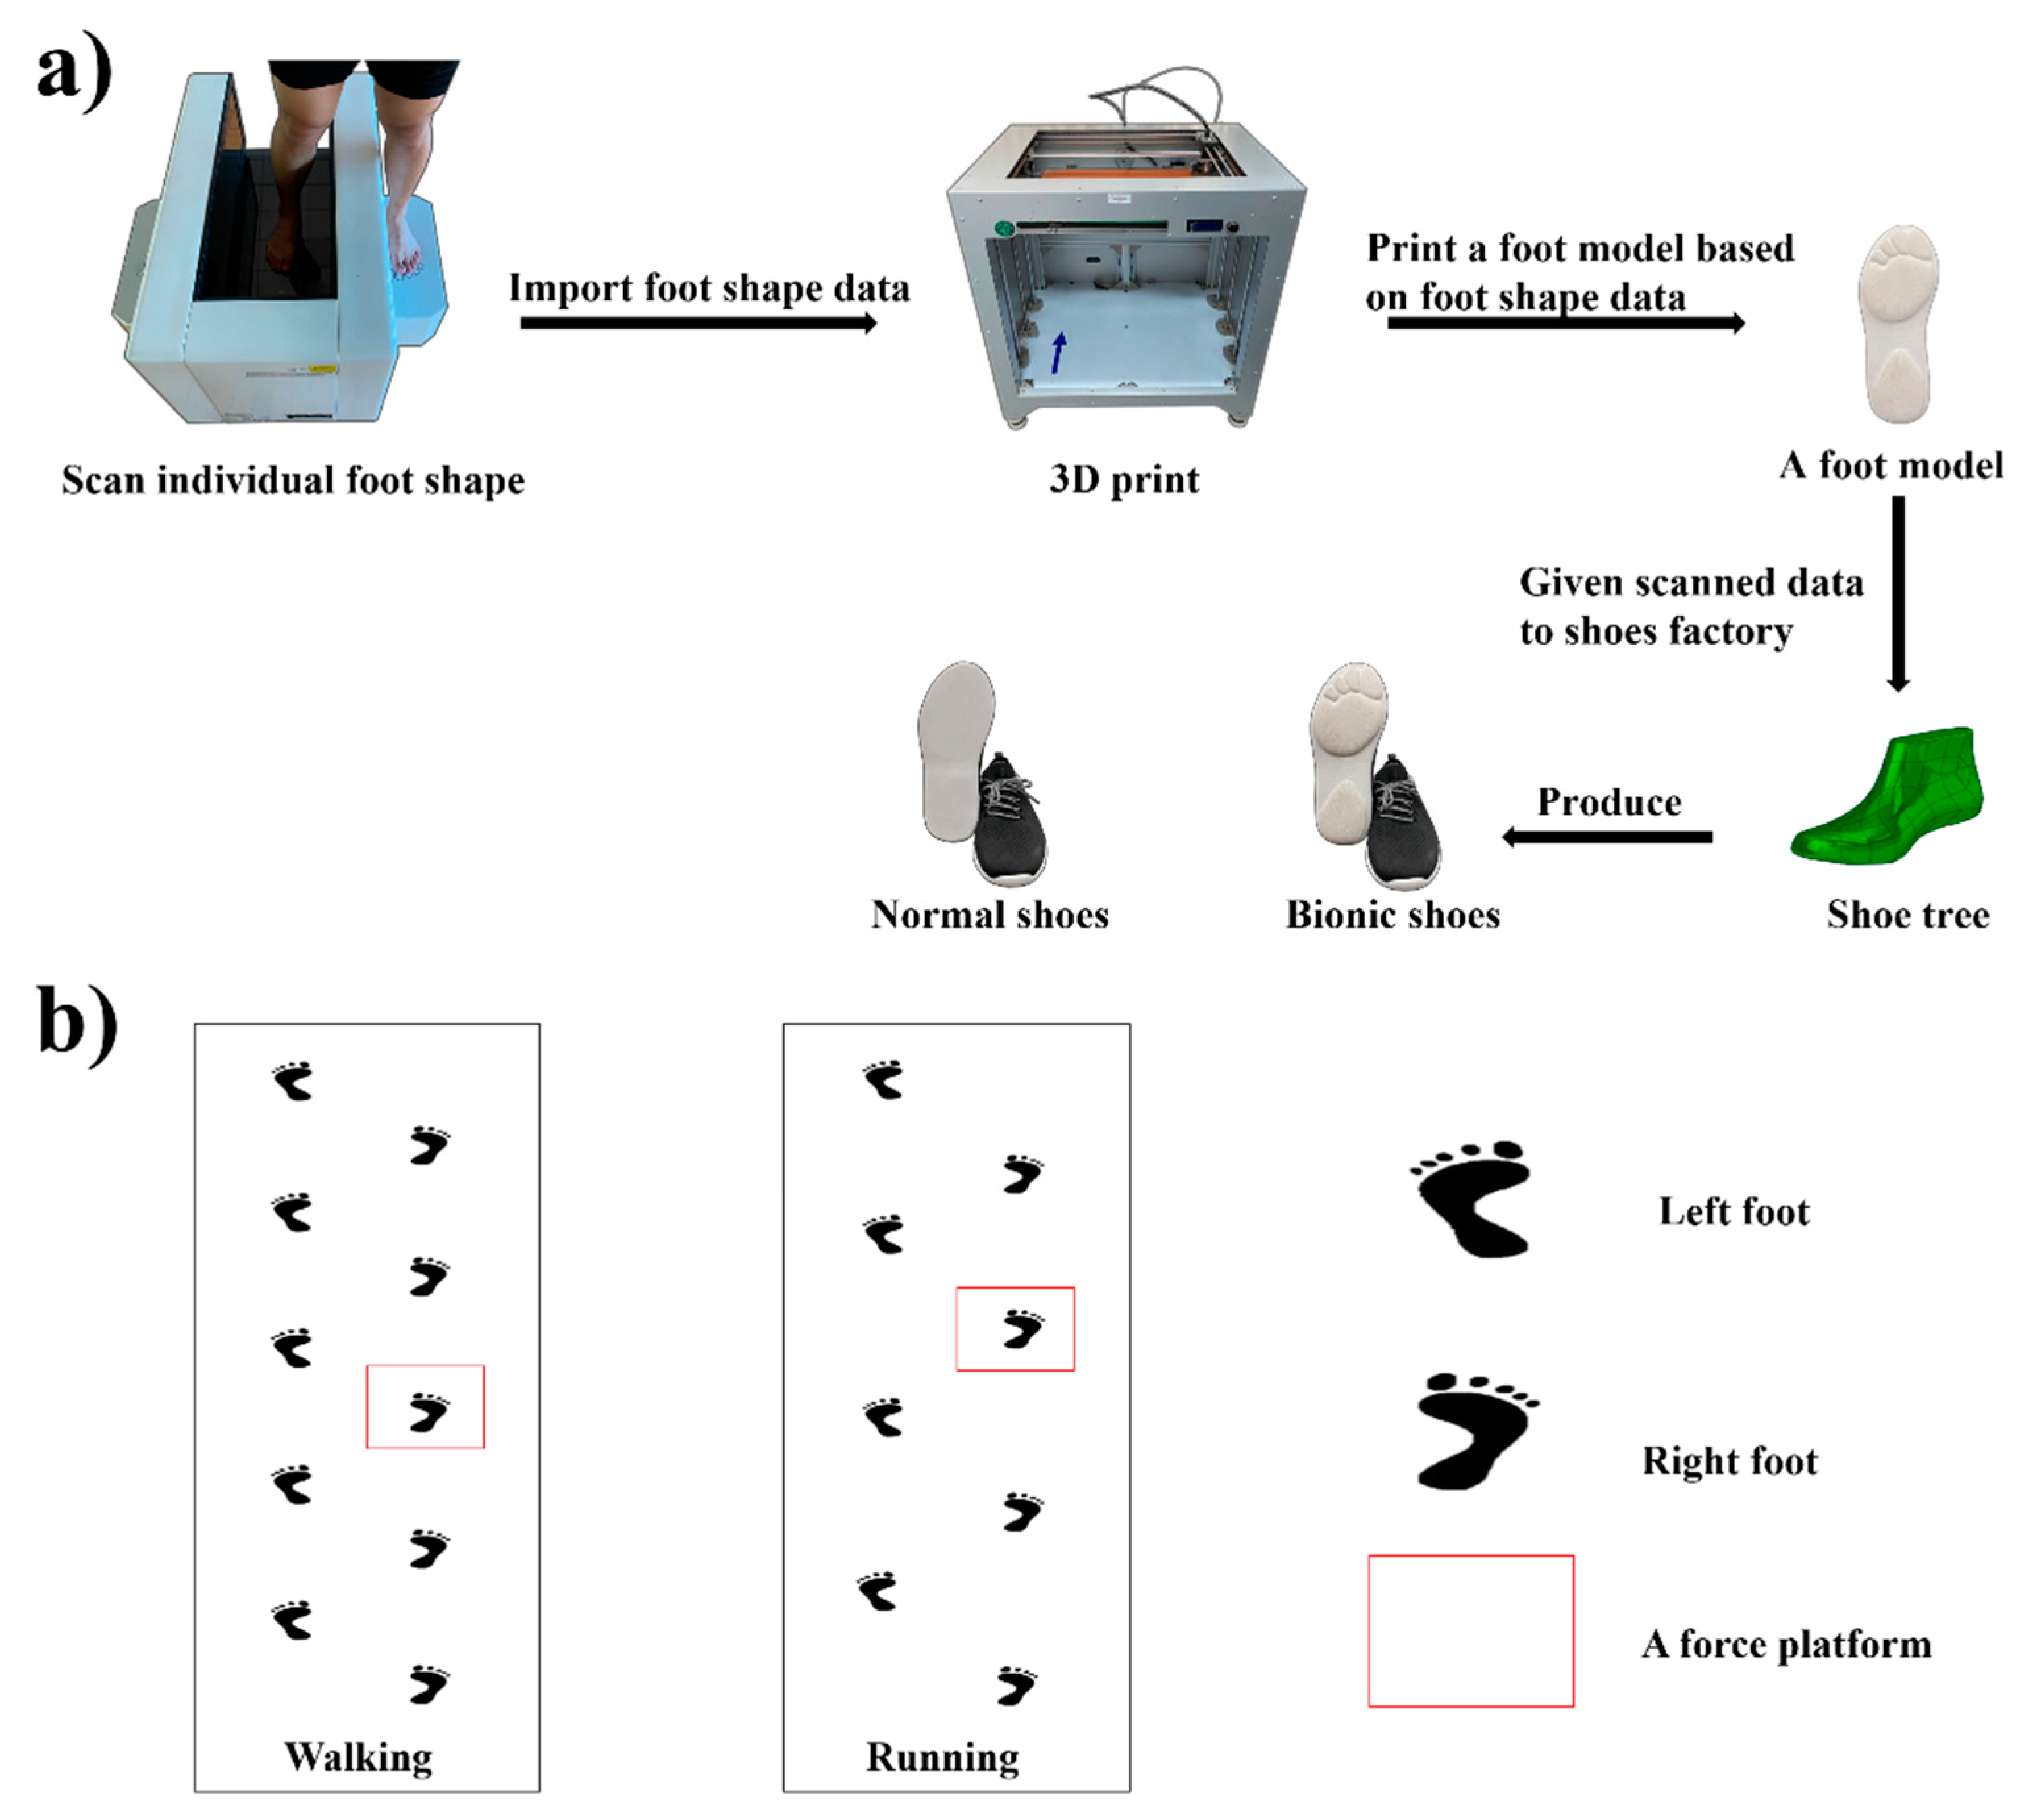
Figure 1a shows two kinds of shoes used in the walking and running experiment. These two shoes were produced by Ningbo Jiangbei Feibu Sports goods Co., Ltd. (Ningbo, China). The BS was designed based on the foot shape of each participant, and the materials and stiffness of both shoe types, i.e., BS and NS, were the same [
11,
12,
13]. The shoes details are present in
Table 1.
2.3. Experimental Protocol and Equipment
Ningbo University Research Academy of Grand Health is a sports biomechanics laboratory with adequate facilities. All tests were performed the biomechanics laboratory. A Vicon motion capture system (Oxford Metrics Ltd., Oxford, UK) and a force platform (Kistler, Switzerland) were used for collecting kinematics and dynamics data. Kinematics and dynamics data were captured at frequencies of 200 and 1000 Hz, respectively. An EMG system (Delsys, Boston, MA, USA) set to a frequency of 1000 Hz was used to collect surface muscle activations and forces, including medial gastrocnemius, lateral gastrocnemius, vastus medialis, vastus lateralis, rectus femoris, and tibialis anterior (
Figure 2a). The data from all the equipment were captured synchronously. Tight shorts and pants were asked to be worn for each test by all participants. Thirty-nine (12.5 mm in diameter) reflective markers were secured onto each participant.
Figure 2b shows the placement of each marker.
2.4. Procedure
Each participant was required to complete a warm-up session that included the following: (a) running on a treadmill at a speed of 8 km/h for 10 min; and (b) lower limb stretching exercises. All participants were permitted 3 trials to familiarize themselves with test movements prior to formal experiments. In order to reduce the impedance of the interface between the skin and the electrode, the skin was prepared by hair removal from the tested area, as well as skin abrasion and alcohol cleaning. After all the participants were fully familiarized with procedures and experimental conditions, the markers and the sensors were attached to the participants as the maximal voluntary contraction (MVC) of each muscle was collected from six muscles. After recording the MVC, the participants were required to stand on a force platform to collect static coordinates.
Each participant was asked to stand parallel to the
Y-axis of the force platform and cross their arms on the shoulder, with eyes looking forward, until complete static coordinates were captured. For the kinematics and dynamics data collection, all participants performed walking and running tasks at a self-selected speed along a 10 m walkway (
Figure 1b). The data collection was only performed on a dominant leg, which was defined as the preferred leg to kick a ball. The dominant leg was used to gather 5 successful data sets, and there was a 1 min break time between each task. The initial contact was defined as exceeding 10 N on a ground reaction force [
19]. The walking and running tasks were divided into two different days for data collection and were performed at the same time on each day. This was important for avoiding inaccuracies in data collection caused by fatigue.
2.5. Data Collection and Processing
Kinematics and ground reaction force data were identified and acquired by Viocn Nexus 1.8.6 software and exported into a c3d format file. MATLAB R2019a (The MathWorks, Natick, MA, USA) was used to perform coordinate system conversion, low-pass filtering, data extraction, and format conversion for kinematics and ground reaction force data. Specifically, the following steps were followed: (1) The coordinate system of the kinematics and ground reaction force data was converted to the coordinate system used in subsequent simulations. That is, the forward direction of the human body was the positive direction of the X-axis, and the upward direction perpendicular to the ground was the Y-axis. The positive direction and the direction of the human body to the right were the positive directions of the Z-axis. (2) The biomechanical data for the marker trajectory and the ground reaction force were filtered by 6 and 30 Hz fourth-order zero-phase lag Butterworth low-pass filters. (3) The kinematics and ground reaction force data were extracted during the stance phases of running and walking, and the data format was converted to the trc. (marker trajectory) and mot. (force plate data) formats required by the OpenSim simulation software.
EMG data were used to prove the reliability of muscles force and activation. Firstly, a 4th-order band-pass filter between 10 and 500 Hz was applied to the EMG data, before it was full-wave-rectified. A 10 Hz low-pass filter was used to smooth data.
Figure 3 demonstrates the activation of each muscle between the EMG data and musculoskeletal modeling.
OpenSim (Stanford University, Stanford, CA, USA) was used to process and calculate biomechanics parameters during this study. A musculoskeletal model in OpenSim (gait 2392), which had 10 rigid bodies, 23 degrees of freedom, and 92 musculotendon actuators, was used [
20,
21]. The muscle activation and muscle force outputs were obtained via the following steps.
Step 1: Import the statics model into the OpenSim 4.2 software. Then use the scale tool to obtain the anthropometric model of each participant. Identify the muscle starting and ending points, and ensure the moment arms are consistent with the length of the participants’ limbs [
20]. Step 2: Use the inverse kinematics (IK) tool in the OpenSim 4.2 software to calculate the joint angle during the stance phases of running and walking, and create a motion file (mot). Simultaneously, use the inverse dynamics tool to import the walking and running marker files and external force files into OpenSim, and then calculate the joint moment of all the participants. Step 3: Apply a residual reduction algorithm (RRA) to smooth the kinematics data which improves the preciseness of the dynamic data which is consistent with the measured kinematic and kinetic data [
20]. Step 4: Using computed muscle control (CMC) with the smoothed kinematics data calculated in Step 3, and calculate the muscle activations and the muscle force [
22].
2.6. Statistical Analysis
Prior to statistical analysis, Shapiro-Wilk normality tests were applied to the dataset. Paired
t-tests were used to assess the stance phases of walking and running between two different shoes, and no significant differences were found. For statistical parametric mapping (SPM) analysis, all data from the walking and running phases were extracted, and the data of stance phase expanded into a time series curve of 101 data points by using a custom script of MATLAB. For statistical analysis, the open-source SPM1d script of paired-samples
t-tests was used. A
p-value of 0.05 was set as the significance threshold [
11,
23].
3. Results
Figure 4,
Figure 5,
Figure 6 and
Figure 7 show the SPM analysis using paired
t-tests between walking and running with different shoes.
Figure 4 shows that there were significant differences found (21.23–28.24%;
p = 0.040) (84.47–100%;
p = 0.017) in hip extension and flexion between the NS and the BS during the walking stance phase.
Figure 5 shows that there were no significant differences found during the running stance phase.
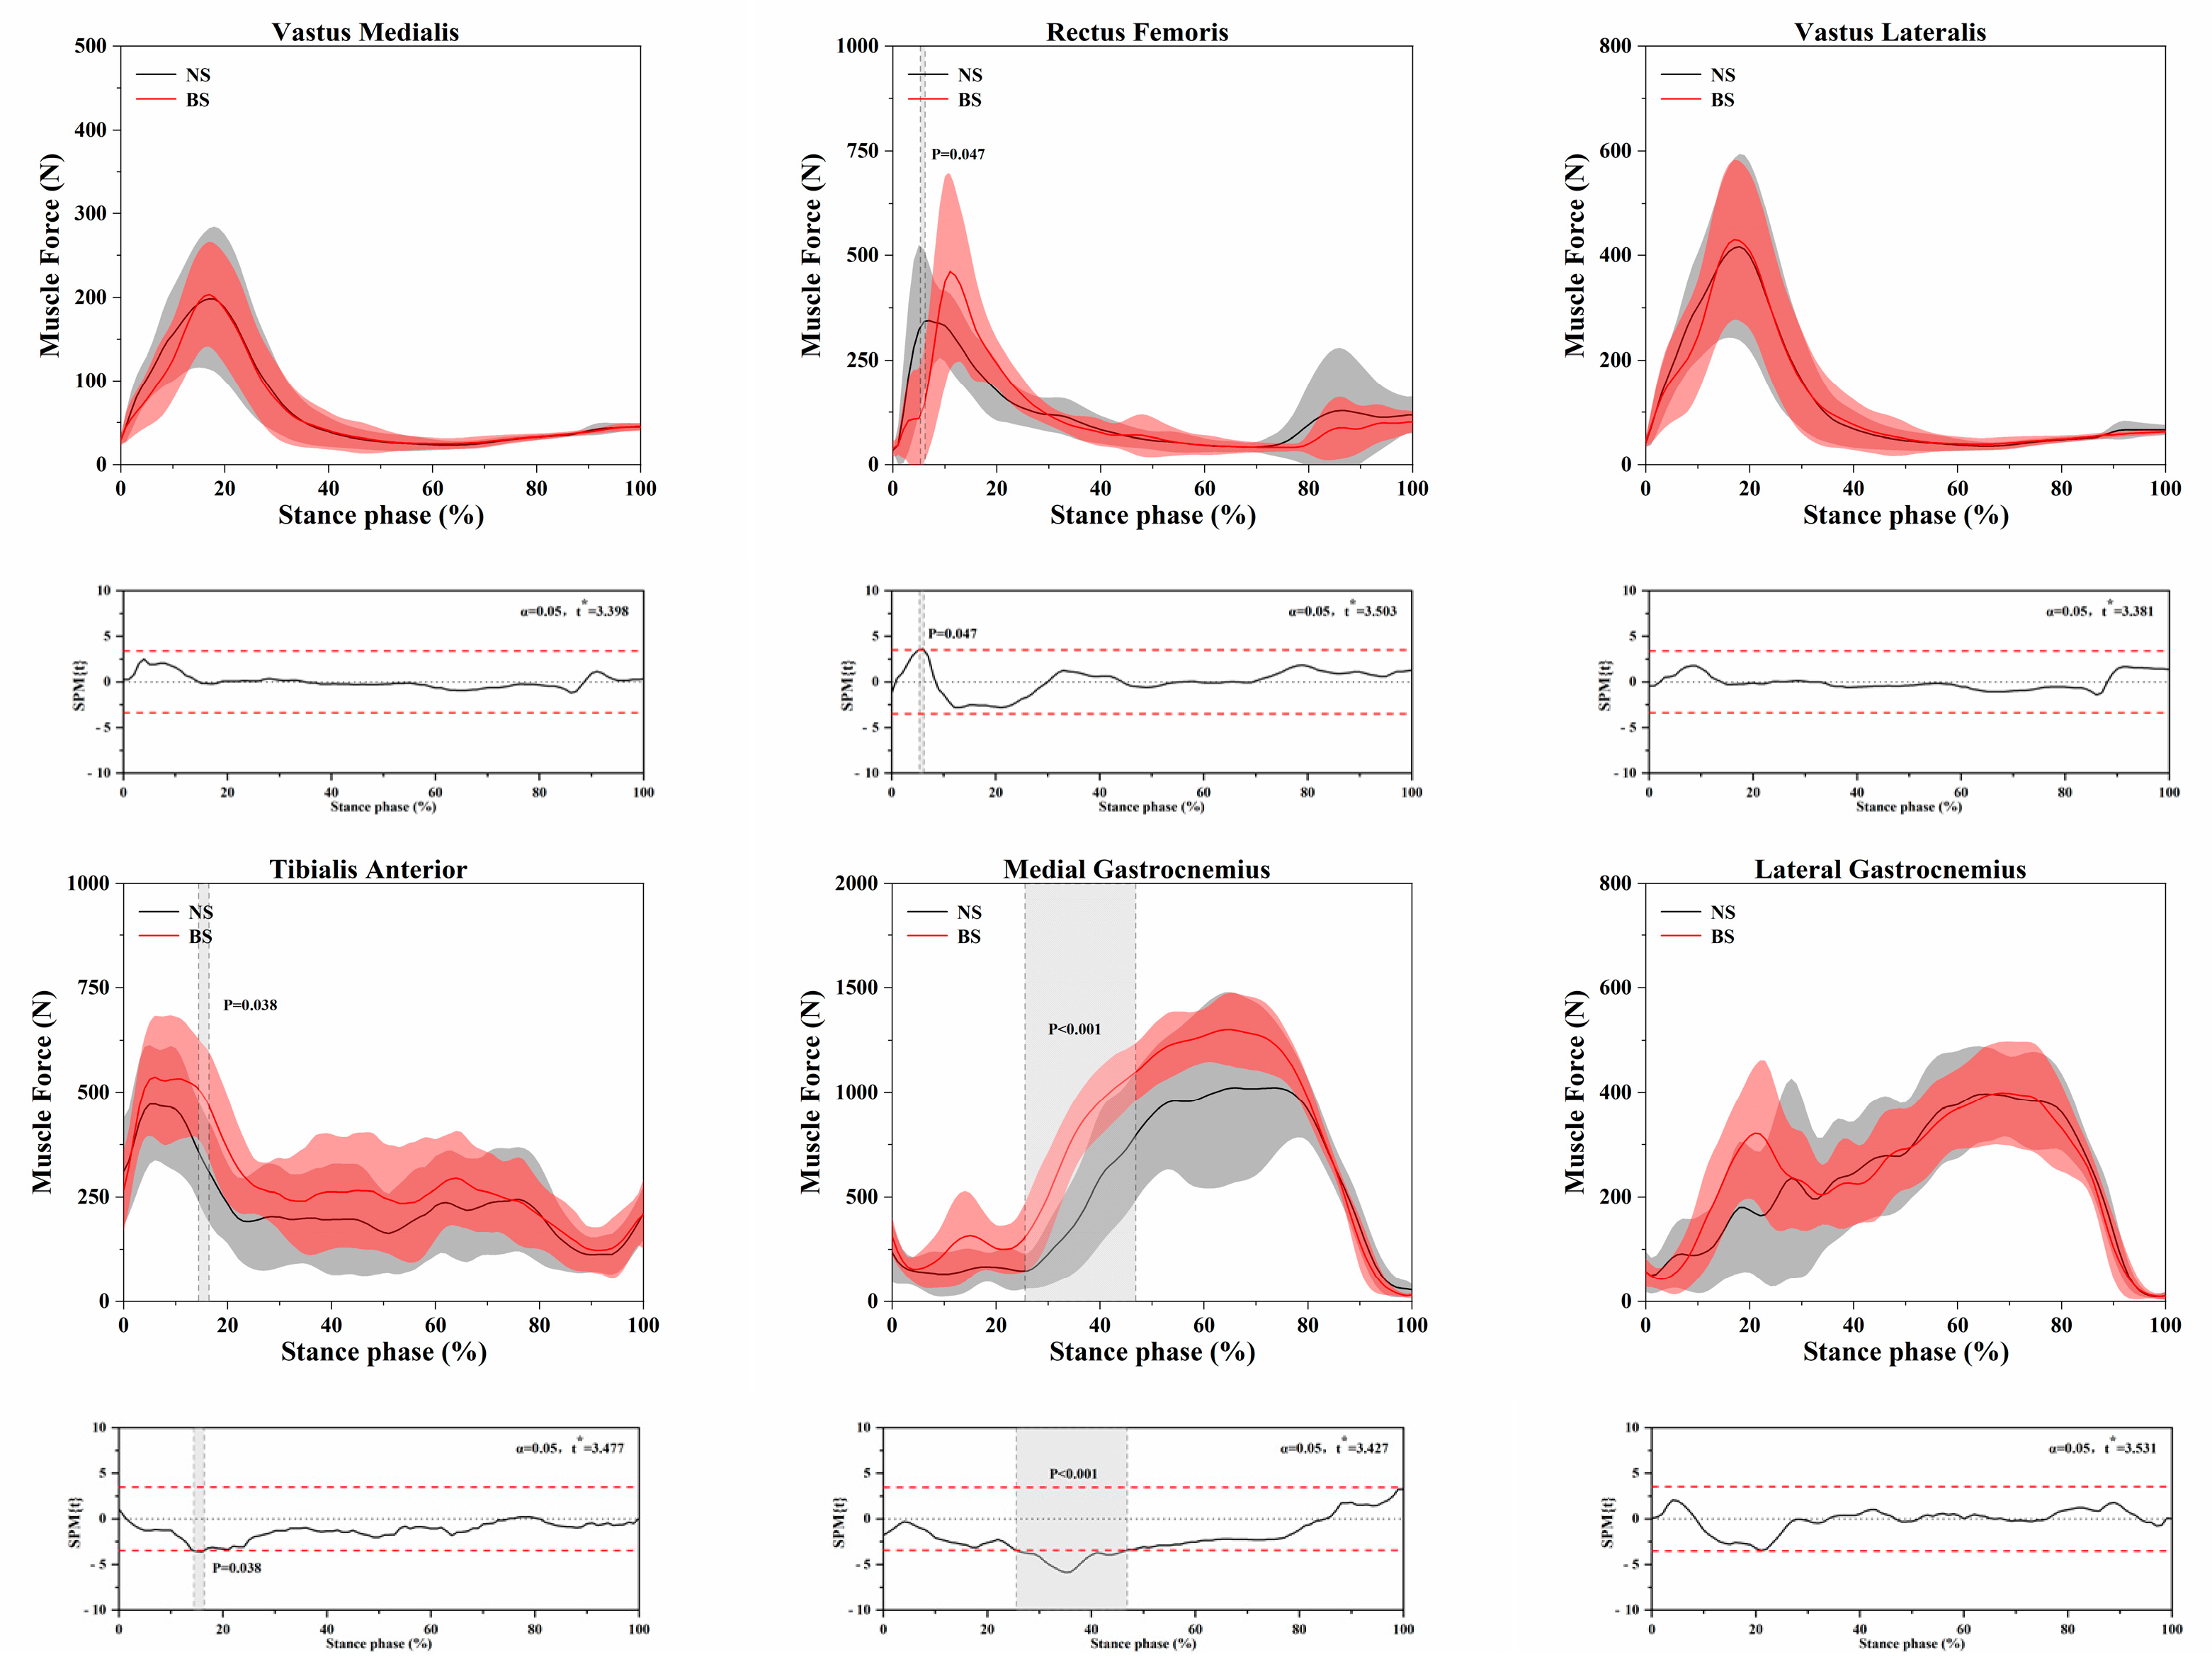
Figure 6 shows that significant differences were found in rectus femoris (5.29–6.21%;
p = 0.047), tibialis anterior (14.37–16.40%;
p = 0.038), and medial gastrocnemius (25.55–46.86%;
p < 0.001) between the NS and the BS during the walking stance phase.
Figure 7 shows that significant differences were found in rectus femoris (12.83–13.10%,
p = 0.049; 15.89–80.19%,
p < 0.001), tibialis anterior (15.85–18.31%,
p = 0.039; 21.14–24.71%,
p = 0.030), medial gastrocnemius (80.70–90.44%;
p = 0.007), and lateral gastrocnemius (11.16–27.93%,
p < 0.001; (62.20–65.63%,
p = 0.032; 77.56–93.45%,
p < 0.001) between the NS and the BS during the running stance phase.
4. Discussion
The objective of this study was to investigate the differences between the NS and the BS during the stance phases of walking and running. We hypothesized that the muscle force of the BS will be larger than that of the NS during the stance phases of walking and running. We further hypothesized that the muscle force of the BS will be larger than that of the NS during the toe-off phase. The results of our study partly agree with our hypotheses.
According to previous studies, a similar unstable shoe, such as the MBT shoe, has a greater flexion angle of the knee and a greater range of motion of the ankle angle during the gait stance phase [
8,
24]. From another point of view, unstable shoes can reduce the range of motion of the ankle angle [
25]. This is completely opposite to the findings of our study, which may be because the unstable shoe actually approaches the plantarflexion and dorsiflexion of the ankle, which changes the kinematics and dynamics of the lower extremity. Is this forced change able to fit the anatomically suitable conditions of the original state? On the other hand, the BS adopted in this study is indeed forced to change the original state of the shoes. However, the change is closer to realize the unstable state of the human foot. Ewald compared the differences in the distribution of the plantar pressure between children and adults [
26]. According to this result, the ratio of plantar pressure distribution in the middle foot is negligible, and the distribution of the pressure in this way does not cause changes in the plantarflexion and dorsiflexion of the ankle joint.
This further proves that the way we used BSs with medial and lateral instability is more correct and more consistent with the needs of a real situation. We have to admit that this kind of unstable front and back shoes may be better for running at an economy or running speed, but maybe this kind of passive reinforcement may have irreversible damage consequences. Therefore, in terms of rehabilitation or increased stability, BSs might be more appropriate.
Our results showed that BSs have a greater muscle force on tibialis anterior and medial gastrocnemius than NSs during the walking stance phase. Unfortunately, we have not observed any studies that have explored the changes in muscle force using BSs, which makes it difficult to discuss the specific reasons. Based on previous studies of unstable shoes, there are some possible reasons for this. By summarizing the results of Nigg and Zhou [
27,
28], we found that the distal fulcrum of unstable shoes can cause the kinematics and dynamics of the lower extremity to become larger or smaller. While this may seem like a small change, it is more straightforward to think about it in another way. For example, the closer the support point is to the trunk, the smaller the change in kinematics and dynamics, whereas if the support point is further away from the trunk, even a small change can make a complete difference. This may explain why changes in muscle strength are evident even when there are few changes in lower limb kinematics and dynamics. We have to admit that perhaps this change in the kinematics and dynamics of the lower limbs may be present in the frontal plane. However, in support of the gait, this increase in muscle strength is very helpful for muscle strength and rehabilitation training.
Our results showed that NSs have a greater muscle force on tibialis anterior and lateral and medial gastrocnemius than BSs during the running stance phase. According to previous studies, we can conclude that the increase of ground reaction force during the toe-off period during running means that the force during the toe-off period is also increasing [
29,
30,
31]. The reason for our findings is probably because the subjects were used to toe-off in the same general design of the NS. Via the gastrocnemius toe-off the ground will conduct the power chain of force, so that the rectus femoris muscle strength is also greater. Therefore, it is going to use more muscle power to hit the ground for higher running economy and speeds. The instability of the BS may help control the muscles more than the NS. From a control and rehabilitation perspective, maybe too much muscle strength is not a good thing. Too much muscle force can cause a tear in the muscle [
32,
33], and for those who have just experienced an injury, control in the muscle is more important than muscle strength.
From the above analysis, we can conclude that the BS may be closer to the real plantar situation than other unstable shoes. This instability may be more helpful for lower limb muscle control and rehabilitation training than other footwear. There are some limitations in the present study. Firstly, we only selected males as our participants. A previous study has shown that because the pelvis of the female is structured differently, they may suffer more lower limb injuries. Secondly, we did not explore the differences between two different shoes during walking and running in the front plane. The kinematics and dynamics parameters of the frontal plane are difficult to evaluate in relation to the muscle force of unstable conditions during ankle inversion and eversion. Thirdly, we did not detect the change of the joint force between two different shoes during the walking and running phases. Further research is necessary, and we will investigate the above limitations in future studies.


 ,
, 


