Assessing Cognitive and Social Attitudes toward Environmental Conservation in Coral Reef Social-Ecological Systems


1
Institute for Geocomputational Analysis and Statistics (GeoCAS), University of the Virgin Islands, St. Thomas, VI 00802, USA
2
Department of Computational and Computer Science, College of Science and Mathematics, University of the Virgin Islands, St. Thomas, VI 00802, USA
Soc. Sci. 2018, 7(7), 109; https://doi.org/10.3390/socsci7070109
Submission received: 20 May 2018
/
Revised: 15 June 2018
/
Accepted: 27 June 2018
/
Published: 30 June 2018
Abstract
:This study addresses the latent construct of attitudes toward environmental conservation based on study participant’s responses. We measured and evaluated the latent scale based on an 18-item scale instrument, over four experimental strata (N = 945) in the US Virgin Islands and the Caribbean. We estimated the latent scale reliability and validity. We further fitted multiple alternative two-parameter logistic (2PL) and graded response models (GRM) from Item-Response Theory. We finally constructed and fitted equivalent structural and generalized structural equation models (SEM/GSEM) for the attitudinal latent scale. All scale measures (composite, alpha-based, IRT-based, and SEM-based) were consistently and reliably valid measures of the study participants’ latent attitudes toward conservation. We found statistically significant differences among participant’s attributes relating to socio-demographic, physical, and core environmental characteristics of participants. We assert that the nature of relationship between cognitive attitudes and individual as well as social behavior related to environmental conservation.
1. Introduction
The formation of attitudes traditionally represents a primarily cognitive process, that is, a process dependent on individual mental processes (Heit 2008). Attitudinal measures across a range of individuals require scale development (Spears 2011; Zuberbühler and Byrne 2006; Kaiser et al. 2018). The study of environmental attitudes has provided insight into cognitive processes and environmental behaviors of participants. For example, Levine and Strube (2012) have shown gender and age-related differences in pro-environmental attitudes and their possible influence of environmental behavior among college student participants.
Latent cognitive and social processes affect the presence, nature, characteristics, and structure of attitudinal formation. They affect jointly, and at the least non-monotonically, the level of association between attitudinal formations within individuals that share a social experience (Ajzen 2012). Such latent social processes represent a social construct that dynamically alters and focuses perceptions of reality in common, shared, and collective ways across individuals and within social groups (Ariely 2008; Eagly and Chaiken 1993).
Whereas one can place environmental attitudes in general in one broader attitudinal category (Mayer and Frantz 2004; Tam 2013), there is an argument to be made that the level of abstraction and the specific context of the latent attitudinal formation can make a difference. Kaiser et al. (2013) argue in favor of support of a two-dimensional model distinguishing general appreciation for nature from attitudes toward environmental protection.
The role, nature, and structure of learning for environmental stewardship is taking place within a shared and collective experience. Such experiential stewardship can influence and being influenced by attitudinal formation and change (Floress et al. 2017). The process involves how individuals learn from social and experiential learning in a stewardship-building process, and at the same time how such experience influences their attitudes, beliefs, and behaviors in turn (Cleeremans and Dienes 2008; Seitz and Watanabe 2005). Zerva et al. (2018) reports citizen satisfaction and dissatisfaction criteria for citizen participation in addressing climate change in Greece. Within our local communities, environmental attitudes co-evolve through shared perceptions of reality and they are confounded within the boundaries of prior (cognitive or social) experiences, as well as prior attitudinal structures (Heit 2008; Thomas and McClelland 2008). Schleicher (2018) argues that while environmental, physical, or biophysical impacts may be readily assessed and evaluated, social impacts may be more diverse, contested, and often under-studied with respect to conservation outcomes. Similarly, Kaplan‐Hallam and Bennett (2018) call for greater attention in incorporating social impact assessment in long-term conservation management. Stronger and more diverse (variant) independent or non-associative prior attitudes are expected to depend more on stronger cognitive learning experiences in their transformations. Similarly, stronger and more convergent (invariant) associative prior group attitudes are expected to depend more on stronger social learning group experiences in their transformations. In cases where weak and uncertain prior attitudes exist, attitudinal transformations can be influenced by both cognitive and social processes at the same time (Rajulton et al. 2007; Pohl and Steyer 2012).
The relationship between individual mental dispositions about nature and perceptions about our attitudes toward environmental conservation involves issues of context, scale and perceptional definitions of importance (Haenn 2016). Ferraro and Pressey (2015) argue for the need for credible, evidence-based science within contextual stakeholder understanding of conservation environmental and social outcomes. Furthermore, Case et al. (2015) demonstrate the need for pluralistic framing in environmental governance of the commons.
Research Questions and Study Organization
The key research question addressed in this study is “Can we measure and evaluate the latent attitudes of participants and social groups toward environmental conservation?” To address this overarching question, we developed a latent scale instrument attempting to measure study participant’s attitudes toward environmental conservation in coral reef systems. We collected participant responses over diverse survey strata, and across different social groups and social learning settings. We further tested the scale reliability and efficacy in measuring the latent attitudinal construct of attitudes toward conservation. We constructed and evaluated attitudinal scale estimates and compared participant and group attributes with respect to their positioning across the attitudinal scale continuum. The remaining of this study presents the comprehensive assessment, development, and analysis methodology; the results and evaluation of the latent attitudinal construct using various statistical models of heuristic and probabilistic estimation, and; the inferential assessment and conclusions reached.
The coral reef system in the US Virgin Islands and the Caribbean region is comprised mainly from shallow reefs, dominated by Orbicella annularis, Orbicella franks, Montastea cavernosa, Orbicella faveolata, and Porites porites (Georgios and Edmunds 2017; Oliver et al. 2018; Williams et al. 2017). Most of these coral reef colonies are found within a short distance from the shores of the US Virgin Islands, and they are subject to anthropogenic impacts from land use, sedimentation, water quality, and climate change (Steneck et al. 2018).
2. Methods
We used an original 24-question survey design to assess participant attitudes. All questions were presented to participants as propositions using a balanced five-item Likert scale (strongly disagree, disagree, agree, strongly agree). The questions were presented in an online survey form, and the order of the questions was randomized. Each participant had unlimited time to answer the questions, and the participant could leave questions unanswered if he/she desired to do so. From the original 24-question survey, we constructed an 18-item scale based on reliability analysis (described in a following section).
2.1. Experimental Data
We used the survey instrument in four major assessment strata, each one with unique participant and group characteristics. All experimental data was collected in the Virgin Islands region of the Caribbean (US Virgin Islands and British Virgin Islands). The four major experimental strata were
- (a)
- Ecotourism survey data (ECO). We collected survey responses from a total of 290 participants of ecotourism (snorkeling) businesses, during their ecotourism activities. Of these, 253 responses had complete answers to all analyzed survey questions. Most of the assessments were done on a boat, on the excursion assembly point, or at the snorkeling location. The study data collected from August 2011 through April 2012, and more details on the study design can be found on Kobrinski (2013).
- (b)
- Experiential Social Learning exercises (ESL). Four exercises were conducted with young Virgin Islanders—student participants of the University of the Virgin Islands. We collected responses from a total of 43 participants of these four experiential social learning exercises. Of these, 42 observations represent valid (full) responses for the analysis. These assessments were done at the beginning of the learning exercises, and the data were collected in 2011.
- (c)
- Visiting Scientists survey (VSC). Several visiting scientists participating in a workshop at the University of the Virgin Islands, were exposed to the same experiential social learning exercises, as described in the previous strata. We collected responses from a total of 42 participants. Of these, 42 observations represent full valid responses for the study. These participants were from outside the Virgin Islands, and the study data were collected during a single fieldwork exercise in May 2012.
- (d)
- Community survey (COM). We collected responses from a total of 790 participants of a community survey focusing on water-energy nexus characteristics of Virgin Island residents. Of these, 626 observations represent full (valid) responses for the analysis. The assessments were done both in in-person settings (fieldwork) or through online surveys disseminated widely to residents of the Virgin Islands. The study data were collected from January 2015 to 2017.
Key participant attributes beyond the 18-item scale survey are summarized in Table 1, for each of the survey strata implementations. Core demographic characteristics such as gender, age group, education and place living were collected in all strata, while other characteristics was collected in individual strata implementations (due to study design and independent project implementation).
2.2. Instrument Reliability
The reliability of the instrument scale is measured using the Cronbach’s alpha coefficient (Cronbach 1951). The summative rating of the scale is measured against the latent variable (composite factor), Attitudes toward coral reef Conservation (ATC). The scale represents the modeled cumulative estimation of the individual item scores, by reversing the scoring ranking for the composite statements that have negative correlations with the composite latent attitudinal factor whose strength is measured.
Cronbach’s alpha is measured using the following symbolic form from Equation (1):
where, k is the number of variables (items) over which α is computed (k = 18), and the term in Equation (2) is the average correlation coefficient among scale items, where si or j is the sign of each item variable in the computing of their correlation coefficients, and nij is the number of observations that are used in calculating the item correlation coefficients (pairwise excluded).
The Cronbach’s alpha coefficient α, can be used to interpret the estimated relationship (correlation) between its value, and the latent scale or variable it measures. This correlation can be computed as the square root of alpha, . Acceptable values of alpha range between 0.7 and 0.95 (Tavakol and Dennick 2011).
2.3. IRT Models: Two-Parameter Logistic and Graded Response Models
Following the establishment and assessment of the reliability for the ATC scale used in this analysis, we tested a few alternative models and applied both a two-parameter logistic model (2PL), and a graded response model (GRM) from Rasch’s Item Response Theory (Van der Linden 2010; Kolen and Brennan 2014). The purpose of this type of analysis is to identify and further explore the patterns and attitudinal formation of the items in each of the study’s scales.
The Two-Parameter Logistic Model (2PL) used in the study, uses a binary scale classification (i.e., 0/1) over recoded scale response items. The ATC scale items were recoded as 0 if responses were negative (strongly or somewhat) or neutral and 1 if responses were positive (somewhat or strongly). The model estimates the probability that a participant’s response is positive, given the level of latent attitude’s trait (θ), for varying level of discrimination parameter, β (Birnbaum 1968). Equation (3) shows the symbolic form of the probabilistic estimation.
The latent attitudinal trait parameter (θ) is shown to follow a standard normal distribution, i.e., (0,1).
In this study, we also applied a polytomous Graded Response Model (GRM) on par with the ordinal nature of the items of the assessed scale. The model was implemented both using the irt grm algorithm in the Stata statistical language (Stata 2017) and the IRTPRO stand-alone software (IRTPRO 2015), and it is based on the 2PL model of Birnbaum (1968) and the GRM model of Samejima (Kolen and Brennan 2014; Samejima 1977, 2008).
The probability of observing a cumulative outcome k or higher for each scale item, i, and for each person j, is estimated from Equation (4).
where i = 1, …, Q are scale items (questions); j = 1, …, N are the number of persons (observations) completing the survey; k = 1, …, K the number of ordinal responses in each scale item; αi represents the discrimination parameter for an item i in the scale (model slope parameter); βik is the kth difficulty parameter for the scale item i (latent ability threshold parameter); cik is the kth cutoff parameter for the scale item i (model intercept parameter); and θj is the latent attitudinal trait for each person, j.
The model assumes that the theoretical distribution of the latent attitude trait is the standard normal distribution, i.e., θj ~ N(0,1). The probability of observing any given ordinal outcome k can be calculated as the probability difference between two consecutive ordinal responses. From the cumulative probability model symbolically, we can derive Equation (5).
From Equation (4), directly derives Equation (6), i.e., that the cutoff point of each outcome k for each item in the scale is the product of the item’s discrimination parameter and the item’s difficulty parameter.
We tested the GRM model fit using both a Bock-Aitkin and an Adaptive Quadrature algorithm. The model for the ATC scale is approximated through a marginal Maximum Likelihood estimation (MMLE). The results were similar across both algorithmic implementations, with the Bock-Aitkin algorithm performing slightly better. The Bock-Aitkin algorithm uses a Bayesian Expectation-Maximization algorithm for estimating convergence. For consistency across multiple implementations, we used an uninformative (uniform) prior and starting values for the simulation. The model runs produced estimates for the logistic GRM model, including the slope parameter estimates (α), the model intercept parameter estimates (c), and the ability threshold parameter estimates (β).
2.4. Structural and Generalized Structural Equation Modeling (SEM/GSEM)
To test and expand latent scale inferences made with previous methods (i.e., using Cronbach’s Alpha reliability scale estimates and IRT GRM empirical Bayes means estimates), we conducted a series of structural equation modeling estimations on the ATC scale item variables. The use of SEM as alternative to scale (latent trait) reliability constructs is grounded in the relevant literature. Cho (2016) demonstrates the use of SEM models for deconstructing and clarifying the covariance composition of Alpha reliability estimates (Cho 2016).
As an alternative to the two previously constructed latent scales (alpha reliability-based and IRT-GRM-based), we also fitted a structural equation model (SEM) using the 18-item observed survey variables to estimate a single latent attitudinal scale variable. The estimation equations of the model are shown in the following Equation (7):
where, x1, x2, …, xi are the i items (variables) empirically observed and assessed, μ1, μ2, …, μi is the mean item vector, and L is the unknown latent attitudinal scale vector with unknown mean μ. We assume that observations and the latent scale vector are independent and identically distributed with mean μ and standard deviation corresponding to the covariance matrix Σ. Each independent equation of the model is equivalent with Equation (8), which provides a standardized (normalized) estimate of the latent attitudinal scale vector. It is thus expected that the latent scale will be following a standard normal distribution, i.t., its mean, μ is expected to asymptotically be estimated to 0.
The SEM model produces estimates for the parameters β and the error terms, ε along with the latent variable’s mean and covariance estimates. The model estimation used a quasi-maximum likelihood (QML) estimation that relaxes the normality assumption in the estimation of the standard error structure of the coefficients.
3. Results and Analysis
3.1. Scale Development
A composite cognitive scale measurement, Attitudes toward Conservation (ATC) was developed and tested through participant survey and experimental assessment responses. The scale attempts to capture the participant’s cognitive latent construct related to their attitudes toward conservation, especially with respect to coral reefs. With respect to its specificity, a number of items in the scale are somewhat related to the subject of the behavioral, mental or experimental activities within which the participant assessments are often nested. The abstract generalizability of the scale links broader participant attitudes, aspirations, dispositions, and social norms of participants toward environmental conservation. Key reliability statistics on the composite scale measurements are shown in Table 2 below.
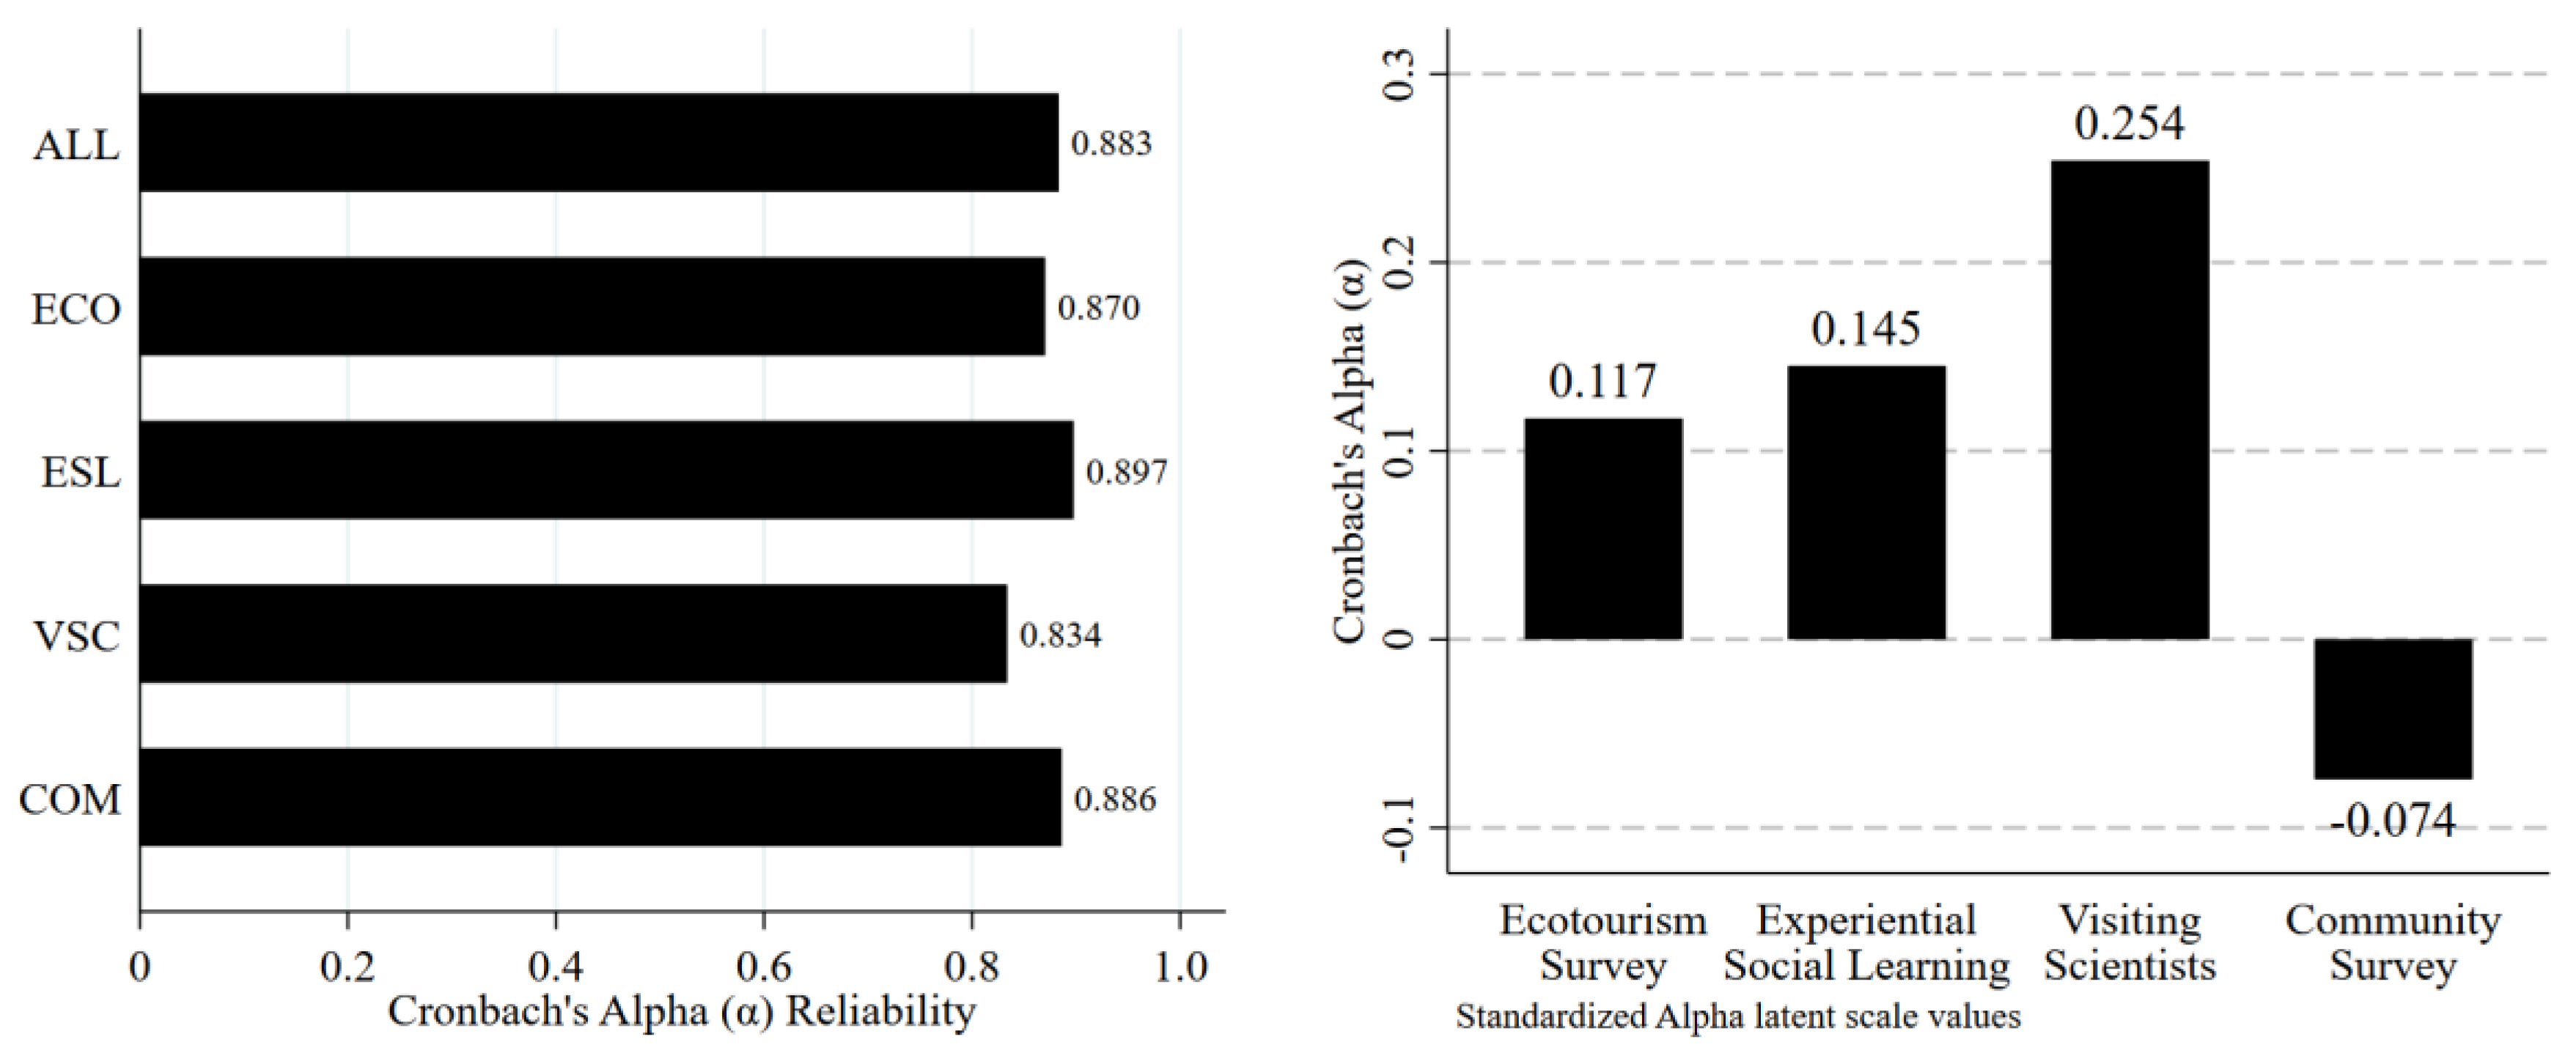
The ATC scale enjoys a relatively high Cronbach’s Alpha reliability coefficient. The Cronbach’s Alpha reliability coefficients were measured by reversing the sign of items 1 (TooMuchConcern), 3 (NoTopPriority), 5 (LawsLimit), 6 (LittleEffect), 8 (ThreatenJobs), 9 (TourismLivelihoods), 12 (FutureGenerations), 14 (EnoughDone), 15 (ConsEconConflict), and 16 (NaturalValues) in the scale. We used a two-stage algorithmic process to estimate the items to be included in order to maximize the yielded Cronbach’s alpha coefficients. The optimal scale is computed by removing items whose item-level alpha coefficient (alpha if item removed) was larger than their respective scale-level alpha. As a result, the optimal ATC scale includes 18 out of the 24 original items (α = 0.883).
The high level of the achieved reliability coefficient confirms the validity of the instrument items to capture the latent constructs under study, namely the cognitive attitudes of participants towards coral reef conservation, and the cognitive beliefs of study participants about nature in general. More specifically, the standardized alpha for the ATC latent scale of 0.883 denotes an overall correlation coefficient value of 0.940 and thus captures approximately 94.0% of the association between items in the scale and the underlying latent factor, i.e., the participant’s attitudes toward coral reef conservation.
In addition, as we can see in Table 3, we conducted separate reliability analyses for all studies included in the data, namely the ecotourism survey, the experiential social learning experiments, the visiting scientists survey, and the community survey data. In each of the studies, the item-level standardized Cronbach’s alpha coefficient was relatively consistent as can be seen in the following Table 3.
The graph in Figure 1 summarizes the performance of the reliability analysis using the standardized Cronbach’s Alpha coefficient, for the standardized ATC scale. As we can see from the right subgraph, the strongest positive ATC scale mean is obtained in the Visiting Scientists study strata (0.254 above the mean ATC overall reliability). The strongest negative alpha coefficient is obtained in the Community survey study strata (slightly below the overall mean, by 0.074).
Based on the reliability analysis, we computed the raw (summative) composite scores of each participant in the study. For a five-Likert scale per item, and for the 18 scale items, the minimum score that can be achieved is 18, and the maximum is 90. We added the raw summative scores, and we rescaled the summative scale from 0 to 100. A histogram of the results for all four studies in the dataset are shown in Figure 2. The mean summative scale score for the 963 participant observations, μ = 58.032 with standard deviation, σ2 = 21.688.
As we can see from the subgraphs in Figure 2, significant differences between the four study groups can be identified, both visually, and statistically. Specifically, the Ecotourism and Social learning groups have very similar characteristics on their distributional patterns and reflect similar participant demographic (and socioeconomic) characteristics.
The analysis of the items in the ATC scale provide further insight into the inferential dynamics of the latent cognitive and social constructs under study. Table 4 presents the key item statistics for the 18-item scale development of the Attitudes toward Conservation (ATC) construct. The scale contains eight positive statements and ten negative statements. The first column of the table shows the scale item question. The second through fourth third columns show the mean (μ), standard deviation (σ2, and standard error values respectively of the participant’s responses to the question using a summative Likert rating scale. The Likert scale used for the analysis ranges from negative to positive dispositions: strongly disagree = 1; disagree = 2; neutral (neither agree nor disagree) = 3; agree = 4; strongly agree = 5 (reversed values in negative items, with strongly disagree = 5 through strongly agree = 1.
The last few columns of Table 4 summarize the key reliability characteristics of the ATC scale, namely the item-test correlation (ITC), the item-rest correlation (IRC), the average inter-item covariance (IIC), and the Cronbach’s alpha test coefficient (α) if the item is removed from the scale.
By reversing the sign of the correlation coefficient (see also Equations (1) and (2)) for the negative statements and computing the relevant Cronbach’s alpha coefficient, we can see that we can obtain a relatively high reliability for our instrument, with an average value of α = 0.877 and a range from 0.871 (minimum value) on item statement 12 (“We don’t need to worry much about the corals, because future generations will be better able to deal with these problems than we are (reversed)”), to 0.884 (maximum value) on item statement 18 (“I expect to see more dramatic changes in our natural and marine environment in the future”). All items are shown to reduce the achieved Cronbach’s alpha reliability coefficient if deleted from the scale, and all items would reduce the scale’s mean value, as they present a correlated composite construct (shown in their corrected item-total correlation coefficients and their squared multiple correlation coefficients alike).
The resulting ATC scale (based on alpha coefficient scores) has 963 observations. The scale has mean of 0, variance of 0.335, and standard deviation of 0.579. The minimum and maximum scale values are −1.583 and 1.115, respectively.
3.2. Comparing Alpha Scale Estimates Across Attributes and Participant Groups
We tested for normality in the scale score distributions using multiple tests for normality. The Kolmogorov-Smirnov (K-S) goodness-of-fit test for normality for the distribution of mean scale scores across participants had a p-value of p = 0.027 for the K-S Statistic D = 0.043. Thus, we cannot reject the null hypothesis (p < 0.05) that the Attitudes Toward Conservation scale is normally distributed across the population of participants in the study. In addition, the joint Skewness and Kurtosis test for normality in the mean scale scores indicate that cannot reject the null hypothesis (p < 0.001) for normality. Specifically, P(skew) = 0.074, and P(kurt) = 0.000, with joint adjusted χ2 = 65.690 (p = 0.000). Finally, both the Shapiro-Wilk W test and the Shapiro-Francia W’ test for normality show that we cannot reject the null hypothesis (p < 0.001) for normality in the scale score distributions with W = 0.982 (z = 5.945) for the Shapiro-Wilk test, and W’ = 0.982 (z = 5.649) for the Shapiro-Francia test. The results of testing for distributional normality across study participants and studies are shown in the following Table 5.
We tested for statistically significance in the equality of mean scale scores for a number of attribute variables in the data, using the non-parametric Kruskall-Wallis chi-square test (Table 6). In cases with only two states, (binary conditions) the Kruskall-Wallis chi-square test, is identical with the Wilcoxon (Mann-Whitney) chi-square test. We also reported the two-sample Kolmogorov-Smirnov test comparing binarized versions of the attributes, allow us to assess the asymptotic significance of the positive or negative sign of the differences.
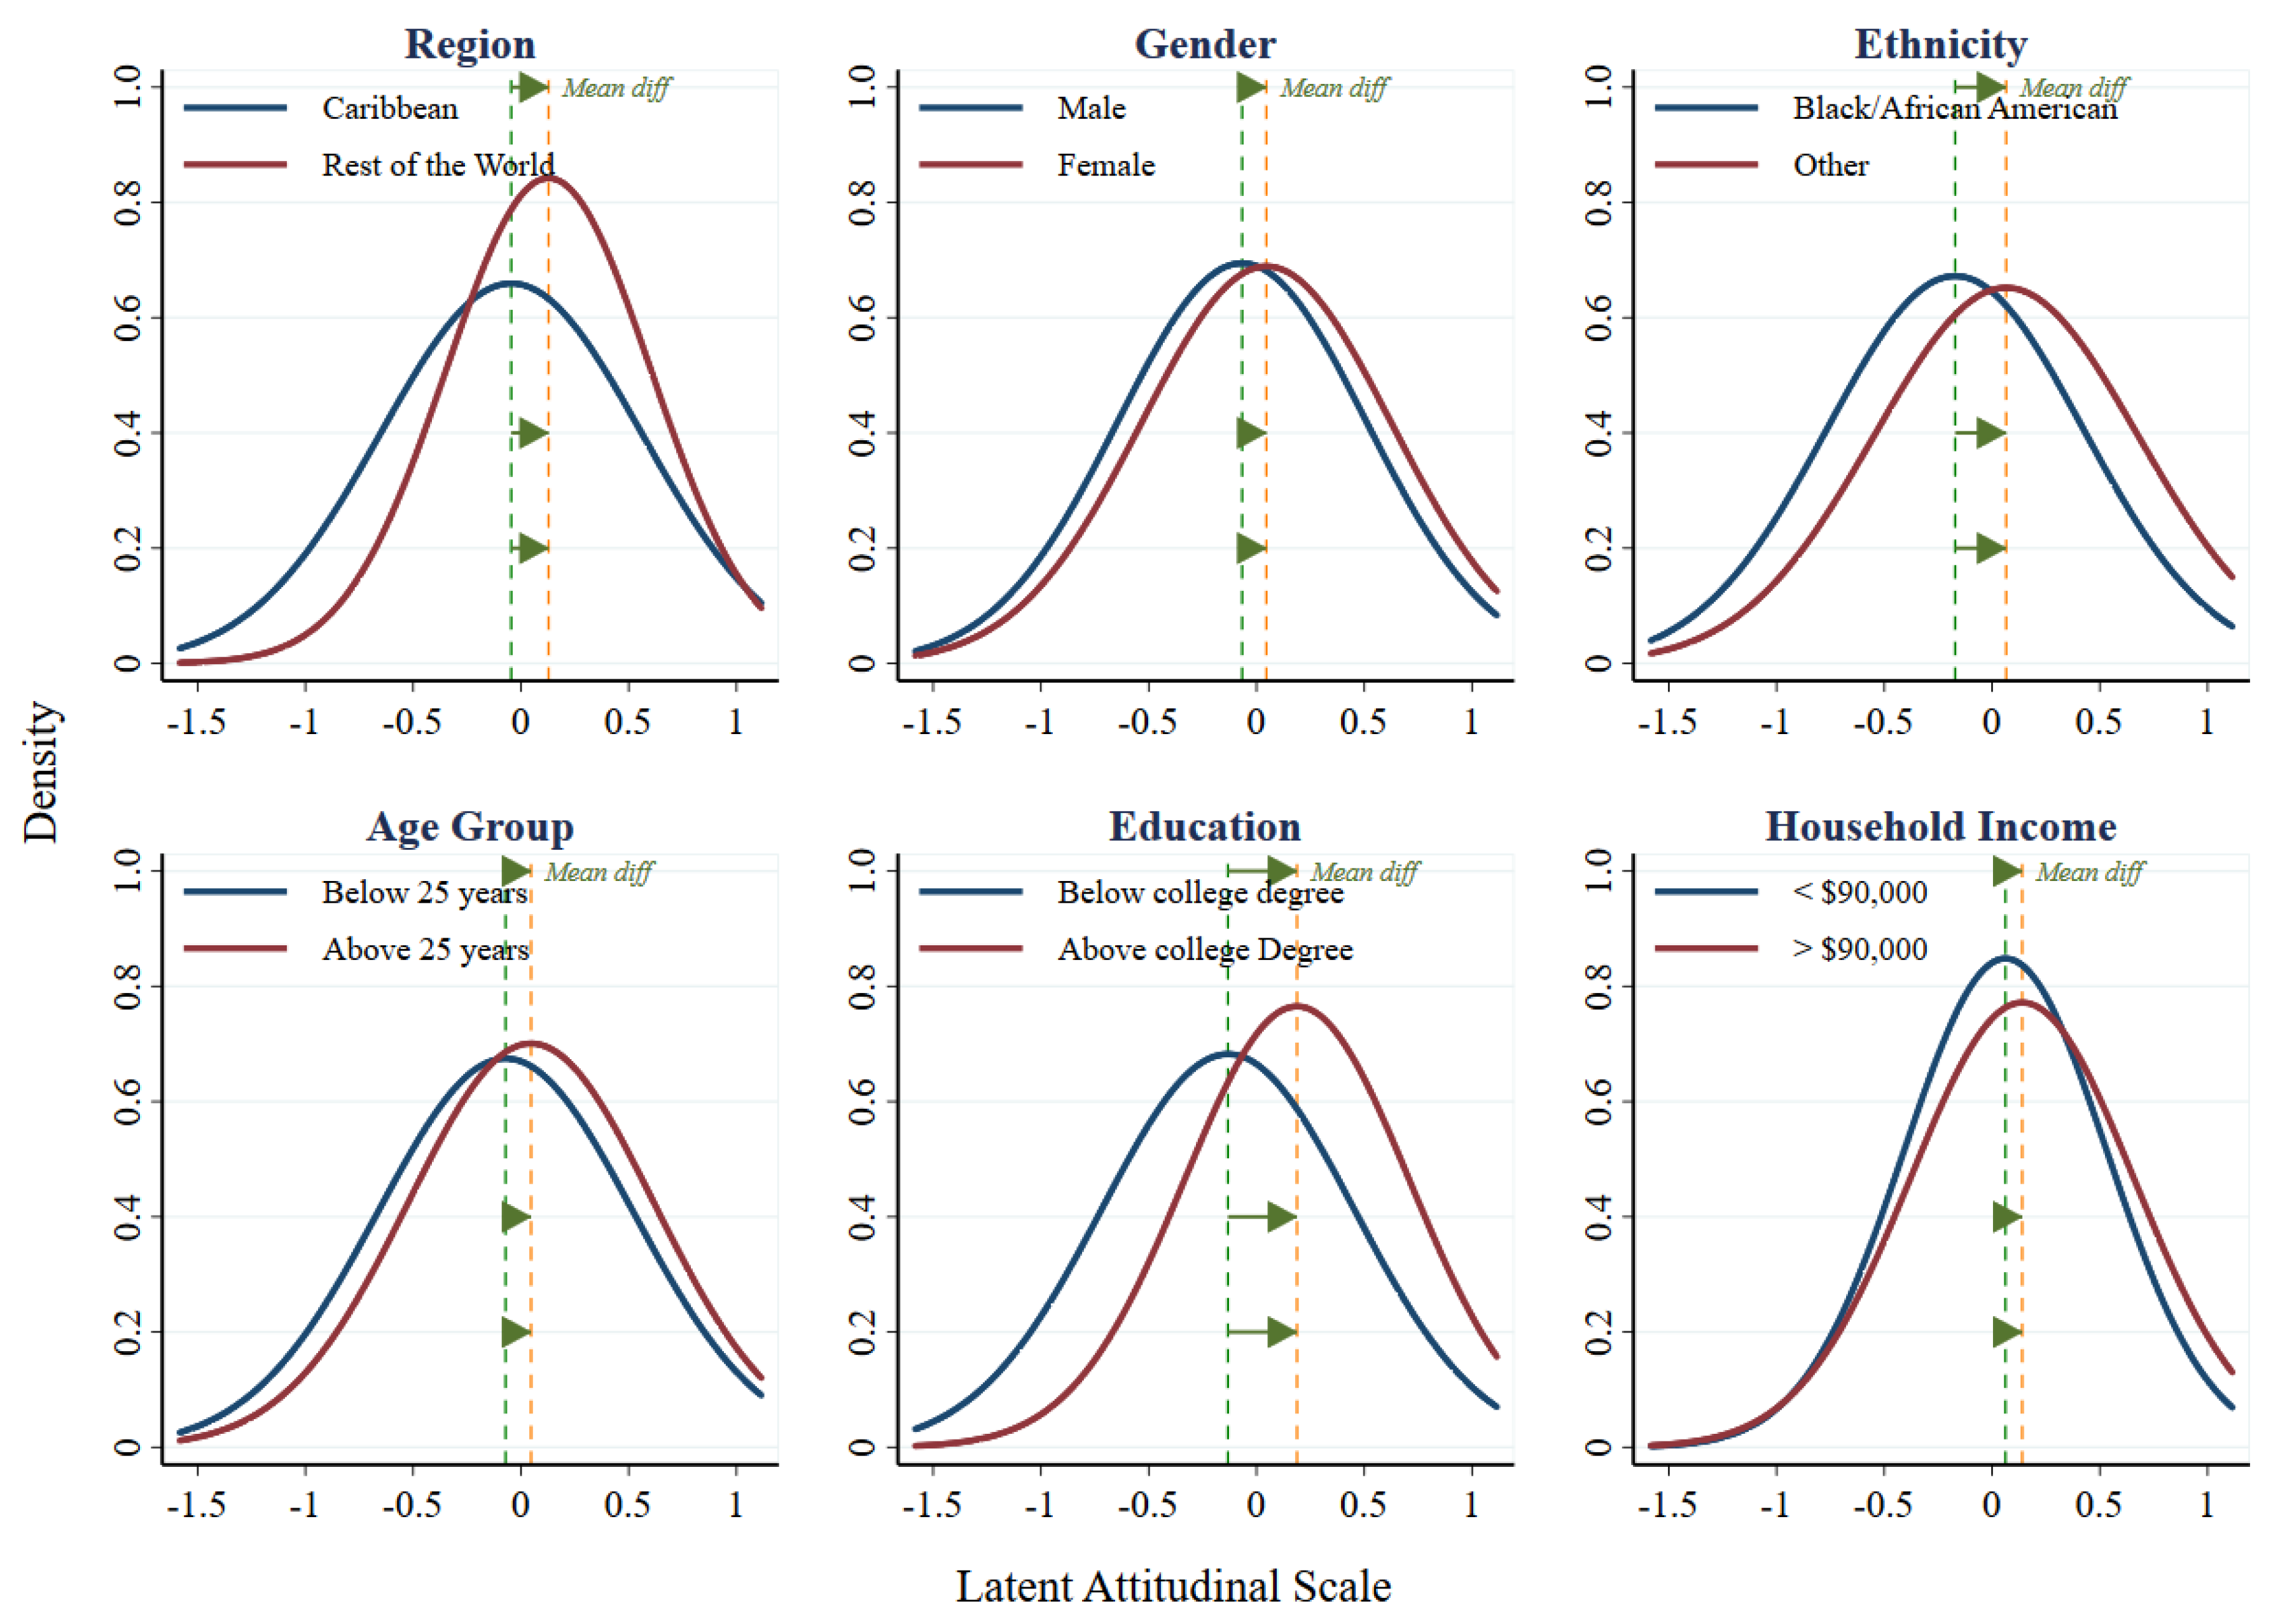
In terms of demographic and socio-economic characteristics, male participants appear to have slightly smaller values of mean scale scores than female ones (albeit barely significant—p = 0.0017). Mean scale scores are shown to be statistically different across ethnicity groups, and furthermore, Black/African American participants have larger mean scale scores than any other ethnic group (p < 0.001). Participants below 25 years old have lower mean scale scores than participants above 25 years (p = 0.0011). Similarly, participants with college degree and above have larger mean scale scores than the ones without college degree (p < 0.001). On the other hand, household income levels do not appear to be statistically significantly different among participants in terms of their mean scale scores. The selected demographic characteristic scale comparisons among participants are shown in the following Figure 3. Additional ethnicity (other/mixed) self-identified characteristics are provided in Appendix B of the study.
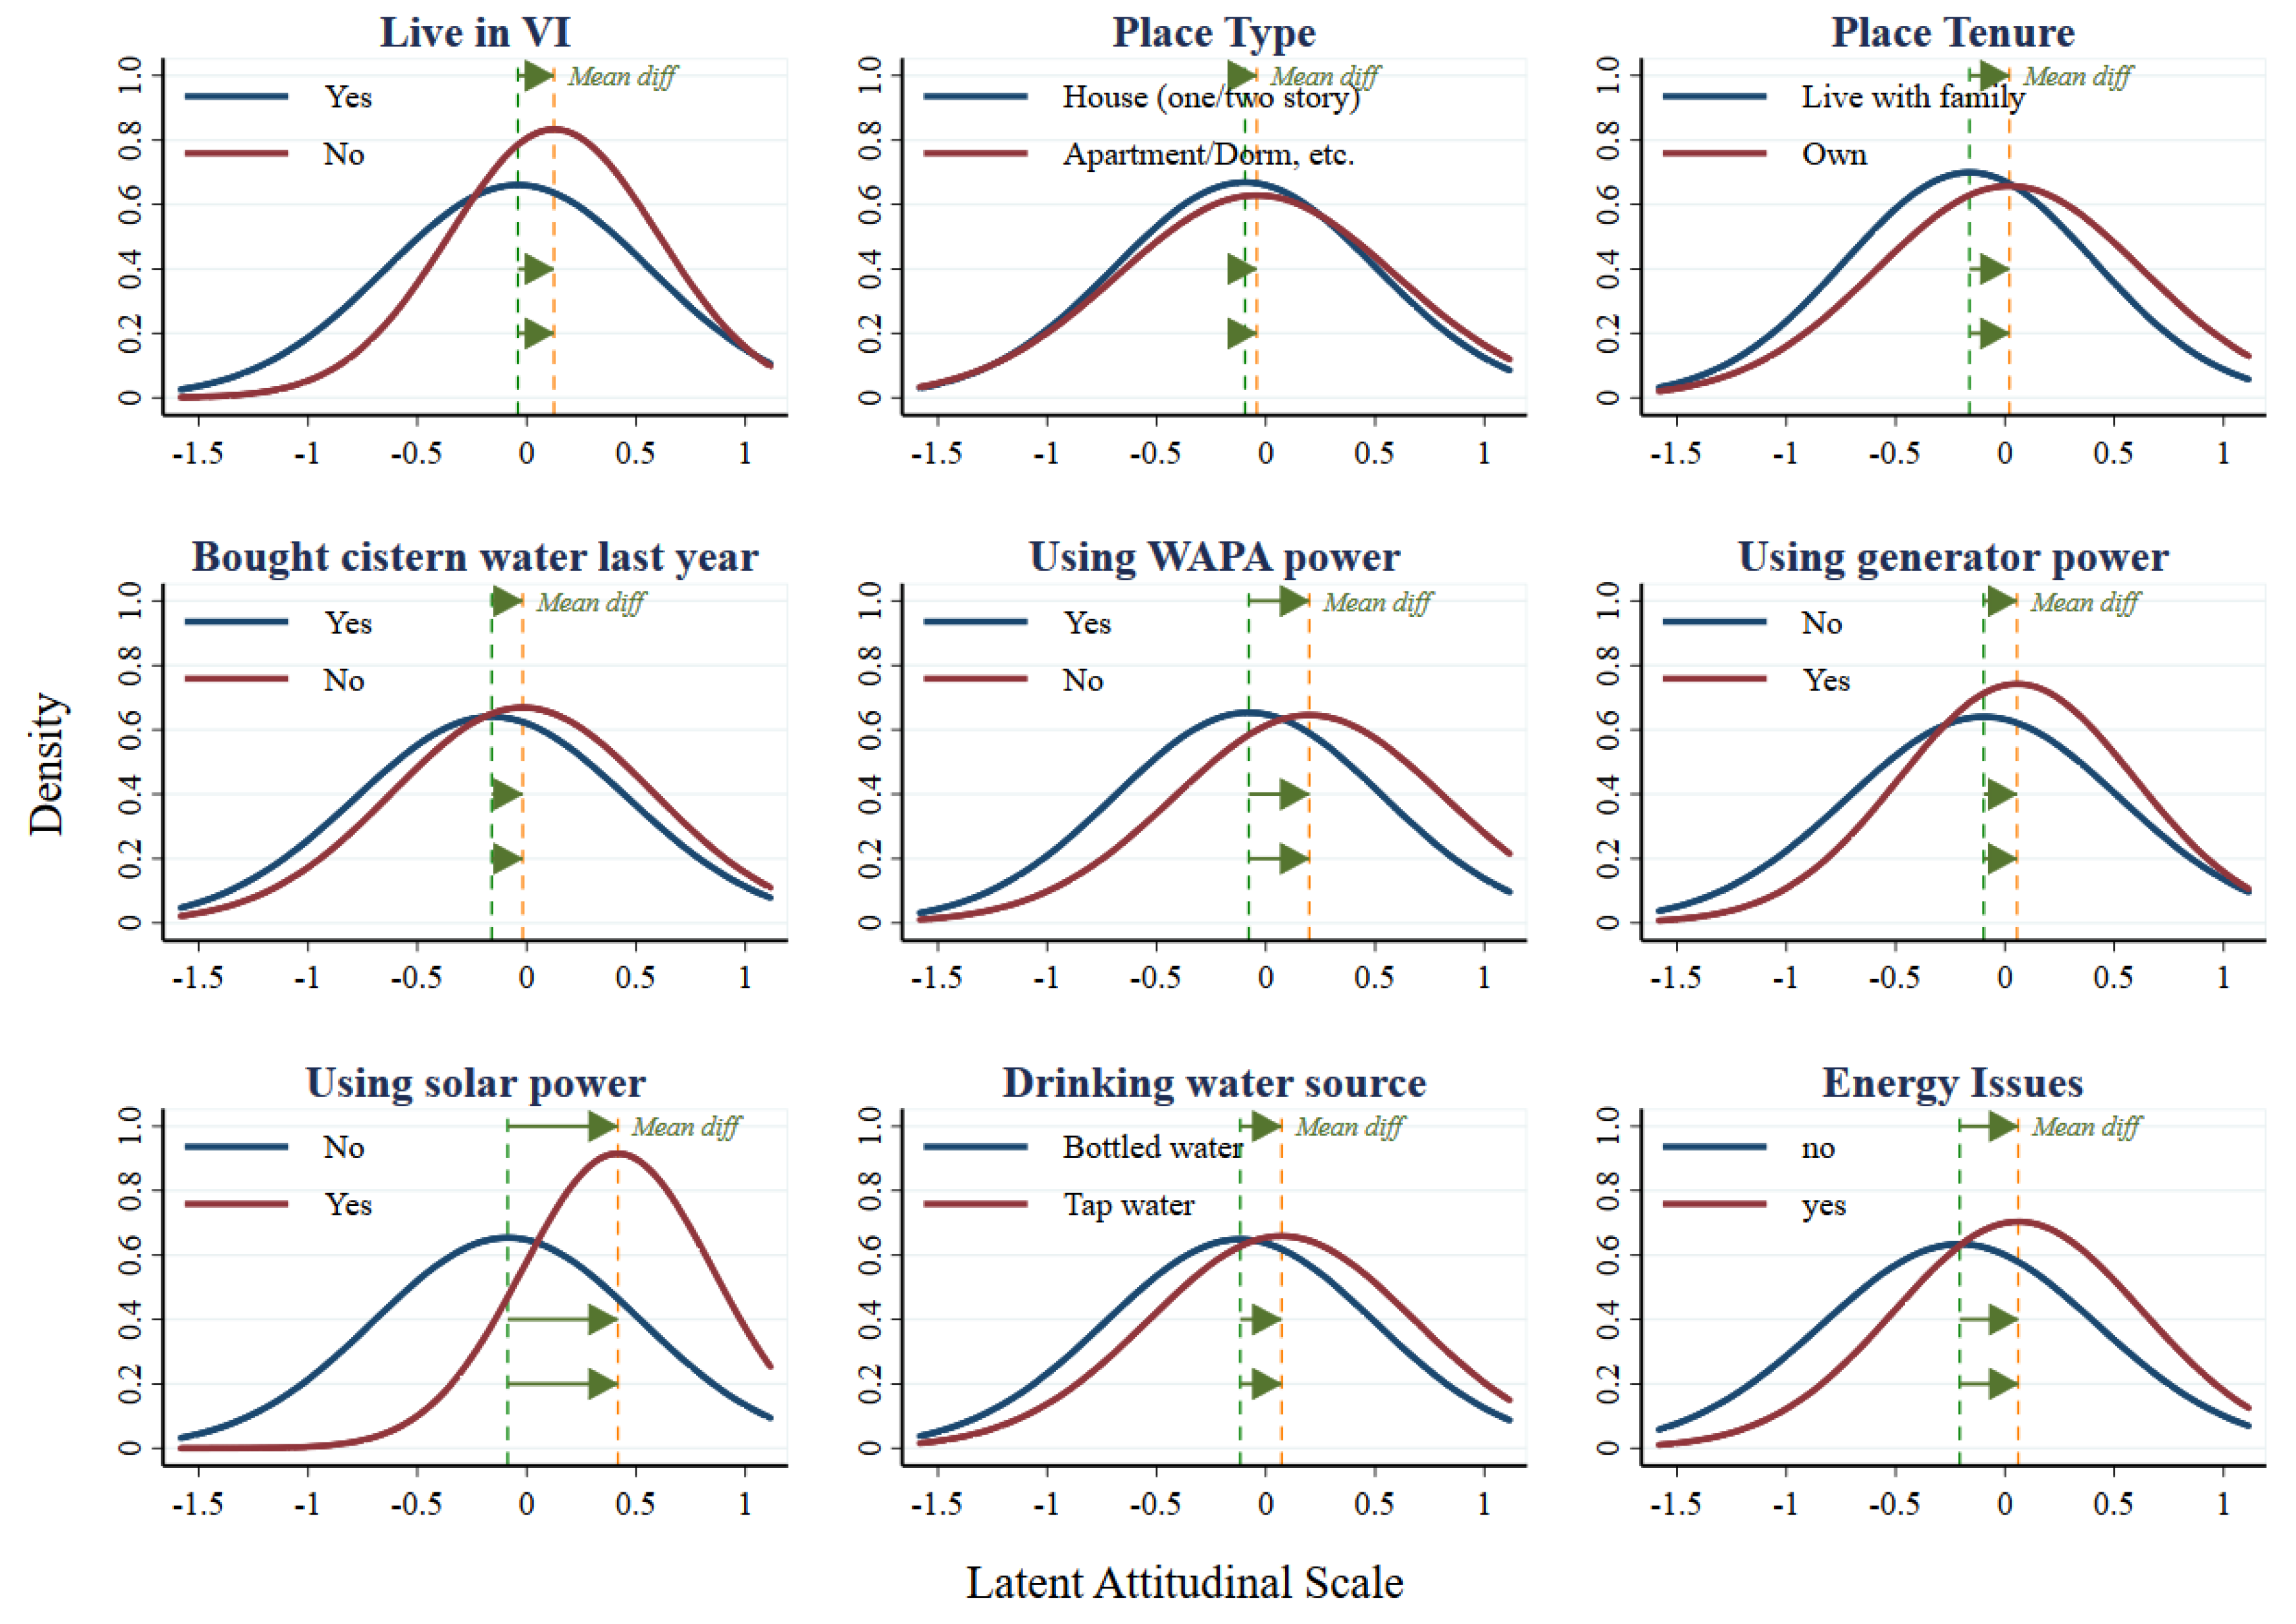
Participants who live in the US Virgin Islands have smaller mean scale scores than the ones who don’t (p < 0.001), and furthermore, their mean scale score is slightly negative on the scale. From those participants who live in the US Virgin Islands, the type of place they live do not appear to affect their mean scale scores (p = 0.3334), but the tenure of the living quarters does: participants who rent or own by themselves have smaller mean scale scores than those living with their family (p = 0.0167). The selected place-based characteristic scale comparisons among participant groups are shown in Figure 4.
In terms of general environmental attributes, the source of water significantly affects participant’s attitudes with participants collecting rain water through cistern systems having larger mean scale scores than the ones using city water (p = 0.0009). On the other hand, among participants who use cistern water, having to buy water to refill their cisterns in the past year is associated with statistically significant lower attitudinal scale scores (p = 0.0052). The use of alternative energy sources is clearly associated with differences in attitudinal mean scale scores. Specifically, participants who use WAPA (local Water and Power Authority) power, slightly smaller means in their attitudinal scores (p = 0.0414), compared to participants who use generator or solar power. These groups have increasingly larger mean scale scores (p = 0.0098, and p = 0.0002, respectively). Participants who had snorkeled before in coral reefs appear to have larger mean scale scores than the ones that have never experienced coral reefs in close contact (p = 0.0123), but the frequency of snorkeling does not affect their attitudes.
In terms of the water-energy nexus, participants who had issues with their water or energy systems tend to have significantly higher mean attitudinal scale scores than the ones that did not (with p-values of 0.0096 and 0.0000, respectively). It is more likely than not, that the limitations of both natural and systemic water-energy systems in small and economically disadvantageous areas such as the US Virgin Islands, reinforces, and perhaps, drives to an extent attitudinal formation and attitudinal change in terms of environmental conservation. The latter proposition is reinforced by the participant’s responses to the questions regarding whether or not they are engaged in active water or energy conservation measures. Specifically, respondents who are either somewhat concerned and aware or very aware and use active conservation in both water and energy systems have higher scale attitudinal values compared to respondents not concerned about conservation or are aware but not taking conservation action (p = 0.0004, for water conservation and p = 0.0000, for energy conservation systems respectively). The mean differences are larger for energy conservation systems than water conservation systems. To check the consistency between attitudes and (stated) behavior, we asked participants whether they flushed their toilet every time they used it or only when they need it (a common conservation practice in the Virgin Islands in the face of water scarcity). The comparative analysis of the attitudinal scale comparison across the response groups show that participants who engage in such conservation behavior have positively higher scale mean attitudinal values than the ones who don’t (p = 0.0000).
There exists a relative strong statistically significant difference between the mean attitudinal scale scores between participants whose decisions are influenced by factors related to climate change, versus those whose decisions remain unaffected (p < 0.0001). In addition, participants who are more likely to support stronger environmental policies at all time scales (currently, near term, distant future), have higher mean attitudinal scale scores that those who are either not sure or not likely to support such decisions (all three question comparisons yield p-values < 0.0001).
Participants who believe that their land and/or coastal environment in the Virgin Islands is generally unhealthy (very unhealthy or somewhat unhealthy) have larger mean scale scores than the ones believing that the land/coastal environment is healthy (p < 0.0001 on both questions regarding land and coastal environmental settings). Similar, yet less strong results hold true in terms of participant beliefs regarding the importance of the ecosystem health. Specifically, participants who believe that the health of our land and/or coastal environment is very important have smaller attitudinal scale scores than the ones who don’t hold such strong views (p = 0.0890). In addition, participants who believe that environmental conservation in general is very important, have considerately larger mean scale scores than the ones who don’t (p < 0.001). Finally, participants who reported that they feel that they know a lot about environmental conservation have larger mean scale scores than the ones that reported that they feel they know a few or nothing at all about environmental conservation issues (p < 0.001). Selected graphs of the environmental-based attitudinal comparisons among participant groups are shown in the following Figure 5.
3.3. Analyzing ATC Scales Using Item Response Theory (IRT) Models
An alternative methodology for assessing the cognitive latent scale as a mental model representation is the use of Item Response Theory (IRT) models. According to Cleophas et al. (2012) IRT models “(…) do not use reliability as a measure of their applicability, but instead use formal goodness of fit tests (…)”. In a nutshell, item response models represent a nonlinear estimation on a binary or categorical response pattern for each item (and sub-item, i.e., item class) in a scale. The nonlinear estimation of item response models follows a Gaussian exponential distribution function (Reckase and Reckase 2009; Drasgow and Parsons 1983).
We compared a number of IRT models on two broad estimation categories: those for ordinal categorical item classification, and those for binary item classification. The former are represented by the original ATC scale item response questions, and they reflect the 5-level Likert agreement categories. The latter represent reduced-form classification, where negative or neutral response categories (1–3) are recoded as 0 and positive response categories (4–5) are recoded as 1.
For the ordinal categorical ATC scale, we fitted four alternative IRT models, namely the Graded Response Model (GRM), the Partial Credit Model (PCM), the Generalized Partial Credit Model (GPCM), and the Rating Scale Model (RSM). The relative model performance comparison is shown in the top subpart of Table 7. Based on all three model performance estimated metrics (model fit −2*Log Likelihood (2LOGL), Akaike Information Criterion (AIC), Bayesian Information Criterion (BIC)), the best fit (minimum values) for ordinal categorical ATC scale response is the Graded Response Model (GRM) with −2LogL = −19,376.6, AIC = 38,933.3, and BIC = 39,371.6.
Similarly, for the binary categorical ATC scale, we fitted three alternative IRT models, namely the One-Parameter Logistic Model (1PL), the Two-Parameter Logistic Model (2PL), and the Three-Parameter Logistic Model (3PL). The relative binary model comparison is shown in the bottom subpart of Table 7. From the three alternative models, the best performance (minimum value of 2LOGL, AIC or BIC) is the Two-Parameter Logistic Model (2PL). The 2PL and 3PL models have the same log likelihood fit, but both the AIC and BIC estimated fit are slightly lower for the 2PL model. The selected model estimates are: −2LogL = −7924.1, AIC = 15,920.2, and BIC = 16,095.5.
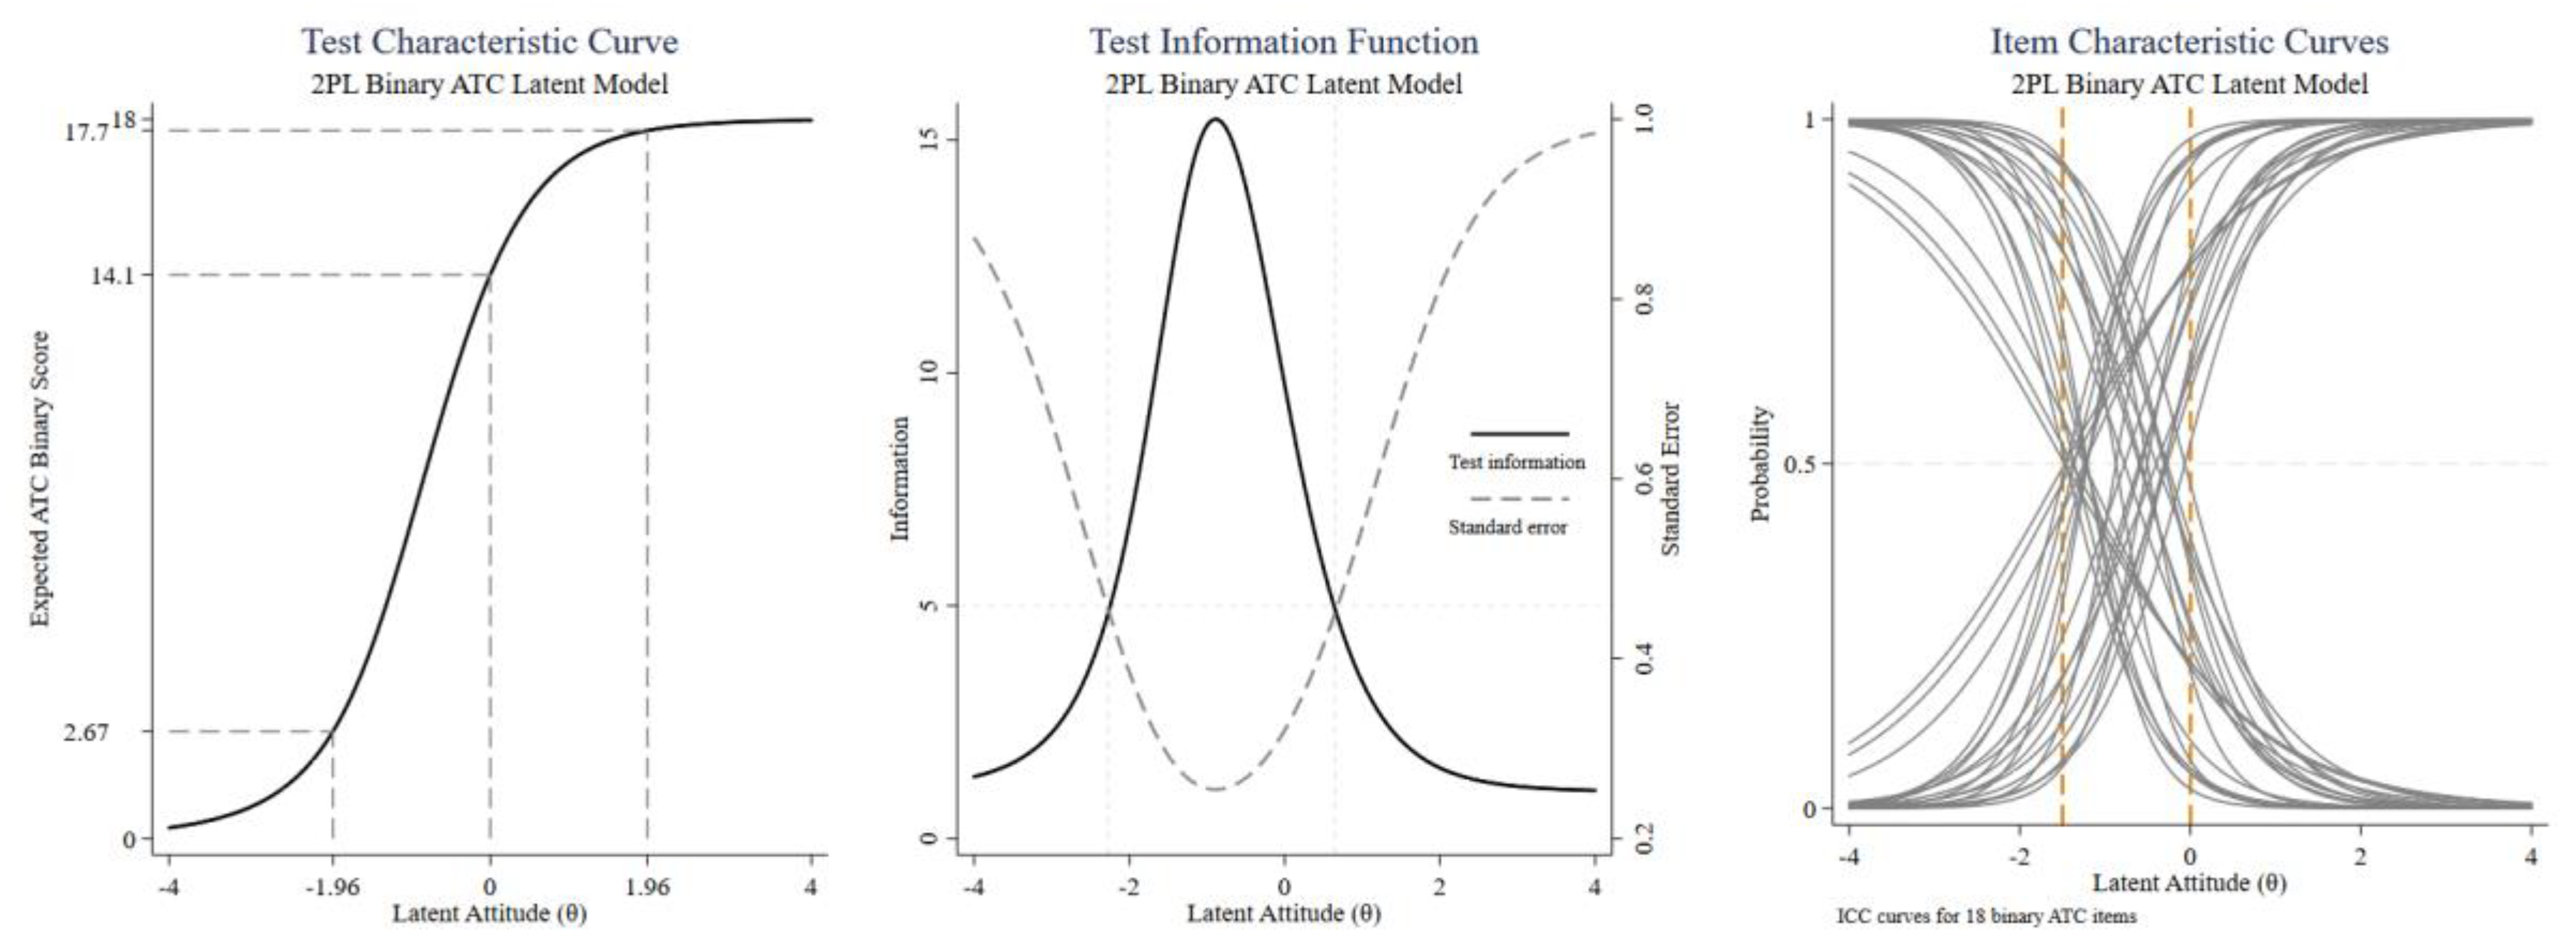
3.3.1. Estimating a Two-Parameter Logistic Model (2PL)
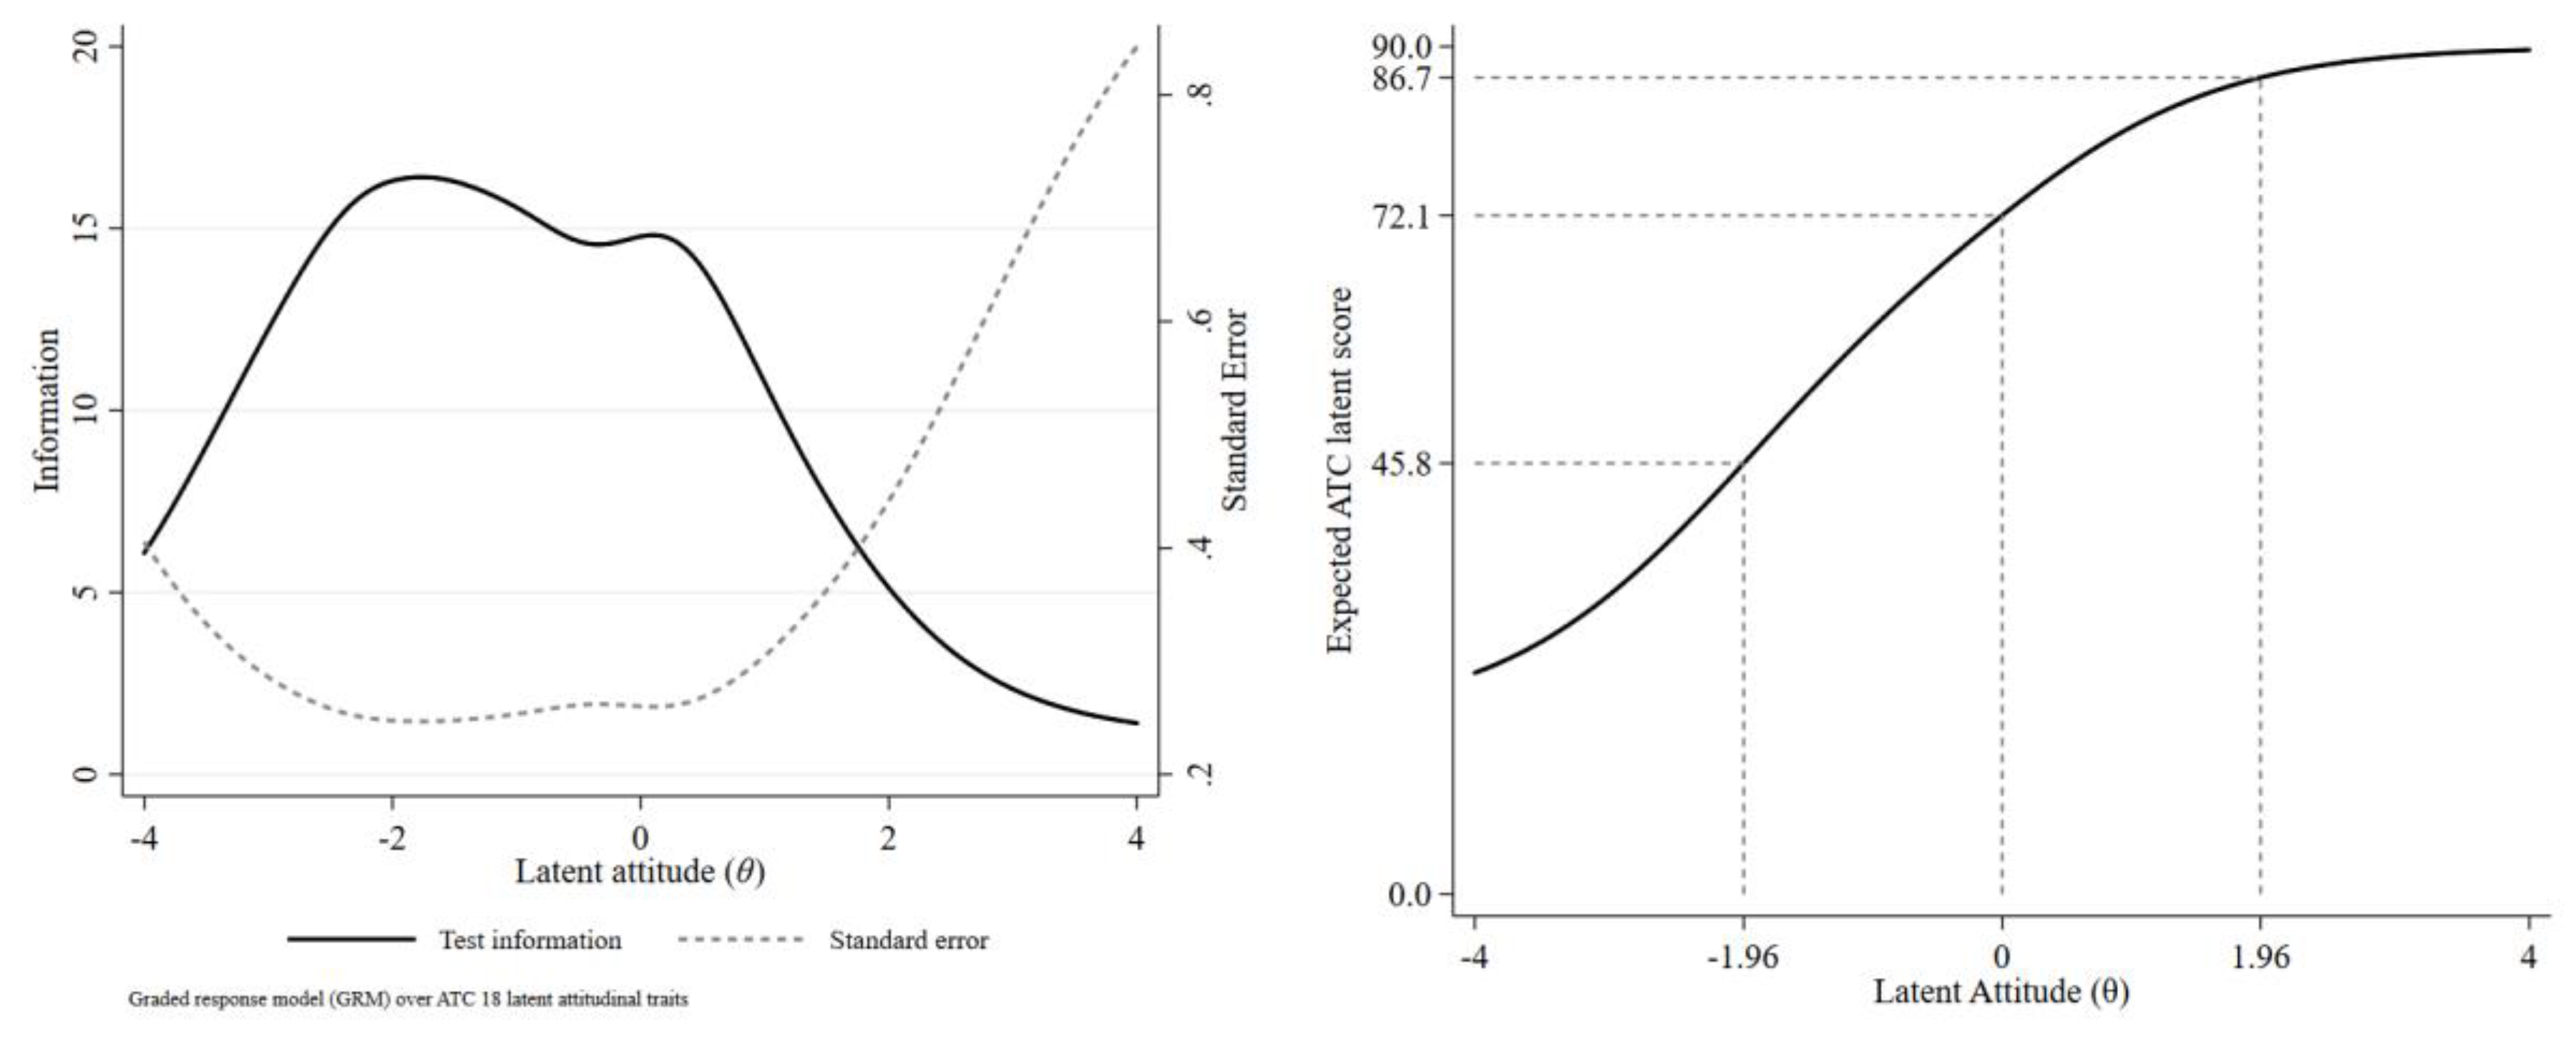
The 2PL model fits a logistic curve estimated results are shown in the following Figure 6. The left subgraph displays the overall test characteristic curve of the estimated latent response trait. Given the binary scale item response configuration, the minimum and maximum theoretically expected scale scores are 0 and 18 respectively. Given that the expected value of the estimated latent attitude trait (θ) follows a standard normal distribution, we can see that the majority of the ATC score values fall within the (2.7, 17,7) range for the 95% two-side confidence interval for the mean theta values. The test information function shows the information value curve for the 2PL model estimation, along with the standard error of the estimation. The majority of our predicted values fall within the (−2, 2) interval for theta, where the information is maximized. Finally, the item characteristic curves for the binary categorical responses are shown in the right subgraph. The distribution of attitudinal scores allow us to clearly define areas defined in the social judgment theory (Ajzen 2012; Petty and Cacioppo 1996) such as the latitude of rejection (below θ = −1.67), the latitude of acceptance (above θ = 0), and the latitude of noncommitment (between −1.67 and 0). These results indicate that respondents with generally negative or neutral attitudinal traits toward coral reef conservation can be persuaded to change their attitudes toward a more positive, conservation-favoring trajectory.
The results of the binary 2PL model estimation, albeit informative and insightful, nevertheless reflect a simplified assessment of latent attitudinal information obtained from the data, as the model requires the informational reduction of the Likert original categorical responses provided by the participants into a binary classification scheme, thus downscaling the value of information that can be obtained.
3.3.2. Estimating a Graded Response Model (GRM)
Fitting the graded response model (GRM) for the ATC scale uses an ordinal logit estimation of each of the 18-item observed variable towards the latent ATC scale. It uses a Bayesian EAP estimation using empirical mean and standard deviations as priors to estimate the latent variable distribution and its moments. The key unidimensional ATC scale-level statistics of the estimation are shown in Table 8.
The parameter estimates for the ATC latent semantic scale of the study are shown in Table 9. The factor loadings parameter, λ = 0.869. The slope parameter ranges from 1.374 to 3.284 with mean α = 2.170. The ordinal logit model estimates range from −2.77 ± 0.16 to 3.46 ± 0.25 in the case of the additive logit αθ + c model (cutoff c values), and from −1.65 ± 0.18 to 1.32 ± 0.97 in the case of the multiplicative logit α(θ − b) model (model intercept, b values). The χ2 statistics of the estimation (Table 9) as well as the marginal reliability and M2 marginal statistics in Table 8 indicate a very good model fit.
The GRM model estimated is equivalent with a generalized structural equation model (GSEM) using ordinal logit regression terms for each of the 18-items in the scale. In terms of the characteristics of the Bayesian estimation, the model estimates the conditional probabilities EAP (θ|u) of the logit model, with parameters αθ + ci, and α(θ − bi) where i is the number of graded model classes (i = 1, 2, 3, 4). For the ATC latent scale, the Kolmogorov-Smirnov hypothesis test allows us to retain the null hypothesis regarding normality of the distribution of the EAP(θ|u) model parameters with mean μ = 0 and standard deviation σ2 = 1. The K-S test statistic value was −0.00368 (p = 0.091).
Following the GRM model fit, we obtained the inferential estimation results for the empirical assessment of the ATC latent attitudinal trait (ability). The graphs in Figure 7 plot the overall (latent-base) information curve (along with the standard error of its estimates), and the cumulative test characteristic curve.
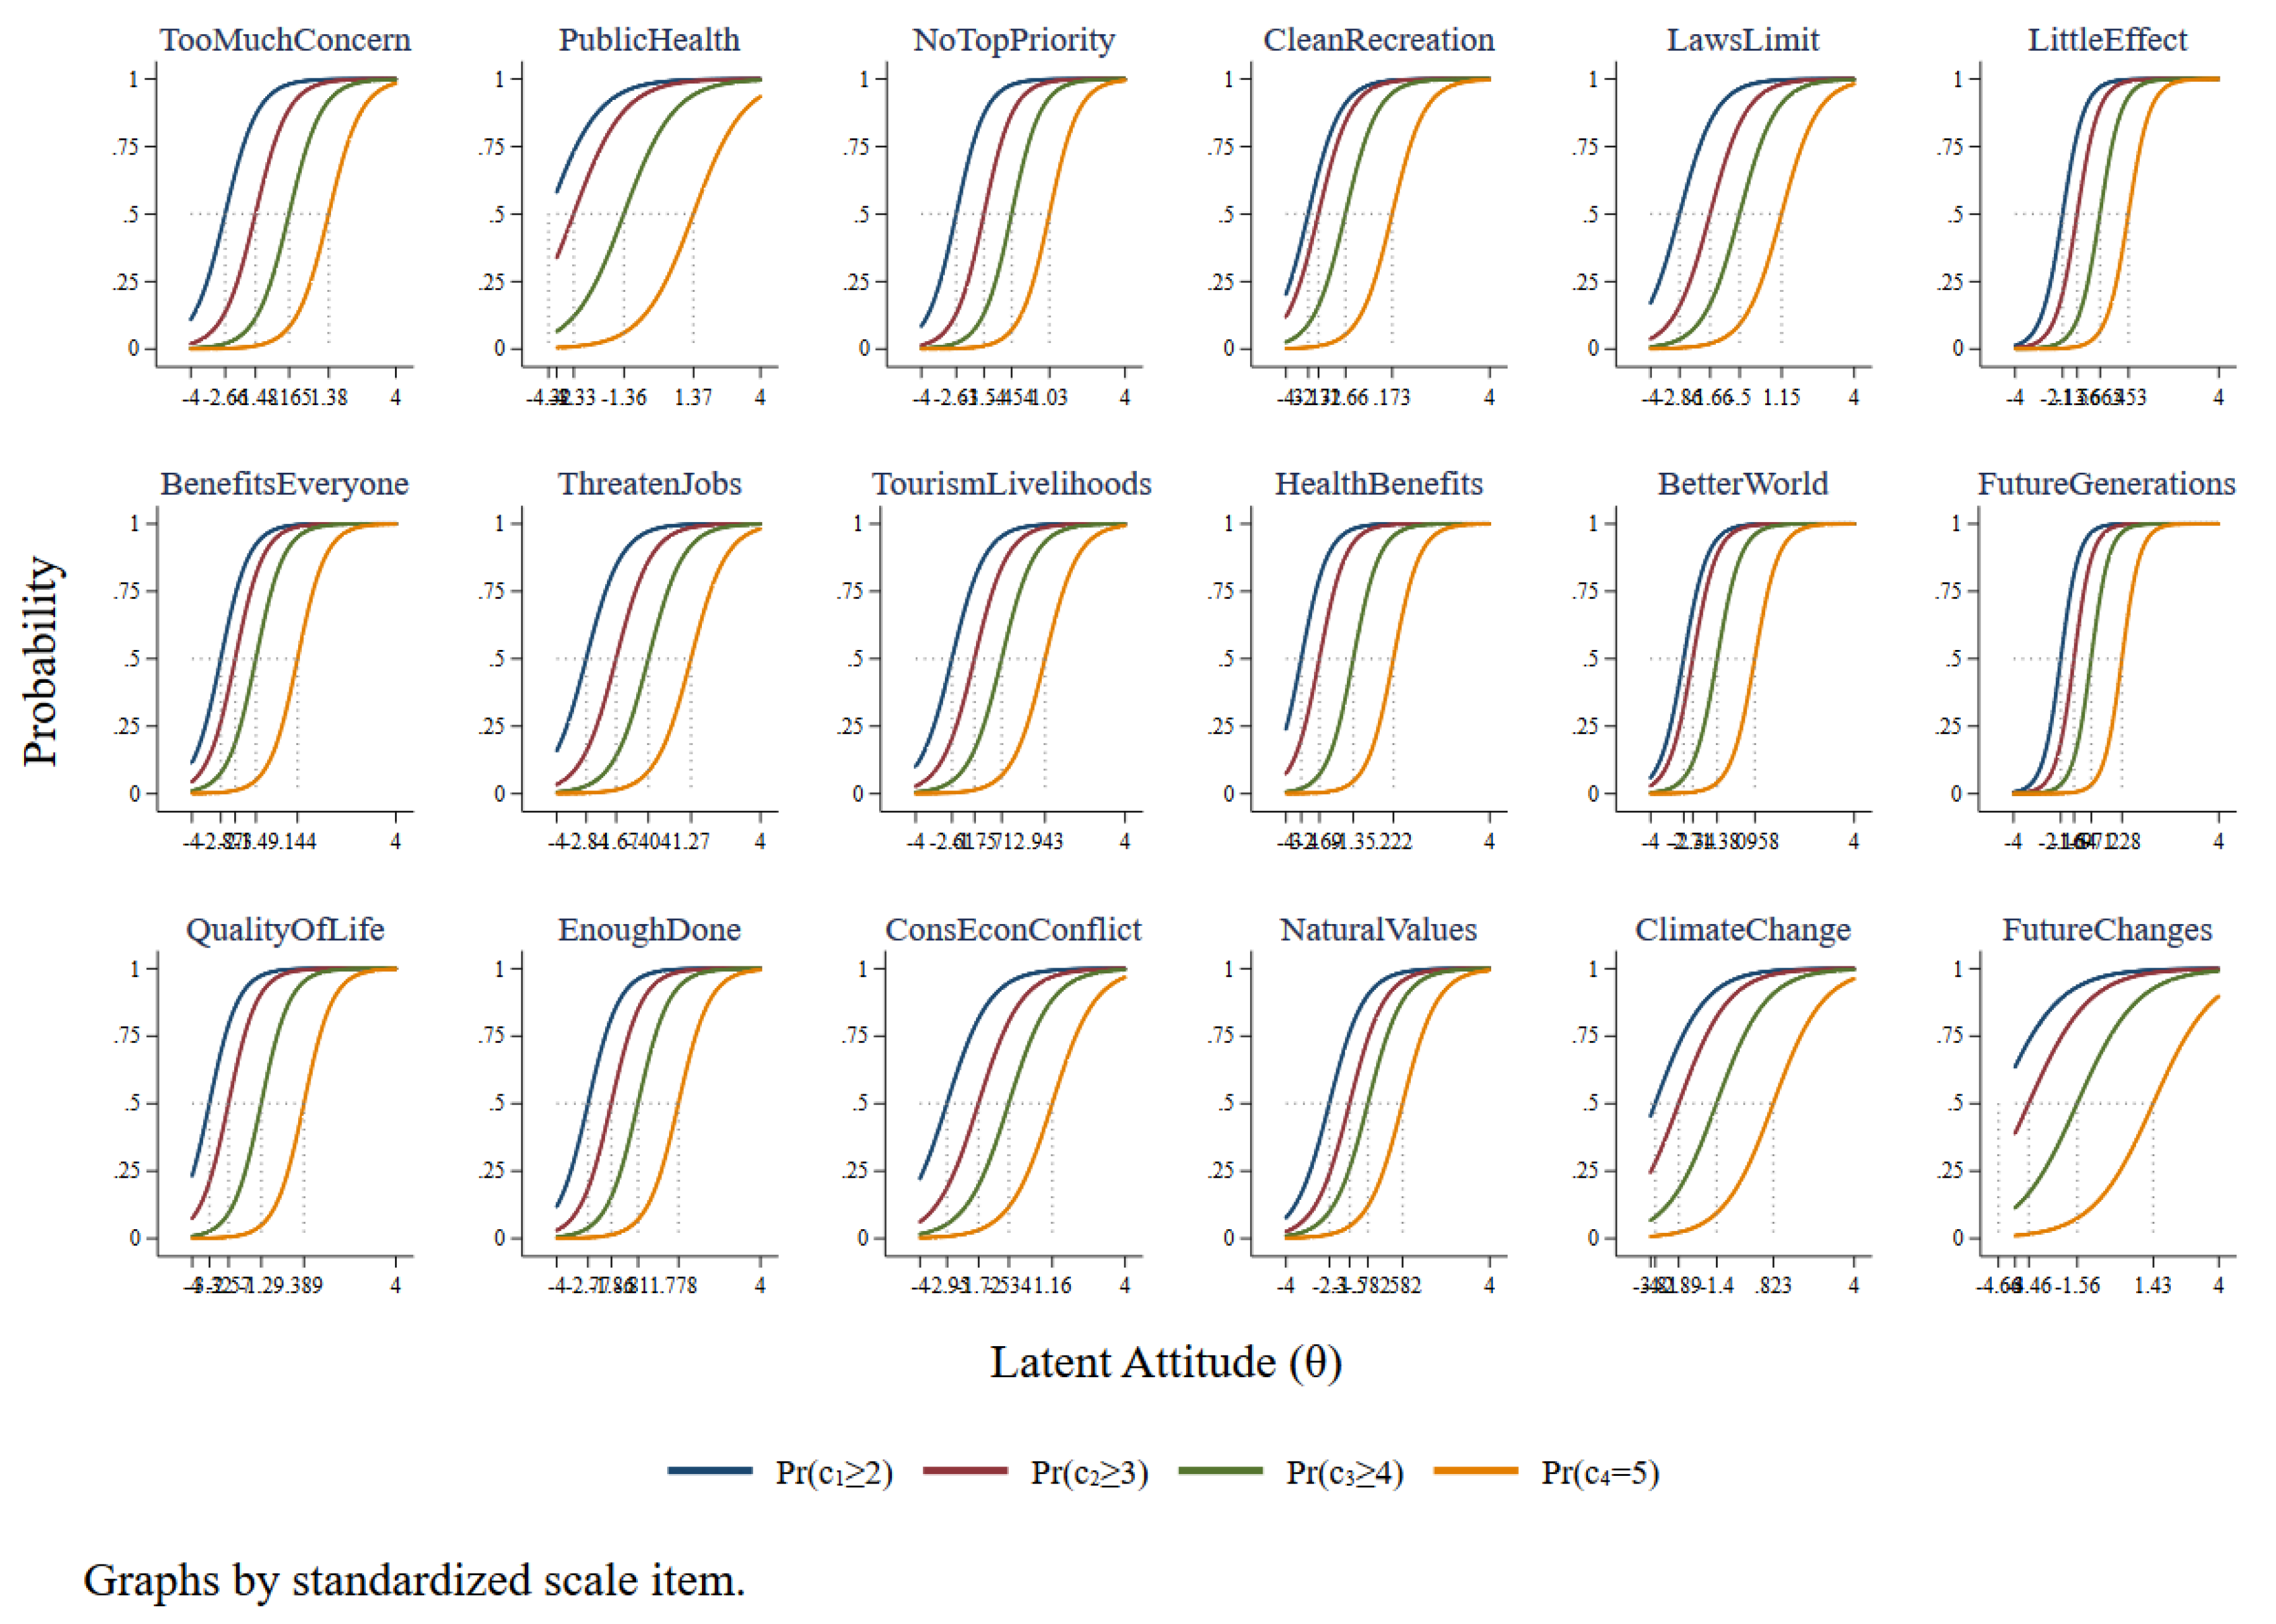
The item or boundary characteristic curves for each of the 18 of the items in the scale are shown as item-ordered subgraphs in Figure 8. The y-axis on each subgraph shows the overall probability estimates, while the x-axes plot the latent ability (ATC scale) estimates. In each subgraph, each line represents the cumulative probability function (CDF) of the item states (from the Likert scale, 0 = strongly negative to 4 = strongly positive). The threshold values where Pr(θ = 0.5) are indicated for each of the curves. i.e., where the % probability threshold exceeds 50%.
The item characteristic curves along with each item’s information curve of the GRM model estimation are shown in Figure 9. The solid colored lines represent the item state probabilistic score estimates with respect to the overall ATC latent attitudinal scale (ability, θ). The areas where each curve dominates the probability of any other states identify ranges of the ATC latent scale to be expected to reflect the true attitudinal state for each item. Items for which these areas a clearly distinct and have minimal overlap are generally ones where the value of information is higher.
The comparison of the GRM assessment of ATC mean scale scores by different participant attributes are shown in the following Table 10. The estimated scale group means are shown to be statistically different for gender (females have stronger positive attitudes, p = 0.013), ethnicity (Black/African American have more negative attitudes, p = 0.0001), age group (participants above 25 years old have stronger positive attitudes, p = 0.0002), education (participants with college degree and above have stronger positive attitudes, p < 0.0001), and snorkeling before (participants who snorkeled before in coral reefs have stronger positive attitudes, p < 0.0001). On the other hand, there appear to be no statistically important differences in attitudinal scale responses for participants living in the Virgin Islands or not, or for participants who use solar power in their home or nor. Finally, participants with household income above $90,000 appear to have slightly or marginally more positive attitudes than the ones with household income below that level (p = 0.028).
3.4. Latent Trait Analysis Using Structural Equation Models for Scale Development
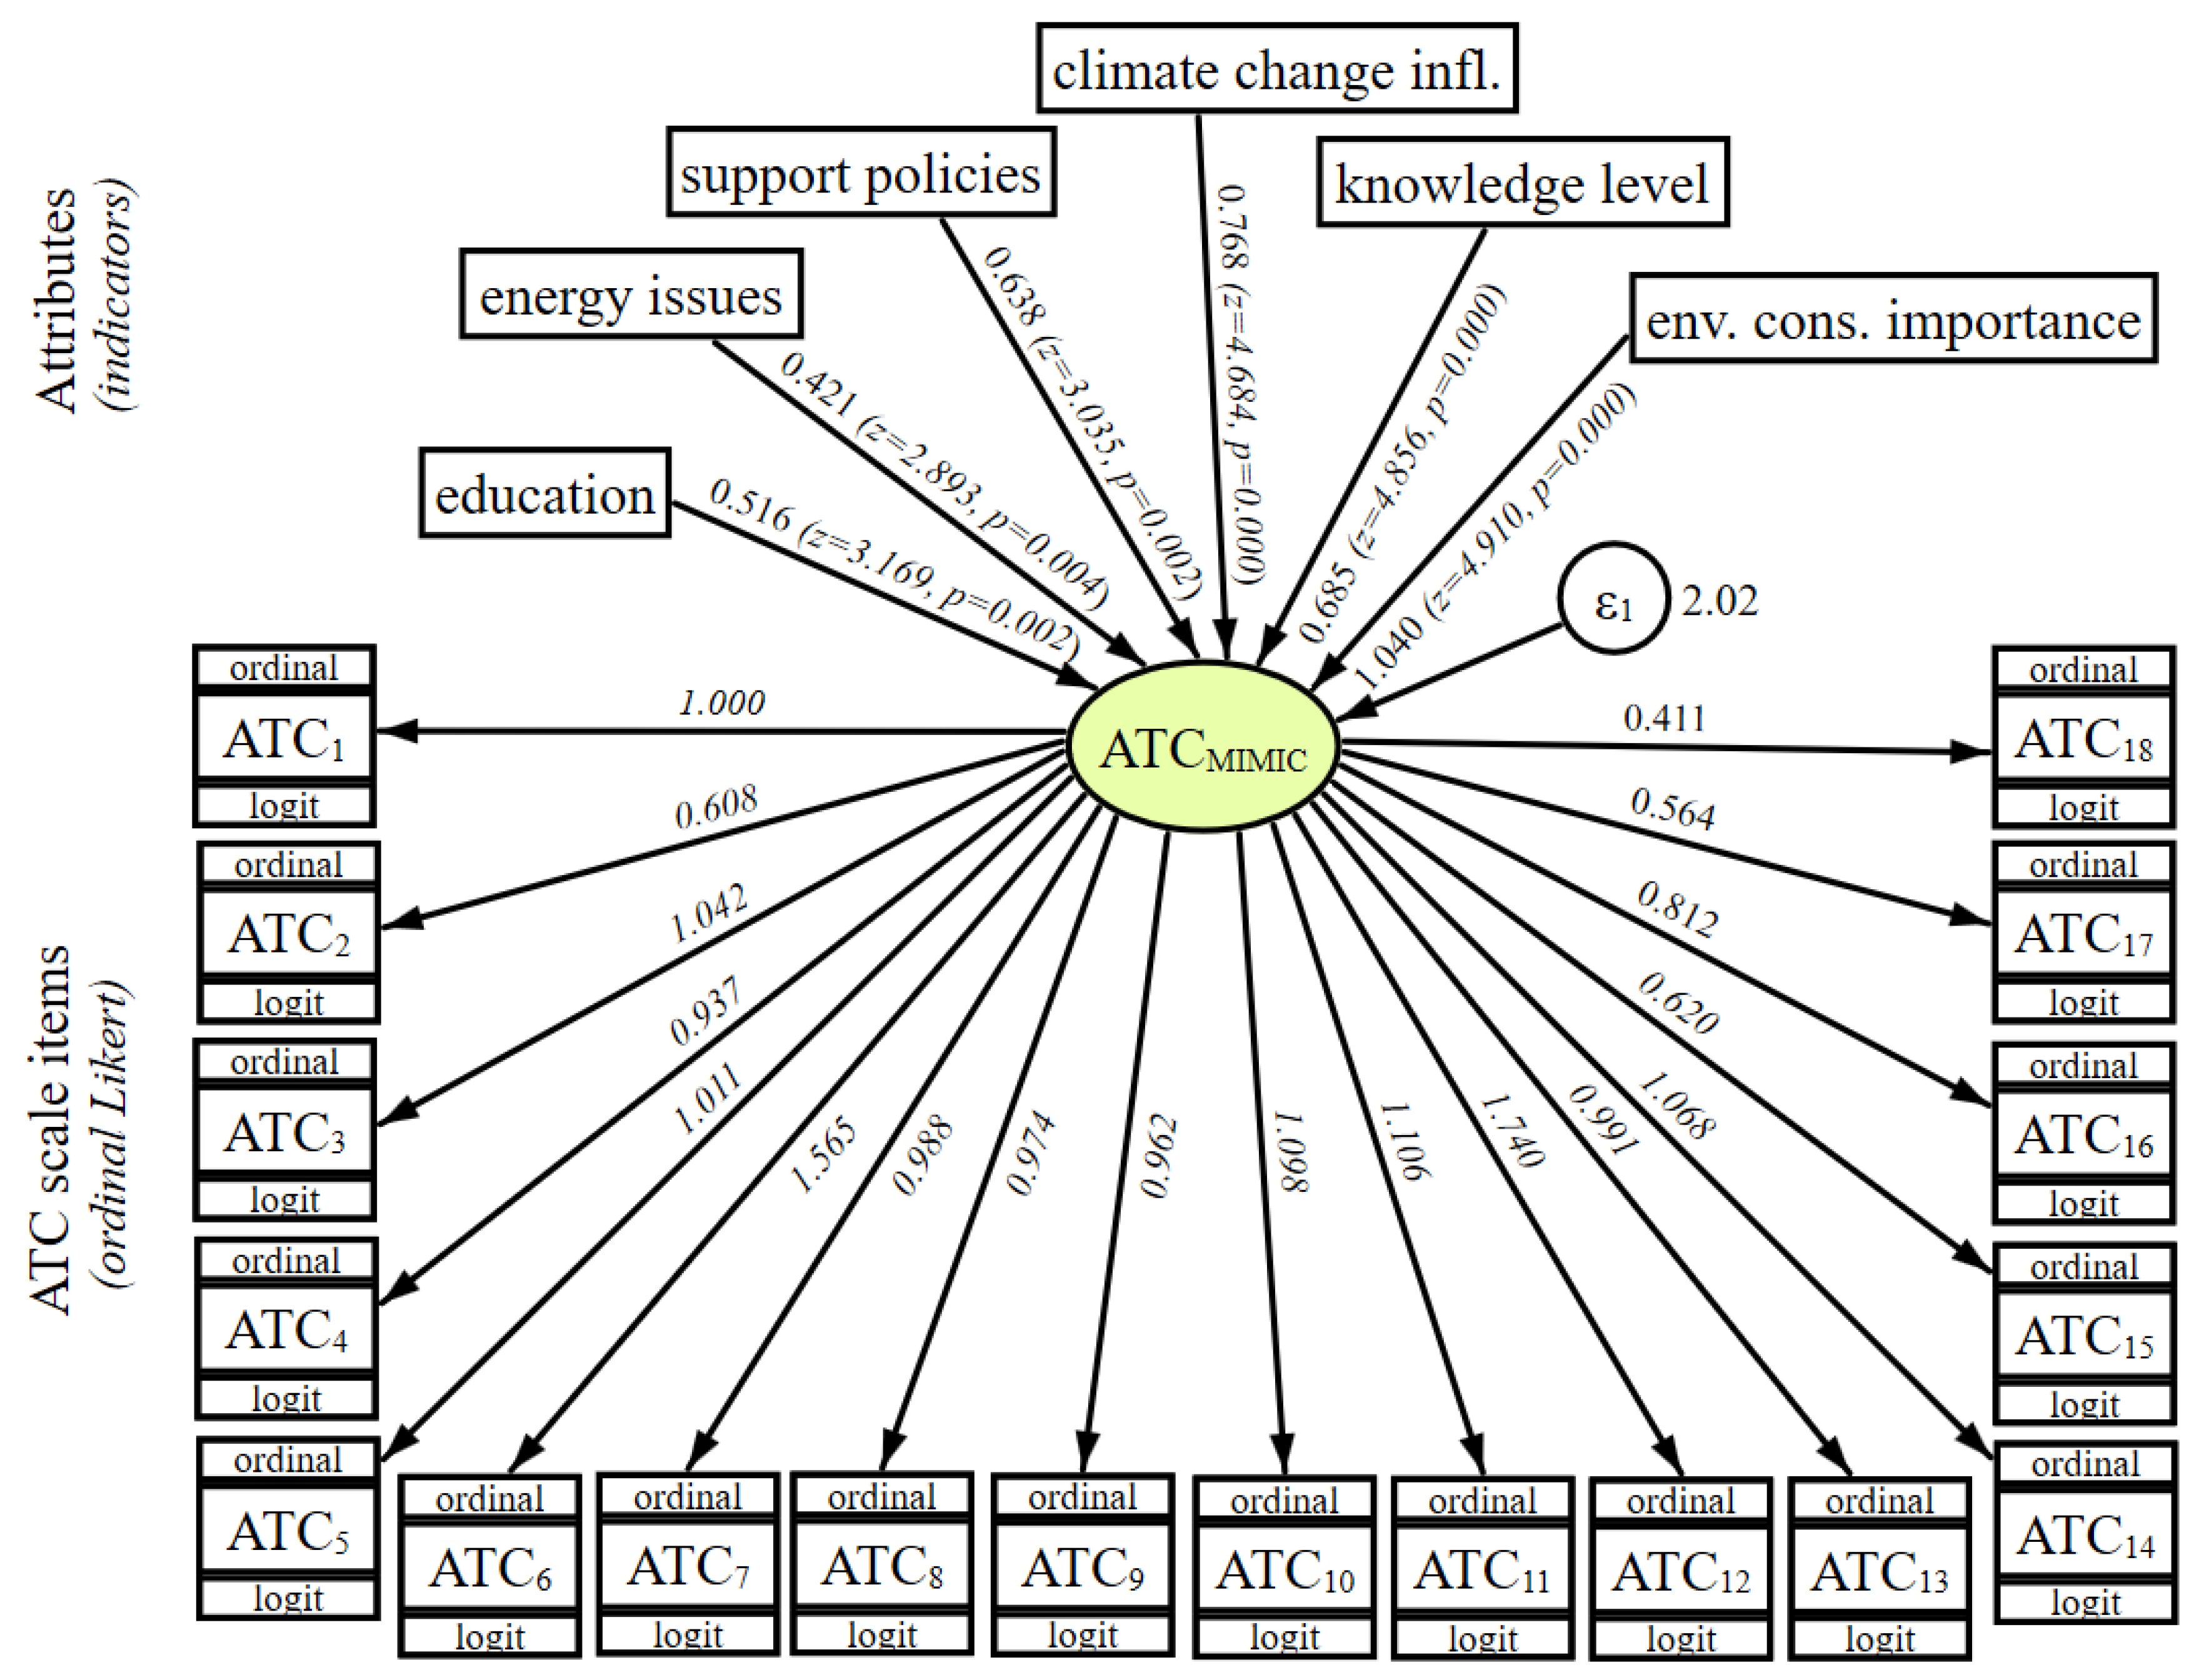
We used a structural equation model design structure to estimate the latent attitudinal effect of the ATC scale. The overall SEM model design is shown graphically in Figure 10 and includes the fitted model parameters. The model used n = 884 observations, over the 18 scale items (dependent variables). The log-likelihood of the model estimation was −2LogL(model) = 19,404.45 with 37 degrees of freedom. The Akaike’s information criterion and the Bayesian information criterion was AIC = 38,882.89 and BIC = 39,059.92 respectively. The overall equation-level goodness of fit gave us an adjusted R2 = 0.908. The likelihood ratio tests for both the model vs. saturated and the baseline vs. saturated configurations was statistically significant with p < 0.0001: (152) = 1820.08, and (153) = 6442.23. The population-based root mean squared error of the approximate ML solution was RMSEA = 0.111 ranging between 0.107 and 0.116 (p < 0.0001). In comparing the SEM model estimates to the baseline model, the comparative fit index is CFI = 0.735 and the Tucker-Lewis index, TLI = 0.733.
The unstandardized (constrained) estimated latent ATC scale mean is 2.558 (in the 0–4 Likert scale for the ATC1-18 items). The standard error of the ATC mean scale estimate is 0.018, with z-statistic value for the mean z = 80.49 (p < 0.001). The 95% CI for the mean are [2.495, 2.620]. Thus, the mean scale parameter is closer to the positive attitudinal level (since 2 = neutral and 3 = positive). We standardized the SEM-estimated ATC scale by constraining each item’s mean empirical value from the data. The resulting standardized SEM attitudinal scale (ATCSEM) has a mean of 0 with standard error of the estimated mean of 0.37. The estimation results are congruent and compatible with both the Cronbach’s alpha scale reliability estimates and the GRM model estimates presented in the previous section.
3.5. Evaluating the Congruency or Concordance between Alternative Latent Cognitive Scale Constructs
An important question of the analysis is the inherent cognitive nature of the relationship between the constructed latent trait scales estimates. What is the degree of association among study participants between these latent scale estimates? The following figure shows the level of association between the various latent traits. We can thus see that while the majority of observations fall within the concordant regions (i.e., showcase a level of consistency between these estimated latent traits).
We used the Hotelling T2 statistic, a multivariate test equivalent to the bivariate likelihood-ratio test (Mardia et al. 1979) for comparing the equality of means across the all estimated ATC latent scale coefficient estimates. The T2 statistic asymptotically approximates 0, with the F(2,882) = 0.00 (p = 0.9999). Therefore, we cannot reject the null hypothesis of equal means of the alternative ATC scale coefficient estimates at almost any level of statistical significance.
The correlation coefficients among these latent scale coefficient estimates (including also the summative composite score of the 18-items) show a very high degree of associative concordance, on average above 90%, depending on the correlational statistic used. The bi-variate Spearman’s and Kendall’s correlation coefficients for the four variables (composite and three estimated latent scale coefficients) are shown in the following Table 11.
The characteristics of associative congruency among the alternative ATC scale estimations and across the survey item strata are shown as a bivariate scatterplot matrix in Figure 11. Each of the subgraphs represents one of the estimated scales in the study. As can be seen from the scatterplot graphs, the relationship between the summative composite scale scores and both the alpha-reliability scale estimates and the generalized SEM empirical Bayes estimates of the latent scale is approximated linear, while the relationship between the IRT GRM empirical Bayes latent scale estimates is exponentially nonlinear.
In order to examine closely the nature of the nonlinear relationship between the alternative scale estimates, we performed a best fit analysis. As can be seen in Figure 12, the best nonlinear fit between the Alpha-estimated ATC score (dependent) and the GRM-estimated latent ATC score (independent) was produced from 2nd order polynomial fit (). The parameter estimates for the fit (with 95%CI) was a = −0.1098 (−0.1264, −0.0932), b = 0.9667 (0.9533, 0.9800), and c = 0.1099 (0.0994, 0.1203) for normalized μx = 0 and σx = 0.6061. The adjusted R2 = 0.9585 (SSE = 33.85, RMSE = 0.196).
4. Discussion
The evaluation of the 18-item ATC scale allows us to confidently confirm the consistency of the survey instrument to measure attitudinal state and formation, and how well such measurements capture the participant population strata attitudes in relation to the concept of environmental conservation in coral reef social-ecological systems. The cross-strata comparison of scale reliability also allows us to generalize our inferences within our study population and across a wider geographic diversity.
Participants who engage in pro-environmental behaviors and activities (e.g., ecotourism, experiential social learning, environmental scientists) have steeper and more cohesive structure in their attitudinal scale formation compared to the broader community participants (see Figure 2).
Our results indicate statistically significant differences in environmental attitudes toward coral reef conservation across a range of different demographic, physical, and socioeconomic characteristics of participants. Female, older (above 25 years old), and more educated participants exhibit a statistically significant higher level of pro-conservation attitudes (see Table 6 and Figure 3). Conversely, Black/African American, and local Caribbean participants exhibit a statistically significant lower level of pro-conservation attitudes (see Table 6 and Figure 3), providing evidence of weaker sense of place and ties to coral reef conservation compared with other ethnicities and locations.
In terms of residential, physical and socioeconomic characteristics, our study found statistically significant differences in latent attitudes toward coral reef conservation among a number of characteristics: place of residence (higher attitudes for people not living in the US Virgin Islands, see Table 3 and Figure 4); residential type and tenure (higher for people living in houses, and for homeowners, from Table 3 and Figure 4); water consumption patterns (higher for people conserving more water and for participants using tap water as their drinking source, from Table 3 and Figure 4 and Figure 5); electricity use (higher for people with less dependency in grid-tied power, even higher differences for participants using solar power and for participants who are concerned and having issues with their energy supply and use, from Table 3 and Figure 4 and Figure 5).
In terms of more general pro-social attributes, actions and behaviors, the results indicate stronger levels of latent attitudes toward conservation among participants who engage in environmental activities, promote or support water and energy conservation measures and environmental policies, are concerned about climate change, environmental health, and take interest in learning and enhancing their environmental knowledge related to environmental conservation, as can be seen from Table 3 and Figure 5.
These results indicate a strong connection between perceived attitudes toward environmental conservation, and individual or socially relevant environmental behaviors, knowledge, and action.
Finally, our results show how robust and reliable are our latent scale attitudinal estimates by comparing our scales across different methodological implementations (alpha estimates, GRM models, SEM models). Overall our results provide a consistent, reliable, and statistically robust estimation of measuring environmental attitudes toward environmental conservation in coral reef social-ecological systems.
5. Conclusions
A number of very valuable and useful conclusions can be drawn from this study and analysis of participant’s attitudes toward environmental conservation. These can be broadly divided into distinct categories, namely ecological, environmental, social, and socioeconomic groups. From the latent attitudinal scale analysis, the survey responses, and the comparative attributional analysis of the results, we can make a range of inferences. Such inferences can relate our findings to the impact and influence in policy frameworks, conservation actions and activities, or future decision making in support of broadening, deepening, and promoting positive attitudinal change. These inferences are listed in the following Table 12.
The inferences presented here have both practical and theoretical significance. Their practical significance relates to the potential relevance to current or future activities and programs that can be designed to take advantage the attitudinal formation and composition of citizens and local community participants toward environmental conservation. They can also be used to ground and provide empirical evidence in support of sound policies aimed in promoting coral reef and environmental conservation in the US Virgin Islands and the Caribbean region as a whole. It is important to note the importance of all ecological, environmental, social, and socioeconomic considerations in the formation of latent attitudes toward conservation and the need for policies to incorporate, address, and digest all these different and diverse versions of reality. In terms of the theoretical significance, our research analysis clearly shows the presence, effect, and influence of coupled and integrated social-ecological systemic interactions in attitudinal formation. Coupled social-ecological realities do not only have physical and directly tangible dimensions or manifestations, but are also part of a broader, latent, and often intangible mental representation at the individual and collective social level. The interaction between our social perceptions of reality and our ecological and environmental state or condition of our natural resources represents an important dimension of environmental and coral reef conservation.
Limitations, Opportunities, and Future Research
The research analysis presented in this study has certain limitations, both technical/methodological, and theoretical. First, while certainly the latent scale analysis of reliability and consistency allow us to generalize our inferences, larger samples from more diverse geographic and demographic participant pool may improve the results including reliability coefficients. Second, statistical inferences for all ATC scale models (Composite, Alpha, GRM, SEM) are subject to statistical assumptions related to each particular method, and statistical hypotheses made in their comparative evaluation. Third, the validity of the latent scale measurement weakens when the contextual link is not present, i.e., the context of coral reef conservation. It is possible that inferences with respect to other areas of environmental conservation (for example, air quality, brownfield development, land development) may be limited, albeit unlikely.
At the same time, the reported research provides some opportunities for further and future explorations and research. In this respect, while the existing study focused on attitudes and stated behaviors, did not assess, or measure actual or revealed behaviors. Studies in the area of social psychology and the psychology of attitudes indicate circumstances and situations where attitudes and behaviors may be inconsistent, or where stated and revealed behaviors may differ (Petty and Cacioppo 1996; Hanley and Alvarez-Farizo 2002). Future research in comparative assessment of stated versus revealed behaviors related to environmental conservation can shed further research light into these issues.
Potential future research opportunities related to this study include evacuating a range of policy and decision-theoretic approaches to strengthening environmental conservation outcomes by promoting positive attitudinal and social-ecological change. This study provides a solid methodological, theoretical, and evidence-based framework with which the policy questions related to coral reef conservation actions can be based and be supported upon. Our inferences raise a few decision-based and policy-related potential questions that warrant further and deeper scientific investigation at both the ecological/environmental and the social/socioeconomic dimensions.
We believe that the presented, assessed, and analyzed 18-item latent attitudinal scale (ATC) can be generalized, standardized, and adapted for use in different communities, geographic regions, and situations in order to assess individual and collective social-ecological attitudes toward environmental conservation.
Finally, our study results make an empirical assessment of the theoretical dimensions of social-ecological systems (SES). We believe that our work demonstrates both the validity and the usefulness of addressing environmental and coral reef conservation as a truly integrated coupled system of social-ecological interactions. Within such SES our individual, collective, social, and institutional perceptions, actions, and arrangements operate and function. Without such firm and comprehensive operant understanding of its functionality, it will be difficult to address and respond to our contemporary environmental challenges.
Author Contributions
K.A. conceived, designed, and implemented the survey project. K.A. performed the analysis of the data and wrote the manuscript. Project collaboration and aid provided in the design of questions and data collection is acknowledged in the relevant section.
Funding
Partial funding of this research is provided by the National Science Foundation, Office of Integrated Activities, through the Virgin Islands Experimental Program for Stimulating Competitive Reearch (VI-EPSCoR), award No. 1355437, entitled “Mare Nostrum Caribbean: Stewardship through Strategic Research and Workforce Development”. Additional partial funding was provided by the National Science Foundation, award number 1243510, entitled “PIRE: Context Sensitive Implementation of Synergistic Water-Energy Systems.”
Acknowledgments
The author wishes to acknowledge Kimarie Engerman and Latisha Ramsey for earlier work on survey instrument item questions. Special acknowledgments for Christina Chanes for planning community events for survey data collection, Elena Kobrinski, Edward Kelliher, and Akil Richardson for aiding in survey data collection. Finally, the author wishes to gratefully acknowledge the contributions of the study participants in providing valuable information and data without which this study would not be possible.
Conflicts of Interest
The authors declare no conflict of interest. The founding sponsors had no role in the design of the study; in the collection, analyses, or interpretation of data; in the writing of the manuscript, and in the decision to publish the results.
Appendix A. Alpha Reliability Analysis
We computed analytical scales for the ATC items using Alpha reliability analysis scores. We computed one overall scale for all studies in the dataset, as well a separate scale for each of the four studies in the dataset.
Appendix A.1. Alpha Latent Scale for All Studies
The results of the reliability analysis for all studies are shown in the following Table A1. The overall alpha value for the scale, α = 0.883, and the overall scale inter-item correlation, ρ = 0.296. The maximum alpha (if item is removed) for the scale across all items is 0.877. The overall scale alpha coefficient is larger or equal than any of the alpha values if the item is removed from the scale, which indicates that the number of items in scale provide are best explain the latent attitudinal construct.

Table A1.
Results of the Alpha reliability analysis for all studies.
| Item | ITC | IRC | IIC | Alpha |
|---|---|---|---|---|
| TooMuchConcern | 0.6140 | 0.5487 | 0.2929 | 0.8756 |
| PublicHealth | 0.4518 | 0.3704 | 0.3053 | 0.8820 |
| NoTopPriority | 0.6231 | 0.5588 | 0.2922 | 0.8753 |
| CleanRecreation | 0.5609 | 0.4897 | 0.2969 | 0.8778 |
| LawsLimit | 0.5617 | 0.4905 | 0.2969 | 0.8777 |
| LittleEffect | 0.7102 | 0.6574 | 0.2855 | 0.8717 |
| BenefitsEveryone | 0.5965 | 0.5291 | 0.2942 | 0.8763 |
| ThreatenJobs | 0.5714 | 0.5013 | 0.2961 | 0.8773 |
| TourismLivelihoods | 0.5843 | 0.5155 | 0.2952 | 0.8768 |
| HealthBenefits | 0.6486 | 0.5875 | 0.2902 | 0.8742 |
| BetterWorld | 0.6472 | 0.5859 | 0.2903 | 0.8743 |
| FutureGenerations | 0.7179 | 0.6662 | 0.2849 | 0.8714 |
| QualityOfLife | 0.6042 | 0.5377 | 0.2936 | 0.8760 |
| EnoughDone | 0.6071 | 0.5409 | 0.2934 | 0.8759 |
| ConsEconConflict | 0.5288 | 0.4543 | 0.2994 | 0.8790 |
| NaturalValues | 0.5601 | 0.4888 | 0.2970 | 0.8778 |
| ClimateChange | 0.4294 | 0.3463 | 0.3070 | 0.8828 |
| FutureChanges | 0.3967 | 0.3113 | 0.3095 | 0.8840 |
Appendix A.2. Alpha Latent Scale for Ecotourism Survey
The results of the reliability analysis for the Ecotourism survey data are shown in the following Table A2. The overall alpha value for the scale, α = 0.870, and the overall scale inter-item correlation, ρ = 0.271. The maximum alpha (if item is removed) for the scale across all items is 0.864. The overall scale alpha coefficient is larger or equal than any of the alpha values if the item is removed from the scale, which indicates that the number of items in scale provide are best explain the latent attitudinal construct.
Table A2.
Results of the Alpha reliability analysis for the Ecotourism survey study.
| Item | ITC | IRC | IIC | Alpha |
|---|---|---|---|---|
| TooMuchConcern | 0.5158 | 0.4371 | 0.2745 | 0.8654 |
| PublicHealth | 0.5142 | 0.4353 | 0.2746 | 0.8655 |
| NoTopPriority | 0.5598 | 0.4856 | 0.2712 | 0.8635 |
| CleanRecreation | 0.4365 | 0.3508 | 0.2803 | 0.8688 |
| LawsLimit | 0.4522 | 0.3678 | 0.2792 | 0.8681 |
| LittleEffect | 0.6408 | 0.5763 | 0.2652 | 0.8599 |
| BenefitsEveryone | 0.6143 | 0.5464 | 0.2672 | 0.8611 |
| ThreatenJobs | 0.4598 | 0.3759 | 0.2786 | 0.8678 |
| TourismLivelihoods | 0.5470 | 0.4714 | 0.2722 | 0.8641 |
| HealthBenefits | 0.6824 | 0.6235 | 0.2622 | 0.8580 |
| BetterWorld | 0.7129 | 0.6584 | 0.2599 | 0.8565 |
| FutureGenerations | 0.6582 | 0.5959 | 0.2640 | 0.8591 |
| QualityOfLife | 0.6026 | 0.5333 | 0.2681 | 0.8616 |
| EnoughDone | 0.5502 | 0.4750 | 0.2719 | 0.8639 |
| ConsEconConflict | 0.5062 | 0.4265 | 0.2752 | 0.8658 |
| NaturalValues | 0.5441 | 0.4683 | 0.2724 | 0.8642 |
| ClimateChange | 0.5637 | 0.4899 | 0.2709 | 0.8633 |
| FutureChanges | 0.4904 | 0.4093 | 0.2764 | 0.8665 |
Appendix A.3. Alpha Latent Scale for the Experiential Social Learning Survey
The results of the reliability analysis for the Experiential Social Learning survey data are shown in the following Table A3. The overall alpha value for the scale, α = 0.897, and the overall scale inter-item correlation, ρ = 0.327. The maximum alpha (if item is removed) for the scale across all items is 0.892. The overall scale alpha coefficient is larger or equal than any of the alpha values if the item is removed from the scale, which indicates that the number of items in scale provide are best explain the latent attitudinal construct.
Table A3.
Results of the Alpha reliability analysis for the Experiential Social Learning survey study.
Table A3.
Results of the Alpha reliability analysis for the Experiential Social Learning survey study.
| Item | ITC | IRC | IIC | Alpha |
|---|---|---|---|---|
| TooMuchConcern | 0.6482 | 0.5899 | 0.3236 | 0.8905 |
| PublicHealth | 0.4198 | 0.3397 | 0.3419 | 0.8983 |
| NoTopPriority | 0.5953 | 0.5309 | 0.3278 | 0.8924 |
| CleanRecreation | 0.5807 | 0.5147 | 0.3290 | 0.8929 |
| LawsLimit | 0.4957 | 0.4215 | 0.3358 | 0.8958 |
| LittleEffect | 0.6395 | 0.5801 | 0.3243 | 0.8908 |
| BenefitsEveryone | 0.7761 | 0.7353 | 0.3134 | 0.8858 |
| ThreatenJobs | 0.5961 | 0.5317 | 0.3278 | 0.8923 |
| TourismLivelihoods | 0.5982 | 0.5341 | 0.3276 | 0.8923 |
| HealthBenefits | 0.7537 | 0.7096 | 0.3152 | 0.8867 |
| BetterWorld | 0.5944 | 0.5299 | 0.3279 | 0.8924 |
| FutureGenerations | 0.7153 | 0.6656 | 0.3183 | 0.8881 |
| QualityOfLife | 0.6569 | 0.5995 | 0.3229 | 0.8902 |
| EnoughDone | 0.6978 | 0.6457 | 0.3196 | 0.8887 |
| ConsEconConflict | 0.3032 | 0.2164 | 0.3512 | 0.9020 |
| NaturalValues | 0.6978 | 0.6457 | 0.3196 | 0.8887 |
| ClimateChange | 0.4932 | 0.4188 | 0.3360 | 0.8959 |
| FutureChanges | 0.6058 | 0.5425 | 0.3270 | 0.8920 |
Appendix A.4. Alpha Latent Scale for the Visiting Scientists Survey
The results of the reliability analysis for the Visiting Scientists survey data are shown in the following Table A4. The overall alpha value for the scale, α = 0.834, and the overall scale inter-item correlation, ρ = 0.218. The maximum alpha (if item is removed) for the scale across all items is 0.825. The overall scale alpha coefficient is larger or equal than any of the alpha values if the item is removed from the scale, which indicates that the number of items in scale provide are best explain the latent attitudinal construct.
Table A4.
Results of the Alpha reliability analysis for the Visiting Scientists survey study.
| Item | ITC | IRC | IIC | Alpha |
|---|---|---|---|---|
| TooMuchConcern | 0.4787 | 0.3884 | 0.2199 | 0.8274 |
| PublicHealth | 0.5469 | 0.4637 | 0.2153 | 0.8235 |
| NoTopPriority | 0.5716 | 0.4914 | 0.2136 | 0.8220 |
| CleanRecreation | 0.4648 | 0.3732 | 0.2208 | 0.8281 |
| LawsLimit | 0.0888 | −0.0200 | 0.2463 | 0.8474 |
| LittleEffect | 0.5763 | 0.4966 | 0.2133 | 0.8217 |
| BenefitsEveryone | 0.4964 | 0.4078 | 0.2187 | 0.8264 |
| ThreatenJobs | 0.3697 | 0.2704 | 0.2273 | 0.8333 |
| TourismLivelihoods | 0.3186 | 0.2161 | 0.2307 | 0.8360 |
| HealthBenefits | 0.4896 | 0.4003 | 0.2192 | 0.8267 |
| BetterWorld | 0.6176 | 0.5432 | 0.2105 | 0.8193 |
| FutureGenerations | 0.6751 | 0.6090 | 0.2066 | 0.8157 |
| QualityOfLife | 0.5553 | 0.4732 | 0.2147 | 0.8230 |
| EnoughDone | 0.6513 | 0.5816 | 0.2082 | 0.8172 |
| ConsEconConflict | 0.4215 | 0.3261 | 0.2238 | 0.8305 |
| NaturalValues | 0.6513 | 0.5816 | 0.2082 | 0.8172 |
| ClimateChange | 0.5563 | 0.4742 | 0.2147 | 0.8229 |
| FutureChanges | 0.6690 | 0.6019 | 0.2070 | 0.8161 |
Appendix A.5. Alpha Latent Scale for the Community Survey
The results of the reliability analysis for the Community Survey data are shown in the following Table A5. The overall alpha value for the scale, α = 0.886, and the overall scale inter-item correlation, ρ = 0.302. The maximum alpha (if item is removed) for the scale across all items is 0.880. The overall scale alpha coefficient is larger or equal than any of the alpha values if the item is removed from the scale, which indicates that the number of items in scale provide are best explain the latent attitudinal construct.
Table A5.
Results of the Alpha reliability analysis for the Community survey study.
| Item | ITC | IRC | IIC | Alpha |
|---|---|---|---|---|
| TooMuchConcern | 0.6253 | 0.5619 | 0.2984 | 0.8785 |
| PublicHealth | 0.4515 | 0.3709 | 0.3118 | 0.8851 |
| NoTopPriority | 0.6278 | 0.5647 | 0.2982 | 0.8784 |
| CleanRecreation | 0.5931 | 0.5259 | 0.3009 | 0.8798 |
| LawsLimit | 0.6160 | 0.5515 | 0.2991 | 0.8789 |
| LittleEffect | 0.7232 | 0.6727 | 0.2909 | 0.8746 |
| BenefitsEveryone | 0.6017 | 0.5356 | 0.3002 | 0.8794 |
| ThreatenJobs | 0.5993 | 0.5329 | 0.3004 | 0.8795 |
| TourismLivelihoods | 0.5921 | 0.5249 | 0.3010 | 0.8798 |
| HealthBenefits | 0.6637 | 0.6051 | 0.2954 | 0.8770 |
| BetterWorld | 0.6330 | 0.5705 | 0.2978 | 0.8782 |
| FutureGenerations | 0.7214 | 0.6706 | 0.2910 | 0.8746 |
| QualityOfLife | 0.6118 | 0.5468 | 0.2994 | 0.8790 |
| EnoughDone | 0.6150 | 0.5503 | 0.2992 | 0.8789 |
| ConsEconConflict | 0.5243 | 0.4500 | 0.3062 | 0.8824 |
| NaturalValues | 0.5379 | 0.4649 | 0.3052 | 0.8819 |
| ClimateChange | 0.4084 | 0.3245 | 0.3152 | 0.8867 |
| FutureChanges | 0.3570 | 0.2699 | 0.3191 | 0.8885 |
Appendix B. Ethnicity
The participant responses to the main ethnicity question are summarized in the following Table A6.
Table A6.
Other/mixed ethnicity self-determination of study participants.
| Ethnicity | Freq. | Percent | Cum |
|---|---|---|---|
| Black/African American | 473 | 62.98% | 62.98% |
| White | 151 | 20.11% | 83.09% |
| Hispanic | 46 | 6.13% | 89.21% |
| Other/Mixed | 81 | 10.79% | 100.00% |
The participant responses to Other/Mixed ethnicity are summarized in the following Table A7. Participants were given the option to choose “other” as opposed to choosing one of the standardized census ethnicity classifications, and then identify their ethnicity in their own, personal terms. Spelling and grammar of responses are left exactly as the responses were provided. From the 81 participants that choose the Other/Mixed category, only 59 choose to specify further their ethnicity.
Table A7.
Other/mixed ethnicity self-determination of study participants.
| Ethnicity (Other/Mixed) | Freq. | Percent | Cum. |
|---|---|---|---|
| African | 1 | 1.69% | 1.69% |
| Afro Caribbean | 2 | 3.39% | 5.08% |
| Afro-Caribbean | 1 | 1.69% | 6.78% |
| American Indian/white | 1 | 1.69% | 8.47% |
| American nut | 1 | 1.69% | 10.17% |
| Arab | 12 | 20.34% | 30.51% |
| Asian & White w/Hispanic | 1 | 1.69% | 32.20% |
| BLACK AND SPAINSH | 1 | 1.69% | 33.90% |
| Black Hispanic | 1 | 1.69% | 35.59% |
| Black/Hispanic | 1 | 1.69% | 37.29% |
| Both Black/African not Hispanic and W. | 1 | 1.69% | 38.98% |
| Caribbean | 1 | 1.69% | 40.68% |
| Caribbean American | 1 | 1.69% | 42.37% |
| Domican/American | 1 | 1.69% | 44.07% |
| Dominican/American | 1 | 1.69% | 45.76% |
| East Indian | 1 | 1.69% | 47.46% |
| Hebrew | 1 | 1.69% | 49.15% |
| Hispanic/West Indian | 1 | 1.69% | 50.85% |
| Human | 1 | 1.69% | 52.54% |
| Human being, fuck your racist classif. | 1 | 1.69% | 54.24% |
| Irish of African decent, freckled fac. | 1 | 1.69% | 55.93% |
| Middl Eastern | 1 | 1.69% | 57.63% |
| Middle Eastern | 1 | 1.69% | 59.32% |
| Middle eastern | 1 | 1.69% | 61.02% |
| Mixed | 1 | 1.69% | 62.71% |
| Mixed race. Caucasian and African Ame. | 1 | 1.69% | 64.41% |
| Multi ethnicity | 1 | 1.69% | 66.10% |
| Multi racial | 1 | 1.69% | 67.80% |
| Mutt | 1 | 1.69% | 69.49% |
| N/A | 1 | 1.69% | 71.19% |
| Somalian | 1 | 1.69% | 72.88% |
| Spanish, India | 1 | 1.69% | 74.58% |
| West Indian | 2 | 3.39% | 77.97% |
| West Indian: Danish, French, African. | 1 | 1.69% | 79.66% |
| afro-caribbean | 1 | 1.69% | 81.36% |
| afroboriquen | 1 | 1.69% | 83.05% |
| black / indian mix | 1 | 1.69% | 84.75% |
| black/asian | 1 | 1.69% | 86.44% |
| creole | 1 | 1.69% | 88.14% |
| middle eastern | 1 | 1.69% | 89.83% |
| middle eastern, european | 1 | 1.69% | 91.53% |
| mixed | 1 | 1.69% | 93.22% |
| mixed raced | 1 | 1.69% | 94.92% |
| multi racial | 1 | 1.69% | 96.61% |
| native, african, european | 1 | 1.69% | 98.31% |
| west indian | 1 | 1.69% | 100.00% |
| Total | 59 | 100.00% |
References
- Ajzen, Icek. 2012. Values, Attitudes, and Behavior. In Methods, Theories, and Empirical Applications in the Social Sciences. Edited by Samuel Salzborn, Eldad Davidov and Jost Reinecke. VS Verlag für Sozialwissenschaften, Wiesbaden: Springer, pp. 33–38. [Google Scholar]
- Ariely, Dan. 2008. Predictably Irrational: The Hidden Forces That Shape Our Decisions. New York: Harper Collins. [Google Scholar]
- Birnbaum, Allan. 1968. Some Latent Trait Models and Their Use in Inferring an Examinee’s Ability. In Statistical Theories of Mental Test Scores. Edited by Frederic M. Lord and Melvin R. Novick. Reading: Addison-Wesley, pp. 395–479. [Google Scholar]
- Case, Peter, Louisa S. Evans, Michael Fabinyi, Philippa J. Cohen, Christina C. Hicks, Murray Prideaux, and David J. Mills. 2015. Rethinking Environmental Leadership: The Social Construction of Leaders and Leadership in Discourses of Ecological Crisis, Development, and Conservation. Leadership 11: 396–423. [Google Scholar] [CrossRef]
- Cho, Eunseong. 2016. Making Reliability Reliable. Organizational Research Methods 19: 651–82. [Google Scholar] [CrossRef]
- Cleeremans, Axel, and Zoltan Dienes. 2008. Computational Models of Implicit Learning. In The Cambridge Handbook of Computational Psychology. Edited by Ron Sun. Cambridge and New York: Cambridge University Press, pp. 396–421. [Google Scholar]
- Cleophas, Ton J., Aeilko H. Zwinderman, Ton J. Cleophas, and Aeilko H. Zwinderman. 2012. Item Response Modeling. In Statistics Applied to Clinical Studies. Dordrecht: Springer, pp. 433–43. [Google Scholar]
- Cronbach, Lee J. 1951. Coefficient Alpha and the Internal Structure of Tests. Psychometrika 16: 297–334. [Google Scholar] [CrossRef]
- Drasgow, Fritz, and Charles K. Parsons. 1983. Application of Unidimensional Item Response Theory Models to Multidimensional Data. Applied Psychological Measurement 7: 189–99. [Google Scholar] [CrossRef]
- Eagly, Alice H., and Shelly Chaiken. 1993. The Psychology of Attitudes. Fort Worth: Harcourt Brace College Publishers (HBJ). [Google Scholar]
- Ferraro, Paul J., and Robert L. Pressey. 2015. Measuring the Difference Made by Conservation Initiatives: Protected Areas and Their Environmental and Social Impacts. Philosophical Transactions of the Royal Society B: Biological Sciences, 370. [Google Scholar] [CrossRef] [PubMed]
- Floress, Kristin, Silvestre García de Jalón, Sarah P. Church, Nicholas Babin, Jessica D. Ulrich-Schad, and Linda S. Prokopy. 2017. Toward a Theory of Farmer Conservation Attitudes: Dual Interests and Willingness to Take Action to Protect Water Quality. Journal of Environmental Psychology 53: 73–80. [Google Scholar] [CrossRef]
- Georgios, Tsounis, and Peter J. Edmunds. 2017. Three Decades of Coral Reef Community Dynamics in St. John, Usvi: A Contrast of Scleractinians and Octocorals. Ecosphere 8: e01646. [Google Scholar] [CrossRef]
- Haenn, Nora. 2016. The Middle-Class Conservationist: Social Dramas, Blurred Identity Boundaries, and Their Environmental Consequences in Mexican Conservation. Current Anthropology 57: 197–218. [Google Scholar] [CrossRef]
- Hanley, Nick, and Begona Alvarez-Farizo. 2002. Valuing the Benefits of Coastal Water Quality Improvements Using Contingent and Real Behaviour. Working Papers/Department of Economics. Glasgow, UK: University of Glasgow. [Google Scholar]
- Heit, Evan. 2008. Models of Inductive Reasoning. In The Cambridge Handbook of Computational Psychology. Edited by Ron Sun. Cambridge and New York: Cambridge University Press, pp. 322–38. [Google Scholar]
- IRTPRO Version 3. Scientific Software International, Inc. Available online: http://www.ssicentral.com (accessed on 29 June 2018).
- Kaiser, Florian G., Terry Hartig, Adrian Brügger, and Caroline Duvier. 2013. Environmental Protection and Nature as Distinct Attitudinal Objects: An Application of the Campbell Paradigm. Environment and Behavior 45: 369–98. [Google Scholar] [CrossRef]
- Kaiser, Florian G., Martin Merten, and Eunike Wetzel. 2018. How Do We Know We Are Measuring Environmental Attitude? Specific Objectivity as the Formal Validation Criterion for Measures of Latent Attributes. Journal of Environmental Psychology 55: 139–46. [Google Scholar] [CrossRef]
- Kaplan-Hallam, Maery, and Nathan J. Bennett. 2018. Adaptive Social Impact Management for Conservation and Environmental Management. Conservation Biology 32: 304–14. [Google Scholar] [CrossRef] [PubMed]
- Kobrinski, Elena. 2013. A Descriptive Cross-Sectional Research Study of the U.S. and British Virgin Islands: A Closer Look at the Local Participation, Experiential Social Learning, and Survey Participant Demographics Relating to Attitudes About Coral Reefs and Nature after Visits to Coral Reefs with Local Ecotourism Businesses. Master’s thesis, University of the Virgin Islands, St. Thomas, US Virgin Islands, USA. [Google Scholar]
- Kolen, Michael J., and Robert L. Brennan. 2014. Item Response Theory Methods. In Test Equating, Scaling, and Linking. New York: Springer, pp. 171–245. [Google Scholar]
- Levine, Debra Siegel, and Michael J. Strube. 2012. Environmental Attitudes, Knowledge, Intentions and Behaviors among College Students. The Journal of Social Psychology 152: 308–26. [Google Scholar] [CrossRef] [PubMed]
- Mardia, Kanti V., John T. Kent, and James M. Bibby. 1979. Multivariate Analysis (Probability and Mathematical Statistics). London and New York: Academic Press. [Google Scholar]
- Mayer, F. Stephan, and Cynthia McPherson Frantz. 2004. The Connectedness to Nature Scale: A Measure of Individuals’ Feeling in Community with Nature. Journal of Environmental Psychology 24: 503–15. [Google Scholar] [CrossRef]
- Oliver, Leah M., William S. Fisher, Leska Fore, Alistair Smith, and Patrick Bradley. 2018. Assessing Land Use, Sedimentation, and Water Quality Stressors as Predictors of Coral Reef Condition in St. Thomas, U.S. Virgin Islands. Environmental Monitoring and Assessment 190: 213. [Google Scholar] [CrossRef] [PubMed]
- Petty, Richard E., and John T. Cacioppo. 1996. Attitudes and Persuasion: Classic and Conterporary Approaches. Boulder: Westview Press. [Google Scholar]
- Pohl, Steffi, and Rolf Steyer. 2012. Modeling Traits and Method Effects as Latent Variables. In Methods, Theories, and Empirical Applications in the Social Sciences. Edited by Samuel Salzborn, Eldad Davidov and Jost Reinecke. VS Verlag für Sozialwissenschaften, Wiesbaden: Springer, pp. 57–65. [Google Scholar]
- Rajulton, Fernando, Zenaida R. Ravanera, and Roderic Beaujot. 2007. Measuring Social Cohesion: An Experiment Using the Canadian National Survey of Giving, Volunteering, and Participating. Social Indicators Research 80: 461–92. [Google Scholar] [CrossRef]
- Reckase, Mark D., and Mark D. Reckase. 2009. Statistical Descriptions of Item and Test Functioning. In Multidimensional Item Response Theory. New York: Springer, pp. 113–35. [Google Scholar]
- Samejima, Fumiko. 1977. A Method of Estimating Item Characteristic Functions Using the Maximum Likelihood Estimate of Ability. Psychometrika 42: 163–91. [Google Scholar] [CrossRef]
- Samejima, Fumiko. 2008. Graded Response Model Based on the Logistic Positive Exponent Family of Models for dichotomous Responses. Psychometrika 73: 561–78. [Google Scholar] [CrossRef]
- Schleicher, Judith. 2018. The Environmental and Social Impacts of Protected Areas and Conservation Concessions in South America. Current Opinion in Environmental Sustainability 32: 1–8. [Google Scholar] [CrossRef]
- Seitz, Aaron, and Takeo Watanabe. 2005. A Unified Model for Perceptual Learning. Trends in Cognitive Sciences 9: 329–34. [Google Scholar] [CrossRef] [PubMed]
- Spears, Russell. 2011. Group Identities: The Social Identity Perspective. In Handbook of Identity Theory and Research. Edited by Seth J. Schwartz, Koen Luyckx and Vivian L. Vignoles. New York: Springer, pp. 201–24. [Google Scholar]
- Steneck, Robert S., Peter J. Mumby, Chancey MacDonald, Douglas B. Rasher, and George Stoyle. 2018. Attenuating Effects of Ecosystem Management on Coral Reefs. Science Advances 4. [Google Scholar] [CrossRef] [PubMed]
- Tam, Kim-Pong. 2013. Concepts and Measures Related to Connection to Nature: Similarities and Differences. Journal of Environmental Psychology 34: 64–78. [Google Scholar] [CrossRef]
- Tavakol, Mohsen, and Reg Dennick. 2011. Making Sense of Cronbach’s Alpha. International Journal of Medical Education 2: 53–55. [Google Scholar] [CrossRef] [PubMed]
- Thomas, Michael S. C., and James L. McClelland. 2008. Connectionist Models of Cognition. In The Cambridge Handbook of Computational Psychology. Edited by Ron Sun. Cambridge and New York: Cambridge University Press, pp. 23–58. [Google Scholar]
- Van der Linden, Wim J. 2010. Item Response Theory. International Encyclopedia of Education 4: 81–88. [Google Scholar]
- Stata Version 15.1. College Station, TX, USA: StataCorp LLC. Available online: http://www.stata.com/ (accessed on 29 June 2018).
- Williams, Stacey M., Sánchez-Godínez Cristina, Steven P. Newman, and Cortés Jorge. 2017. Ecological Assessments of the Coral Reef Communities in the Eastern Caribbean and the Effects of Herbivory in Influencing Coral Juvenile Density and Algal Cover. Marine Ecology 38: e12395. [Google Scholar] [CrossRef]
- Zerva, Aikaterini, Georgios Tsantopoulos, Evangelos Grigoroudis, and Garyfallos Arabatzis. 2018. Perceived Citizens’ Satisfaction with Climate Change Stakeholders Using a Multicriteria Decision Analysis Approach. Environmental Science & Policy 82: 60–70. [Google Scholar]
- Zuberbühler, Klaus, and Richard W. Byrne. 2006. Social Cognition. Current Biology 16: R786–90. [Google Scholar] [CrossRef] [PubMed]
Figure 1.
Standardized Cronbach’s alpha reliability estimated for the optimal implementation of the ATC latent scale. The bars on the left subgraph show standardized alpha coefficients by study strata, while the bars on the right subgraph show differences in mean scale coefficients of each study strata from the overall latent scale (for all studies).

Figure 2.
Histograms displaying density of computed latent alpha score values for the 18-item ATC by study strata.
Figure 2.
Histograms displaying density of computed latent alpha score values for the 18-item ATC by study strata.
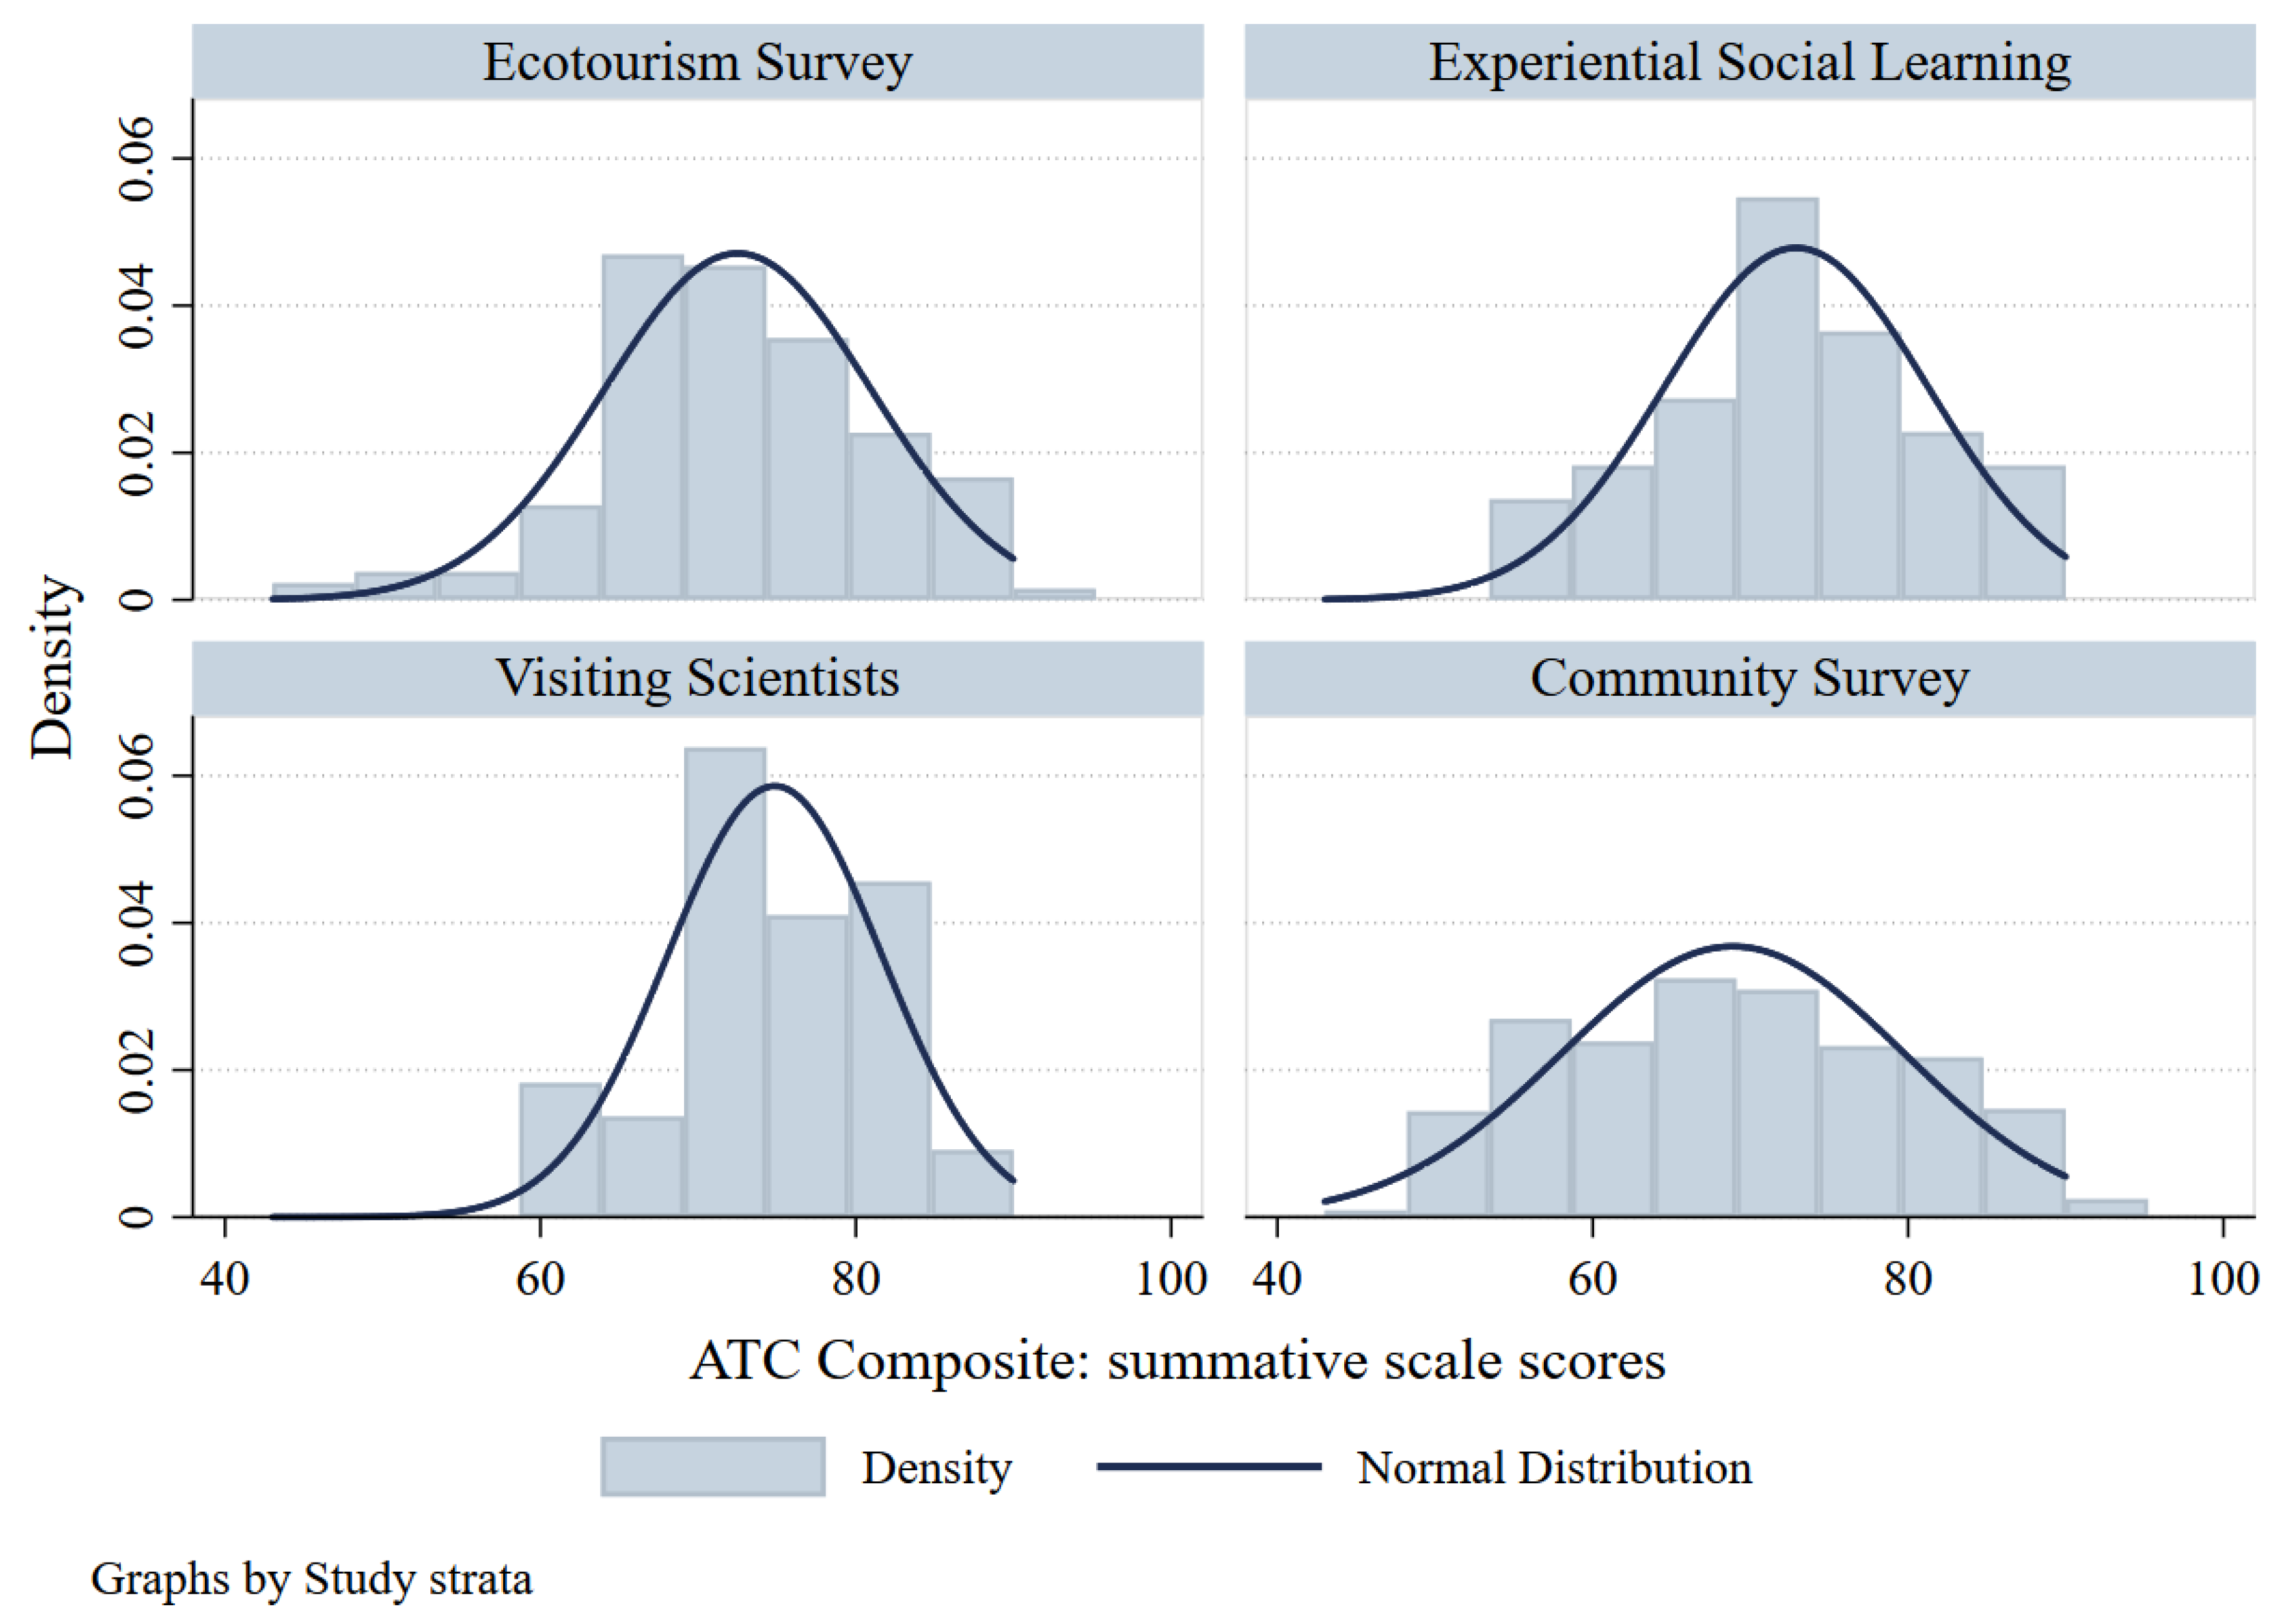
Figure 3.
Differences in mean latent attitudinal scale values among demographic-based survey question participant groups.
Figure 3.
Differences in mean latent attitudinal scale values among demographic-based survey question participant groups.

Figure 4.
Differences in mean latent attitudinal scale values among place-based survey question participant groups.
Figure 4.
Differences in mean latent attitudinal scale values among place-based survey question participant groups.

Figure 5.
Differences in mean latent attitudinal scale values among environmental-based survey question participant groups.
Figure 5.
Differences in mean latent attitudinal scale values among environmental-based survey question participant groups.
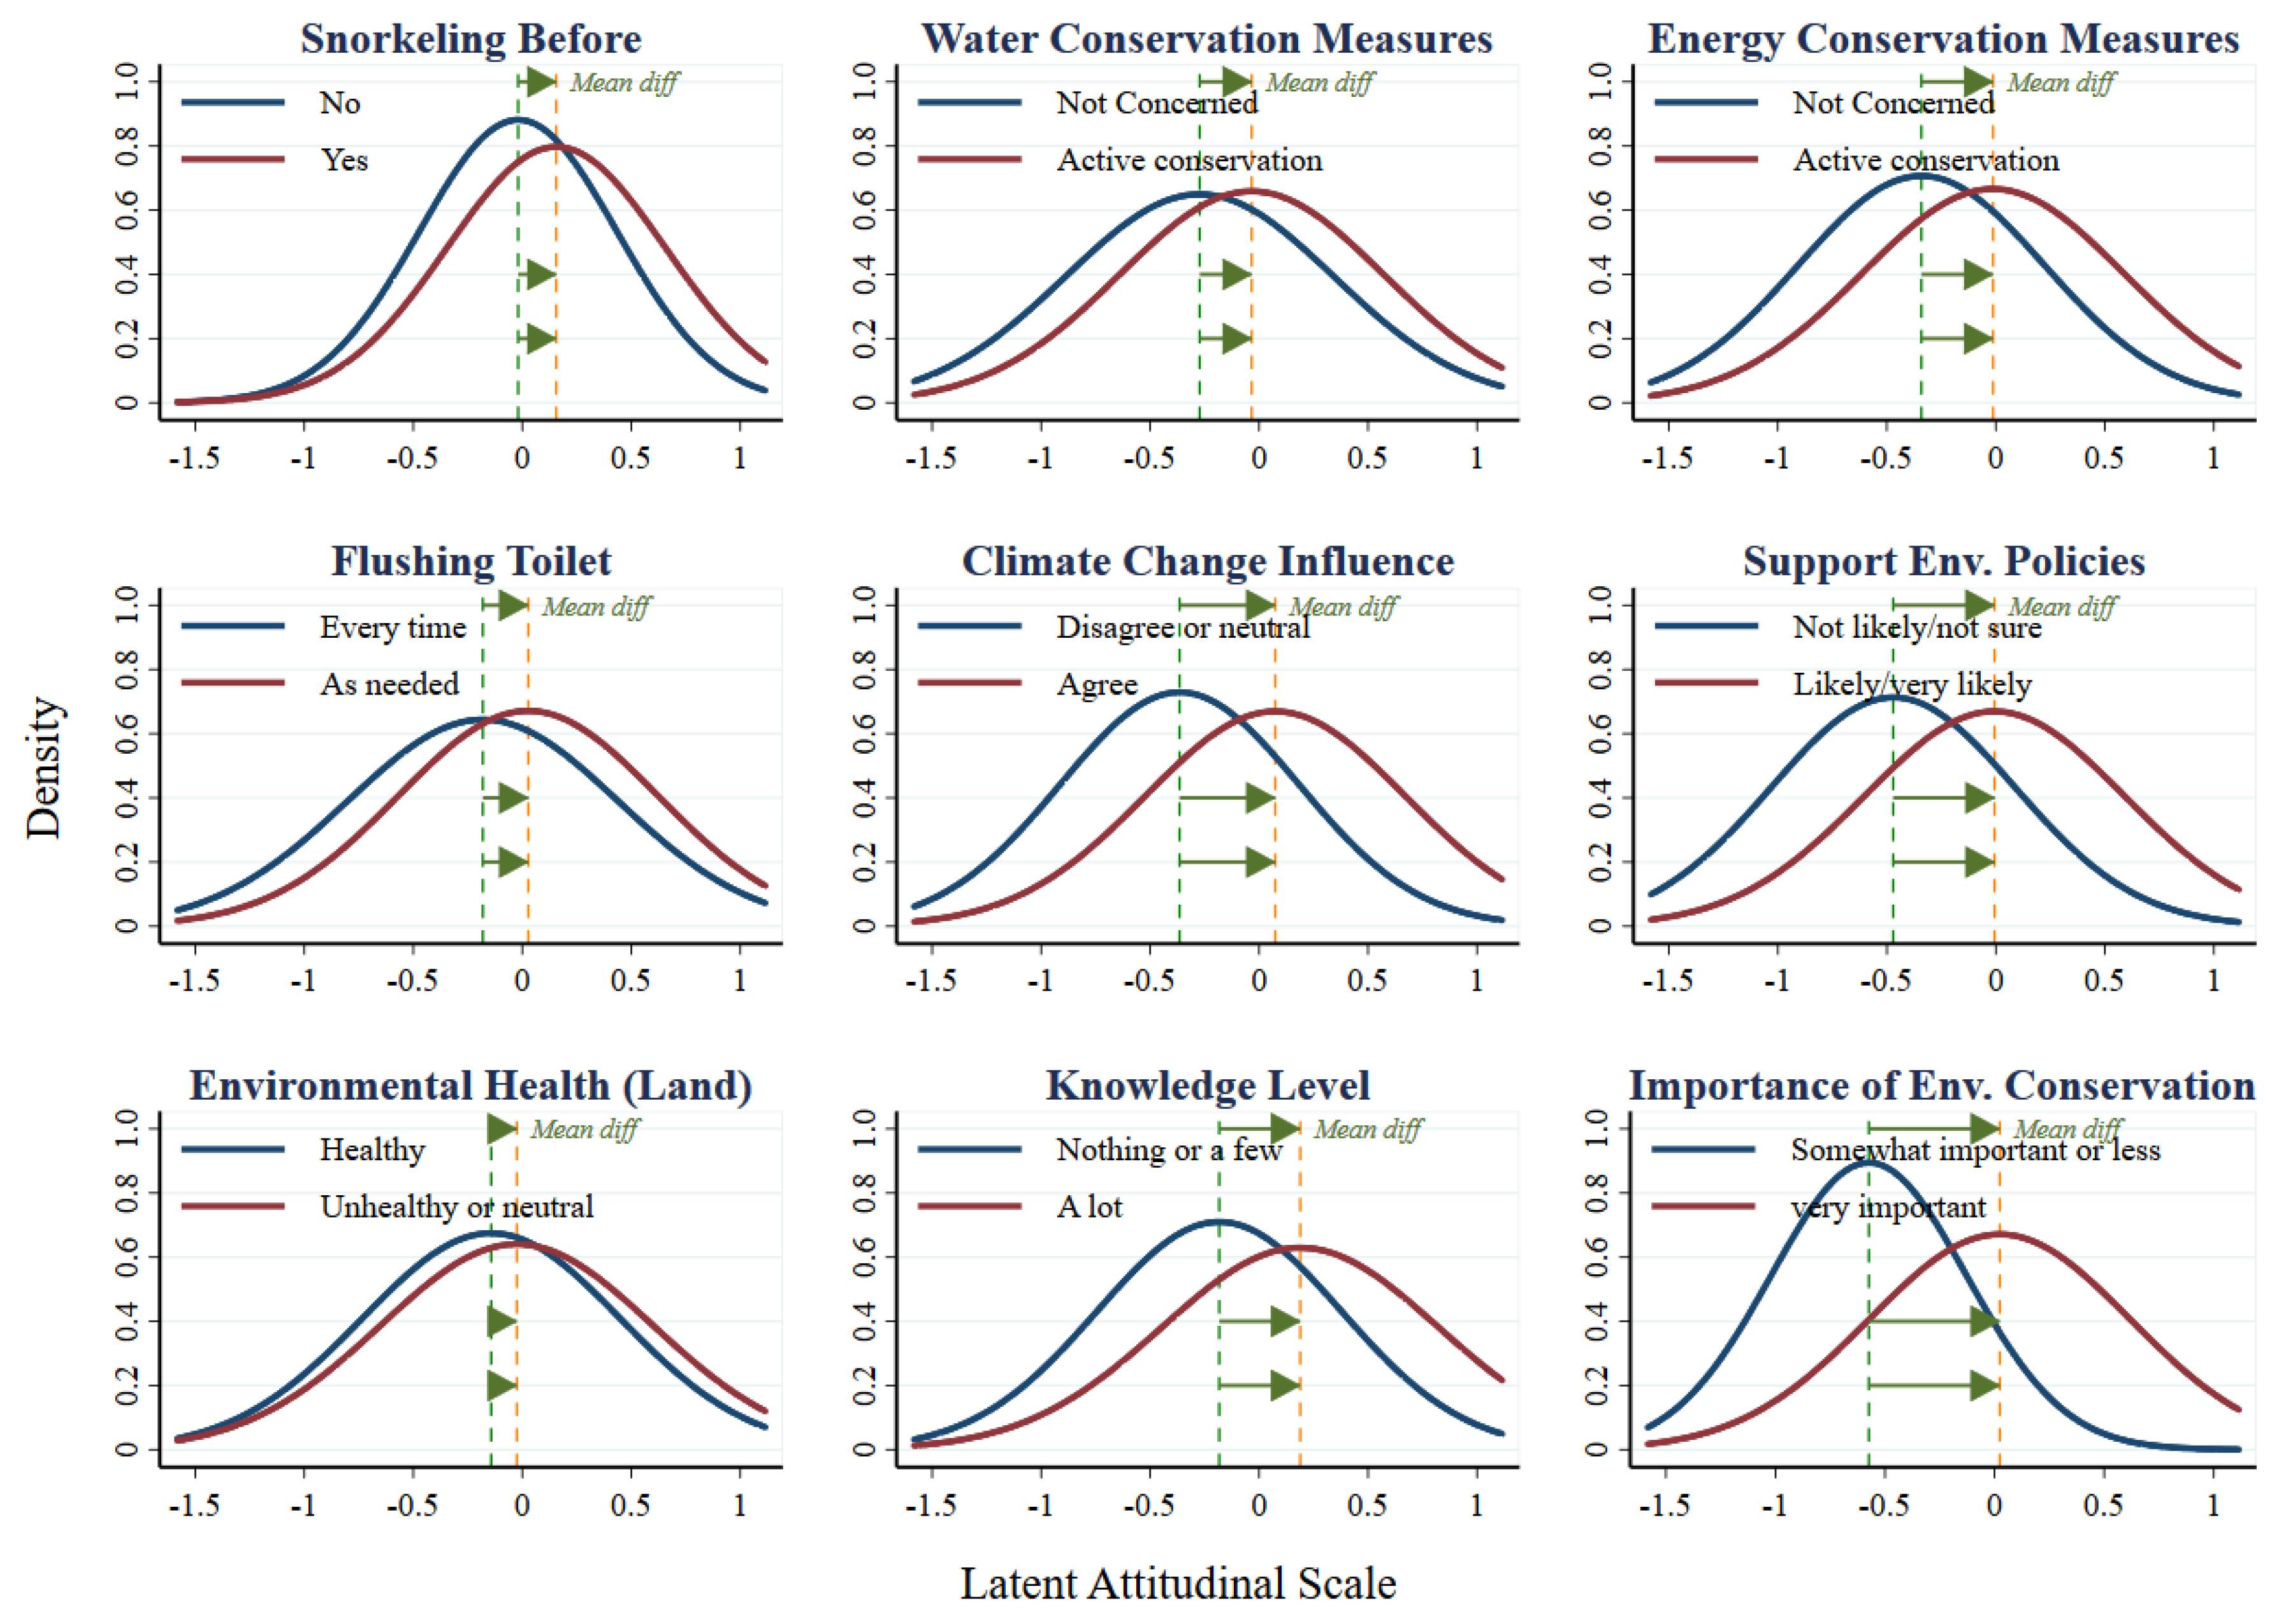
Figure 6.
Test, information, and item characteristic curves of the 2PL IRT latent ATC model estimation. The left subgraph plots the cumulative test characteristic curve of the model. The dotted lines indicate corresponding 95% probability boundaries. The center subgraph plots the overall test information function (solid line) and the standard error of the information estimate (dotted line). The right subgraph plots all 18 × 2 item characteristic curves (binary). The dotted reference lines indicate boundaries of latitude of non-commitment area.

Figure 7.
Information curves for the ATC latent scale estimation. The solid lines represent the total information curve in the left subgraph and the test characteristic (cumulative) information curve in the right subgraph. The dotted curve line in the left subgraph represents the standard error of the estimates. The dotted droplines for each of the right subgraph’s axes identify the expected ATC scores for the mean, and two-sided 95% probability limits for the expected ATC values.

Figure 8.
Item (boundary) characteristic curves. Each curve displays the cumulative probability of each item ordinal state. Dotted reference lines show scale values above which the cumulative probability exceeds 50%.
Figure 8.
Item (boundary) characteristic curves. Each curve displays the cumulative probability of each item ordinal state. Dotted reference lines show scale values above which the cumulative probability exceeds 50%.

Figure 9.
Item characteristic curves for the latent scale Attitudes toward coral reef conservation. Colored lines denote varying response curves to signed item characteristics. Dotted lines display information characteristics curves for each scale item.
Figure 9.
Item characteristic curves for the latent scale Attitudes toward coral reef conservation. Colored lines denote varying response curves to signed item characteristics. Dotted lines display information characteristics curves for each scale item.
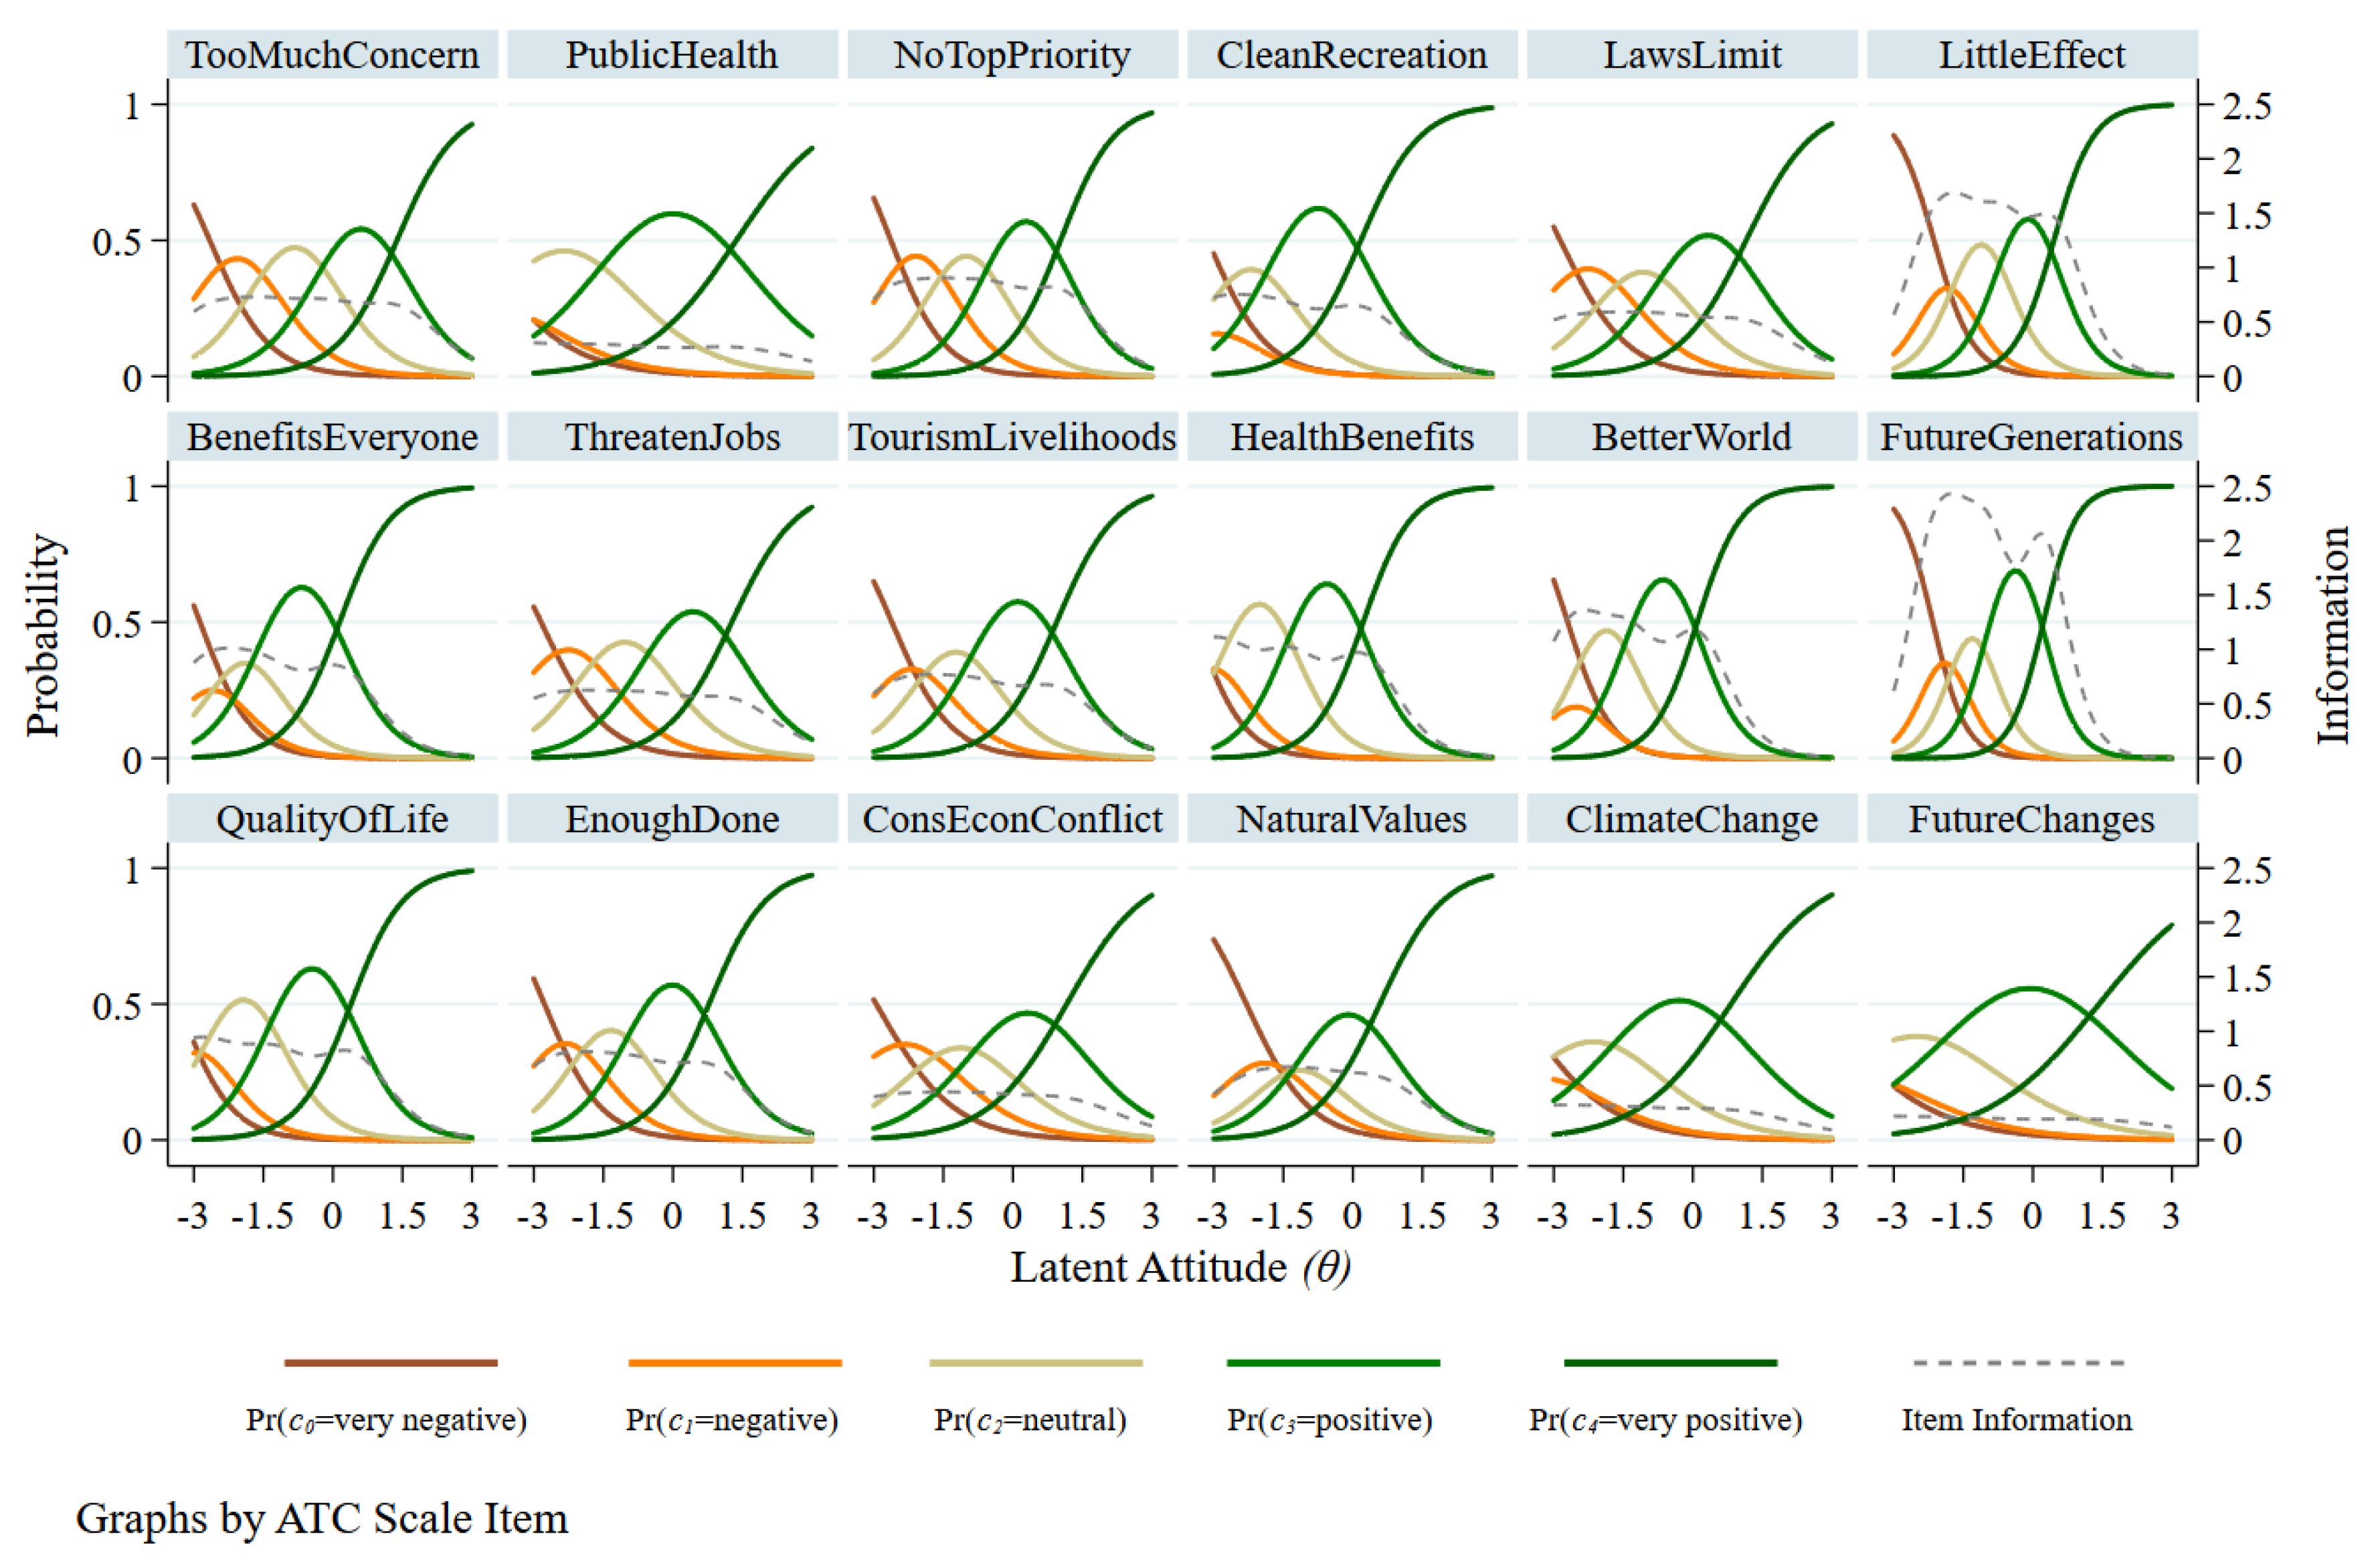
Figure 10.
Graphical representation of the estimated generalized structural equation model (GSEM) MIMIC model parameters for the ATC latent attitudinal scale. The MIMIC model uses an ordinal logit fit for the 18 scale item parameters, adjusting for covariance contributions from a number of associated attributes (6 attributes). The fitted mean values of the estimation (along with z-scores and p-values for the attributes) are shown alongside the connecting arrows.

Figure 11.
Congruency visualization among ATC latent trait scale estimations.
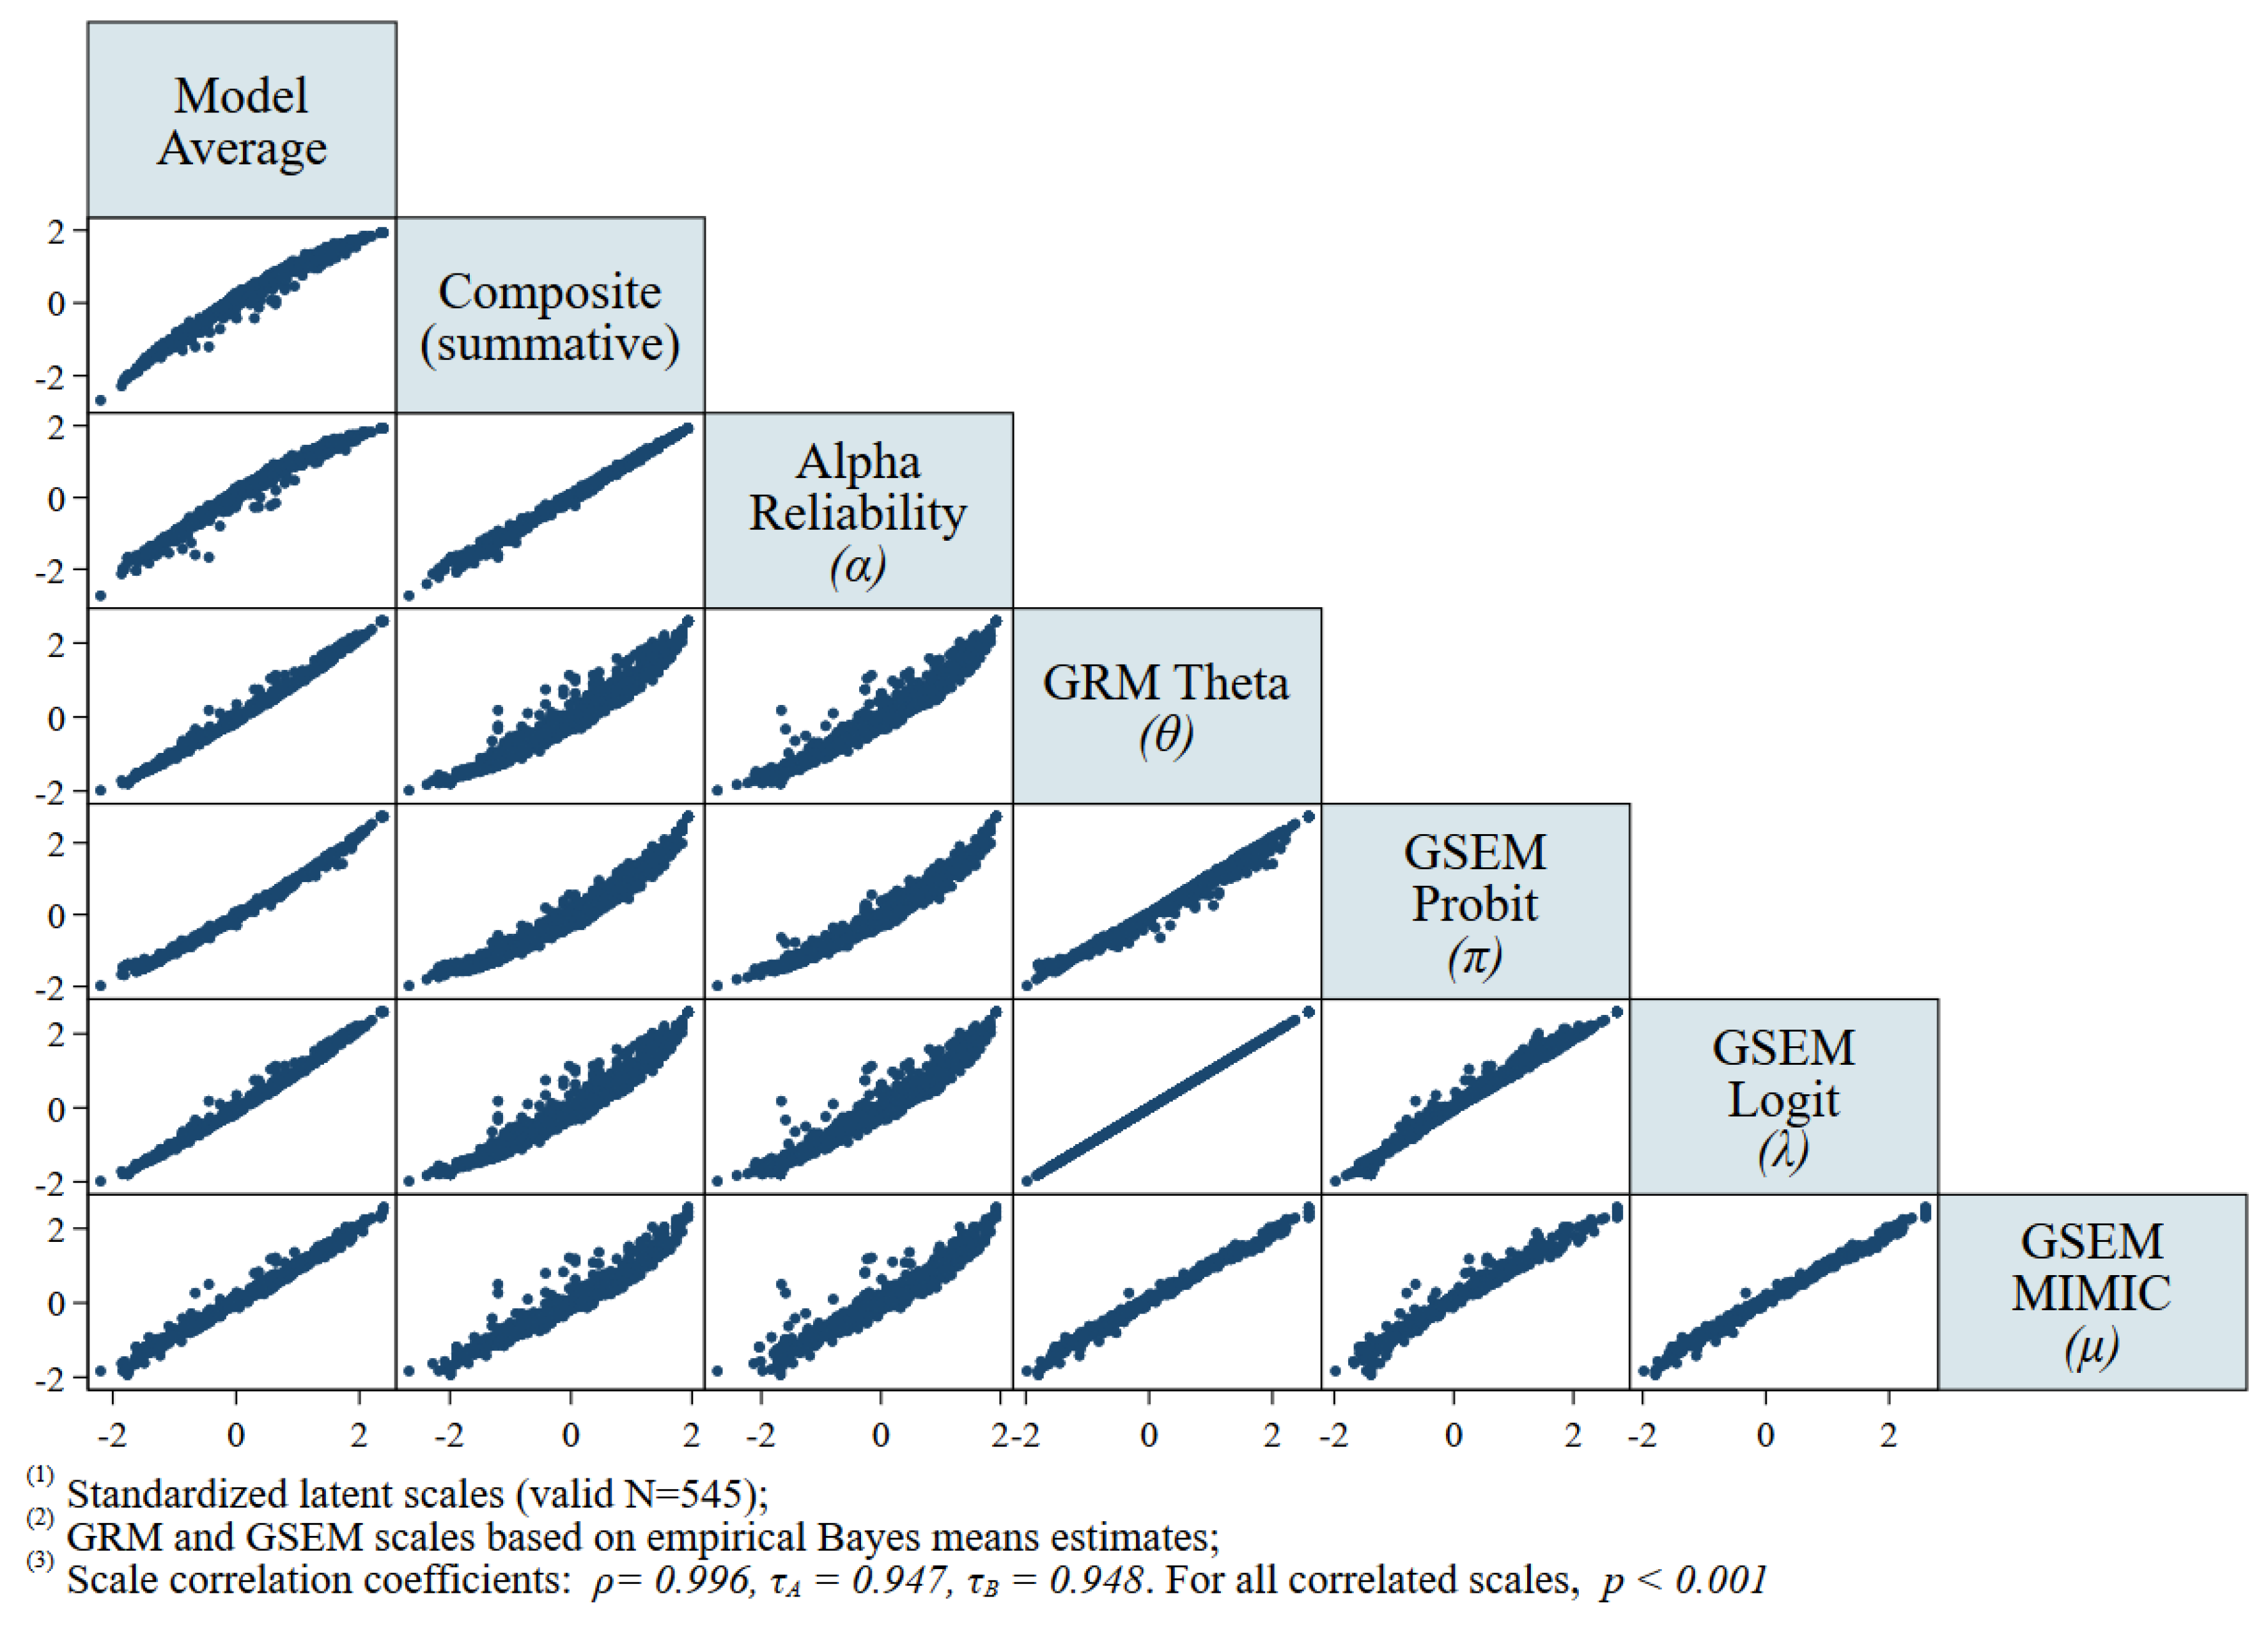
Figure 12.
Linear polynomial interpolation (3D and contour plots) between the GRM-estimated latent scale score (x-axis), the Alpha-estimated latent scale score (y-axis), and the composite summative scale score (z-axis, contour) of the ATC latent attitudinal scale.
Figure 12.
Linear polynomial interpolation (3D and contour plots) between the GRM-estimated latent scale score (x-axis), the Alpha-estimated latent scale score (y-axis), and the composite summative scale score (z-axis, contour) of the ATC latent attitudinal scale.

Table 1.
Key participant attributes across survey data.
| Attribute | Categories | ECO | ESL | VSC | COM | Total |
|---|---|---|---|---|---|---|
| Location | St. John | 54 | 0 | 0 | 0 | 54 |
| St. Thomas | 84 | 42 | 42 | 626 | 794 | |
| St. Croix | 25 | 0 | 0 | 0 | 25 | |
| Tortola | 29 | 0 | 0 | 0 | 29 | |
| Virgin Gorda | 61 | 0 | 0 | 0 | 61 | |
| Gender | Female | 134 | 27 | 21 | 393 | 575 |
| Male | 108 | 15 | 21 | 226 | 370 | |
| Age Group | <25 years | 43 | 38 | 0 | 301 | 382 |
| >25 years | 200 | 4 | 42 | 321 | 567 | |
| Education | Below college degree | 86 | 42 | 0 | 427 | 555 |
| Above college degree | 159 | 0 | 42 | 194 | 395 | |
| Household Income | <$40,000 | 43 | 0 | 0 | 0 | 43 |
| $40,000–$90,000 | 59 | 0 | 0 | 0 | 59 | |
| >$90,000 | 115 | 0 | 0 | 0 | 115 | |
| USVI Residents | No | 188 | 0 | 42 | 0 | 230 |
| Yes | 57 | 42 | 0 | 626 | 725 | |
| Snorkeling Before | No | 51 | 0 | 0 | 0 | 51 |
| Yes | 193 | 0 | 0 | 0 | 193 |
Table 2.
Key cognitive scale reliability analysis statistics.
| Scale | IIC | IRC | ITC | Rho | Alpha |
|---|---|---|---|---|---|
| All Studies | 0.296 | 0.510 | 0.579 | 0.877 | 0.883 |
| Ecotourism Survey | 0.271 | 0.485 | 0.558 | 0.864 | 0.870 |
| Experiential Learning | 0.327 | 0.542 | 0.604 | 0.892 | 0.897 |
| Visiting Scientists | 0.218 | 0.427 | 0.511 | 0.825 | 0.834 |
| Community Survey | 0.302 | 0.516 | 0.583 | 0.880 | 0.886 |
Table 3.
Basic statistics of the standardized item-level Cronbach’s alpha coefficient across study implementations for the Attitudes toward coral reef Conservation (ATC) scale.
Table 3.
Basic statistics of the standardized item-level Cronbach’s alpha coefficient across study implementations for the Attitudes toward coral reef Conservation (ATC) scale.
| Study ID | Mean Scale Score Statistics | Item Reliability Statistics | ||||||||
|---|---|---|---|---|---|---|---|---|---|---|
| N | Mean | Min | Max | St.Dev | i | Mean | Min | Max | St.Dev | |
| All Studies | 963 | 0.00 | −1.583 | 1.115 | 0.579 | 18 | 0.877 | 0.871 | 0.884 | 0.003 |
| Ecotourism Survey | 253 | 0.00 | −1.737 | 1.142 | 0.558 | 18 | 0.864 | 0.857 | 0.869 | 0.003 |
| Social Learning | 42 | 0.00 | −1.391 | 1.021 | 0.604 | 18 | 0.892 | 0.886 | 0.902 | 0.003 |
| Visiting Scientists | 42 | 0.00 | −1.200 | 0.980 | 0.511 | 18 | 0.825 | 0.816 | 0.847 | 0.003 |
| Community Survey | 626 | 0.00 | −1.449 | 1.131 | 0.583 | 18 | 0.880 | 0.875 | 0.888 | 0.003 |
Table 4.
Key scale and item statistics for the ATC scale development.
| Composite Scale: Attitudes toward Conservation (ATC) | μ | SD | SE | ITC | IRC | IIC | α |
|---|---|---|---|---|---|---|---|
| 1. Too much concern is shown for corals and not enough for humans, so I would rather see the resources used to help communities with their problems (reversed). | 3.495 | 1.041 | 0.034 | 0.614 | 0.549 | 0.293 | 0.876 |
| 2. The environmental effects on public health are worse than we realize. | 3.923 | 0.847 | 0.027 | 0.452 | 0.370 | 0.305 | 0.882 |
| 3. We have too many other social and economic problems to solve in the Virgin Islands. Environmental conservation shouldn’t be our top priority (reversed). | 3.651 | 1.042 | 0.034 | 0.623 | 0.559 | 0.292 | 0.875 |
| 4. A clean environment provides me with better opportunities for recreation. | 4.253 | 0.841 | 0.027 | 0.561 | 0.490 | 0.297 | 0.878 |
| 5. Laws to protect the environment limit my choices and personal freedom (reversed). | 3.623 | 1.072 | 0.035 | 0.562 | 0.491 | 0.297 | 0.878 |
| 6. While some local plants and animals may have been harmed by environmental degradation, over the whole Earth, there has been little effect (reversed). | 3.872 | 1.084 | 0.035 | 0.710 | 0.657 | 0.286 | 0.872 |
| 7. Environmental conservation benefits everyone. | 4.233 | 0.875 | 0.028 | 0.597 | 0.529 | 0.294 | 0.876 |
| 8. Conserving the environment will threaten jobs for people like me, or people I know (reversed). | 3.593 | 1.039 | 0.033 | 0.571 | 0.501 | 0.296 | 0.877 |
| 9. Tourism and livelihoods are more important than protecting our environment (reversed). | 3.757 | 1.049 | 0.034 | 0.584 | 0.516 | 0.295 | 0.877 |
| 10. Environmental conservation has benefits for my health. | 4.241 | 0.779 | 0.025 | 0.649 | 0.587 | 0.290 | 0.874 |
| 11. Environmental conservation will provide a better world for me and my family. | 4.267 | 0.831 | 0.027 | 0.647 | 0.586 | 0.290 | 0.874 |
| 12. We don’t need to worry much about the corals, because future generations will be better able to deal with these problems than we are (reversed). | 4.086 | 0.993 | 0.032 | 0.718 | 0.666 | 0.285 | 0.871 |
| 13. Environmental conservation will help people achieve a better quality of life. | 4.155 | 0.817 | 0.026 | 0.604 | 0.538 | 0.294 | 0.876 |
| 14. Enough is being done to protect and enhance the marine environment already (reversed). | 3.860 | 1.008 | 0.032 | 0.607 | 0.541 | 0.293 | 0.876 |
| 15. Conservation and economic development don’t go together (reversed). | 3.622 | 1.122 | 0.036 | 0.529 | 0.454 | 0.299 | 0.879 |
| 16. Natural things must only be valued for what humans get out of them (reversed). | 3.749 | 1.232 | 0.040 | 0.560 | 0.489 | 0.297 | 0.878 |
| 17. I am concerned about climate change and its effects to the Virgin Island’s environment. | 3.979 | 0.967 | 0.031 | 0.429 | 0.346 | 0.307 | 0.883 |
| 18. I expect to see more dramatic changes in our natural and marine environment in the future. | 3.916 | 0.910 | 0.029 | 0.397 | 0.311 | 0.310 | 0.884 |
Table 5.
Test for normality coefficients for scale scores across study participants.
| Study Extent | Kolmogorov-Smirnov | Shapiro-Wilks W | Shapiro-Francia W’ | |||
|---|---|---|---|---|---|---|
| D | p | z | p | z | p | |
| All Studies | 0.0434 | 0.0265 | 5.9446 | 0.0000 | 5.6486 | 0.0000 |
| Ecotourism Survey | 0.0275 | 0.6816 | 2.4407 | 0.0073 | 2.2634 | 0.0118 |
| Social Learning | 0.0457 | 0.8393 | 0.0570 | 0.4773 | −0.2594 | 0.6023 |
| Visiting Scientists | 0.0649 | 0.7022 | 0.0927 | 0.4631 | 0.0366 | 0.4854 |
| Community Survey | 0.0573 | 0.0164 | 6.0236 | 0.0000 | 5.7212 | 0.0000 |
Table 6.
Kruskal-Wallis rank tests for the equality of mean scale scores across attribute variables in the data.
Table 6.
Kruskal-Wallis rank tests for the equality of mean scale scores across attribute variables in the data.
| Attribute | States | K-W χ2 | K-S t | Attribute (cont.) | States | K-W χ2 | K-S t |
|---|---|---|---|---|---|---|---|
| Gender | 2 | 7.354 * | 2.934 * | Drinking water source | 2 | 8.639 * | 2.927 * |
| Ethnicity | 4 | 42.872 ** | −4.780 ** | Drinking water taste | 5 | 2.498 | 0.584 |
| Age group | 2 | 8.762 * | −3.082 * | Water issues | 2 | 5.889 * | −2.349 * |
| Education | 2 | 67.325 ** | −8.696 ** | Waste issues | 2 | 0.436 | 0.681 |
| Household income | 3 | 7.097 * | −1.153 | Energy issues | 2 | 30.592 ** | −5.577 ** |
| Live in VI | 2 | 13.437 ** | 3.787 ** | Cons Measures (water) | 4 | 33.343 ** | −3.347 ** |
| Snorkeling before | 2 | 4.986 * | −2.261 * | Cons Measures (energy) | 4 | 36.347 ** | −4.281 ** |
| Snorkeling frequency | 2 | 0.524 | −0.518 | Flushing toilet | 2 | 16.787 ** | −4.232 ** |
| Living place type | 6 | 5.730 | −1.090 | Climate change influence | 5 | 119.829 ** | −8.612 ** |
| Place tenure | 3 | 8.187 * | −1.845 | Support policies now | 4 | 83.338 ** | −5.755 ** |
| Place water source | 6 | 12.417 * | −3.132 * | Support policies near | 4 | 90.906 ** | −6.725 ** |
| Bought cistern water | 2 | 6.303 * | 2.573 * | Support policies future | 4 | 89.553 ** | −6.600 ** |
| Filtered cistern | 2 | 0.149 | −0.519 | Env. health (land) | 5 | 47.647 ** | 6.135 ** |
| Treated cistern | 2 | 3.975 * | 2.009 * | Env. health (coastal) | 5 | 47.208 ** | 5.935 ** |
| Power source: WAPA | 2 | 2.899 | 1.737 | Env. health importance | 4 | 24.994 ** | −1.349 |
| Power source: generator | 2 | 5.682 * | −2.340 * | Knowledge level | 3 | 58.430 ** | −7.342 ** |
| Power source: solar | 2 | 12.630 ** | −3.565 ** | Env. cons. importance | 5 | 76.028 ** | −9.279 ** |
Note: * p < 0.05; ** p < 0.001.
Table 7.
Model estimation comparison for IRT ATC scale model fit.
| Model | N | −2LOGL | DF | AIC | BIC |
|---|---|---|---|---|---|
| GRM | 963 | −19,376.628 | 90 | 38,933.256 | 39,371.561 |
| PCM | 963 | −20,147.805 | 73 | 40,441.609 | 40,797.123 |
| GPCM | 963 | −19,921.008 | 90 | 40,022.016 | 40,460.320 |
| RSM | 963 | −20,356.670 | 22 | 40,757.341 | 40,864.482 |
| 1PL | 963 | −8051.379 | 19 | 16,140.757 | 16,233.288 |
| 2PL | 963 | −7924.076 | 36 | 15,920.152 | 16,095.474 |
| 3PL | 963 | −7924.076 | 37 | 15,922.152 | 16,102.344 |
Table 8.
Key unidimensional, scale-level statistics of the EAP estimation.
| Statistic | Value |
|---|---|
| Sample Size | 963 |
| Number of Items in Scale | 18 |
| Mean scale (μ) | 0.720 |
| Std. Error of mean | 0.056 |
| St. Deviation of mean | 0.653 |
| Marginal Reliability | 0.930 |
| M2 (marginal scores) | 15,082.57 |
| Degrees of Freedom | 2428 |
| RMSEA (p < 0.001) | 0.08 |
| −2LogLikelihood | 34,485.81 |
| Akaike Information Criterion (AIC) | 34,669.81 |
| Bayesian Information Criterion (BIC) | 35,109.98 |
| EM algorithm: E-step | 0.061 |
| EM algorithm: M-step | 0.116 |
| EM algorithm: S-step | 1.810 |
| Goodness of fit (EM) | 341.821 |
Table 9.
Parameter estimates of the graded response model (GRM) for the ATC latent semantic scale.
| Model Parameter | Mean | S.E. | St.Dev | Min | Max | |
|---|---|---|---|---|---|---|
| Factor | λ | 0.869 | 0.075 | 0.108 | 0.677 | 1.042 |
| Slope | α | 2.170 | 0.181 | 0.556 | 1.374 | 3.284 |
| Logit: αiθj + c | c1 | 3.464 | 0.250 | 0.651 | 2.310 | 4.765 |
| c2 | 1.953 | 0.148 | 0.716 | 1.095 | 3.381 | |
| c3 | 0.542 | 0.111 | 0.700 | −0.999 | 1.210 | |
| c4 | −2.771 | 0.161 | 0.783 | −4.691 | −1.596 | |
| Logit: αi(θj − bik) | b1 | −1.647 | 0.179 | 0.330 | −2.601 | −1.196 |
| b2 | −0.917 | 0.105 | 0.325 | −1.614 | −0.592 | |
| b3 | −0.017 | 0.055 | 0.327 | −0.644 | 0.530 | |
| b4 | 1.323 | 0.967 | 0.376 | 0.815 | 1.864 | |
| Stats | χ2 | 219.50 | 59.179 | 130.41 | 381.90 | |
| df | 98.56 | 15.971 | 76 | 127 | ||
| p | 0.0003 | 0.0007 | 0.0001 | 0.0031 | ||
Table 10.
TC mean scale GRM model assessment comparisons across different participant attributes.
| Variable and Condition | N | Mean | SE | SD | M.Rel. | z-stat | p(diff) | |
|---|---|---|---|---|---|---|---|---|
| Unrestricted | 884 | 0.704 | 0.246 | 0.633 | 0.92 | |||
| Gender | Female | 530 | 0.743 | 0.073 | 0.666 | 0.92 | 2.2262 | 0.9870 |
| Male | 338 | 0.646 | 0.417 | 0.599 | 0.91 | 2.2262 | 0.0130 | |
| Ethnicity | Black | 306 | 0.573 | 0.148 | 0.657 | 0.92 | −3.6330 | 0.0001 |
| Other | 198 | 0.812 | 0.124 | 0.760 | 0.92 | −3.6330 | 0.9999 | |
| Age Group | <25 years | 389 | 0.618 | 0.122 | 0.656 | 0.92 | −3.5106 | 0.0002 |
| >25 years | 480 | 0.771 | 0.084 | 0.617 | 0.91 | −3.5106 | 0.9998 | |
| Education | Below College | 471 | 0.612 | 0.078 | 0.634 | 0.92 | −4.0930 | 0.0000 |
| Above College | 316 | 0.807 | 0.295 | 0.669 | 0.92 | −4.0930 | 1.0000 | |
| Household Income | <$90,000 | 113 | 0.606 | 0.094 | 0.547 | 0.91 | −1.9179 | 0.0276 |
| >$90,000 | 131 | 0.747 | 0.135 | 0.601 | 0.91 | −1.9179 | 0.9724 | |
| Live in the VI | No | 254 | 0.727 | 0.117 | 0.546 | 0.91 | 0.8443 | 0.8007 |
| Yes | 621 | 0.690 | 0.096 | 0.681 | 0.92 | 0.8443 | 0.1993 | |
| Snorkeling Before | No | 58 | 0.364 | 0.584 | 0.489 | 0.91 | −5.7814 | 0.0000 |
| Yes | 218 | 0.800 | 0.101 | 0.584 | 0.91 | −5.7814 | 1.0000 | |
| Using Solar Power | No | 490 | 0.647 | 0.121 | 0.706 | 0.92 | −0.9190 | 0.1791 |
| Yes | 16 | 0.890 | 0.274 | 1.050 | 0.90 | −0.9190 | 0.8209 | |
Table 11.
Correlation coefficients evaluating the congruency between ATC scale factor estimates.
| Correlation | ATCcomp | ATCalpha | ATCGRM | ATCSEM | Mean (i) | |
|---|---|---|---|---|---|---|
| Spearman’s Rank (r) | ATCcomp | 1.0000 | 0.9876 | |||
| ATCalpha | 0.9987 * | 1.0000 | ||||
| ATCGRM | 0.9766 * | 0.9793 * | 1.0000 | |||
| ATCSEM | 0.9931 * | 0.9933 * | 0.9848 * | 1.0000 | ||
| Kendall’s Rank (τa) | ATCcomp | 0.9722 | 0.9203 | |||
| ATCalpha | 0.9642 * | 0.9994 | ||||
| ATCGRM | 0.8849 * | 0.8971 * | 0.9994 | |||
| ATCSEM | 0.9280 * | 0.9318 * | 0.9158 * | 0.9994 | ||
| Kendall’s Rank (τb) | ATCcomp | 1.0000 | 0.9273 | |||
| ATCalpha | 0.9782 * | 1.0000 | ||||
| ATCGRM | 0.8978 * | 0.8976 * | 1.0000 | |||
| ATCSEM | 0.9415 * | 0.9324 * | 0.9164 * | 1.0000 |
* Significance level: p < 0.001; (i) excluding diagonal.
Table 12.
Key ecological, environmental and social inferences of the ATC scale survey responses.
| Study Outcome | Category |
|---|---|
| Overall, participant’s views regarding the importance of environmental conservation in decision making greatly affect and being affected by their attitudes. The more important they found environmental conservation the more wider and extensively positive are their attitudes. | Ecological |
| Participant engagement with ecological activities (e.g., ecotourism, snorkeling, etc.) are shown to be associated with better and more positive attitudes toward coral reef conservation. Programs promoting and enabling more participation with these activities have the potential of improving social attitudes toward conservation. | Ecological |
| Overall, participants have stronger and higher scores for abstract conservation scale items that relate to broader social, livelihoods, and wellbeing, rather than ecologically-explicit scale items related to coral reef themselves. Thus, framing environmental conservation policies, initiatives, and actions in ways that bare relevance to participant’s perceptions and views might help promote stronger and more consistent participation and engagement to collective efforts in support of environmental conservation. | Ecological/Environmental |
| Participants believe that recreation opportunities are very strongly and positively related to their attitudinal formation towards coral reef conservation (item mean = 4.253/5.0) | Ecological/Environmental |
| Participants with more positive attitudes toward environmental and coral reef conservation are likely or very likely to support environmental policies aimed in promoting conservation. Thus, any efforts to change and shift community attitudes toward more support of coral reef conservation would increase both nominal and active support for future environmental policies and environmental governance. | Ecological/Environmental |
| Concerns about climate change and its impacts influence participants’ attitudes and support of policies and decisions toward environmental conservation. | Environmental |
| Improving participant’s knowledge level regarding environmental and natural resources in the US Virgin Islands, is shown to be associated with more positive attitudes toward environmental conservation. Programs promoting and enhancing citizen and local community knowledge about coral reefs are likely to help changing attitudes toward conservation. | Environmental |
| Local residents who perform and are engaged with active water and energy conservation measures are shown to have more positive attitudes toward conservation, thus providing a strong and verifiable link between attitudes and behaviors. The more actively involved with water/energy conservation are the citizens, the more likely it is to support policies and measures improving ecological and environmental conditions in the region. | Environmental |
| Female participants are shown to have slightly (but statistically significant) better or more positive attitudes toward coral reef conservation. Promoting gender-based policies and leadership may help improve conservation efforts. | Social |
| Black or African/American participants have less positive attitudes toward coral reef conservation compared to other ethnicities or participants with mixed ethnicity. The ethnic dimension of coral reef conservation might have to to with ethnocultural and historical reasons that relate to the sense of place and community. | Social |
| Younger people (below 25 years) are shown to have slightly less positive attitudes toward environmental conservation. Programs designed to reach younger citizens and local participants may improve conservation attitudes and outcomes in the future. | Social |
| Education levels are shown to promote stronger and more positive attitudes toward conservation. Especially participants with educational attainment above college degree have stronger conservation attitudes. This result shows the potential influential role that education has in shaping and shifting attitudes. | Social |
| The collective and social aspects of environmental conservation are shown to be strongly positively related with attitudes toward conservation. The participants have a high item scale mean for the proposition that “environmental conservation benefits everyone” (item mean = 4.233/5.0), as well as the benefits for a better world (item mean = 4.267/5.0) | Social |
| Participants recognize the health benefits of environmental conservation (item mean = 4.241/5.0), and the impacts in their quality of life (item mean = 4.155/5.0) | Social |
| Despite overall positive influence of the importance of environmental conservation, people living in the local area appreciate less the coral reef and conservation level compared to participants outside the Caribbean region. Since local communities are the ones that need to support policies and actions to protect the natural resources in the region, thus, programs and initiatives that focus on fostering and promoting better attitudes toward coral reef conservation among the local population can aid conservation efforts. | Social/Economic |
| Participants with higher levels of income are shown to have slightly more positive, yet less strong (weaker) levels of attitudes toward environmental conservation, albeit these results are not strongly statistically inferred. It is possible that purely economic outcomes might not be a strong predictor or influencer of conservation attitudes. | Economic |
| Home ownership and improvement of socioeconomic outcomes at the local community are shown to promote environmental conservation and participant attitudes. | Social/Economic |
| Adopting new and alternative technologies (e.g., solar power) are shown to be associated with higher positive levels of environmental and coral reef conservation attitudes. Our study shows that promoting alternative technologies, not only can improve environmental outcomes (e.g., reducing energy dependency and air pollution by burning fossil fuel for energy generation in the islands), but also has the benefit of significantly changing citizen’s attitudes in support of environmental conservation efforts. | Social/Economic |
| Persistent and challenging issues with energy in the US Virgin Islands (e.g., often power black outs, inadequate supply of power, etc.) have as a side-effect a higher level of positive attitudes toward environmental conservation, by way of transforming participant’s views and necessitating higher appreciation of conservation efforts. | Social/Economic |
© 2018 by the author. Licensee MDPI, Basel, Switzerland. This article is an open access article distributed under the terms and conditions of the Creative Commons Attribution (CC BY) license (http://creativecommons.org/licenses/by/4.0/).
Share and Cite
MDPI and ACS Style
Alexandridis, K. Assessing Cognitive and Social Attitudes toward Environmental Conservation in Coral Reef Social-Ecological Systems. Soc. Sci. 2018, 7, 109. https://doi.org/10.3390/socsci7070109
AMA Style
Alexandridis K. Assessing Cognitive and Social Attitudes toward Environmental Conservation in Coral Reef Social-Ecological Systems. Social Sciences. 2018; 7(7):109. https://doi.org/10.3390/socsci7070109
Chicago/Turabian StyleAlexandridis, Kostas. 2018. "Assessing Cognitive and Social Attitudes toward Environmental Conservation in Coral Reef Social-Ecological Systems" Social Sciences 7, no. 7: 109. https://doi.org/10.3390/socsci7070109
Note that from the first issue of 2016, this journal uses article numbers instead of page numbers. See further details here.