Article

Assessing Energy Security Using Indicator-Based Analysis: The Case of ASEAN Member Countries

by
Kamonphorn Kanchana
1,* and
Hironobu Unesaki
1,2
1
Graduate School of Energy Science, Kyoto University, Yoshida Honmachi, Sakyo-ku, Kyoto-shi, Kyoto 606-8501, Japan
2
Kyoto University Research Reactor Institute, Kumatori-cho, Sennan-gun, Osaka 590-0494, Japan
*
Author to whom correspondence should be addressed.
Soc. Sci. 2015, 4(4), 1269-1315; https://doi.org/10.3390/socsci4041269
Submission received: 23 June 2015 / Revised: 6 November 2015 / Accepted: 26 November 2015 / Published: 4 December 2015

Abstract

:
Using indicator-based assessment, this study examines the energy security of nine Association of Southeast Asian Nations (ASEAN) member countries to see how it has evolved over the past 12 years and identifies a country-specific energy security context for each country. The assessment uses 42 energy security indicators, which can be separated into five components: overall energy balance, socio-economic aspect, domestic energy resources, overseas energy demands and resources, and diversification of energy supply. The findings show different energy security situations among ASEAN member nations that are a result of national energy contexts, specifically uneven economic and energy infrastructure developments. The context, at a national level, affects the connotation of energy security and the interpretation of the indicators, which reflects different primary issues of concern regarding energy security. At the international level, due to the diversity, the interconnection of intra-regional energy markets could contribute to energy self-reliance of the region. Adversely, the difference could hinder the prospect of cooperation due to the lack of consensus on shared value.

1. Introduction

Energy is essential to the well-being and functioning of a related system. For modern society, energy drives the day-to-day activities of people, societies, and economies. The role of energy is more than just to provide basic services, but also to facilitate functionality. Since energy plays a significant part across all sectors of activity, it involves a wide range of actors of all levels and permeates through time; threats to energy would affect everything within this context [1]. Energy security has emerged as policy concerns and as a concept since the era of modern energy systems and hydrocarbon [2]. Decision-makers implement policies to ensure the security of nations and economies presumably threatened by energy vulnerabilities while analysts and scholars pursue the elaboration of energy security studies.
Despite the importance and widely referenced terminology, there is no consensus on the concept of energy security. Energy security as a concept has raised controversies over its definition, scope, and approaches. Developed countries may refer to energy security as “a resilient energy system with uninterrupted availability of energy sources at an affordable price” [3,4,5,6], whereas developing countries simply define energy security as the access to modern energy services [7]. From an energy commodity perspective, energy-importing countries consider energy import dependency and vulnerability significant whereas energy-exporting countries prioritize the security of demand [8]. Its high context-dependence does not only affect the perception towards energy security, but also the extent to which the energy sector of a country can be considered secured and how it should be measured [9,10,11]. While previous studies that quantitatively measure energy security using indexes and indicators have addressed the multi-dimensionality and context-dependence of the concept [12,13,14,15,16,17], they merely discuss how different energy contexts affect the assessment. Some scholars have emphasized the significance of the balance between generalized and context-specific indicators [18]. Nevertheless, the question remains to what extent the assessment is general enough to allow comparison among countries or specific enough to capture a country-specific context and its concerns.
Since the concept of security is highly perceptual and contextual, in this paper, energy security is defined as the security of the national energy sector, specifically referring to an adequate and stable amount of energy supply to meet demand and function within the economy of a country. To cover energy-exporting countries, this study also considers the security of energy demand from overseas. In existing literature, the security of energy supply is commonly associated with keywords that suggest the secure continuity of supply to an energy system, e.g., a supply that is adequate, reliable, uninterrupted, stable, sufficient [19,20,21,22], and, for a socio-economic dimension, the affordability or reasonability of energy prices [23,24,25]. Using a broad definition makes it possible to cut through the complexity caused by different interpretations of energy security. In addition, this generic framework allows comparative discussions across countries with different energy contexts.
The purpose of this study is not to debate over the conceptualization of energy security or to offer a novel method of measuring it. It does, however, aim to examine energy contexts among countries by quantitatively assessing the energy security situation of a group of countries at the national level in order to identify different energy security contexts that are reflected through the indicators. Induced country-specific energy security contexts from the assessment are aimed to illustrate primary issues of concern based on actual energy security situations, not just perceived security. To achieve that, nine countries of the Association of Southeast Asian Nations (ASEAN) were selected as case study, due mainly to the diversity of energy contexts within the cluster and the lack of available studies. In spite of numerous regional cooperative frameworks on energy, e.g., ASEAN Power Grid, Trans-ASEAN Gas Pipeline, Coal and Clean Coal Technology, Renewable Energy, Energy Efficiency and Conservation, Regional Energy Policy and Planning, and Civilian Nuclear Energy [26,27], there has been a small number of studies that assess how each country performs in terms of energy security or addresses the diversity in energy contexts among the member countries [28,29,30].
In order to identify country-specific energy contexts of nine ASEAN member countries, this study uses a selected set of indicators to assess their energy security performances at the national level. The findings aim to provide an overall country-specific evaluation of the energy security performances of ASEAN countries and their primary issues of concern, which could serve as a stepping-stone for further study on regional cooperation for energy security. The paper is composed of four main sections. Following this introduction, Section 2 describes the methodology and indicators used to assess energy security. Section 3 presents empirical results, and Section 4 discusses energy security contexts of ASEAN member countries and policy implications based on the assessment.

2. Methods

Using an indicator-based assessment, this study quantitatively measures the energy security of nine ASEAN member nations: Brunei Darussalam (hereafter referred to as Brunei), Cambodia, Indonesia, Malaysia, Myanmar, the Philippines, Singapore, Thailand, and Vietnam. Laos has been excluded due to energy data inaccessibility. The study examines whether and how the performance of energy security of each ASEAN member nation has evolved over the past 12 years and how different energy security contexts can be identified and reflected through selected indicators.
Indicators of energy security were determined based on energy demand and supply security and socio-economic dimensions. However, the study put an emphasis on the security of energy supply, and the physical availability of energy sources, which is the central dimension of energy security [12], as well as energy security from the perspective of energy-exporting countries. Energy supply insecurity ranges from overreliance on external energy resources to insufficiently diversified energy sources, while the socio-economic dimension highlights energy efficiency from a macroeconomic perspective. An indicator-based assessment allows a wide range of issues to be tackled since the selected indicators are not explicitly linked, and is thus able to identify wider vulnerability issues. Nevertheless, to sufficiently cover multifaceted aspects of energy security, it requires a large number of individual indicators. Thus, the assessment was conducted using 42 individual indicators (as shown in Table 1), most of which were adapted from existing energy security studies [31,32,33].
Table 1. List of selected energy security indicators.
No.IndicatorsC1C2C3C4C5
1Primary energy mix
2Electricity generation by source
3Sectoral energy consumption
4Access to electricity
5Total primary energy supply per capita
6Final energy consumption per capita
7Electricity consumption per capita
8Primary energy intensity
9Energy consumption intensity
10Electricity intensity
11Energy self-sufficiency
12Coal self-sufficiency
13Crude oil self-sufficiency
14Natural gas self-sufficiency
15Coal R/P ratio
16Crude oil R/P ratio
17Natural gas R/P ratio
18Refining capacity
19Energy trade per GDP
20Coal export-to-production ratio
21Crude oil export-to-production ratio
22Natural gas export-to-production ratio
23Energy import dependency
24Coal import dependency
25Crude oil import dependency
26Natural gas import dependency
27Reliance on Middle East crude oil imports
28Reliance on Middle East natural gas imports
29Reliance on Middle East refined oil imports
30Intra-regional coal import dependency
31Intra-regional crude oil import dependency
32Intra-regional natural gas import dependency
33Intra-regional refined oil import dependency
34SWI: PES diversification
35HHI: Coal export destination diversification
36HHI: Crude oil export destination diversification
37HHI: Natural gas export destination diversification
38HHI: Refined oil export destination diversification
39HHI: Coal import source diversification
40HHI: Crude oil import source diversification
41HHI: Natural gas import source diversification
42HHI: Refined oil import source diversification

2.1. Selecting Energy Security Indicators

In addition to thematic relevance, indicator selection was based on the “SMART” criteria (specific, measurable, achievable, realistic, and time-based) [34]. In short, indicators should represent specific attributes and be quantitatively measurable and comparable across countries and temporal conditions. They must also be achievable, realistic, and timely. Selected indicators were categorized into five components: (1) overall energy balance; (2) socio-economic aspect; (3) security of domestic resources; (4) vulnerability to overseas resources and external demands; and (5) diversification of energy supply and trade partners. Selected indicators are quite specific in terms of energy products, which include primary energy (coal, crude oil, and natural gas) and refined oil (for certain indicators), but the indicators are rather open to including different roles of energy actors (importer, producer, or exporter). Using generic indicators allows us to identify country-specific energy security contexts, which are not only useful for national-level analysis but also the discussion on a regional level.
Under the overall energy balance component, three indicators, primary energy mix, power generation mix, and sectoral energy consumption, were selected to show the overview of development and trends of ASEAN energy balances. In the “primary energy mix”, sources referred to in the indicator include coal, crude oil, natural gas, and renewables, whereas sources in the “electricity generation mix” are coal, oil products, natural gas, and renewables. “Sectoral energy consumption” shows how each sector of the economy (industry, transport, residential, commercial and public services, and others) contributes to energy consumption.
The second component, socio-economic aspect, reflects energy accessibility and efficiency. “Access to electricity”, which is measured through the electrification rate (national and rural), shows to what extent the country has access to modern energy services. It also reflects the security of energy supply from a human-centric perspective. “Total primary energy supply per capita”, “final energy consumption per capita”, and “electricity consumption per capita” reflect the intensity of energy use among the population.
Per capita indicators can be interpreted differently depending on the context. For countries with energy poverty problems, higher energy and electricity consumption per capita would mean better accessibility to energy for the people. For countries that hit a plateau of energy infrastructure development, a lower indicator could indicate energy efficiency. These four indicators highlight the energy demand of the country while indicators on energy efficiency assess the management of energy demand. Energy efficiency of the economy was measured by “primary energy supply intensity”, “energy consumption intensity”, and “electricity consumption intensity”, showing the amount of energy/electricity consumed to produce certain units of GDP. This indicator shows the energy efficiency of the economy. A lower value of energy intensity refers to a higher energy efficiency.
As the third component focuses on domestic energy resources, selected individual indicators include self-sufficiency, reserves-to-production ratio, and refining capacity. It should be noted that the focus of assessing domestic energy resources is to reflect domestic resource availability (to meet energy demand), not resource sustainability. The “self-sufficiency” indicator was used to assess the share of indigenous energy production in the total supply of energy. Besides the energy self-sufficiency rate, the indicator includes explicit sources, namely coal, crude oil, and natural gas. Renewable energy was not included because of its indigenousness. The formula is the ratio of the domestic energy production to the total primary energy supply (TPES) for each energy product. The self-sufficiency rate shows the capacity of the country to cover its energy demand using domestic resources. The self-sufficiency rate ranges from 0 to 1. The higher value indicates more self-sufficiency (in other words, the less the country has to rely on external energy resources) while a value over 1 implies export capability.
The “reserves-to-production” ratio (R/P ratio) was chosen to represent the availability of (proven) hydrocarbon energy resources of the country through the number of years resources have been available, presuming the production is consistent. Energy sources included in this indicator are coal, crude oil, and natural gas. As a result of the ASEAN reputed refining industry, “refining capacity” was also included, but assessed only countries with refined oil exports (Indonesia, Singapore, and Thailand).
For the fourth component, the reliance on overseas energy resources and/or external energy demand is a major concern. Since ASEAN members are a mixture of both energy-importing and energy-exporting countries, reliance on external factors is thus divided into overseas resources and overseas demands. The indicator of “energy trade per GDP” draws an overall image of how much the economy is open to international energy trade, the extent to which energy exports contribute to economic growth, and how much the country spends on energy imports. For exporting countries, the indicator regarding the export-to-production ratio was developed to reflect the extent to which the domestic production of a particular energy product is bonded to external demands. The assessment was used to measure three primary energy sources: coal, crude oil, and natural gas.
Focusing on the imports, “energy import dependency” shows the extent to which a country relies on imported fuels in order to meet the demands. In this indicator, energy products include coal, crude oil, natural gas, and the total of all energy products (including renewables). The import dependency rate is calculated based on the ratio of imported energy products to the total primary energy supply. The import dependency rate reflects the reliance of the country on imported overseas resources. The rate usually ranges from 0 to 1. A higher value implies a higher dependence, which infers more exposure to energy vulnerability.
To reflect the geographical vulnerability of the overseas supply, “reliance on Middle East imports” and “intra-regional energy imports” indicators were selected. The indicators show the share of the imports from the Middle East (calculated for crude oil, natural gas, and refined oil) and from intra-ASEAN countries (calculated for coal, crude oil, natural gas, and refined oil) in total world imports. The reason for focusing on the Middle East and intra-ASEAN countries is to show energy (inter)dependence within the region and otherwise. Equivalent to the import dependency rate, the two area-specific reliance indicators also range from 0 to 1. A higher value signifies a greater dependence on the import source.
Diversification is the key to enhance energy security. The fifth component focuses on supply diversification and supplier (or market) diversification. The Shannon-Wiener Index (SWI) was chosen to measure the degree of primary energy supply diversity. SWI is often used to measure the diversity and evenness of the products or, in this case, energy sources. The formula is where N represents the total number of energy sources and pi represents the share of energy supply from each source in a total primary energy supply. The index ranges from 0 to 2. A higher value of SWI refers to more diversified energy sources, which implies a more resilient energy supply, while a lower value represents low diversification of energy sources and, thus, poorer energy security. However, SWI does not reflect the disparity dimension of diversification [35].
Another diversity indicator selected to analyze market concentration was the Herfindahl-Hirschman index (HHI). On the one hand, the method was also used to measure the degree of concentration of the specific export destination. In this aspect, energy products in the HHI diversity assessment include coal, crude oil, natural gas, and oil products. On the other hand, the indicator reflects the degree of concentration of import sources (partner country) in relation to total imports of an energy product. The inclusion of the assessment on energy-exporting countries is not commonly found in existing studies on energy security assessment, since most of them primarily focused on importing countries [16,33,36,37,38,39]. Energy interdependence implies mutual costs to both importer and exporter. If the market for energy exports is too concentrated, this may induce economic dependence of the energy exporter on a particular trade partner.
The formula is where p refers to the import or export share per energy source, i is the source country or export destination, j equals the energy product, and N is the total number of source countries or export destinations. HHI value ranges from 0 to 1. In contrast to the SWI, an HHI below 0.15 reflects an unconcentrated market condition while a value over 0.25 indicates high market concentration. In particular cases, the value of 1 suggests the absolute market concentration where there is only one supplier contributing to the total imports or one export destination for all exports.

2.2. Data

The criteria for data acquisition include credibility, accessibility, transparency, and comparability. Furthermore, due to the difference in units of currency and measurement among the nine countries, data on monetary and energy statistics from reputed international organizations were preferred over national data.
Primary energy statistics were retrieved from the International Energy Agency [40] while macroeconomic statistics were collected from the World Bank [41] and the International Monetary Fund [42]. Some of the crude oil and oil-related statistics were gathered from the Organization of the Petroleum Exporting Countries (OPEC) annual statistical bulletin [43] and the British Petroleum (BP) statistical review of world energy [44]. Commodity trade statistics were collected from the statistical database of the United Nations Commodity Trade Statistics Database (UN Comtrade) [45]. Other statistics were obtained from ministry of energy.
The analysis was conducted based on the data for the years 2001 to 2012 except in the assessment regarding the energy commodity trade, import source, and export destination because of the lack of accessible data, which was based on the latest data available (2012) and 2010 for Myanmar statistics. For GDP statistics, the data were in constant 2005 U.S. dollar (USD), in which the GDP was converted from domestic currencies to USD using the 2005 official exchange rates [41].
The results for certain indicators were presented using a two-digit country code [46]: Brunei (BN), Cambodia (KH), Indonesia (ID), Malaysia (MY), Myanmar (MM), the Philippines (PH), Thailand (TH), Singapore (SG), and Vietnam (VN).

3. Empirical Results

Based on five thematic components, which include the overall energy balance, socio-economic aspect, security of domestic resources, vulnerability to overseas resources and external demands, and diversification of energy supply and trade partners, this section presents and explains the findings by country, energy product, and as a regional body.

3.1. Overall Energy Balance

3.1.1. Primary Energy Mix

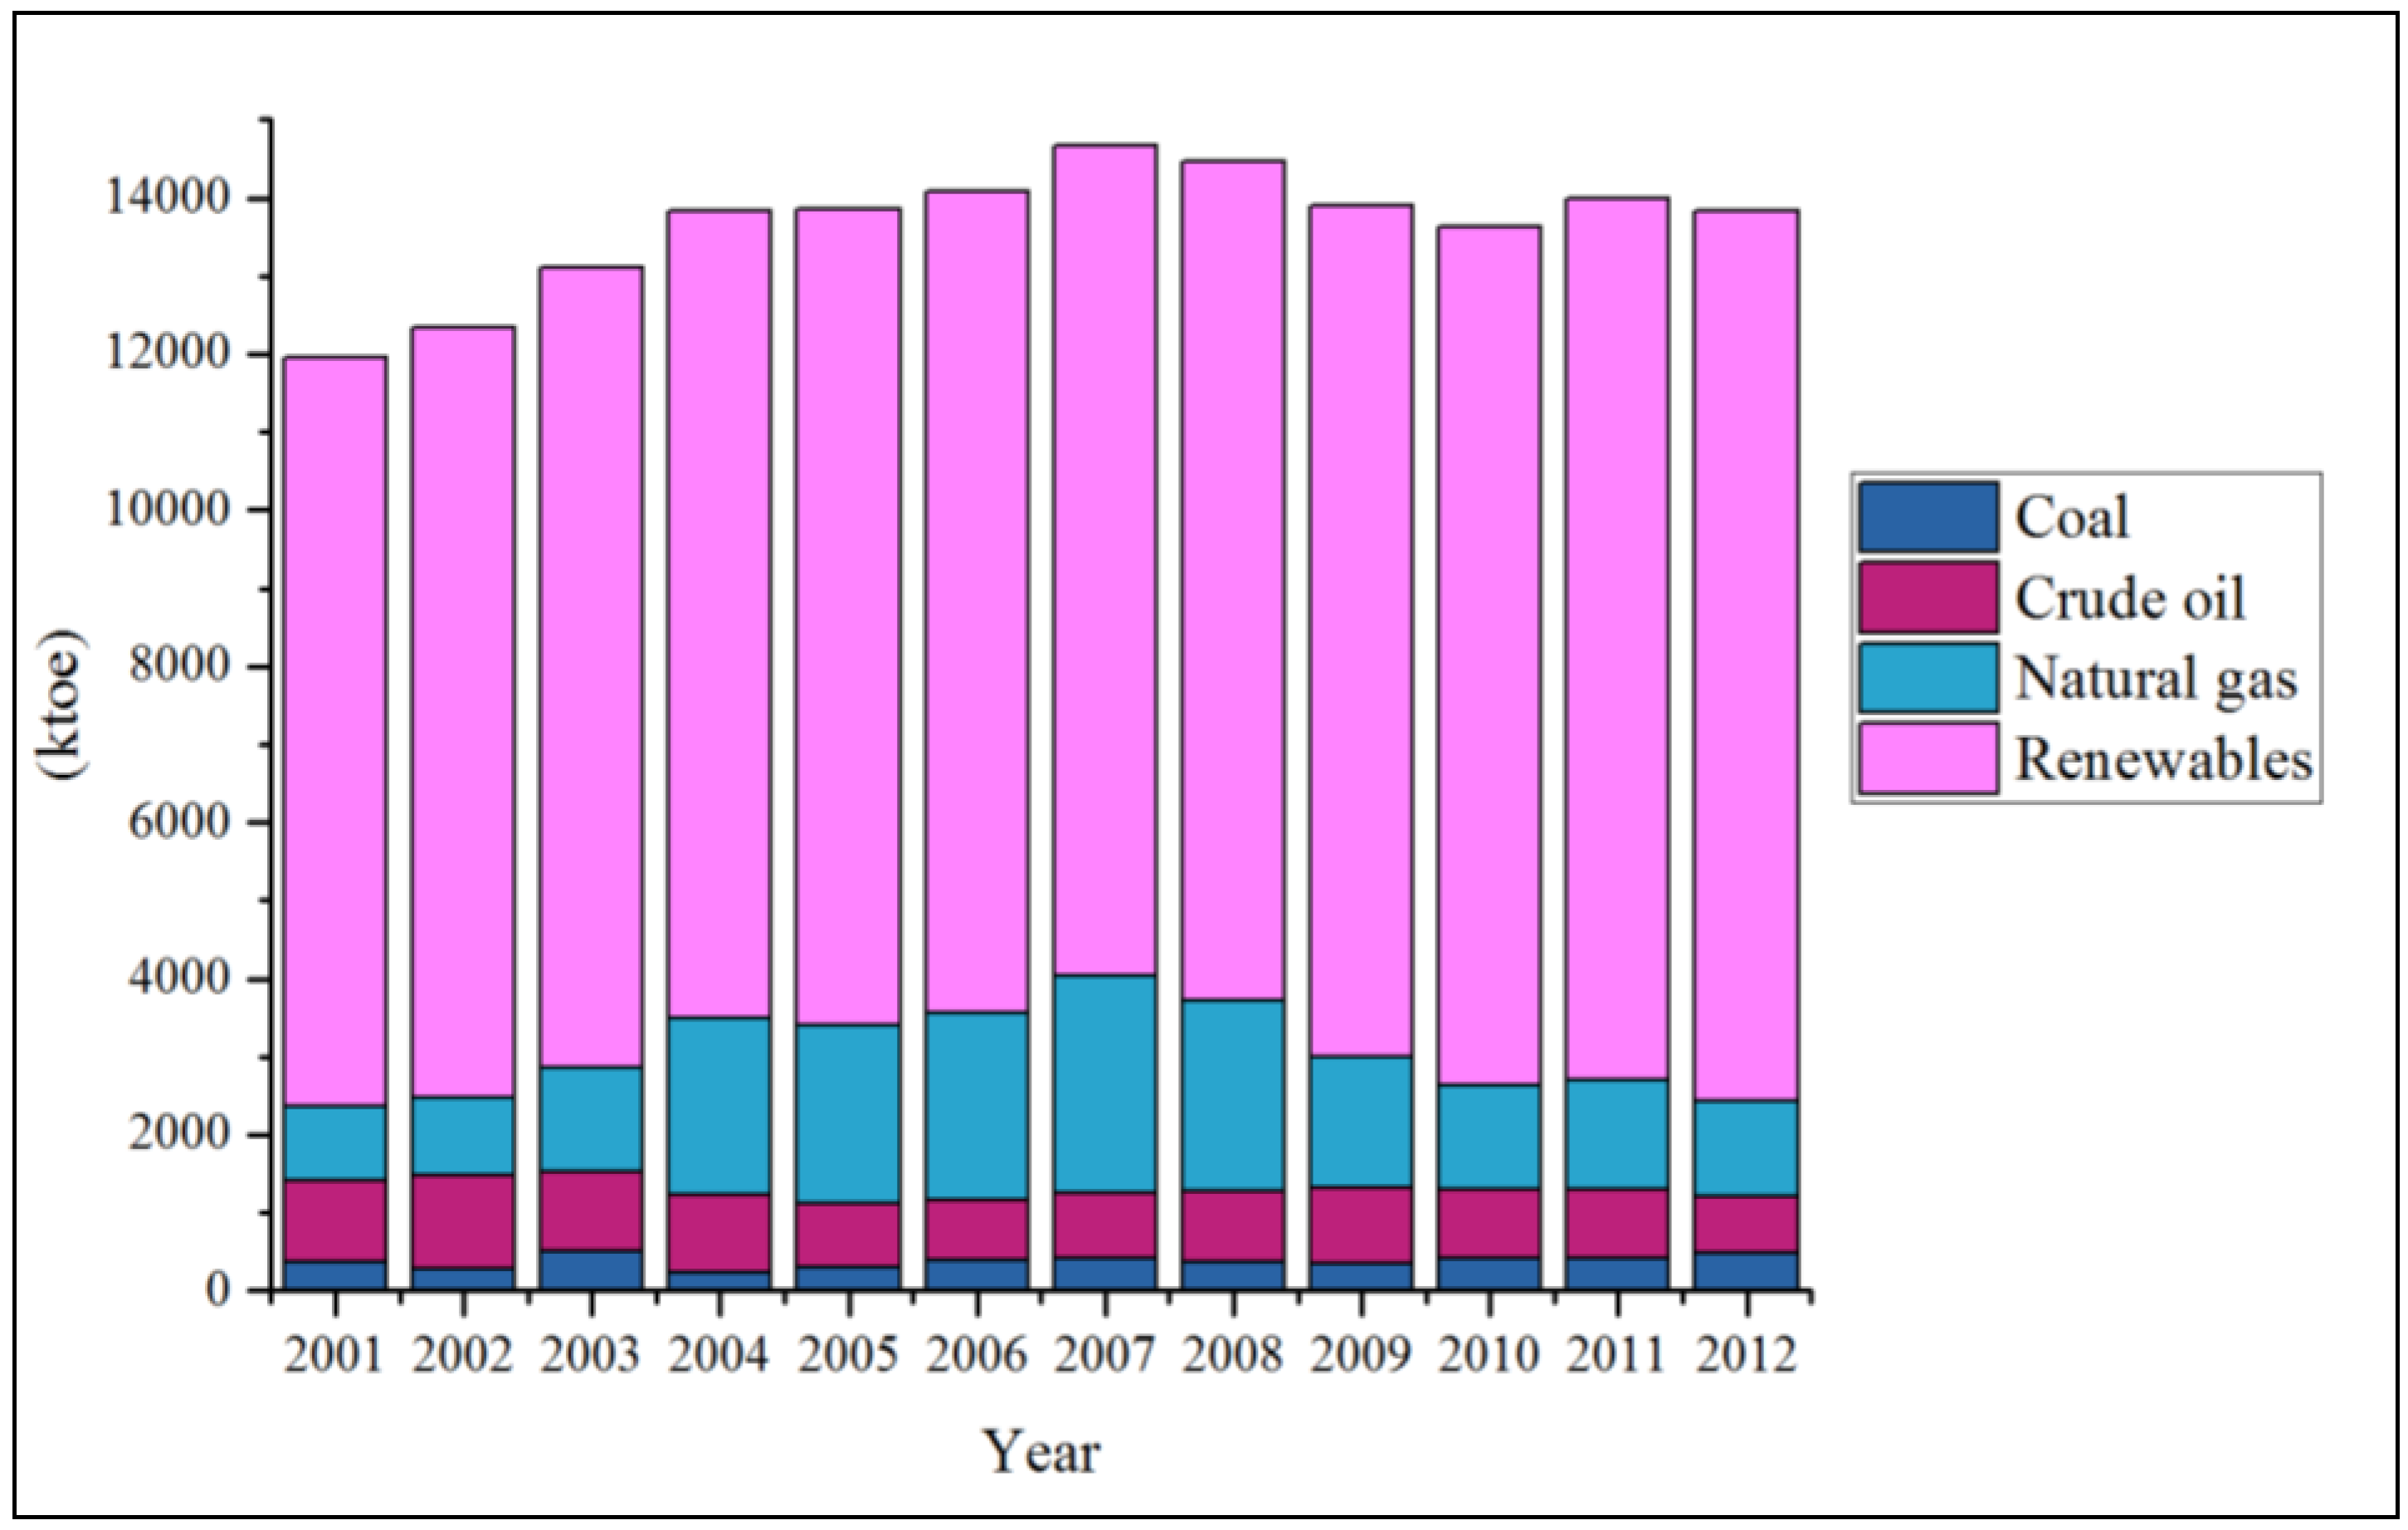
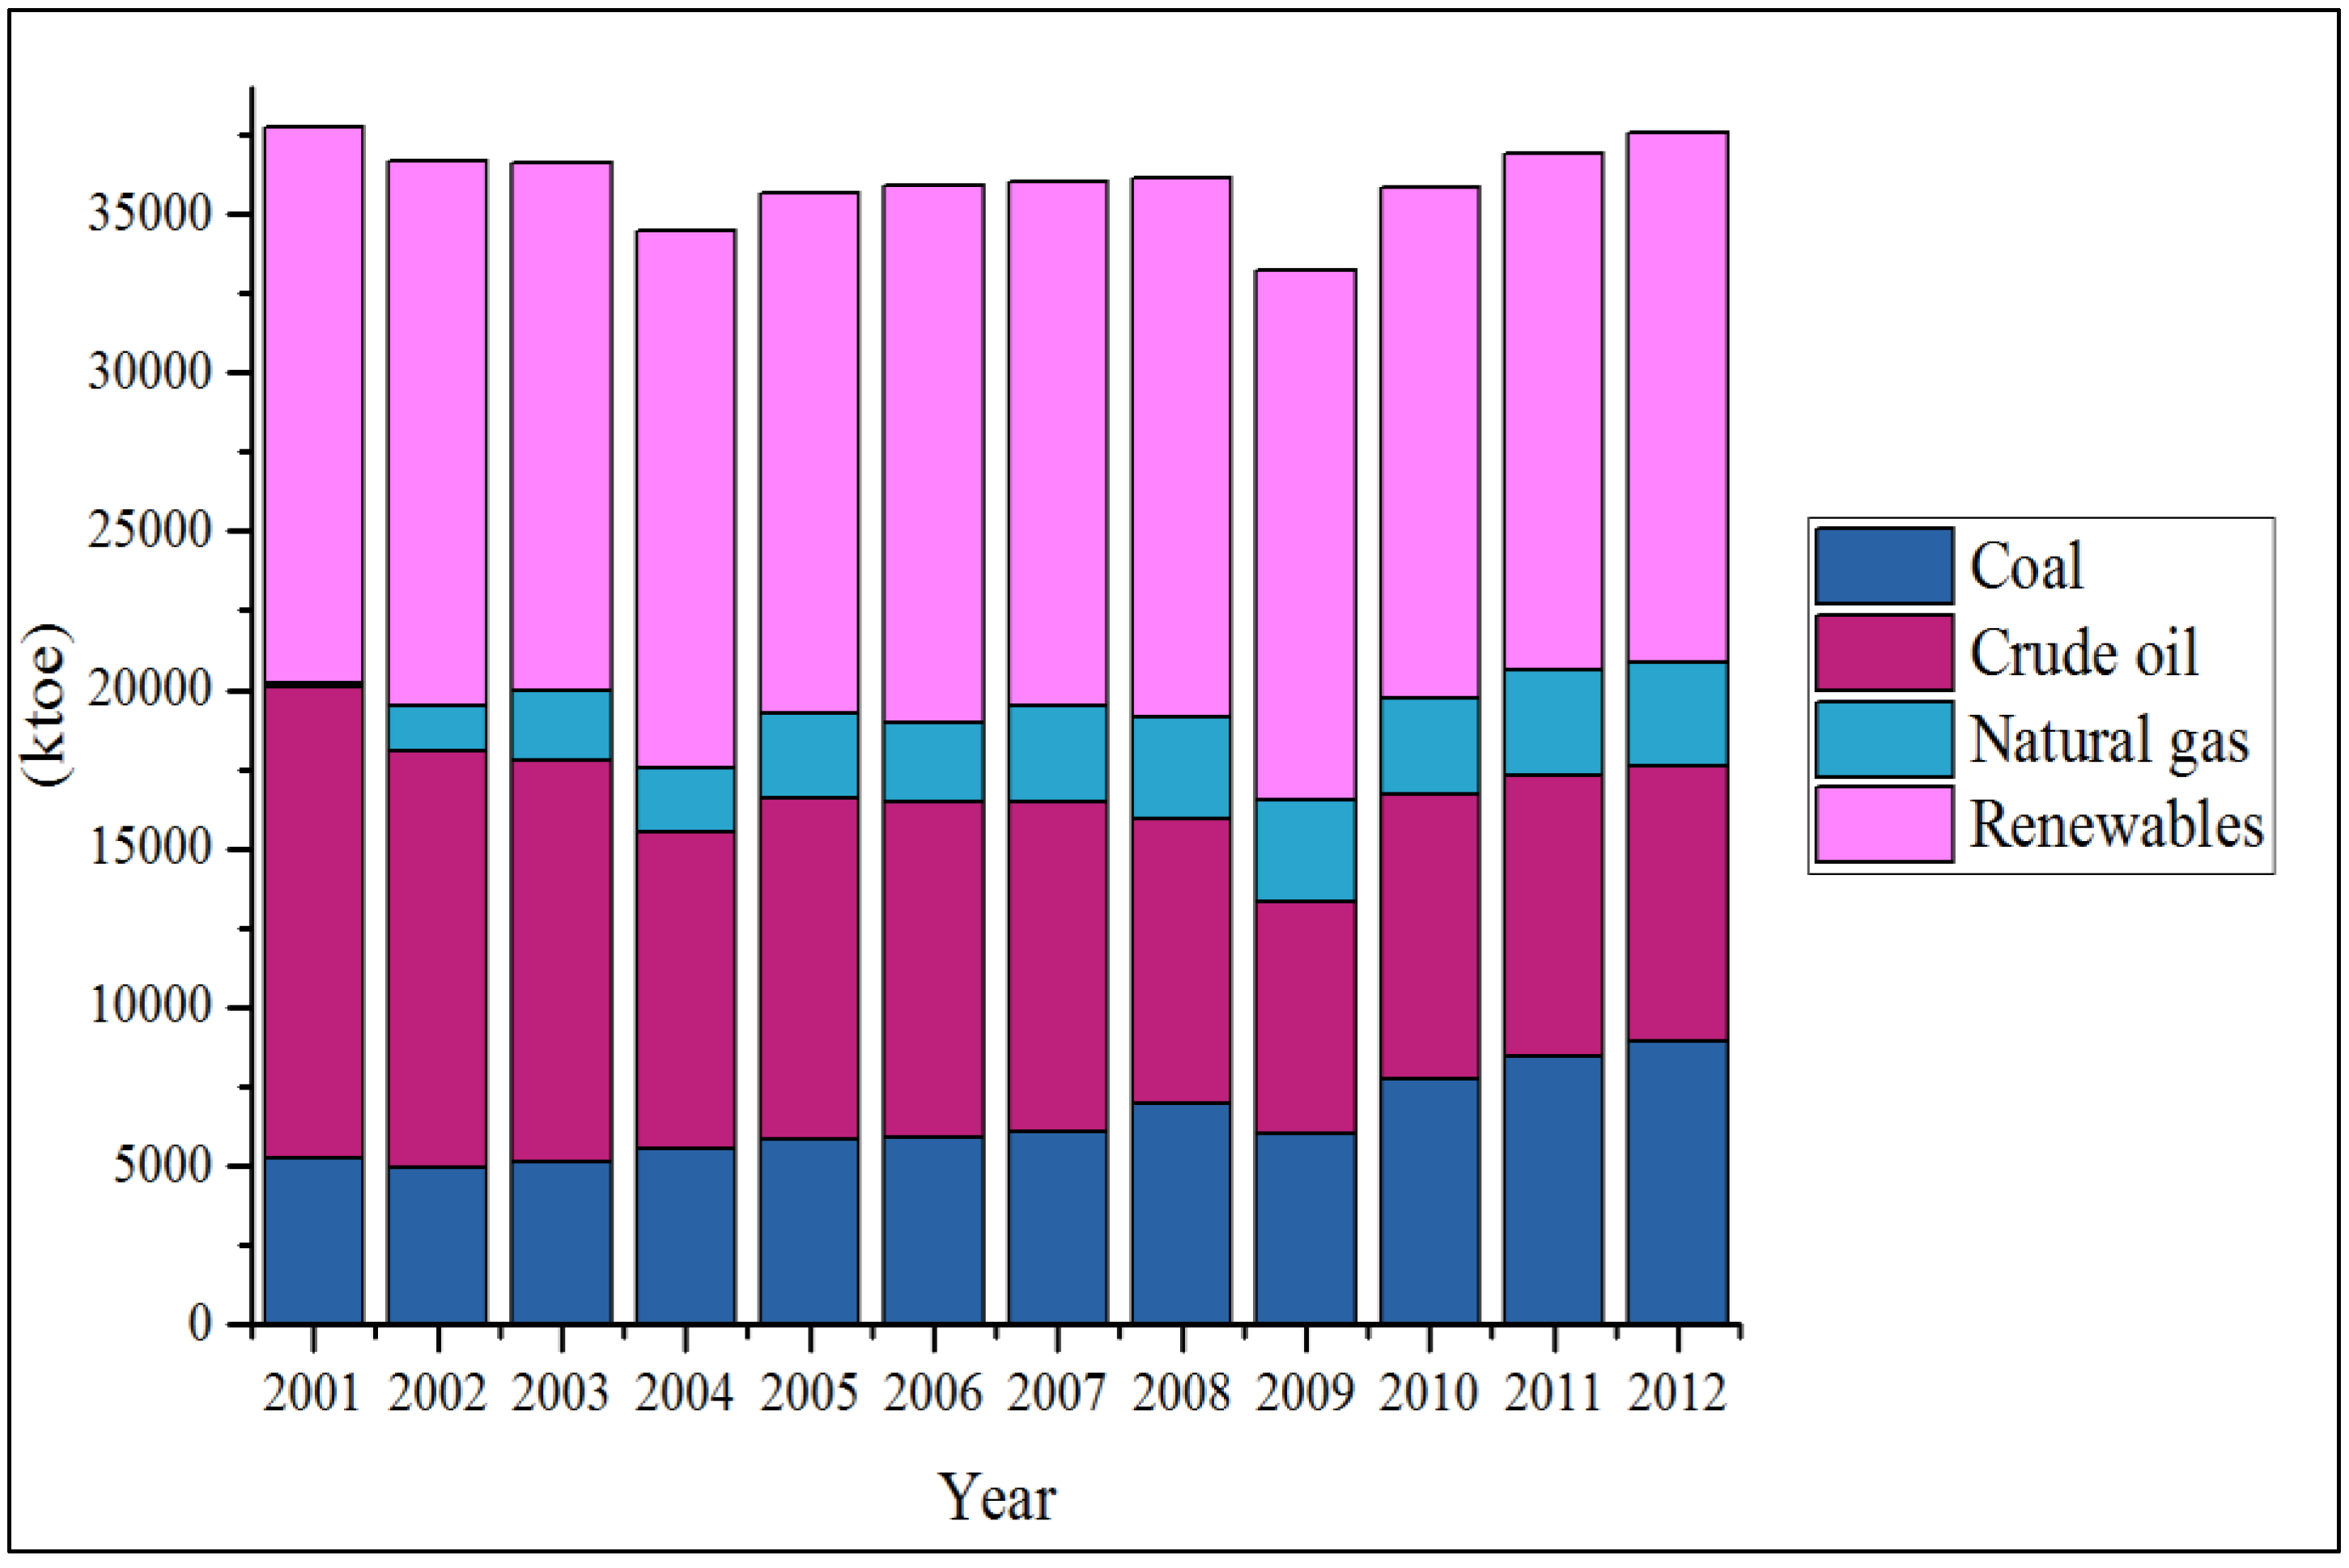
Figure 1, Figure 2 and Figure 3 show the primary energy mix of Brunei, Cambodia, and Indonesia. Blessed with abundant natural gas and oil resources, Brunei’s primary energy supply (PES) mix is almost 100% based on fossil fuels (although the country started solar power generation in 2011, the amount is relatively small [47]). However, Cambodia is nearly 100% dominated by renewable energy that is mainly traditional biomass, due to energy poverty and the lack of modern energy infrastructure development [48]). Unlike Brunei and Cambodia, Indonesia’s energy mix is more diversified (see Figure 3). On average, approximately 40% of the Indonesian mix is from renewable energy (biofuels, geothermal, and hydropower) whereas one-third of the mix is based on crude oil, followed by natural gas (less than 20%) and coal (around 10%).
Figure 1. Brunei: primary energy mix.
Socsci 04 01269 g001
Figure 2. Cambodia: primary energy mix.
Socsci 04 01269 g002
Figure 3. Indonesia: primary energy mix.
Socsci 04 01269 g003
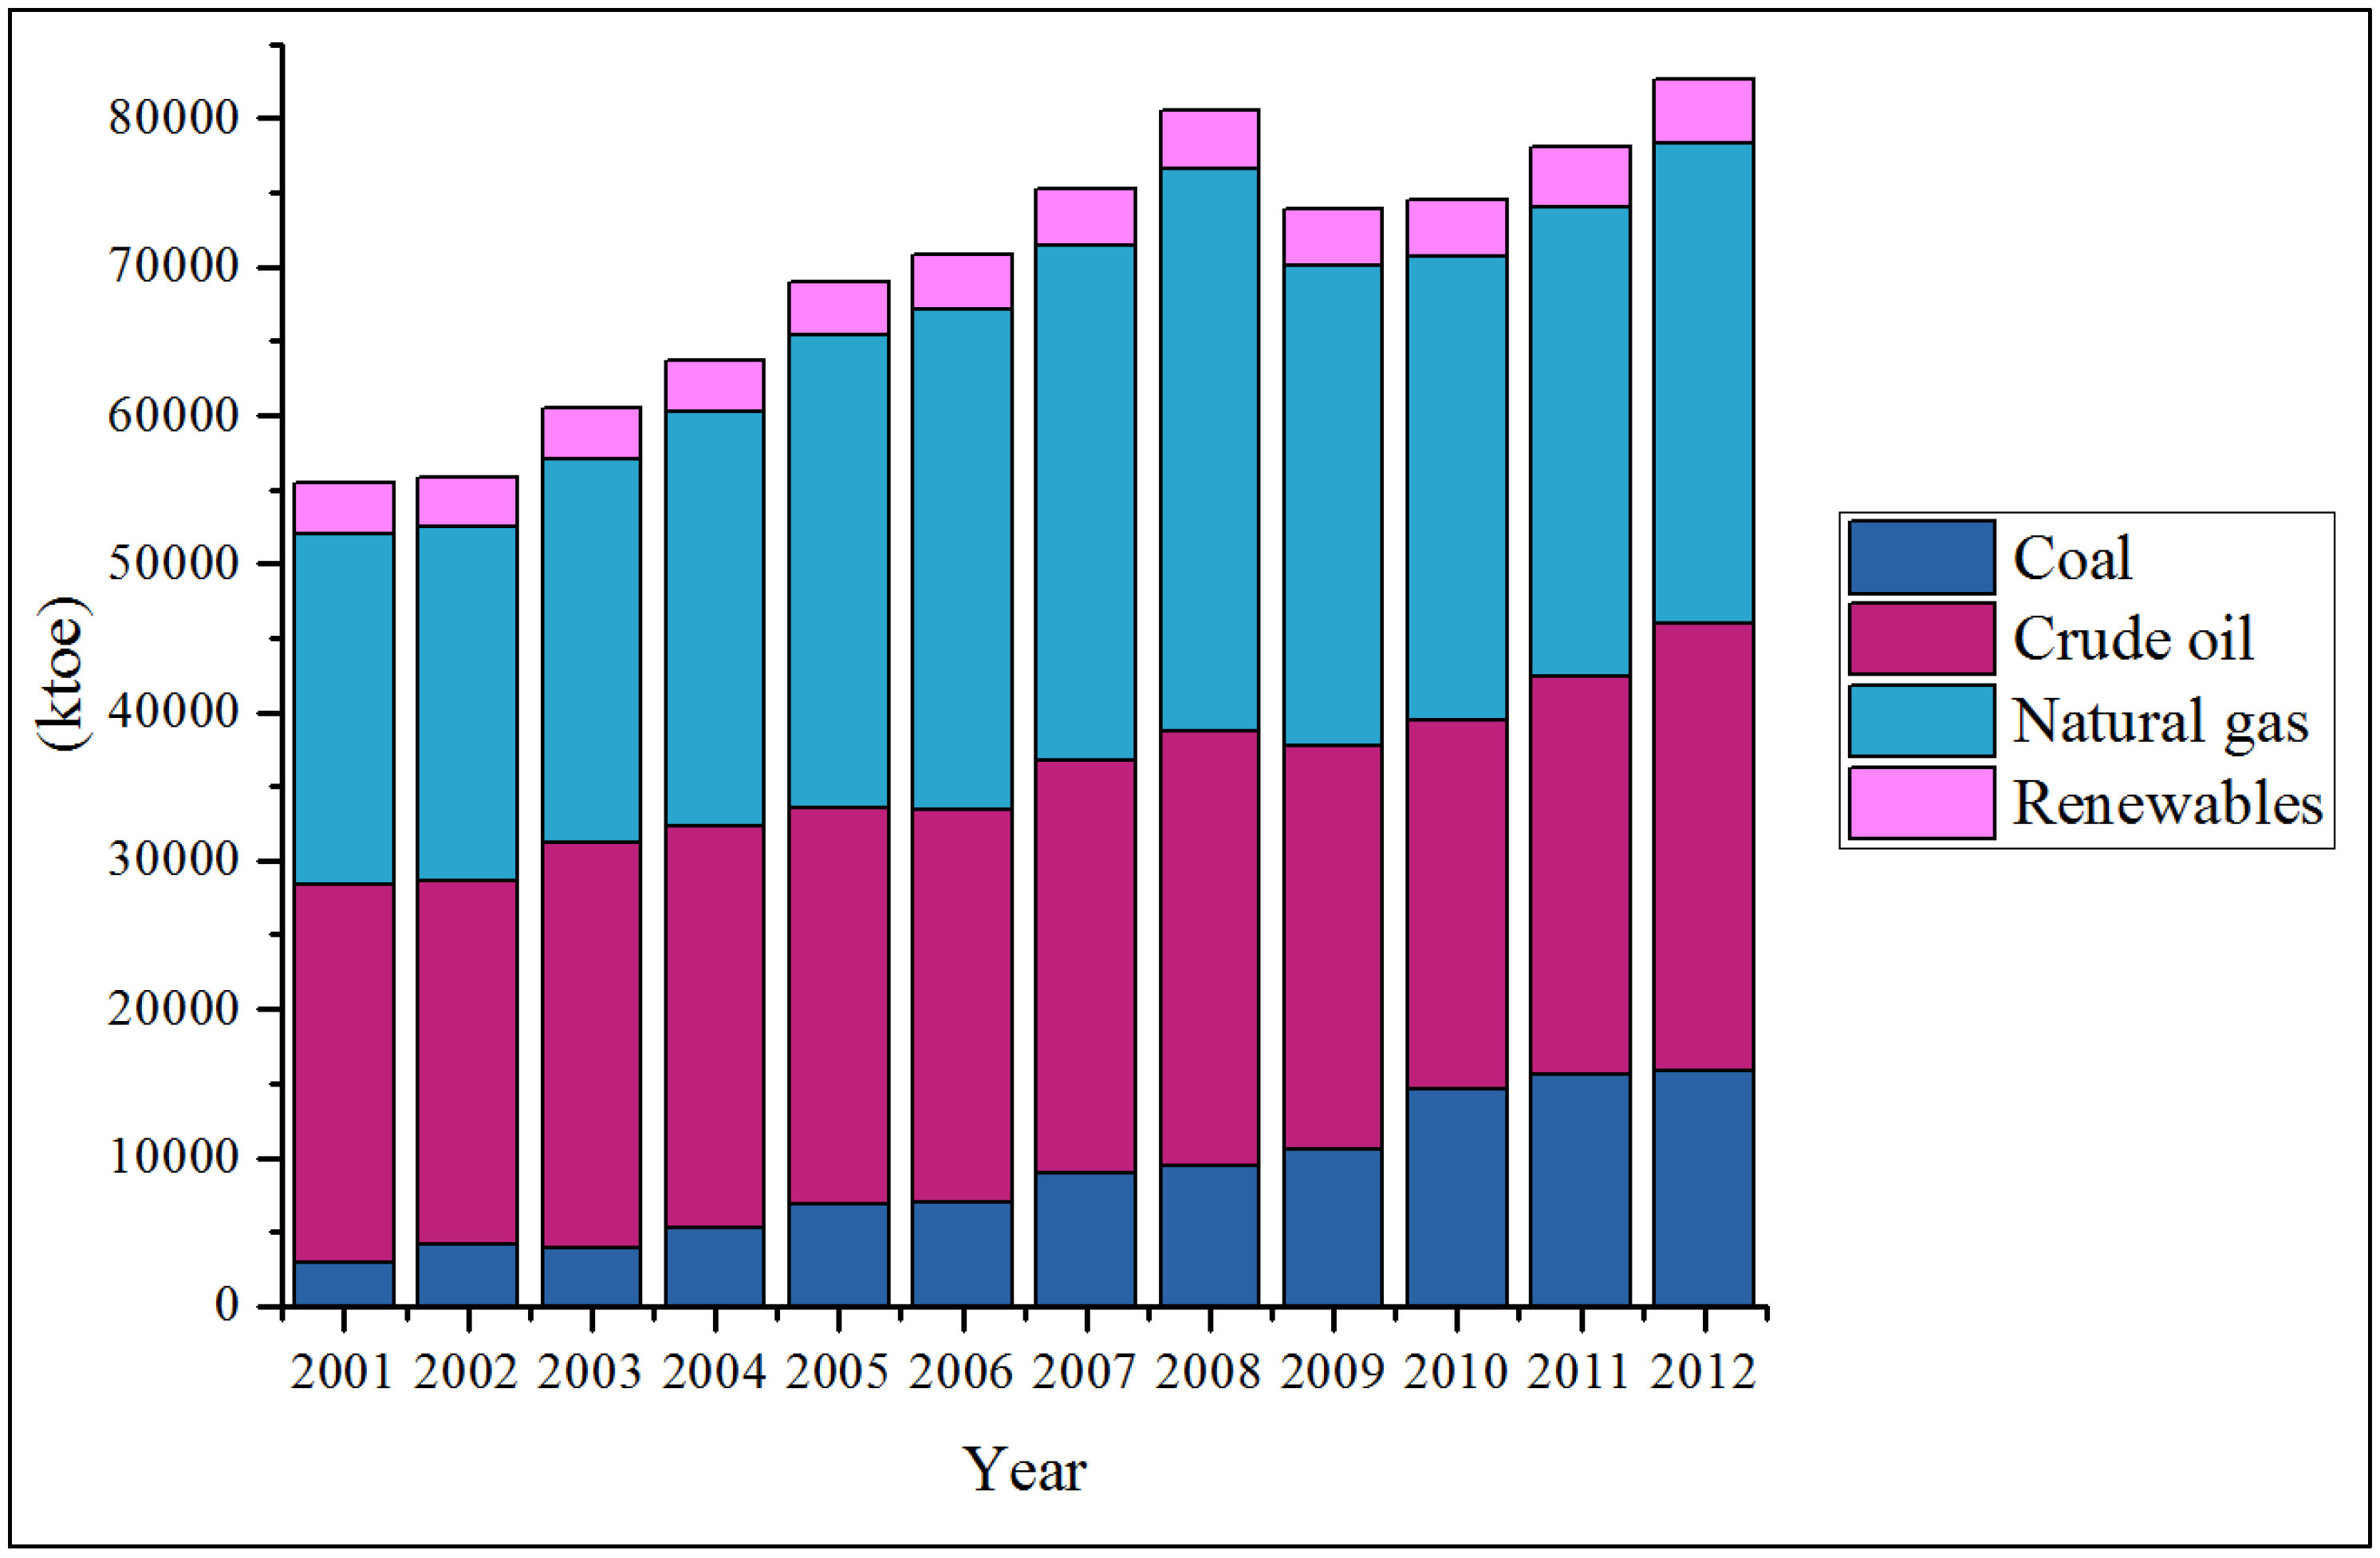
On the other hand, Malaysia’s primary energy mix (see Figure 4) is heavily concentrated on hydrocarbons (more than 90%). Based on 2012, coal accounts for 19% (5% in 2001), crude oil accounts for 37% (46% in 2001), and natural gas for 39% (43% in 2001). Similar to Cambodia, Myanmar’s primary energy mix is dominated by traditional biomass (around 80% in the past 12 years). Despite prosperous natural gas reserves and other energy potentials, the share of natural gas in the TPES is remarkably low, as seen in Figure 5. The Philippines’ primary energy mix (presented in Figure 6) is half renewables (biofuels, geothermal, and hydropower) and half hydrocarbons.
Figure 4. Malaysia: primary energy mix.
Socsci 04 01269 g004
Figure 5. Myanmar: primary energy mix.
Socsci 04 01269 g005
Figure 6. The Philippines: primary energy mix.
Socsci 04 01269 g006
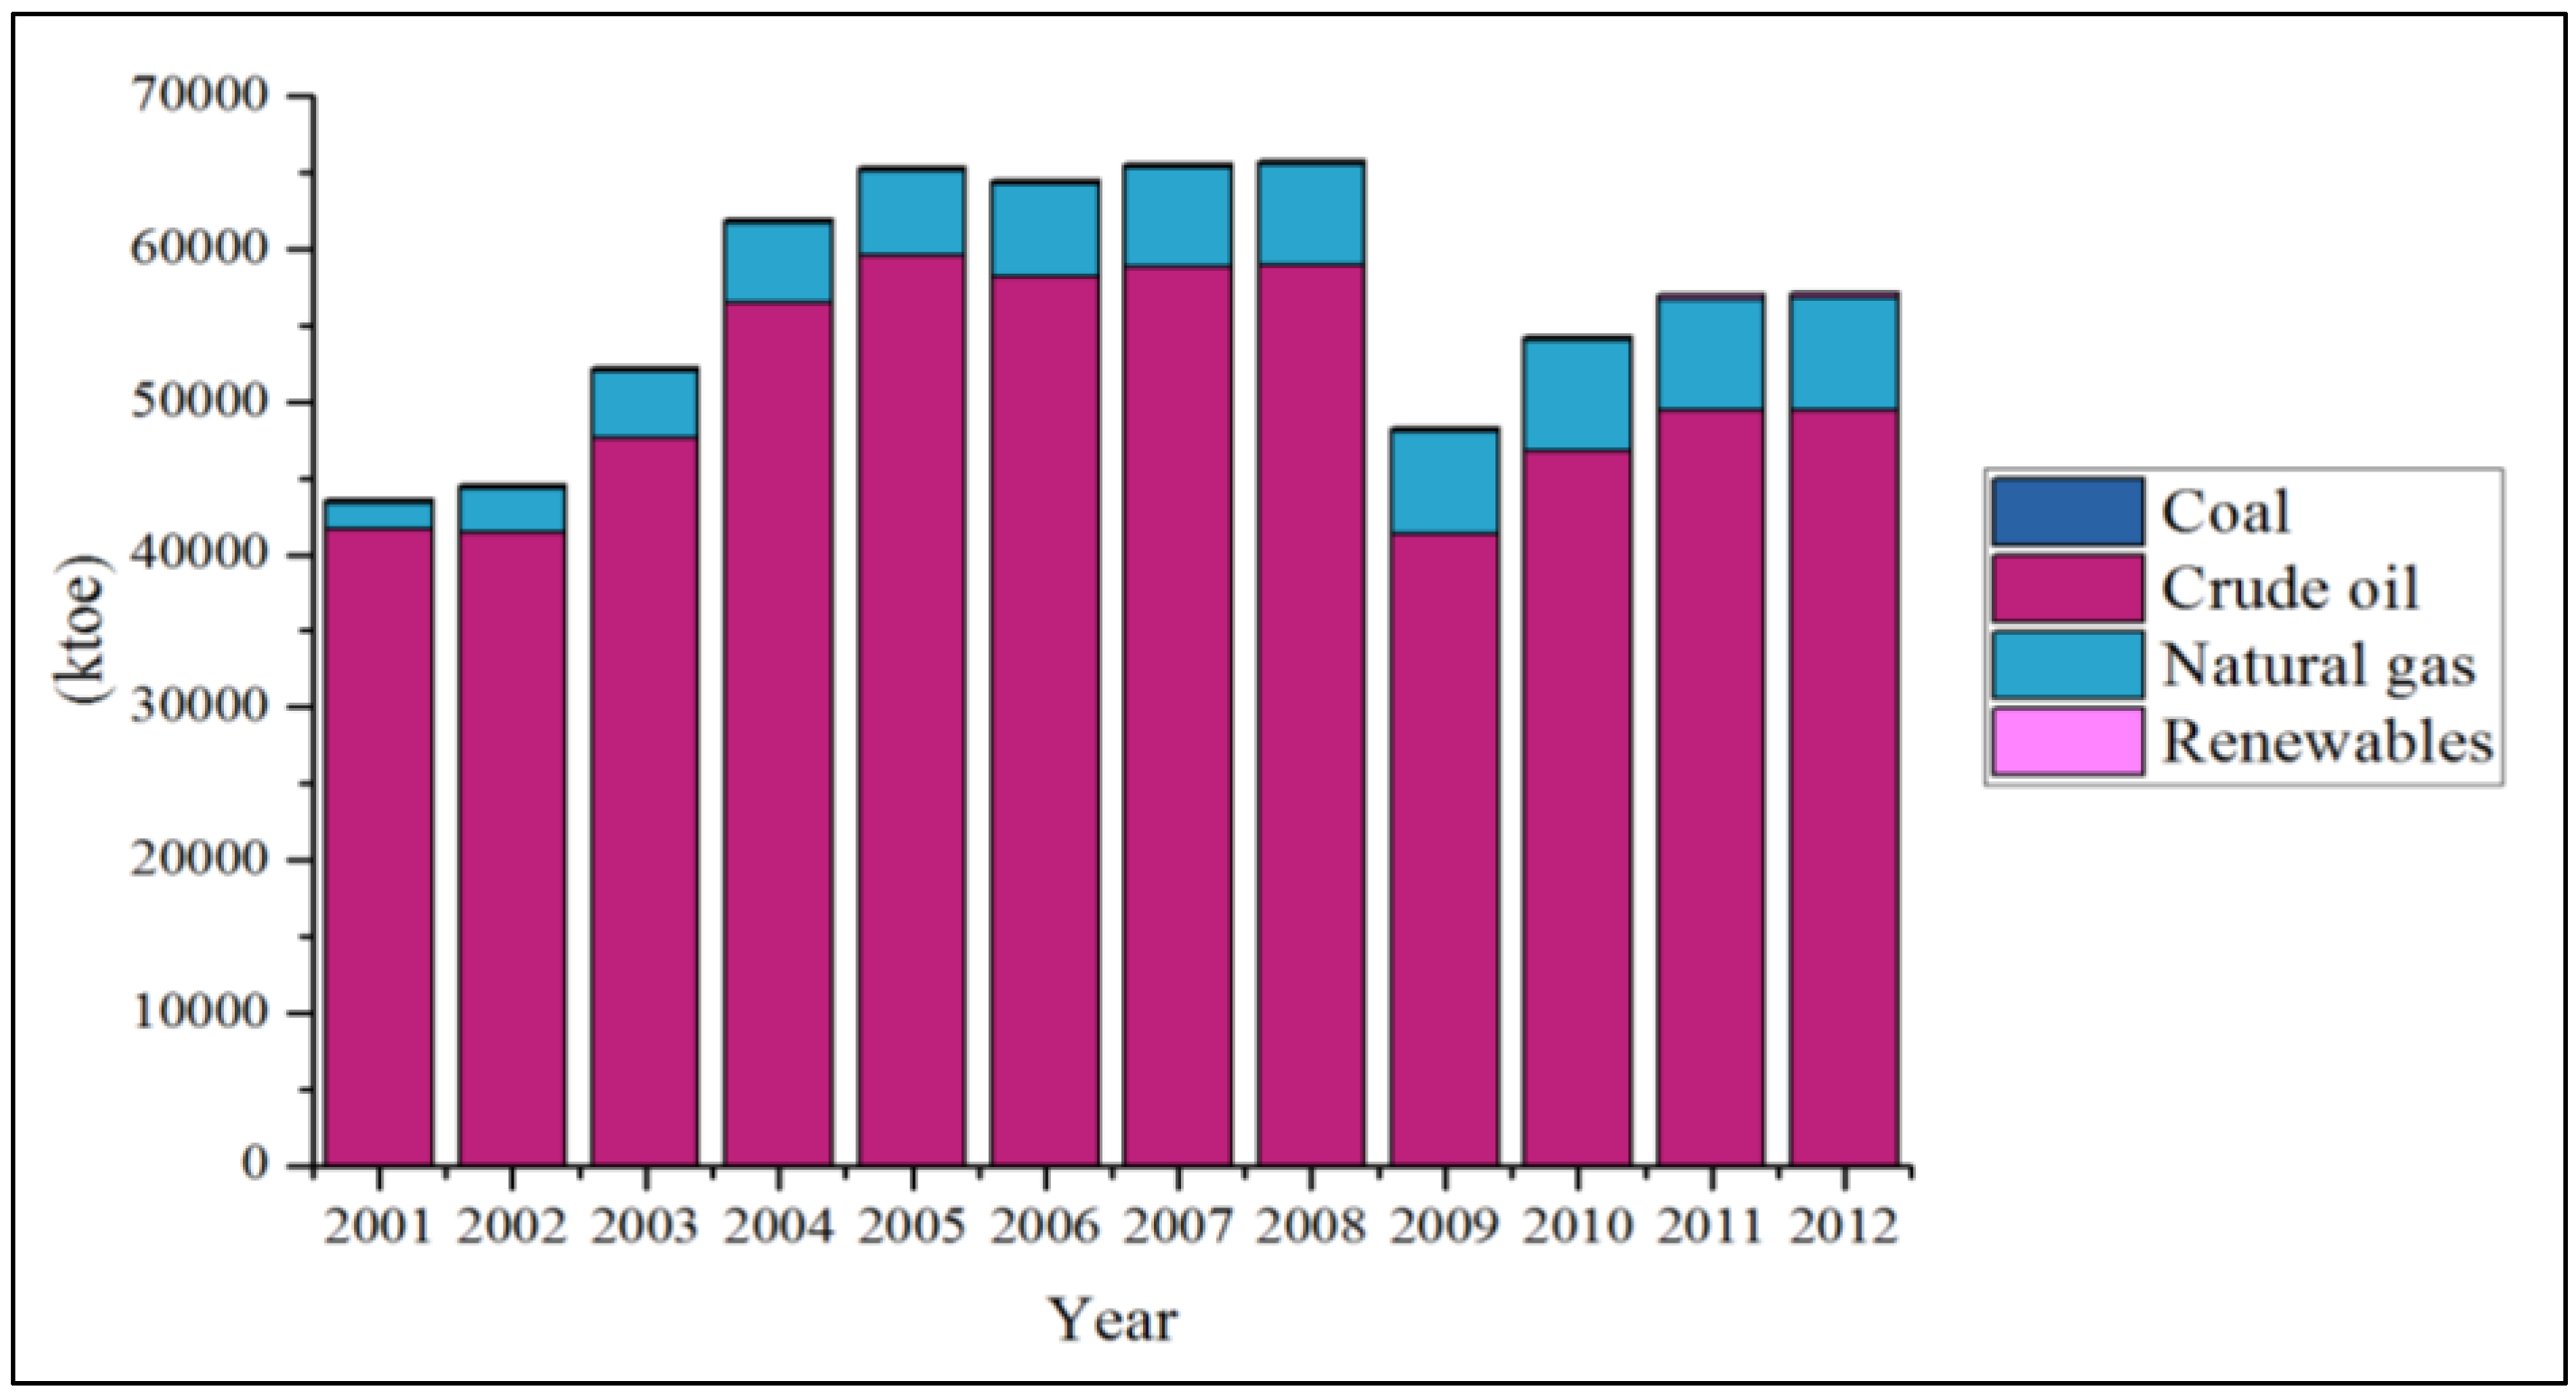
Due to the lack of indigenous resources, the primary energy supply of Singapore is almost 90% crude oil-based, specifically imported crude. As seen from Figure 7, although the share of natural gas has gradually increased, the mix is highly crude oil-concentrated, resulting from its exports of crude oil and petroleum products. While Thailand’s primary energy mix may appear to be rather diversified, hydrocarbons account for more than 80% of the mix, in which half of it is crude oil-based (see Figure 8). Biofuels, hydroelectricity, and solar power contribute to the country’s renewable energy. Vietnam’s primary energy mix reflects how the country has developed its energy sector. Presented in Figure 9, the obvious increase of coal, crude oil, and natural gas has surpassed renewable energy (renewable energy accounted for 71% of the Vietnamese PES mix in 2001, which was reduced to 38% in 2012).
Figure 7. Singapore: primary energy mix.
Socsci 04 01269 g007
Figure 8. Thailand: primary energy mix.
Socsci 04 01269 g008
Figure 9. Vietnam: primary energy mix.
Socsci 04 01269 g009
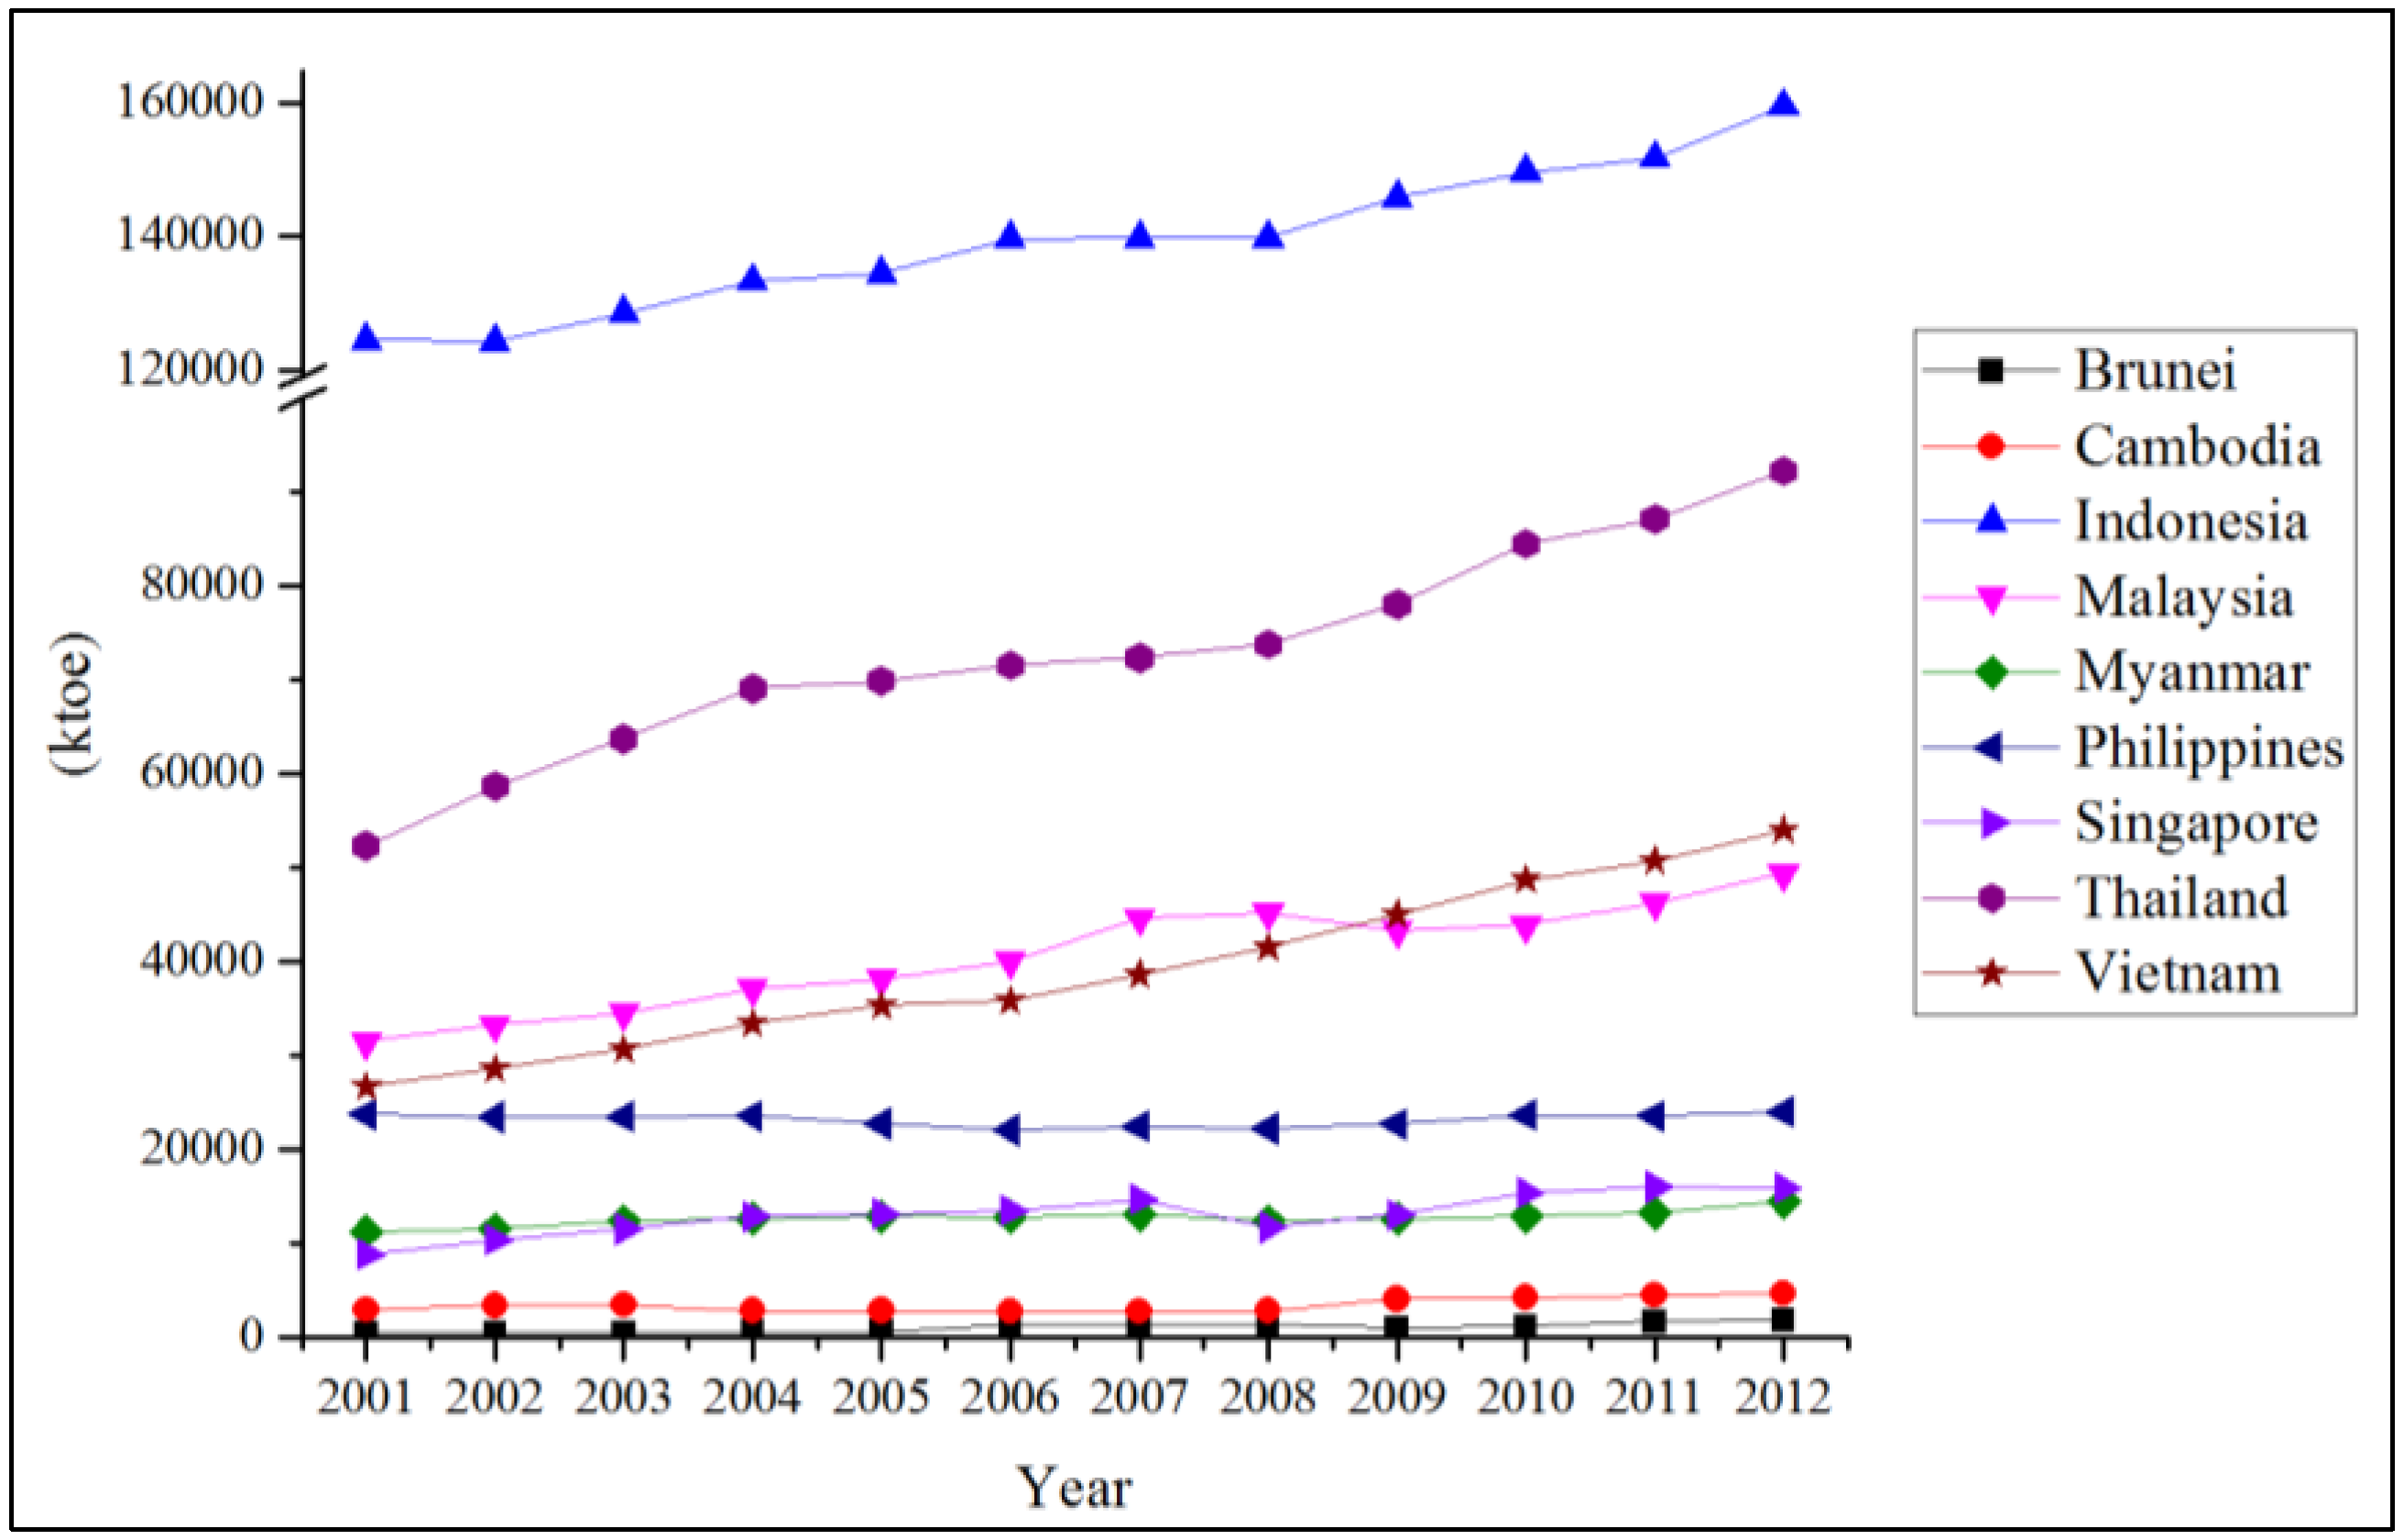
Primary energy demand of nine ASEAN member countries can be divided into three groups based on demand size: high energy demand countries (more than 100,001 kilo tons of oil equivalent (ktoe) annually) that include Indonesia and Thailand; countries with middle energy demand (20,001–100,000 ktoe per year) that include Malaysia, the Philippines, Singapore, and Vietnam; and countries with low energy demand (less than 20,000 ktoe per year) that include Brunei, Cambodia, and Myanmar. For coal, Indonesia has the highest coal demand followed by Thailand, Vietnam, Malaysia, and the Philippines. Crude oil, on the other hand, has the most shares in Thailand, Singapore, and Indonesia. It should be also noted here that the three countries are regional oil-refining countries as well. Natural gas demand is prominent in Indonesia, Malaysia, and Thailand. The gap between the three mentioned countries and the rest of the Southeast Asian countries is, on average, greater than 10,000 ktoe annually. Similarly, the difference between Indonesia, the country with the highest renewable energy demand, and the other eight countries is distinct. Brunei and Singapore are, however, ranked last in terms of renewable energy. Still, it is the comparison in terms of demand size; there are other relevant factors and dynamics to consider, e.g., the size of the population and the size of the economy, which will be addressed in later.
Nevertheless, the categorization can also be based on energy sources that can be grouped into three categories: those heavily dominated by fossil fuels, those heavily dominated by renewables, and somewhat diversified mixes. The first group consists of Brunei and Singapore, the two wealthiest countries of the region [49], since their primary energy mixes are highly fossil fuel-concentrated; Brunei is dominated by natural gas while Singapore relies mainly on crude oil. The second group includes Cambodia and Myanmar, the only two low-income countries of the region [50], because they are both more than two-thirds renewable energy-concentrated. The last group comprises Indonesia, Malaysia, the Philippines, Thailand, and Vietnam, whose mixes are more diversified compared to the other four countries.
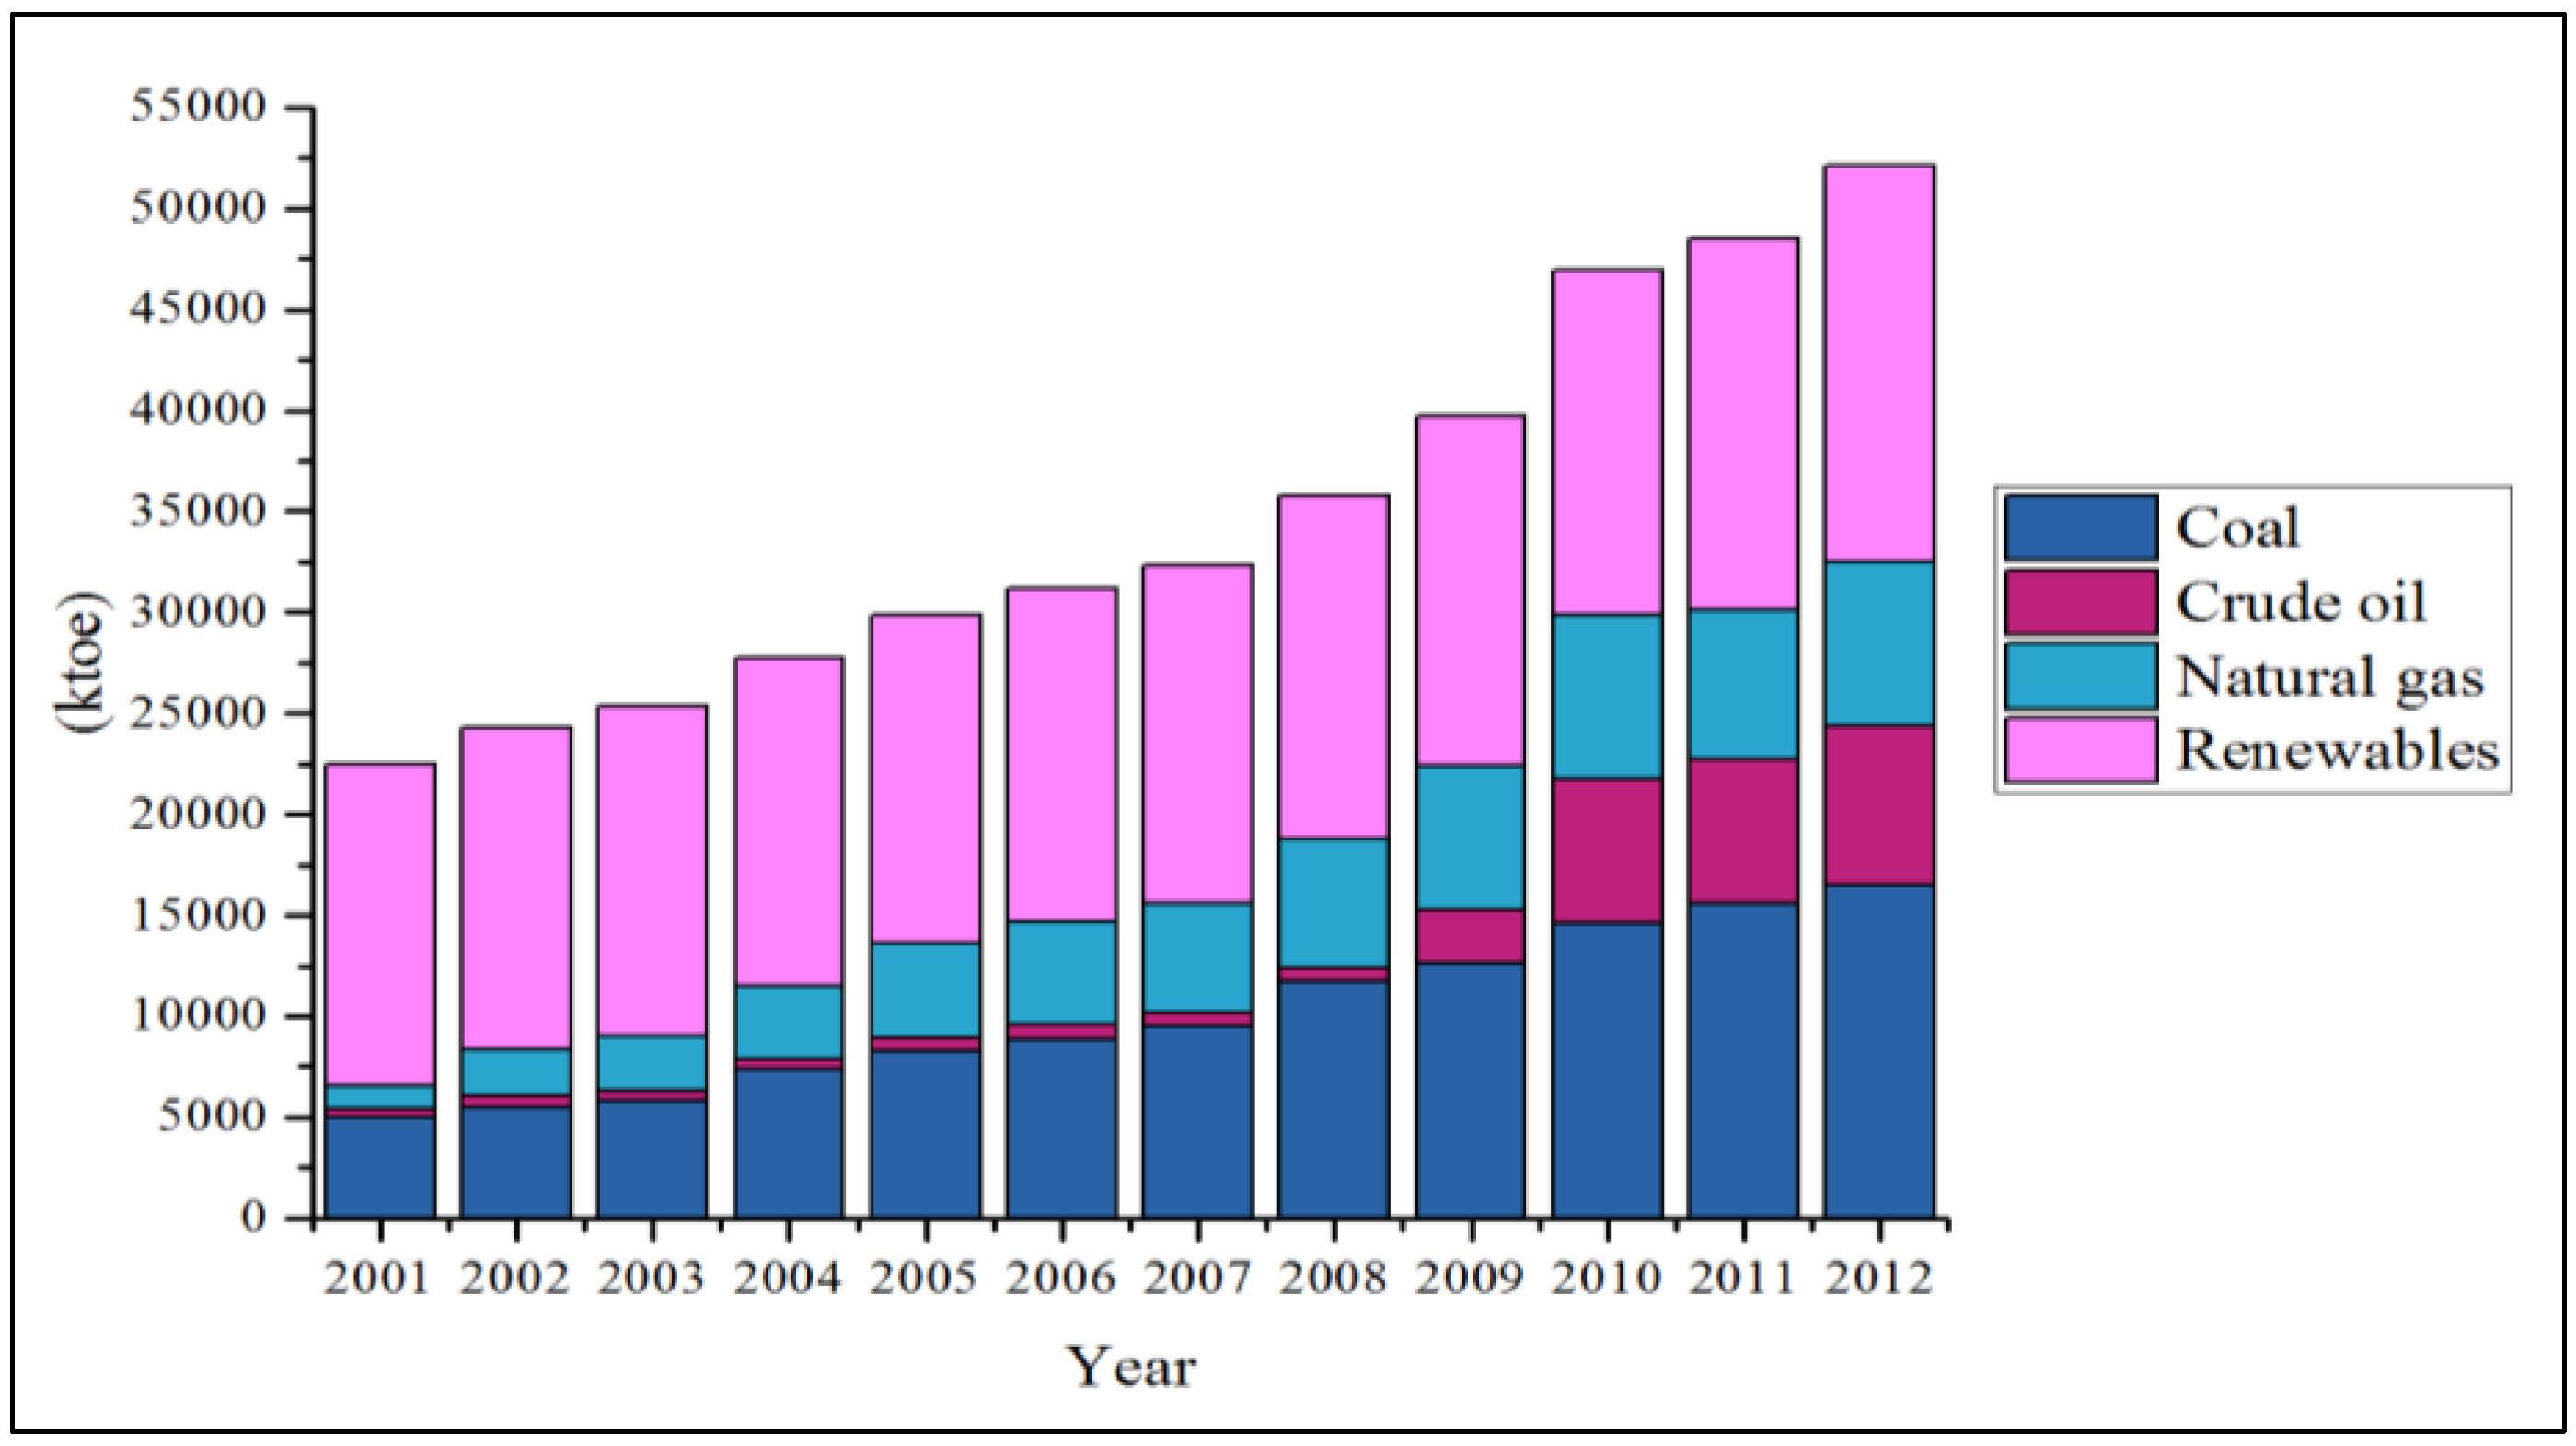
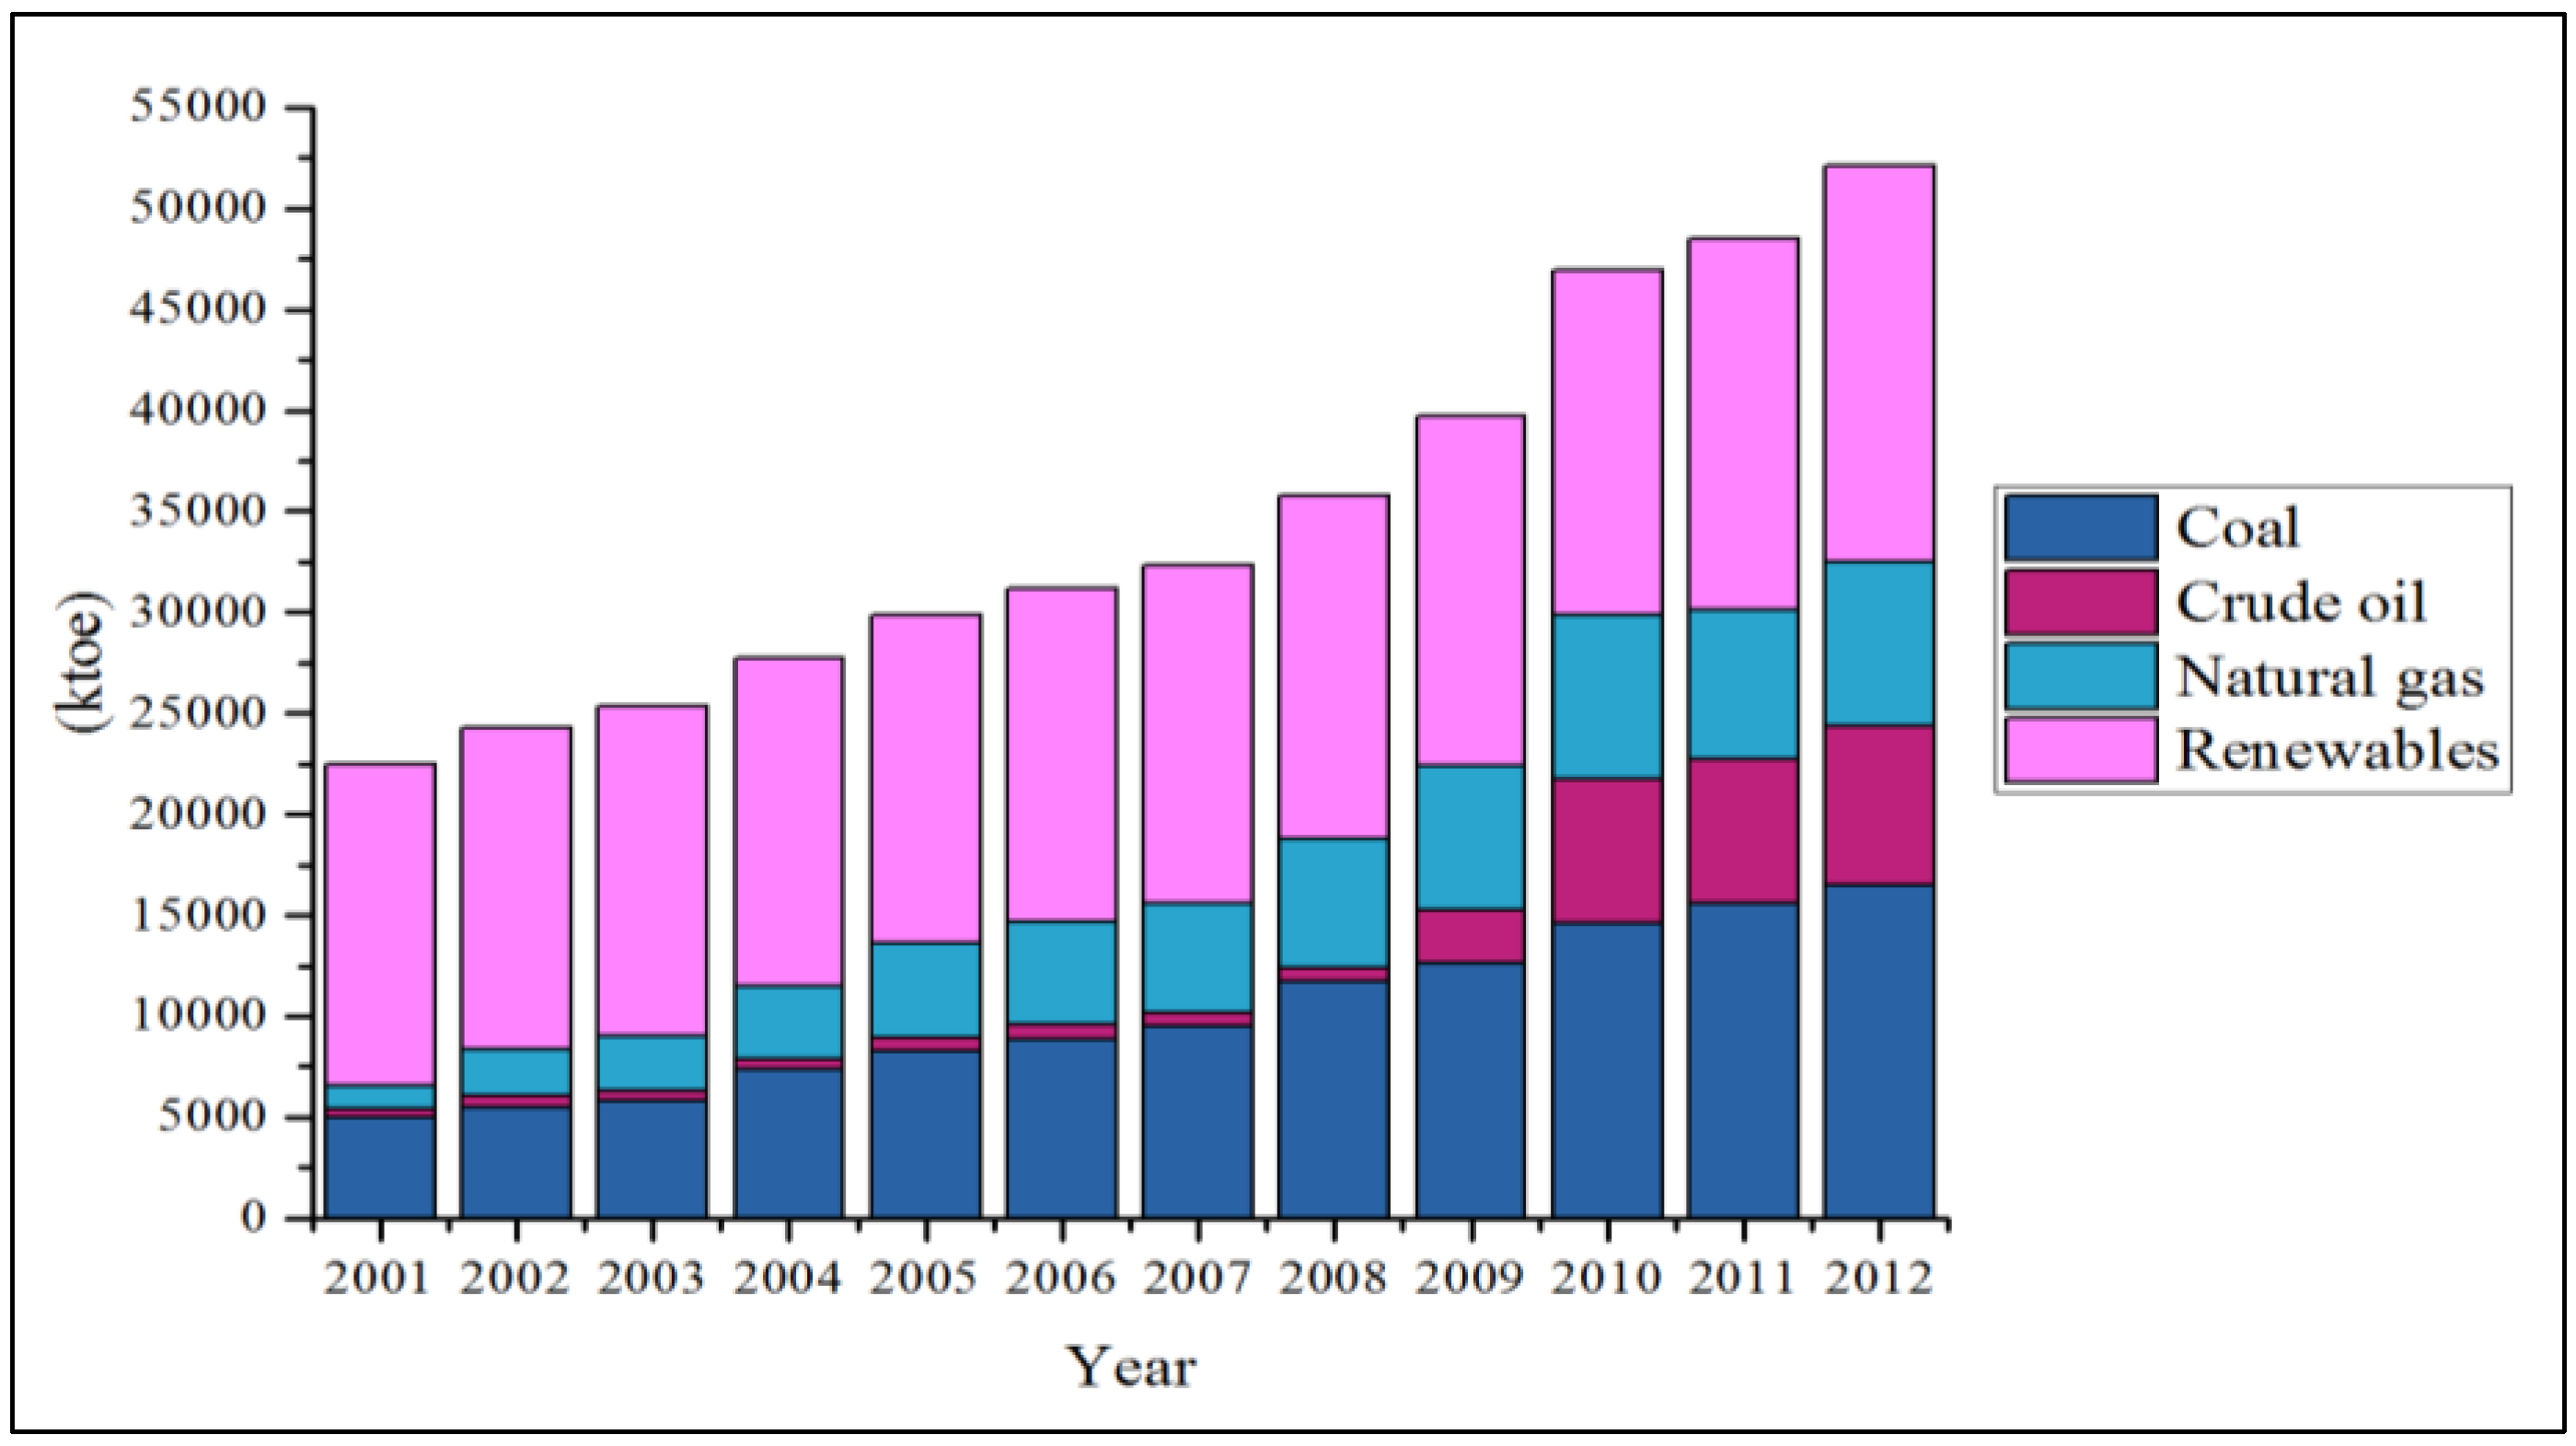
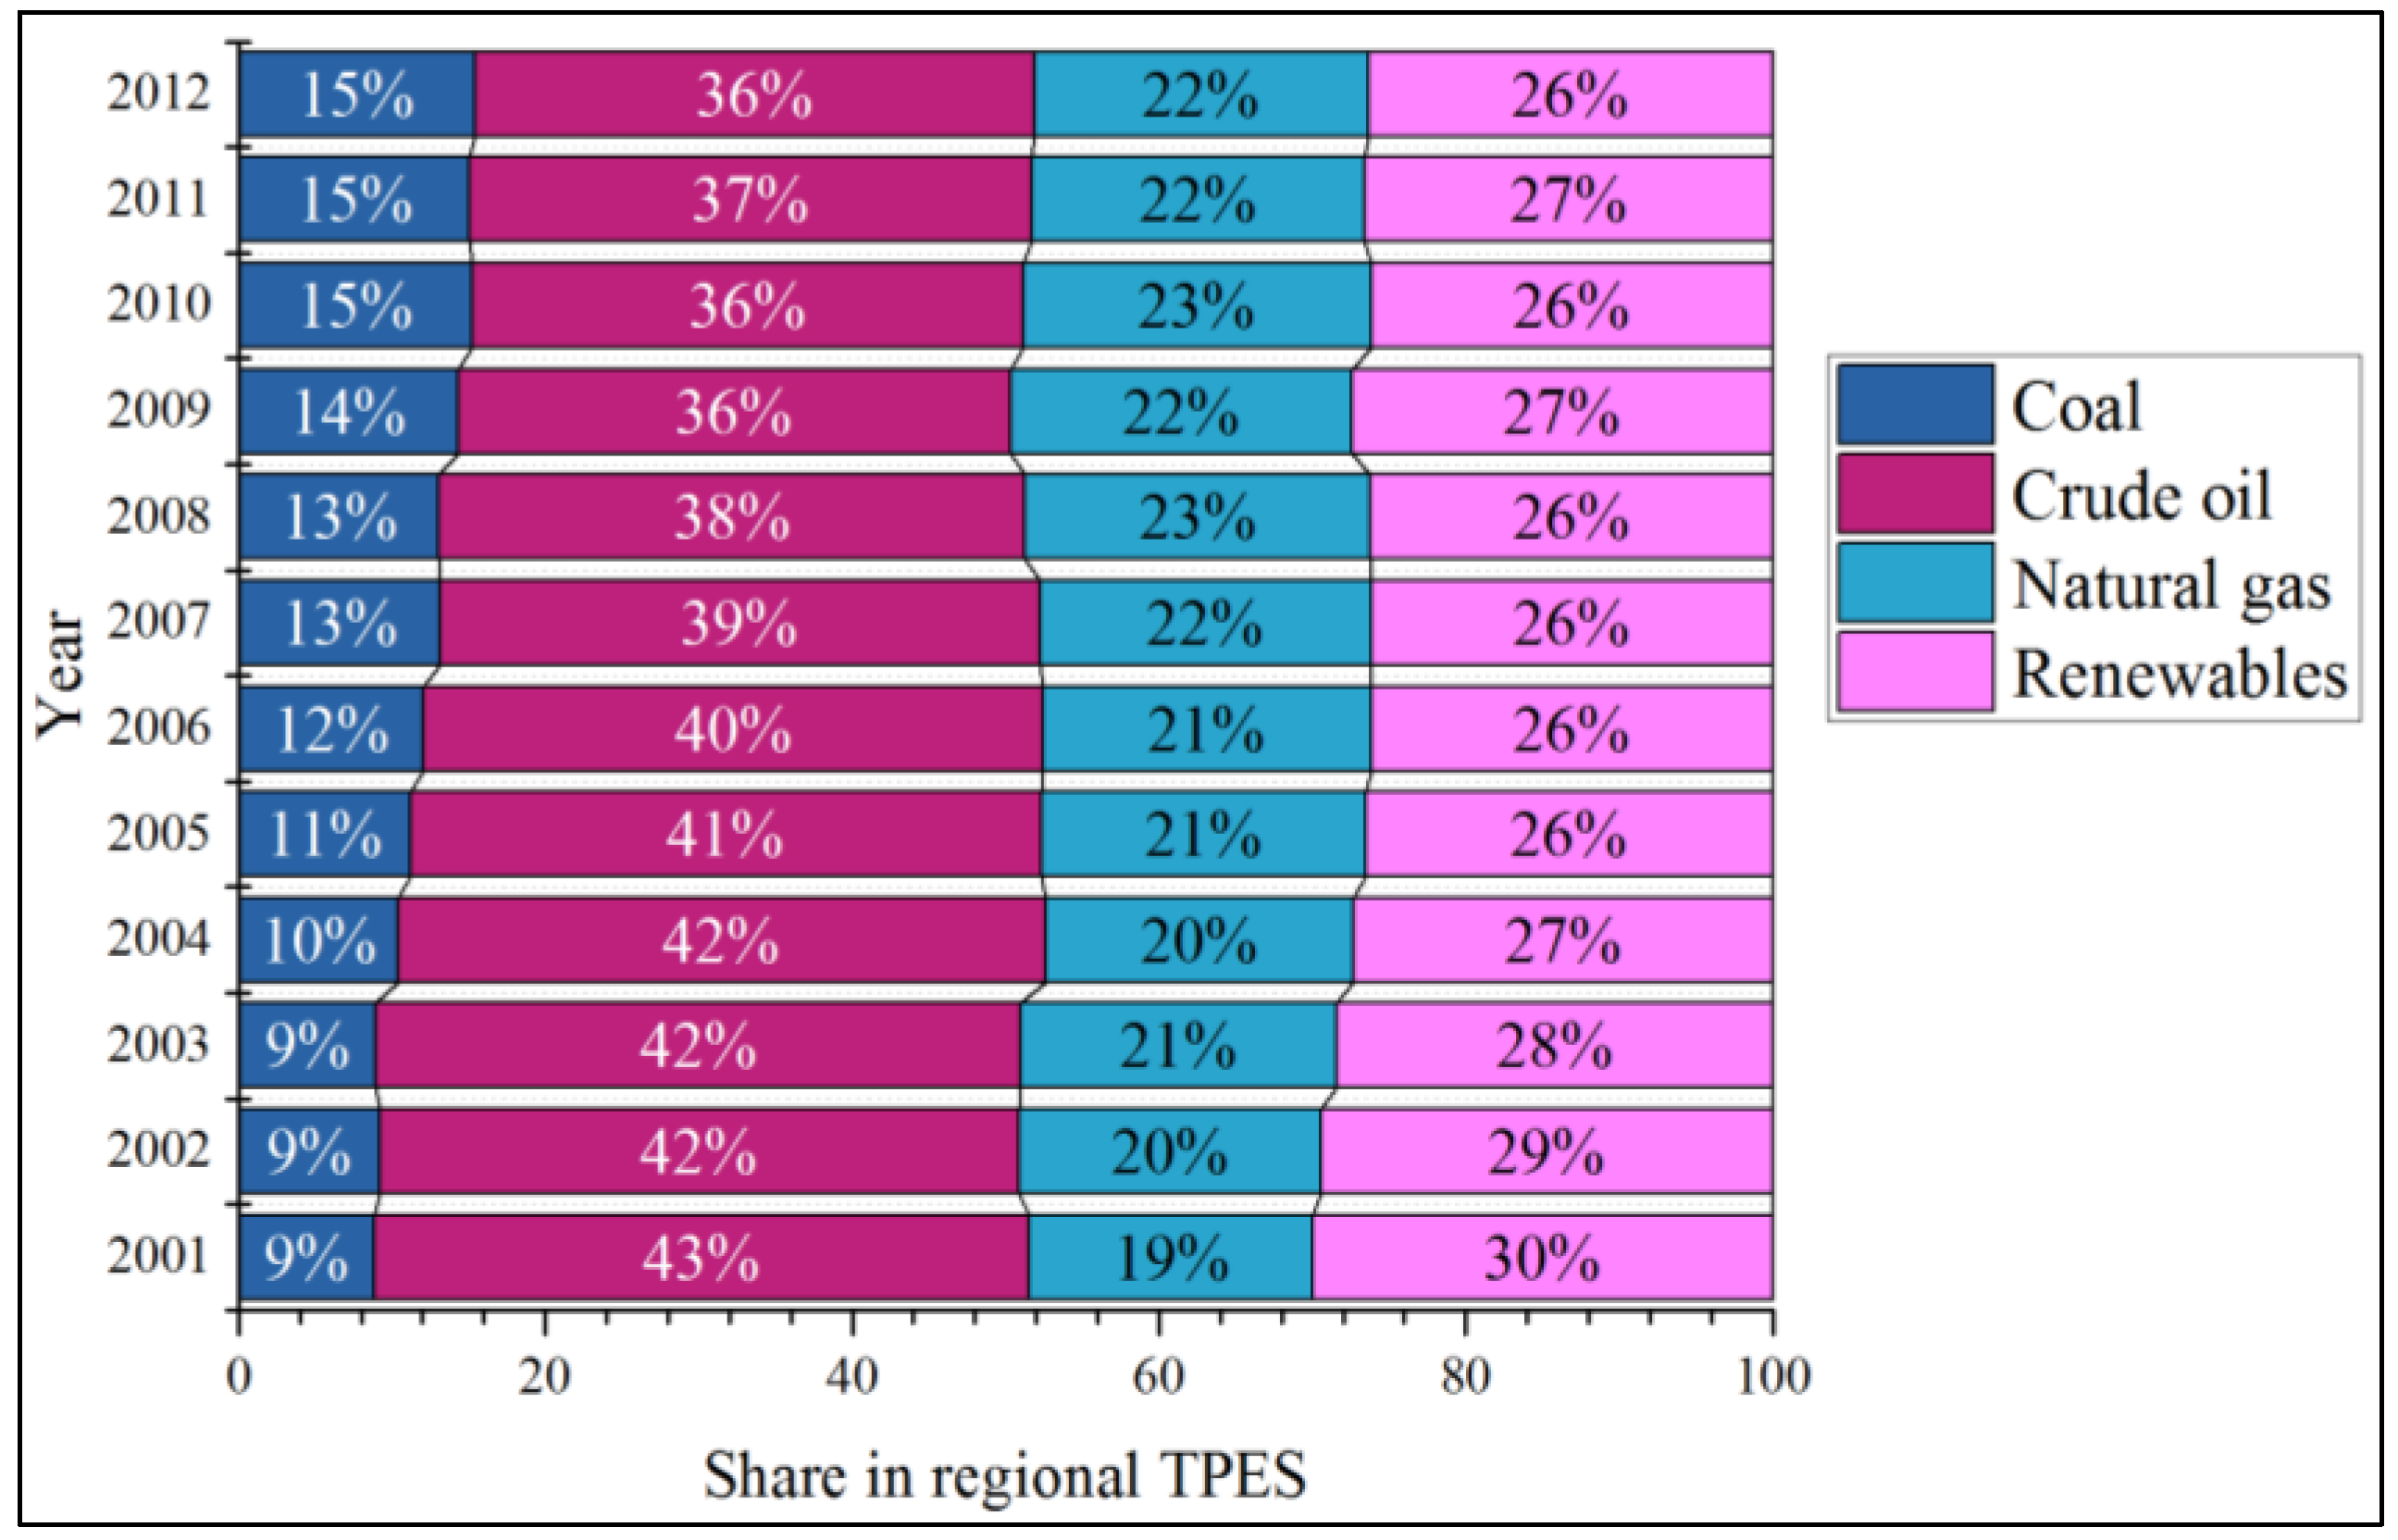
Hydrocarbons play a significant role in the ASEAN energy mix. Figure 10 shows the average share of regional primary energy supply between 2001 and 2012. The trend shows the growing shares of coal demand and the shrinking shares of crude oil and renewables. On one hand, coal demand has continued to increase in most ASEAN countries, particularly Indonesia, Malaysia, the Philippines, Thailand, and Vietnam. On the other hand, the share of crude oil in the regional energy mix has been declining despite the fact that it still covers more than one-third of the regional mix.
Figure 10. ASEAN primary energy supply between 2001 and 2012 (by source).
Socsci 04 01269 g010

3.1.2. Electricity Generation by Source

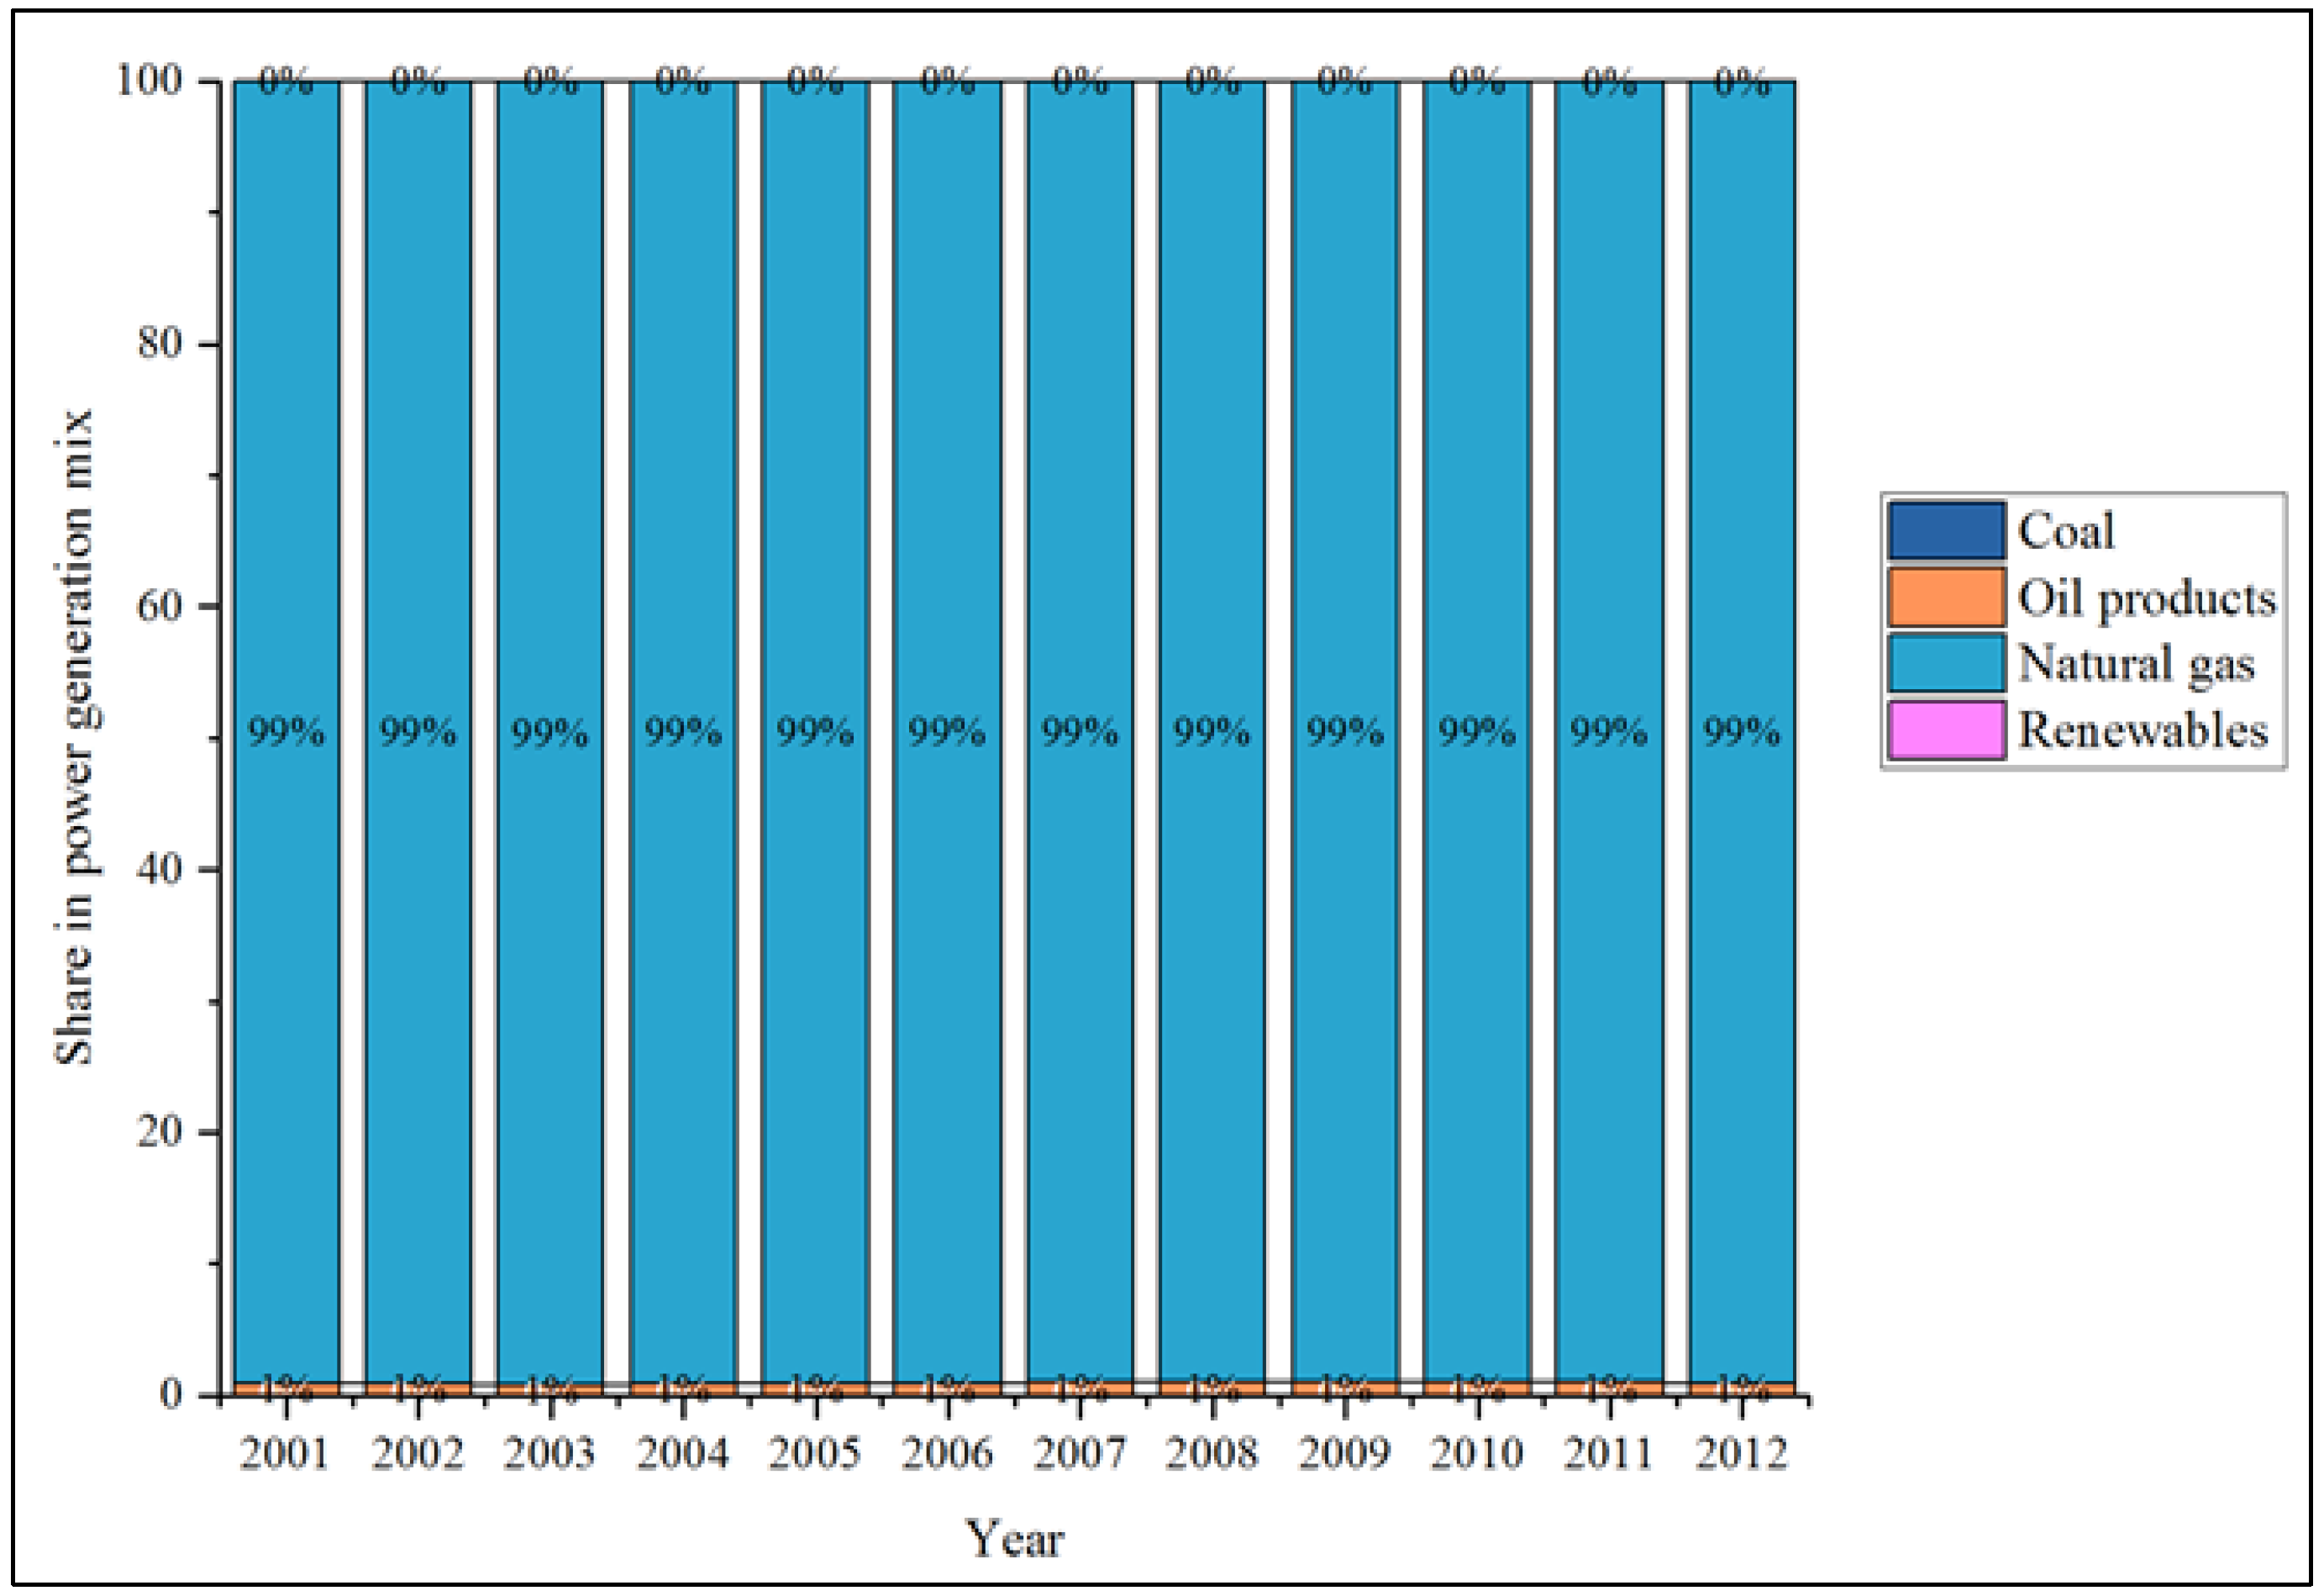
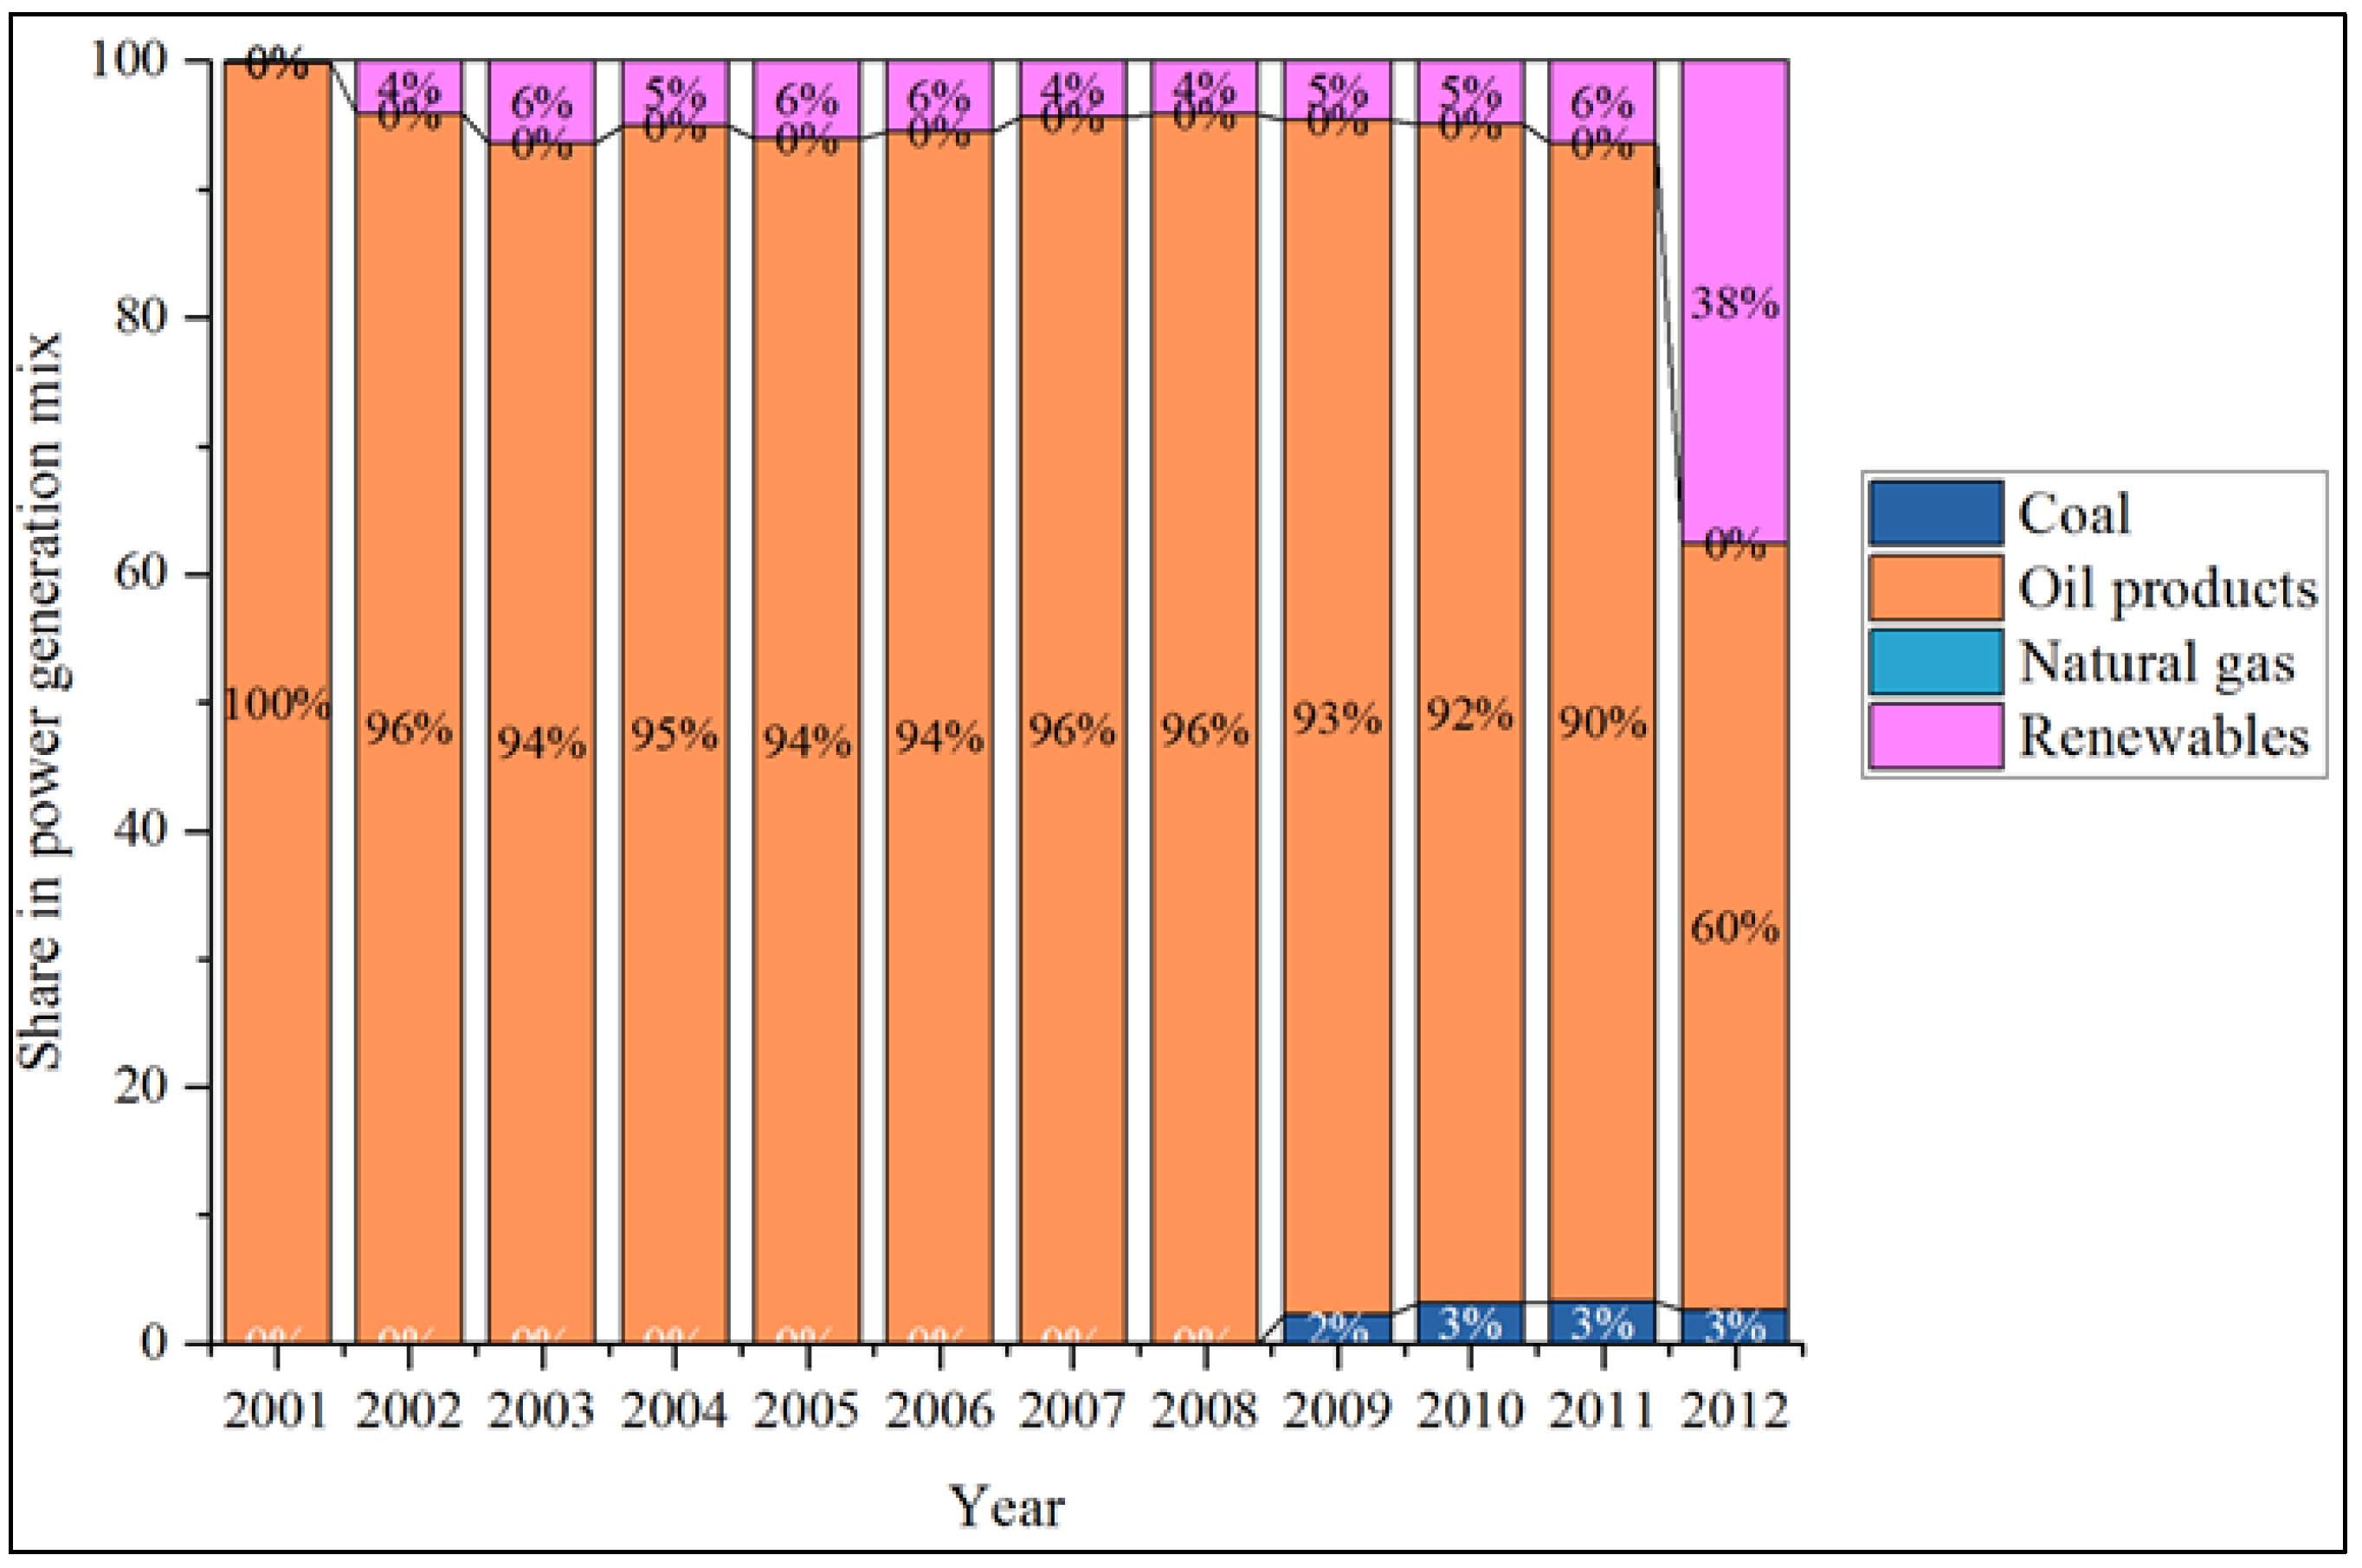
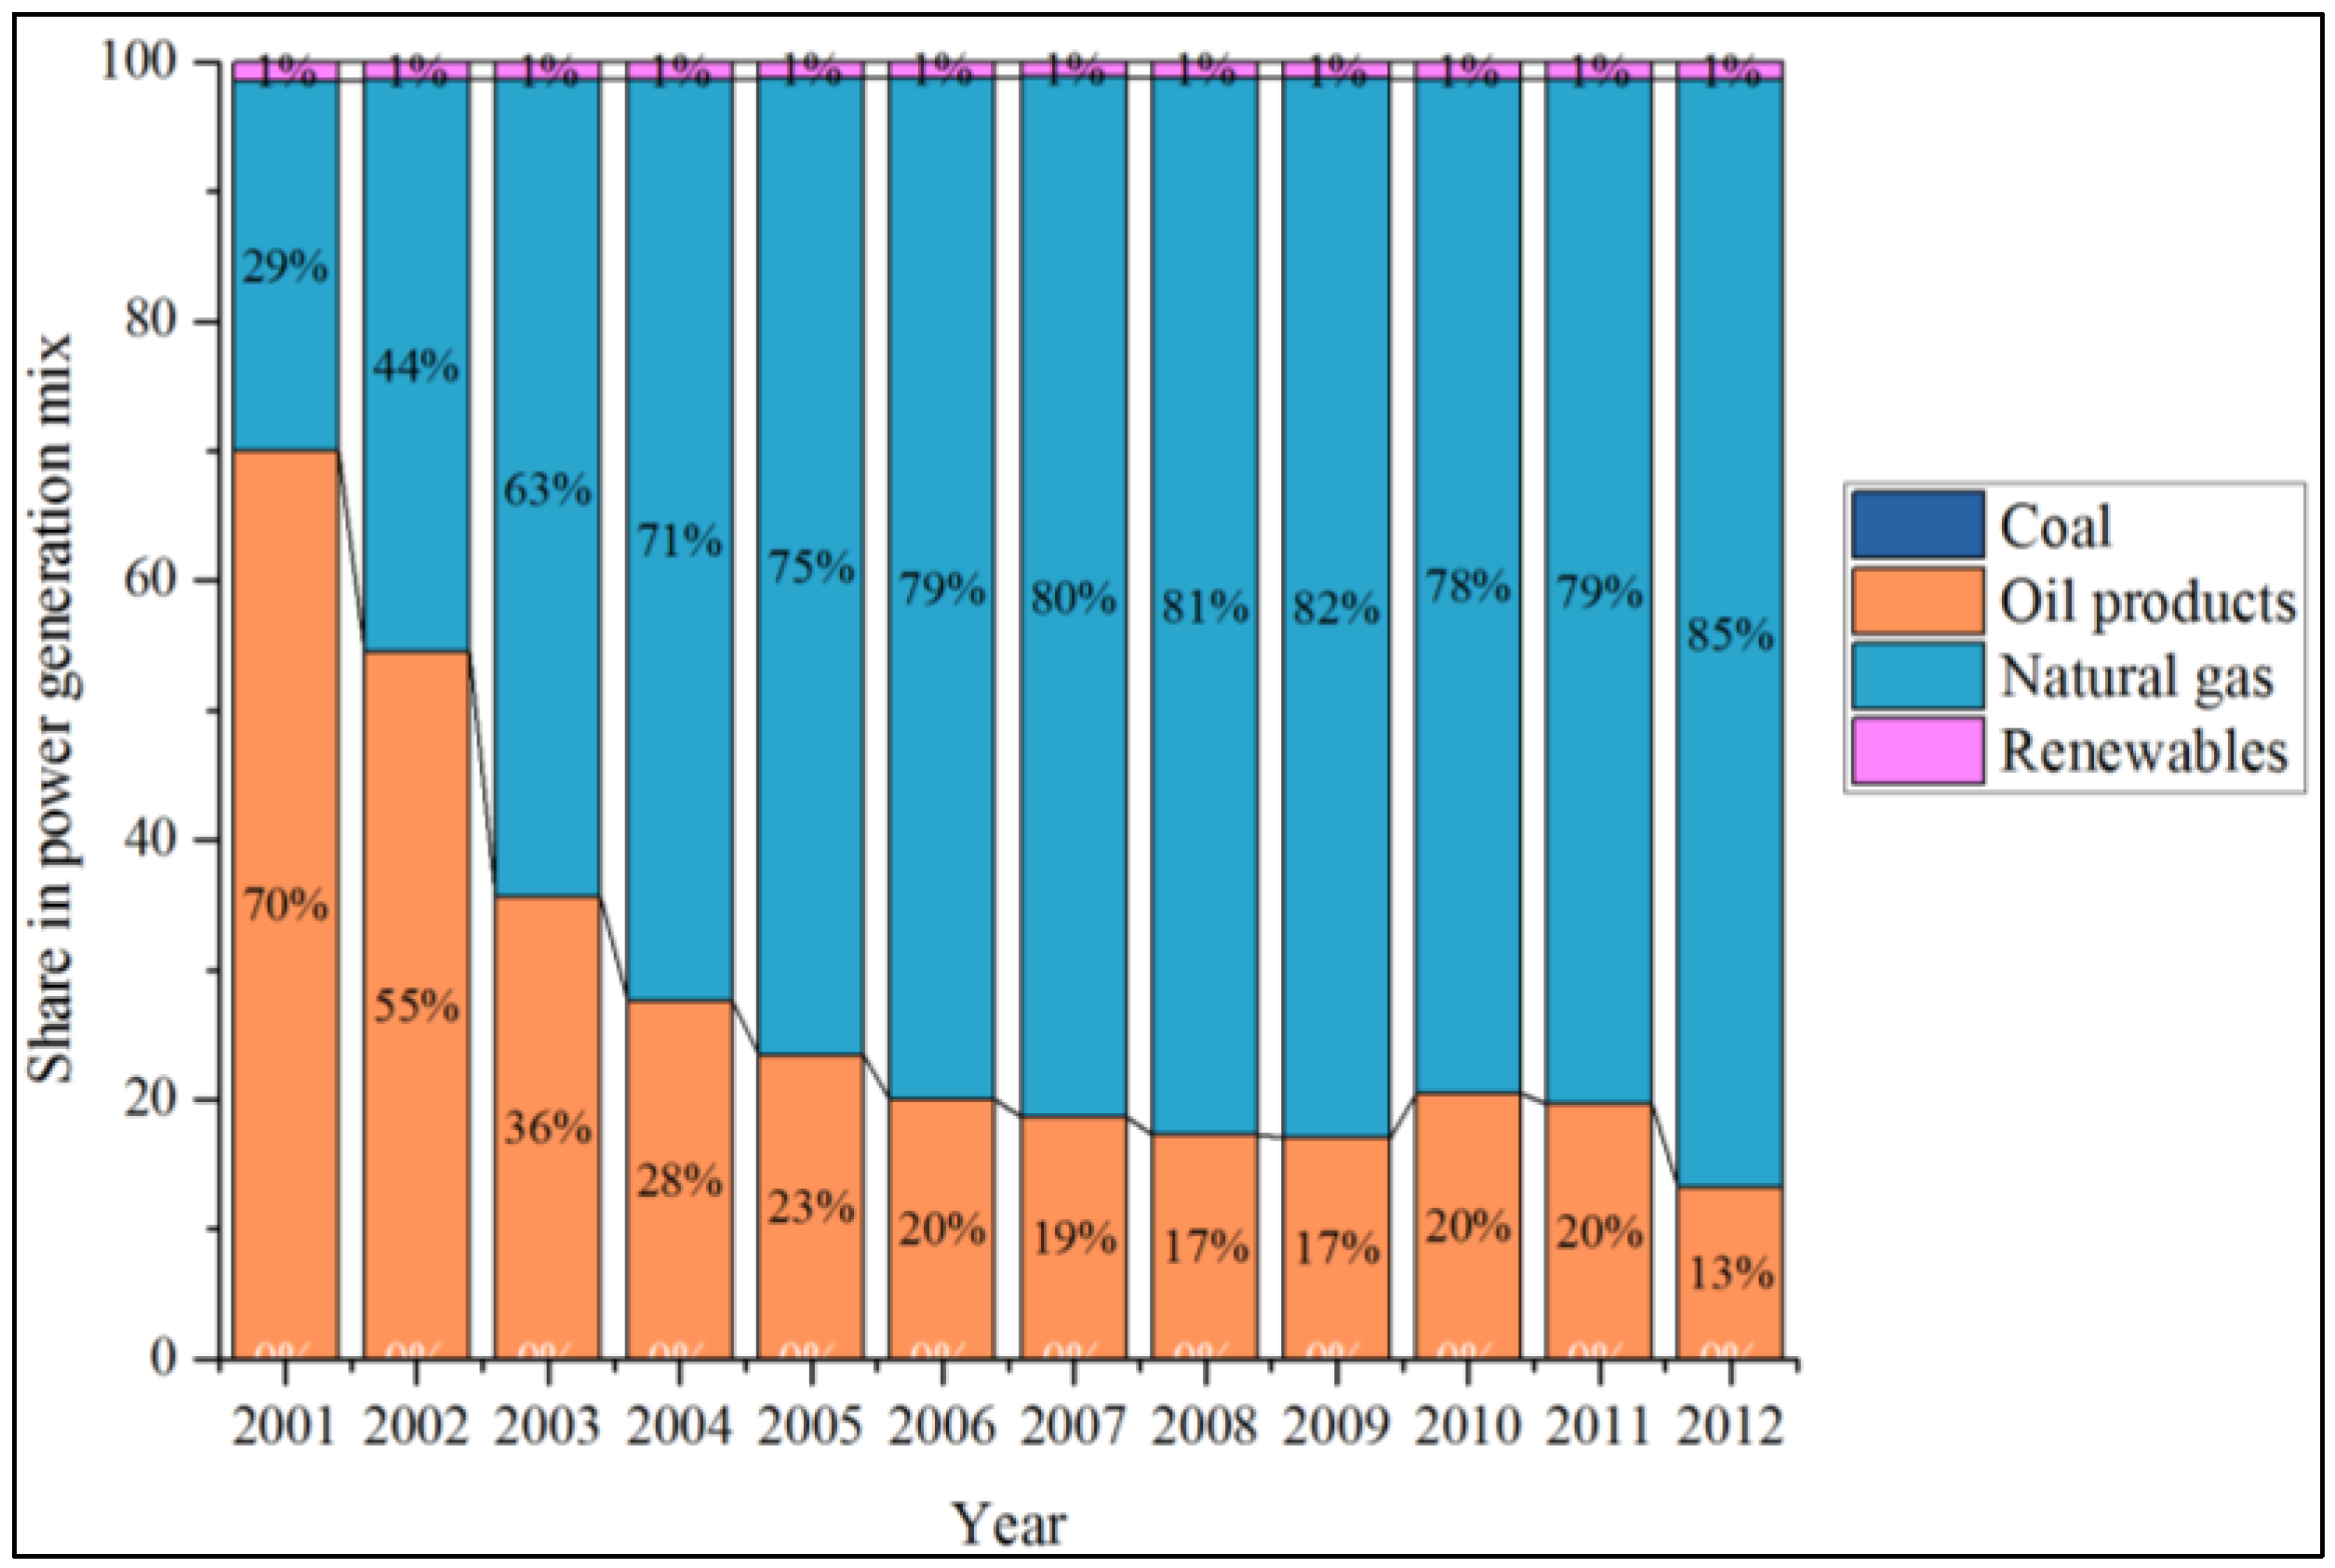
Figure 11 and Figure 12 present the electricity generation by source of Brunei and Cambodia from the year 2001 to 2012. While 99% of Brunei’s electricity is generated by natural gas, the majority of Cambodia’s power generation is from oil. As a part of the power sector development, Cambodia has launched several hydroelectric power plants to improve its generation capacity [51], which resulted in the steep rise of renewable shares in 2012. Even though the country began to generate electricity from coal in 2009, its share in the power generation mix is relatively small compared to other sources.
Figure 11. Brunei: power generation mix.
Socsci 04 01269 g011
Figure 12. Cambodia: power generation mix.
Socsci 04 01269 g012
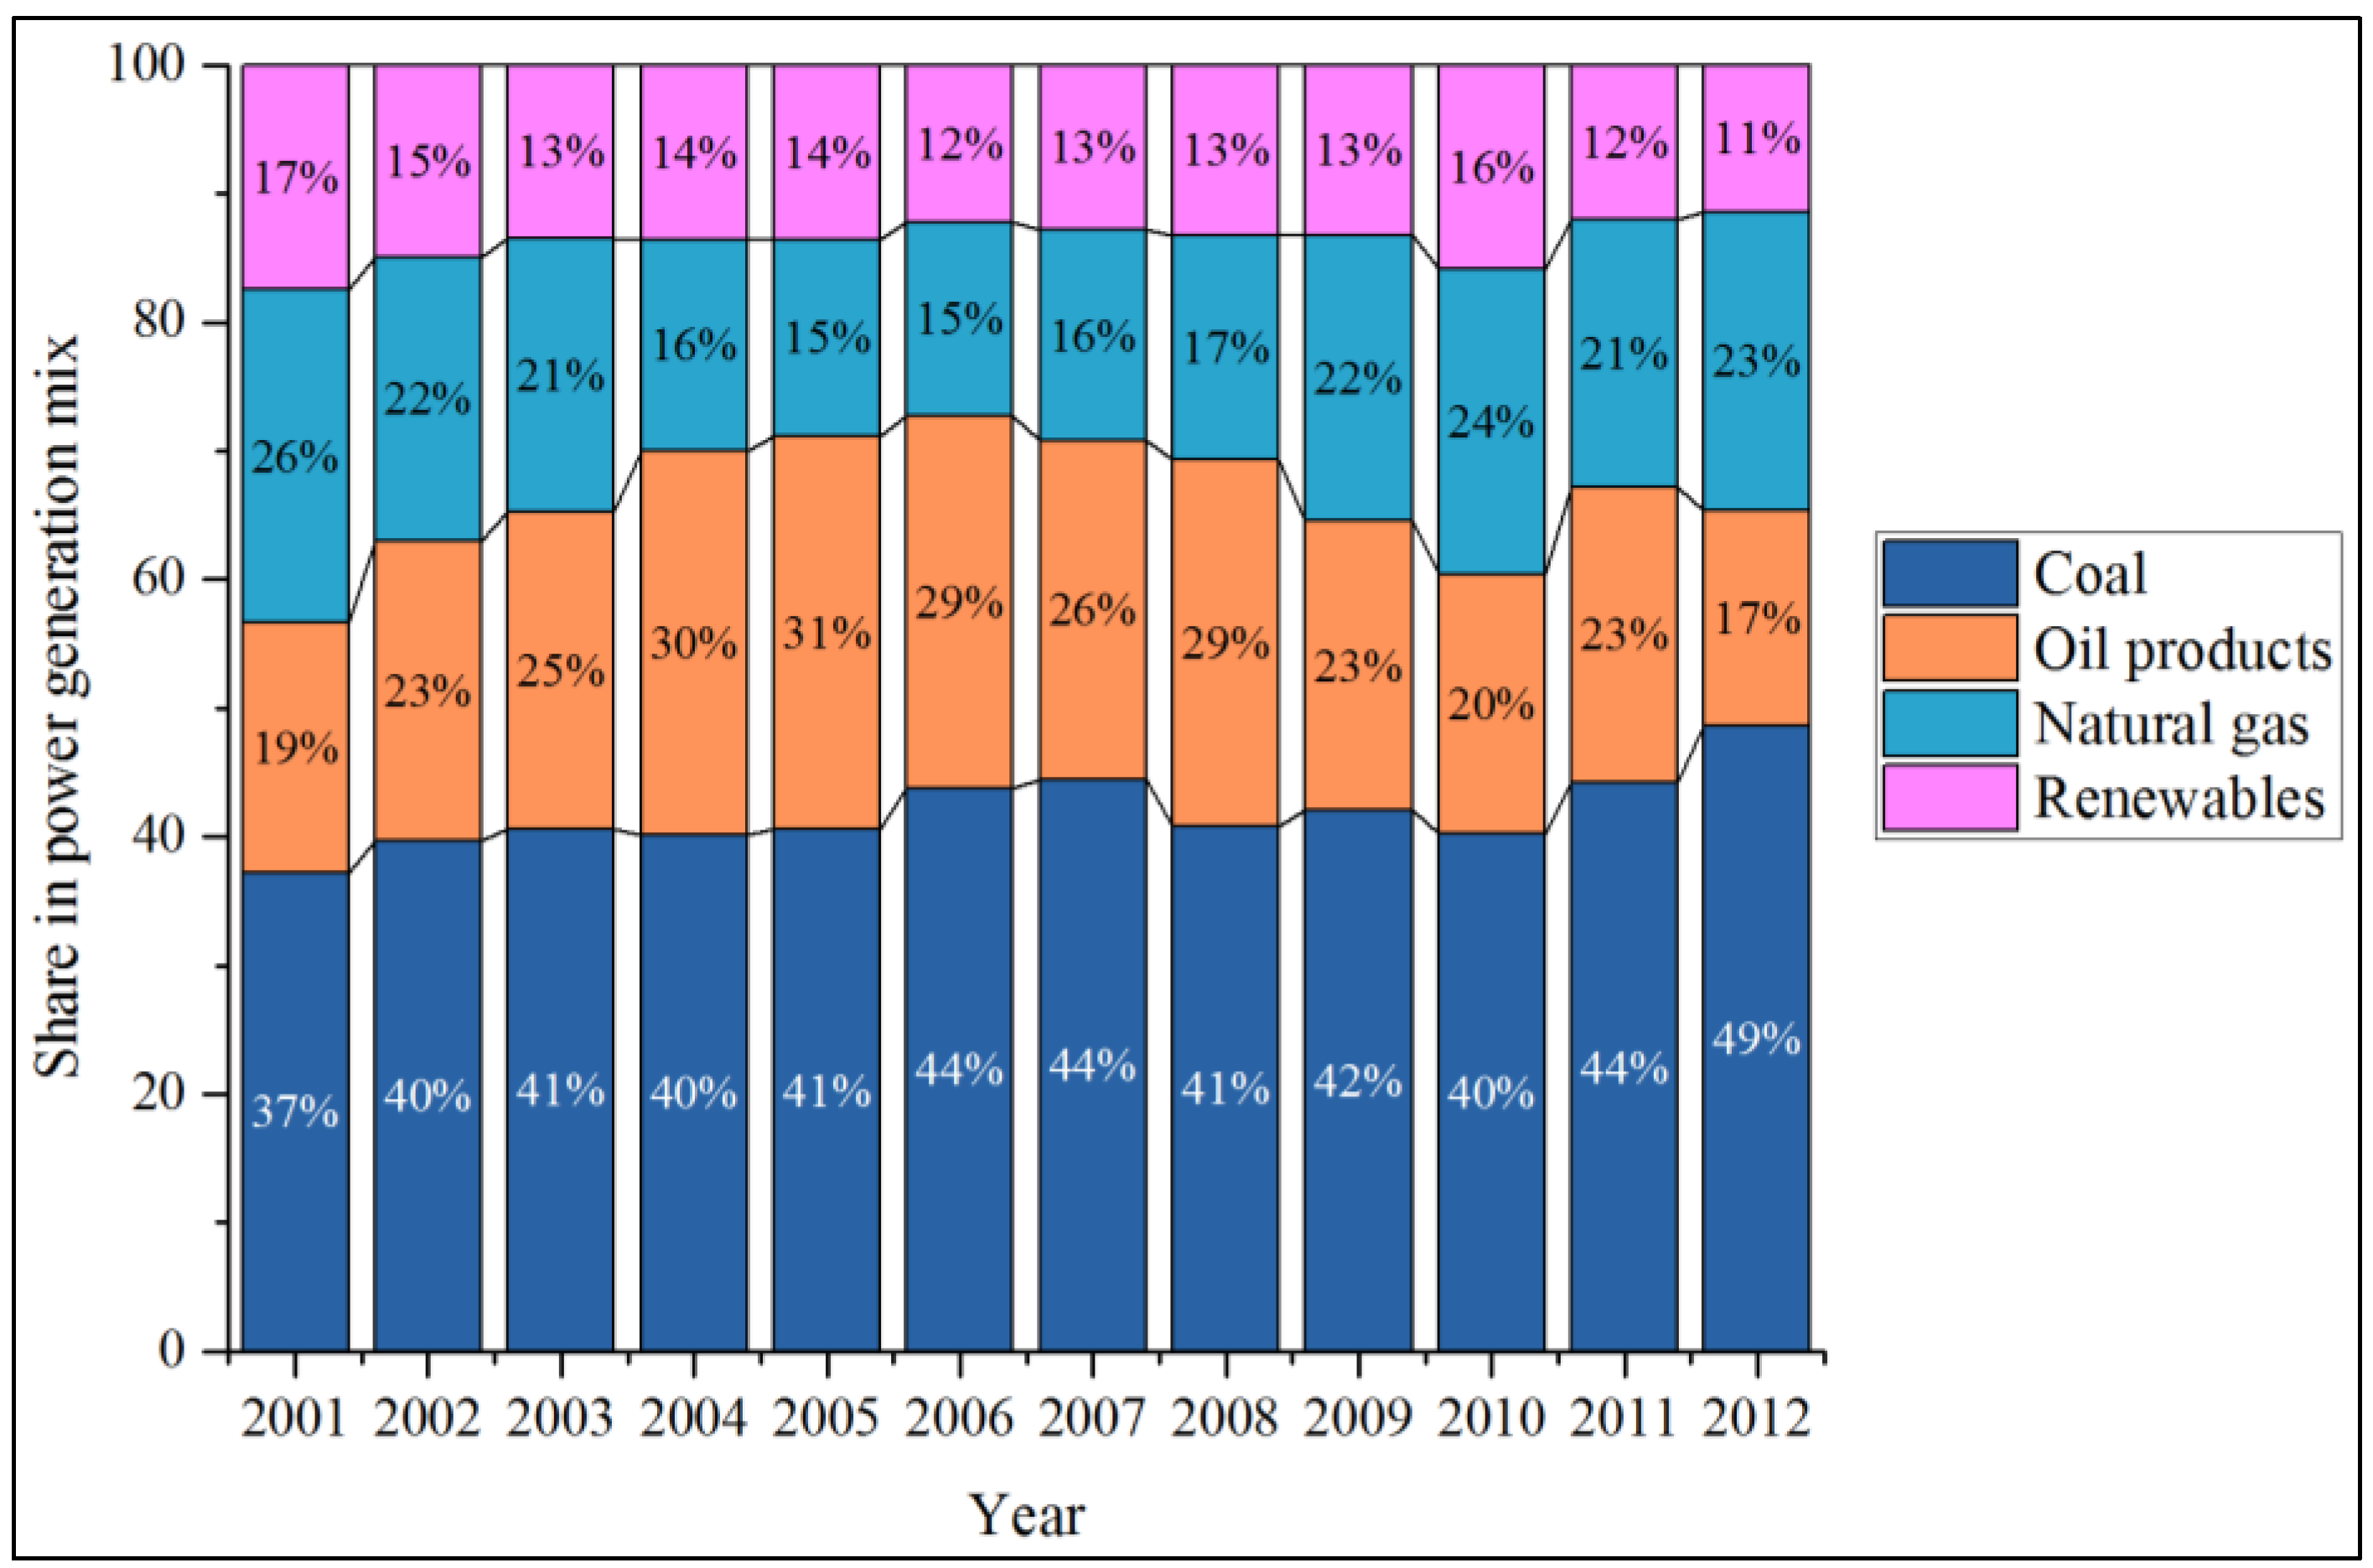
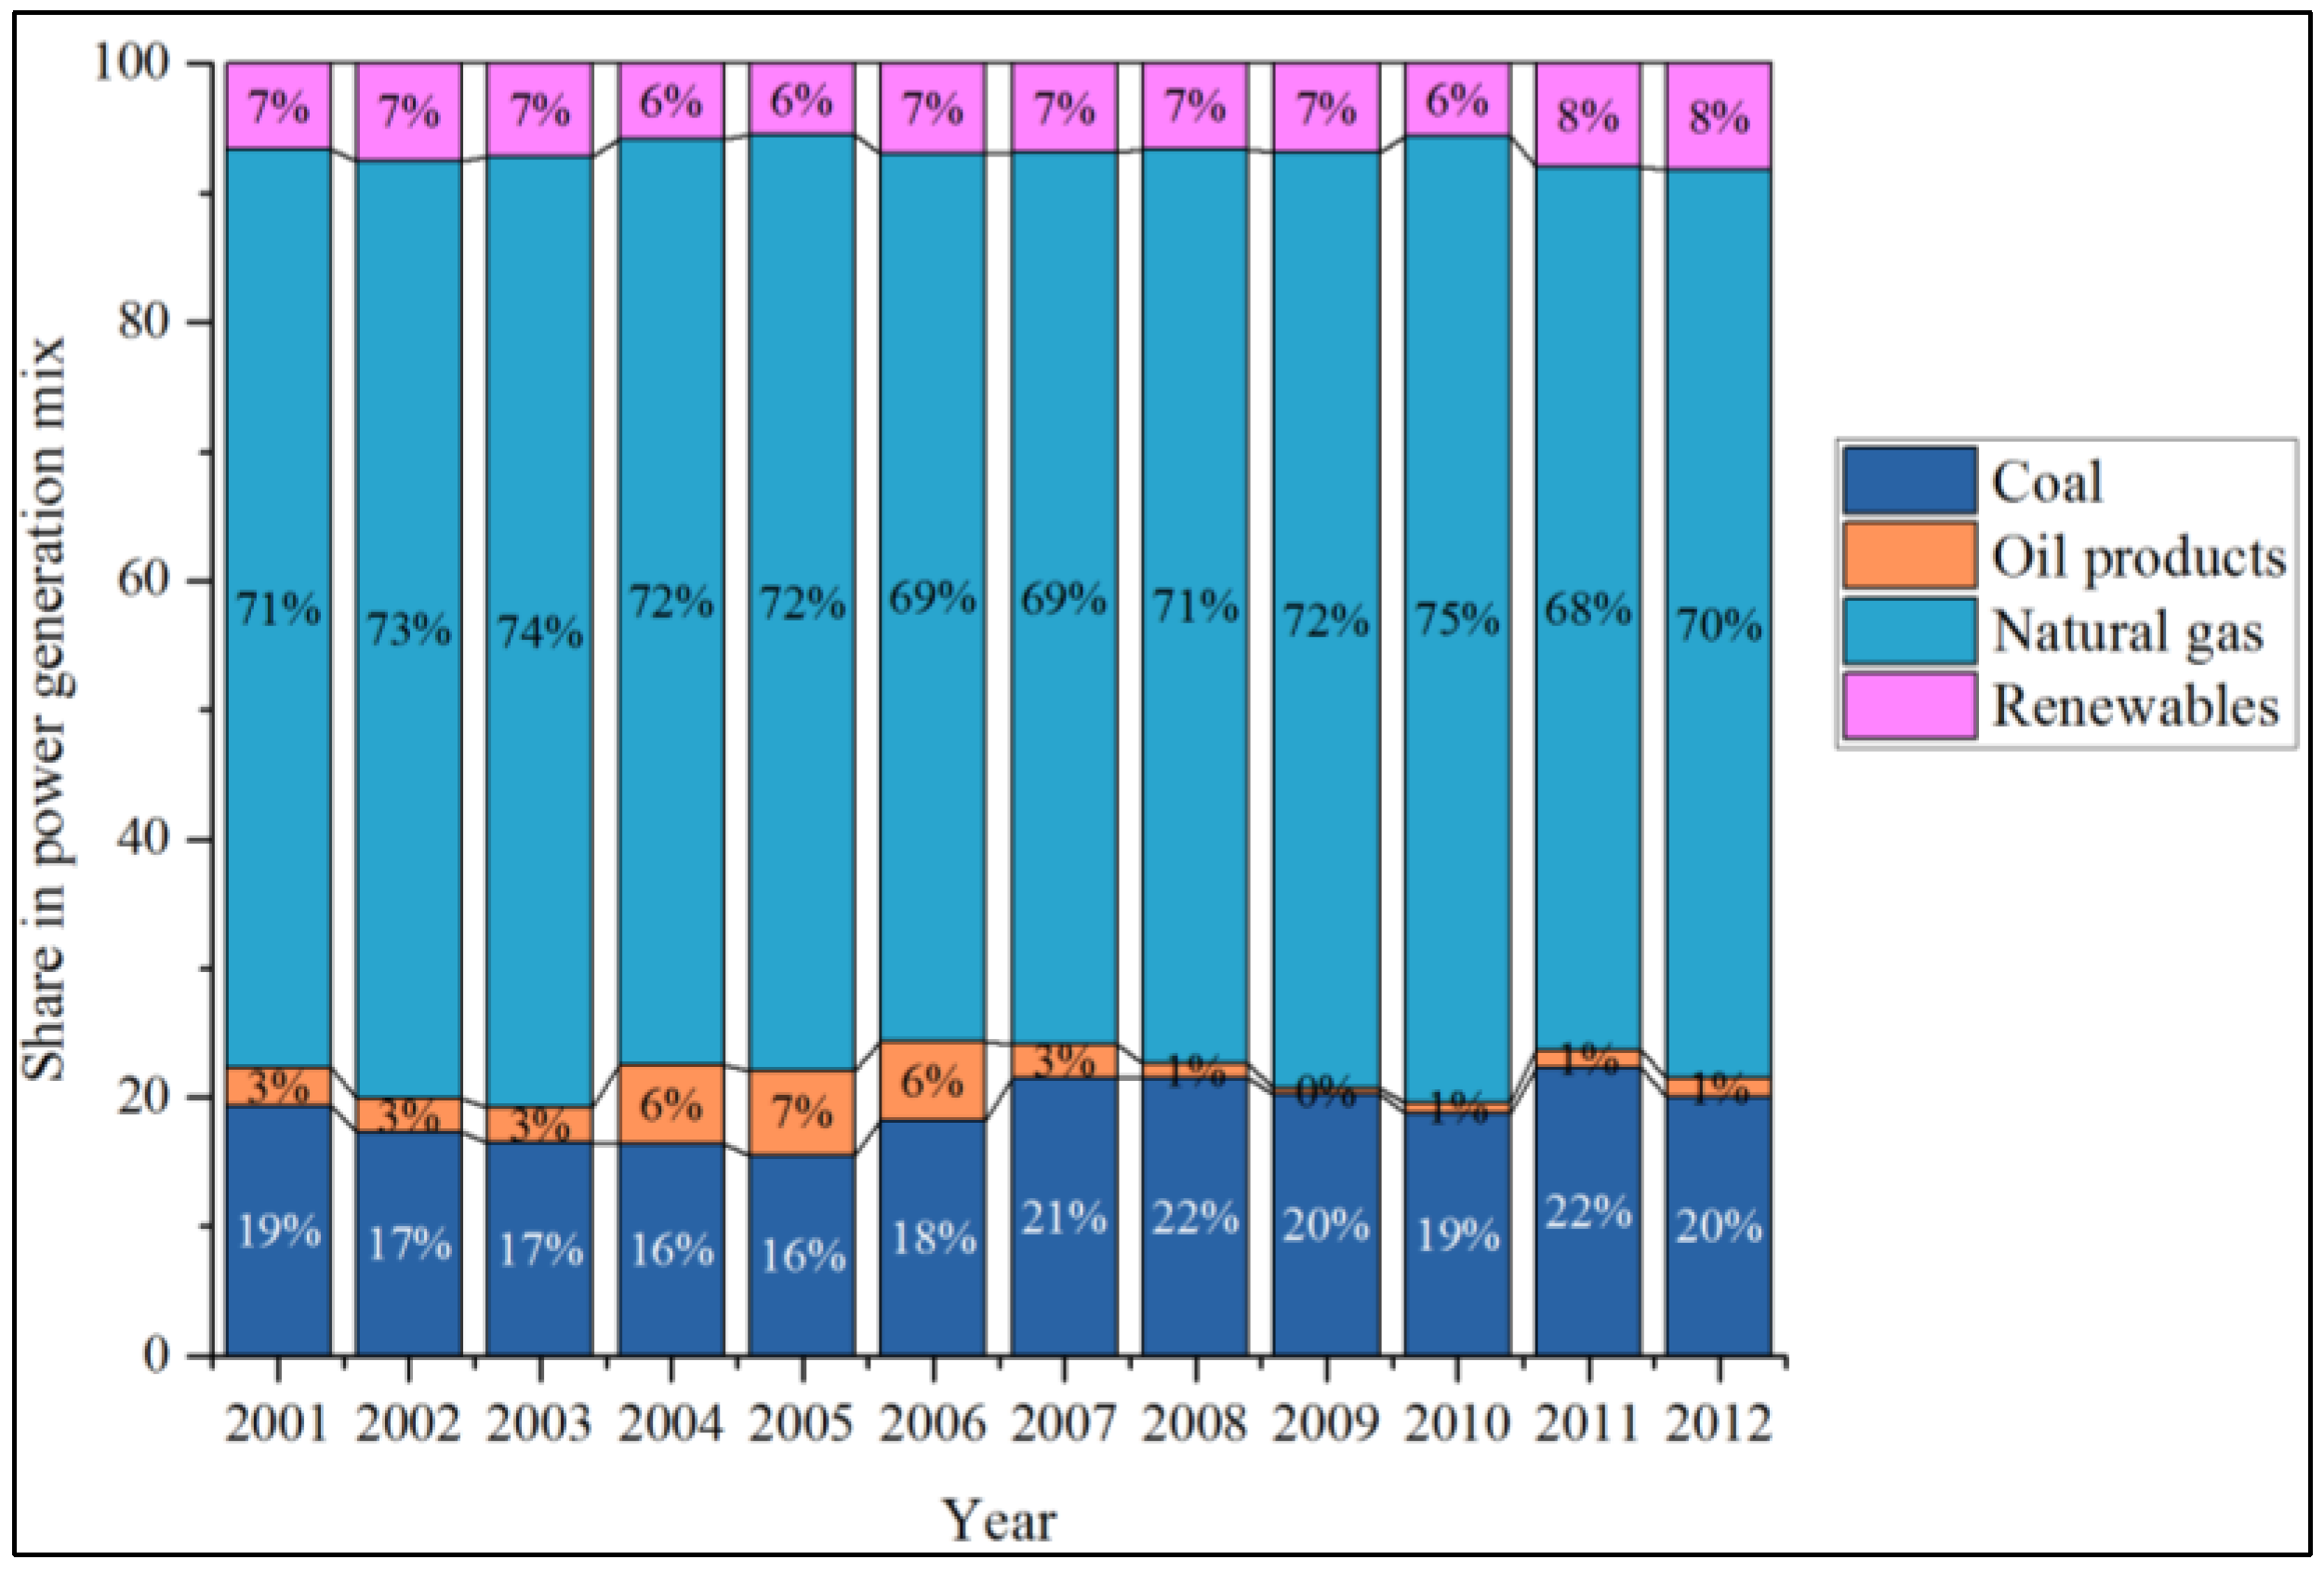
Referring to Figure 13, coal has gradually increased and become a main source of Indonesian electricity generation. In addition to coal, natural gas and oil have somewhat equal shares in contributing to the country’s electricity. Malaysia, comparably, tripled its share of coal in power generation from 12% in 2001 to 42% in 2012 (see Figure 14). Coal and natural gas is thus the primary source of Malaysia’s power generation. Renewable energy, particularly hydroelectricity, accounts for less than 7% of both Indonesian and Malaysian electricity mixes.
Figure 13. Indonesia: power generation mix.
Socsci 04 01269 g013
Figure 14. Malaysia: power generation mix.
Socsci 04 01269 g014
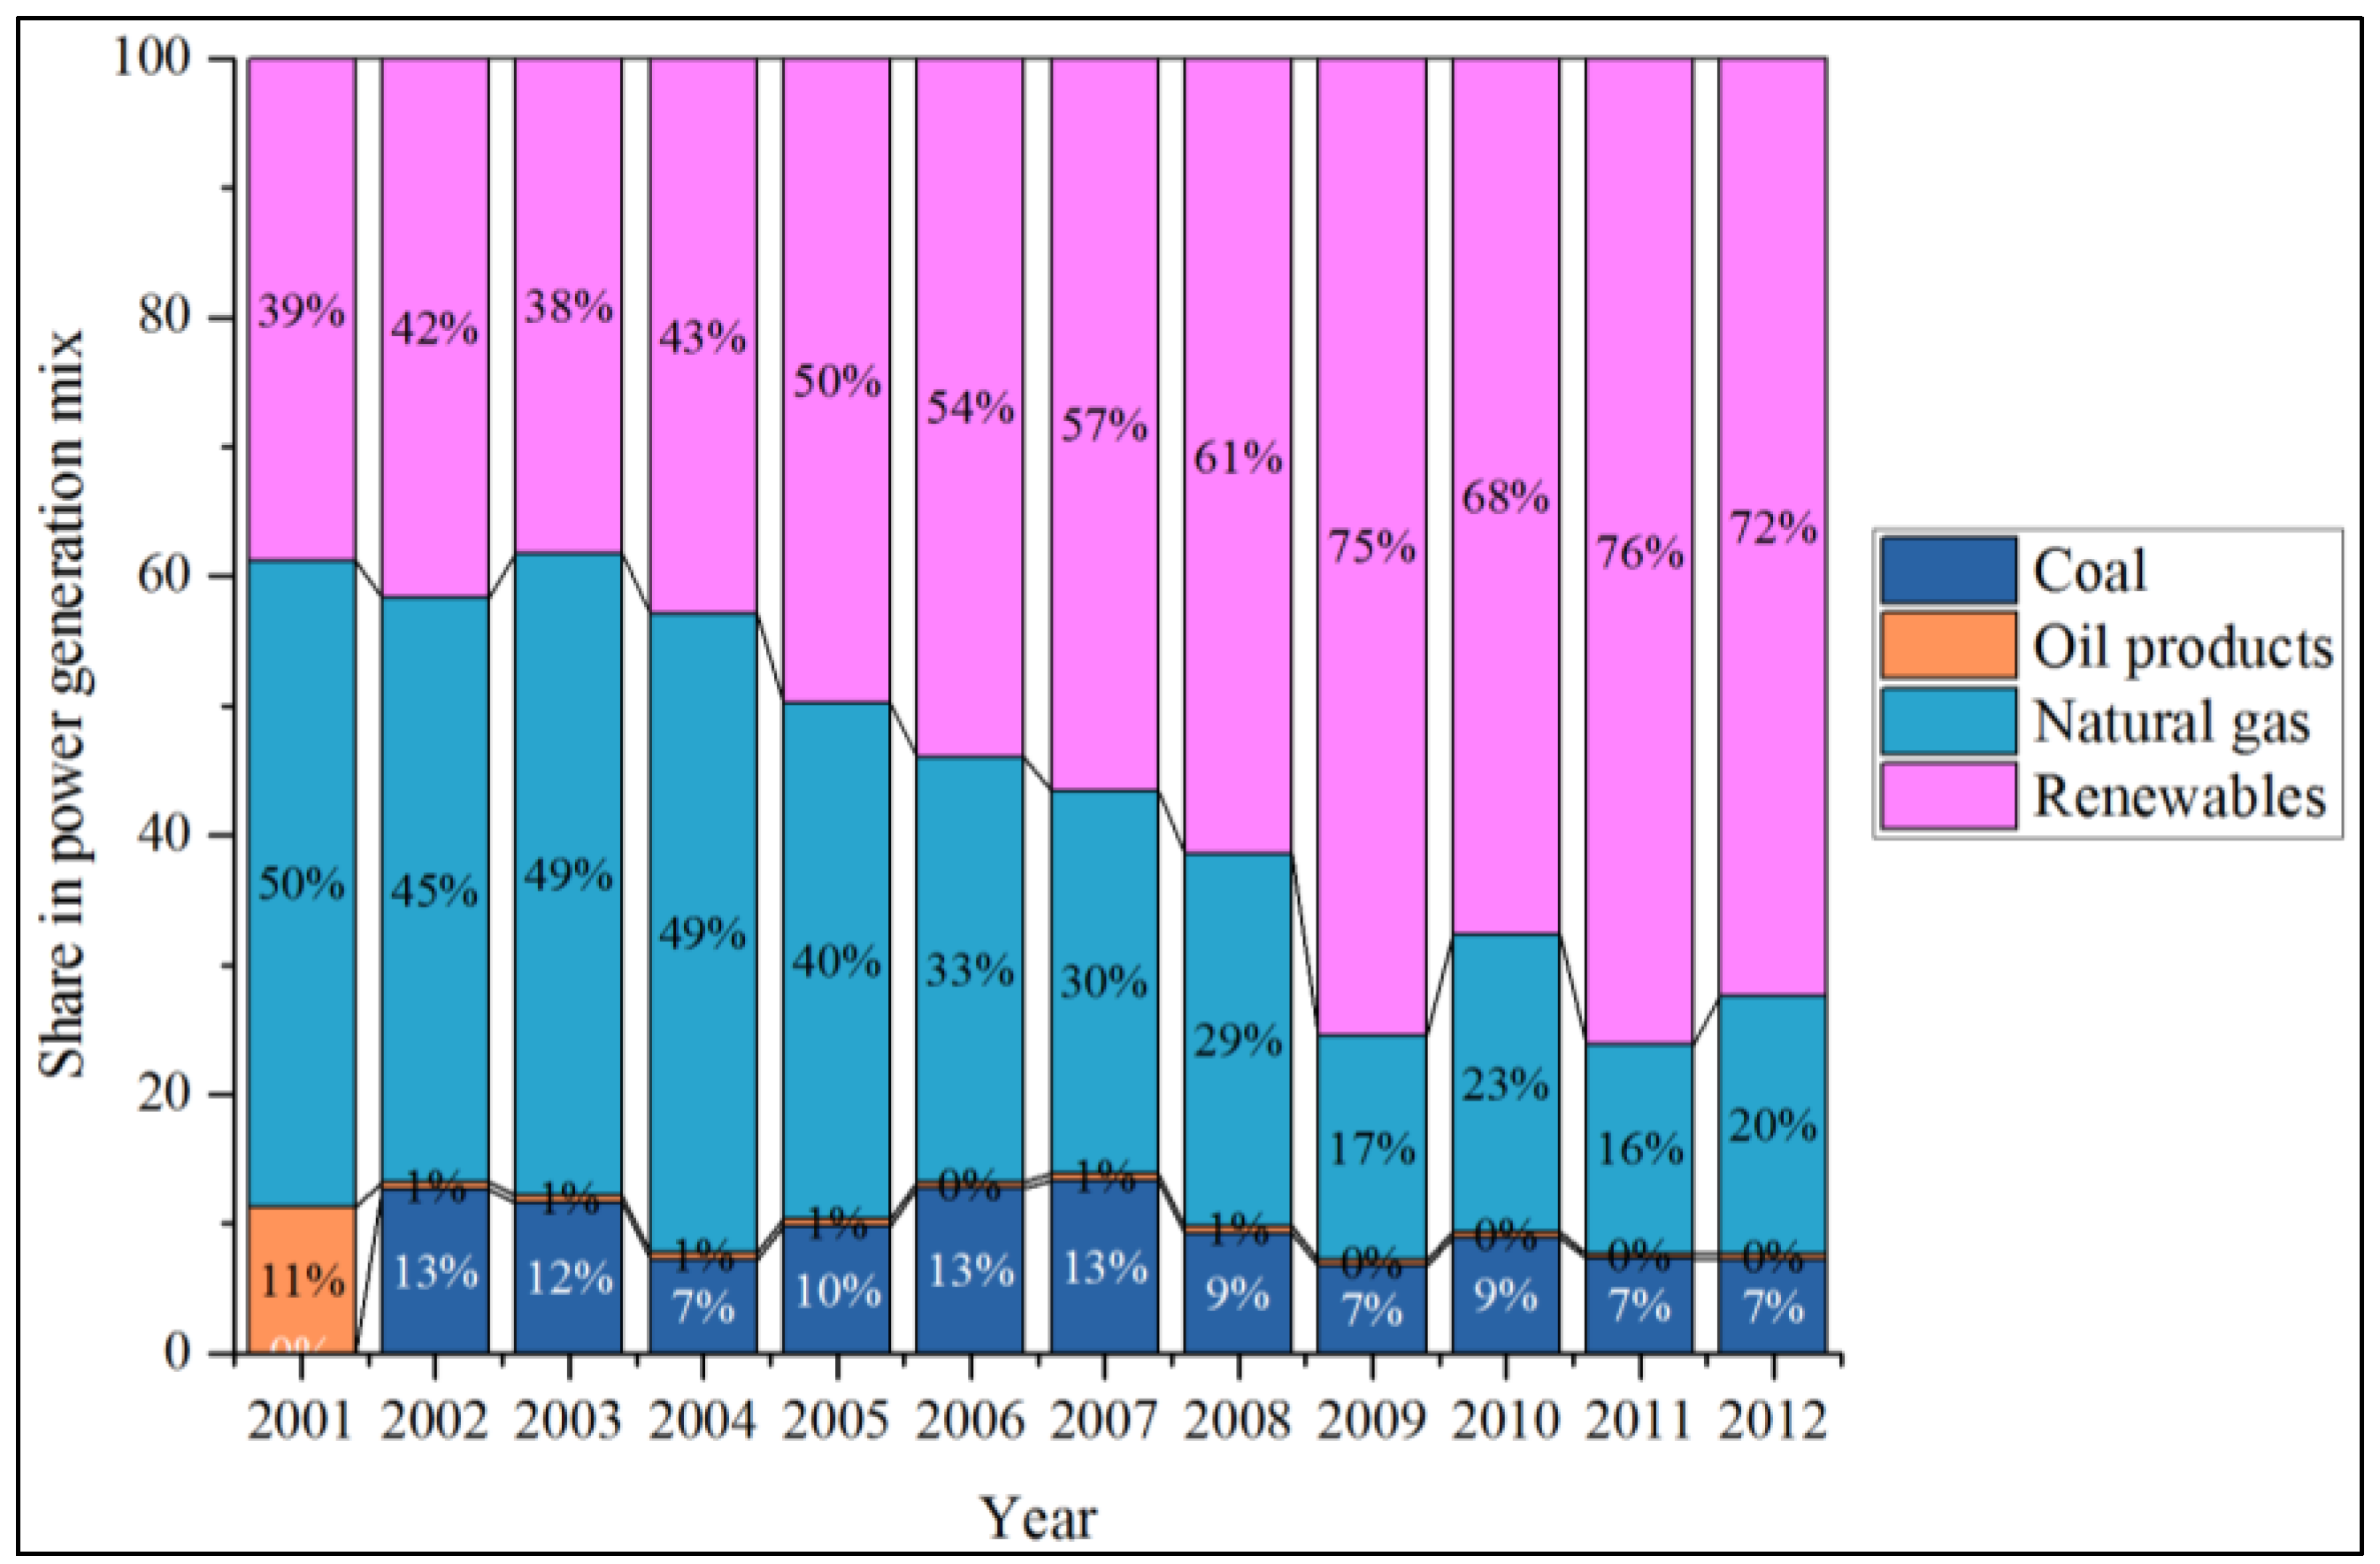
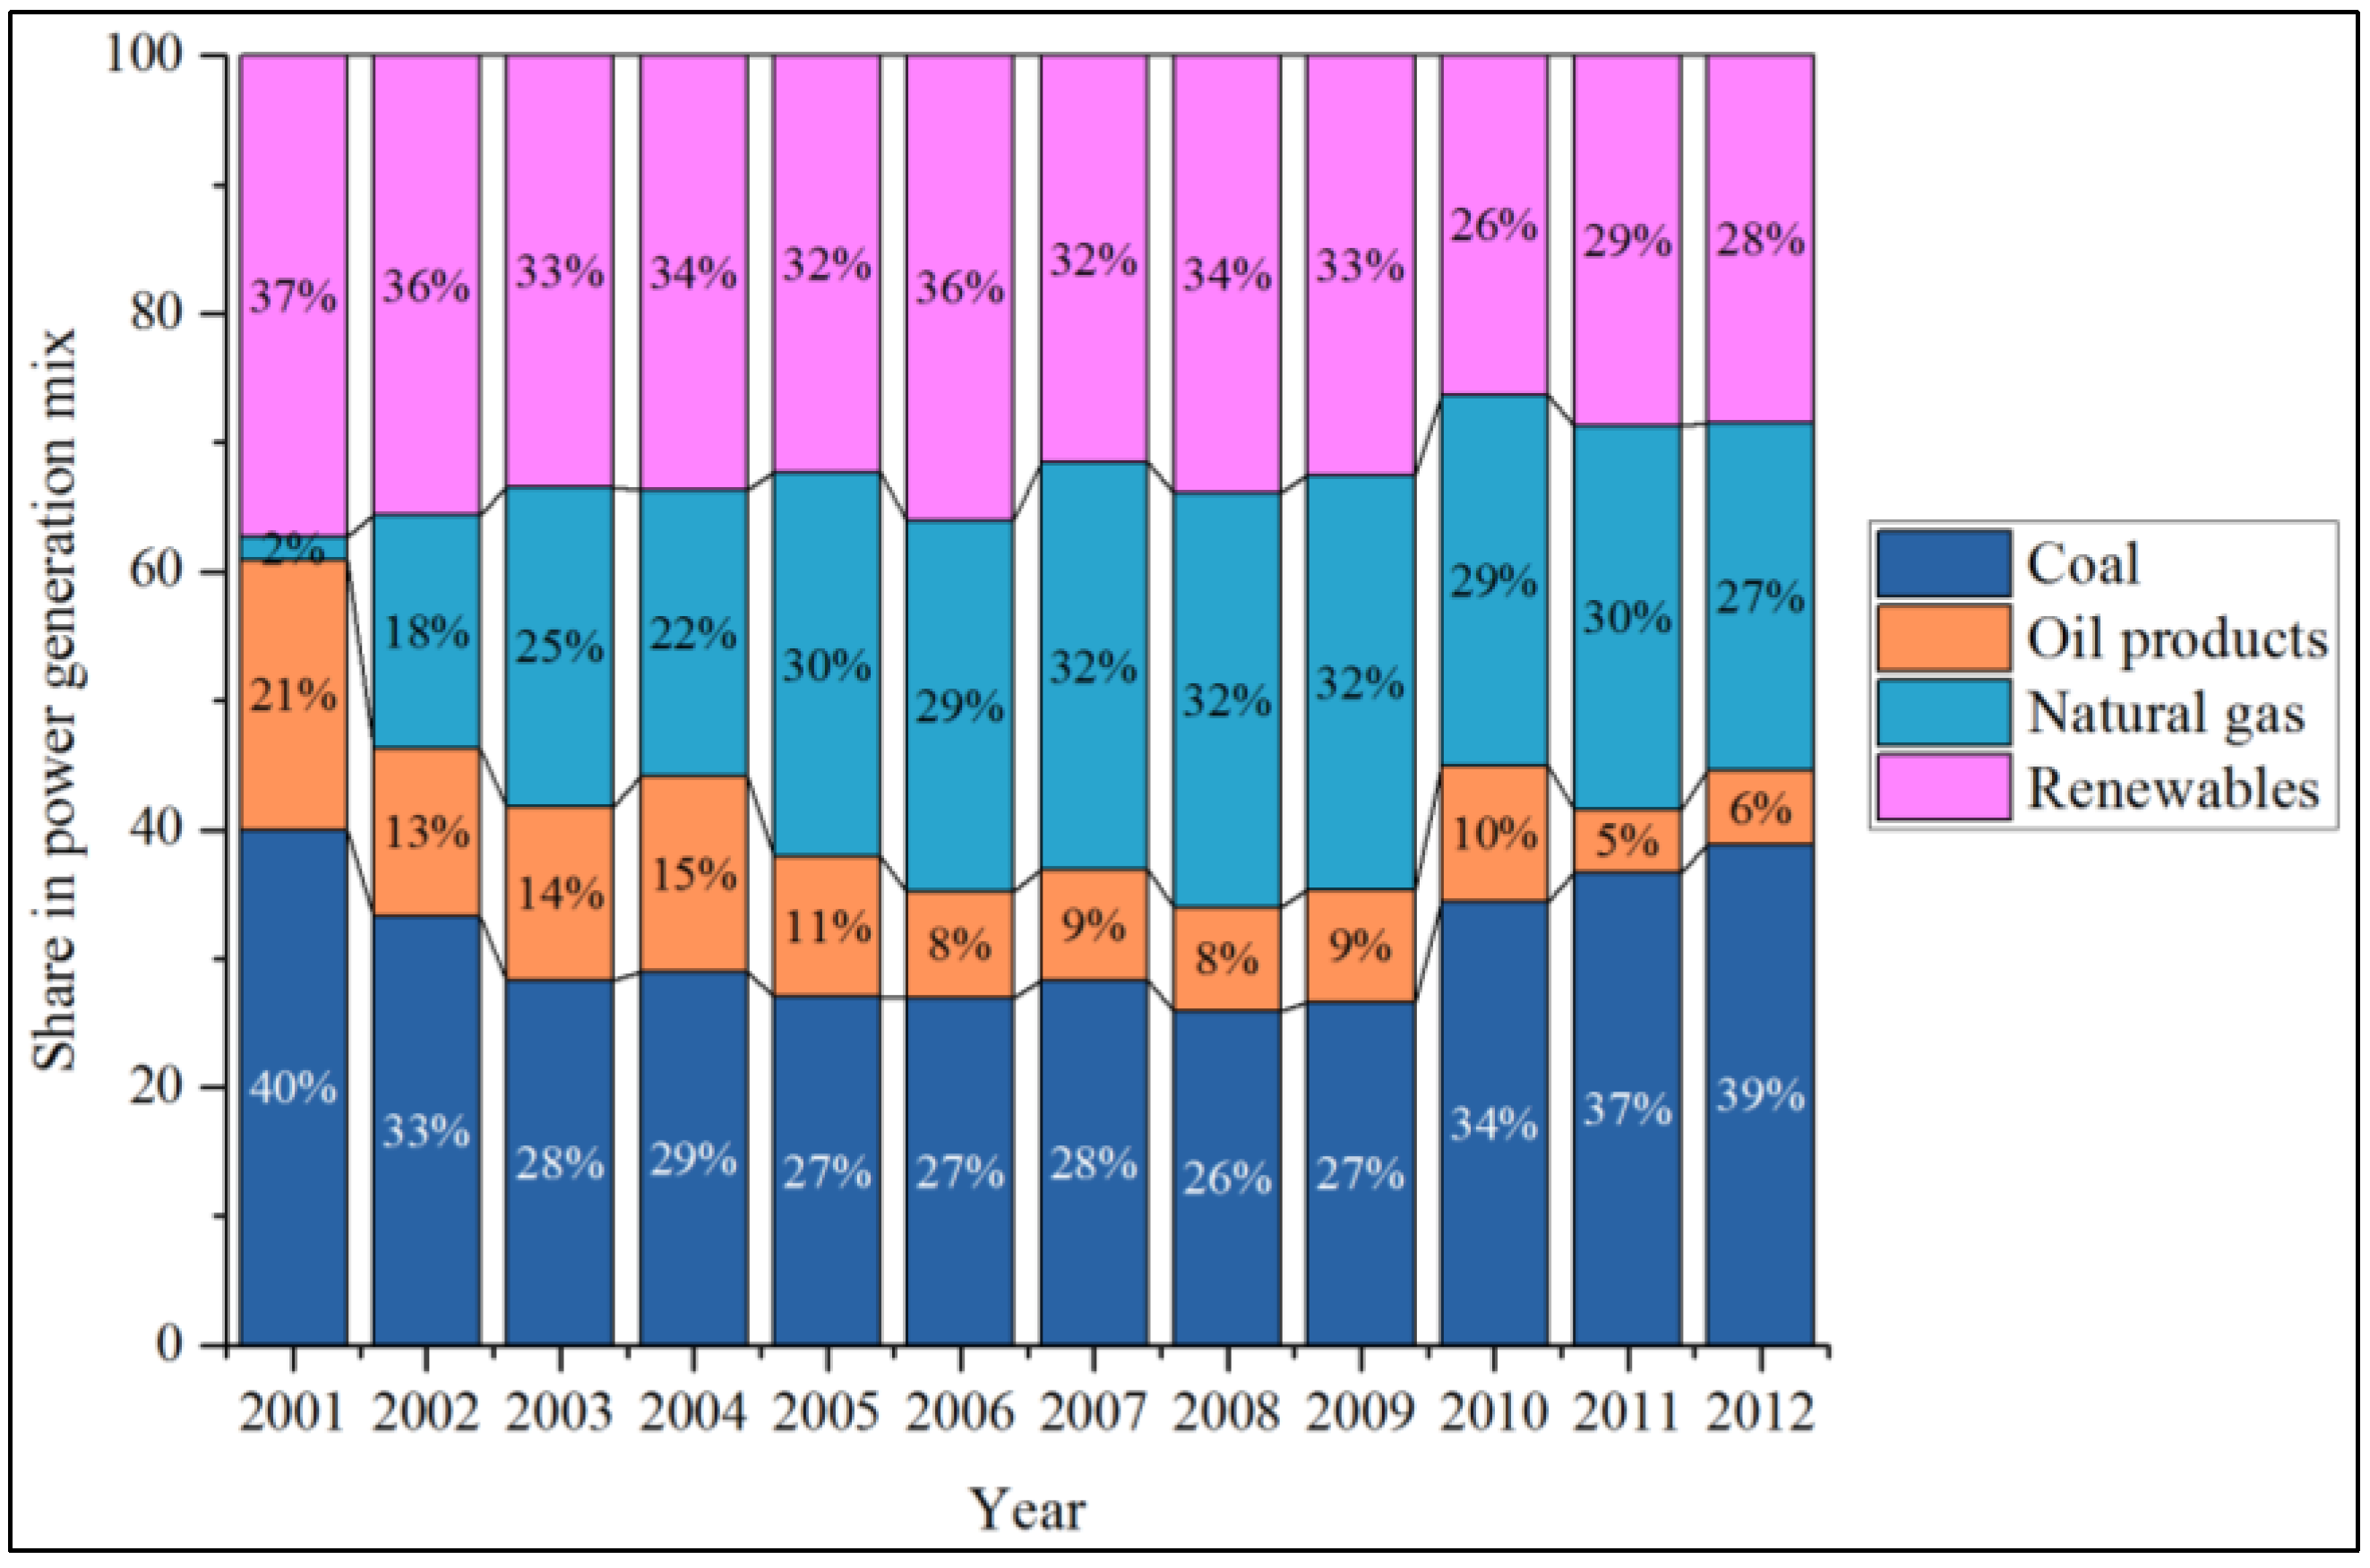
In contrast to Indonesia and Malaysia, the share of coal and natural has been decreasing in Myanmar’s electricity generation mix (even though coal has replaced oil in electricity generation since 2002), whereas renewable energy, specifically hydroelectricity, has considerably continued to grow (as presented in Figure 15). For the Philippines (see Figure 16), coal accounts for approximately one-third of the power generation, followed by renewables (half from hydroelectricity and another half from other renewables) and natural gas that significantly increased from the year 2001.
Figure 15. Myanmar: power generation mix.
Socsci 04 01269 g015
Figure 16. The Philippines: power generation mix.
Socsci 04 01269 g016
Singapore’s power generation is heavily dominated by natural gas (see Figure 17). In addition, the share of natural gas in generating electricity has exceptionally increased when compared to the one in 2001. In contrast to natural gas, the share of oil has substantially dropped while renewable energy (waste and biofuels) has been fixed at 1% in the past 12 years due to geographical limitations. Similar to Singapore, natural gas is also at the center of Thailand’s electricity generation (as shown in Figure 18). Natural gas attributes to two-thirds of the power generation, followed by coal (approximately 20%) and renewable energy (mostly hydroelectricity). As for Vietnam (see Figure 19), renewable energy, specifically hydroelectricity, dominates its power generation, followed by natural gas and coal. In accordance with most ASEAN countries, natural gas has continued to increase its crucial role in electricity generation for Vietnam.
Figure 17. Singapore: power generation mix.
Socsci 04 01269 g017
Figure 18. Thailand: power generation mix.
Socsci 04 01269 g018
Figure 19. Vietnam: power generation mix.
Socsci 04 01269 g019
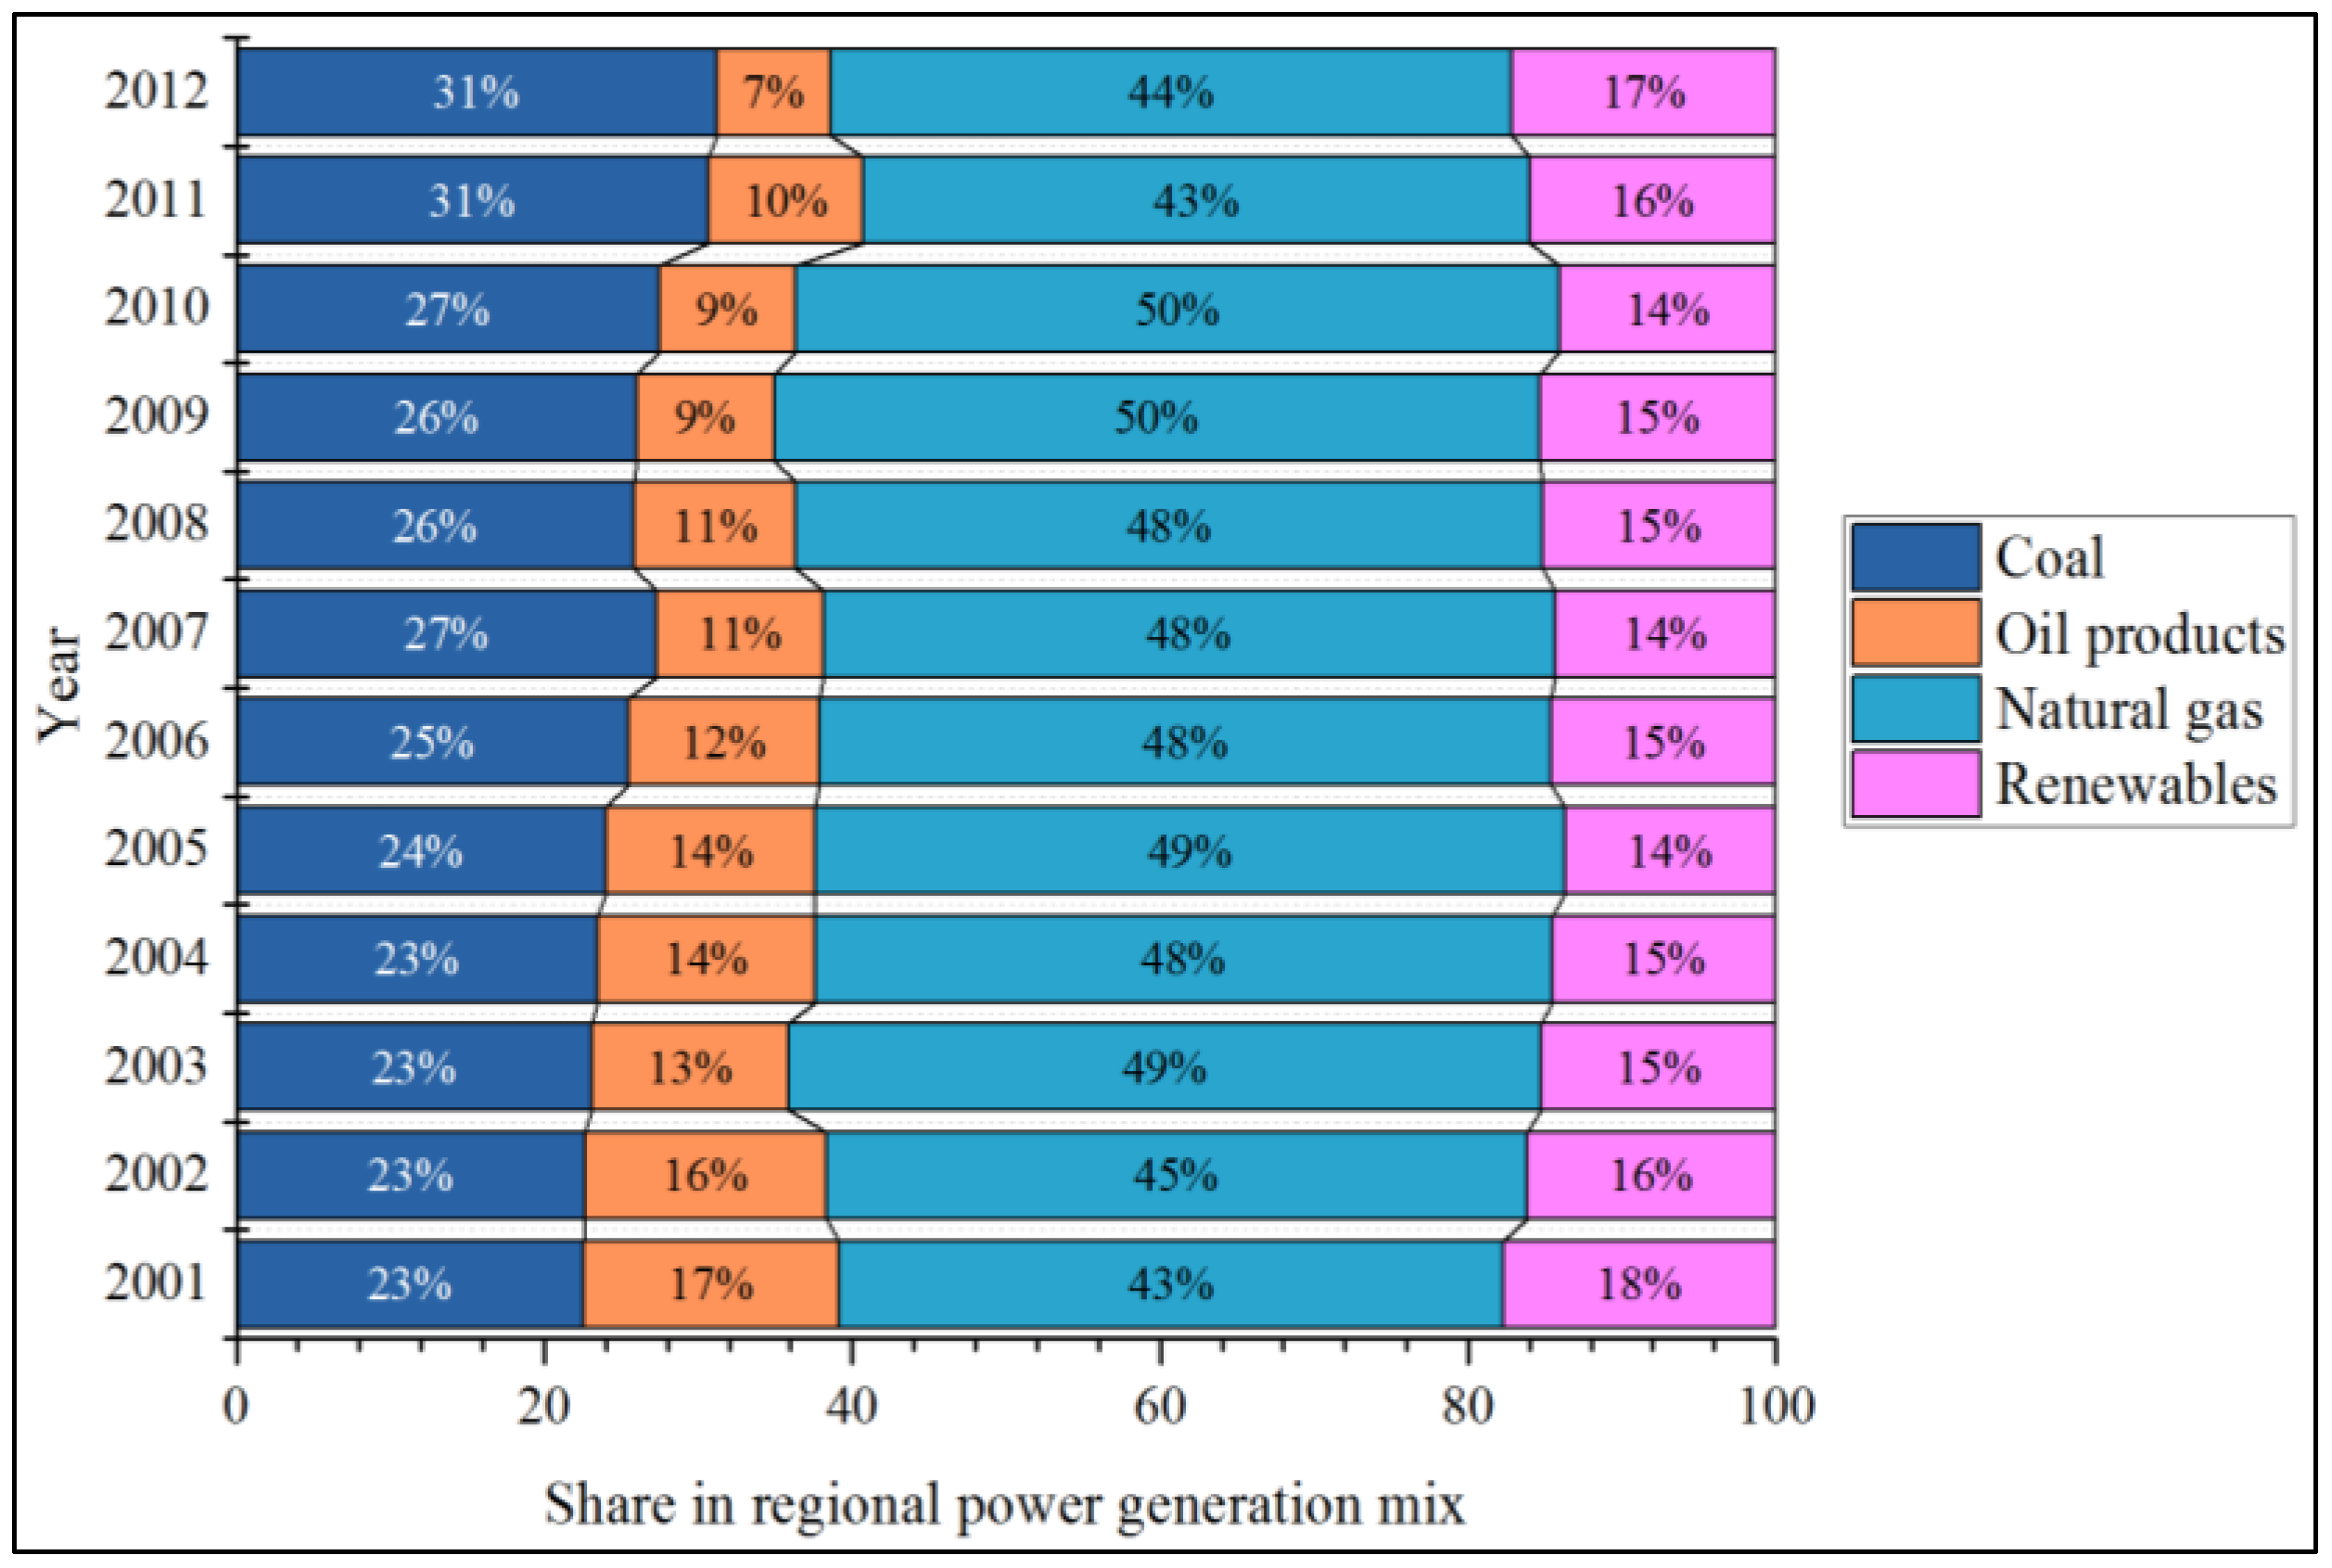
Regionally, there is no doubt that fossil fuels are the main energy sources for power generation in most ASEAN nations. According to Figure 20, natural gas is evidently a crucial driver of power supply not only nationally, but also regionally, since it makes up more than one-third of the regional power generation. The gradual increase of coal in electricity generation has replaced the usage of oil in generating power whereas the share of renewable energy is rather constant. Independently of the primary energy mix, ASEAN power generation capacity divides the countries into certain groups: countries with high installed capacity and output (Indonesia, Thailand, and Malaysia); countries with middle capacity (Vietnam, the Philippines, and Singapore); and countries with relatively low electricity capacity (Brunei, Cambodia, and Myanmar).
Figure 20. ASEAN: power generation mix.
Socsci 04 01269 g020

3.1.3. Sectoral Energy Consumption

Regarding final energy consumption, Figure 21 presents an overview of energy consumption among ASEAN countries. In general, energy consumption in most countries has been growing, particularly Vietnam (it surpassed Malaysia in terms of energy consumption in 2009), Thailand, and Indonesia. There were slight drops between 2007 and 2008 due to the global financial crisis. In comparison, in the past 12 years, Indonesia has been the largest energy-consuming country among ASEAN countries, with an average annual energy consumption of 139,277 ktoe. Thailand, the second-largest energy consumer of the region, has an average energy consumption of 72,811 ktoe, followed by Malaysia (40,674 ktoe) and Vietnam (39,124 ktoe). In spite of being the second-wealthiest country of the region, Brunei only requires 1116 ktoe for its domestic energy consumption.
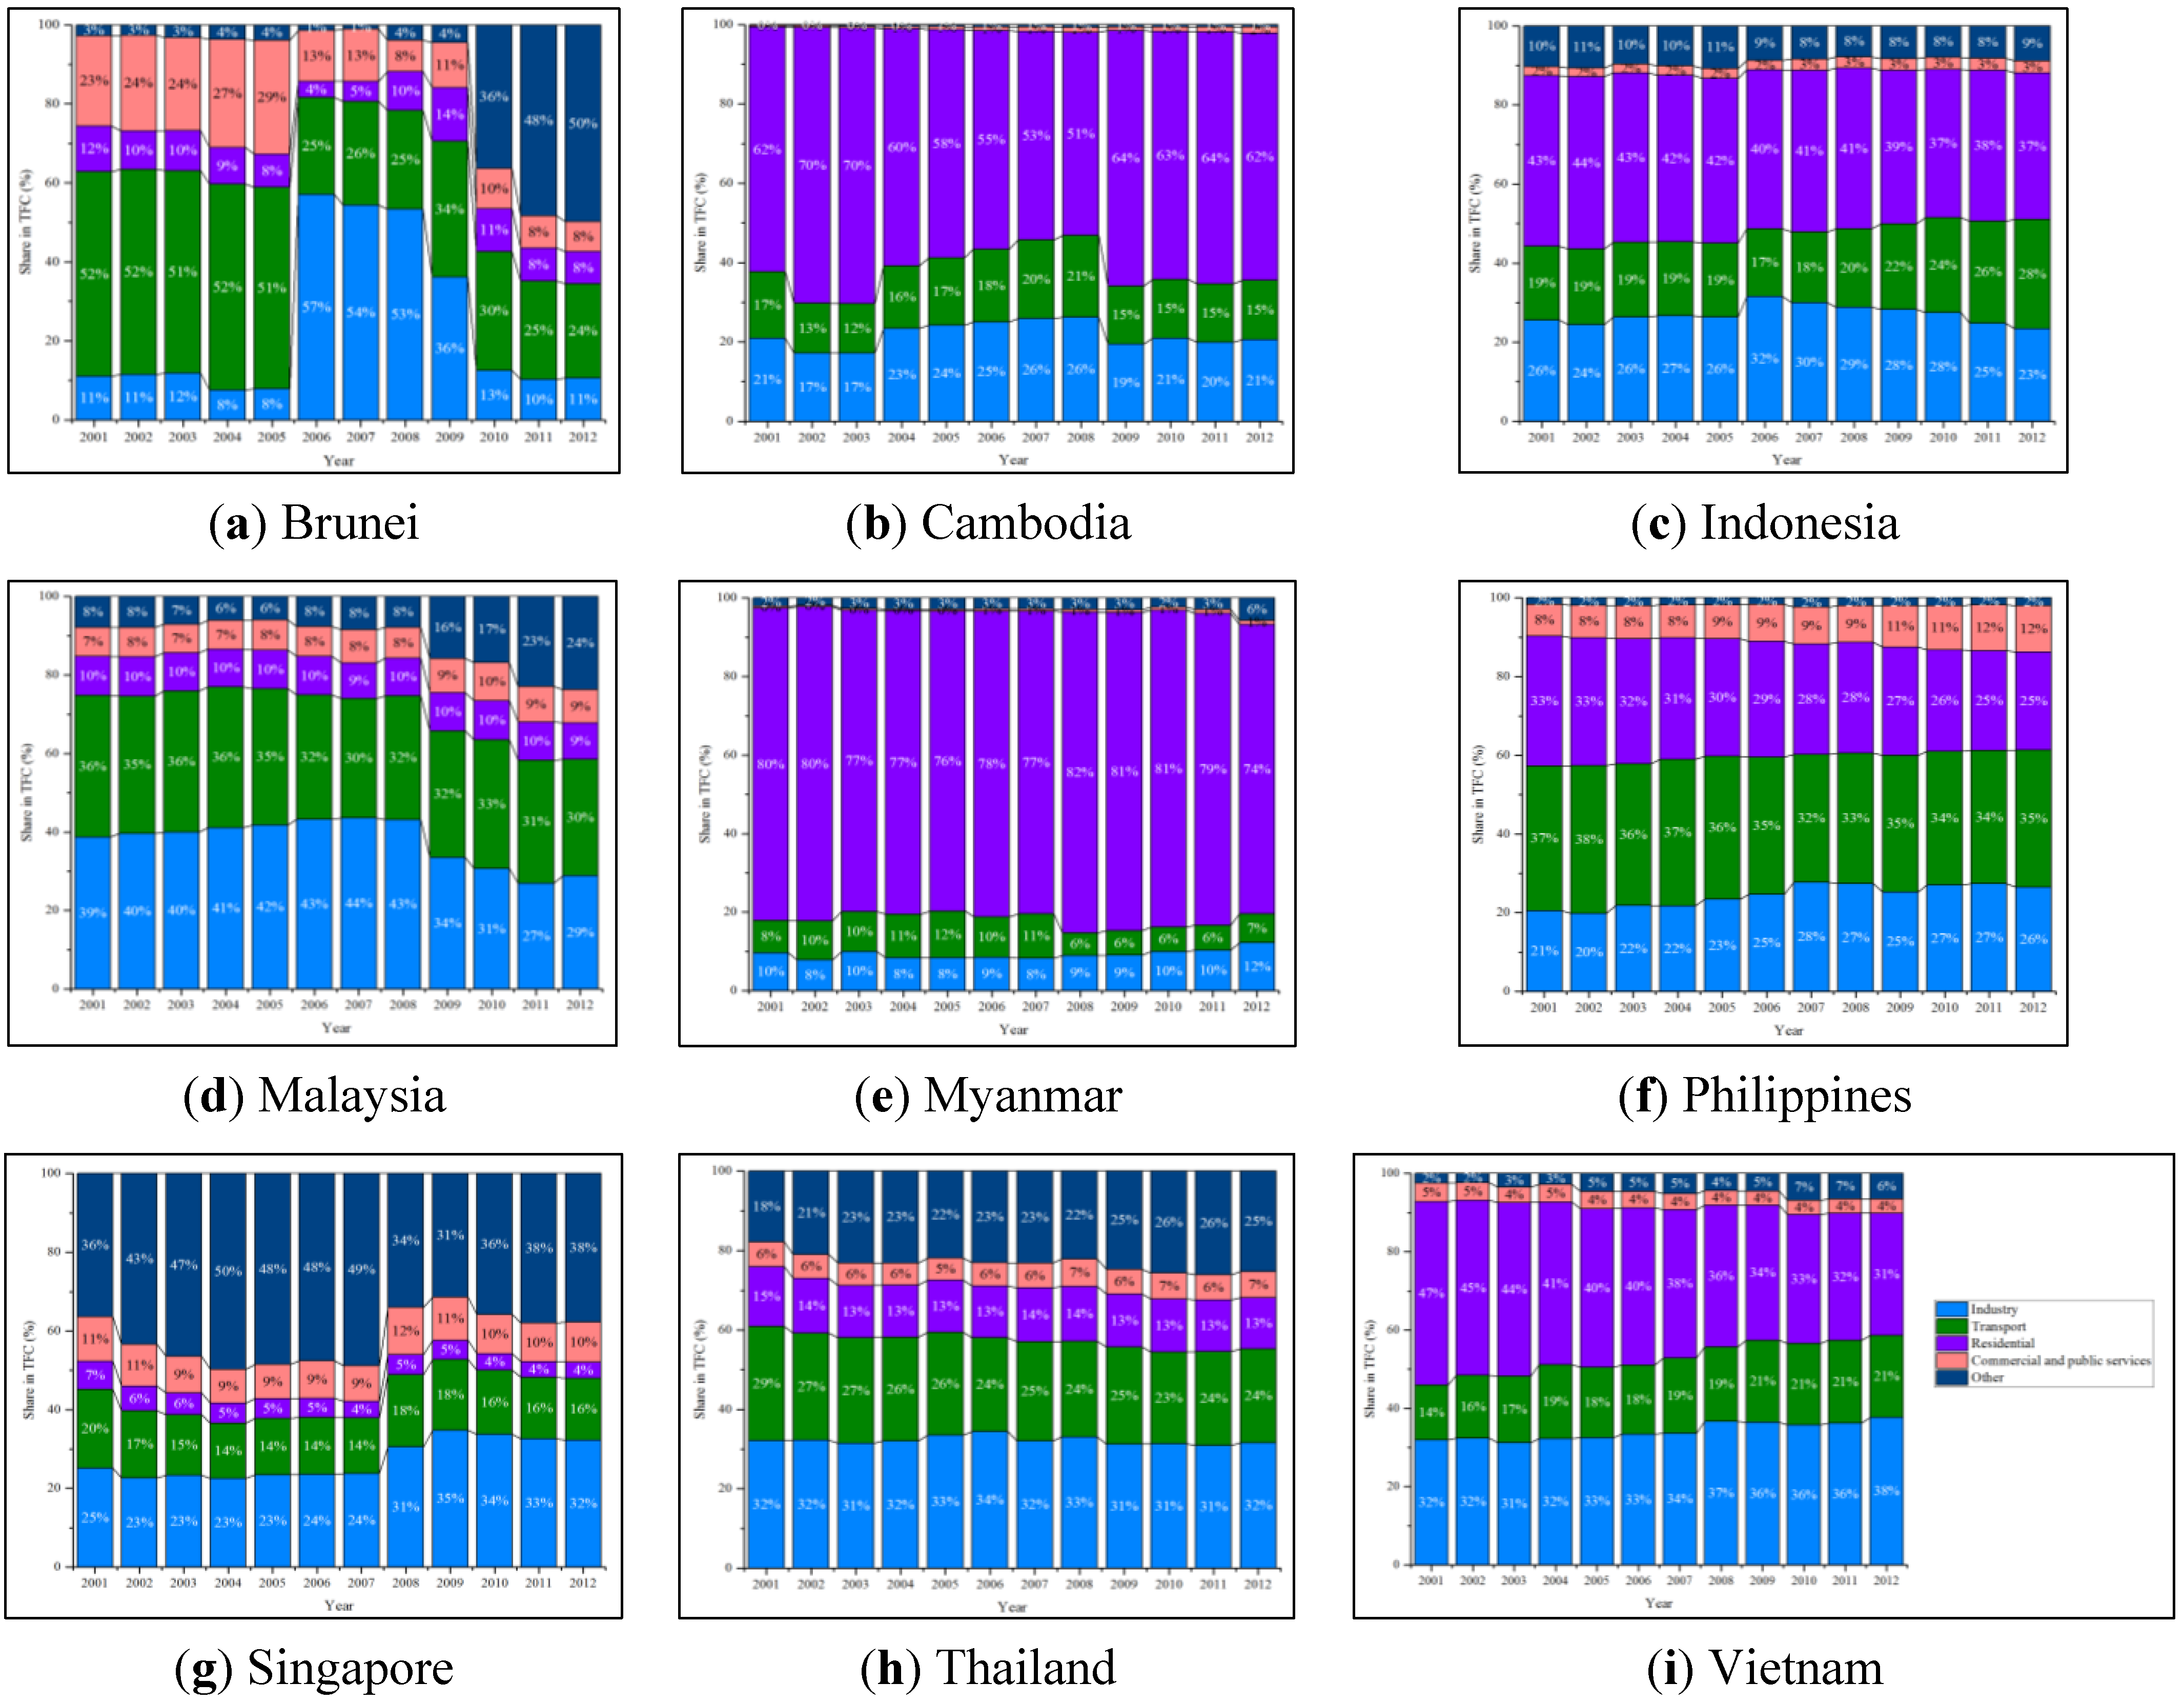
For energy consumption by sector, Figure 22 shows sectoral energy consumption by country. Brunei’s final energy consumption between 2001 and 2012 was rather inconsistent. As shown in Figure 22a, energy consumption in the industry sector jumped from 8% in 2005 to 57% in 2006 before falling to 13% in 2010, which was a result of the construction of its methanol plant [52]. Energy consumed in other sectors also skyrocketed from 1% in 2007 to 36% in 2010 due to the Bruneian government’s decision to increase production output and to replace imported fuels with domestic refineries, which resulted in a high share of non-energy use from the chemical/petrochemical industry [47]. More than half of Cambodia’s energy consumption is, on the contrary, concentrated in the residential sector, which stems from the use of traditional biomass for cooking and heating. For Indonesia, one-third of its energy is consumed in the residential sector, followed by the transport and industry sectors. While the share of energy consumption in residential and industrial sectors is declining, the need for energy in the transport sector has continued to grow.
Figure 21. ASEAN final energy consumption.
Socsci 04 01269 g021
On the contrary, two-thirds of the Malaysian energy consumption fall into the industry and transport sectors, while less than 10% of the final energy is consumed in the residential sector. Similar to Cambodia, three-quarters of Myanmar’s energy consumption is used in the residential sector. Even though the trend has been declining in the past 12 years, it shows the lack of economic activities in the country. In the case of the Philippines, its final energy consumption is equally distributed among transport, industry, and residential sectors.
With the expanding share in industry and commercial and public services, energy consumption in residential and transport sectors is consequently decreasing. The non-energy sector accounted for more than 40% of Singapore’s energy consumption. One explanation is that the country imports crude oil that is used in the petrochemical industry. In addition to non-energy demand, Singaporean energy is mainly consumed in the industry and transport sectors. Thailand’s energy consumption is concentrated in industry, transport, and other (mostly non-energy) sectors. While the share of energy consumption in industry is quite constant, non-energy consumption has gradually increased. On the other hand, industry, residential, and transport sectors dominate the energy consumption of Vietnam.
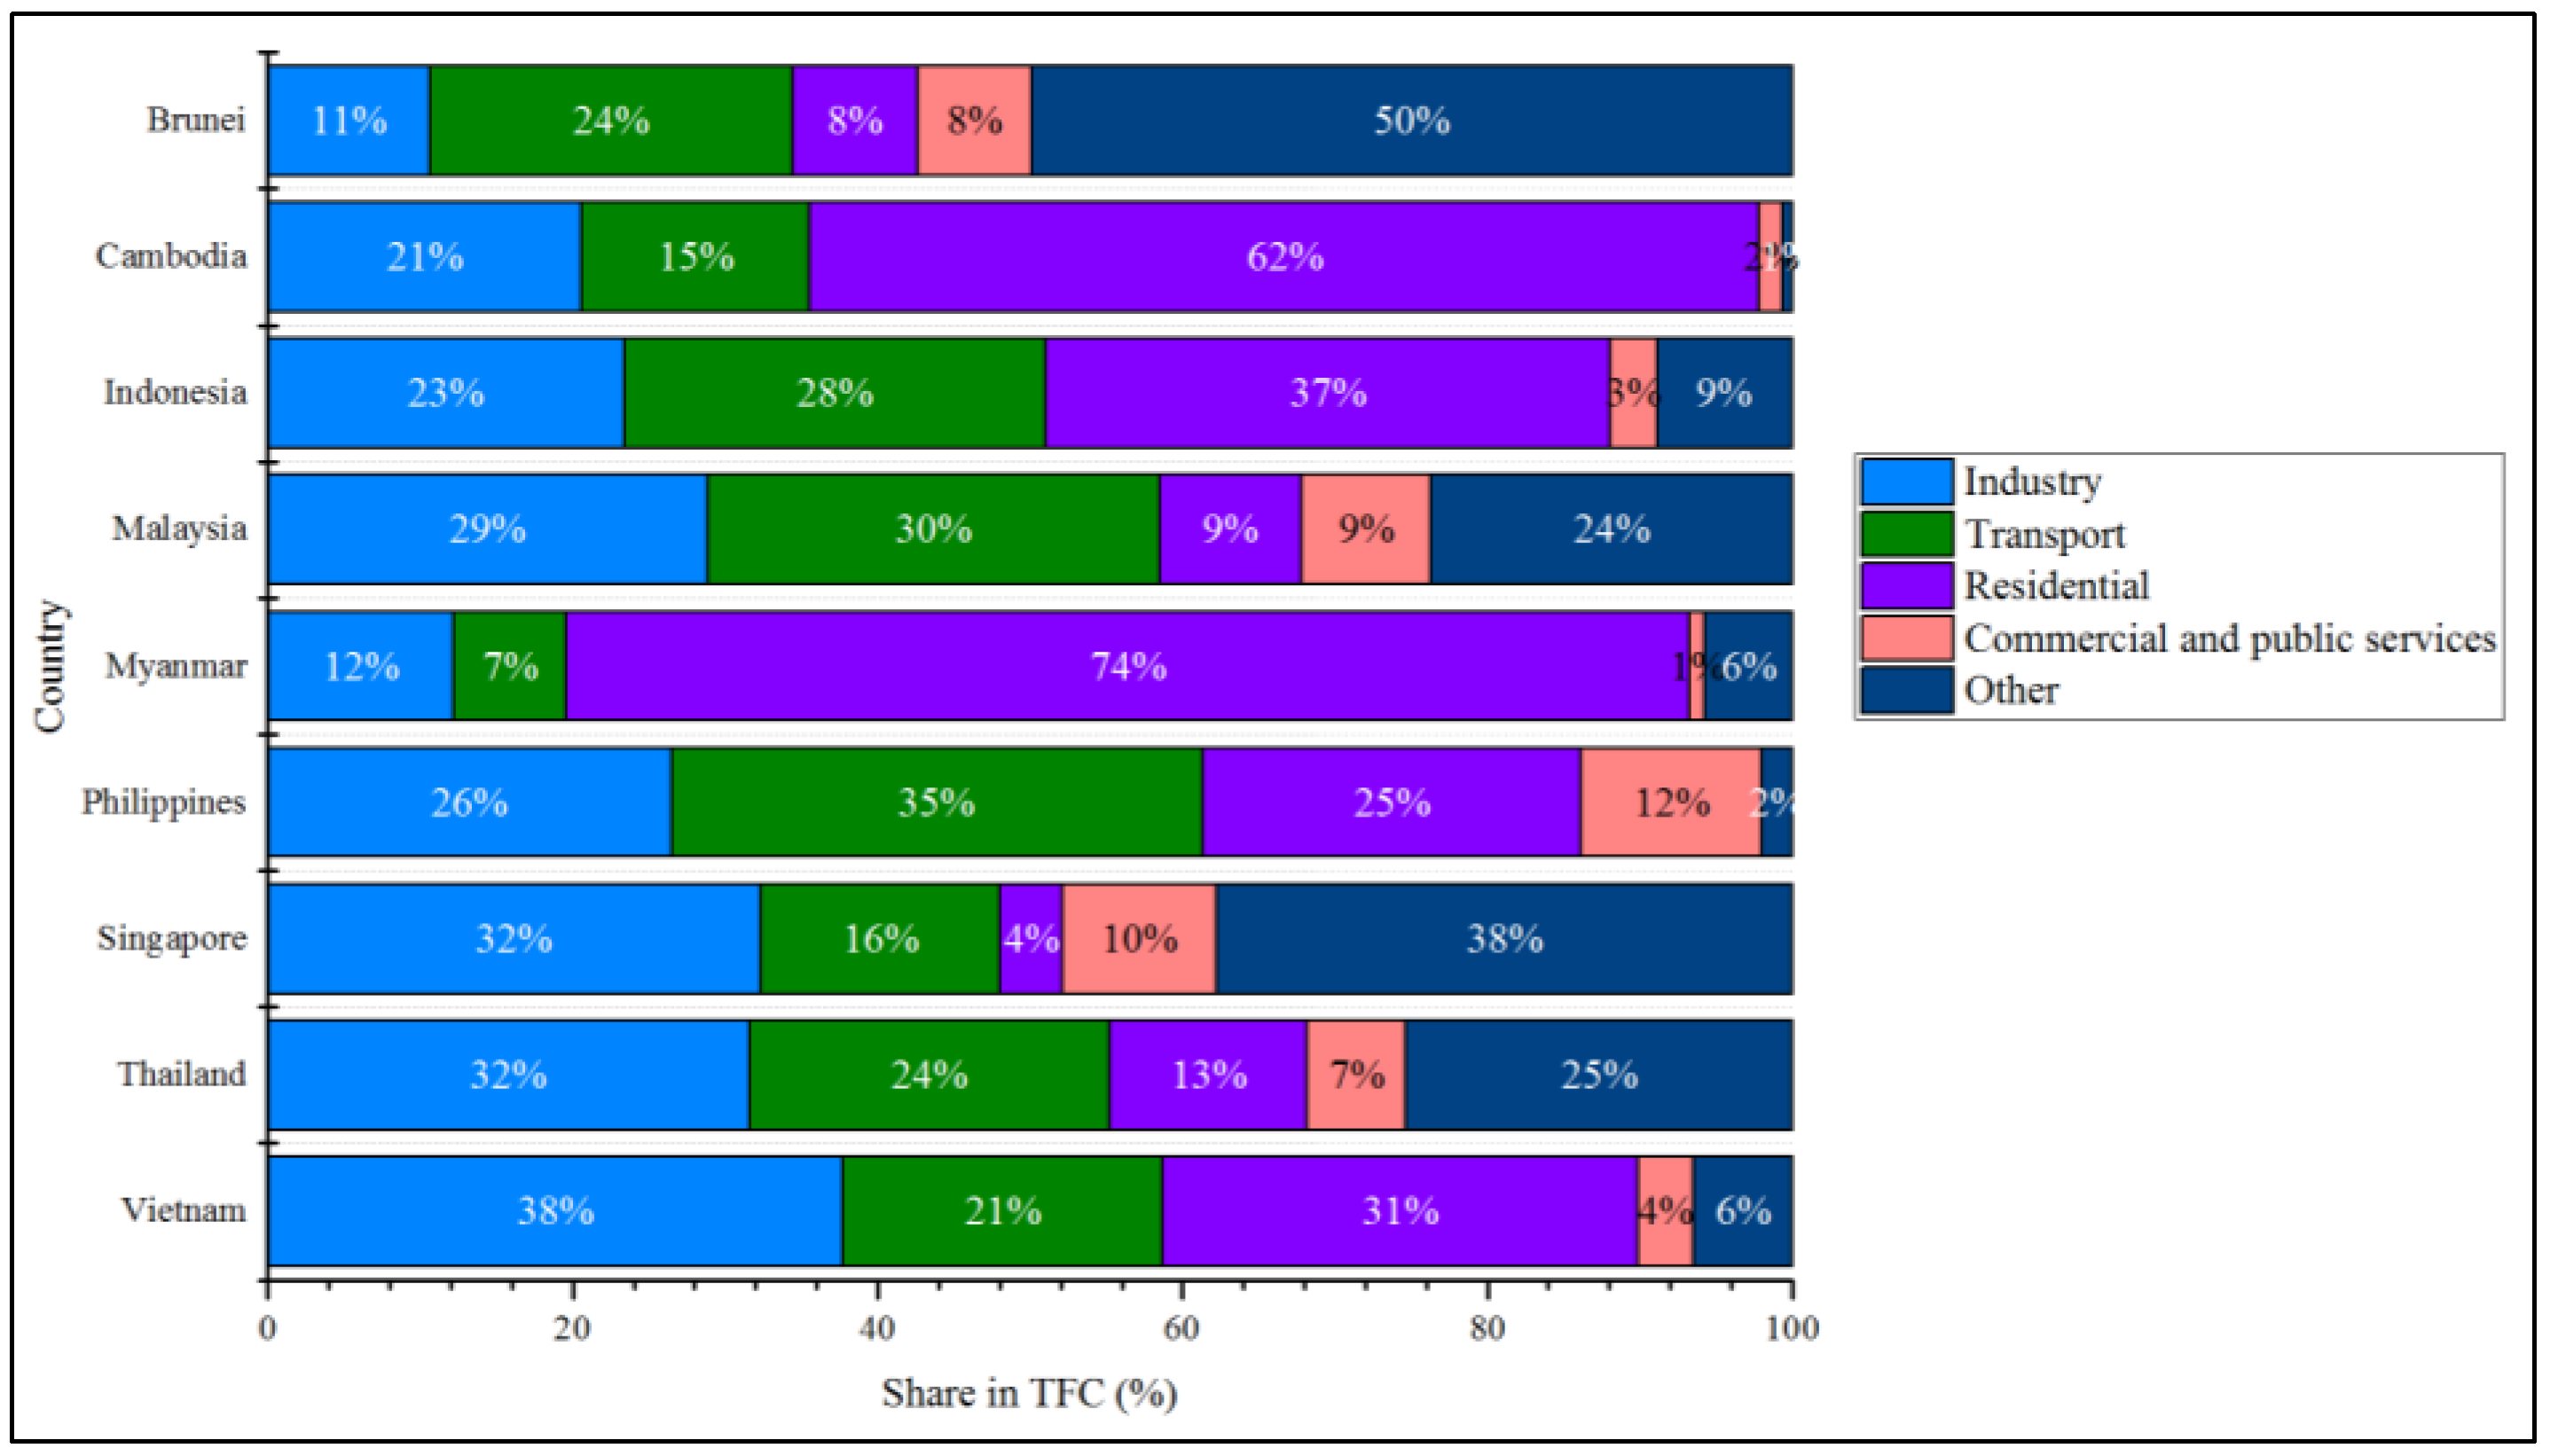
According to Figure 23, as of 2012, the residential sector is the sector consuming the most energy of the ASEAN countries with the exception of Singapore (4%), Brunei (8%), and Malaysia (9%), the three countries with the highest income of the region. It is apparent that countries where the residential sector takes up most of the final energy consumption are developing countries (Cambodia and Myanmar), but its share has gradually decreased as a result of energy development. Preceded by the residential sector, regional energy consumption is also spent in the industry and transport sectors. Other sectors, on the other hand, accounted for a significant share of Brunei, Singapore, Thailand, and Malaysia’s energy consumption. Even though the sector is comprised of various aspects, e.g., agriculture, fishery, non-energy, etc., it is non-energy consumption (particularly for the chemical/petrochemical industry) that drives its large share.
Figure 22. Sectoral energy consumption (by country).
Socsci 04 01269 g022
Figure 23. Sectoral energy consumption (2012).
Socsci 04 01269 g023

3.2. Socio-Economic Aspect

3.2.1. Access to Electricity

Referring to national energy development, findings on electricity accessibility were compiled from the World Energy Outlook 2011–2014 [53,54,55,56], and they are shown in Table 2. The comparison of the results between the years 2009 to 2012 reflects the attempts of the country to acquire modern energy services (electricity).
Table 2. ASEAN electricity access between 2009–2012.
CountryNational Electrification (%)Population without Electricity (Millions)
20092010201120122009201020112012
BN99.6699.799.799.70000
KH2431.13434.111.210.39.49.8
ID64.57372.975.981.662.865.759.5
MY99.499.499.599.50.20.20.10.1
MM1348.848.83243.525.824.735.9
PH89.783.370.270.39.515.628.328.7
SG1001001001000000
TH99.387.799990.58.40.70.7
VN97.697.696.196.12.12.13.53.5
The national electrification rate of Myanmar jumped from 13% in 2009 to 49% in 2010, while there was a slight increase in Cambodia and Indonesia. Brunei, Malaysia, and Singapore are countries where almost all of the populations have access to modern energy services, showing an energy development gap when compared to energy-poor countries, particularly Cambodia and Myanmar. Despite abundant energy resources, Indonesian national electrification covers only 76% of the country due to geographical conditions of the country that obscure the development of the power grid. Noticeably, there are some fluctuations in the electrification rates found in Myanmar, the Philippines, and Thailand, which could be the result of increasing energy inequity, prices, or simply data inconsistency. Nevertheless, since information on the electrification rate provided by the World Bank for the years 2010 and 2012 indicates increasing national electrification in the three countries [41], it is more likely that the fluctuations were data inconsistencies from the International Energy Agency (IEA).
Access to electricity also serves as a baseline assessment prior to the analysis of energy efficiency. The efficient use of energy can be observed through per capita and per GDP indicators. Provided that the majorities of the populations have access to modern energy services, the low and/or decrease in per capita and per GDP indicators reflects the more efficient use of energy. However, if the electrification rate is not yet nationwide, lower per capita and per GDP indicators could simply refer to the fact that people do not have access to modern energy services.

3.2.2. Per Capita Indicators

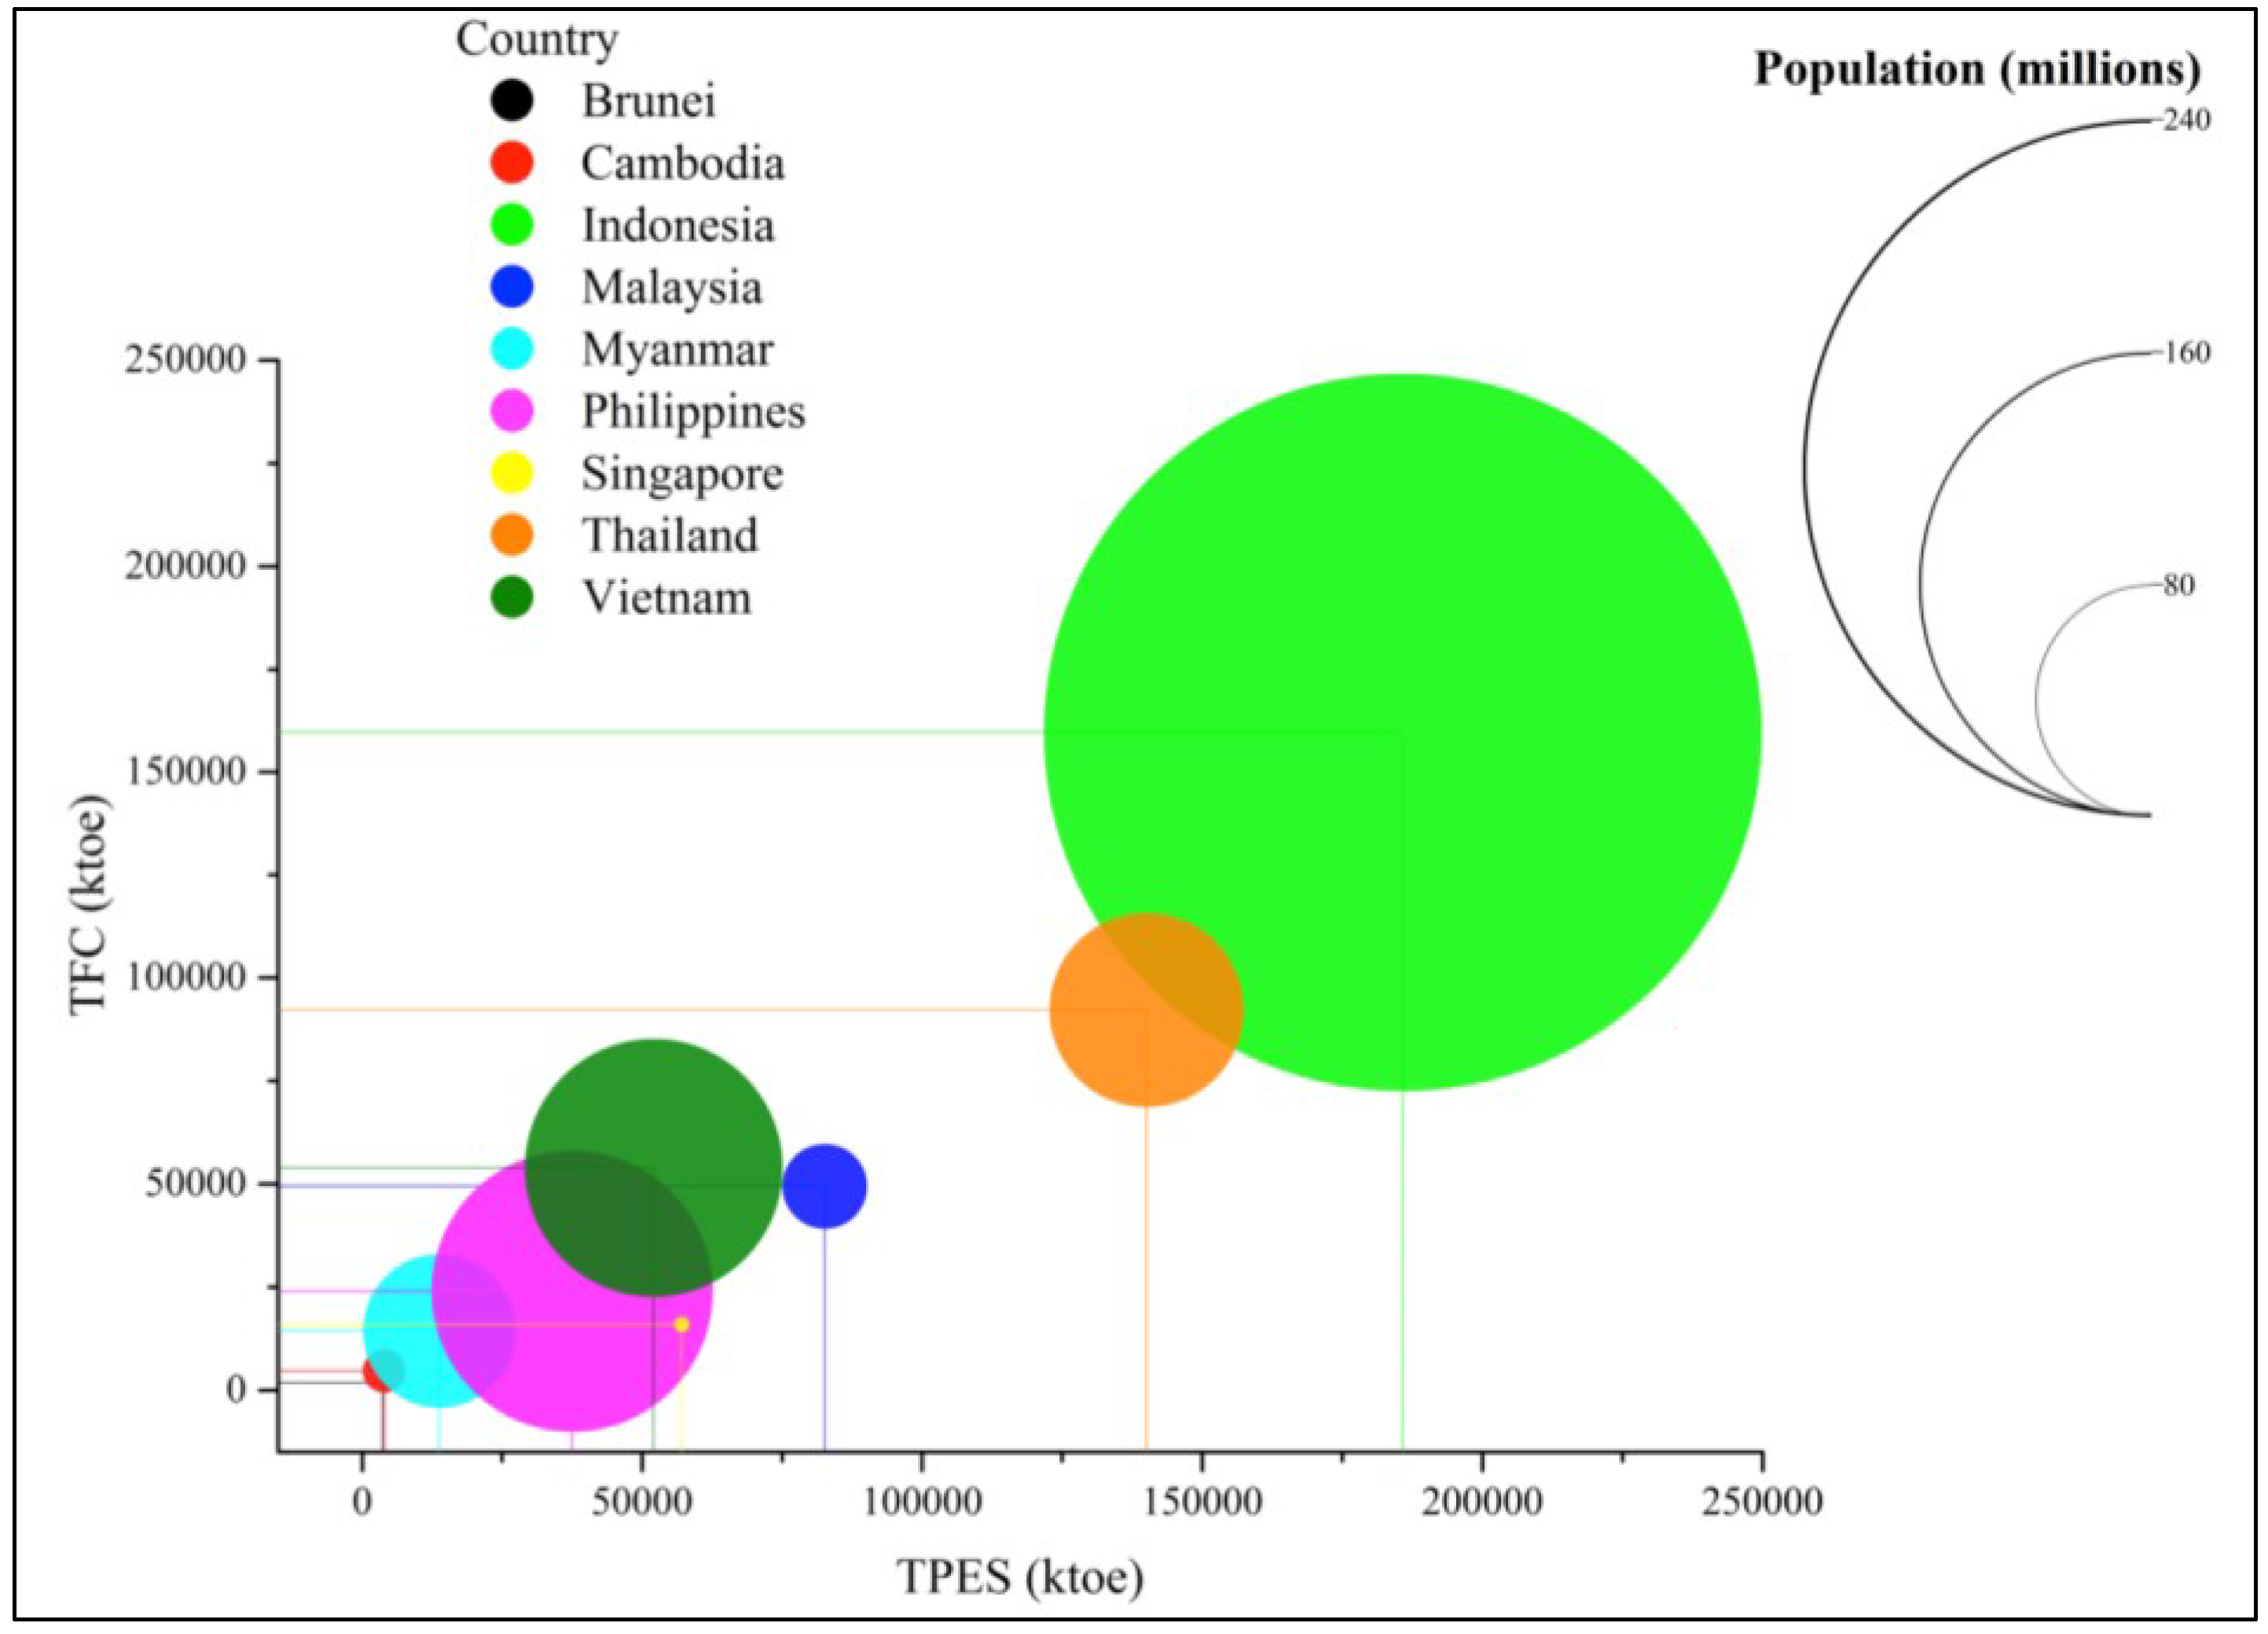
This part presents the results from energy supply, energy consumption, and electricity consumption per capita, which help illustrate the outcome of energy efficiency policy and energy security from a human-security perspective. As presented in Figure 24, energy supply and consumption is, to a certain extent, relative to the population size. Based on the previous country-level comparison showing Indonesia has not only the highest energy demand, but also the highest energy consumption, it is basically due to the large population size. However, in smaller countries with smaller populations, e.g., Brunei or Singapore, the size of the population should be proportional to the energy supply and demand.
Figure 24. ASEAN energy demand, consumption, and population.
Socsci 04 01269 g024
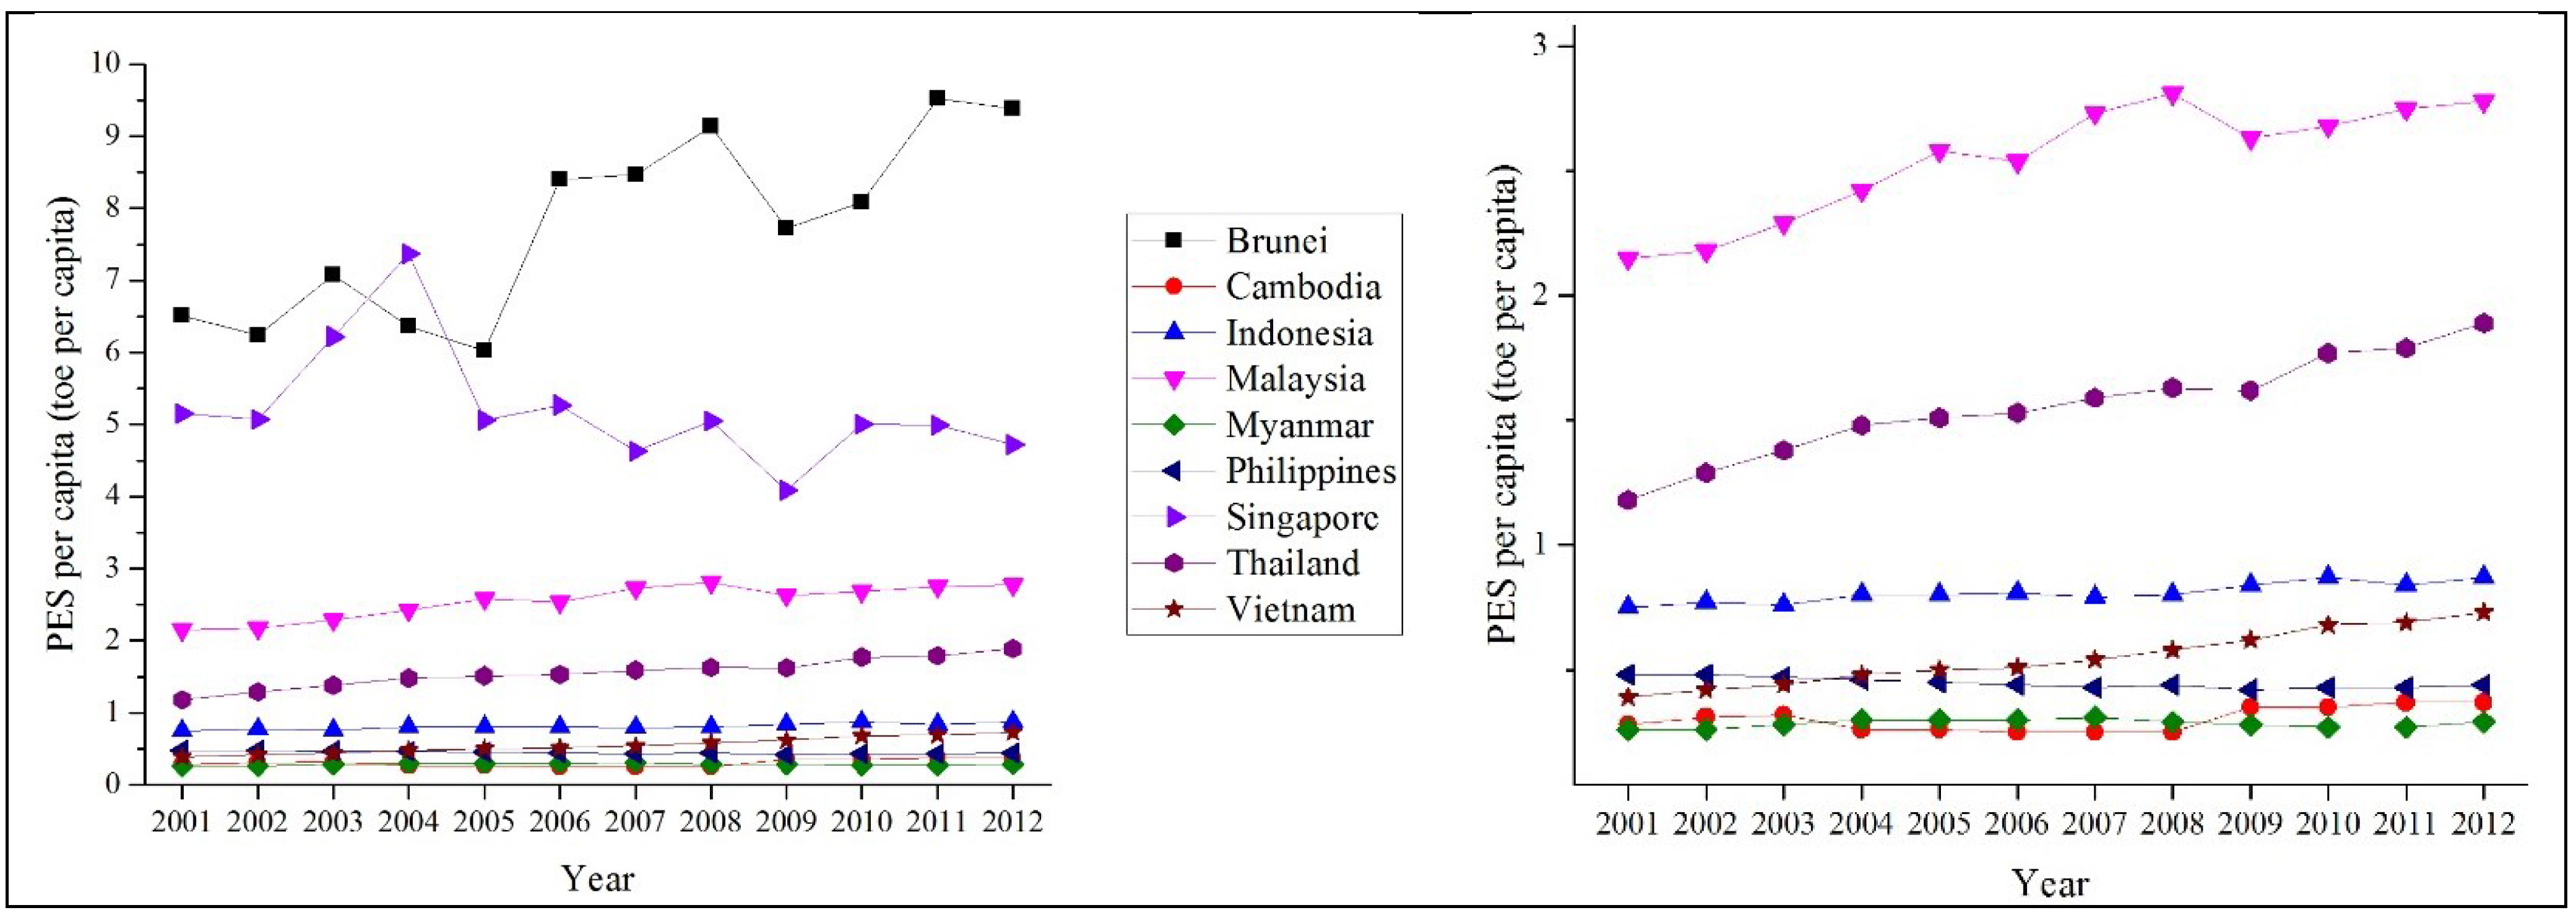
Hence, findings on primary energy per capita and energy consumption per capita in the case of countries with smaller populations are completely different from the previous section. Shown in Figure 25 and Figure 26, Brunei and Singapore have the highest primary energy supply per capita and final energy consumption per capita compared to the rest of the ASEAN countries. One explanation is that the two countries are the wealthiest countries in the region [50]. Brunei’s final energy consumption per capita sharply increased in 2006, especially when compared to those between 2001 and 2005.
Figure 25. Primary energy supply per capita.
Socsci 04 01269 g025
Figure 26. Total final consumption per capita.
Socsci 04 01269 g026
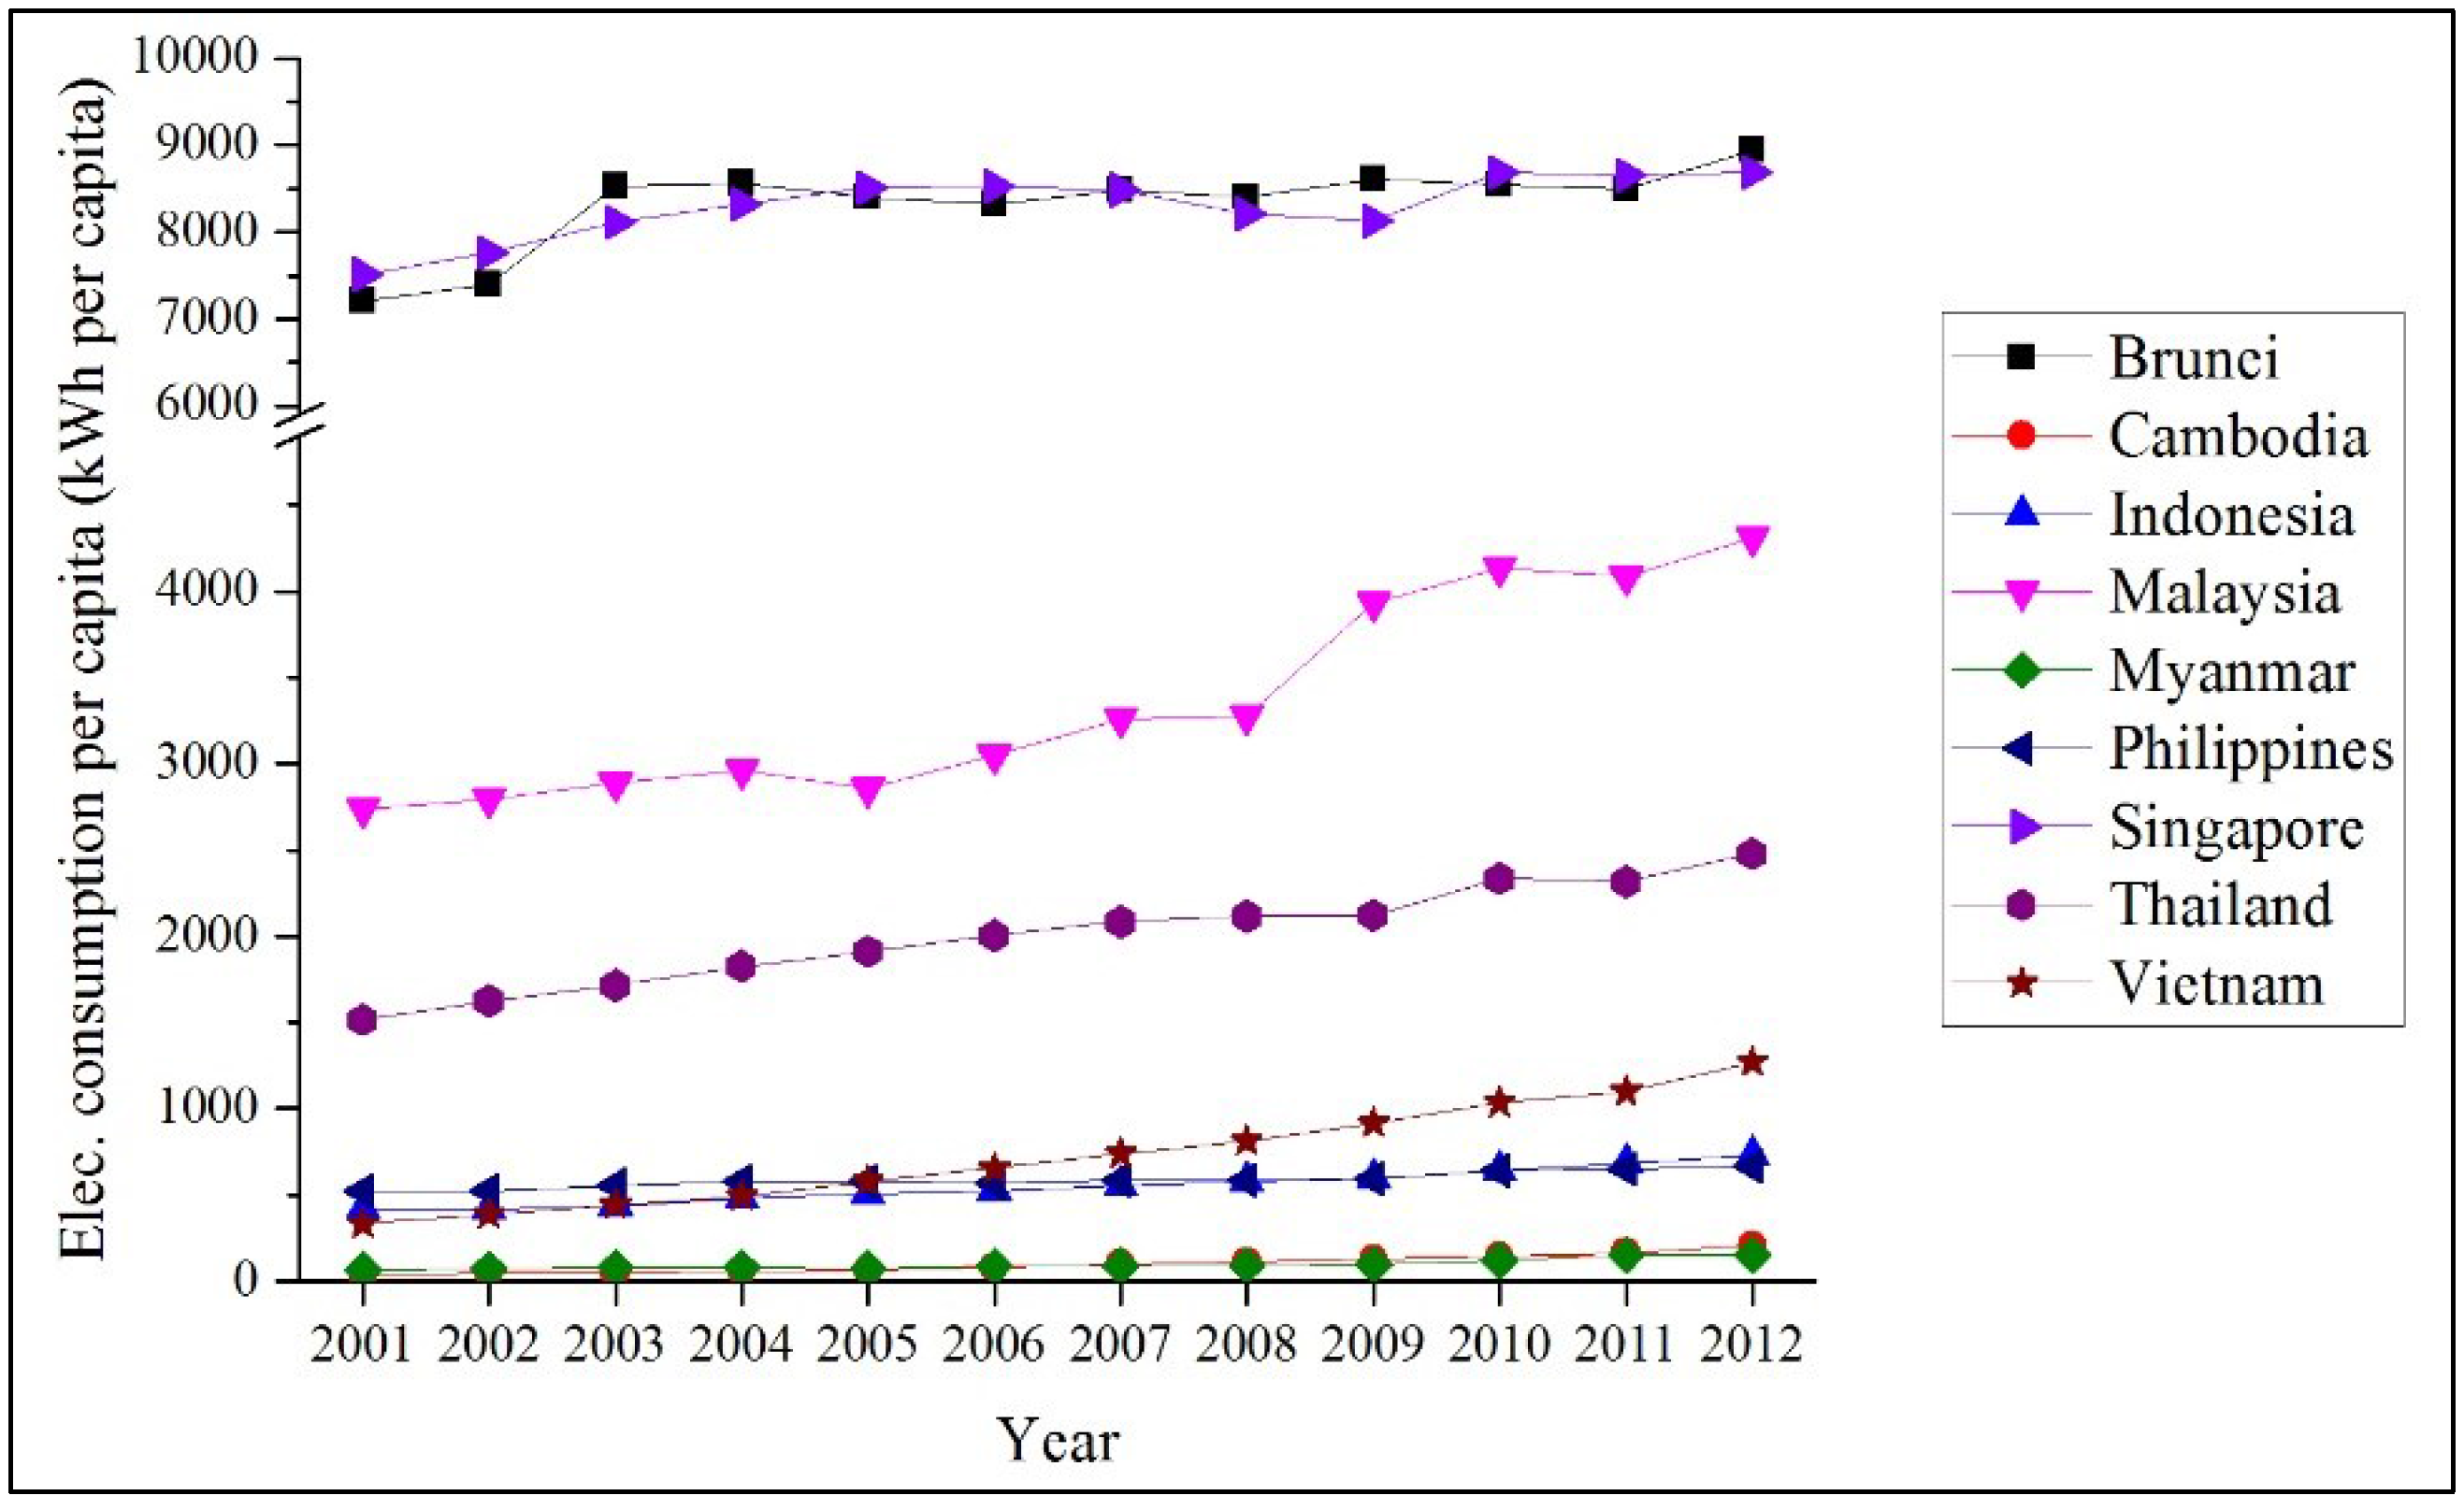
Although the gap between Brunei and Singapore versus the rest of the ASEAN countries is rather noticeable, there has been consistent growth in Indonesia, Malaysia, Thailand, and Vietnam. However, countries with significantly low energy supply and consumption per capita are Cambodia, Myanmar, and the Philippines (see zoomed-in Figure 25 and Figure 26 on the right), the three countries that are considered to be the least developed countries of the ASEAN members [50]. Electricity consumption per capita of all the countries is on a positive track (see Figure 27), which indicates not only the improvement in the power sector but also the successful implementation of electricity development. Drastic growth can be found in Vietnam, Cambodia, and Myanmar, while the rest of the countries are rather constant. Electricity consumption per capita of the ASEAN countries is also separated into four groups: the highest (Brunei and Singapore), the middle (Malaysia and Thailand), the lower middle (Indonesia, the Philippines, and Vietnam), and the lowest (Cambodia and Myanmar).
Figure 27. Electricity consumption per capita.
Socsci 04 01269 g027
As mentioned in the previous section, the per capita indicator is highly contextual. While an increase in the indicators suggests an expanding energy economy and minimal change reflects limited performance in national energy developments, the decrease could imply improved energy efficiency and conservation, provided that the energy development of the country has reached its peak. The overall trends of PES per capita and the total final energy consumption (TFC) per capita for almost all ASEAN countries are heading towards higher energy demand and higher energy consumption. The Philippines is the only ASEAN country with a relatively low primary energy supply and final consumption per capita. Given that the country is considered a lower-middle-income country [50], the decrease could result from development challenges caused by geographical conditions (the Philippines is a distributed and mountainous island country), which lead to a high cost of energy infrastructure development and rural electrification [57]. Similar to the Philippines, Indonesia, which is also classified as a lower-middle-income country [50] and is an island country with many distributed islands, has a low electrification rate and low electricity consumption per capita, despite the fact that the country has ample energy resources.

3.2.3. Energy Intensity Indicators

Energy intensity highlights the efficient use of energy for monetary productivity by representing how much energy use is spent for a unit of GDP. While a higher value of energy supply and use per capita implies a lower efficiency, for the energy intensity indicator, a lower value of energy intensity means a higher energy efficiency. Still, it should be noted that the intensity indicators of primary energy, energy consumption, and electricity are subjected to various dynamics shaping how a country performs in terms of GDP, so the result could be less relevant in certain cases.
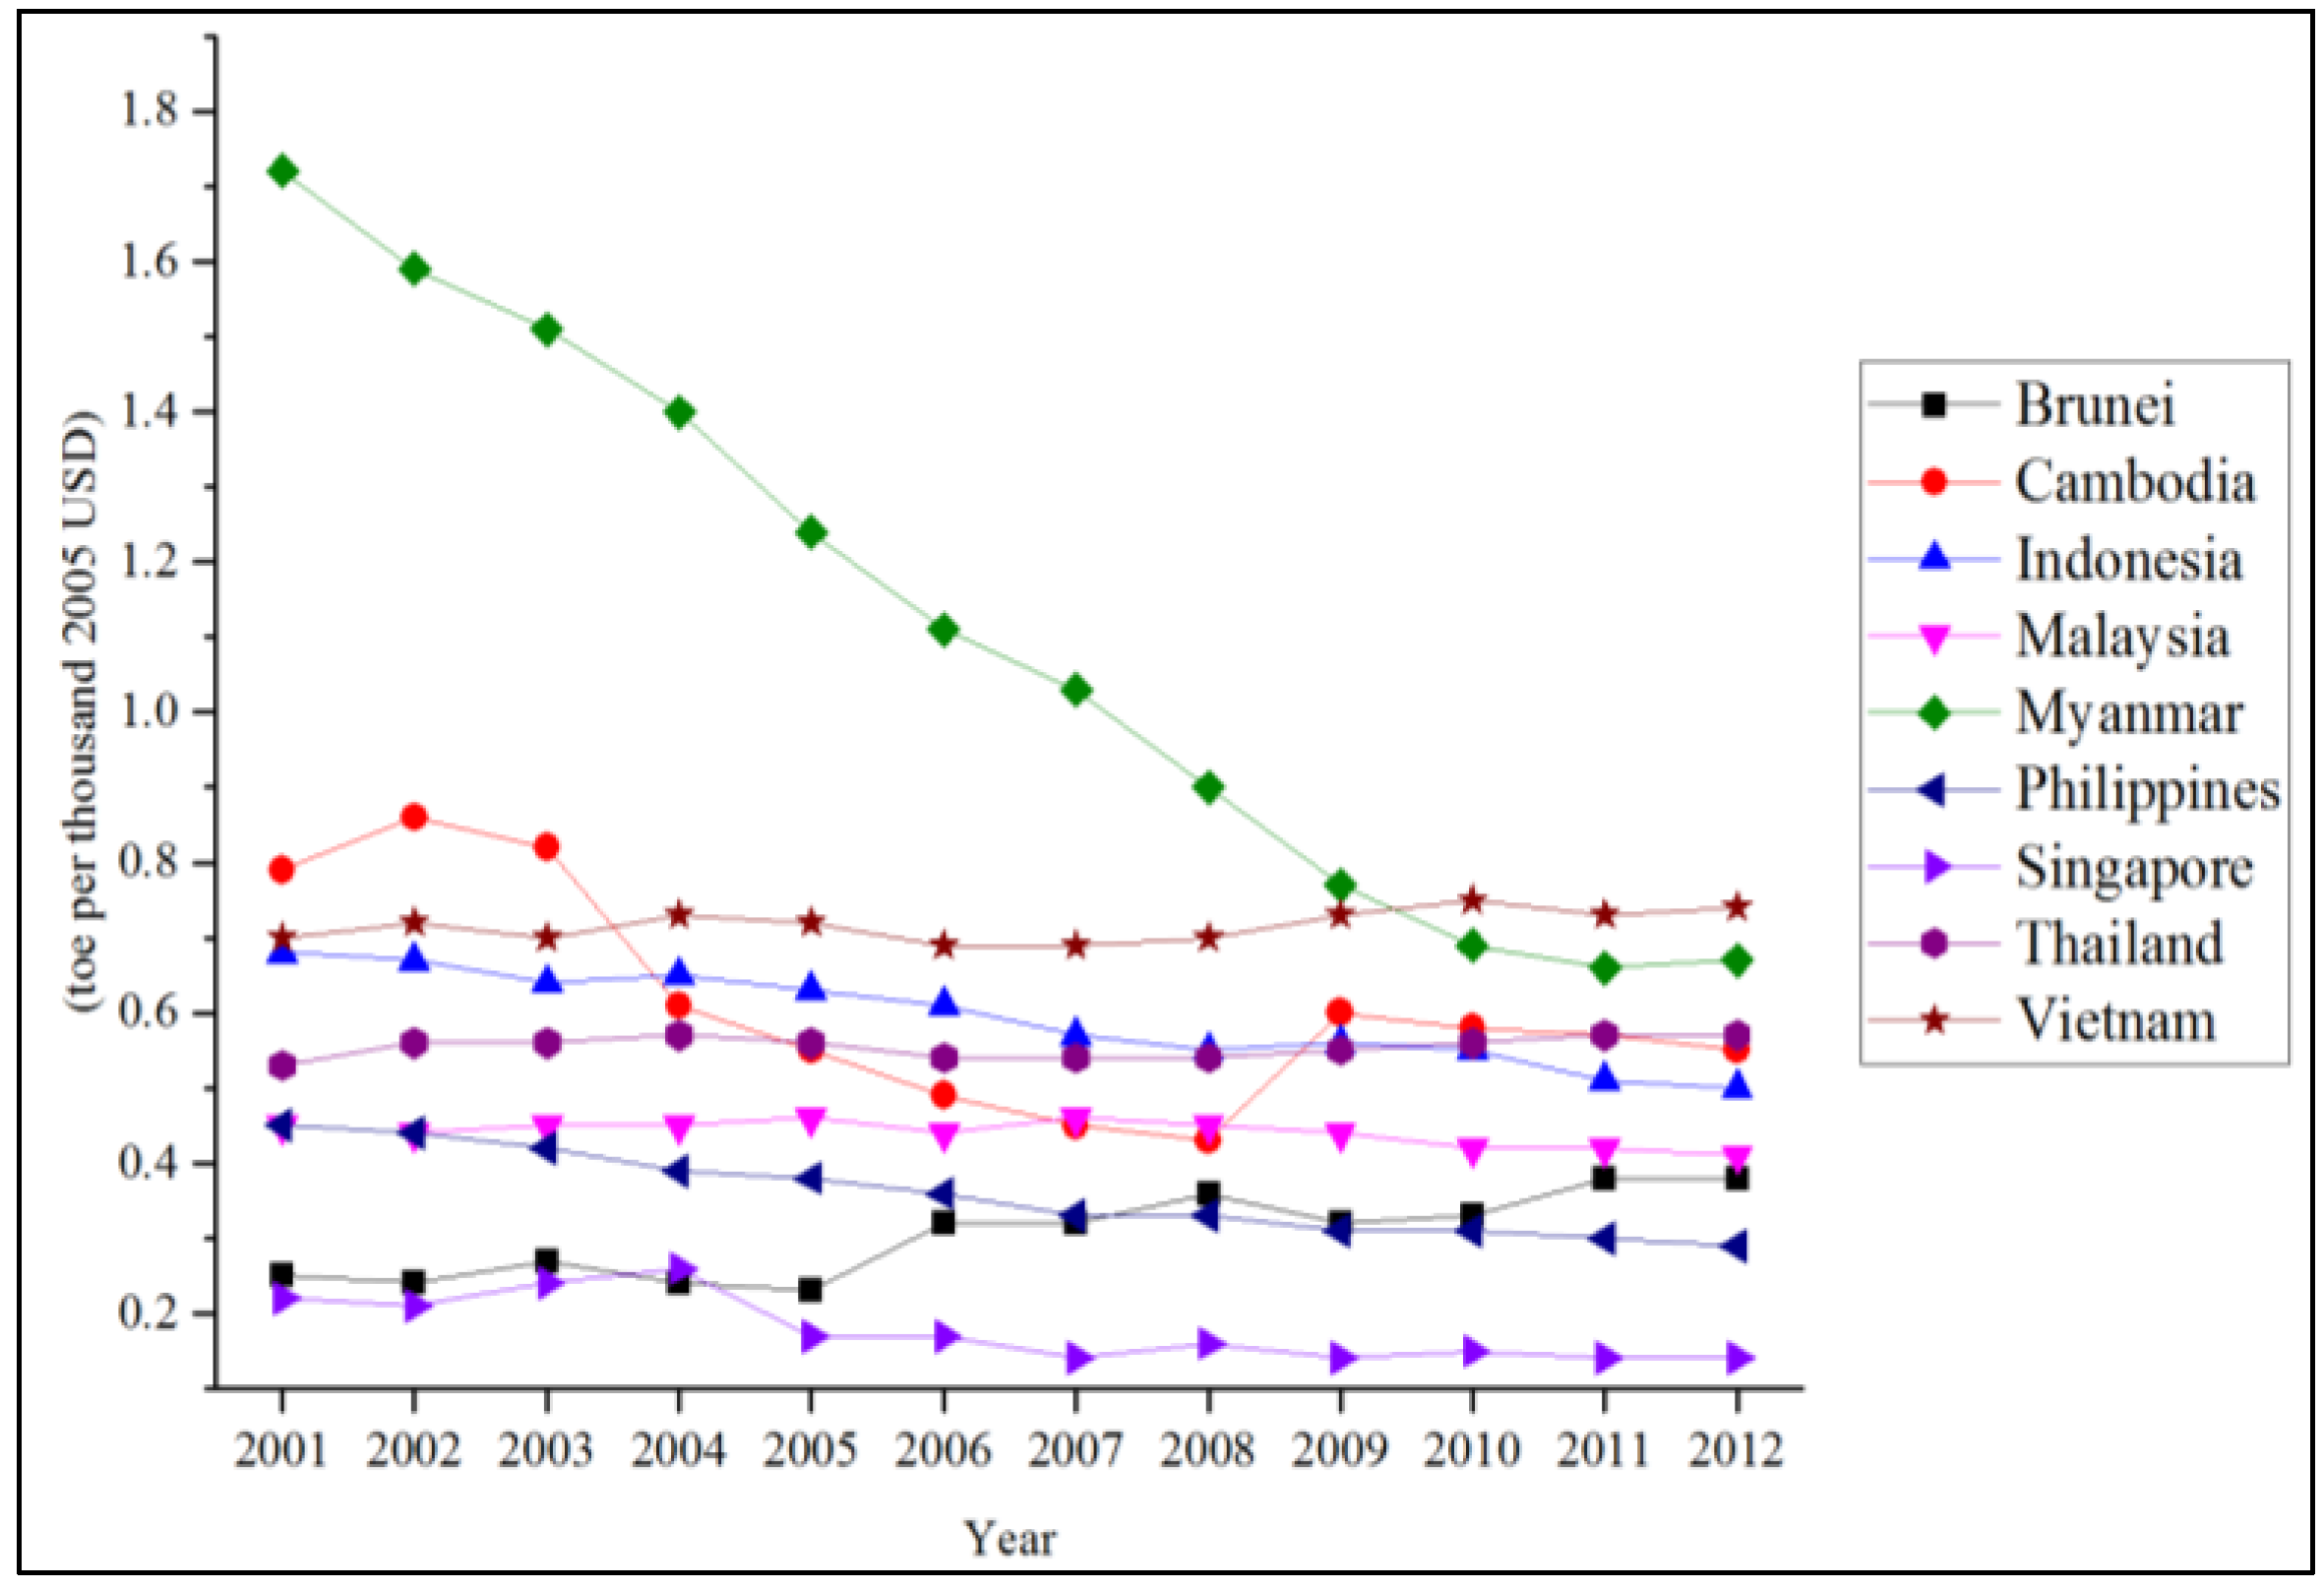
In Figure 28, the primary energy intensities of most countries are not on the declining track, with the exception of Singapore. While the results are rather scattered, Myanmar’s energy intensity continued to fall before reaching a plateau in 2011. However, some discrepancies can be found in the case of Brunei and Cambodia, in which the changes in PES intensity do not actually reflect changes in energy efficiency, but merely the result of the fluctuations in GDP and change in energy production. For Brunei, it was because the country increased production output. For Cambodia, there was a drastic decrease in primary energy balances between 2004 and 2008. As of 2012, the country with the highest primary energy intensity is Myanmar, followed by Vietnam and Indonesia, while those with the lowest results include Singapore, Brunei, and the Philippines.
Figure 28. Energy intensity (2001–2012).
Socsci 04 01269 g028
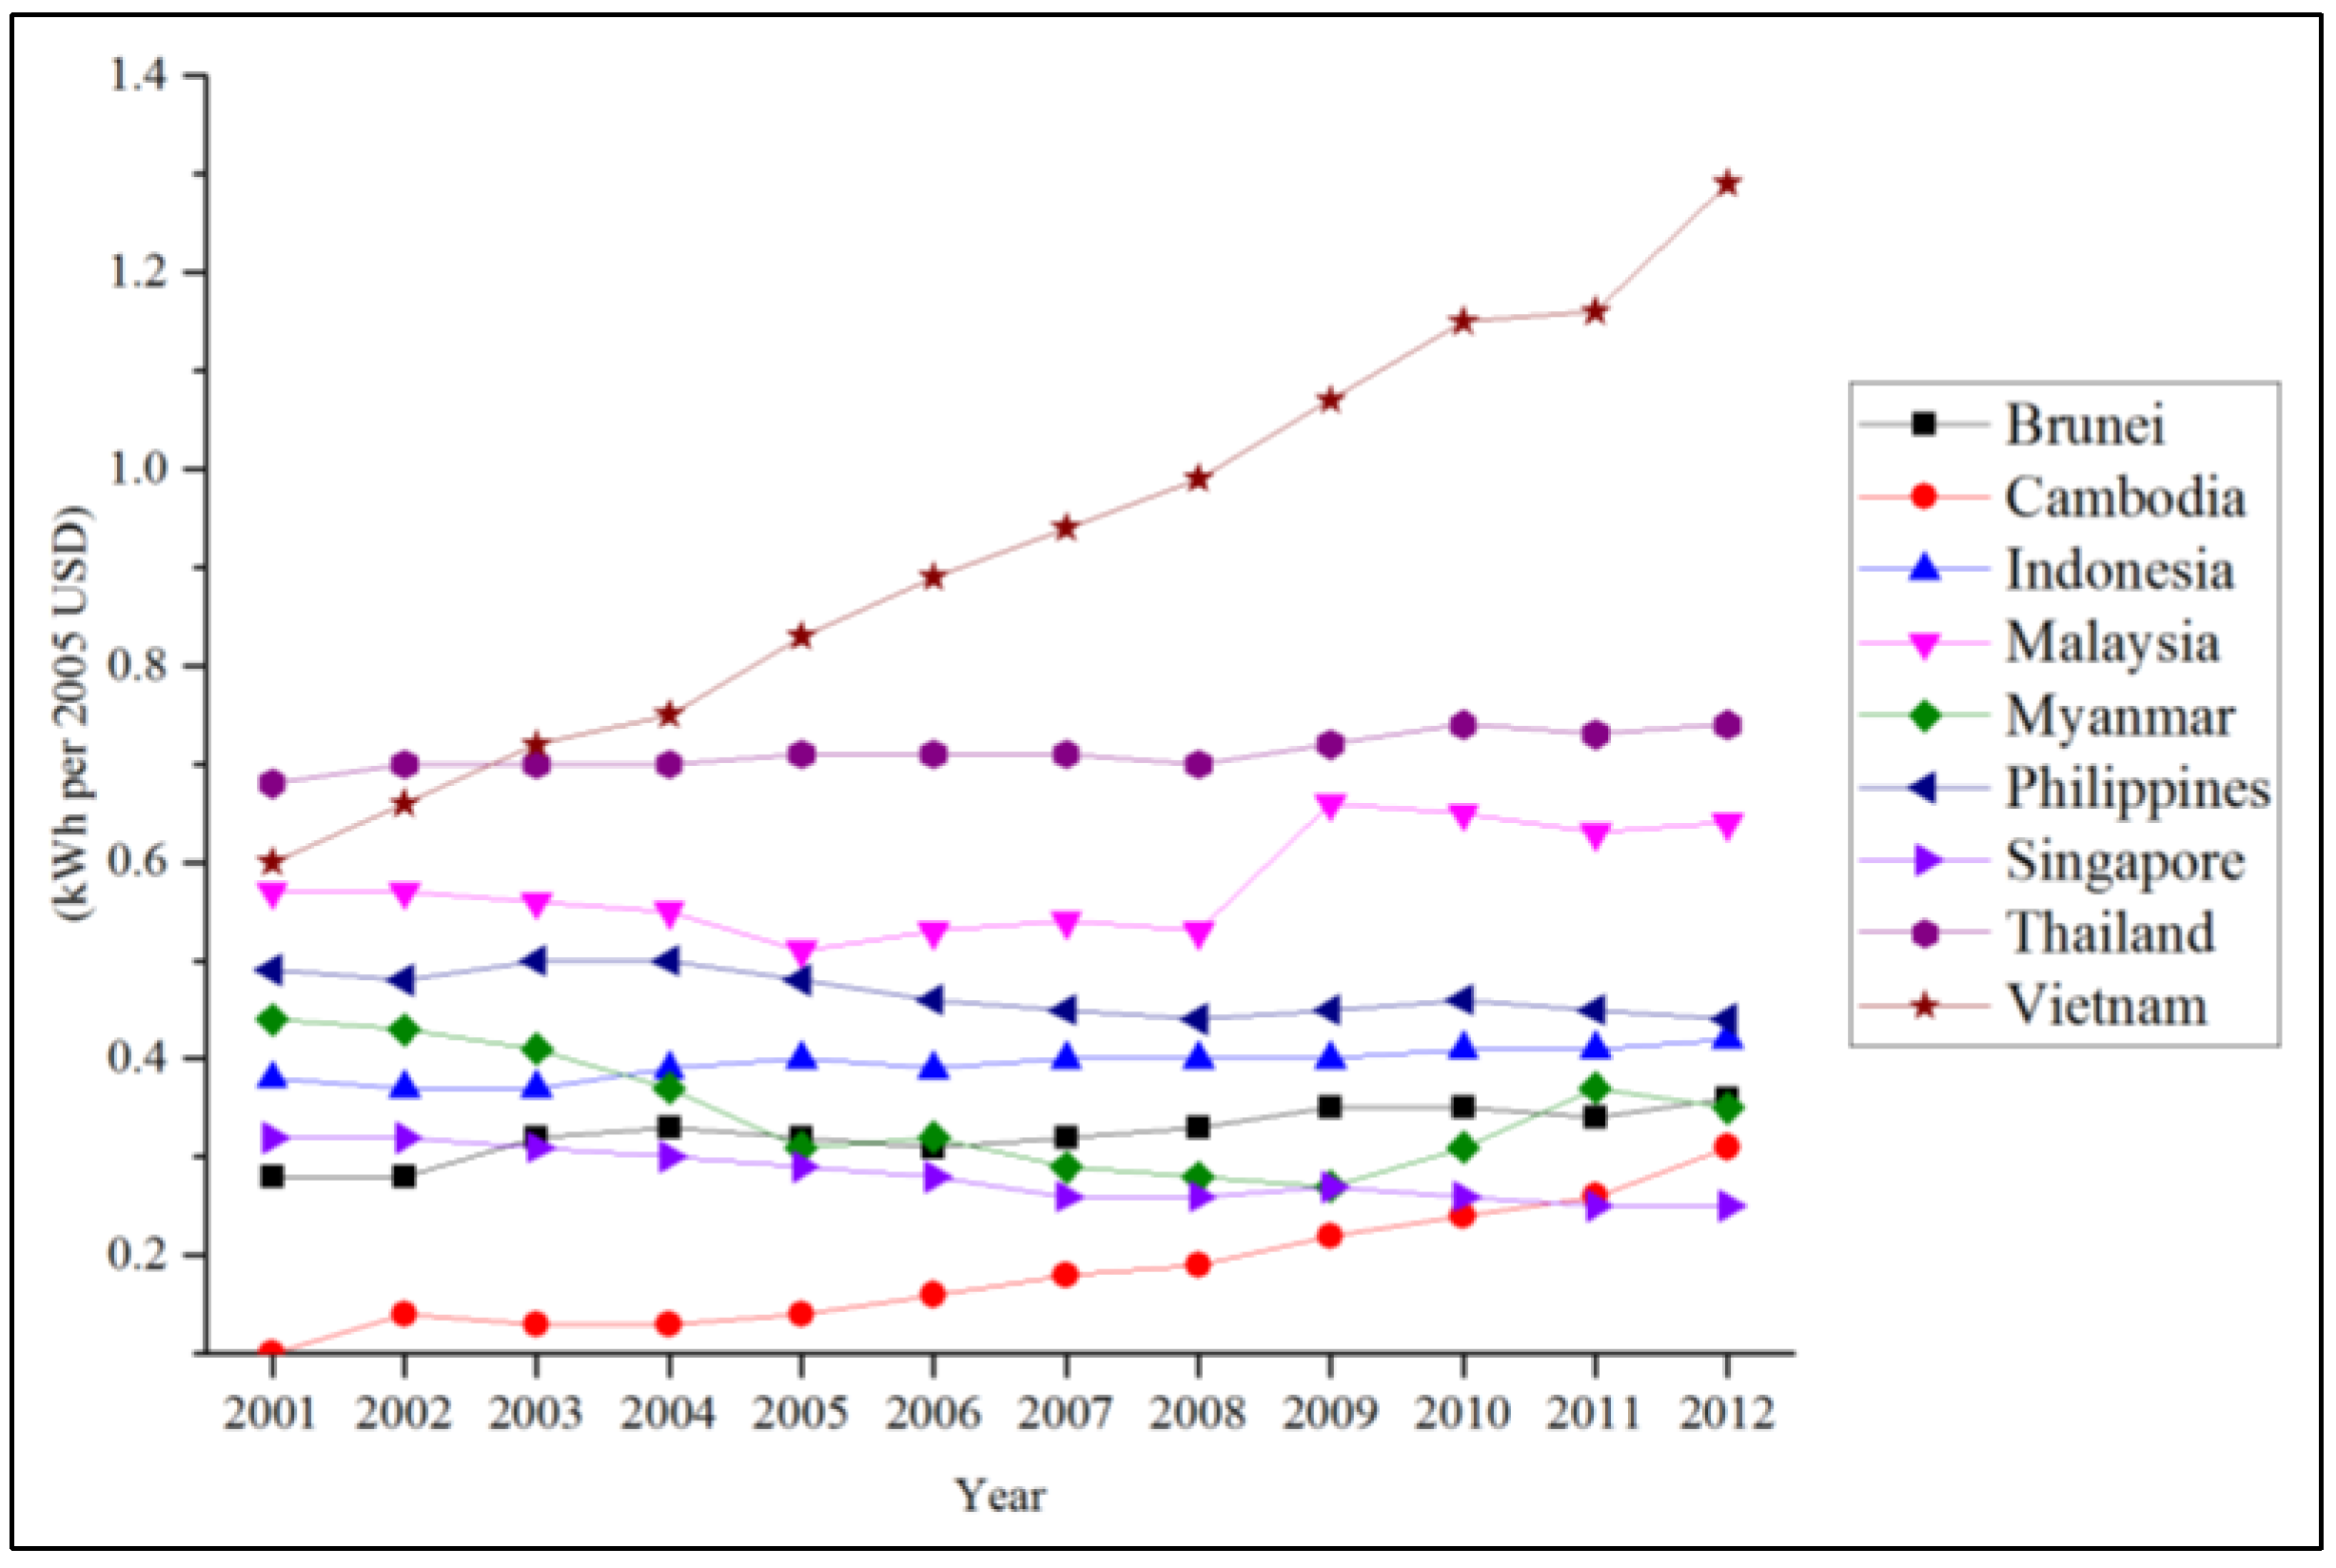
Unlike primary energy intensity or the intensity of final energy consumption, the electricity intensity of ASEAN countries, shown in Figure 29, is rather disparate. Vietnam, Cambodia, and Malaysia are countries with drastic positive growths while Myanmar, the Philippines, and Singapore are the ones with gradually decreasing values. The electricity intensity of Indonesia and Thailand is rather steady. Referring back to access the electricity results, the increase in the electricity intensity of Cambodia is clearly the result of the national electrification development plan. In comparison, Vietnam has the highest and vastest range of electricity intensity, followed by Thailand, Malaysia, and the Philippines.
Figure 29. Electricity intensity (2001–2012).
Socsci 04 01269 g029
For this component, the gap of energy development and performance among the ASEAN member nations is emphasized, as there is a clear difference between countries struggling to pursue modern energy services and countries with a well-developed energy sector.

3.3. Domestic Energy Resources

3.3.1. Energy Self-Sufficiency

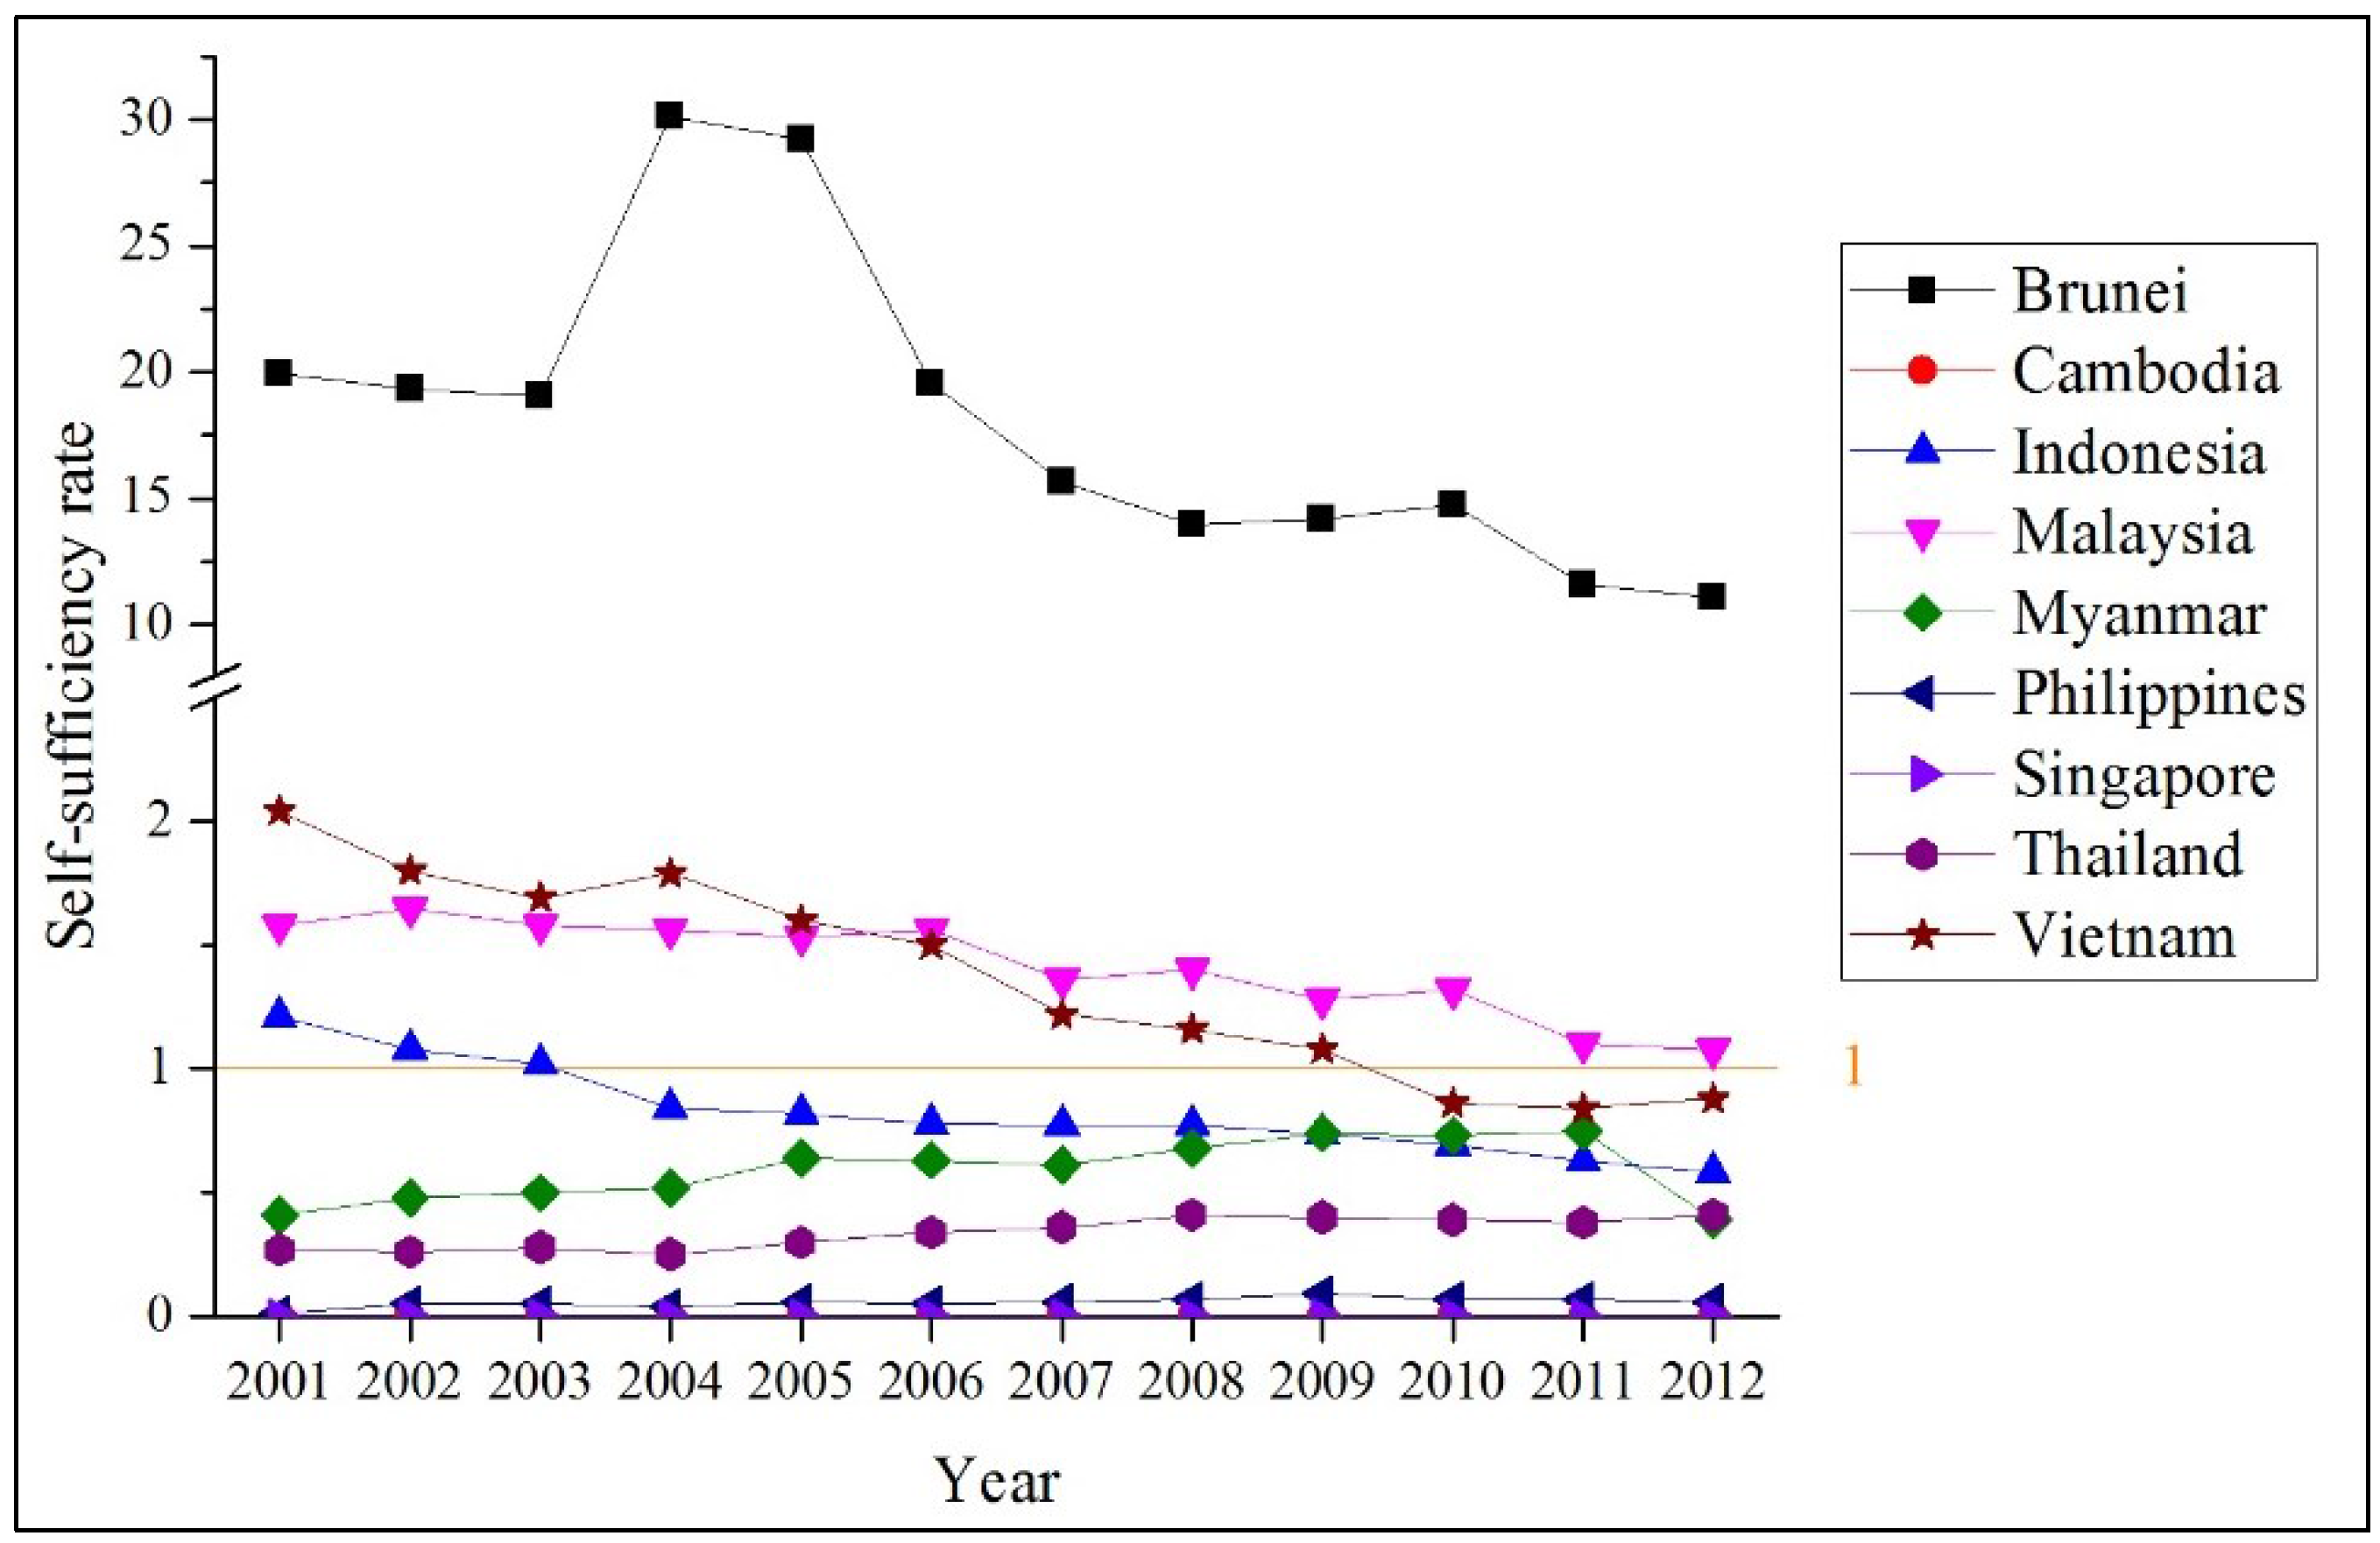
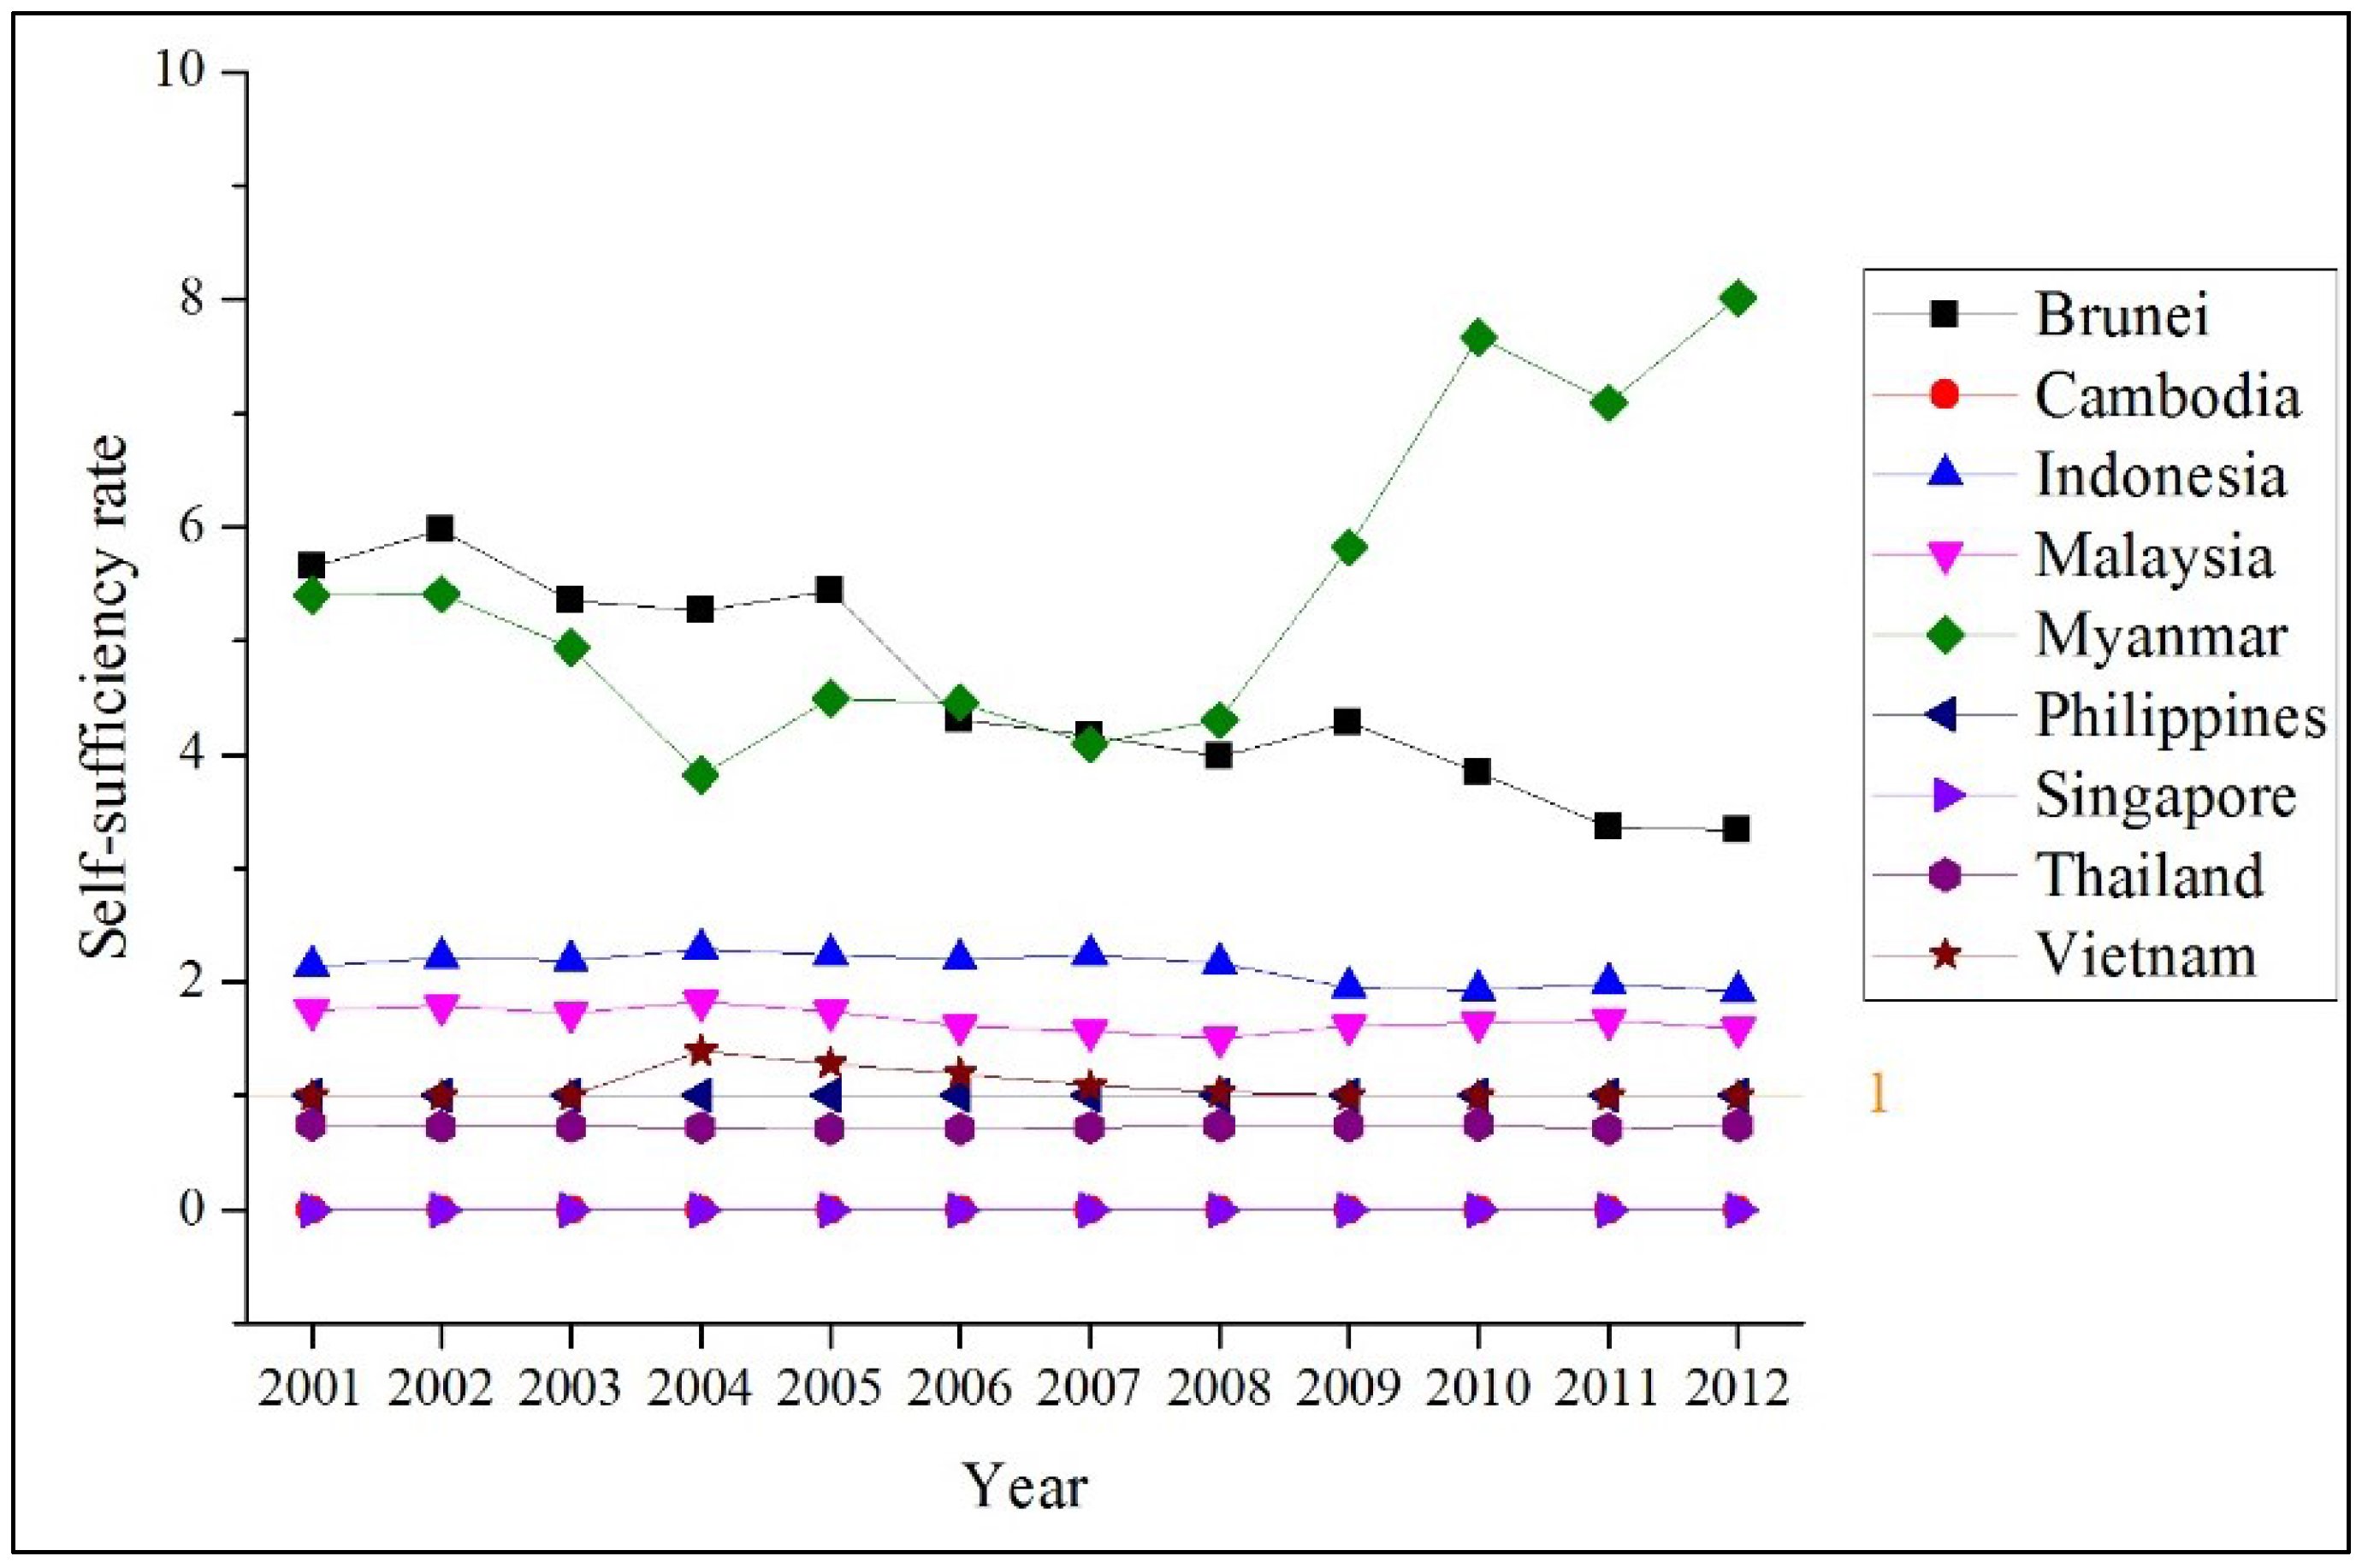
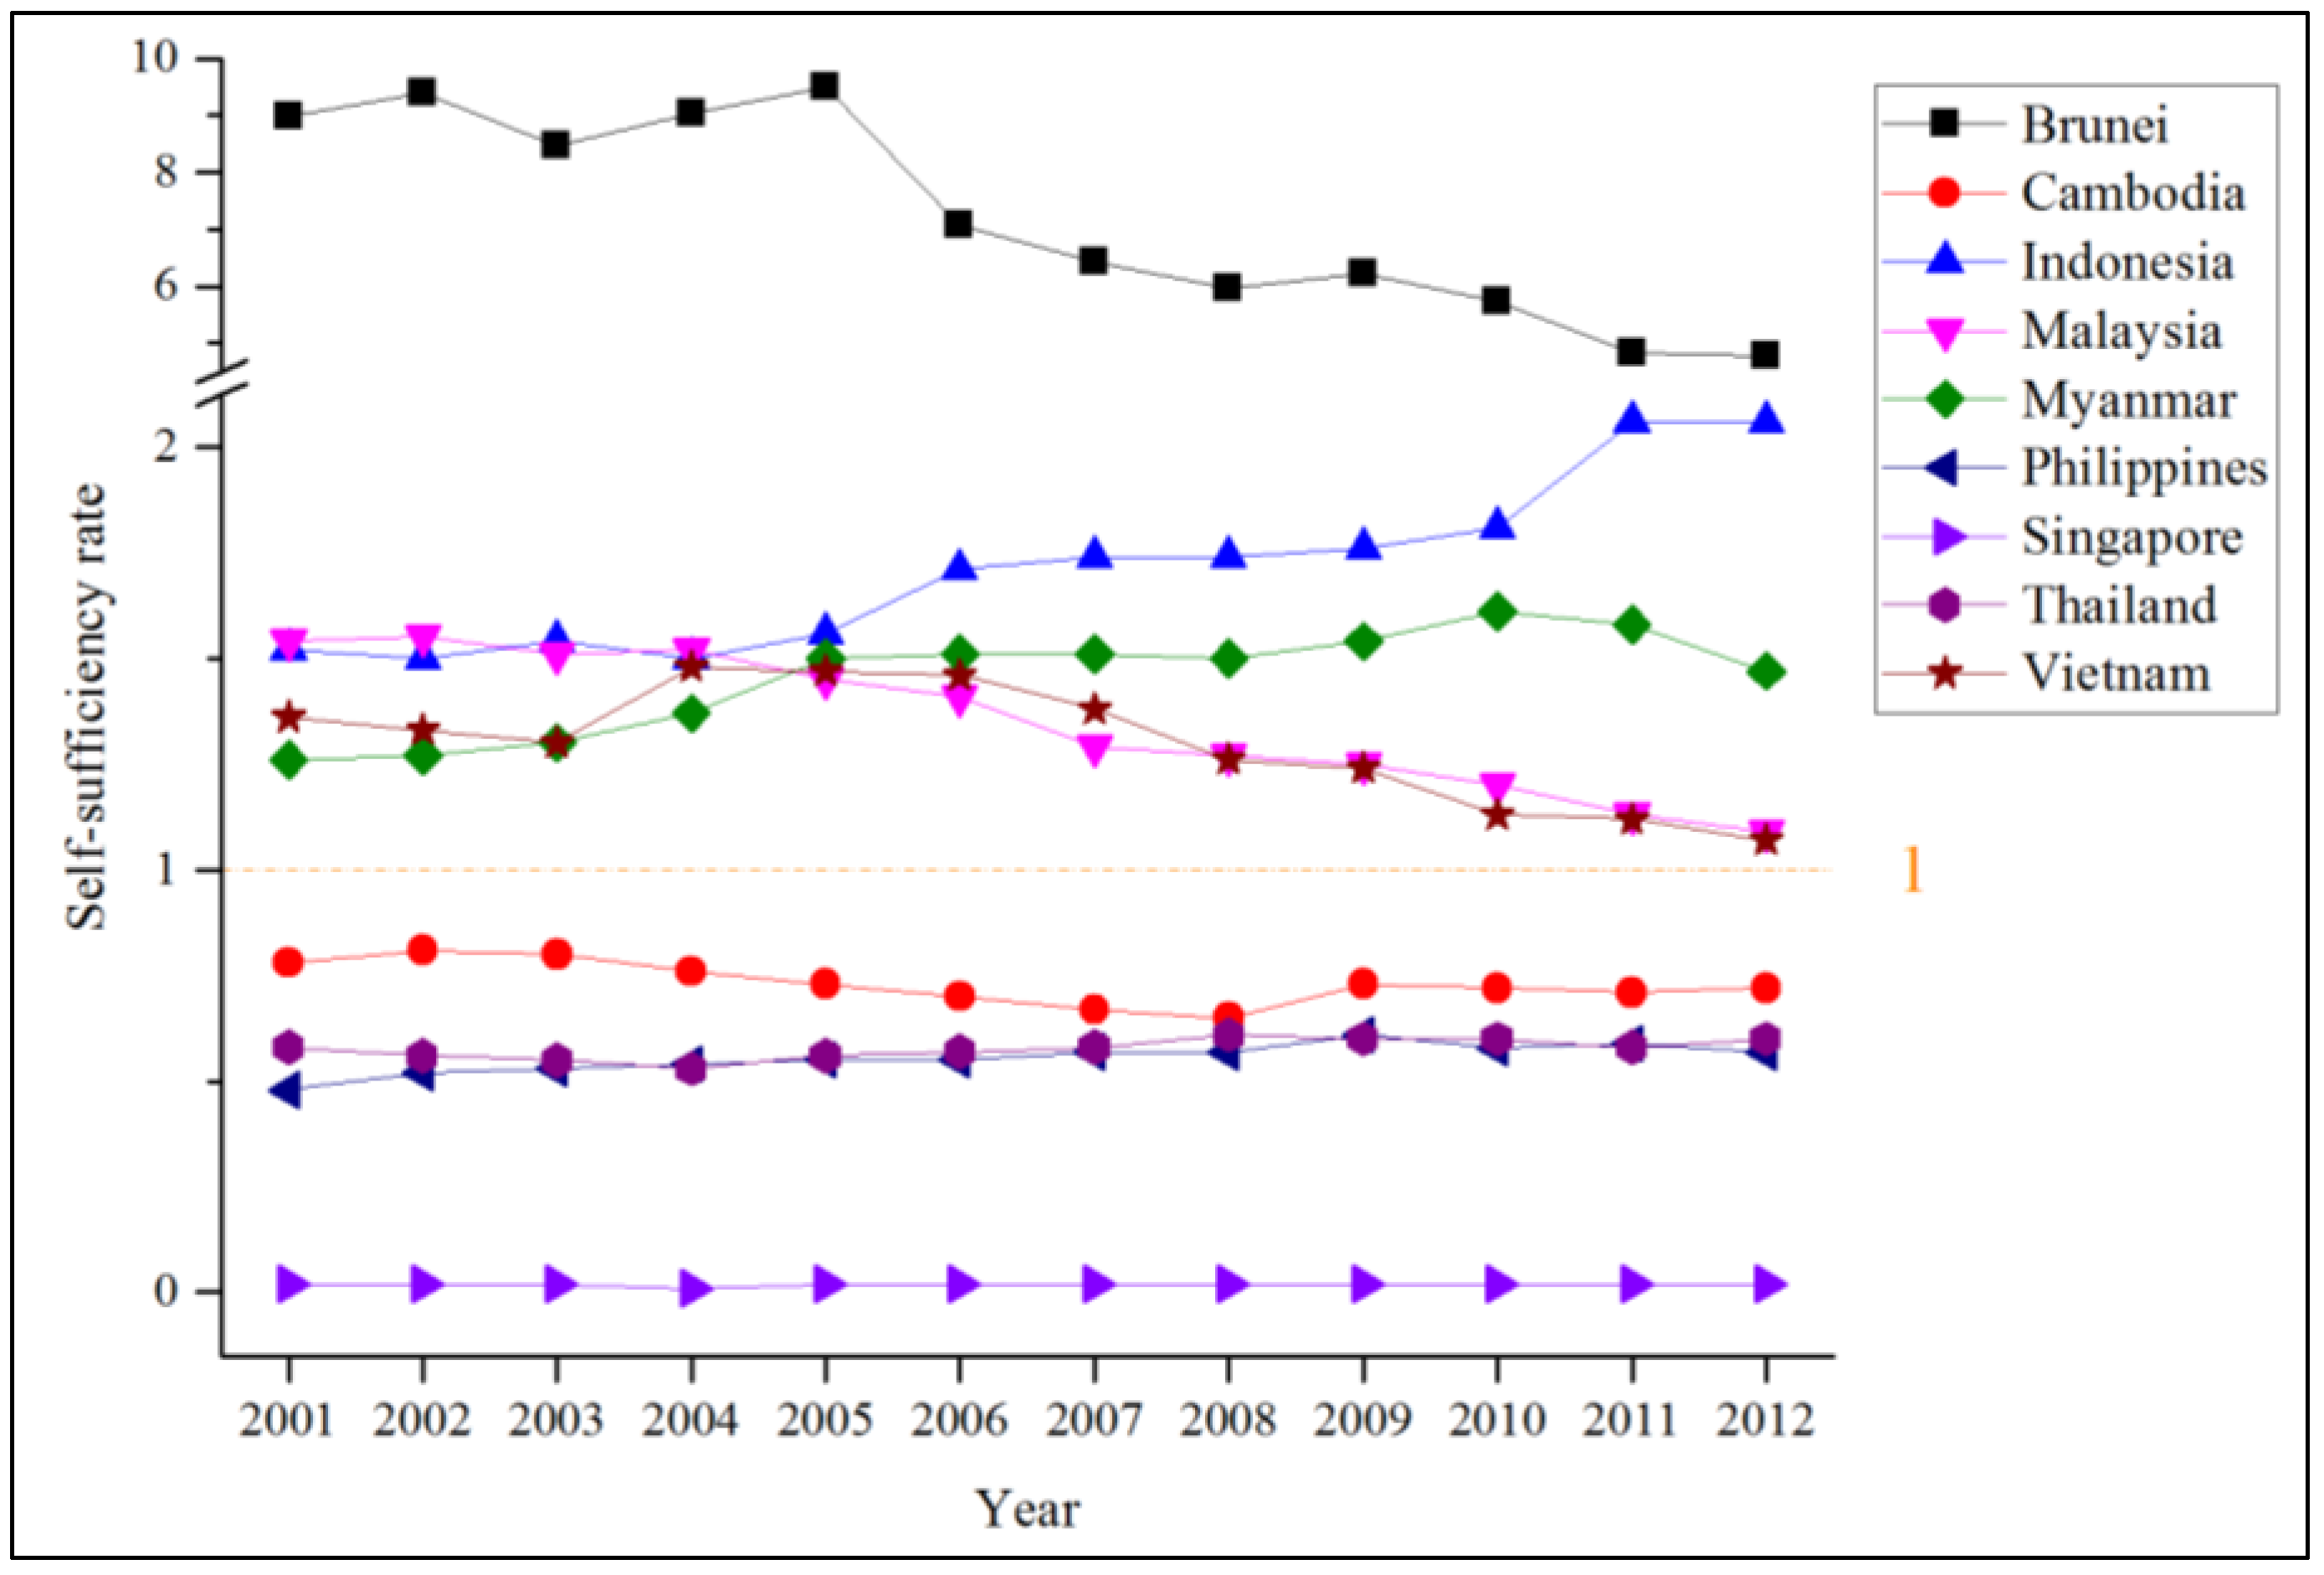
The self-sufficiency (SS) rate reflects the capability of the country to meet its own energy needs based on indigenous energy production. Figure 30, Figure 31 and Figure 32 show self-sufficiency rates of ASEAN countries categorized by energy source (coal, crude oil, and natural gas) between 2001 and 2012.
Starting with coal (see Figure 30), its self-sufficiency rates are remarkably high for Indonesia and Vietnam since they are both coal exporters. The production, thus, is not only required to meet domestic but also external demands. Indonesia also has the widest range of coal self-sufficiency rates, ranging from the maximum of 9.15 (as of 2011) to the minimum of 3.73 (as of 2001). Myanmar, in contrast, has a coal self-sufficiency rate of 1, meaning the country can support 100% of its domestic demand; its production also exceeded domestic demands in 2012. Coal production of Malaysia, the Philippines, and Thailand can partially (less than half) meet their demands. Brunei, Cambodia, and Singapore have no domestic coal production. However, there are some policy initiatives regarding coal exploration in both Brunei and Cambodia [47,58].
Figure 30. Coal self-sufficiency between 2001 and 2012.
Socsci 04 01269 g030
Compared to coal, more ASEAN countries have better crude oil self-sufficiency (see Figure 31). As one of the major crude oil exporters in the region, Brunei has the highest crude oil self-sufficiency with the maximum of 30.08 (as of 2004). Following Brunei, Vietnam has the second-highest crude oil self-sufficiency, while Malaysia is third. However, it is indispensable to highlight that Vietnam has a relatively smaller amount of crude oil production compared to Malaysia. Indonesia, a former oil exporter, has domestic crude oil resources available to cover approximately two-thirds of the demand. Myanmar domestic crude oil production can meet more than half of its crude oil use whereas Thailand can meet one-third of its crude oil demand based on domestic production. Meanwhile, Cambodia and Singapore have no domestic crude oil production, so the self-sufficiency rate is at zero, while less than 10% of the Philippines’ crude oil supply is indigenous.
Figure 31. Crude oil self-sufficiency between 2001 and 2012.
Socsci 04 01269 g031
Referring to natural gas self-sufficiency (Figure 32), Myanmar holds the highest self-sufficiency rate with an average of 5.45, followed by Brunei (4.58), Indonesia (2.12), and Malaysia (1.67). Vietnam also has a self-sufficiency rate of more than 1, implying the surplus of natural gas, whereas all of the Philippines’ gas demand is based on domestic production. On the other hand, Thailand’s domestic natural gas production only meets approximately 72% of the demand. Cambodia and Singapore have a natural gas self-sufficiency rate of zero. However, it should be noted that Cambodia has not yet developed a concrete plan in acquiring its own energy resources. The country currently utilizes traditional biomass and imports other needed energy supply, but it has potentially significant reserves of crude oil and natural gas, which could contribute to the improvement of its energy self-reliance [59]. With regards to renewable energy, there is no overall energy self-sufficiency at the rate of absolute zero since renewables are indigenous. As mentioned, 74% of the domestic energy production of Cambodia is from traditional biomass. Singapore’s 2% of domestic energy supply is from non-renewable municipal waste.
Figure 32. Natural gas self-sufficiency between 2001 and 2012.
Socsci 04 01269 g032
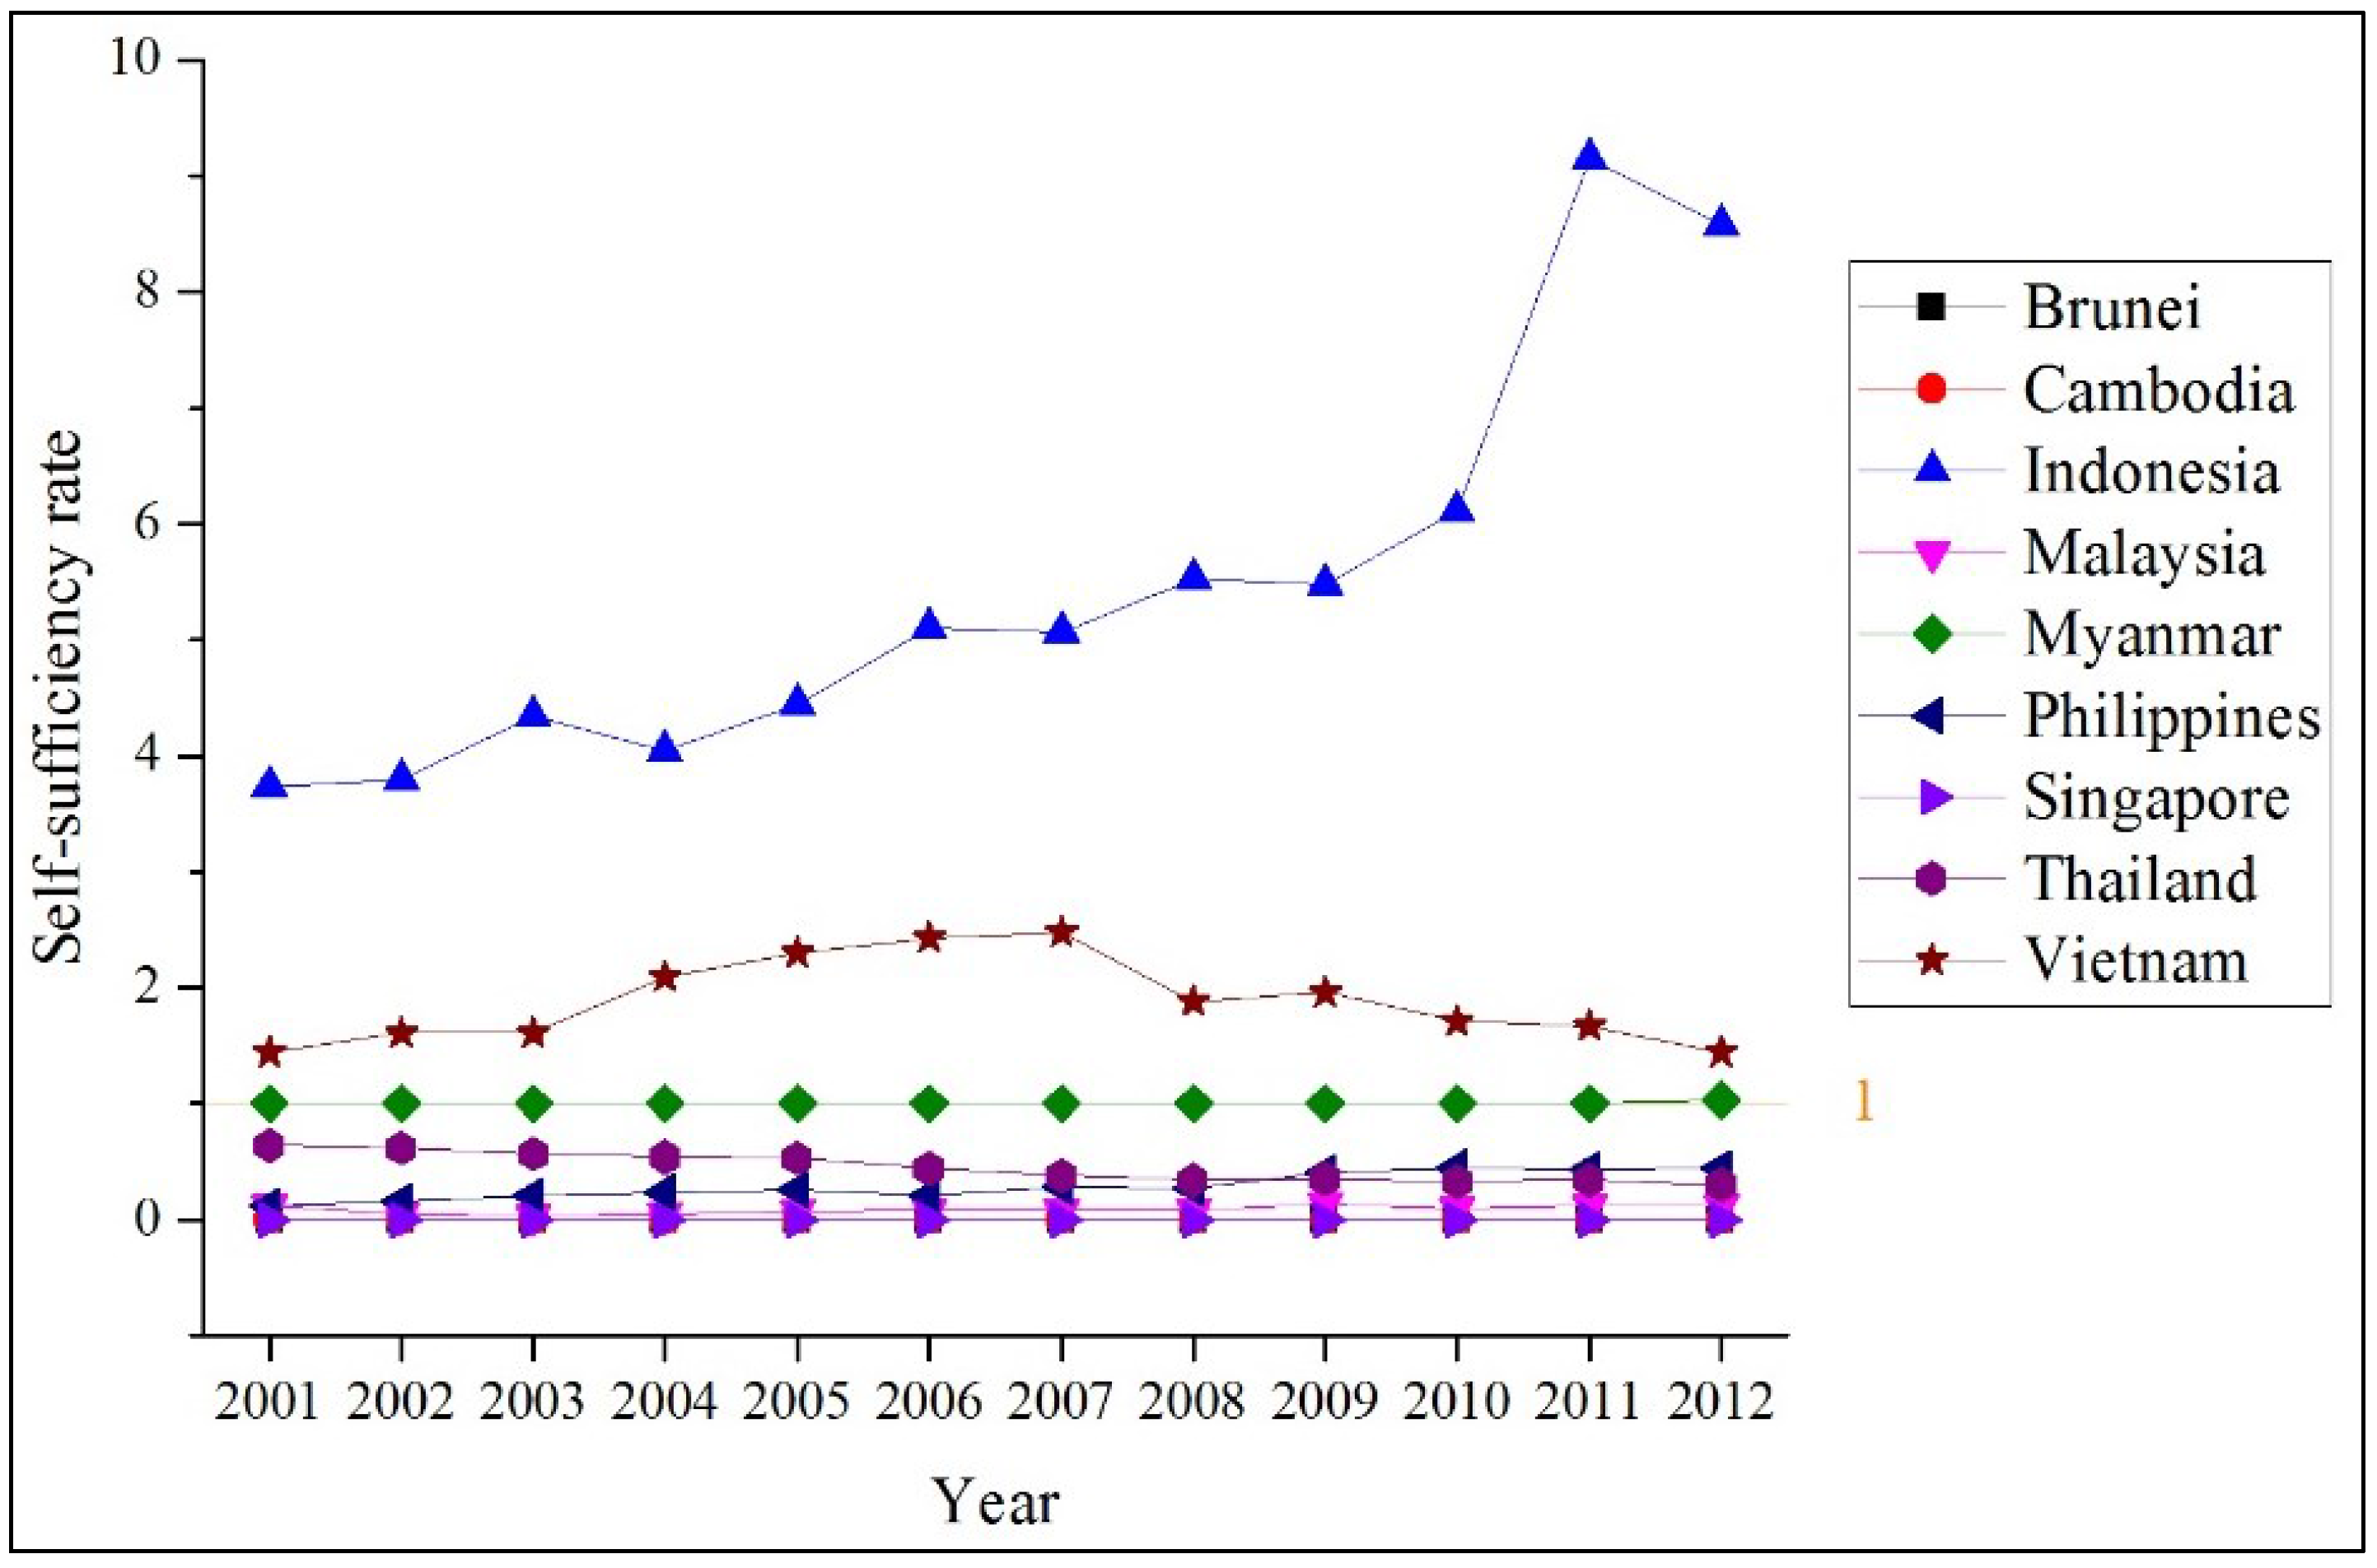
Figure 33 shows self-sufficiency trends between 2001 and 2012. Marked at the value of 1, ASEAN countries are divided into energy exporters Brunei, Indonesia, Malaysia, Myanmar, and Vietnam, and energy importers Cambodia, the Philippines, Singapore, and Thailand. Countries with remarkably improved self-sufficiency are Indonesia and Myanmar, due mainly to increased domestic production from renewable energy (Indonesia) and natural gas (Myanmar). Countries with consistently decreasing self-sufficiency values include Brunei, Cambodia, Malaysia and Vietnam due to lesser domestic production, particularly crude oil, and the declining share of renewable energy in the cases of Cambodia and Vietnam.
However, a higher self-sufficiency rate does not always infer better security of domestic supply. Compared to Singapore, Cambodia’s self-sufficiency rate is obviously higher. However, its energy consumption is based on traditional biomass that is, in fact, securely indigenous, but the question is its accessibility. The decrease in energy self-sufficiency simply refers to less domestic production, but it could also stem from an increased share of energy imports in the total primary energy supply as well.
Figure 33. Overall self-sufficiency rate.
Socsci 04 01269 g033

3.3.2. Reserves-to-Production Ratio

According to Table 3, the reserves-to-production Ratio (R/P ratio) shows a high potential of coal resources from the Philippines, Indonesia, and Thailand, but the high result may stem from the fact that the coal production of the two countries (except Indonesia) is very low. Vietnam, the Philippines, Brunei, and Malaysia have many years of crude oil reserves to meet the production demands. From the R/P ratio rate, natural gas poses as a promising energy resource for ASEAN members since seven countries out of nine have significant natural gas resources. Considered from the share in the primary energy mix, Thailand has begun to confront the decline of proven energy resources, particularly in crude oil and natural gas, while Singapore has continued to be a net-energy importing country with no domestic resources. Still, similar to the indicator of self-sufficiency, it should be noted that the R/P ratio rate is determined by the production rate. A higher R/P ratio does not guarantee richness of energy resources; it could simply be the result of a small production, but it does indicate resource availability.
Table 3. Reserves-to-production ratio.
CountryReserves-to-Production Ratio (Years)
CoalCrude OilNatural Gas
BNNA18.9722.92
KHNANANA
ID63.2711.1741.18
MY1.3114.9916.13
MM1.697.4822.24
PH39.522.6529.18
SG---
TH67.612.606.88
VN3.5834.6165.97
Note: “-” is used in Singapore to represent no available resources whereas NA in Brunei’s coal and Cambodia part refers to the lack of energy resource exploration data.

3.3.3. Refining Capacity

Indonesia, Singapore, and Thailand are considered the major refined oil exporters of ASEAN. According to the refinery capacity as of the year 2012, Indonesia could manage the refinery at 1.04 million barrels per day while Singapore is capable of refining at 1.38 million barrels per day. Thailand has the refining capacity of 1.26 million barrels per day.
For the domestic energy resource component, ASEAN countries are mixed with resource-rich and resource-poor countries. However, the assessment in this part covers only fossil fuels. The utilization of renewable energy resources, which are completely domestic (if excluding commodity imports), should be also included.

3.4. Overseas Energy Resources and External Demands

This part assesses the vulnerability of overseas energy resources and external energy demands based on openness to the international energy market, reliance on the imported resources, the share of energy export in domestic production, and geographical dimension of energy dependency. Vulnerability stemming from foreign energy resources involves transportation risk. Resource transportation from other regions must pass through several chokepoints that have certain impacts on the security of the imports. Here, two geographical locations were selected including the Middle East and intra-ASEAN.

3.4.1. Energy Trade per GDP

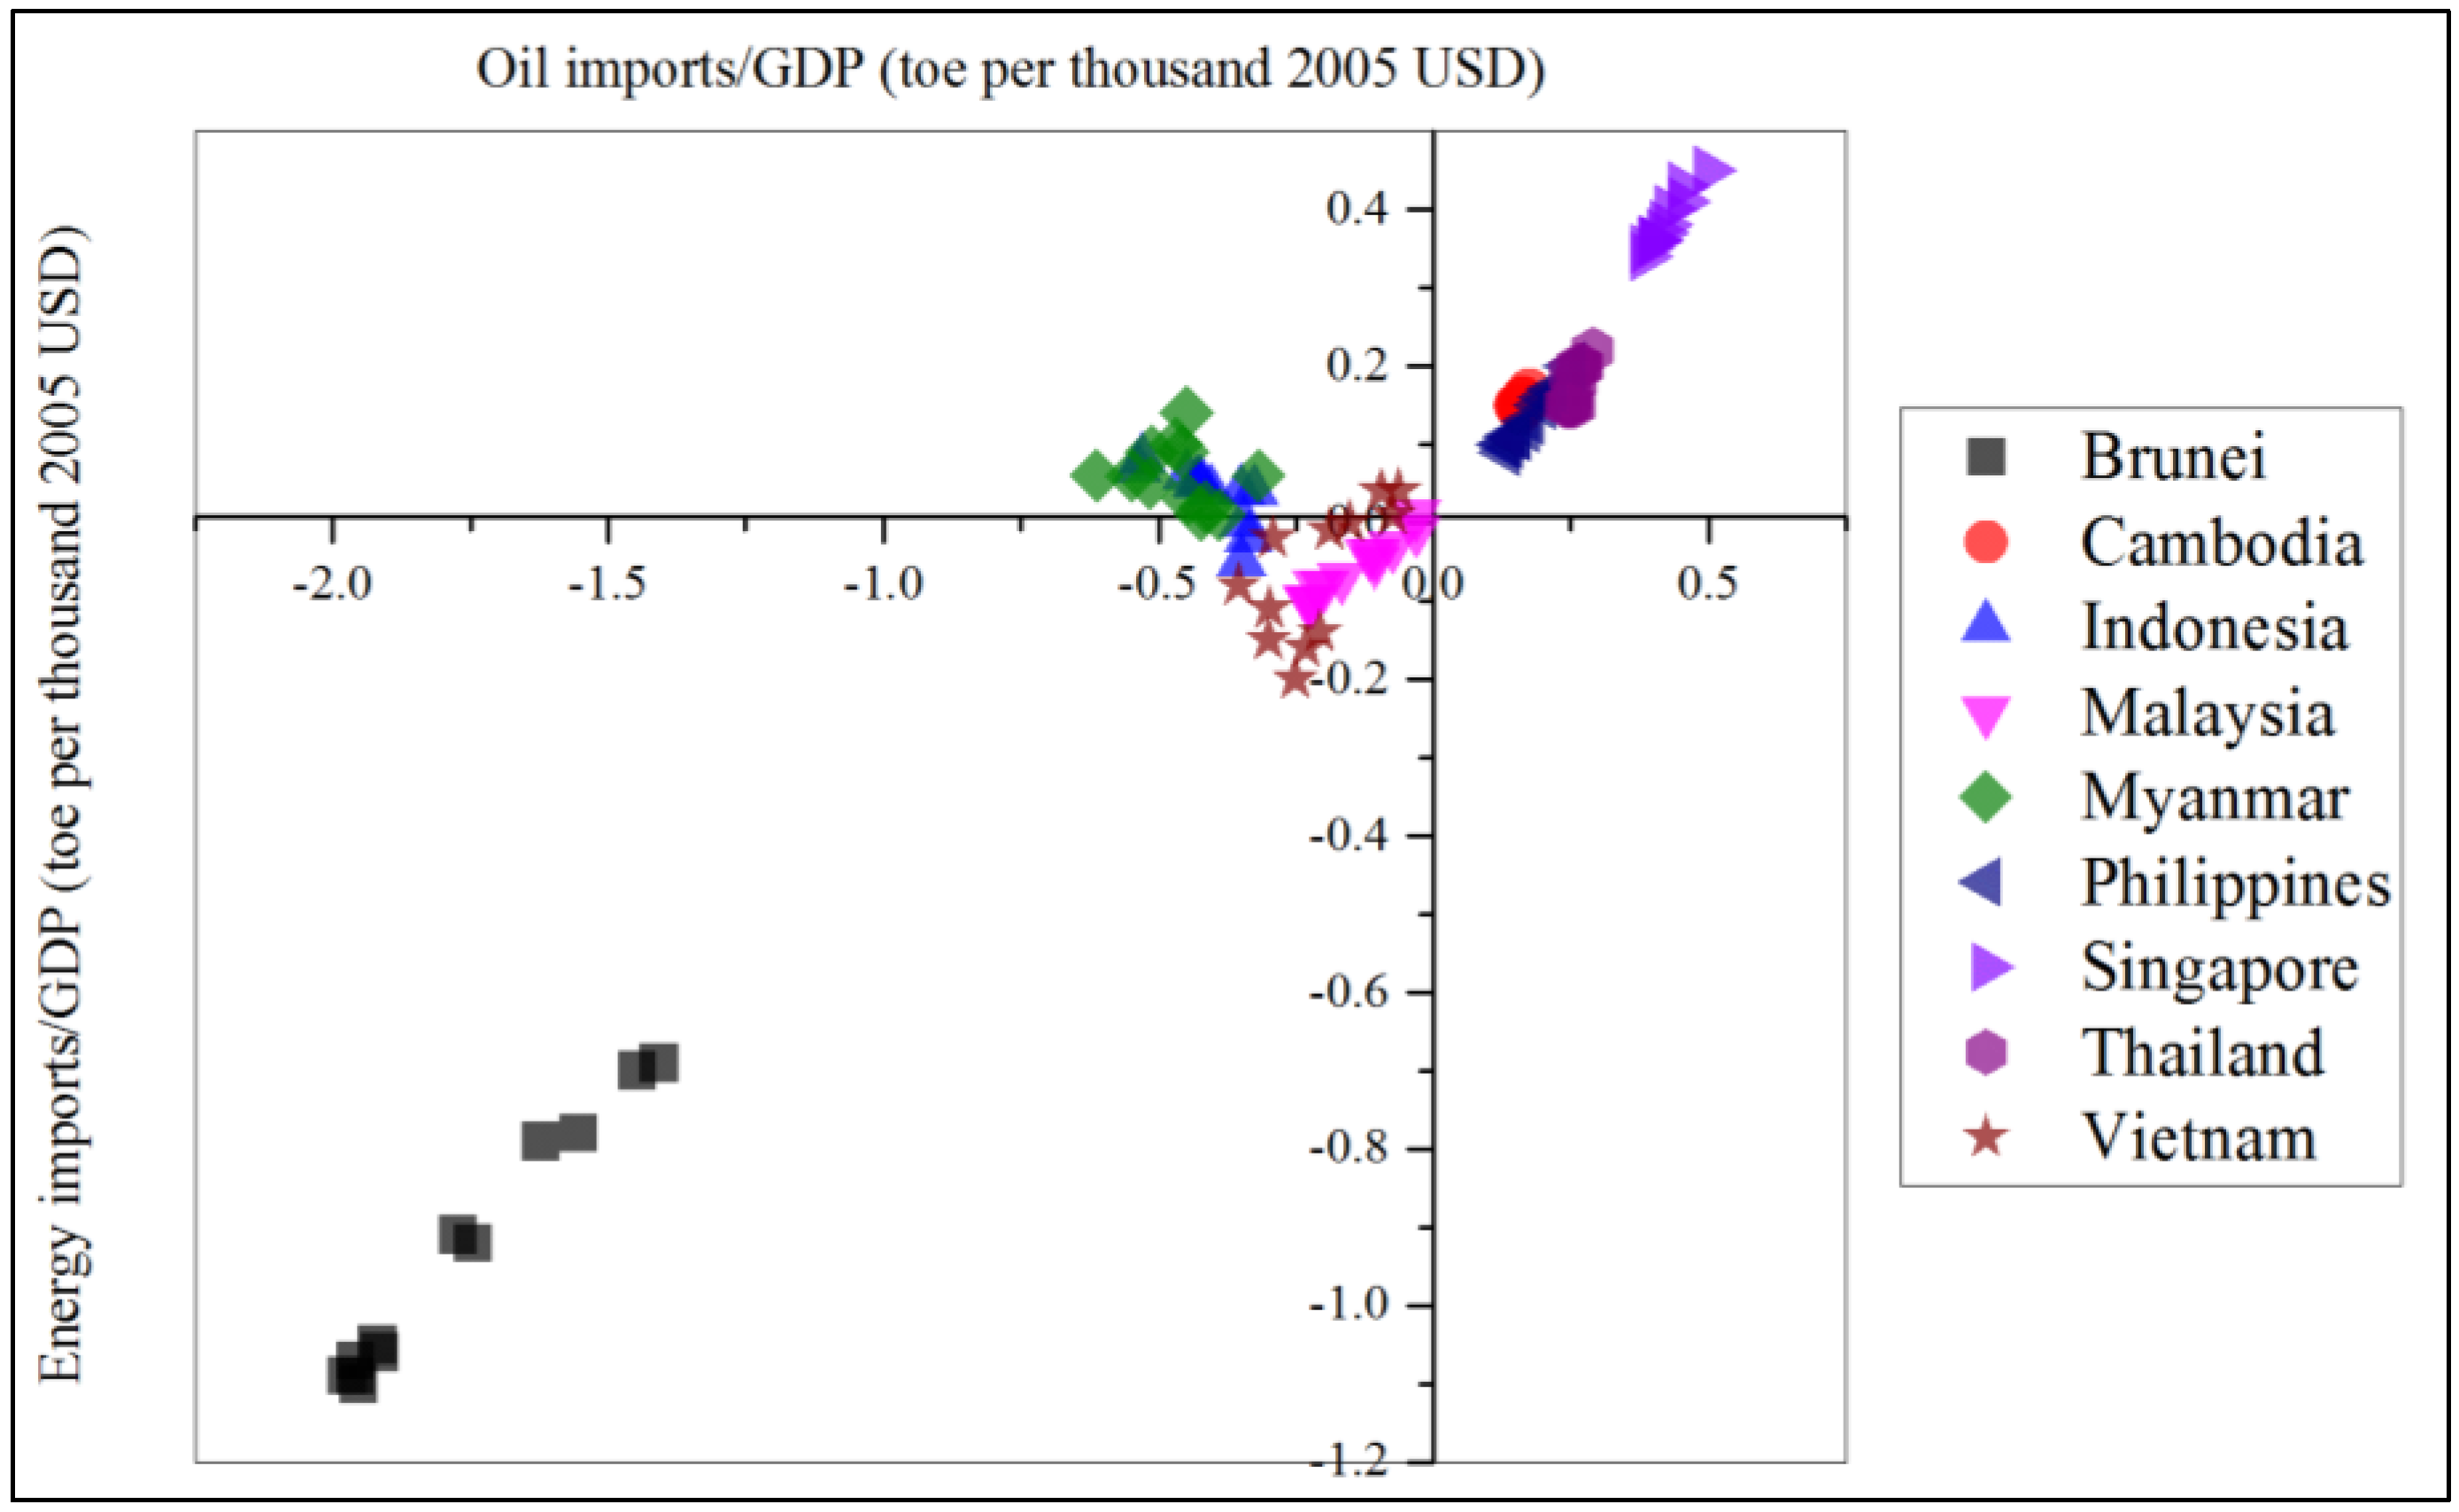
Energy trade per GDP does not indicate only the share of energy trade in the overall economy of a country, but also its openness to the international energy market. In this part, we included net energy imports as well as oil imports per certain units of GDP. Different from the self-sufficiency indicator that focuses on supply dimension, net energy imports per GDP reflect the vulnerability of energy imports to the economy as well as the contribution of energy exports to economic growths. The higher the share of energy imports to the GDP, the more the country is financially obscured to international trade, which also affects the wealth of the nation.
Figure 34 shows the overall net energy imports to the GDP between 2001 and 2012. Separated by the value of zero, again ASEAN countries are divided into energy-exporting countries and energy-importing countries. Starting with exporting countries, it is obvious that the energy sector is an important driver of Brunei’s income, especially when compared to the rest of the region. On average, 1.76 toe of energy that the country produces contributes to a $1000 USD of domestic income. For Singapore, on the other hand, every $1000 USD of its income must be spent on approximately 0.42 toe of energy imports.
Figure 35 contrasts energy imports per GDP with oil imports per GDP. The figure shows the clusters of energy- and oil-importing countries within the region. First, countries that import both energy (in general) and oil include Cambodia, the Philippines, Singapore, and Thailand. Second, countries that import oil but export other energy products include Indonesia, Myanmar, and Vietnam. Third, countries that export both energy and oil are Brunei and Malaysia (although as of 2012 the ratio of net oil imports to the GDP for Malaysia was −0.01). With the attempts to replace crude oil imports with domestic production and other energy resources, the overall trends of net oil imports per GDP and net energy imports per GDP of the ASEAN counties have continued to decrease and move closer to the center, with the exceptions of Indonesia and Vietnam. The figure also represents how much each country is open to international energy trade. A line closer to the center (zero) refers to a lower likelihood of trade (importing) from other countries.
Figure 34. Net imports/GDP between 2001 and 2012.
Socsci 04 01269 g034
Figure 35. Net imports/GDP and oil imports/GDP (2001–2012).
Socsci 04 01269 g035

3.4.2. Export-to-Production Ratio

Focusing on energy producers and exporters of the region, which are Brunei, Indonesia, Malaysia, Myanmar, and Vietnam, the export-to-production ratio indicates how much external energy demands affect domestic production.
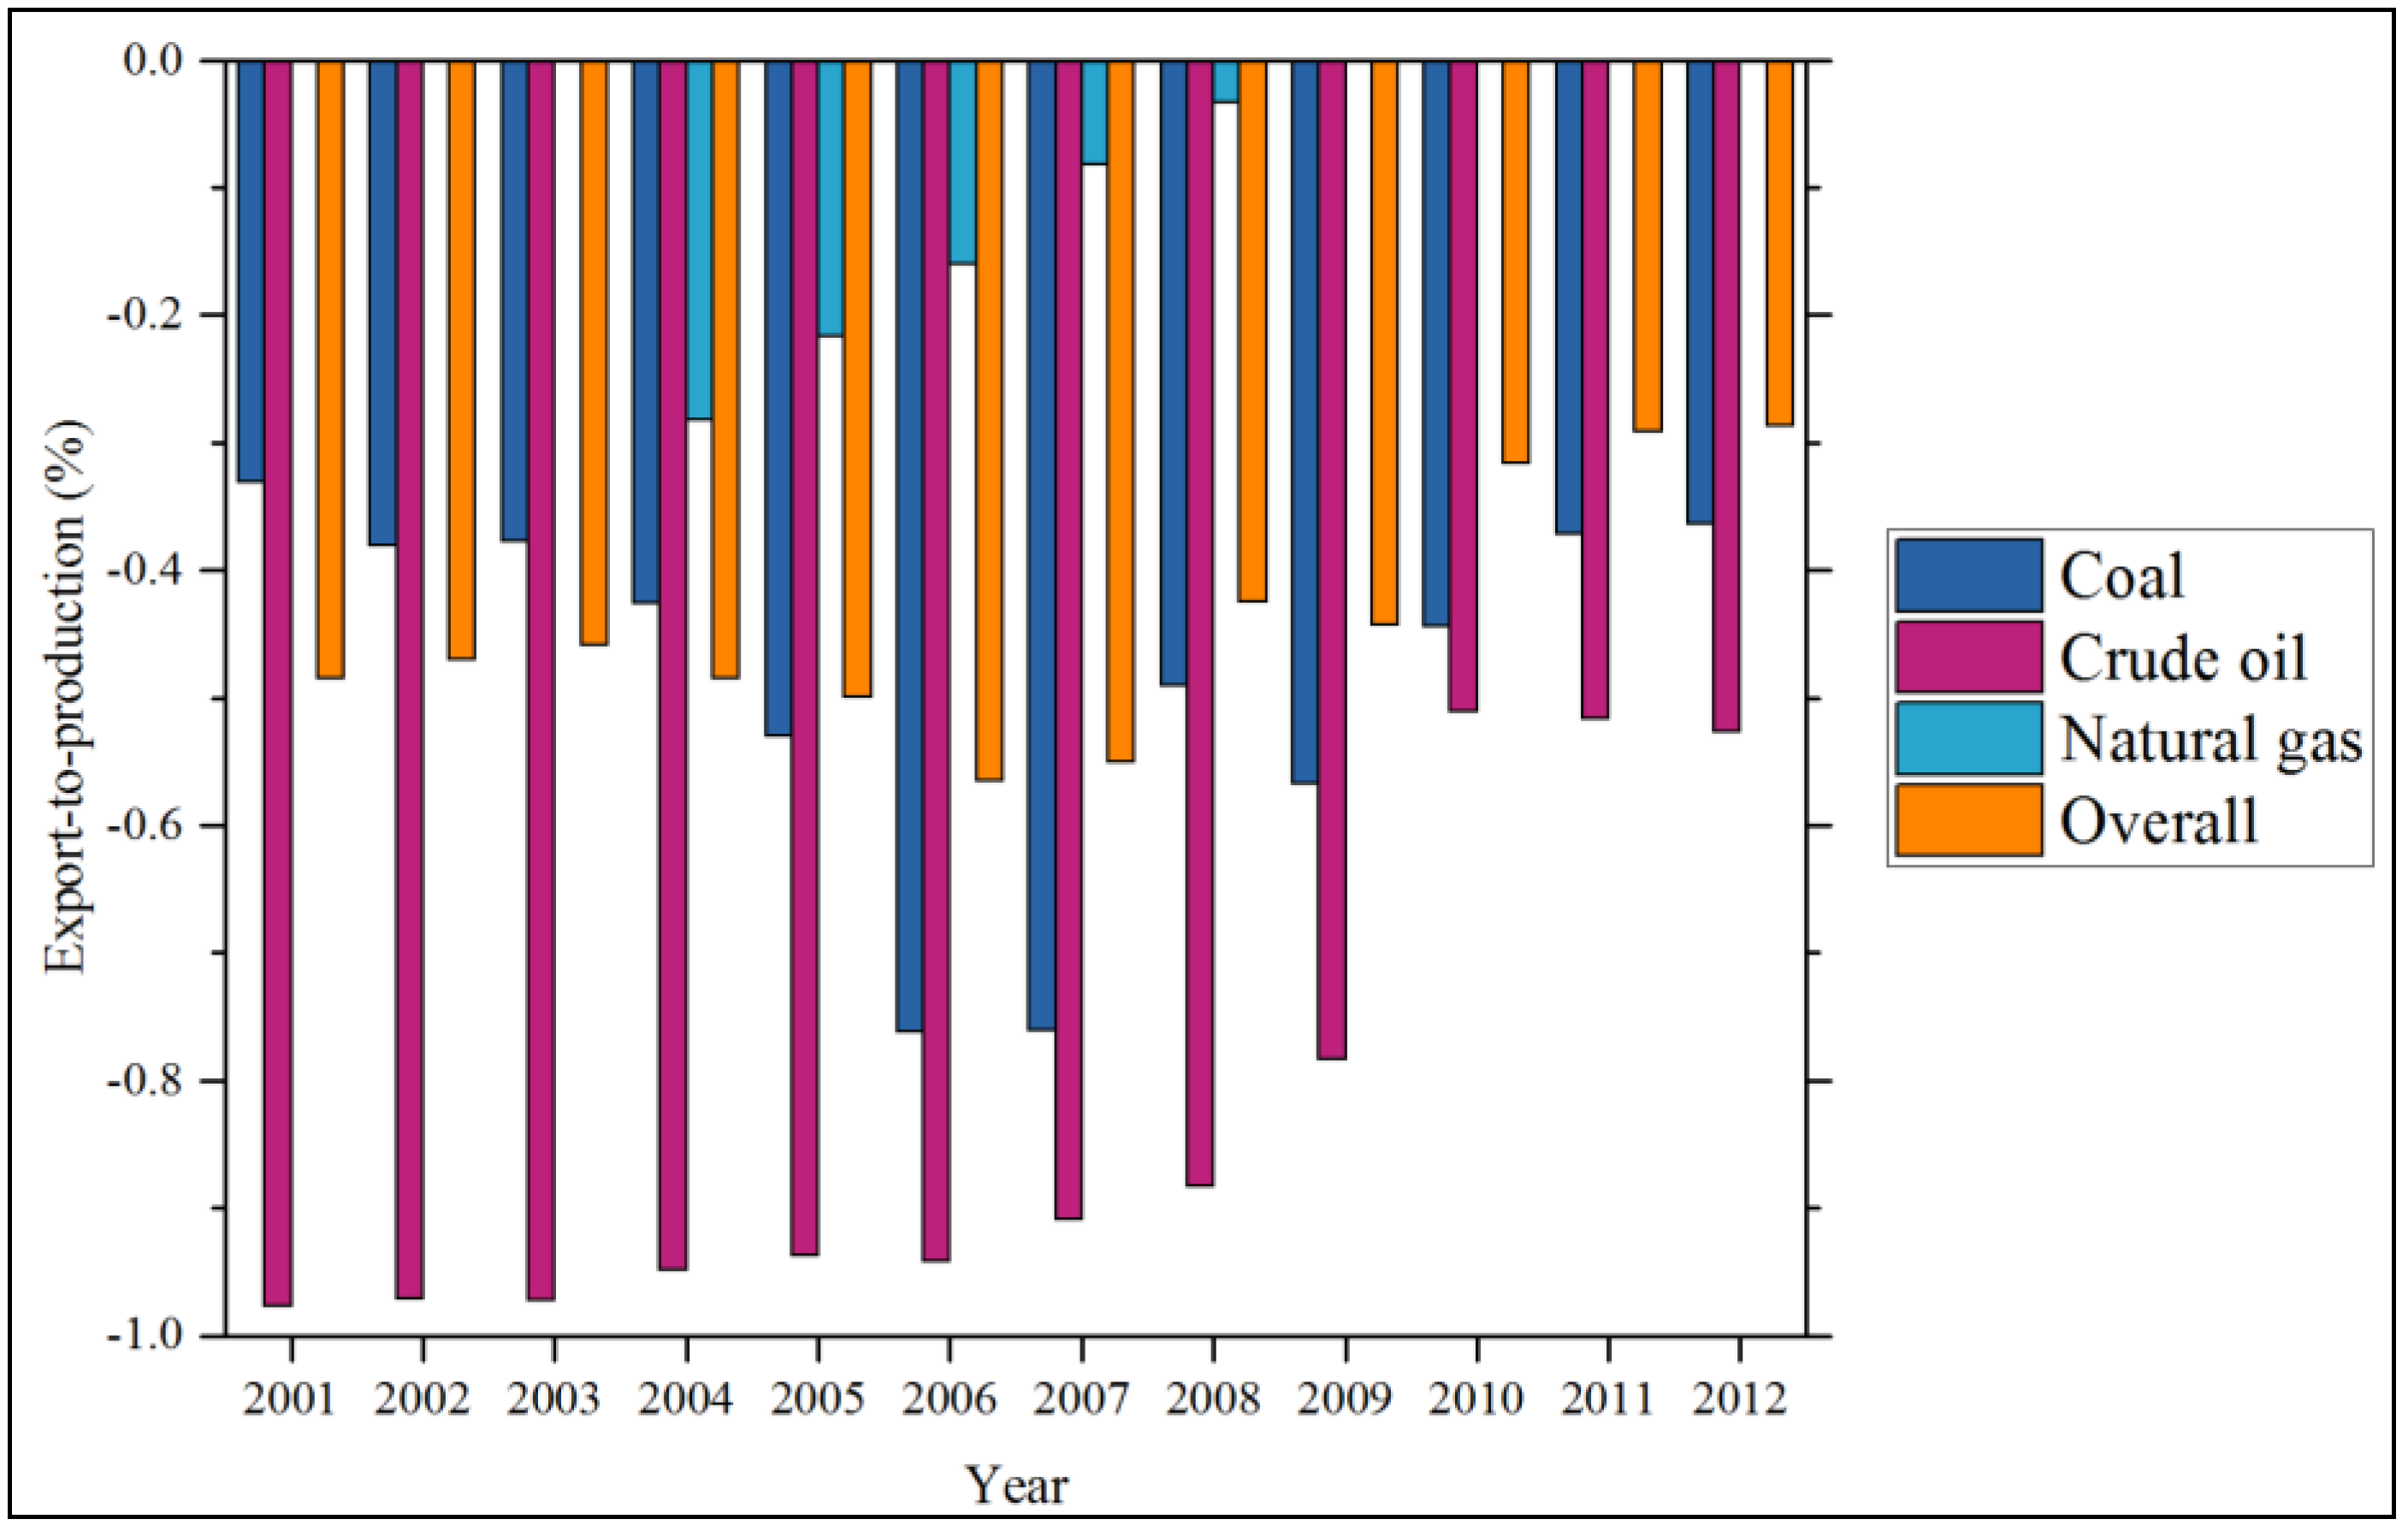
As the leading energy producer and exporter of ASEAN, Brunei exports crude oil and natural gas. Presented in Figure 36, in the past 12 years, more than 90% of Brunei’s crude oil production was exported. Around 77% of the produced natural gas is also exported. However, while the share of crude oil exports in the production is rather constant, the share of natural gas has continued to decrease, caused by growing domestic demands that began in 2006. Nevertheless, the majority (more than 80%) of Brunei’s domestic energy production is sent out of the country.
Figure 36. Brunei: export to production.
Socsci 04 01269 g036
One of the former member of the Organization of the Petroleum Exporting Countries (OPEC), Indonesia, has been confronting the significant growth of domestic energy demand (due to its large economy and population size), so the country is no longer a net oil exporter and left OPEC in 2009 [60]. Still, as shown in Figure 37, the country exports a significant amount of coal (more than 80% of the production). Around half of the natural gas produced is also exported (although the trend has continued to decline) while there has been a gradual decrease in the share of crude oil exports in the production. Because of coal, the overall export-to-production ratio of Indonesia has continued to grow.
Figure 37. Indonesia: export to production.
Socsci 04 01269 g037
The majority of Malaysia’s energy exports are natural gas and crude oil (about half of the total output) as well as petroleum products. As shown in Figure 38, the country also exports a small amount of coal (less than 10% of the produced coal). Between 2001 and 2012, the Malaysian share of crude oil exports in the domestic production has been somewhat decreasing, whereas the share of natural gas exports is quite constant. Coal export-to-production, on the other hand is highly scattered. Still, the country is the third-largest energy exporter of the region.
Figure 38. Malaysia: export to production.
Socsci 04 01269 g038
Myanmar is ASEAN’s leading natural gas producer and exporter since more than 80% of the produced natural gas is exported (see Figure 39). The country also exports crude oil and coal, but the amounts are very small. It should be noted that the gradual increase in natural gas exports may stem from the fact that Myanmar’s energy development is still not countrywide; consequently, domestic natural gas could be small. However, approximately one-third of the overall energy production is exported.
Figure 39. Myanmar: export to production.
Socsci 04 01269 g039
The last energy-exporting country to discuss is Vietnam. Based on Figure 40, Vietnam exports a significant amount of crude oil (more than 90% during 2001–2007), yet its crude oil export-to-production dropped drastically in 2010 due to increasing domestic consumption. In addition to crude oil, the country also exports coal (on average, around 48% of coal production). Between 2004 and 2008, Vietnam briefly exported natural gas.
Figure 40. Vietnam: export to production.
Socsci 04 01269 g040
Energy production and export are subjected to both internal and external demands. With regards to a definite amount of resource availability, energy-exporting countries must take into account the prospect of a clash between the two demands. The security of the energy supply from this point of view differs from the conventional import-centric standpoint. Indonesia is always a good example of how the clash between internal and external energy demand has led to an energy development dilemma.

3.4.3. Energy Import Dependence

Shifting towards import dependence, this indicator is based on the premise that the more the country relies on external energy resources, the more the country is vulnerable to the geopolitics of energy and exposed to supply disruptions.
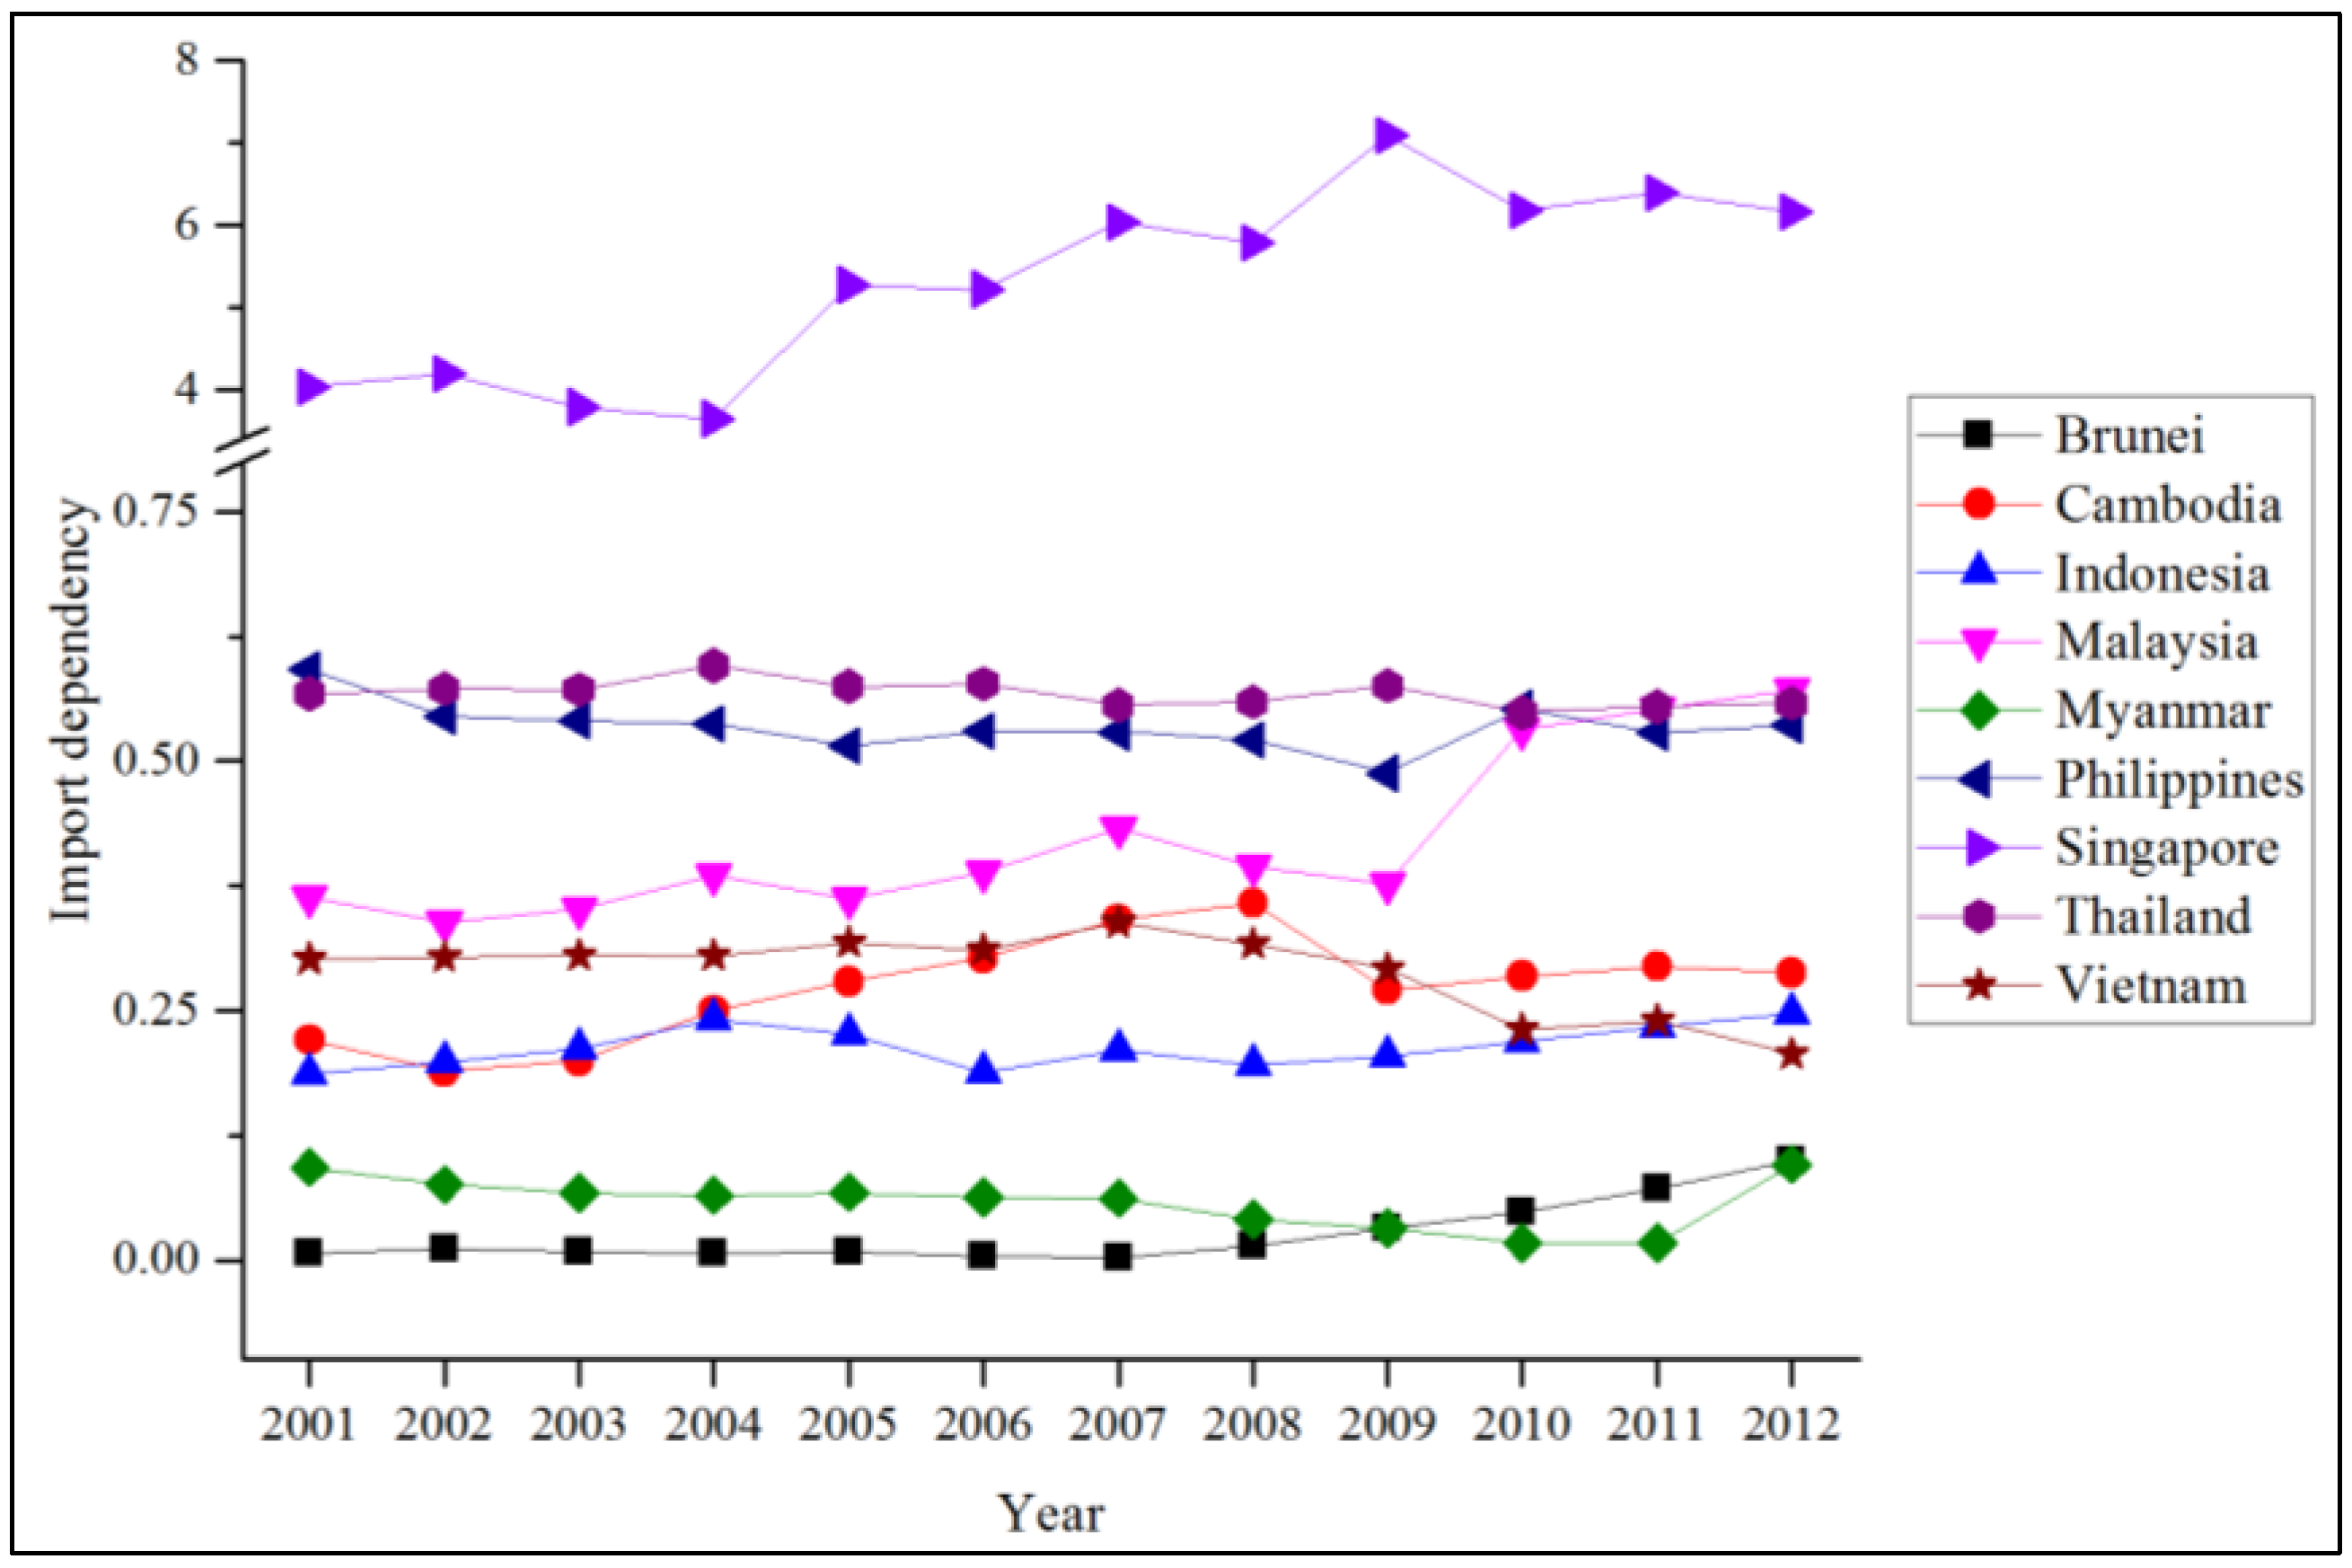
Figure 41 presents the trends of energy import dependence between 2001 and 2012 whereas Figure 42 shows by-energy-source results. As a net oil and natural gas exporter, Brunei has the lowest import dependency rate, yet the country doubled the imports of oil products in 2009. Cambodia is reliant on coal imports for power generation and all oil products must be imported, which results in a 25% reliance on imported supplies. Indonesia depends on 35% of crude oil imports due to its depleting crude oil resources; it also imports a significant amount of oil products to meet growing domestic demands and re-exports. Although the overall import dependence between 2001 and 2012 is slightly less than 22%, there has been a gradual increase since 2009.
Figure 41. Energy import dependence (by country).
Socsci 04 01269 g041
Figure 42. Energy import dependence (by source).
Socsci 04 01269 g042
Malaysia relies heavily on coal imports, which account for 92% of the coal demands; the country has also imported one-quarter of its natural gas since 2003. While Myanmar relies on 100% of imported oil products, in terms of primary energy supply, the country is rather oblivious to overseas resources with less than 5% of PES imports. For the Philippines, more than half of the energy supply is imported, especially coal and crude oil. Referring to the reserves-to-production (R/P ratio) value showing that the country has proven resource potential, this contradiction reflects that the Philippines may have difficulties acquiring its own resources due to the lack of capital investment or investors, which makes the decision to import economically more attractive than to produce domestically. Singapore has the highest energy import dependency rate with 100% of imports (Singapore has been importing coal since 2002). Thailand is also, by half, dependent on imported supplies, particularly coal and crude oil. Vietnam has imported coal for power generation since 2005, but its moderate energy import dependency rate is a result of electricity and the imports of oil products.

3.4.4. Reliance on Imports from the Middle East

Focusing on geographical conditions of import reliance, this indicator shows the share of energy supply imports from the Middle East to the total world imports in the same energy products: crude oil, natural gas, and refined oil. The Middle East OPEC is the world’s major producer and exporter of crude oil and natural gas. The standard international oil price is also influenced by this organization. Although reliance on crude oil and oil imports from the OPEC Middle East could be considered less influenced by energy politics that would lead to disruption or sudden price changes due to its open and competitive international markets when compared to other energy markets, for ASEAN countries, the reliance on imports from the Middle East entails subsequent risks such as transportation risks and chokepoints. The indicator thus reflects oil and gas geopolitics as well as energy interdependence between ASEAN countries and the OPEC members. Brunei was excluded in this category and the following because of its small import share.
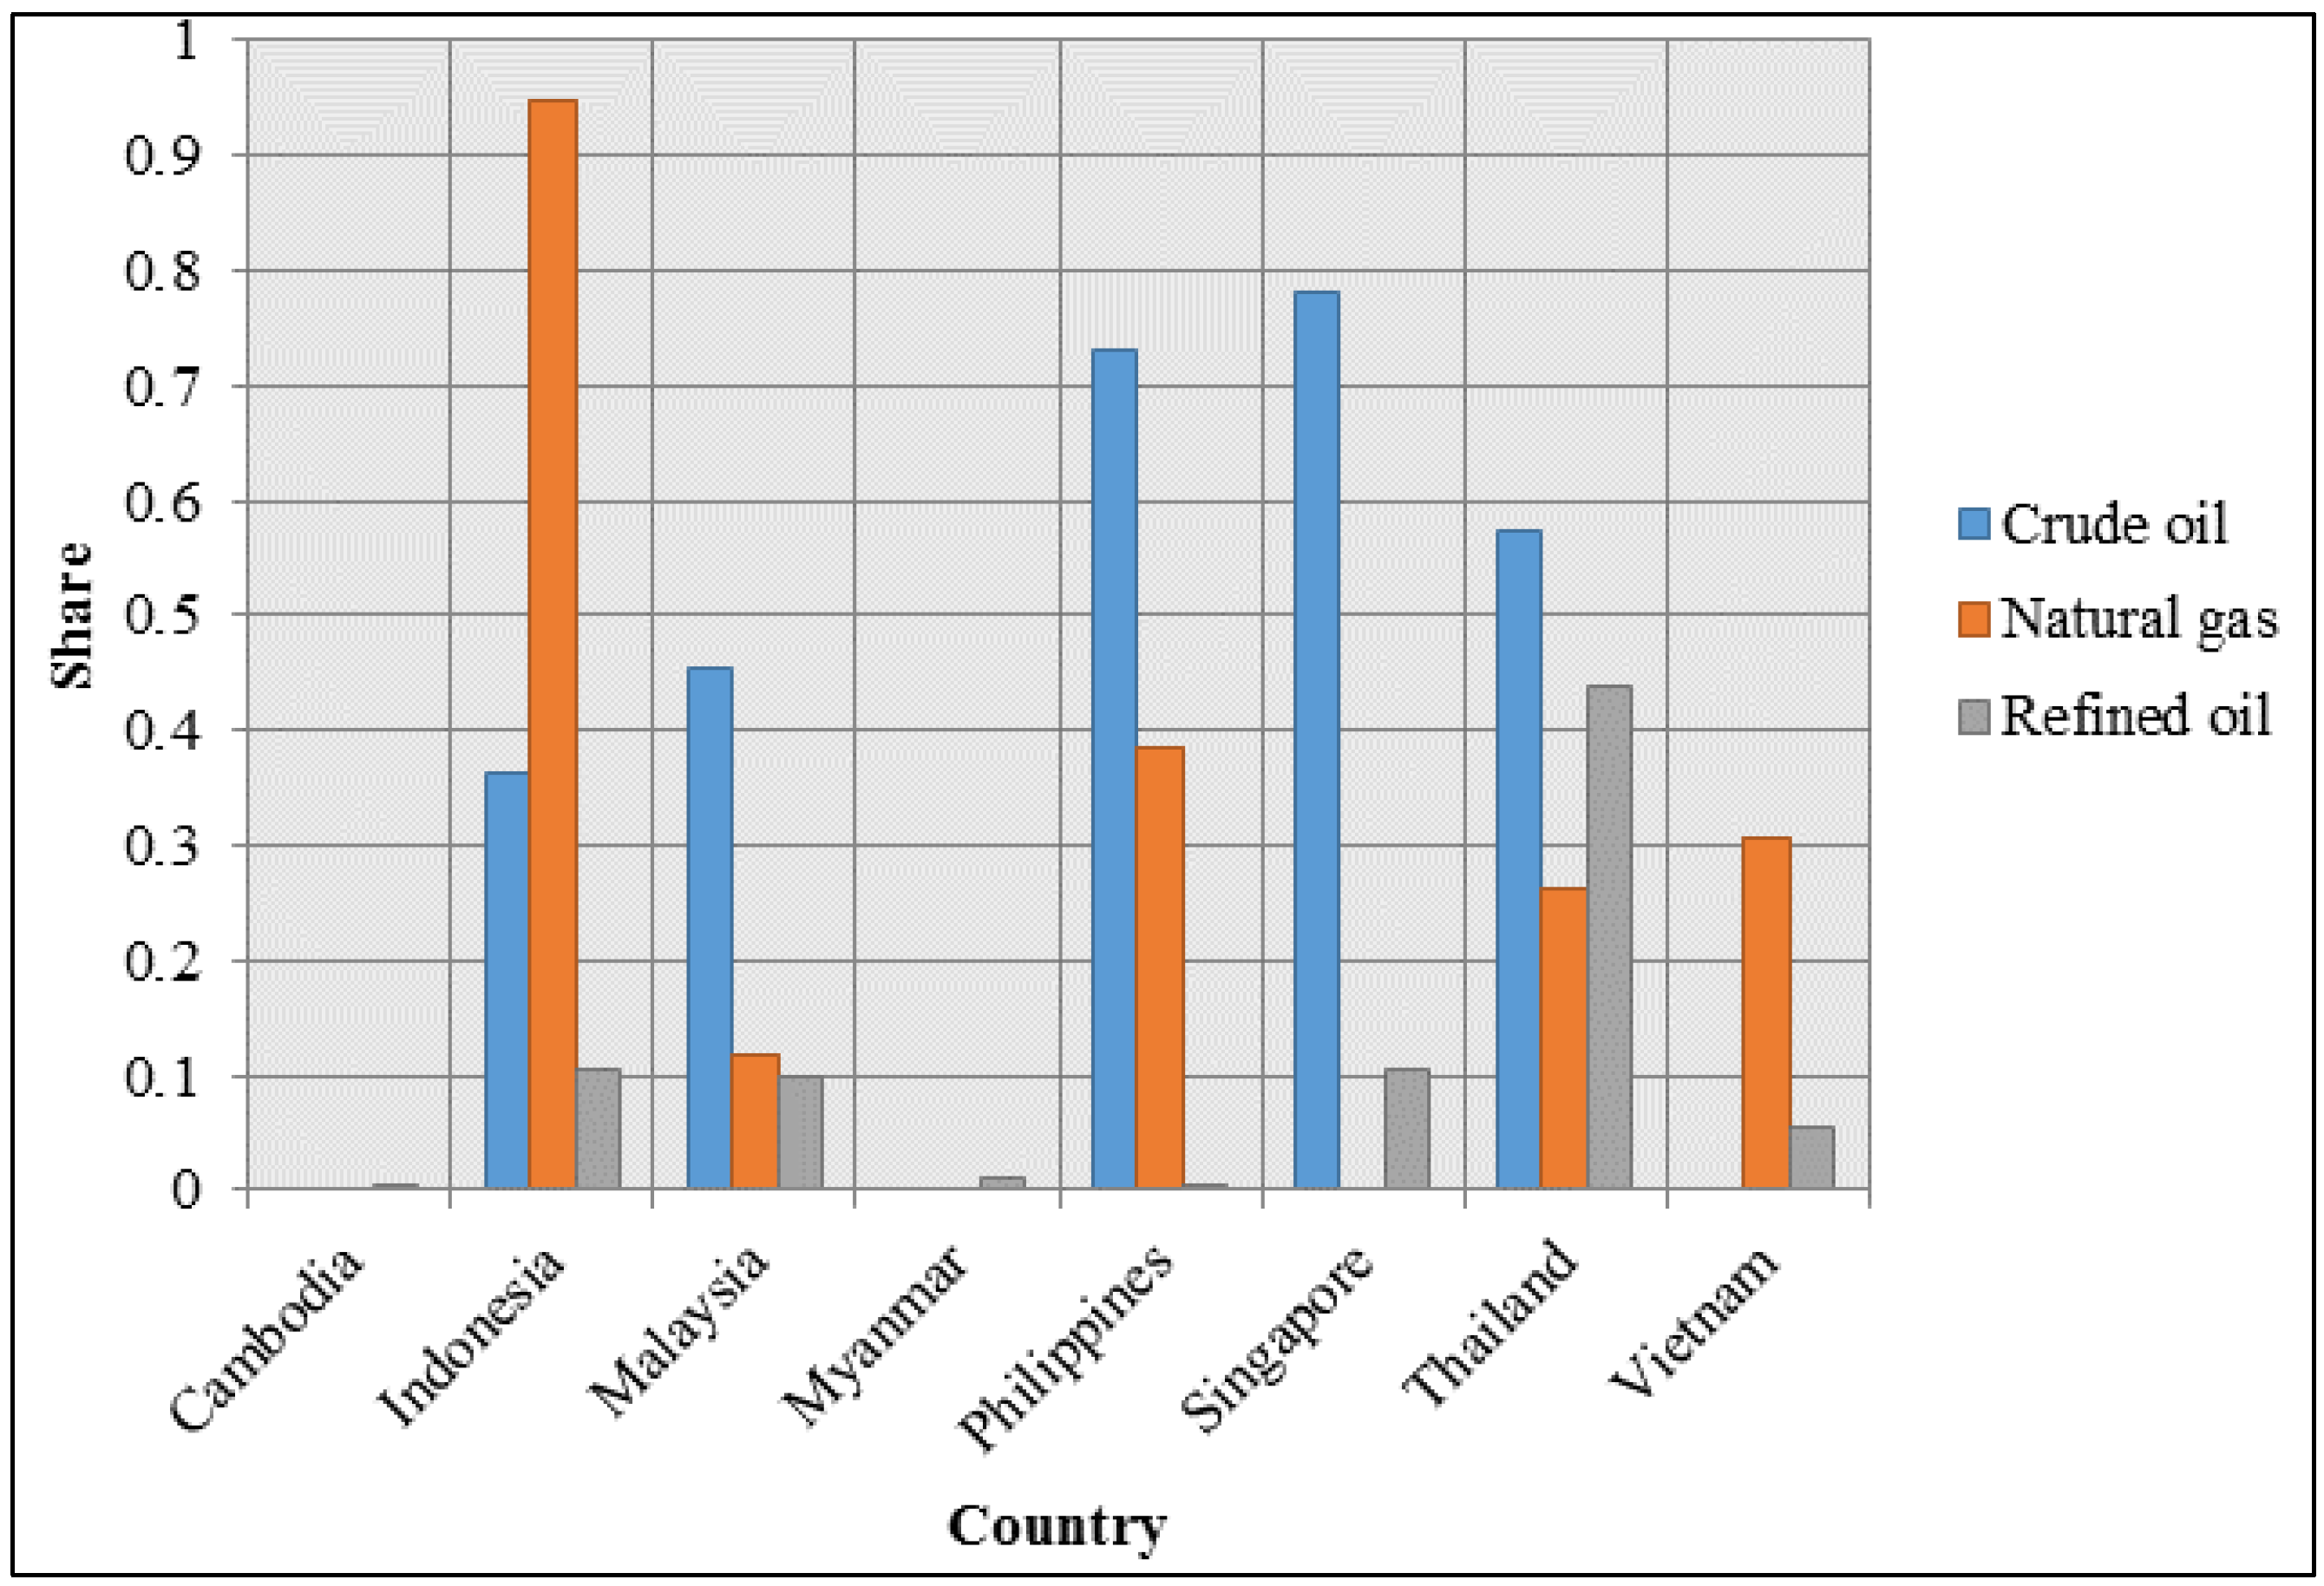
As presented in Figure 43, the majority of energy supply imports from the Middle East are crude oil. Almost 80% of Singapore crude oil import is from the Middle East. Similarly, 73% of the Philippines’ and 57% of Thailand’s crude oil import source countries are OPEC Middle East. While 36% of Indonesia’s crude oil import is from the Middle East, 95% of its natural gas import relies on this region. Dependence on refined oil import from the Middle East is not as significant as crude oil or natural gas shares, except for in Thailand, where the country is, by 47%, reliant upon the Middle East’s oil products.
Figure 43. Reliance on imports from the Middle East.
Socsci 04 01269 g043

3.4.5. Intra-Regional Energy Trade

To highlight intra-regional energy interdependence and the prospect for regional energy markets, this indicator focuses on the intra-regional energy trade. Energy products included in this part are coal, crude oil, natural gas, and refined oil. However, it should be noted that the results do not cover upstream imports from other sources prior to intra-regional trade, so some overlapping data may occur.
From Figure 44, the results show that intra-regional energy interactions are quite remarkable. Energy import sources for Cambodia are heavily concentrated on intra-regional trade. More than 94% of coal, natural gas, and refined oil are imported from fellow ASEAN member nations. Indonesia’s share of the refined oil import from the Southeast Asian region is more than 66%. More than 98% of Myanmar’s imported refined oil is intra-regional. The total coal import of the Philippines is also within the region. Intra-regional import reliance for Singapore is rather low, except for natural gas, which is because Singapore’s main import source region is the Middle East.
Figure 44. Share of intra-regional energy trade.
Socsci 04 01269 g044
Compared to OPEC Middle East and international oil markets, intra-regional energy interactions may not be as depoliticized. Nevertheless, in terms of the security of energy supply, the reliance on imports from neighboring countries implies lesser spatial vulnerability regarding supply transport/transmission. While coal, natural gas, and petroleum products are energy supplies that are most traded within the region, natural gas is an energy commodity that is most likely to be subjected to energy politics, particularly those transmitted through transnational pipelines. Regional cooperation is thus important to ensure the security of uninterrupted energy commodity trade and pricing.
In this component, Brunei is regarded to be the country least vulnerable to overseas energy resources because of its abundant crude oil and natural gas resources. In contrast, Singapore is a net-energy import country while the Philippines, despite energy resource potentials, have to rely heavily on imports. The results from intra-regional energy dependency reflects energy interconnection among the ASEAN countries.

3.5. Resource Diversification

3.5.1. Diversity of Primary Energy Supply

The diversification of supply is considered to be crucial in enhancing energy security. If an energy system of a country has a well-diversified energy mix, it will be more resilient to changes in terms of supply interruption or price disruptions because the country would be more flexible in switching to other energy products. The diversification of the primary energy mix is crucial for countries without domestic energy resources. In this part, we measure the degree of energy supply diversity using the Shannon-Wiener index (SWI).
Figure 45 shows the degree of diversity in primary energy supply for the years 2001 to 2012. The lowest SWI diversity value is for Cambodia because its primary energy supply is highly traditional biomass-concentrated. The slight increase is a result of coal imports for electricity generation. The second- and third-lowest are Singapore and Brunei according to crude oil and natural gas dominance in primary energy mixes. Unlike Myanmar, Vietnam’s SWI value has remarkably increased (from 0.80 in 2001 to 1.30 in 2012) as the country included more supply options in the mix. Although 1.30 is still considered low diversity, it is great progress for the security of the supply. Indonesia is the country with highest SWI for primary energy diversity due to a significant share of renewables in the mix. The median SWI of nine ASEAN member nations for the year 2012 is 1.20, which has considerably increased compared to 0.80 in 2001. Individually, the SWIs in most countries are increasing because supply diversification has been adopted as an energy security strategy to decrease supply insecurity caused by over-reliance on specific energy sources.
Figure 45. Diversity of primary energy supply.
Socsci 04 01269 g045
While the SWI focuses on energy supply diversification, this HHI diversity indicator emphasizes market concentration based on import source countries. The assessment for the next part was based on 2012 energy trade statistics, except for Myanmar which used 2010 statistics. Cambodia was excluded from the export market concentration because the country does not export any energy products, while Brunei was, again, excluded from the import market concentration because the import amount is too small.

3.5.2. Energy Market: Diversity of Export Destination

Similar to the diversification of import source countries, the lack of diversity in export destinations could induce economic dependence of an energy exporter on a particular trade partner, which may lead to energy insecurity. This indicator examines the diversity of energy-export markets using the Herfindahl-Hirschman index (HHI). The more the export destination is concentrated on certain trade partners, the more the country is exposed to economic dependence. Nevertheless, it should be noted that the concentration of the export market has different impacts for the countries that are major exporters compared to the countries whose exports contribute relatively little to their economies. Despite the lack of market diversity, if the country’s economy does not rely heavily on those exports, the high concentration and the security of trade partners would not substantially affect its energy security.
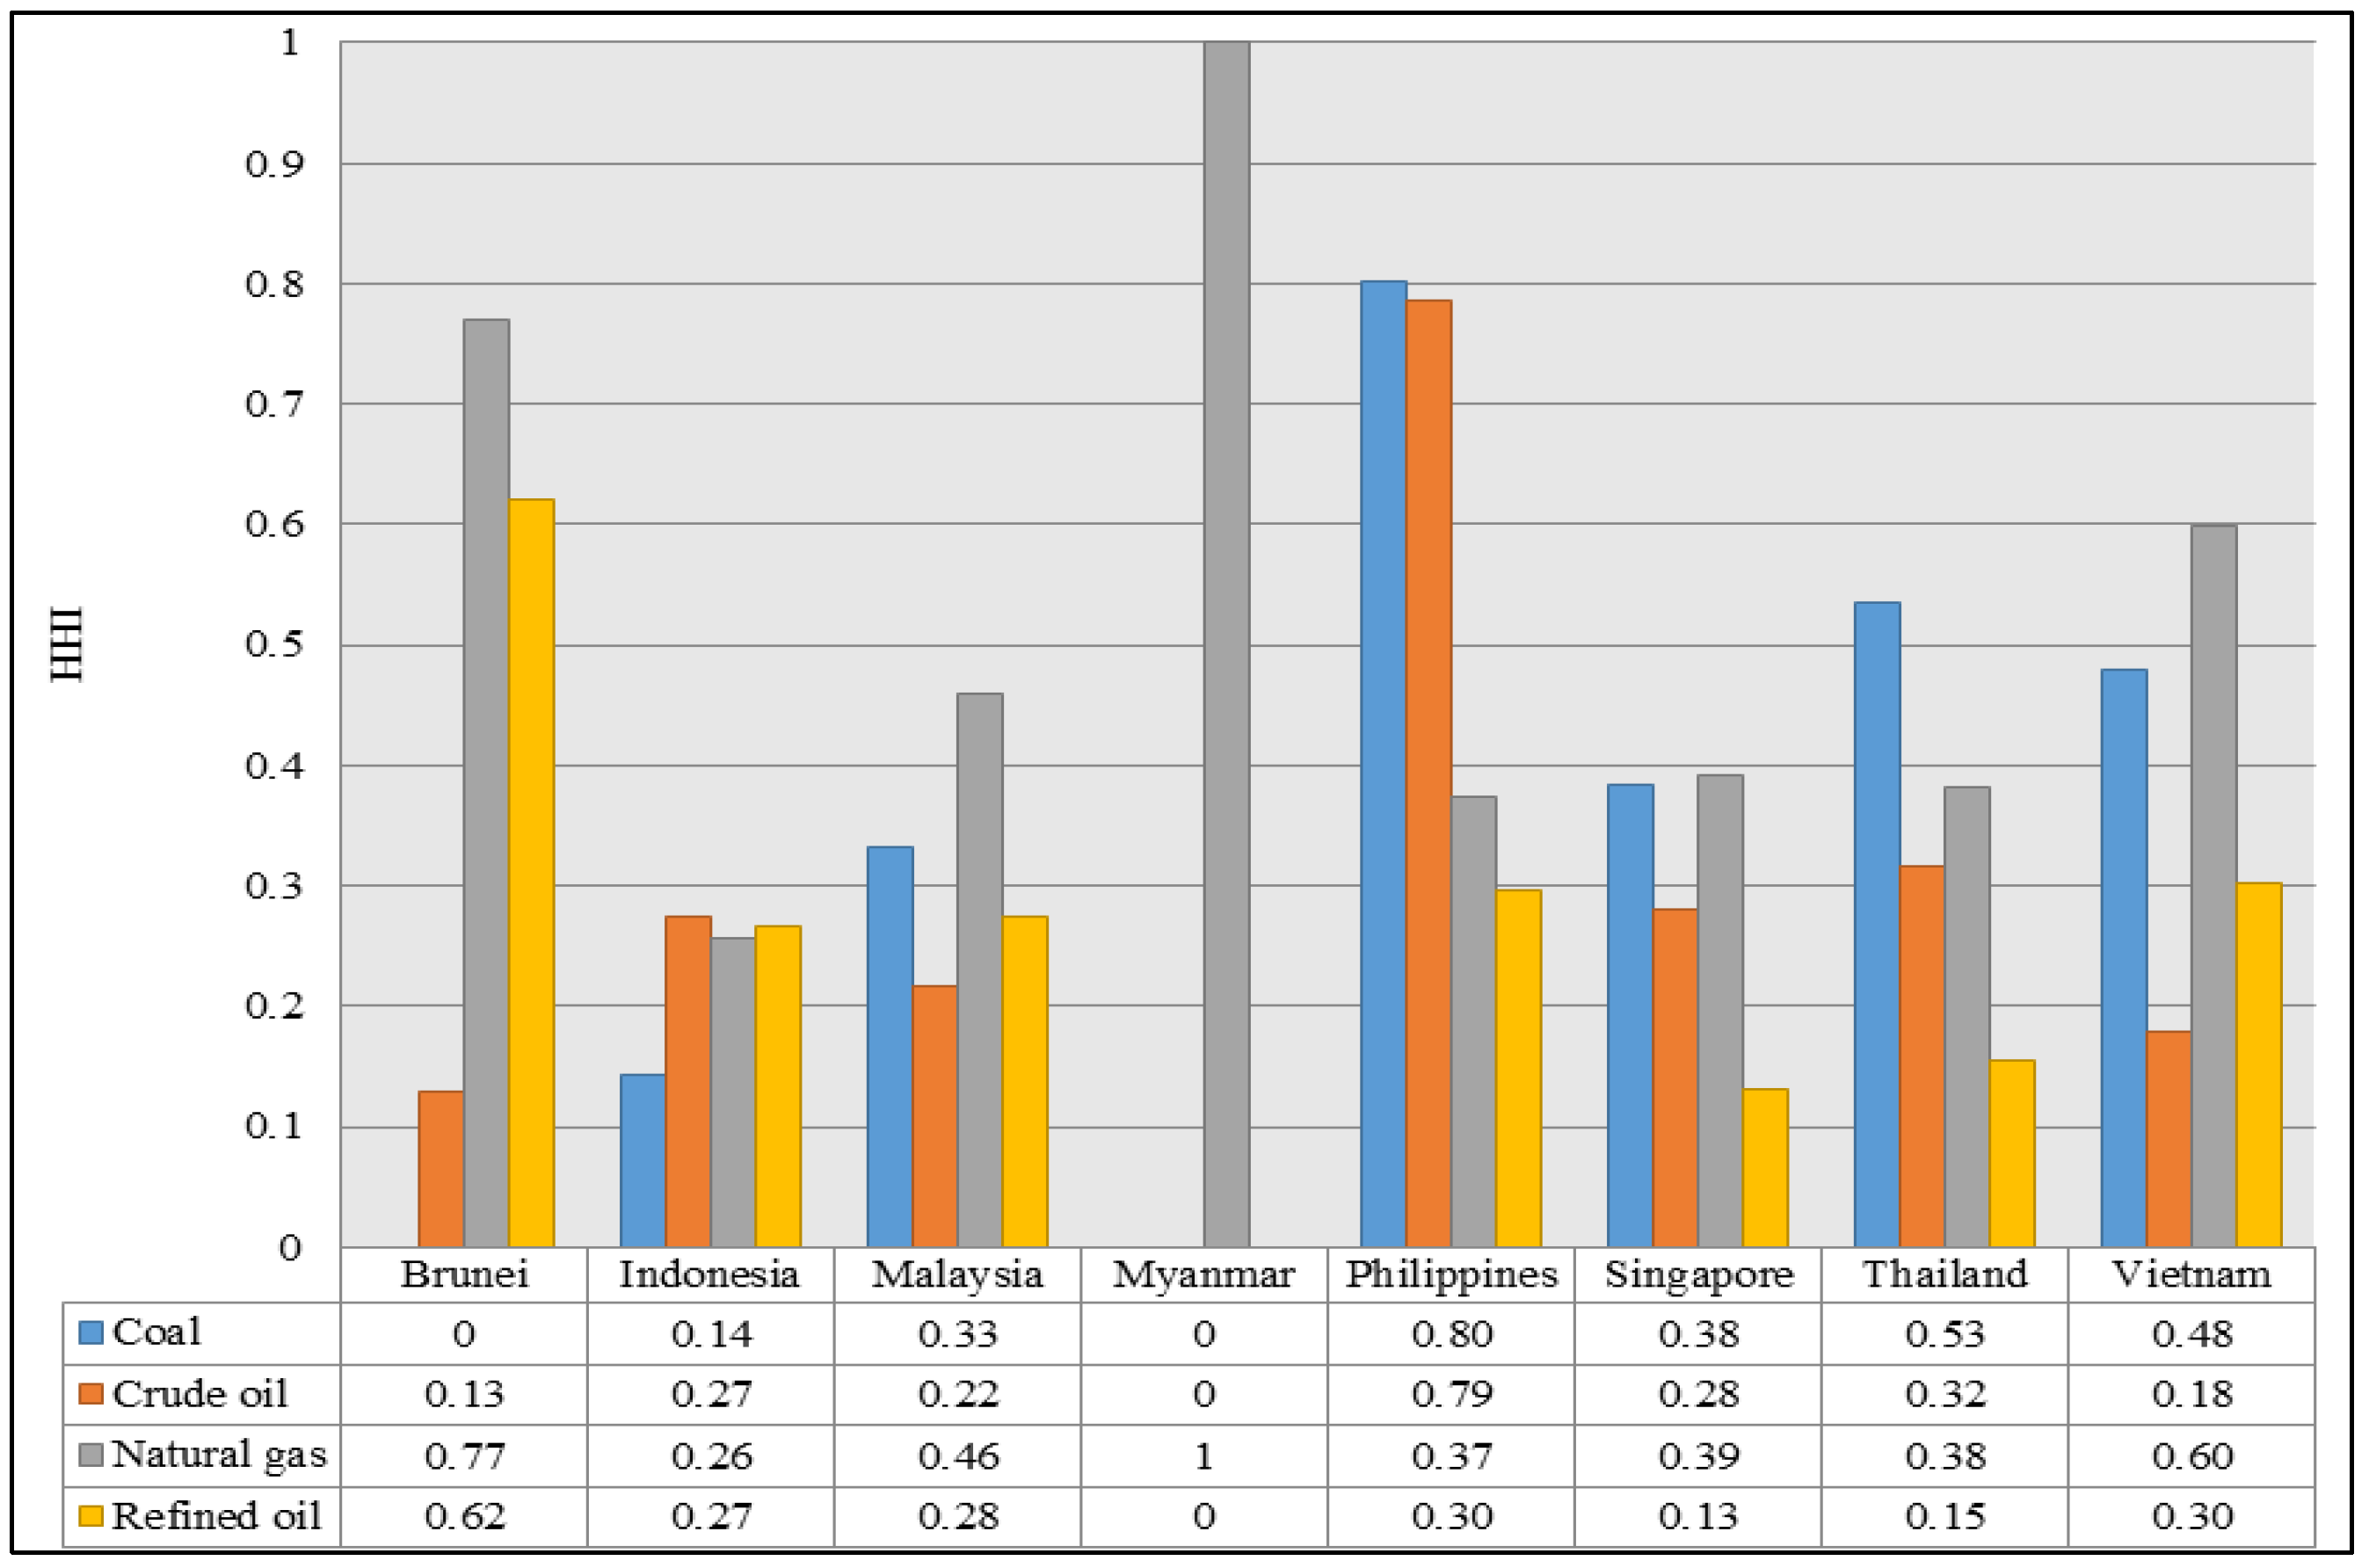
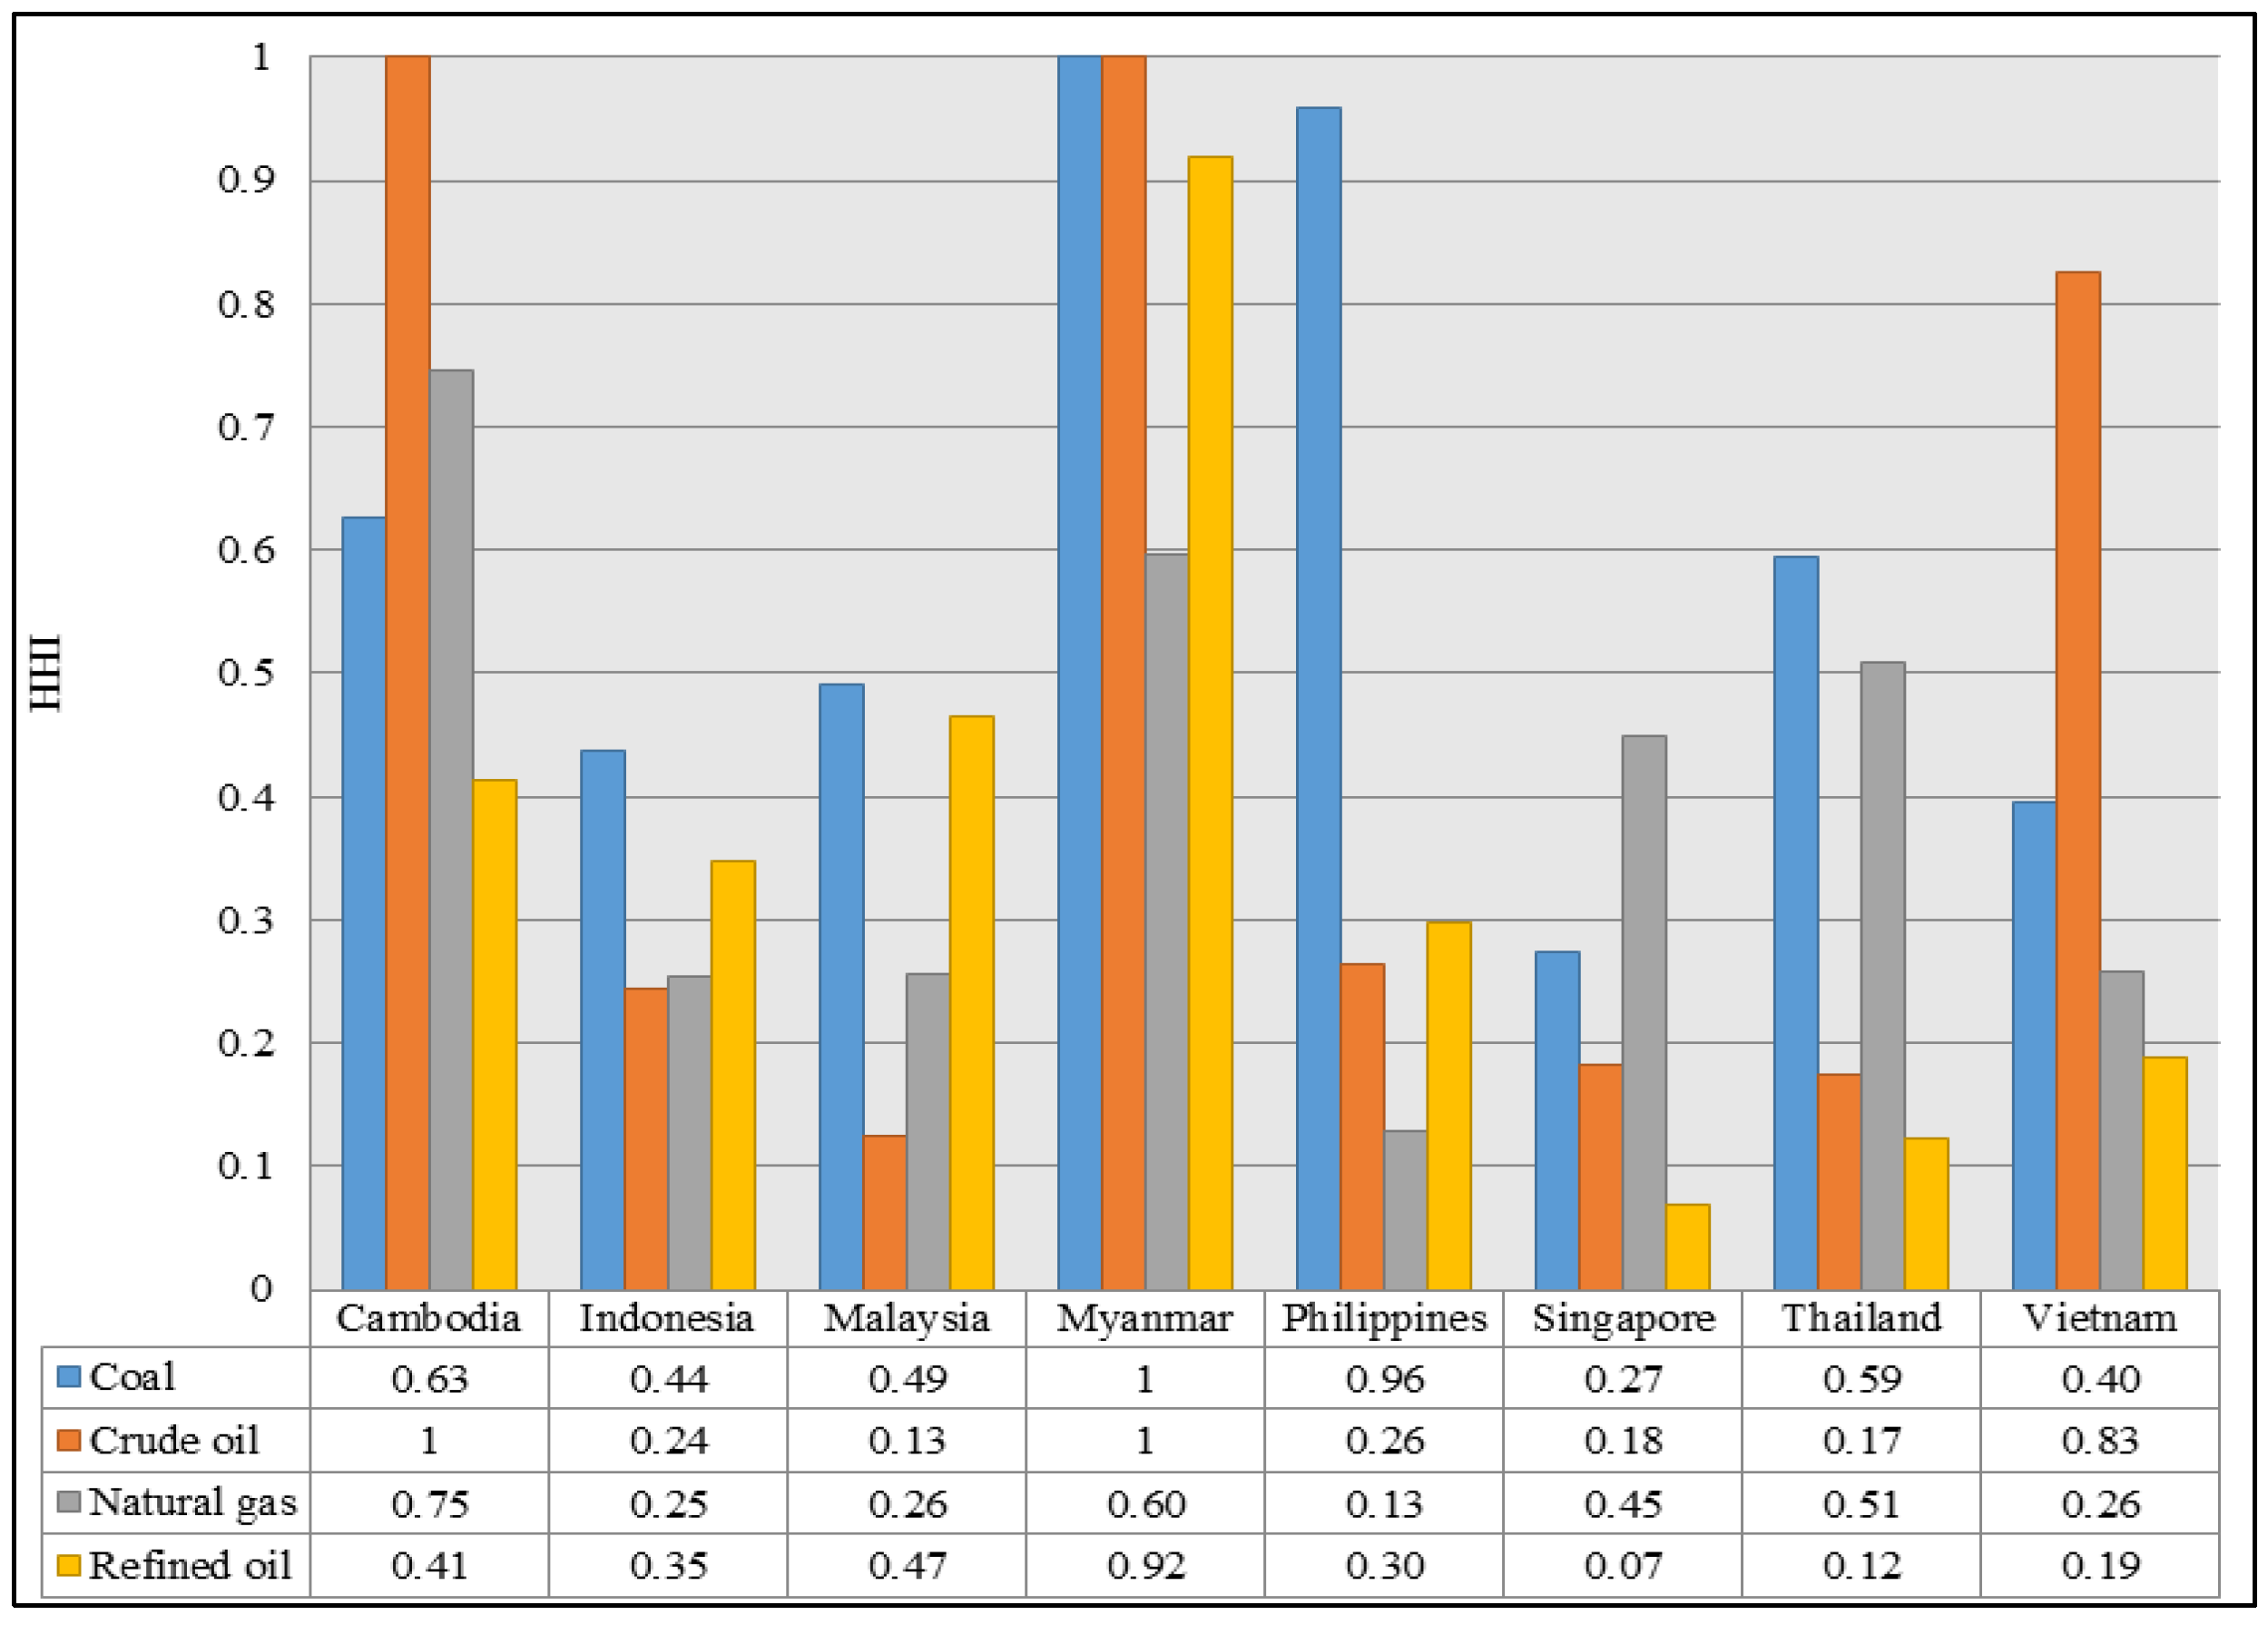
According to Figure 46, most energy producers and exporters of ASEAN perform rather well regarding the diversification of export destinations. Beginning with coal, Indonesia, a regional coal producer and net exporter, engages in a rather unconcentrated coal market; the biggest share of the coal exports is to China (23%), followed by India (20%) and Japan (14%). The HHI rates for the rest of the countries, however, indicate high concentration on specific export destinations. The Philippines, with the highest HHI rate, exported almost 90% of their coal to China. As for crude oil diversity of export destinations, Brunei has the lowest HHI with the exports that diversified among Korea (19%), India (18%), Australia (15%), and so on. Vietnam has the second-lowest HHI, but the exports are highly concentrated on Japan (30%) and Australia (21%). Indonesia, Malaysia, and Singapore also have concentrated HHI values. Thus, by comparison, Brunei has the best relative diversity of crude oil export destinations of the ASEAN countries. Considering natural gas, there is no country with an HHI value less than 0.15. Myanmar, in contrast, has the absolute index of 1, which refers to one trading partner (Thailand). Singapore, on the other hand, has the lowest HHI of the refined oil export market, followed by Thailand. In the overall HHI diversity for energy export destinations, Indonesia has better rates across four energy products compared to other ASEAN countries.
Figure 46. Market concentration of energy exports.
Socsci 04 01269 g046

3.5.3. Energy Market: Diversity of Import Source Countries

While the lack of diversified trade partners for energy-exporting countries is linked to economic dependence, the lack of import source countries (or suppliers) indicates supply dependence. A concentrated energy market hinders the resilience of the energy system against disruptions or sudden price changes. By diversifying import counterparts, the country can switch to other trading partners during emergency and leverage the risk of overreliance.
According to Figure 47, the Myanmar energy market is highly concentrated. In fact, the value of 1 suggests that there is only one trade partner available. However, it is possible that this is because Myanmar is new to the external market and its economic development is still evolving. Even distribution and diversification of energy import suppliers is essential in reducing the vulnerability of this circumstance. Cambodia also has a similar issue in terms of the crude oil market. Similarly, the Philippines’ coal market concentration is also concentrated on one trading partner, e.g., 97% of the Philippines’ coal imports are from Indonesia. Countries with the best HHI diversity indicator that reflects an unconcentrated market condition are Singapore’s refined oil sector (0.07), followed by Thailand from the same category (0.12). Malaysia’s crude oil and the Philippines’ natural gas HHI values of 0.13 also represent diversified import source countries.
Figure 47. Market concentration of energy imports.
Socsci 04 01269 g047
Within this aspect, the diversification of trade counterparts for both energy-exporting and energy-importing countries is crucial to the enhancement of energy security. The rationale for improving the market concentration is to lessen vulnerability regarding possible supply or external demand disruption or other political disputes that may lead to energy insecurity.

4. Energy Security Contexts of ASEAN Member Countries

This part summarizes major findings from the previous section, identifies primary energy security issues of concern for each country as reflected through the assessment, and discusses relevant policy implications. According to considerable differences in individual performances among the nine ASEAN countries and their diverse energy contexts, these affect how the findings in certain indicators should be interpreted. Once the issues are identified, we discuss what the policy implications are and how policy-makers can address the problems.
In the first component, overall energy balance presents the mixes of primary energy supply, electricity generation, and sectoral final energy consumption. The findings reflect not only country-specific contexts regarding energy resources and demands, but also the gap of economic development between developing and developed countries in terms of energy infrastructure development. In fact, the nine countries are divided into countries that are heavily dominated by fossil fuels (Brunei and Singapore), countries suffering from energy poverty that are heavily dominated by traditional biomass utilization (Cambodia and Myanmar), and countries with moderate energy resources that have rather diversified mixes (Indonesia, Malaysia, the Philippines, Thailand, and Vietnam). Final energy consumption by sector also differs among the countries. However, due to the excessive share of residential energy consumption in the least developed countries, the sectors that consume the most energy of ASEAN include the residential, industry, and transport sectors. The non-energy sector, however, takes up the most energy consumption in the cases of Brunei, Singapore, Thailand, and Malaysia. The difference in sectoral energy consumption reflects the difference in the country-specific energy security context. For instance, the energy insecurity of Cambodia would mainly impact its residential sector while the energy insecurity of Vietnam would mostly affect the industry sector.
The utilization of fossil fuels and traditional biomass is another primary issue of concern for ASEAN countries regarding the primary energy supply. Hydrocarbon-based energy mixes of ASEAN countries have led to controversy over the development dilemma and the inevitable link between energy and the environment [61]. To reiterate, the development of energy infrastructure based on fossil fuels as a primary energy source is far more economically practical and accessible than advanced energy technology that is costly and requires technological readiness. Each country has to ponder which should be a priority: cheaper fossil fuels that could be harmful to the environment; conventional renewable energy utilization that does not emit carbon dioxide, but requires large land areas; more expensive and challenging advanced energy technology (e.g., fourth-generation nuclear power plant, cutting-edge modern renewables, or hydrogen and fuel cells) that is environmentally friendly; or a hybrid energy system that is the combination of multiple choices. Nevertheless, focusing on energy security, each country requires specific policy measures that correspond to its energy context and sensitivity. These overall indicators alone are not sufficient.
Development gaps and different energy contexts among ASEAN countries are further emphasized in the second component, the socio-economic aspect. While Myanmar, Cambodia, the Philippines, and Indonesia have been struggling to provide modern energy services nationwide, the electrification rate among the rest of the ASEAN countries is almost 100%. For per capita indicators, Brunei and Singapore have the highest and most distinct primary energy supply per capita and final energy consumption per capita, whereas Cambodia, Myanmar, and the Philippines have significantly low energy supply and consumption per capita. The rest of the ASEAN countries are concentrated somewhere in the middle. However, based on primary energy intensity and the intensity of final energy consumption, Singapore is the only country with remarkably decreasing values, which implies successful energy policy measures to improve energy efficiency [56]. In addition, by comparison, even though Cambodia, Myanmar, Indonesia, and the Philippines all have low electricity use per capita, the different energy development status (as shown through the nationwide electrification rate) has left the question of why the Philippines’ electrification rate and per capita indicator are rather low—whether it is because of the successful energy efficiency measures like in Singapore or it is because the Philippines is comprised of numerous distributed smaller islands that make a challenge for grid development like in Indonesia.
Different from the per GDP indicator, which reflects the use of a certain amount of energy/electricity to produce GDP, the per capita indicator shows domestic consumption. Due to the differences in country-specific energy contexts, the indicators can be interpreted differently. For countries with more mature energy development, a decrease in per capita and intensity indicators could be interpreted as positive change with improved efficiency [62]. On the other hand, for countries that have not yet reached countrywide energy accessibility, a decrease in those indicators could be interpreted as negative change where energy accessibility could not keep up with the increasing population (per capita indicator) or the country had to use more units of GDP to produce energy (intensity indicator). Since the concerns are different, the interpretation of these indicators must consider relevant country-specific contexts.
Thus, in the long run, countries that hit a plateau in providing the citizens’ access to modern energy services, which, in this study, include Brunei, Malaysia, Singapore, Thailand, and Vietnam, should aim to reduce energy demand and consumption per capita by improving the efficient use of energy and electricity (e.g., technological changes, conversion to more efficient power generation systems, mandatory regulations for energy-efficient industry and buildings, fuel-efficient vehicles, etc.). For countries that are still in pursuit of energy infrastructure development, such as Cambodia, Indonesia, Myanmar, and the Philippines, the goal is completely opposite to the previous group. Here, designed policy packages should prioritize adequate accessibility to energy services. In the short- to medium-term, policy measures should aim to induce and encourage behavioral changes towards energy and electricity conservation (e.g., a program to raise public awareness towards the significance of energy efficiency, a program to provide incentives for energy conservation, etc.). However, policy-makers should refer to sectoral energy indicators to narrow down which sector they should emphasize.
The third part analyzes domestic energy resources measured by indicators on energy self-sufficiency, the reserves-to-production ratio, and refining capacity. ASEAN countries are clearly divided into energy resource-rich and resource-poor countries. The physical availability of energy resources and reserves is not only more than adequate to meet domestic demands, but enough to also cover external demands (for exports). For instance, Indonesian coal self-sufficiency is quintuple to domestic consumption, while Brunei’s crude oil production is more than 15 times greater than what the country consumes. Similarly, Myanmar’s natural gas self-sufficiency is extensive. However, countries with lesser resource prosperity, which include Cambodia, the Philippines, Thailand, and Singapore, are more exposed to supply disruptions from both domestic inadequacy and interruption of the imports. As a result, to provide an adequate and stable amount of energy supply to match the demand is the primary energy security issue for these countries.
Considering the security of the energy supply, there is no doubt that domestic resource availability plays an important part in enhancing the energy security situation of a country. Still, as seen from diverse energy contexts, the daunting question that follows is, by comparison, whether the energy security of countries with energy resources is better (or more secured) than those without. However, in terms of policy implications, countries with abundant energy resources should be aware of the possible clash between domestic and external energy demands. On one hand, exporting countries should not exploit fruitful resources and over-export. On the other hand, efficient domestic energy use should be taken into account. Sustainable consumption and the acquisition of energy resources are key policies. On contrary, for countries with limited amounts of resource availability, one possible option is to seek domestic energy production potentials, e.g., energy conversion from municipal wastes, nuclear power generation, or alternative and renewable energy (solar PV, wind power, tidal power, geothermal power, hydroelectricity, piezo electricity, energy crop plantations and biofuels, etc.). However, it should be noted that, in most cases, renewable energy is not entirely indigenous; system parts and devices still need to be imported. The issue of rare earth elements should also be considered [63].
The fourth part measures the extent to which each country is vulnerable to overseas resources and external demands. The assessment first focuses on the openness to international energy trade, which is separated into two standpoints: exporting countries and importing countries. While the energy trade per GDP of Brunei, Indonesia, Malaysia, Myanmar, and Vietnam shows how much the energy sector contributes to their economic growths, the results from the same indicator indicate how much the economies of Cambodia, the Philippines, Singapore, and Thailand are monetarily inclined due to energy imports. Indicators on energy trade also reveal the mixture of energy producers and exporters, e.g., Brunei Darussalam (crude oil and natural gas), Indonesia (coal, crude oil, natural gas, and refined oil), Malaysia (crude oil and natural gas), Myanmar (natural gas), Singapore (refined oil), and Vietnam (coal and crude oil), and energy importers, e.g., Cambodia (coal, oil products, and electricity), the Philippines (coal, crude oil, and refined oil), Singapore (coal, crude oil, natural gas, oil products, and natural gas), and Thailand (coal, crude oil, natural gas, oil products, and electricity), of ASEAN.
The assessment on the reliance over external demands and foreign resources is highly context-dependent and differs from country to country. For example, Singapore is a net importer of coal, crude oil, and natural gas, whereas more than one-third of the Brunei economy is based on the international energy trade. The implication of the assessment infers that, while Singapore is considered vulnerable to the disruption of energy supply, Brunei’s vulnerability is on the country’s income. The comparison of the assessment results within the region should embrace this difference in contexts as well.
Starting with importing countries, although the idea of being completely energy-independent is merely a myth [64,65,66], particularly when domestic energy resources are an issue, designed policies, for medium- to long-term goals, should aim to reduce import reliance by improving energy efficiency and controlling demand. Energy reform to terminate fossil fuel and electricity subsidies (especially those that need to be imported) is highly recommended. Among ASEAN countries, Singapore and the Philippines are the only two countries that do not subsidize energy prices. Energy and fuel subsidization could hinder the efficient and sustainable use of energy, although it increases investments in exploration and production. In addition to demand control, energy-importing countries should adopt policies to reduce supply risks. For short- to medium-term goals, the establishment of emergency stockpiling and fuel buffer stock is one of the most effective ways to reduce the impacts of supply disruptions. For the longer run, the diversification of the energy supply by increasing alternative and renewable energy that is domestically produced is another way to reduce reliance.
For energy producers and exporters, the best policy measure for resource sustainability is to improve energy efficiency. One policy option is to trigger more investments in exploration and production activities that maximize advanced and enhanced recovery techniques. Apart from upstream activities, downstream energy production should also be considered to replace unnecessary fuel imports. Using information and technology, energy-producing countries should invest in overseas energy production through joint investments in countries that have energy resources but lack the investment and technology to acquire those resources. Nevertheless, the encouragement of efficient energy use is highly recommended. Balancing between the domestic and external energy demand is significant. Similar to energy-importing countries, the abolition of fuel subsidies is an effective way to manage domestic demand in long term. Energy producers may find more difficulties in implementing the measure since the people could be more comfortable with state-controlled low energy and fuel prices. As a result, public awareness of energy efficiency and the definite availability of energy resources is a priority. For external demand, policy-makers can control and manage it via production output. Still, the diversification of export industries could lessen possible impacts from overreliance on the exportation that leaves the country exposed to market risks.
The last component assesses two common practices to reduce vulnerability: the diversification of the energy supply and the geographical diversification of trade partners. Brunei and Singapore have the least diversity of primary energy, followed by Myanmar, Malaysia, the Philippines, Thailand, and Vietnam, whereas Indonesia has the highest PES diversity. Even though the diversification of the energy supply should get a priority in order to obtain a more balanced energy mix, it is not quite an option, particularly when domestic energy production is not available either due to depleting resources or cost-inefficiency. As a result, the diversification of energy import sources is a more practical alternative. Geographical diversification of export destinations may not appear to have such significant impacts towards the enhancement of energy security compared to importing countries, but it contributes to a more secure market engagement for energy producers and exporters.
While the diversification of the energy supply could minimize the impacts of disruption risks, the diversification of trade partners leverages market risks. Over-reliance on specific energy supplies and trade partners could lead to vulnerability from energy supply shocks caused by energy politics [67]. The usual policy strategy is to choose trade partners with stable domestic political conditions and good export credits. This seemingly simple measure is, however, crucial in ensuring the security of the energy supply. From the findings, for example, one may question the comparative performance between a net-energy importer like Singapore, which relies on 100% of its energy imports, and Thailand, which has some domestic production and relies on one-third of its natural gas imports. Looking closer at trade partners, it is more likely that Singapore has a more secure importation of energy resources due to the portfolio of import source countries while Thailand imports from countries with higher political instability. The point is that, once the import is inevitable, policy-makers should seek to reduce market risks that would lead to supply interruption.
For energy producers and exporters, the diversification of the energy supply is quite different from the importing perspective. Having other countries reliant on our exports of energy supply could be considered a positive dependence, which means the exporting countries have some sort of superior power over the reliant countries. However, to a certain extent, the exporter also economically relies on the importers, although it should be noted that the significance of the reliance is relative to the size of the export to the country’s income. Thus, to ensure a stable and predictable flow of external demand, policy-makers should pay appropriate attention to the improvement of its export credits and portfolio. In the growing competitiveness of international energy markets, importers have a variety of trade partners to choose from. Having a reliable portfolio would attract new trade counterparts and ensure that current trade partners would not switch to other supplies. Apart from strengthening export credits, another measure is to join an investment with major multinational energy enterprises.

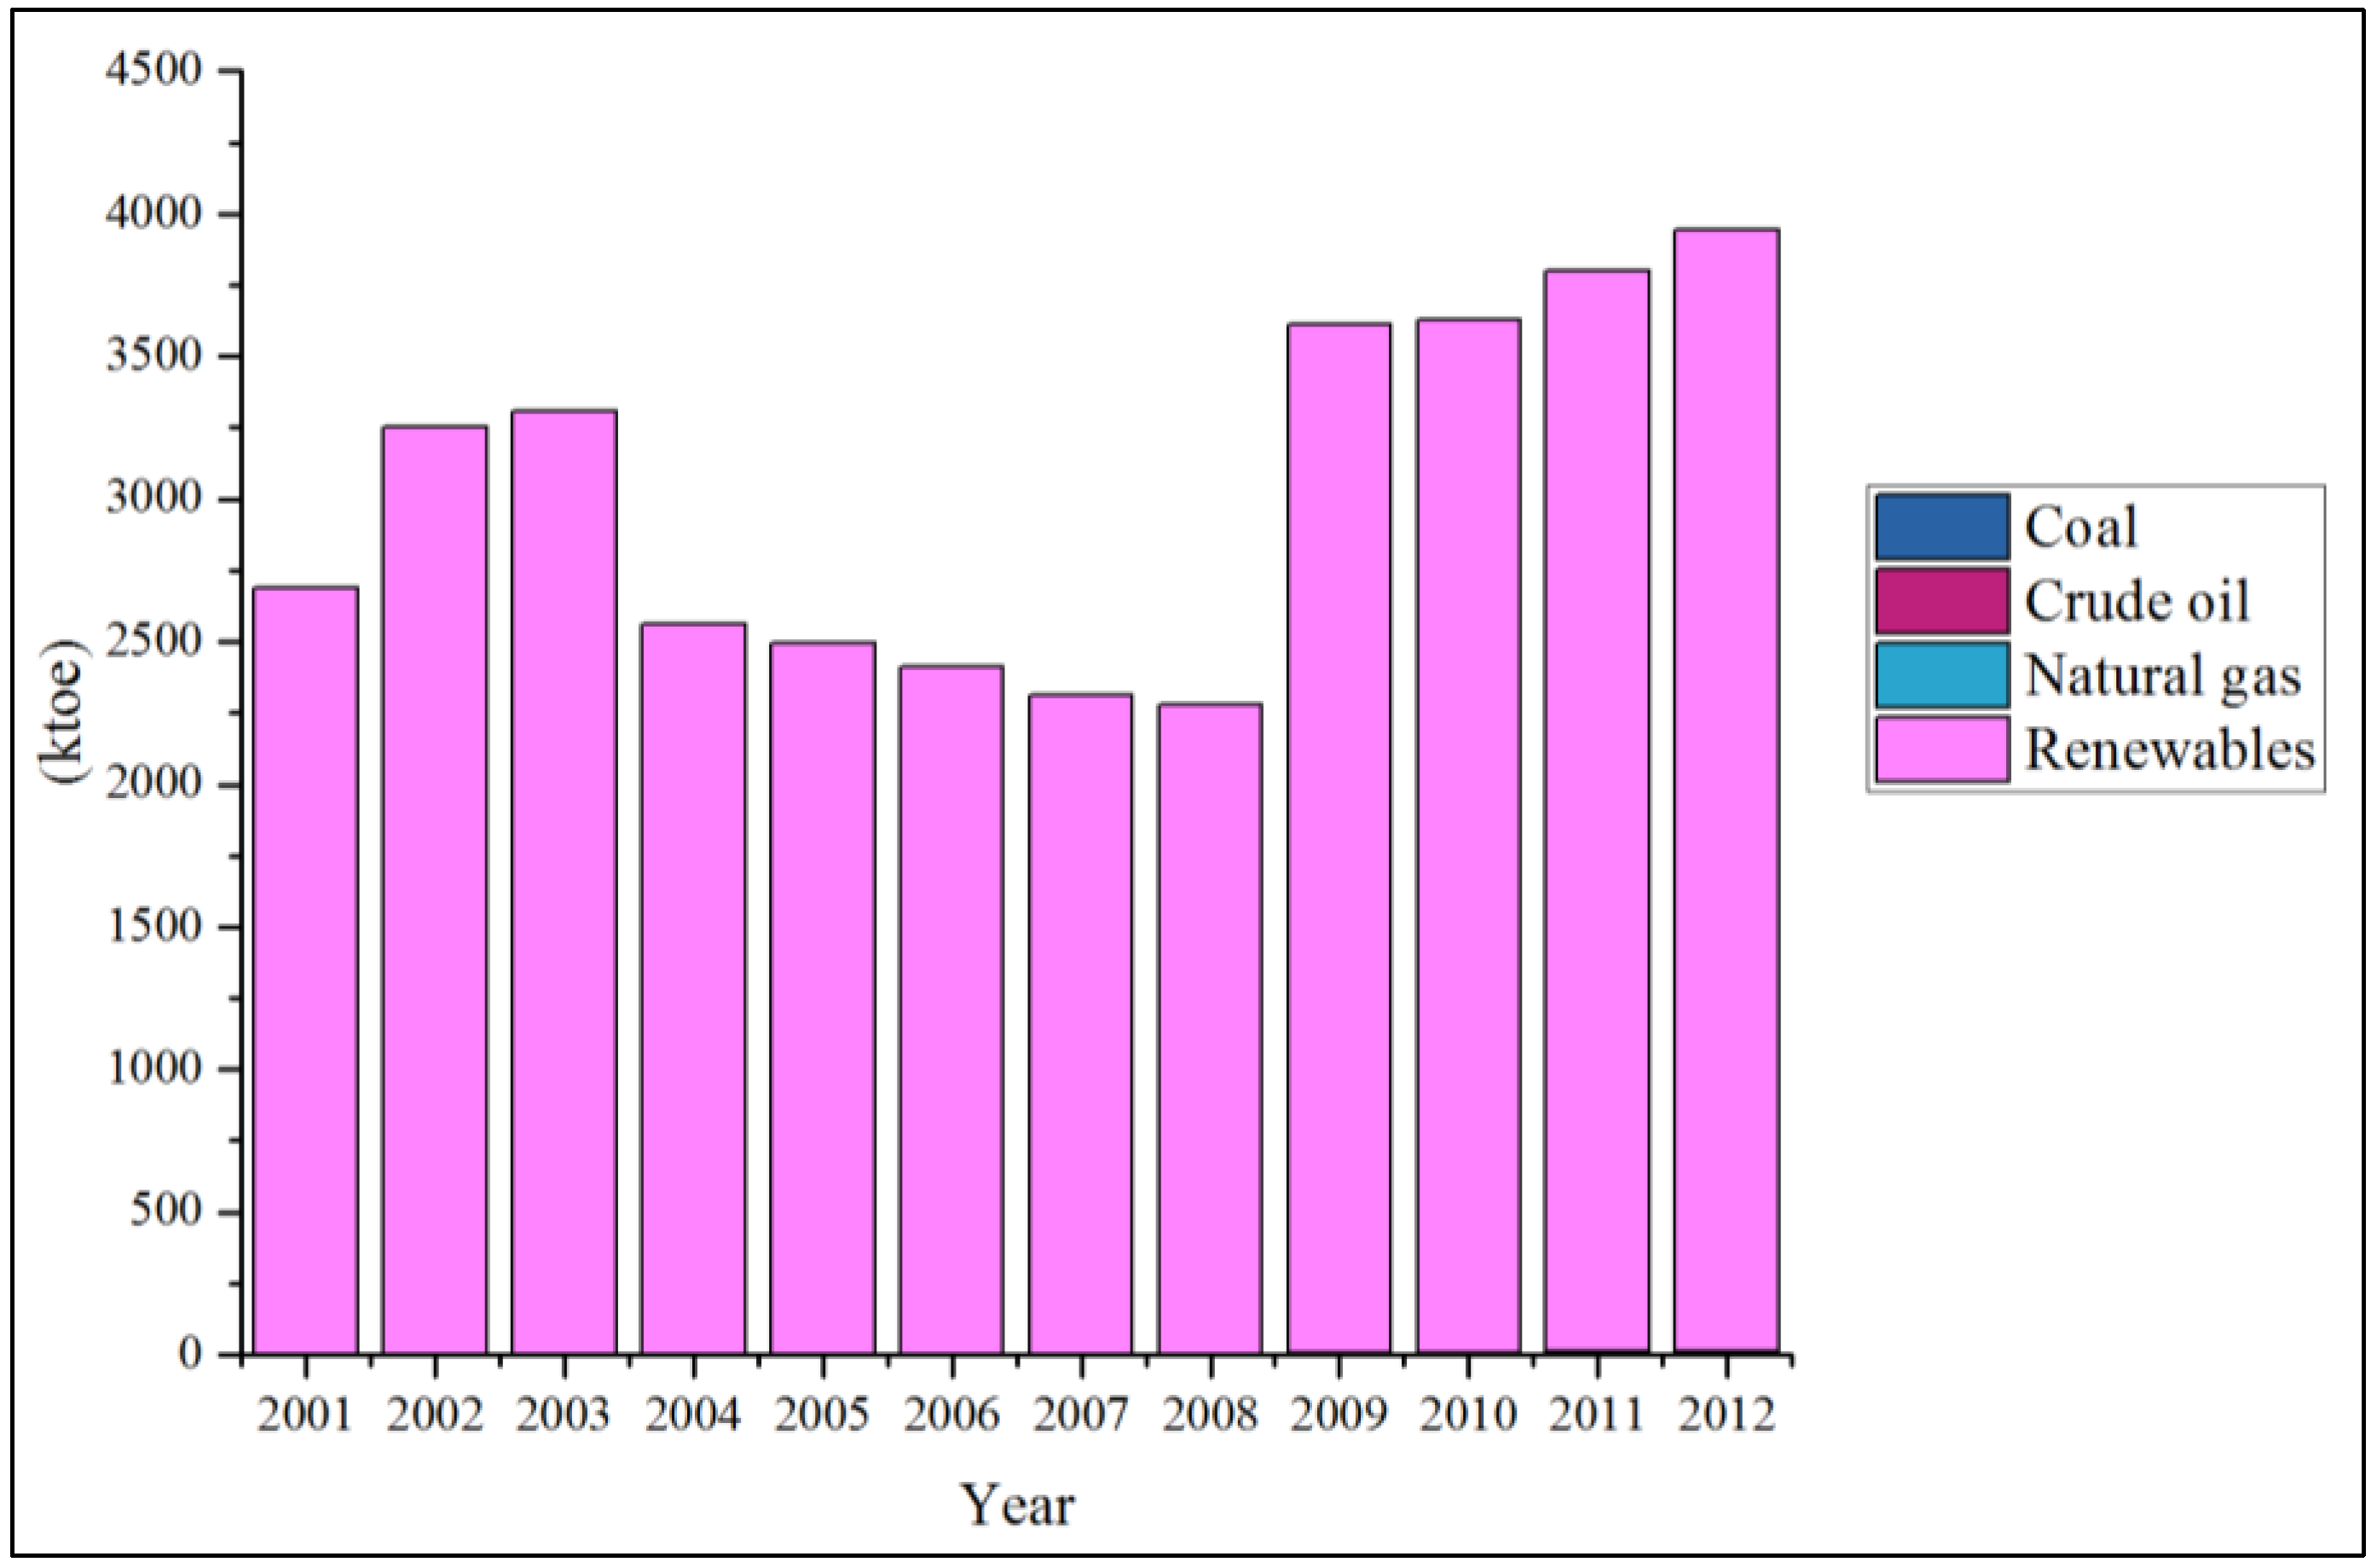
5. Concluding Remarks

This study assessed the energy security situations and performances of nine ASEAN member countries over the past 12 years. By expanding the definition of energy security and the inclusion of generalized indicators, the findings show country-specific energy security contexts. At the national level, not only do the indicators reflect different energy security contexts, but the results also suggest that the differences in the contexts affect the interpretation of the indicators. As mentioned, sometimes a higher value of an indicator can be interpreted as both a better and worse security of energy supply. Nevertheless, the comparison that is based on a broad framework has allowed us to capture the diversity and the interconnection (or interdependence) among the individual ASEAN countries. The way some ASEAN member nations have abundant fossil fuel resources while others rely heavily on imports helps create the image of regional self-sufficiency of the energy market, which could enhance the geographical diversification of export destinations and import source countries. Intra-regional energy markets would also contribute to other dimensions of the energy security balance, e.g., by lessening vulnerability from transport risks and chokepoint shares. Self-reliance within the region could thus be considered as a way to improve the energy security of a nation and, of course, the whole region. On the other hand, the difference in the contexts, which leads to different issues of energy security concerns, could hinder the prospect of regional cooperation for energy security.
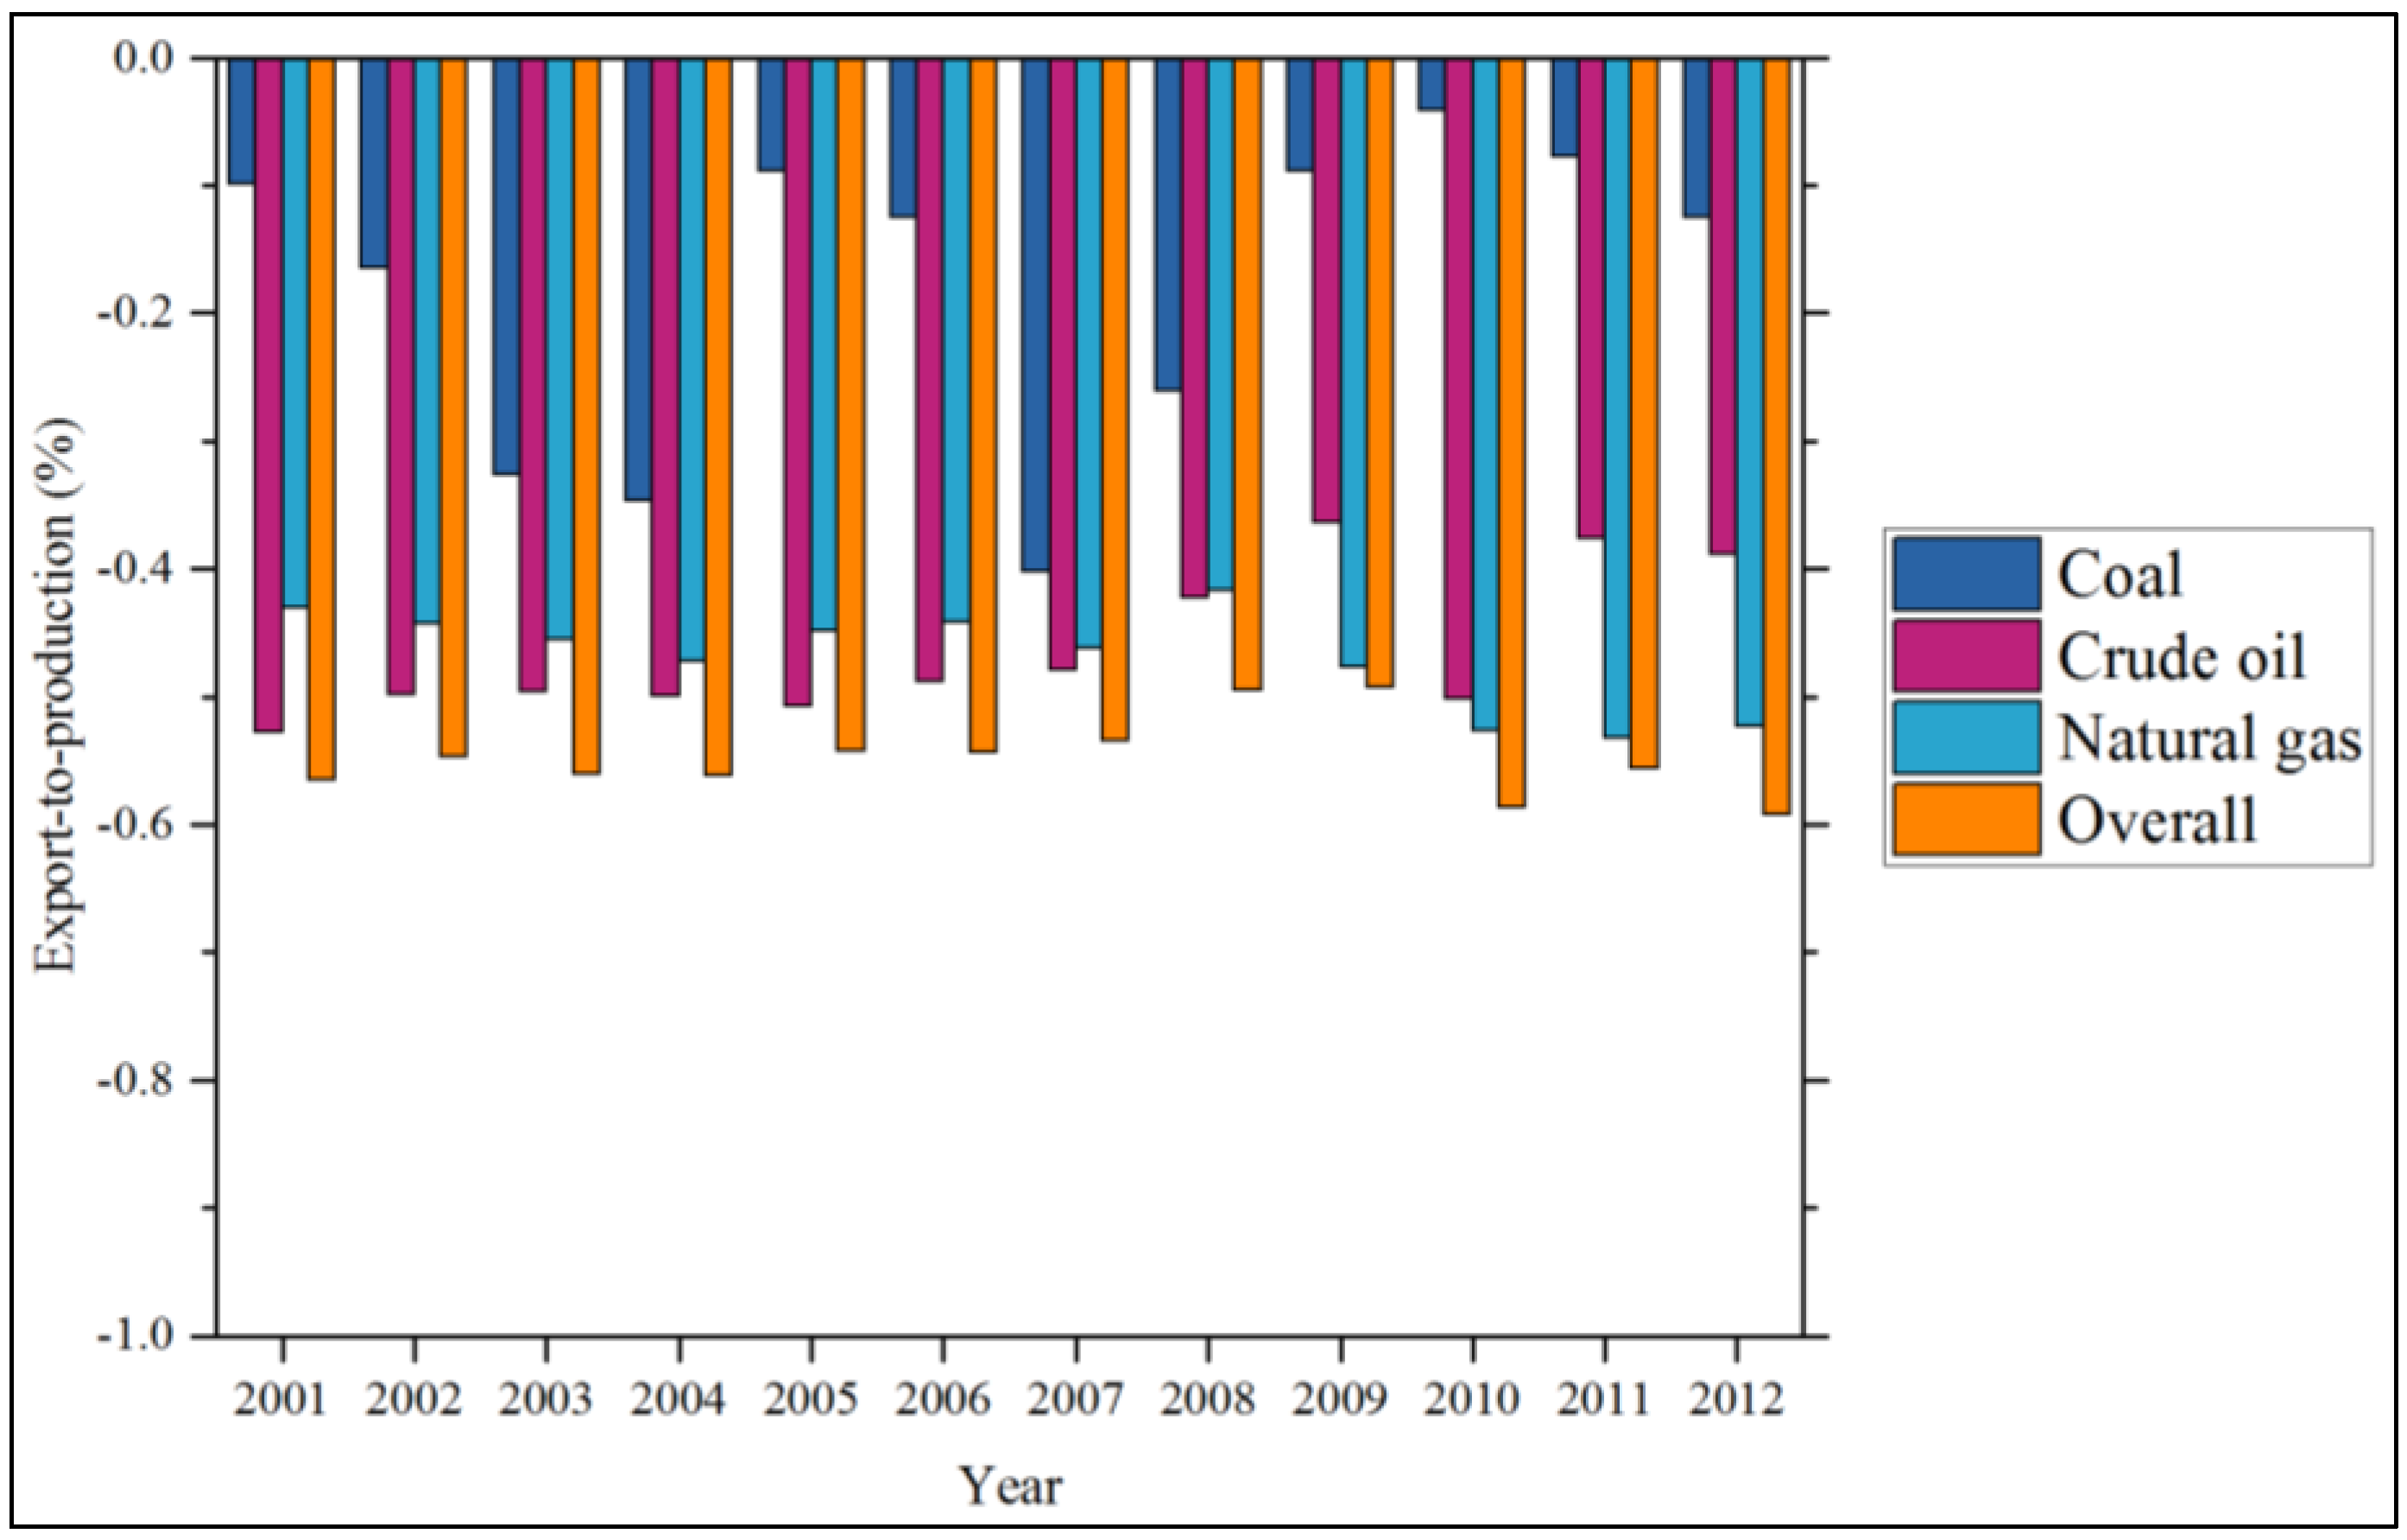
However, to capture multifaceted dimensions of energy security, the assessment requires a large number of indicators. Although the study did provide initial assessments of overall energy security situations of the ASEAN countries, other limitations remain. Due to data limitations, we have excluded Lao PDR, a landlocked country in the middle of the region, and some factors such as the distinction between traditional and modern renewable energy utilizations, country-specific energy policies, geographical and transport risks (chokepoints and critical points), and energy-induced environmental risks. Further study could be improved by linking the assessment results to actual energy policy measures to examine whether the actions contribute to the security of the energy supply or not. Nonetheless, it is hoped that this study sheds light onto the energy security performances of the nine countries. Future work would seek to include in-depth analysis on energy interdependence among ASEAN countries at a regional level and the aggregation of relevant indicators, which would also contribute to comparative analysis.

Acknowledgments

This paper is based on an ongoing study “Energy Security and International Relations: The case of regional cooperation in Southeast Asia”, supported by the Ministry of Education, Culture, Sports, Science and Technology of Japan. Some initial results were presented at the 11th Eco-Energy and Materials Science and Engineering (11th EMSES) held on 18–21 December 2013 at Phuket, Thailand. The authors are extremely grateful to the three anonymous referees for their valuable comments. The authors would also like to thank Dr. Benjamin C. McLellan for his thoughtful feedbacks on the drafts.

Author Contributions

Both authors conceived and designed the study. Kamonphorn Kanchana collected and analyzed the data as well as wrote the article; Hironobu Unesaki supervised all steps and contributed to the writing of the paper.

Conflicts of Interest

The authors declare no conflict of interest.

References

  1. Felix Ciută. “Conceptual Notes on Energy Security: Total or Banal Security? ” Security Dialogue 41 (2010): 123–44. [Google Scholar] [CrossRef]
  2. Vaclav Smil. “World History and Energy.” In Encyclopedia of Energy. Edited by Cutler J. Cleveland. New York: Elsevier, 2004, pp. 549–61. [Google Scholar]
  3. IEA. Towards a Sustainable Energy Future. Paris: Organisation for Economic Co-Operation and Development, 2001. [Google Scholar]
  4. Christian Winzer. “Conceptualizing energy security.” Energy Policy 46 (2012): 36–48. [Google Scholar] [CrossRef]
  5. Modassar Chaudry, Paul Ekins, Kannan Ramachandran, Anser Shakoor, Jim Skea, Goran Strbac, Xinxin Wang, and Jeanette Whitaker. “Building a Resilient UK Energy System.” Research Report. London, UK: UK Energy Research Centre (UKERC), 14 April 2011. Available online: http://nora.nerc.ac.uk/16648/1/UKERC_energy_2050_resilience_Res_Report_2011.pdf (accessed on 5 May 2015).
  6. APERC. A Quest for Energy Security in the 21st Century. Tokyo: Institute of Energy Economics, 2007. [Google Scholar]
  7. United Nations Development Programme. “UNDP and Energy Access for the Poor: Energizing the Millennium Development Goals.” 2010. Available online: http://www.undp.org/content/dam/aplaws/publication/en/publications/environment-energy/www-ee-library/climate-change/undp-and-energy-access-for-the-poor/2593.EnergyAccess_Booklet_Revision02.pdf (accessed on 23 December 2014).
  8. Daniel Yergin. “Ensuring energy security.” Foreign Affairs 85 (2006): 69–82. [Google Scholar] [CrossRef]
  9. Walter Bryce Gallie. “Essentially contested concepts.” Proceedings of the Aristotelian Society 56 (1955): 167–98. [Google Scholar]
  10. Felix Ciutǎ. “Security and the problem of context: A hermeneutical critique of securitisation theory.” Review of International Studies 35 (2009): 301–26. [Google Scholar] [CrossRef]
  11. Nicholas Hildyard, Larry Lohmann, and Sarah Sexton. Energy Security: For Whom? For What? Dorset: The Corner House, 2012. [Google Scholar]
  12. Bert Kruyt, Detlef P. van Vuuren, H. J. M. De Vries, and H. Groenenberg. “Indicators for energy security.” Energy Policy 37 (2009): 2166–81. [Google Scholar] [CrossRef]
  13. Benjamin K. Sovacool, and Ishani Mukherjee. “Conceptualizing and measuring energy security: A synthesized approach.” Energy 36 (2011): 5343–55. [Google Scholar] [CrossRef]
  14. Vlado Vivoda. “Diversification of oil import sources and energy security: A key strategy or an elusive objective? ” Energy Policy 37 (2009): 4615–23. [Google Scholar] [CrossRef]
  15. Larry Hughes. “A generic framework for the description and analysis of energy security in an energy system.” Energy Policy 42 (2012): 221–31. [Google Scholar] [CrossRef]
  16. Andreas Löschel, Ulf Moslener, and Dirk TG Rübbelke. “Indicators of energy security in industrialised countries.” Energy Policy 38 (2010): 1665–71. [Google Scholar] [CrossRef]
  17. Nicolas Lefèvre. “Measuring the energy security implications of fossil fuel resource concentration.” Energy Policy 38 (2010): 1635–44. [Google Scholar] [CrossRef]
  18. Aleh Cherp, and Jessica Jewell. “Energy Security Assessment Framework and Three Case Studies.” In International Handbook of Energy Security. Edited by Hugh Dyer and Maria Julia Trombetta. Cheltenham: Edward Elgar Pub. Ltd., 2013. [Google Scholar]
  19. Clinton J. Andrews. “Energy security as a rationale for governmental action.” IEEE Technology and Society Magazine 24 (2005): 16–25. [Google Scholar] [CrossRef]
  20. Morgan Bazilian, Fergal O’Leary, Brian O. Gallachoir, and Martin Howley. Security of Supply in Ireland 2006. Cork: Energy Policy Statistical Support Unit, Sustainable Energy Ireland SEI, 2006. [Google Scholar]
  21. Machiel Mulder, Arie ten Cate, and Gijsbert Zwart. “The economics of promoting security of energy supply.” EIB Papers 12 (2007): 38–61. [Google Scholar]
  22. Chloe Le Coq, and Elena Paltseva. “Measuring the security of external energy supply in the European Union.” Energy Policy 37 (2009): 4474–81. [Google Scholar] [CrossRef]
  23. Klaus-Dietmar Jacoby. “Energy Security: Conceptualization of the International Energy Agency (IEA).” In Facing Global Environmental Change. Edited by Hans Günter Brauch, Navnita Chadha Behera, Patricia Kameri-Mbote, John Grin, Úrsula Oswald Spring, Béchir Chourou, Czeslaw Mesjasz and Heinz Krummenacher. Berlin and Heidelberg: Springer Berlin Heidelberg, 2009, pp. 345–54. [Google Scholar]
  24. Benjamin K. Sovacool, and Harry Saunders. “Competing policy packages and the complexity of energy security.” Energy 67 (2014): 641–51. [Google Scholar] [CrossRef]
  25. Eunju Jun, Wonjoon Kim, and Soon Heung Chang. “The analysis of security cost for different energy sources.” Applied Energy 86 (2009): 1894–901. [Google Scholar] [CrossRef]
  26. ASEAN Secretariat. Roadmap for an ASEAN Community 2009–2015. Jakarta: ASEAN Secretariat, Publications Unit, 2009. [Google Scholar]
  27. ASEAN Secretariat. Memorandum of Understanding on the ASEAN Power Grid. Jakarta: ASEAN, 2007. [Google Scholar]
  28. Philip Tammen. “ASEAN’s Regional Approach to Energy Security: Taking Member States beyond National and Commercial Interests? ” 2013. Available online: http://www.defence.gov.au/ADC/publications/Shedden/2013/Tammen%20paper%20%28edited%20version%202%29.pdf (accessed on 24 December 2014). [Google Scholar]
  29. Benjamin K. Sovacool. “Reassessing Energy Security and the Trans-ASEAN Natural Gas Pipeline Network in Southeast Asia.” Pacific Affairs 82 (2009): 467–86. [Google Scholar] [CrossRef]
  30. N. Agya Utama, Andhy M. Fathoni, Mandau A. Kristianto, and Benjamin C. McLellan. “The End of Fossil Fuel Era: Supply-Demand Measures through Energy Efficiency.” Procedia Environmental Sciences 20 (2014): 40–45. [Google Scholar] [CrossRef]
  31. Magdalena Spooner, Mirco Tomasi, Paul Arnoldus, Ǻsa Johannesson-Linden, Fotis Kalantzis, Emmanuelle Maincent, Jerzy Pienkowski, and Andras Rezessy. Member States’ Energy Dependence: An Indicator-Based Assessment. Brussels: European Economy, 2013. [Google Scholar]
  32. Tomoko Murakami, Mitsuru Motokura, and Ichiro Kutani. An Analysis of Major Countries’ Energy Security Policies and Conditions: Quantitative Assessment of Energy Security Policies. Tokyo: IEEJ, 2011. [Google Scholar]
  33. Eshita Gupta. “Oil vulnerability index of oil-importing countries.” Energy Policy 36 (2008): 1195–211. [Google Scholar] [CrossRef]
  34. Robert L. Bogue. “Use SMART goals to launch management by objectives plan.” Retrieved November 15 (2005): 2010. [Google Scholar]
  35. Andy Stirling. “The diversification dimension of energy security.” In The Routledge Handbook of Energy Security. Edited by Benjamin K. Sovacool. New York: Routledge, 2011. [Google Scholar]
  36. Xu Tang, Baosheng Zhang, Lianyong Feng, Simon Snowden, and Mikael Höök. “Net oil exports embodied in China’s international trade: An input-output analysis.” Energy 48 (2012): 464–71. [Google Scholar] [CrossRef]
  37. Yudha Prambudia, and Masaru Nakano. “Exploring Malaysia’s Transformation to Net Oil Importer and Oil Import Dependence.” Energies 5 (2012): 2989–3018. [Google Scholar] [CrossRef]
  38. Yuying Yang, Jianping Li, Xiaolei Sun, and Jianming Chen. “Measuring external oil supply risk: A modified diversification index with country risk and potential oil exports.” Energy 68 (2014): 930–38. [Google Scholar] [CrossRef]
  39. Gail Cohen, Frederick Joutz, and Prakash Loungani. “Measuring energy security: Trends in the diversification of oil and natural gas supplies.” Energy Policy 39 (2011): 4860–69. [Google Scholar] [CrossRef]
  40. IEA. “IEA Energy Database 2012.” 2012. Available online: http://data.iea.org (accessed on 21 May 2015).
  41. The World Bank. “World Data Bank.” 2013. Available online: http://databank.worldbank.org (accessed on 20 May 2015).
  42. IMF. World Economic Outlook (WEO) Database. Washington: International Monetary Fund, 2014. [Google Scholar]
  43. OPEC. Annual Statistical Bulletin 2012. Vienna: Organization of the Petroleum Exporting Countries (OPEC), 2012. [Google Scholar]
  44. BP. “BP Statistical Review of World Energy: Data workbook 1965–2014.” 2015. Available online: http://www.bp.com/content/dam/bp/excel/energy-economics/statistical-review-2015/bp-statistical-review-of-world-energy-2015-workbook.xlsx (accessed on 2 December 2015).
  45. UN Comtrade. “UN Comtrade Statistical Database.” Available online: http://comtrade.un.org (accessed on 21 May 201).
  46. UN Comtrade. “Comtrade Country Code and Name: ISO 2-Digit Alpha.” Available online: http://unstats.un.org/unsd/tradekb/Knowledgebase/Comtrade-Country-Code-and-Name (accessed on 21 May 2015).
  47. US-ASEAN Business Council. “Brunei Darussalam Energy White Paper 2014.” Available online: https://www.usasean.org/sites/default/files/uploads/Energy%20White%20Paper%202014.pdf (accessed on 5 January 2015).
  48. Kongchheng Poch. “Renewable Energy Development in Cambodia: Status, Prospects and Policies.” In Energy Market Integration in East Asia: Renewable Energy and Its Deployment into the Power System. ERIA Research Project Report 2012, No. 26; Edited by Fukunari Kimura, Han Phoumin and Brett Jacobs. Jakarta: ERIA, 2013, pp. 227–66. [Google Scholar]
  49. World Development Indicators Database. “World Bank Gross Domestic Product Ranking 2013.” 2014. Available online: http://databank.worldbank.org/data/download/GDP.pdf (accessed on 12 May 2015).
  50. The World Bank. “World Bank Classification: Country Groups.” 2015. Available online: http://go.worldbank.org/47F97HK2P0 (accessed on 12 May 2015).
  51. Ministry of Industry, Mines, and Energy (MIME). Cambodia Power Sector Strategy 1999–2016; Phnom Penh: Government of Cambodia, 1999.
  52. Chemicals-Technology.com. “Brunei Darussalam Methanol Plant, Brunei Darussalam.” Available online: http://www.chemicals-technology.com/projects/bruneimethanol/ (accessed on 24 October 2015).
  53. IEA. World Energy Outlook 2011. Paris: IEA, 2011. [Google Scholar]
  54. IEA. World Energy Outlook 2012. Paris: IEA, 2012. [Google Scholar]
  55. IEA. World Energy Outlook 2013. Paris: IEA, 2013. [Google Scholar]
  56. IEA. World Energy Outlook 2014. Paris: IEA, 2014. [Google Scholar]
  57. Gerald Foley, and Jose D. Logarta Jr. “Power and politics in the Philippines.” In The Challenge of Rural Electrification: Strategies for Developing Countries. Edited by Douglas F. Barnes. Washington: Resources for the Future, 2007. [Google Scholar]
  58. Government of Cambodia. Energy Sector Development Plan 2005–2024; Phnom Penh: Government of Cambodia, 2005.
  59. UNDP Cambodia. Review of Development Prospects for the Cambodian Oil and Gas Sectors. Phnom Penh: United Nations Development Programme Cambodia, 2006. [Google Scholar]
  60. OPEC. “Member Countries.” Available online: http://www.opec.org/opec_web/en/about_us/25.htm (accessed on 2 September 2013).
  61. Benjamin K. Sovacool. The Dirty Energy Dilemma: What’s Blocking Clean Power in the United States. Westport: ABC-CLIO/Praeger, 2008. [Google Scholar]
  62. Ivan Vera, and Lucille Langlois. “Energy indicators for sustainable development.” Energy 32 (2007): 875–82. [Google Scholar] [CrossRef]
  63. Elisa Alonso, Andrew M. Sherman, Timothy J. Wallington, Mark P. Everson, Frank R. Field, Richard Roth, and Randolph E. Kirchain. “Evaluating rare earth element availability: A case with revolutionary demand from clean technologies.” Environmental Science & Technology 46 (2012): 3406–14. [Google Scholar] [CrossRef] [PubMed]
  64. Scott R. Littlefield. “Security, independence, and sustainability: Imprecise language and the manipulation of energy policy in the United States.” Energy Policy 52 (2013): 779–88. [Google Scholar] [CrossRef]
  65. Benjamin K. Sovacool. “Solving the oil independence problem: Is it possible? ” Energy Policy 35 (2007): 5505–14. [Google Scholar] [CrossRef]
  66. Llewelyn Hughes. “The limits of energy independence: Assessing the implications of oil abundance for U.S. foreign policy.” Energy Research & Social Science 3 (2014): 55–64. [Google Scholar] [CrossRef]
  67. Ashish Ranjan, and Larry Hughes. “Energy security and the diversity of energy flows in an energy system.” Energy 73 (2014): 137–44. [Google Scholar] [CrossRef]