1. Introduction
Side-lit office buildings typically suffer from overly bright perimeter zones and steep light falloff. Large-area windows lead to high solar gains [
1]. Integrated in modern facades (Daylight Redirecting Components (DRCs)) such as micro-structured films, laser-cut panels, prismatic glazing or specifically profiled louvers address this problems possibly in combination with low energy glazing and dynamic sun shading. Daylight Redirecting Components (DRCs) can increase Daylight Autonomy (DA) and reduce direct sun for energy efficiency. They provide evenly distributed daylight for visual comfort and prevent glare. They achieve this by retro-reflecting high altitude sunlight to the outside and redirecting a portion of incoming light to the ceiling thereby illuminating deep zones of the room. In contrast to artificial lighting, Daylight Redirecting Components (DRCs) provide illumination that is correlated to the spectral, temporal and spatial dynamics of actual daylight.
Daylight Redirecting Components (DRCs) are complex optical systems with characteristics that are challenging to plan and design. These characteristics determine the Daylight Redirecting Component (DRC)’s performance under actual circumstances (local weather, orientation, built environment, office layout).
1.1. Goniophotometric Measurement of Bidirectional Scattering Distribution Function (BSDF)
Determining the light distribution of a Daylight Redirecting Component (DRC) under different sky conditions requires the knowledge of its BSDF. The BSDF is a set of hemispherical luminous coefficients defined by paired source and scatter directions [
2,
3]. The latter relates to light distribution in the interior, while the former relates to the acceptance of light from different sky regions.
The BSDF is measured by recording light reaching a receiver from a sample under known illumination for combinations of source and scatter directions. The BSDF is defined for an infinitesimal surface area and an infinitely large set of directions, but can only be measured by a discrete subset of these. The effects of sampling and averaging are inherent in any BSDF measurement and define a characteristic instrument signature [
4,
5]. This signature depends on the following factors:
The continuous function is measured for a finite number of directions, typically given as pairs of source (or incident) and scatter (or receiver) directions , and , .
Due to the finite extents of receiver and source, the BSDF is averaged over their respective areas.
The measured BSDF, which is defined for an infinitesimal surface element, is averaged over the observed surface area, i.e., the sampling aperture.
The instrumentation for such measurements is implemented as scanning or imaging goniophotometers [
6]. Most available BSDF databases are based on imaging devices in academic environments [
7]. The directional resolution of imaging devices is typically low compared to scanning instruments [
8]. The directional resolution further depends on the scatter direction and cannot be configured [
9].
Scanning goniophotometers implement the set of directions by mechanical movement or rotation of the sample (or source) and the receiver. The directional resolution is independent of source and scatter direction and can be configured according to the characteristics of a sample. In practice, the directional resolution is limited by the accuracy and speed of the mechanics, which has been addressed by improved designs [
10].
1.2. Simulation of Daylight Redirecting Components
Lighting simulation provides cost-effective means to predict the performance of Daylight Redirecting Components (DRCs) under actual circumstances e.g., local weather, orientation, built environment or office layout. It is helpful to select suitable Daylight Redirecting Components (DRCs) in planning, to adjust their parameters and to combine them with appropriate glazing. Simulation can support the further development of Daylight Redirecting Components (DRCs) themselves while the comparison to measurement can help to find deviations of production samples from the intended design.
Before the integration of the photon mapping extension,
Radiance was exclusively based on a backward raytracing algorithm [
11]. While backward raytracing is well suited to calculate the light distribution in architectural scenes and provides the necessary tools to generate artificial skies or integrate measured weather data, and suitable material models etc., it is less able to simulate the complex reflections of a detailed geometry as the chosen Daylight Redirecting Component (DRC). The statistic probability of a sample ray hitting the DRC within the specular lobe is too low to resolve the small-scale curved geometry. Inaccuracies are unavoidable in simulations of practical calculation periods.
The photon map extension recently integrated into the
Radiance suite adds a pre-computation step to the standard backward raytracing algorithm [
12,
13]. This extension makes use of geometric models and supports the advanced built-in reflection- and transmission-models in Radiance to describe the optical properties of the surfaces comprising the Daylight Redirecting Component (DRC). Its
forward raytracing algorithm is capable of calculating such complex and detailed DRCs in a reasonable amount of time while the
backward raytracing is still used to calculate the irradiance on the room surfaces. The result is a
bidirectional ray-tracer that allows to simulate a DRC represented by a 3D geometric model and the architectural scene in a single procedure. The accuracy of the photon mapping algorithm is generally noted [
14,
15] and the utilisation of the algorithm with geometric modelling has been examined [
16].
For the comparison of simulation results with measured data the measurement setup can be reproduced in the simulation environment. Such a setup is denoted as
Virtual Goniophotometer. An earlier study utilised a commercial forward ray-tracer to simulate Venetian blinds in comparison to goniophotometric measurements. It provided an error estimate for the comparison but was limited in directional resolution [
17]. Similar setups have further been used to compare scattering models with measurements and to cross-validate BSDF data [
18,
19,
20]. In the previous work it was partly necessary to resample the directional data for comparison as the data sources differed in directional resolution, the instrument’s properties where unknown or the simulation environment limits the options. Resampling implies a loss of information and would considerably reduce the directional resolution of the scanning goniophotometer and suppress the instrument’s signature. As a further consequence some characteristics of the Daylight Redirecting Component (DRC)’s scattering behaviour might be lost.
1.3. The Daylight Redirecting Component
The Daylight Redirecting Component (DRC) (RETROLuxTherm 12 mm [
21]) is a small-scale louver system intended for integration into double glazing (
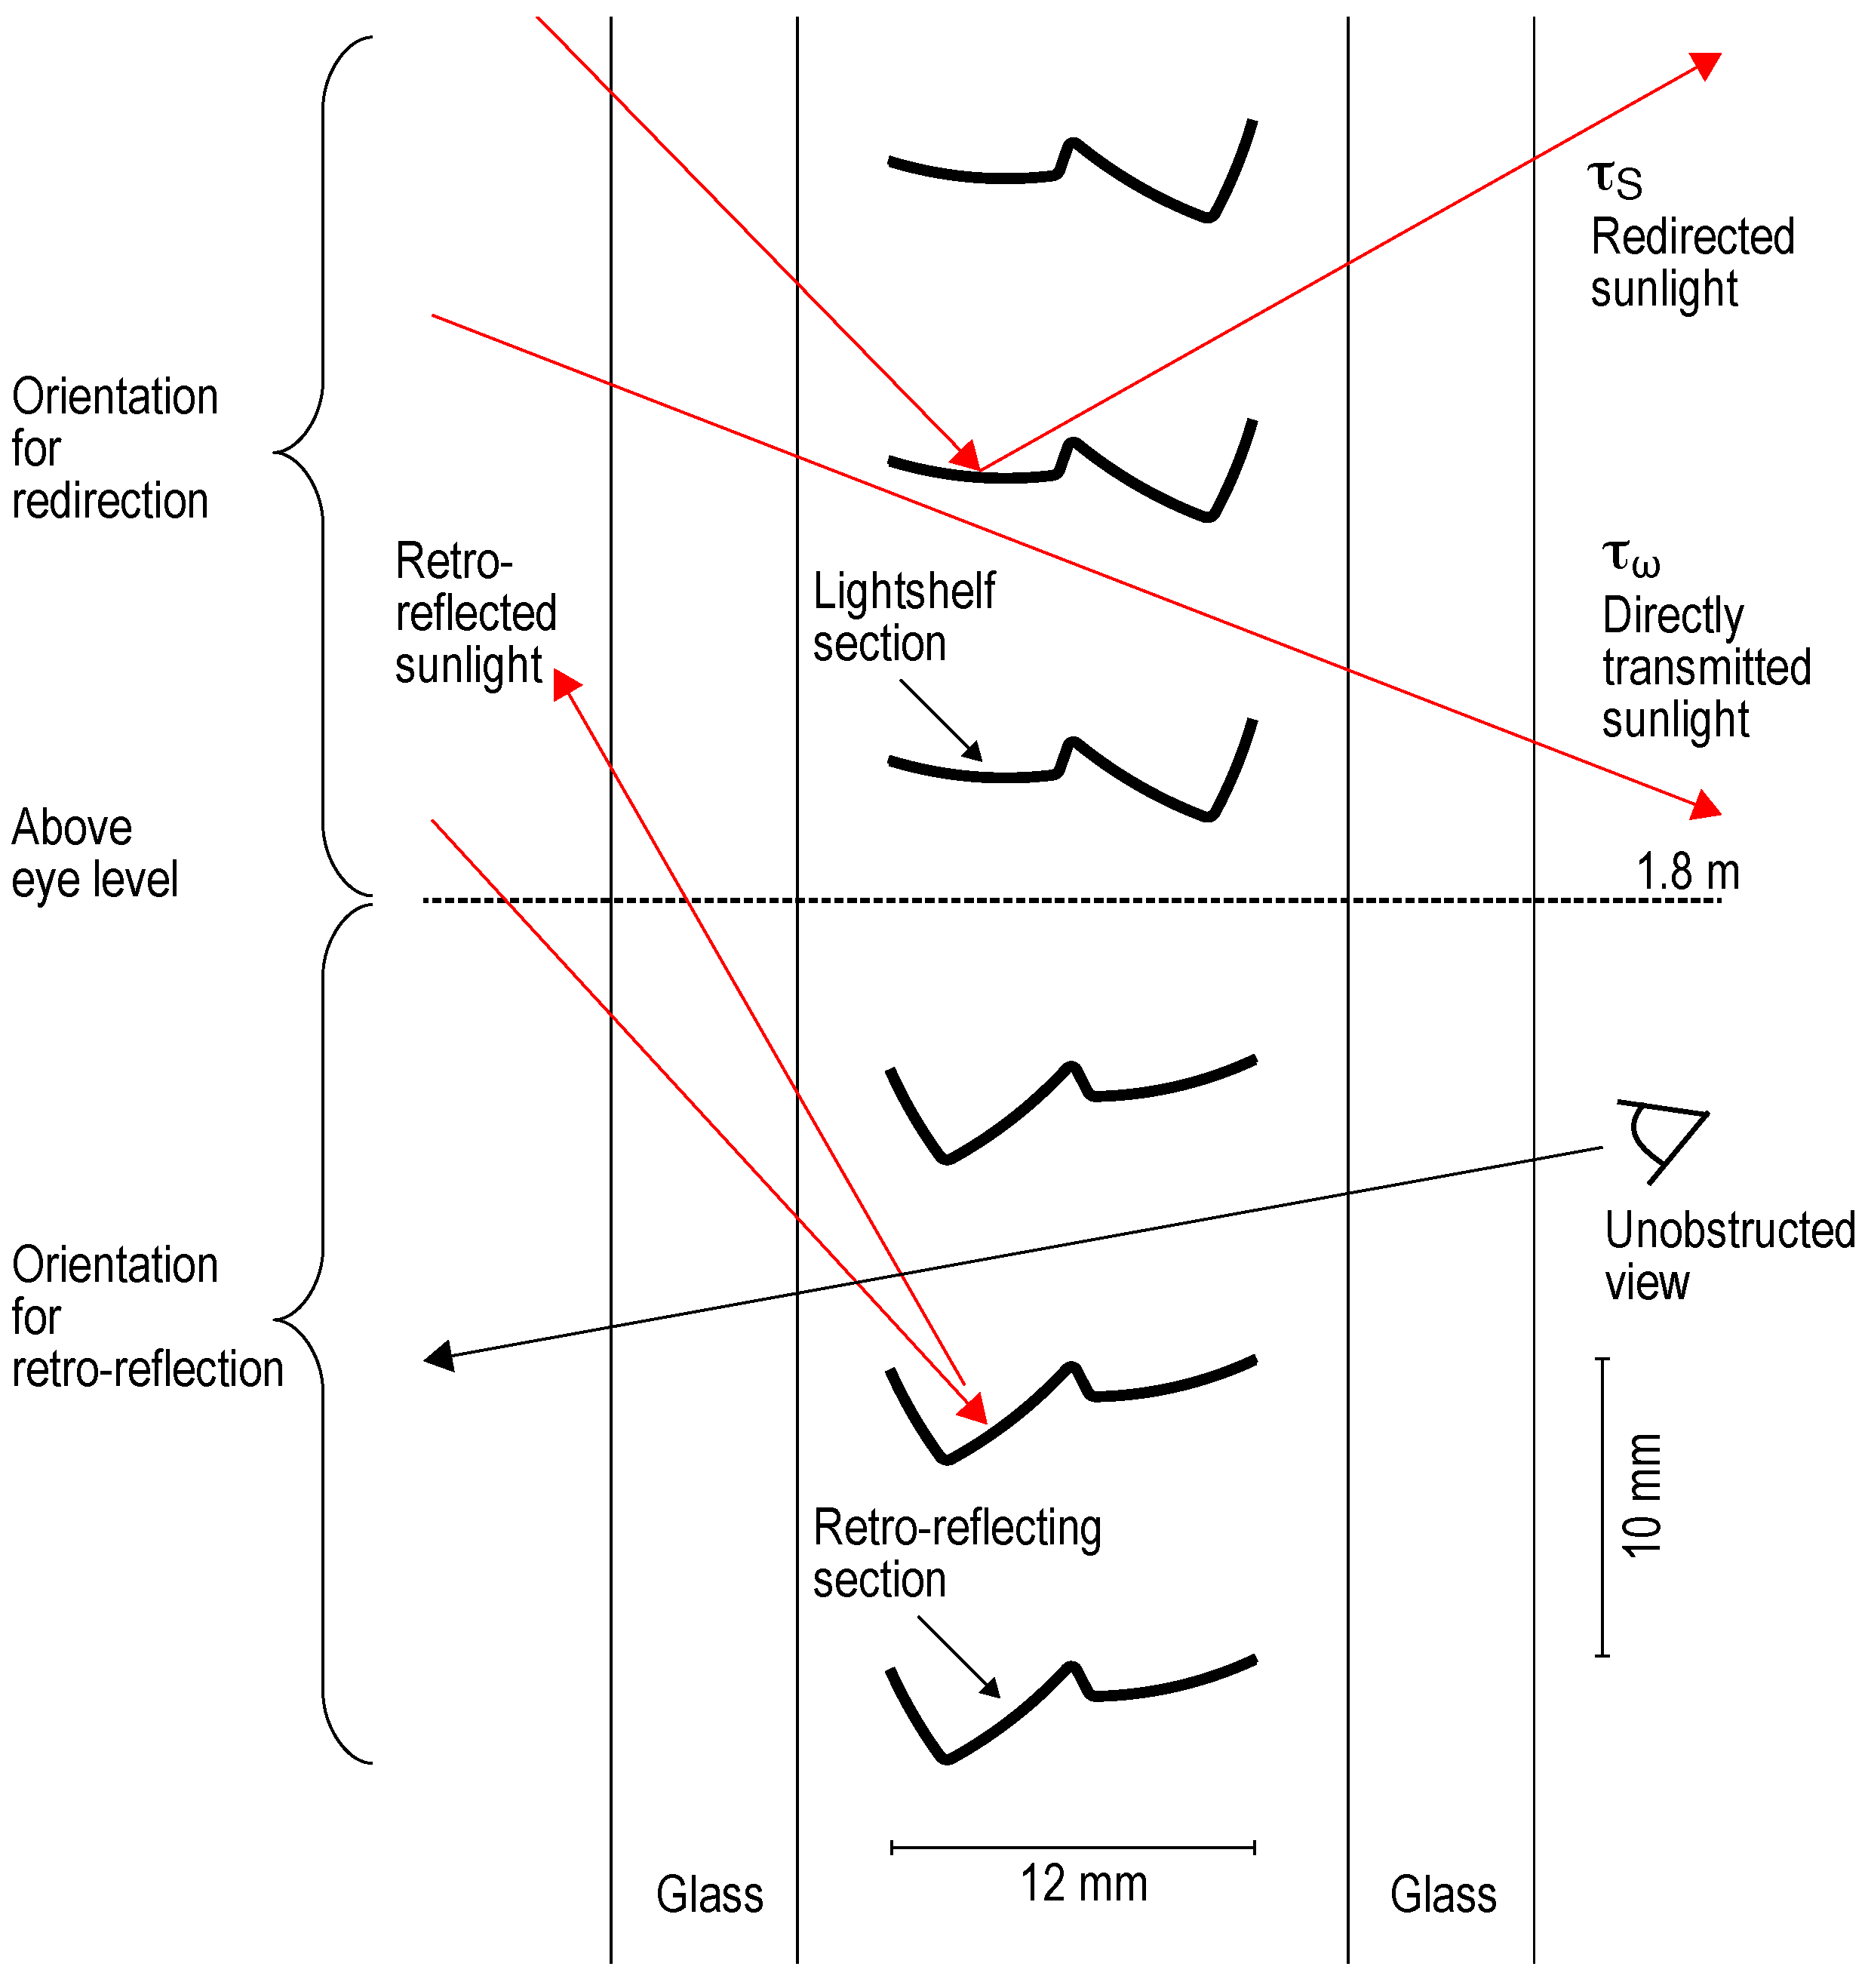
Figure 1). The slats are 12 mm deep and 10 mm apart. In the provided sample they were held by a rectangular frame. The system has no moveable parts and is protected from dust and damage by the glazing. It is optimised for visual transmission (55%–62%), providing an unobstructed view to the outside including the ground.
The top face of the slats is a highly reflective mirroring material, the lower side is covered with white paint of high reflectance. The profile of the slats combines two sections: one forms a light shelf reflecting incoming light upwards into the room for indirect lighting from the ceiling. The other section is designed to retro-reflect light from altitudes above . The slats are typically mounted in two orientations: above eye level ( m) the light shelf section points outwards and is the active part. Below eye level the retro-reflecting section points outwards and is therefore active. Only the upper orientation is assessed in this study.
The geometry of the DRC is affected by a set of configurable parameters but also by unknown variables. The DRC’s design has two adjustable parameters: the distance between the slats and their tilt angle. Tolerances in the exact positioning and inclination of the slats can be expected due to their loose, stress-free mounting in the frame. The impact of the manufacturing of the slats by cold-forming and their material properties are unknown.
The performance data published by the manufacturer is derived from measurements of the actual product, as he is aware that the manufacturing process leads to small geometric deviations from the intended design (
Figure 2). Accordingly, the following assessment includes three different geometric variants of the exemplary DRC:
2. Objectives
This study aims to find, quantify and explain differences between transmission characteristics measured on the cold-formed, small-scale louver system and predictions based on its design. Its results shall contribute to product development and quality assurance. This leads to the following research questions:
How can high-resolution BSDFs of DRCs be qualitatively and quantitatively compared?
What is the difference between the BSDF of the production sample (V1) and the BSDF of the exemplary DRC’s design geometry (V2)?
To what extent do the observed geometric deviations (V3) contribute to the differences between these BSDFs?
3. Method
3.1. Comparing High Resolution BSDF
Measurements or simulations will result in sets of irradiance values for the same measurement points on the sensor sphere. These values represent the amount of light directed from the centre of the sampling aperture to each sensor point (
). The values in these sets are proportional to the light emitted from the illumination system of the physical or virtual goniophotometer (
Figure 3). To compare the results, the power of the respective reference beam
is calculated from
n samples of
and their corresponding solid angles
[
10]:
The reference beam measurements and calculations are conducted for a range of source directions:
and
(with invariant
). By dividing each of the
n measurements by
, the Differential Scattering Function (DSF) and the BSDF can then be calculated for each combination of
and
:
As Equation (
2) shows the definition of the BSDF includes a division by
. For
and
this corresponds to a division by zero, resulting in an exaggeration of irregularities in this area. Therefore the Differential Scattering Function (DSF)—in all other aspects equal to the BSDF—is a more appropriate measure to describe the scattering characteristics of a measured sample, and chosen as basis for this comparison.
3.2. Qualitative Comparison of BSDF Data
The Differential Scattering Function (DSF) can be visualised and qualitatively compared in projections of the transmission hemisphere or in 2-dimensional sections through the scattering plane. The latter is defined for transmission in the sample directions to and . Good qualitative accordance is achieved when all relevant features of the scattering characteristic are represented at similar directions and have similar proportions.
3.3. Comparison Metrics for Directionally Resolved BSDF
The comparison of BSDFs imposes two main challenges. First, to quantify the overall accordance of two distributions, a global metric has to integrate all observed local deviations into a single value; Second, to explain the differences between two BSDFs, deviations must be localized and therefore the directional resolution be maintained.
Among the existing metrics for
global accordance over the hemispherical distribution [
22,
23], a quality index is proposed for applications in the characterization of light sources [
24]:
The metric has been designed to compare measurements of luminaires with different goniophotometers of identical construction. A perfect match would result in . This metric is symmetric with respect to over- and underestimated values. The metric was selected on account of this symmetry and adapted as a novel metric for the comparison of BSDFs. Because the original designation might be misleading in this context, it is henceforth referred to as global accordance ().
To complement the
global accordance by a metric for the accordance of a pair
,
in the transmission hemisphere, resolved by direction
j, a new metric
—referred as
local accordance—is proposed:
To relate global accordance to scattering behaviour that is significant for the intended purpose of the exemplary DRC two integrals are computed: the conical-hemispherical transmittance
, i.e., the integral of the DSF over all sample directions (total transmission), and the biconical transmission
[
25] (direct transmission, see
Figure 3). The latter was calculated as the integral of the DFS at the sample directions
including the part of the collimated beam that is not obstructed by the sample (for nomenclature see [
3,
4]).
To quantify the deviations from the simulations to the measurements of conical-hemispherical transmittance
, and biconical transmission
the percentage error (
) is calculated from these integrals:
3.4. Measuring the BSDF of the Production Sample
The scanning goniophotometer setup consists of an illumination system and a robotic arm that moves a sensor on a virtual sphere (
mm) around the sample [
10]. A sample holder allows the rotation of the sample relative to the optical bench of the illumination system for each source direction
–
(automatic) and
(manual). For any source direction the robotic arm allows high-resolution measurements of scatter directions (typically
) in the transmission hemisphere (
–
–
). The measurement routine includes a measurement without a sample to characterise the illumination system, referred to as
reference beam.
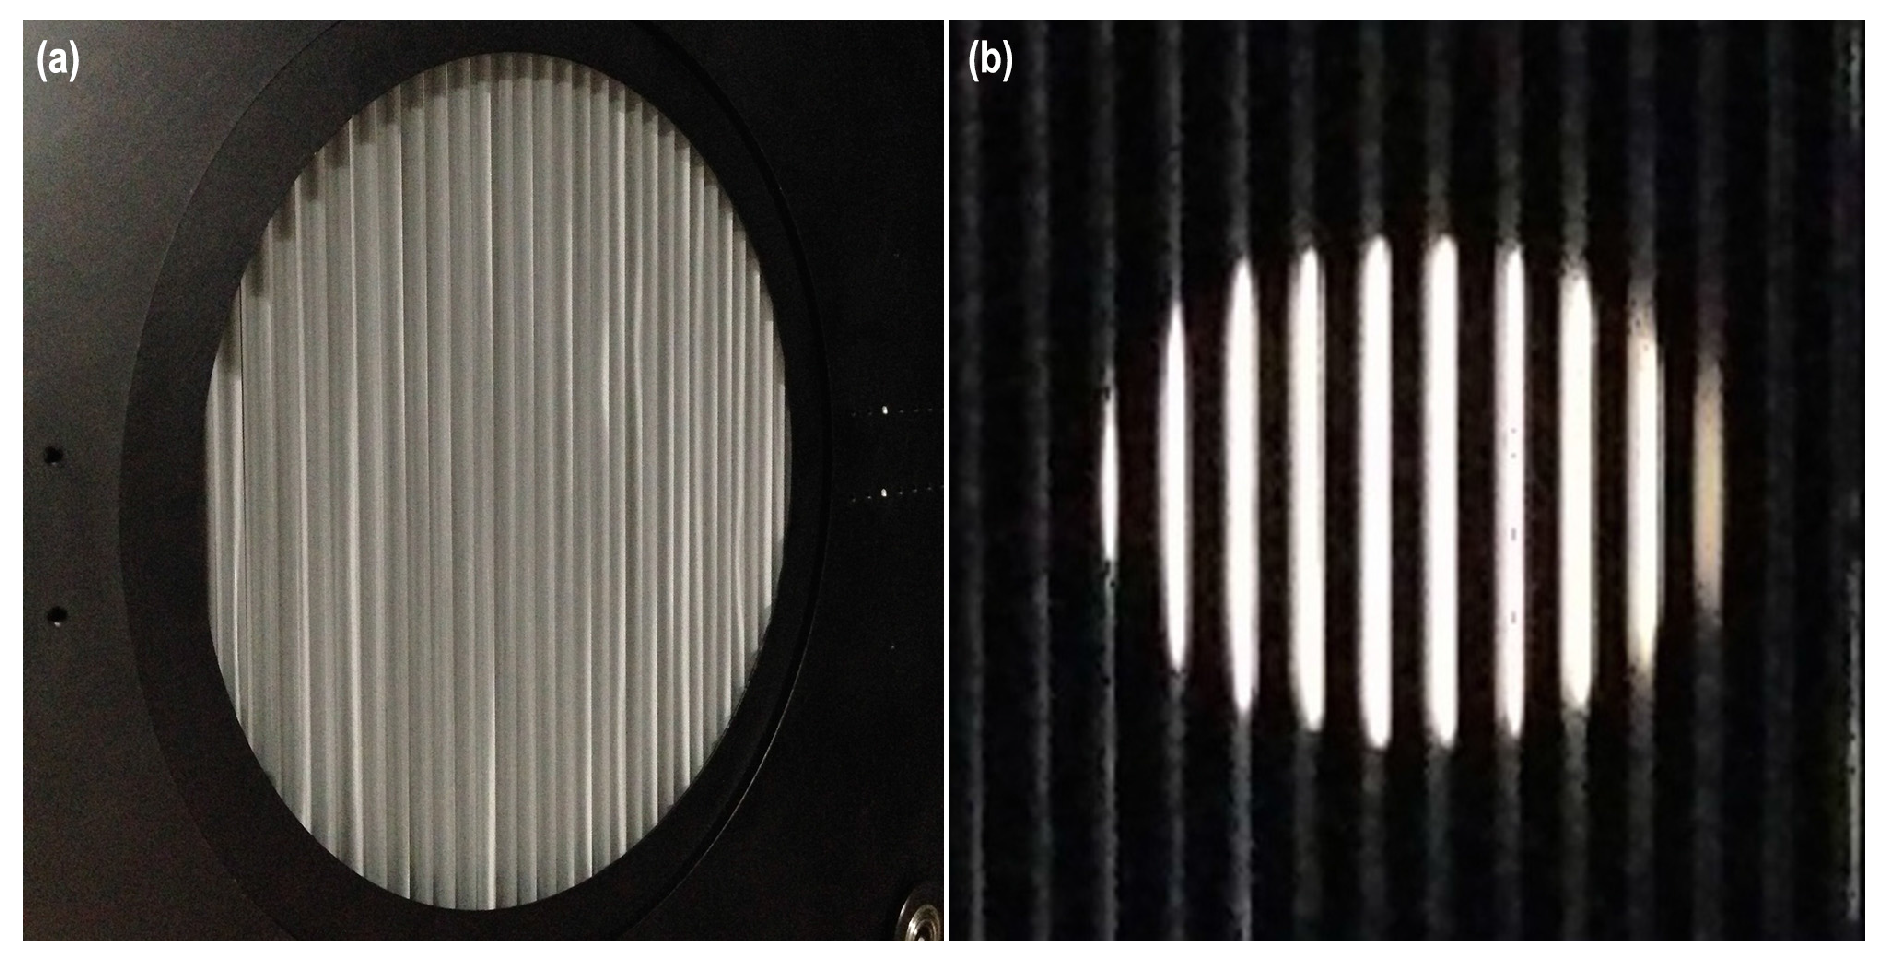
DRCs such as the exemplary that exhibit a visible geometry and therefore non-uniformity require the adjustment of the sampling aperture [
26,
27]. It must be set large enough relative to the the scale of the sample that the averaged BSDF is representative for the entire sample. Therefore the illumination system is focused at infinity to provide a
collimated beam, allowing the maximum sampling aperture (
mm) to cover the largest possible number of slats (approx. 8, see
Figure 4). Furthermore, the directional resolution and scan patterns have to match the DRC’s characteristics [
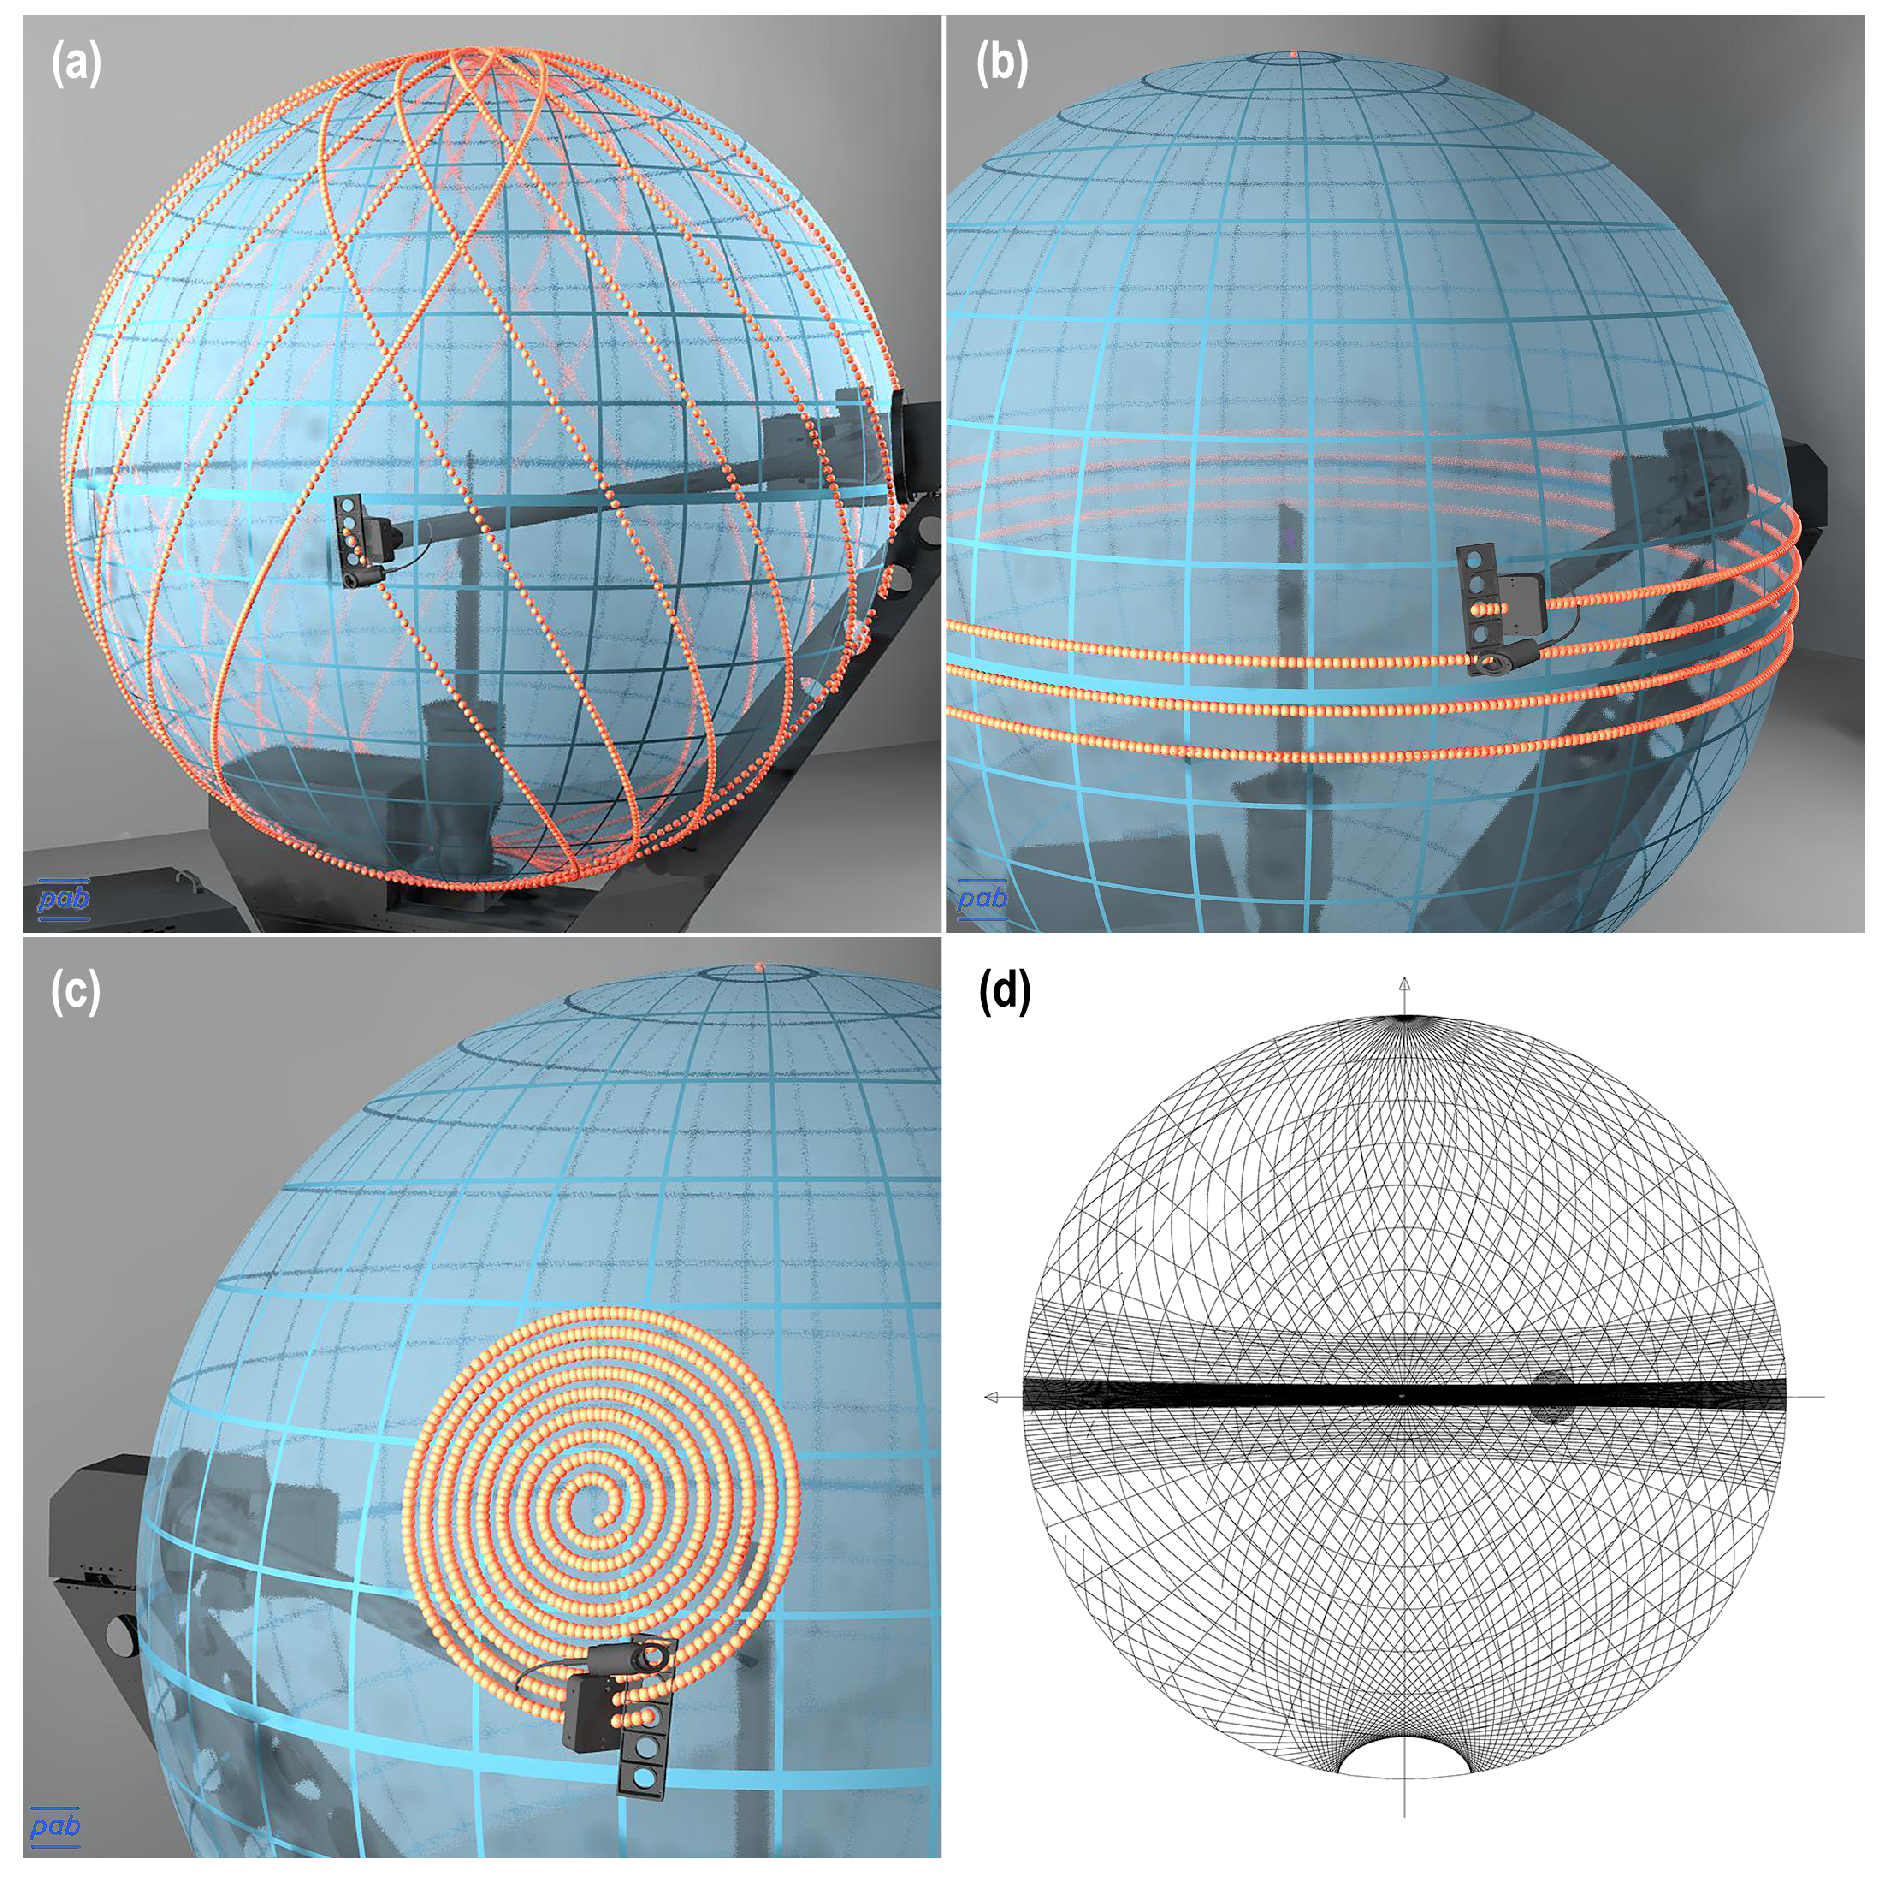
8]. Therefore three scanning paths are combined: (1) interleaving circles covering the transmission hemisphere in a grid at low resolution; (2) dense parallel circles to capture details in the distribution orthogonally oriented to the linear shadow pattern caused by the slats to avoid interference; and (3) a spiral pattern to measure the reference beam and directly transmitted light at high resolution (
Figure 5).
Due to the geometry of the optical bench and the sample holder, the measurements are carried out with the sample rotated by
from its normal mounting orientation (
Figure 4). The rotation of the sample leads to an unpredictable inclination of the slats which are normally fixed by their weight. The slats are fixed (Blu-Tack) for the measurement but with limited accuracy. The number of slats in the sample aperture is comparably low. Therefore the measurement results are of limited constancy as they cannot compensate for these irregularities. Preliminary tests have shown deviations around 10% for total transmission over different measurement sessions when the sample has to be remounted.
3.5. Modelling the Design for Simulation of the BSDF
To gain a BSDF from the design (
V2), a simulation model is prepared that represents its geometry (
Figure 6). For comparability the reflection characteristics of the model’s surfaces are chosen according to the finishes of the production sample.
A general problem of geometric modelling of small-scale macro-structured DRCs similar to the exemplary is tessellation. The small slats have a complex curved geometry that is precisely shaped for its purpose. For raytracing, curved geometry is typically converted to flat surfaces by tessellation. This conversion reduces the number of angles under which the incoming light is reflected leading to visible banding and loss of detail in the distribution of light.
The sample shows two finishes. (1) The top surface is a highly reflective aluminium front-side mirror; (2) The bottom side is coated with a glossy white paint. Both were represented in the simulation by the Dür-Ward scattering model [
28]. In this model the reflection characteristic is defined by six parameters: direct-hemispherical (total) reflection for three colour channels, the ratio of specular to total reflection and two roughness parameters that shape the width of the specular reflection in two orthogonal directions for anisotropic reflection. Total and specular reflection were derived from goniophotometric measurements. As colour is not addressed in this study the three parameters were set to the same values. The roughness parameters were set to zero.
3.6. Implementation of a Virtual Goniophotometer (VGP) with Photon Mapping in Radiance
To gain comparable data a Virtual Goniophotometer (VGP) is designed to model the high resolution scanning goniophotometer that is utilised for the measurements in adequate detail. This includes its illumination system, its scanning paths and resolution that form its instrument signature. The accuracy of its replication is critical in this approach.
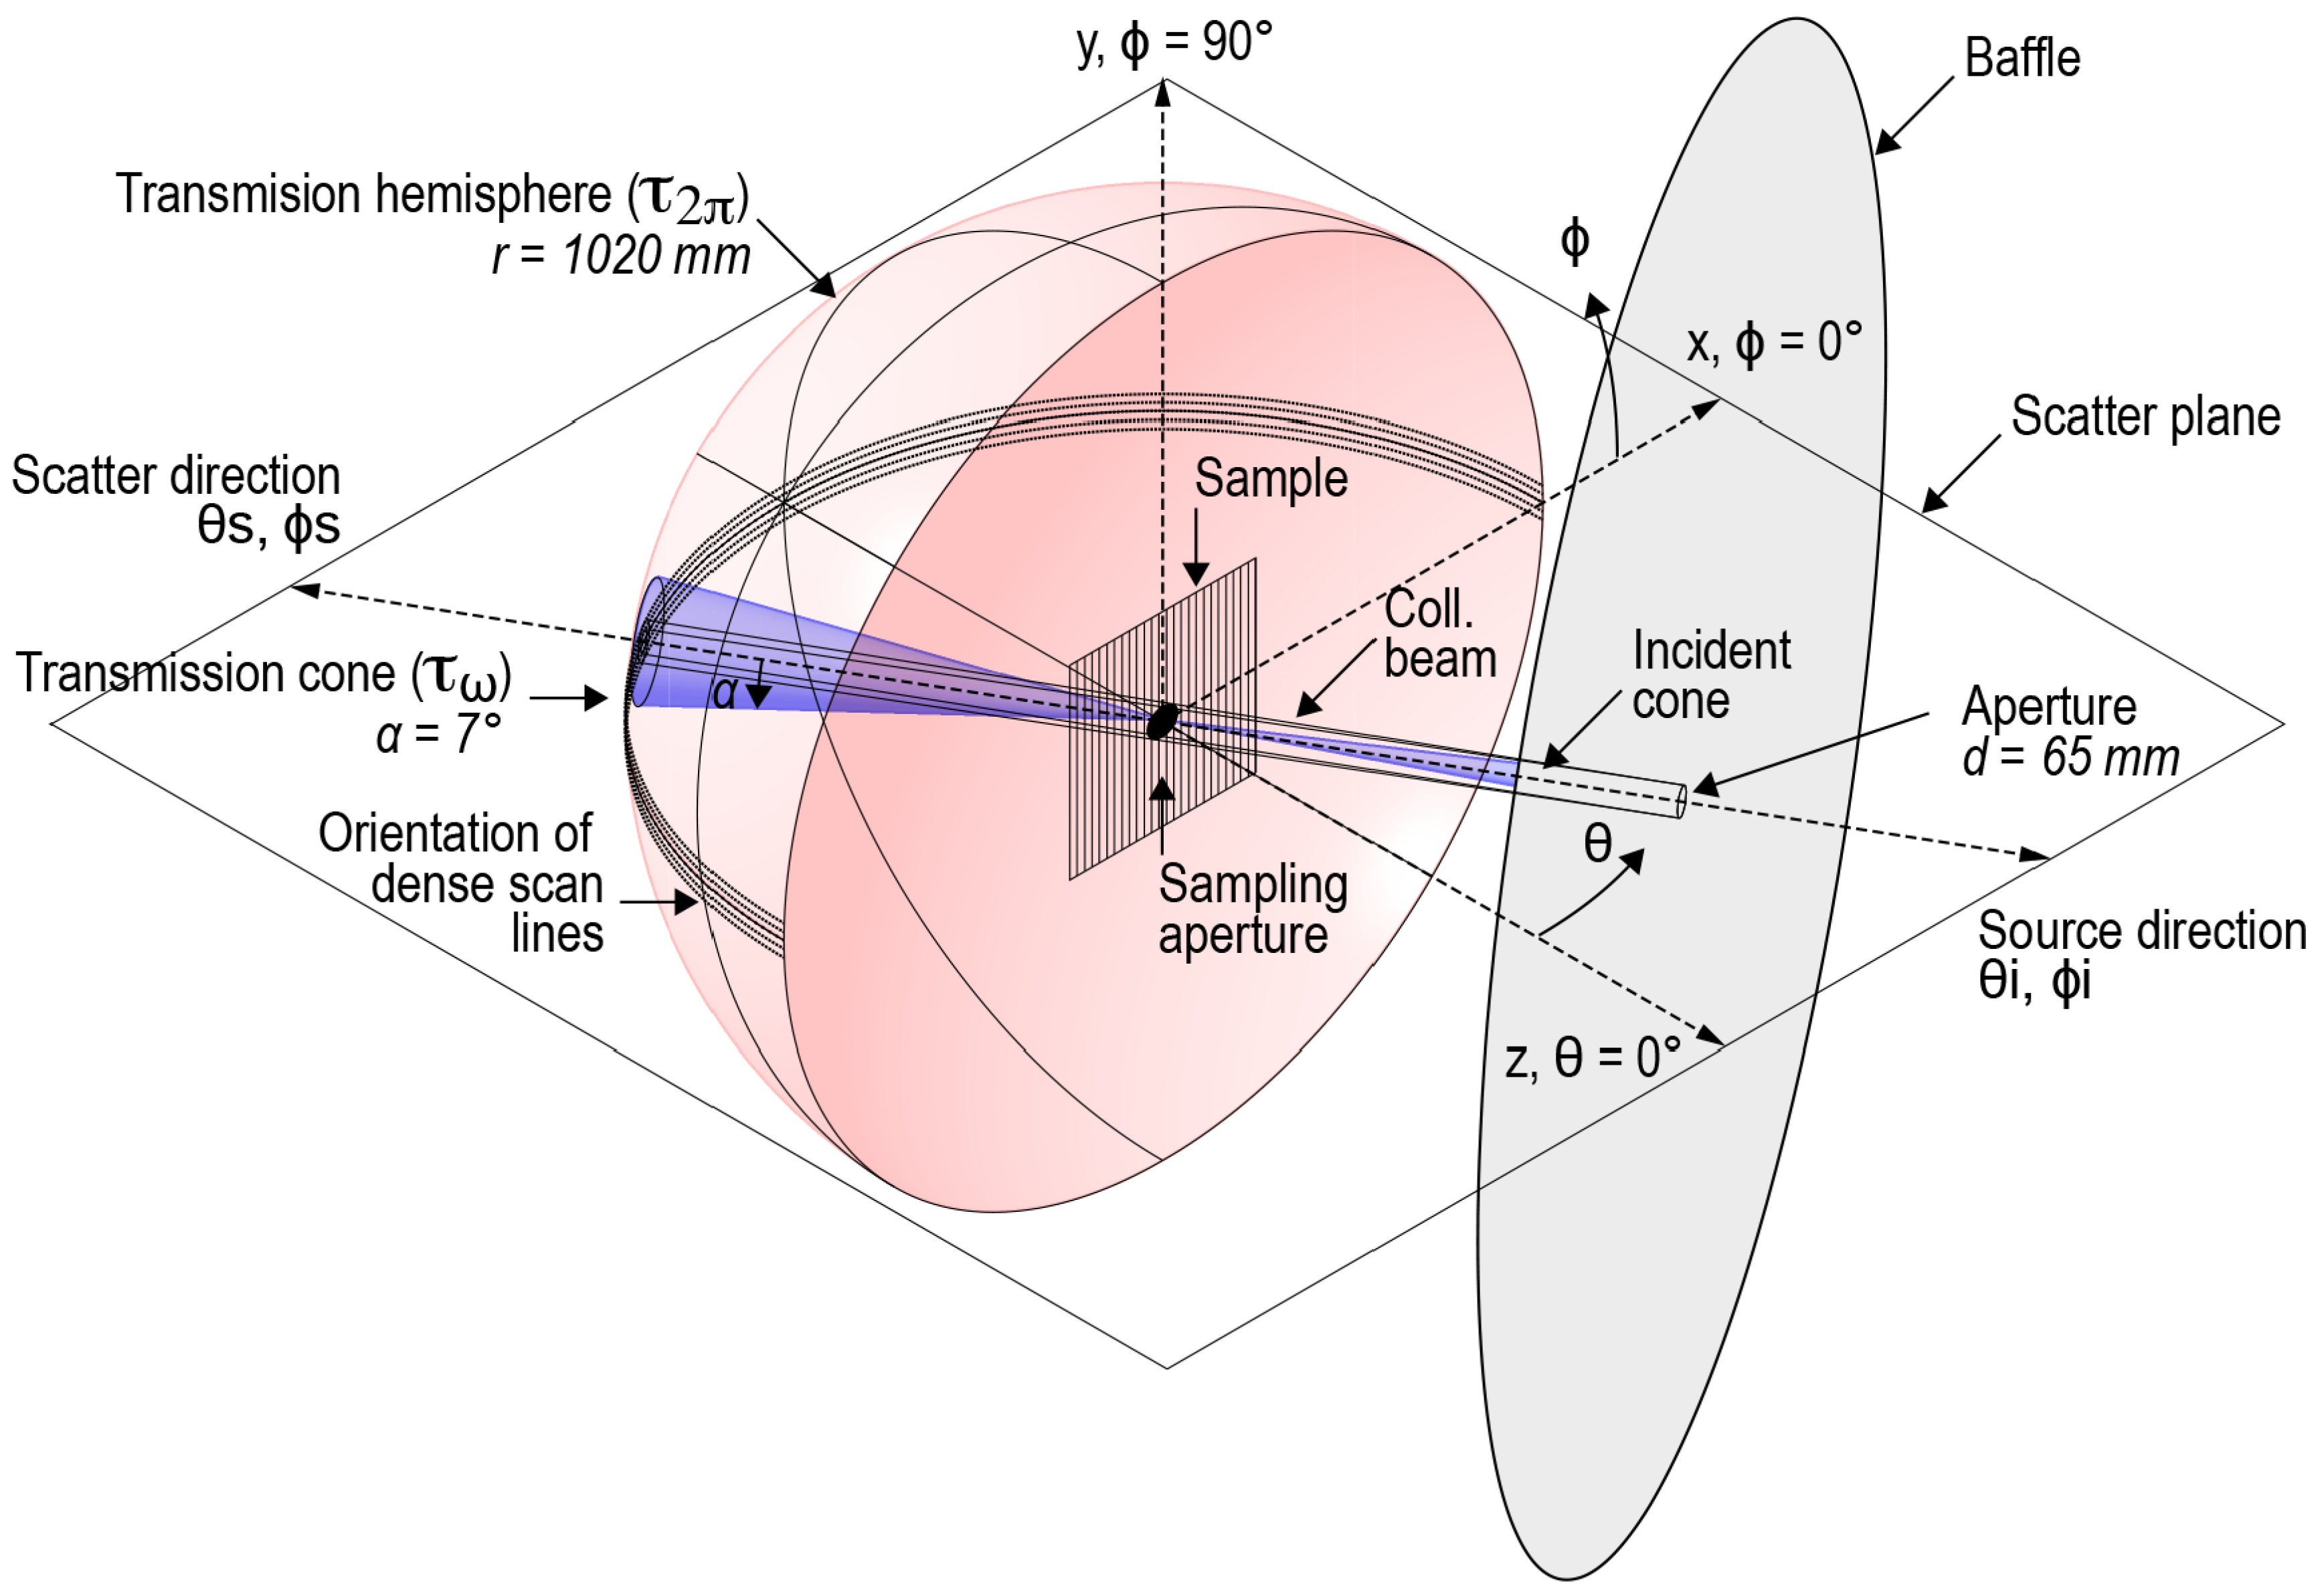
The illumination system is modelled as a distant light source and a baffle (
Figure 3). The angle of the light-source and the size of the aperture in the baffle (
mm) is adjusted to shape a beam with similar characteristic to the beam used in the measurements. Note that the collimated beam in the real goniophotometer is almost perfectly parallel light while the light source definition in Radiance implies an angle (
) leading to visible fall-off at the edges of the illuminated area. The degree of accordance is visible in a comparison of the DSF profiles of the reference beams (
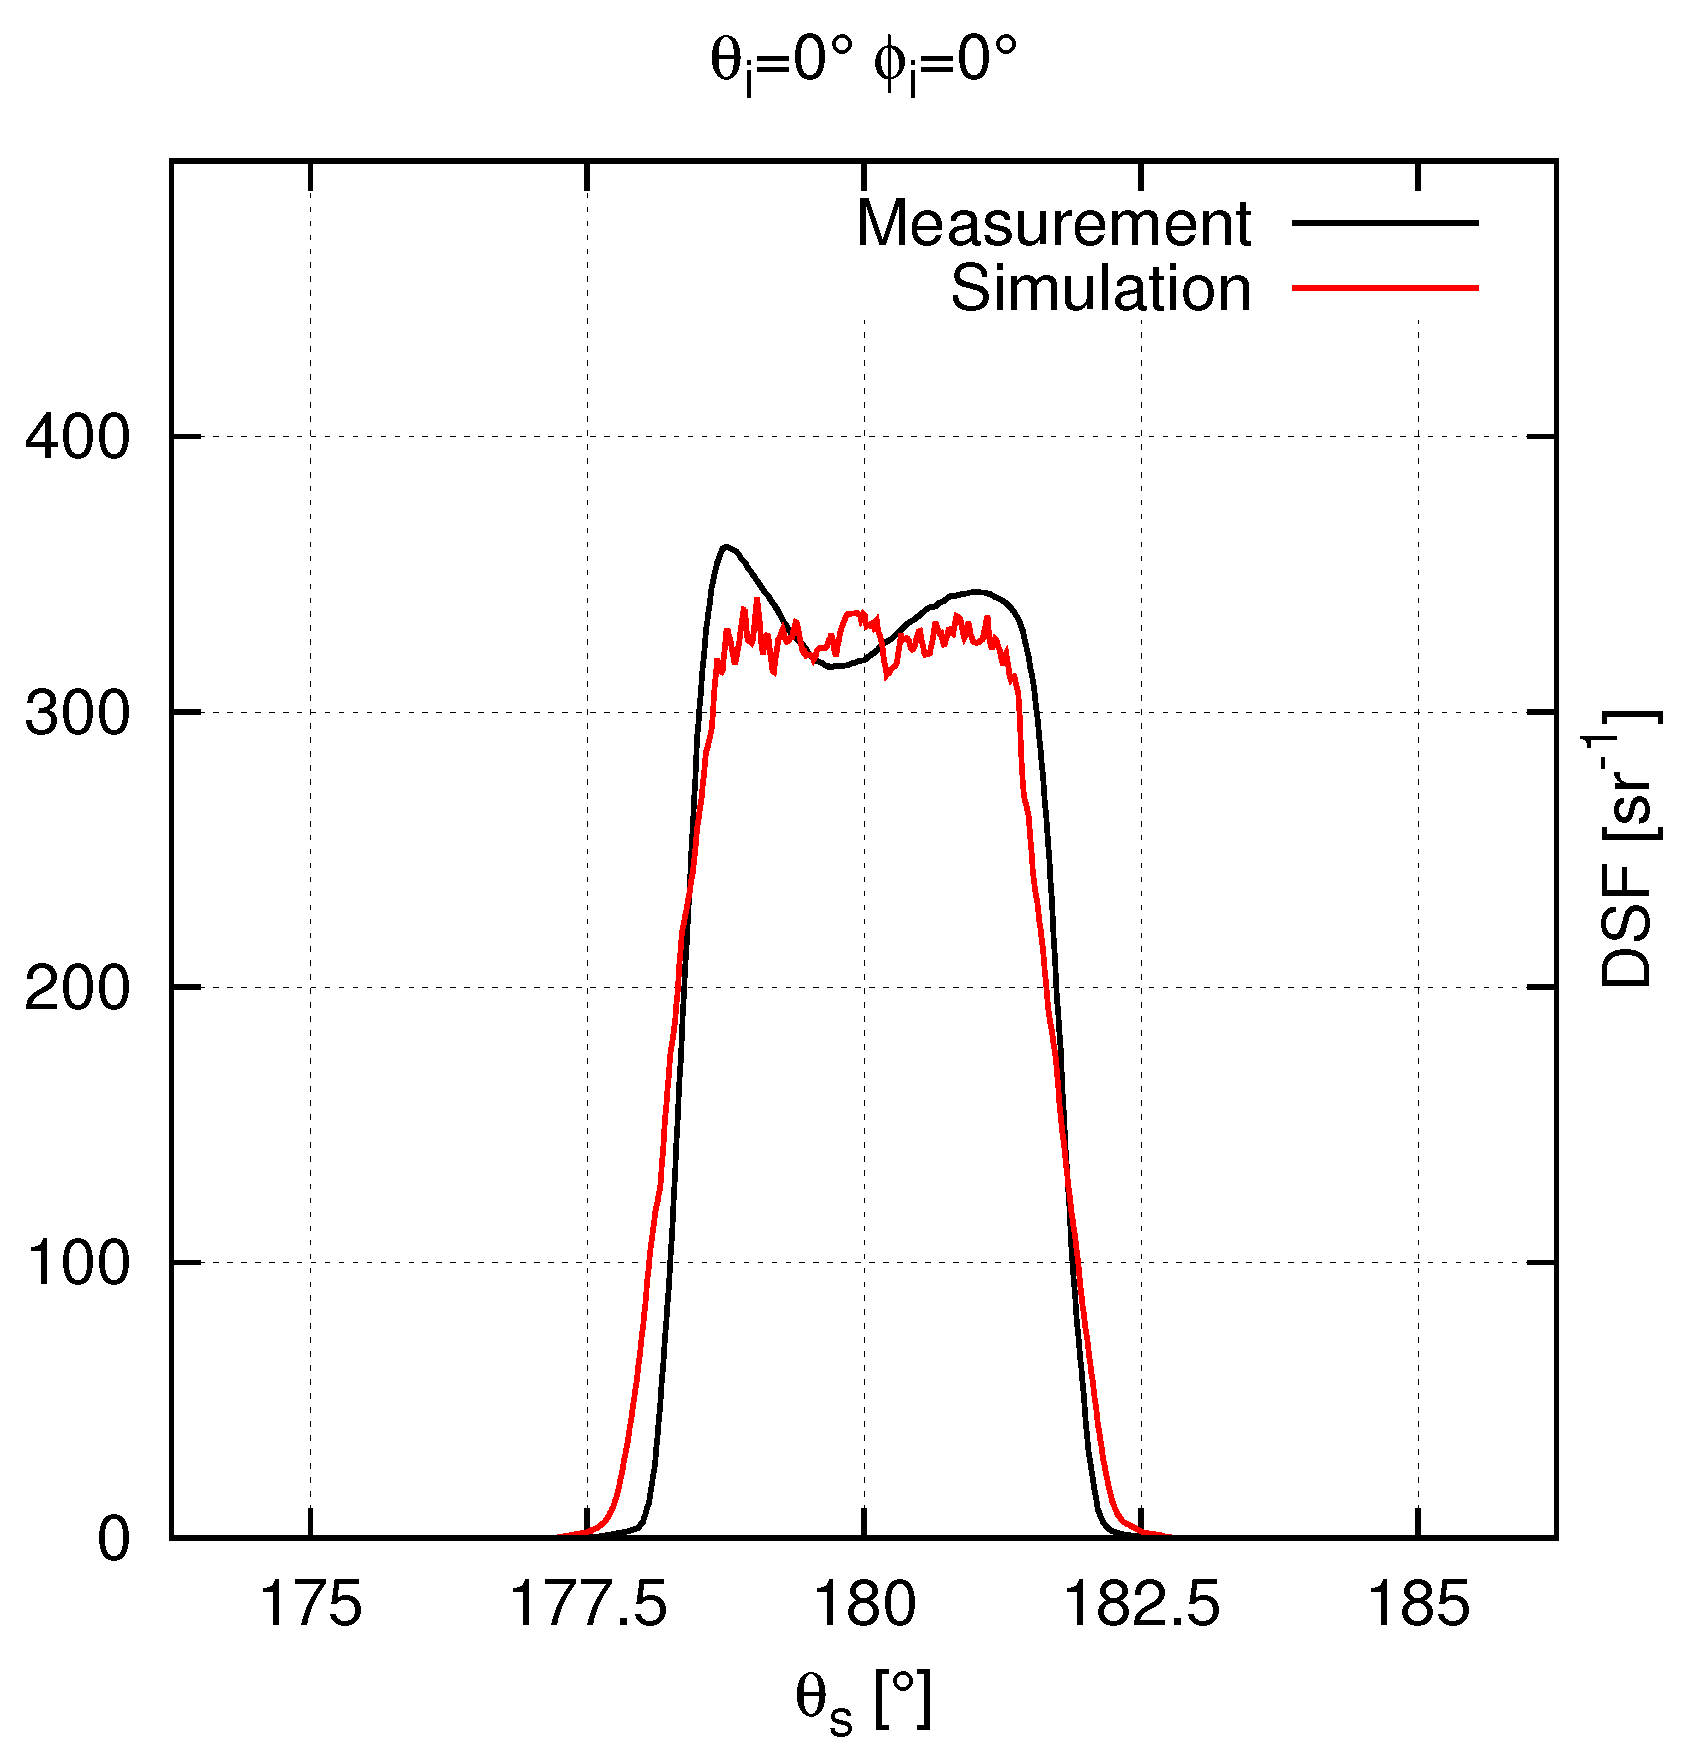
Figure 7). The illumination system of the physical goniophotometer exhibits a central area with a diameter of
with some non-uniformity of the Halogen filament. The edge shows a fall-off and some stray-light at the bottom. The reference beam of the simulation setup exhibits noise in the central area and the expected fall-off. The lower end of its peak is formed by small bias in the photon density estimate. The illumination system of the goniophotometer is closely approximated by this setup.
Virtual sensors are positioned at the same distance as in the measurements and in identical directions. This is achieved by reading the directions of the corresponding measurements from their data files. A direct comparison of measured and computed BSDF is therefore possible without re-sampling.
To replicate the detector signal in the BSDF measurement, the illuminance around the sampling aperture is computed with
Radiance photon mapping in two steps:
The diameter of the search radius depends on the local photon density and is regulated by the selected
bandwidth, i.e., the number of photons to search for. The setting of this bandwidth is a compromise between
noise—if the bandwidth is too low—and a
bias—if the bandwidth is too high. Noise will manifest in fluctuations of the BSDF for adjacent directions. Bias will reduce the contrast along illumination gradients. A suitable setting for this parameter depends on the total number of emitted photons. The relevant parameters of the simulation with
Radiance [
12] are listed in
Table 1.
The variation of the search radius implies a difference between measurement and simulation. The physical sensor is fixed in size but in the simulation the search radius is a function of local photon density. However, effects from the differences in the detector system are not observed. The instruments signature is closely replicated as shown in
Figure 7.
The impact of the relative location of the sampling aperture on the sample in the physical and the virtual setup is tested by comparing simulations repeated with 0.25 mm increments orthogonal to the slats with the measurements. The result with the best spatial accordance is chosen (
Figure 8).
Finally the BSDFs of the design geometry are calculated from the simulation results and compared to the measured BSDFs of the production sample applying the selected metrics.
3.7. Contribution of the Observed Geometric Deviations to the Differences between BSDFs
The simulation procedure is repeated for a model (V3) that includes the known geometric deviations. A comparison to the measured BSDFs of the production sample is expected to show a high accordance if the known geometric deviations from the design geometry (V2) contribute significantly to the different transmission characteristics of the production sample (V1).
Modelling variant
V3 requires finding the tilt angle of the slats caused by the deformation near their ends. It is estimated by geometric analysis and goniophotometric measurements: The slats block direct light above a certain altitude (
Figure 9). This angle is defined by the distance between the slats and the inclination of the slat’s profile. Goniophotometric measurements repeated with a
increment for the altitude (
) reveal that this angle differs by
from the design geometry. The resulting model can be seen in
Figure 6.
4. Results
4.1. Directional Comparison of BSDF Data
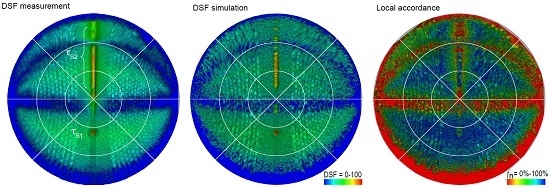
The directional distribution of the measured and calculated DSF can be seen in
Figure 10a,b. The plots reveal a similar diffuse background in the hemisphere. Prominent features such as ridges and peaks appear in a similar topology, but along the scattering plane the simulation results show noise in areas of diffuse reflection and multiple differentiated peaks where the measurements show a continuous ridge.
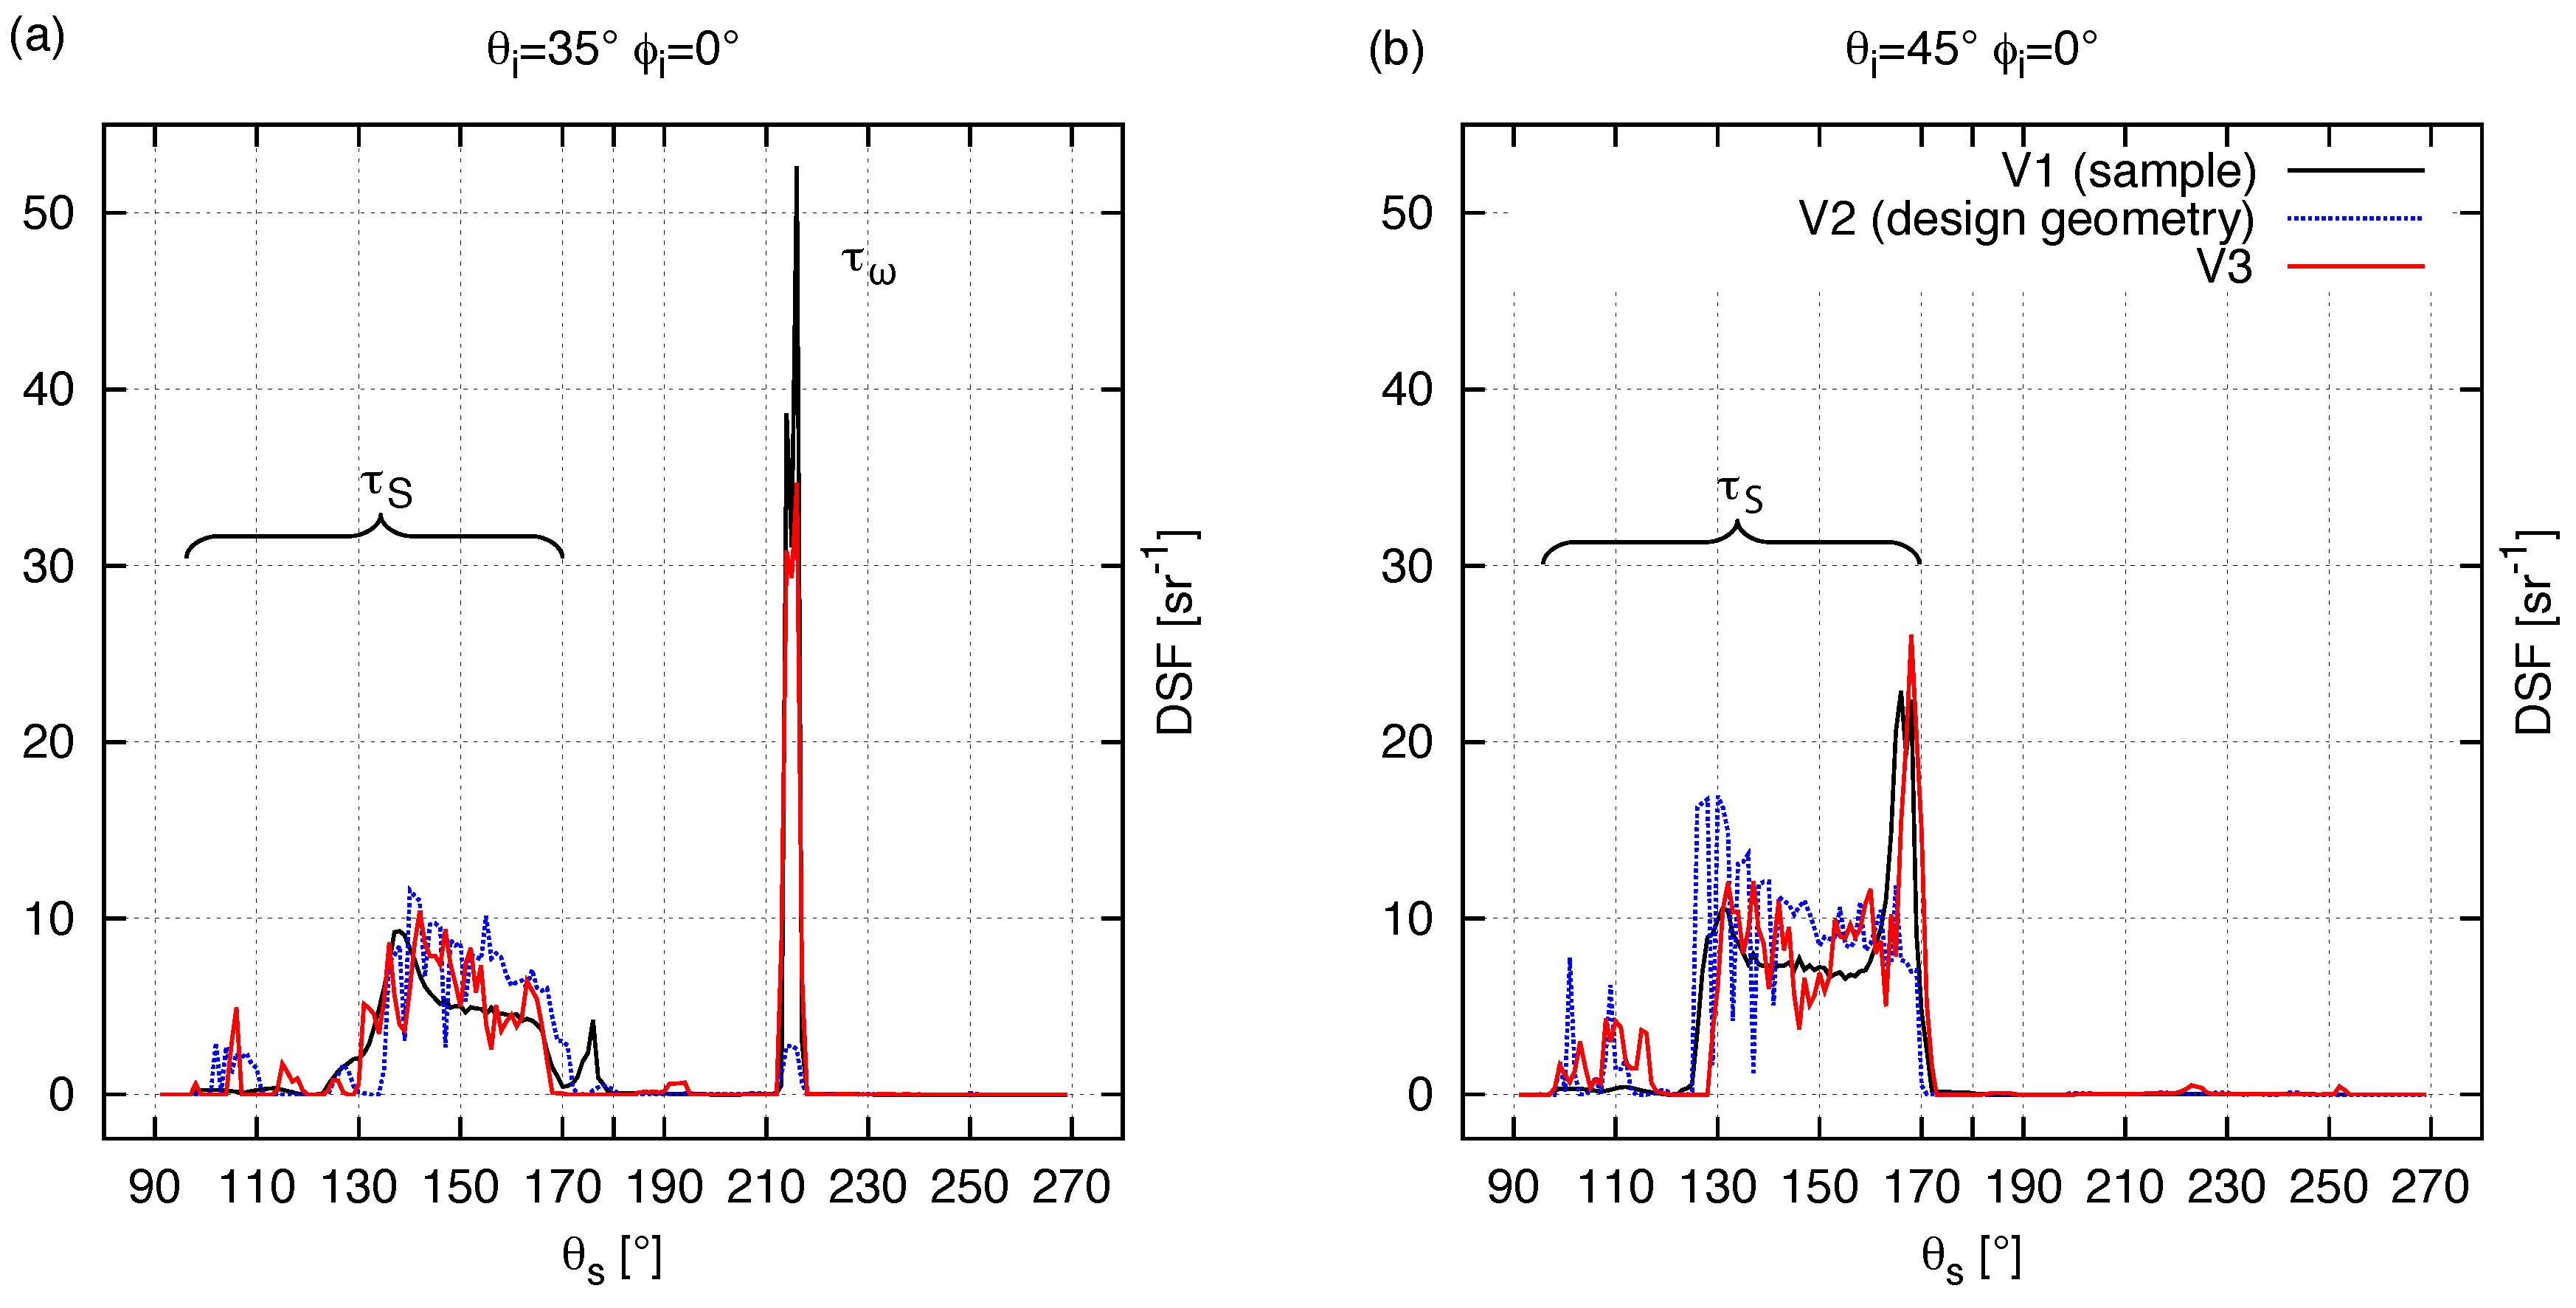
Sections through the scattering plane (
Figure 11) reveal differences and similarities in more detail:
For a prominent peak () at shows the light that can directly pass the louvers at this angle. The measurements and the simulation results from the V3 show a similar hight of this peak, while the simulation results from the design geometry (V2) show a significantly lower peak. Between = 130–170 the light that is reflected to the ceiling () results in a high ridge similar for all measurements and simulation results.
For the prominent peak is absent since direct light is blocked by the system at this angle. The ridge between = 130–170 () is higher compared to the results for and similar for all measurements and simulation results. However, near the edges of the ridge at and the results from V3 fit the measurements more closely.
For sample directions = 90–130 the simulations show visibly higher DSF.
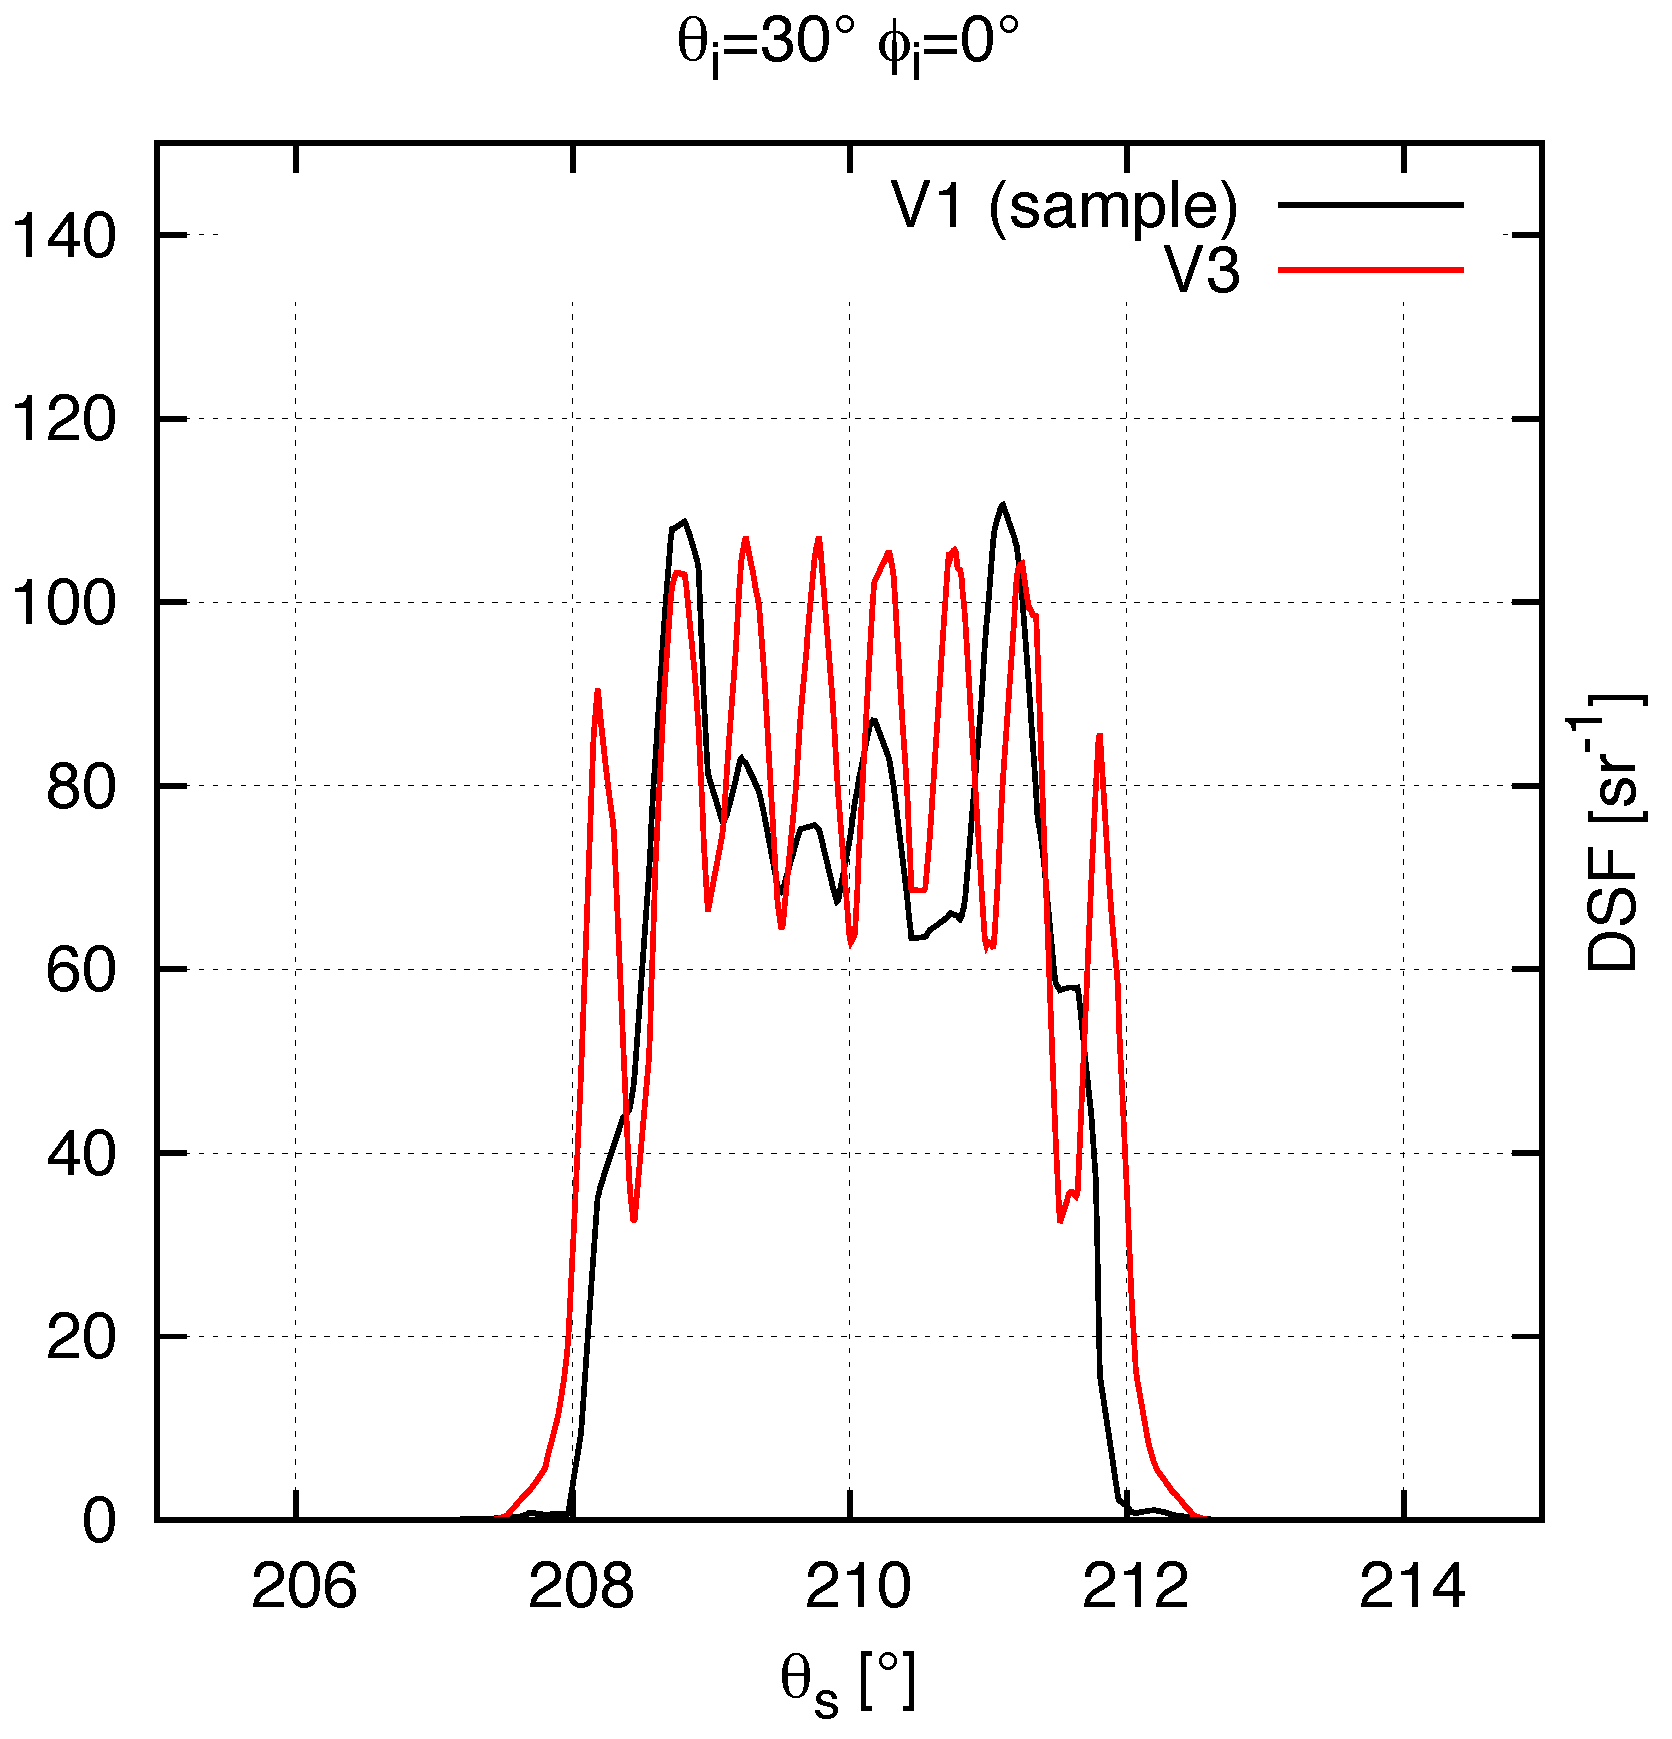
Detailed plots of the area around the direct peak reveal a fairly regular fluctuation of the DSF for the simulation of
V3 but irregular results in the measurements (
V1). Significant differences can be observed at the edges of this peak (
Figure 8).
4.2. Comparison of Conical-Hemispherical and Biconical Transmission
The conical-hemispherical transmission for all measured (
) and simulation results (
,
) decreases from
to
, then continuously increases to
(
Table 2). The difference between measured and simulated results is lower than 13% but different for the models
V2 and
V3. While the first show values lower than the measurements
V1 at
and
and higher values for
= 40
–50
, the latter shows generally higher values.
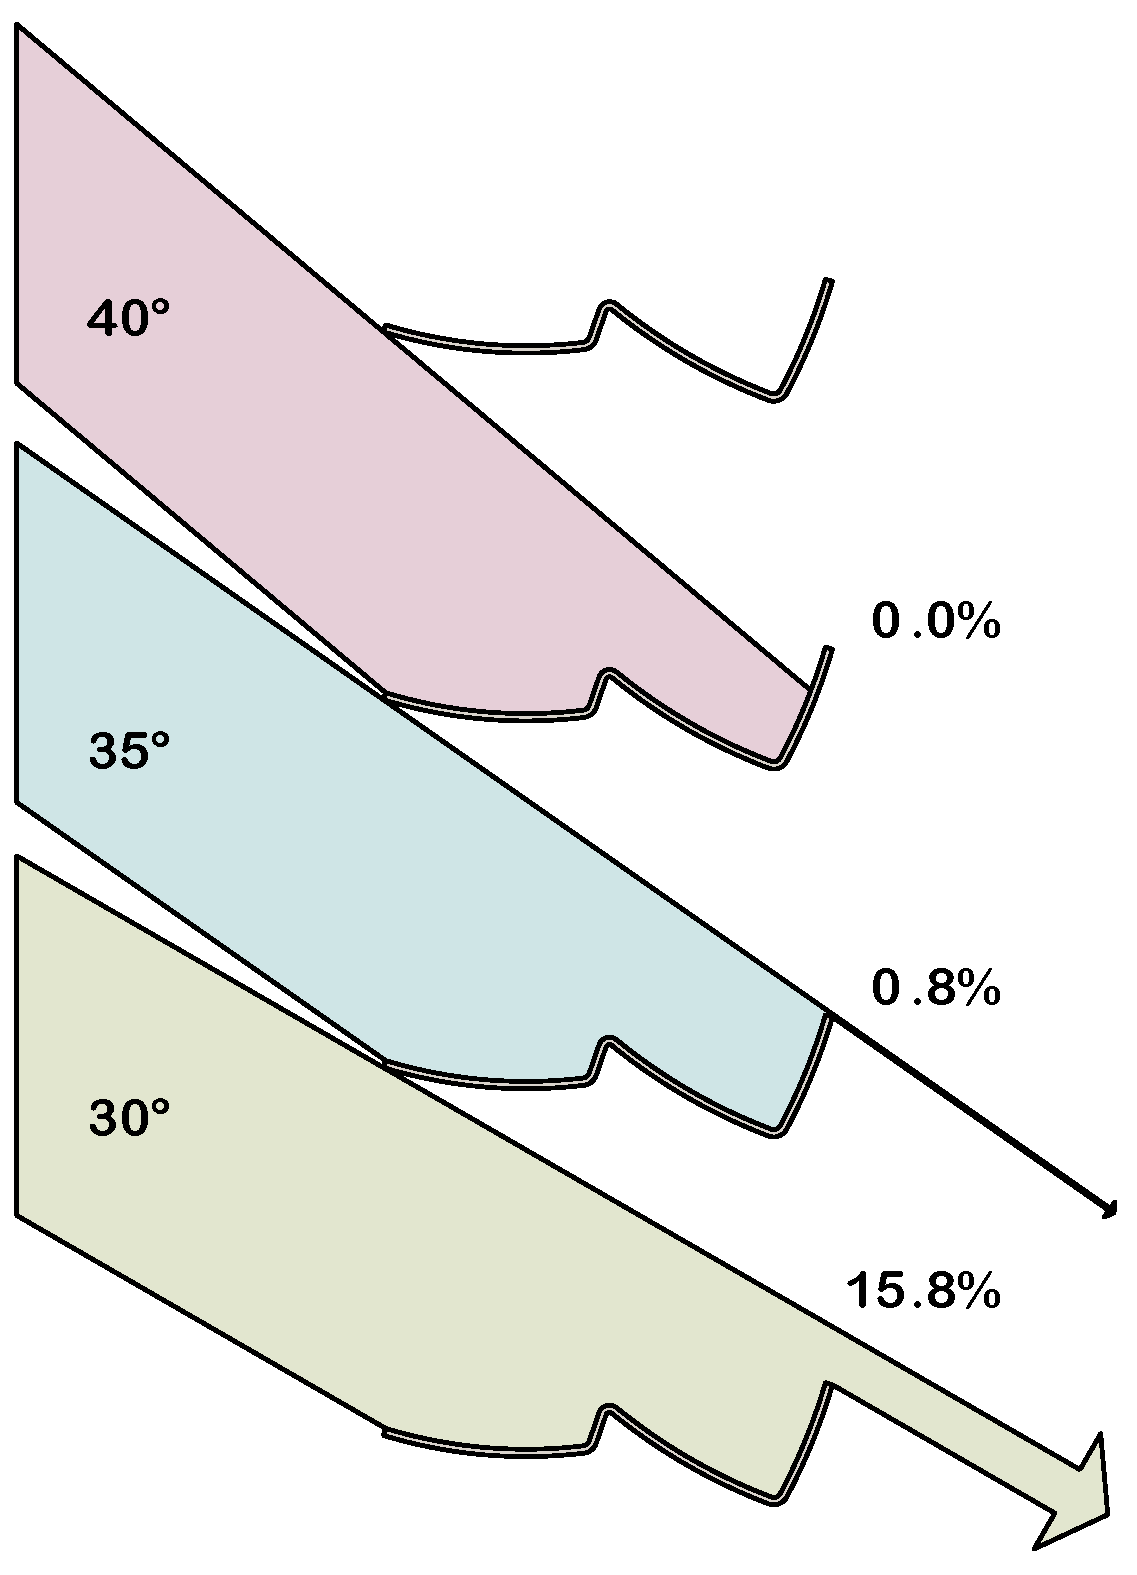
Biconical transmission is shown for
and
(
Table 3). For other source directions biconical transmission is blocked by the DRC. The simulation results for the design geometry (
) are significantly lower than the measurements (
) especially for
. The simulation results for
, on the other hand, are higher than the measurements.
4.3. Global and Local Level of Accordance
The level of global accordance
for the models is between 65%–84% except for model
V2 at
. It is generally higher for
V3 as for
V2 (
Table 4).
The local accordance
is low for the lowest DSF. This extends to the diffuse background where lower accordance is achieved for lower DSF. Along the ridge the accordance is low in gaps between peaks in the simulation and at the edges of these peaks (
Figure 10c).
5. Discussion
The directionally resolved comparison (
Figure 10) shows that the scattering behaviour of the models (
V2,
V3) resembles the production sample (
V1) in many details while some differences have to be explained:
The ridge from redirected light (
) is continuous in the measurements. In both simulations this ridge consists of separated peaks. This is a visible effect from the tessellation of the geometric models: the light is reflected in a few discrete directions depending on the number of surfaces (
Figure 10). Tessellation is challenging for complex optical components of a small scale that leads to huge magnifications. This challenge is characteristic for DRCs that are meant to be mounted into double glazing.
The DSF at the end of the ridge (
= 90
–130
) in the measurements is lower than the DSF in both simulations. This is a result of the shadowing from the sample holder (
Figure 11).
The range of percentage errors
for conical-hemispherical transmission is similar for both models (3%–13%). This range is similar to earlier findings (an average of 8%) for a similar comparison [
17].
The design geometries’ lower conical-hemispherical transmission for and can be related to its significantly lower for biconical transmission at these source directions. Both can be explained by the preliminary revealed deviation of the slats’ inclination () of the production sample (V1) compared to this geometry (V2). The biconical transmission is largely determined by obstruction and the latter is correlated with the inclination of the slats relative to the source direction. The results show that this affects the conical-hemispherical transmission as well.
The remaining differences of biconical transmission for
V3 may be partially explained by the irregularities of the measured sample (
V1) visible in
Figure 8. The difference between the physical and the virtual illumination system will contribute as well (
Figure 7). The profile of the slats may vary in production. The sections provided by the manufacturer (
V2) might not fit the measured production sample (
V1). Therefore a residual deviation in the inclination or the geometry of the slats cannot be ruled out.
The level of global accordance of
and
is low compared to results that are referred as “good” (≧98%) or “very good” (≧99%) in the literature [
24]. This rating is related to a comparison of measurements of the same luminaires with identical goniophotometers, but the results for the reference beams
are expected to be in this range. The non-uniform illumination of the sample aperture in the measurement and the small offset of the physical illumination system, and to a lower degree the noise in the simulation are potential causes for the limited global accordance (
Figure 7).
Effects of these deviations are visible in the directional distribution of
as well. They are aggravated by effects of the model’s tessellation and noise in the simulation and the measurements. The geometric differences of the models and the sample are not similarly visible but manifest in the results for the global accordance (
). The model
V3 is closer to the measured sample than the design geometry (
V2), especially for
, where
. These results correlate well with the integrated values of biconical and conical-hemispherical transmission. This shows that the metric correlates with the actual difference in scattering behaviour. The non-uniformity of the physical sample visible in
Figure 4 and
Figure 8 is likely to contribute significantly to the general low level of global accordance.
6. Conclusions and Broader Impact
Two metrices have been introduced into the comparison of BSDFs. Global accordance has been applied in the field of daylighting for the first time, and allows to detect and assess deviations of production samples from the intended design. Its correlation to the percentage error for integrated biconical transmission makes it an indicator for deviations significant for the performance DRCs. Local accordance has been proposed as a novel metric. Its application allows to localize deviations of BSDFs, supporting the analysis of the sources for unexpected transmission characteristics of DRCs.
The two metrics have been successfully applied in conjunction with the comparison of biconical and directional-hemispherical transmission to quantify and explain the impact of manufacturing processes on the transmission characteristics of the small-scale louver-system.
While the general topology of features over the transmission hemisphere match in all BSDFs, the results show that the BSDF from the production sample and the design geometry differ significantly if quantified by the metrics: The maximum percentage error for biconical transmission is and the minimal global accordance is , both occurring at .
The contribution of the known geometric deviations is significant. Variant (
V3) and (
V1) resemble each other more closely (
and
for
). The remaining differences can be partly explained by effects from the non-uniformity of the sample (
Figure 4 and
Figure 8). A more closer inspection of this effect is complicated by the superimposed non-uniformity of the illumination system in the measurements.
The limited accordance of the reference beam between simulation and measurement of
is a restriction for this kind of comparison. Another is the noise in lower BSDF values from the simulation (
Figure 10) as are the effects from tessellation (
Table 5).
The comparison of BSDFs can serve as a useful tool in the product development of DRCs to understand the effects of geometric deviations on light distribution. In combination with the integration of photon mapping into Radiance, the proposed method can be utilised for the assessment of geometric models for simulation. This can lead to a straight-forward method of performance prediction for DRCs with known accuracy. Global and local accordance as metrics for the comparison of BSDFs have the potential for a range of applications in other fields of light scattering measurements.
7. Further Research
To understand the remaining deviations in more detail further research is needed, therefore the actual geometry of the DRC system has to be known. Without that knowledge other influencing factors are difficult to quantify. This leads to the challenge of measuring fragile and small-scale samples in detail. In this study the inclination of the slats in V3 had to be derived from indirect measurements as it was impossible to measure it directly.
The observed differences are related to the performance of the DRC in Climate-Based Daylight Modelling (CBDM). The deviation in biconical transmission is expected to lead to a deviation in Annual Sunlight Exposure (ASE) calculation and therefore in the prediction of spatial Daylight Autonomy (sDA) [
29]. Also informative would be the calculation of Daylight Glare Probability (DGP) for the assessment of visual comfort [
30]. Quantifying the impact on performance would help to understand the potential of an improved production process with respect to energy savings and visual comfort.
Acknowledgments
This research was supported by the Swiss National Science Foundation as part of the project “Simulation-based assessment of daylight redirecting components for energy savings in office buildings” (#147053). Marek Krehel contributed goniophotometric measurements. Helmut Köster contributed a production sample, design drawings and a cross-section of the DRC. Peter Apian-Bennewitz (pab advanced technologies Ltd.) contributed illustrations of the goniophotometer’s scan paths.
Author Contributions
Andreas Noback, Lars O. Grobe and Stephen Wittkopf conceived and designed the experiments; Andreas Noback and Lars O. Grobe performed the experiments; Andreas Noback and Lars O. Grobe analysed the data; Andreas Noback wrote the paper.
Conflicts of Interest
The authors declare no conflict of interest. The founding sponsors had no role in the design of the study; in the collection, analyses, or interpretation of data; in the writing of the manuscript, and in the decision to publish the results.
References
- Konis, K. Evaluating daylighting effectiveness and occupant visual comfort in a side-lit open-plan office building in San Francisco, California. Build. Environ. 2013, 59, 662–677. [Google Scholar] [CrossRef]
- Ward, G.; Mistrick, R.; Lee, E.; McNeil, A.; Jonsson, J. Simulating the daylight performance of complex fenestration systems using bidirectional scattering distribution functions within Radiance. Leukos 2011, 7, 241–261. [Google Scholar] [CrossRef]
- Nicodemus, F.E.; Richmond, J.C.; Hsia, J.J.; Ginsberg, I.W.; Limperis, T. Geometrical Considerations and Nomenclature for Reflectance; US Department of Commerce, National Bureau of Standards: Washington, DC, USA, 1977; Volume 160.
- ASTM E2387-05 Standard Practice for Goniometric Optical Scatter Measurements; ASTM International: West Conshohocken, PA, USA, 2005.
- Stover, J.C. Optical Scattering: Measurement and Analysis; SPIE Optical Engineering Press: Bellingham, WA, USA, 1995; Volume 2. [Google Scholar]
- Filip, J.; Haindl, M. Bidirectional Texture Function Modeling: A State of the Art Survey. IEEE Trans. Pattern Anal. Mach. Intell. 2009, 31, 1921–1940. [Google Scholar] [CrossRef] [PubMed]
- Matusik, W.; Pfister, H.; Brand, M.; McMillan, L. A Data-Driven Reflectance Model. ACM Trans. Graph. 2003, 22, 759–769. [Google Scholar] [CrossRef]
- Krehel, M.; Wittkopf, S.; Kämpf, J. Characterisation and Modelling of Advanced Daylight Redirection Systems with Different Goniophotometers. In Proceedings CISBAT 2015; EPFL: Lausanne, Switzerland, 2015; pp. 211–216. [Google Scholar]
- Meyen, S.; Sutter, F.; Heller, P. Near Specular Scatter Analysis Method With a New Goniophotometer; SPIE Proceedings: San Diego, CA, USA, 2014; Volume 9205, pp. 92050B–92050B-15. [Google Scholar]
- Apian-Bennewitz, P. New Scanning Gonio-Photometer for Extended BRTF Measurements; SPIE Proceedings: San Diego, CA, USA, 2010; Volume 7792, pp. 77920O–77920O-20. [Google Scholar]
- Larson, G.W.; Shakespeare, R.; Ehrlich, C.; Mardaljevic, J.; Phillips, E.; Apian-Bennewitz, P. Rendering with Radiance: The Art and Science of Lighting Visualization; Morgan Kaufmann: San Francisco, CA, USA, 1998. [Google Scholar]
- Schregle, R. Development and Integration of the Radiance Photon Map Extension; Technical Report; Lucerne University of Applied Sciences and Arts: Luzern, Switzerland, 2015. [Google Scholar]
- Schregle, R.; Grobe, L.; Wittkopf, S. Progressive photon mapping for daylight redirecting components. Sol. Energy 2015, 114, 327–336. [Google Scholar] [CrossRef]
- Schregle, R.; Wienold, J. Physical validation of global illumination methods: Measurement and error analysis. In Computer Graphics Forum; Wiley: Oxford, UK, 2004; Volume 23, pp. 761–781. [Google Scholar]
- Schregle, R. Daylight Simulation with Photon Maps. Ph.D. Thesis, Saarland University, Saarbrücken, Germany, 2007. [Google Scholar]
- Grobe, L.O.; Noback, A.; Wittkopf, S.; Kazanasmaz, Z.T. Comparison of measured and computed BSDF of a daylight redirecting components. In Proceedings of the CISBAT 2015 International Conference on Future Buildings and Districts, Lausanne, Switzerland, 1–9 September 2015; pp. 205–210.
- Andersen, M.; Rubin, M.D.; Powles, R.; Scartezzini, J.L. Bi-Directional Transmission Properties of Venetian Blinds: Experimental Assessment Compared to Ray-Tracing Calculations. Sol. Energy 2005, 78, 187–198. [Google Scholar] [CrossRef]
- Krishnaswamy, A.; Baranoski, G.V.; Rokne, J.G. Virtual Goniophotometric Measurements Protocol; Technical Report; University of Waterloo: Waterloo, ON, Canada, 2002. [Google Scholar]
- Mihálik, A.; Ďurikovič, R. Virtual gonio-spectrophotometer for validation of BRDF designs. Cent. Eur. J. Phys. 2011, 9, 1334–1343. [Google Scholar] [CrossRef]
- Havran, V.; Neumann, A.; Zotti, G.; Purgathofer, W.; Seidel, H.P. On cross-validation and resampling of BRDF data measurements. In Proceedings of the 21st Spring Conference on Computer Graphics, Budmerice, Slovakia, 12–14 May 2005; pp. 161–168.
- Köster, H. Daylight Modulation. Strategies for Adaptive Facades; WITAG Verlag: Frankfurt, Germany, 2015. [Google Scholar]
- Audenaert, J.; Durinck, G.; Leloup, F.B.; Deconinck, G.; Hanselaer, P. Simulating the spatial luminance distribution of planar light sources by sampling of ray files. Opt. Express 2013, 21, 24099–24111. [Google Scholar] [CrossRef] [PubMed]
- Ashdown, I. Comparing Photometric Distributions. J. Illum. Eng. Soc. 2000, 29, 25–33. [Google Scholar] [CrossRef]
- Bergen, A. A practical method of comparing luminous intensity distributions. Light. Res. Technol. 2012, 44, 27–36. [Google Scholar] [CrossRef]
- Grobe, L.O.; Wittkopf, S.; Apian-Bennewitz, P.; Jonsson, J.C.; Rubin, M. Experimental Validation of Bidirectional Reflection and Transmission Distribution Measurements of Specular and Scattering Materials; SPIE Proceedings: Brussels, Belgium, 2010; Volume 7725, pp. 772510–772510-19. [Google Scholar]
- Aydinli, H.; Kaase, H. Measurement of Luminous Characteristics of Daylighting Materials; Technical Report; International Energy Agency Task 21: Paris, France, 1999. [Google Scholar]
- Mohanty, L.; Yang, X.; Wittkopf, S.K. Optical scatter measurement and analysis of innovative daylight scattering materials. Sol. Energy 2012, 86, 505–519. [Google Scholar] [CrossRef]
- Geisler-Moroder, D.; Dür, A. A new Ward BRDF model with bounded albedo. In Computer Graphics Forum; Wiley: Oxford, UK, 2010; Volume 29, pp. 1391–1398. [Google Scholar]
- Heschong, L.C.; Wymelenberg, V.D.; Vice-Chair, K.; Andersen, M.; Digert, N.; Fernandes, L.; Keller, A.; Loveland, J.; McKay, H.; Mistrick, R.; et al. Approved Method: IES Spatial Daylight Autonomy (sDA) and Annual Sunlight Exposure (ASE); Illuminating Engineering Society: New York, NY, USA, 2016. [Google Scholar]
- Wienold, J.; Christoffersen, J. Evaluation methods and development of a new glare prediction model for daylight environments with the use of CCD cameras. Energy Build. 2006, 38, 743–757. [Google Scholar] [CrossRef]
Figure 1.
Geometry and optical mechanisms of the DRC (patented by H. Köster). The orientation above eye level is assessed in this study.
Figure 1.
Geometry and optical mechanisms of the DRC (patented by H. Köster). The orientation above eye level is assessed in this study.
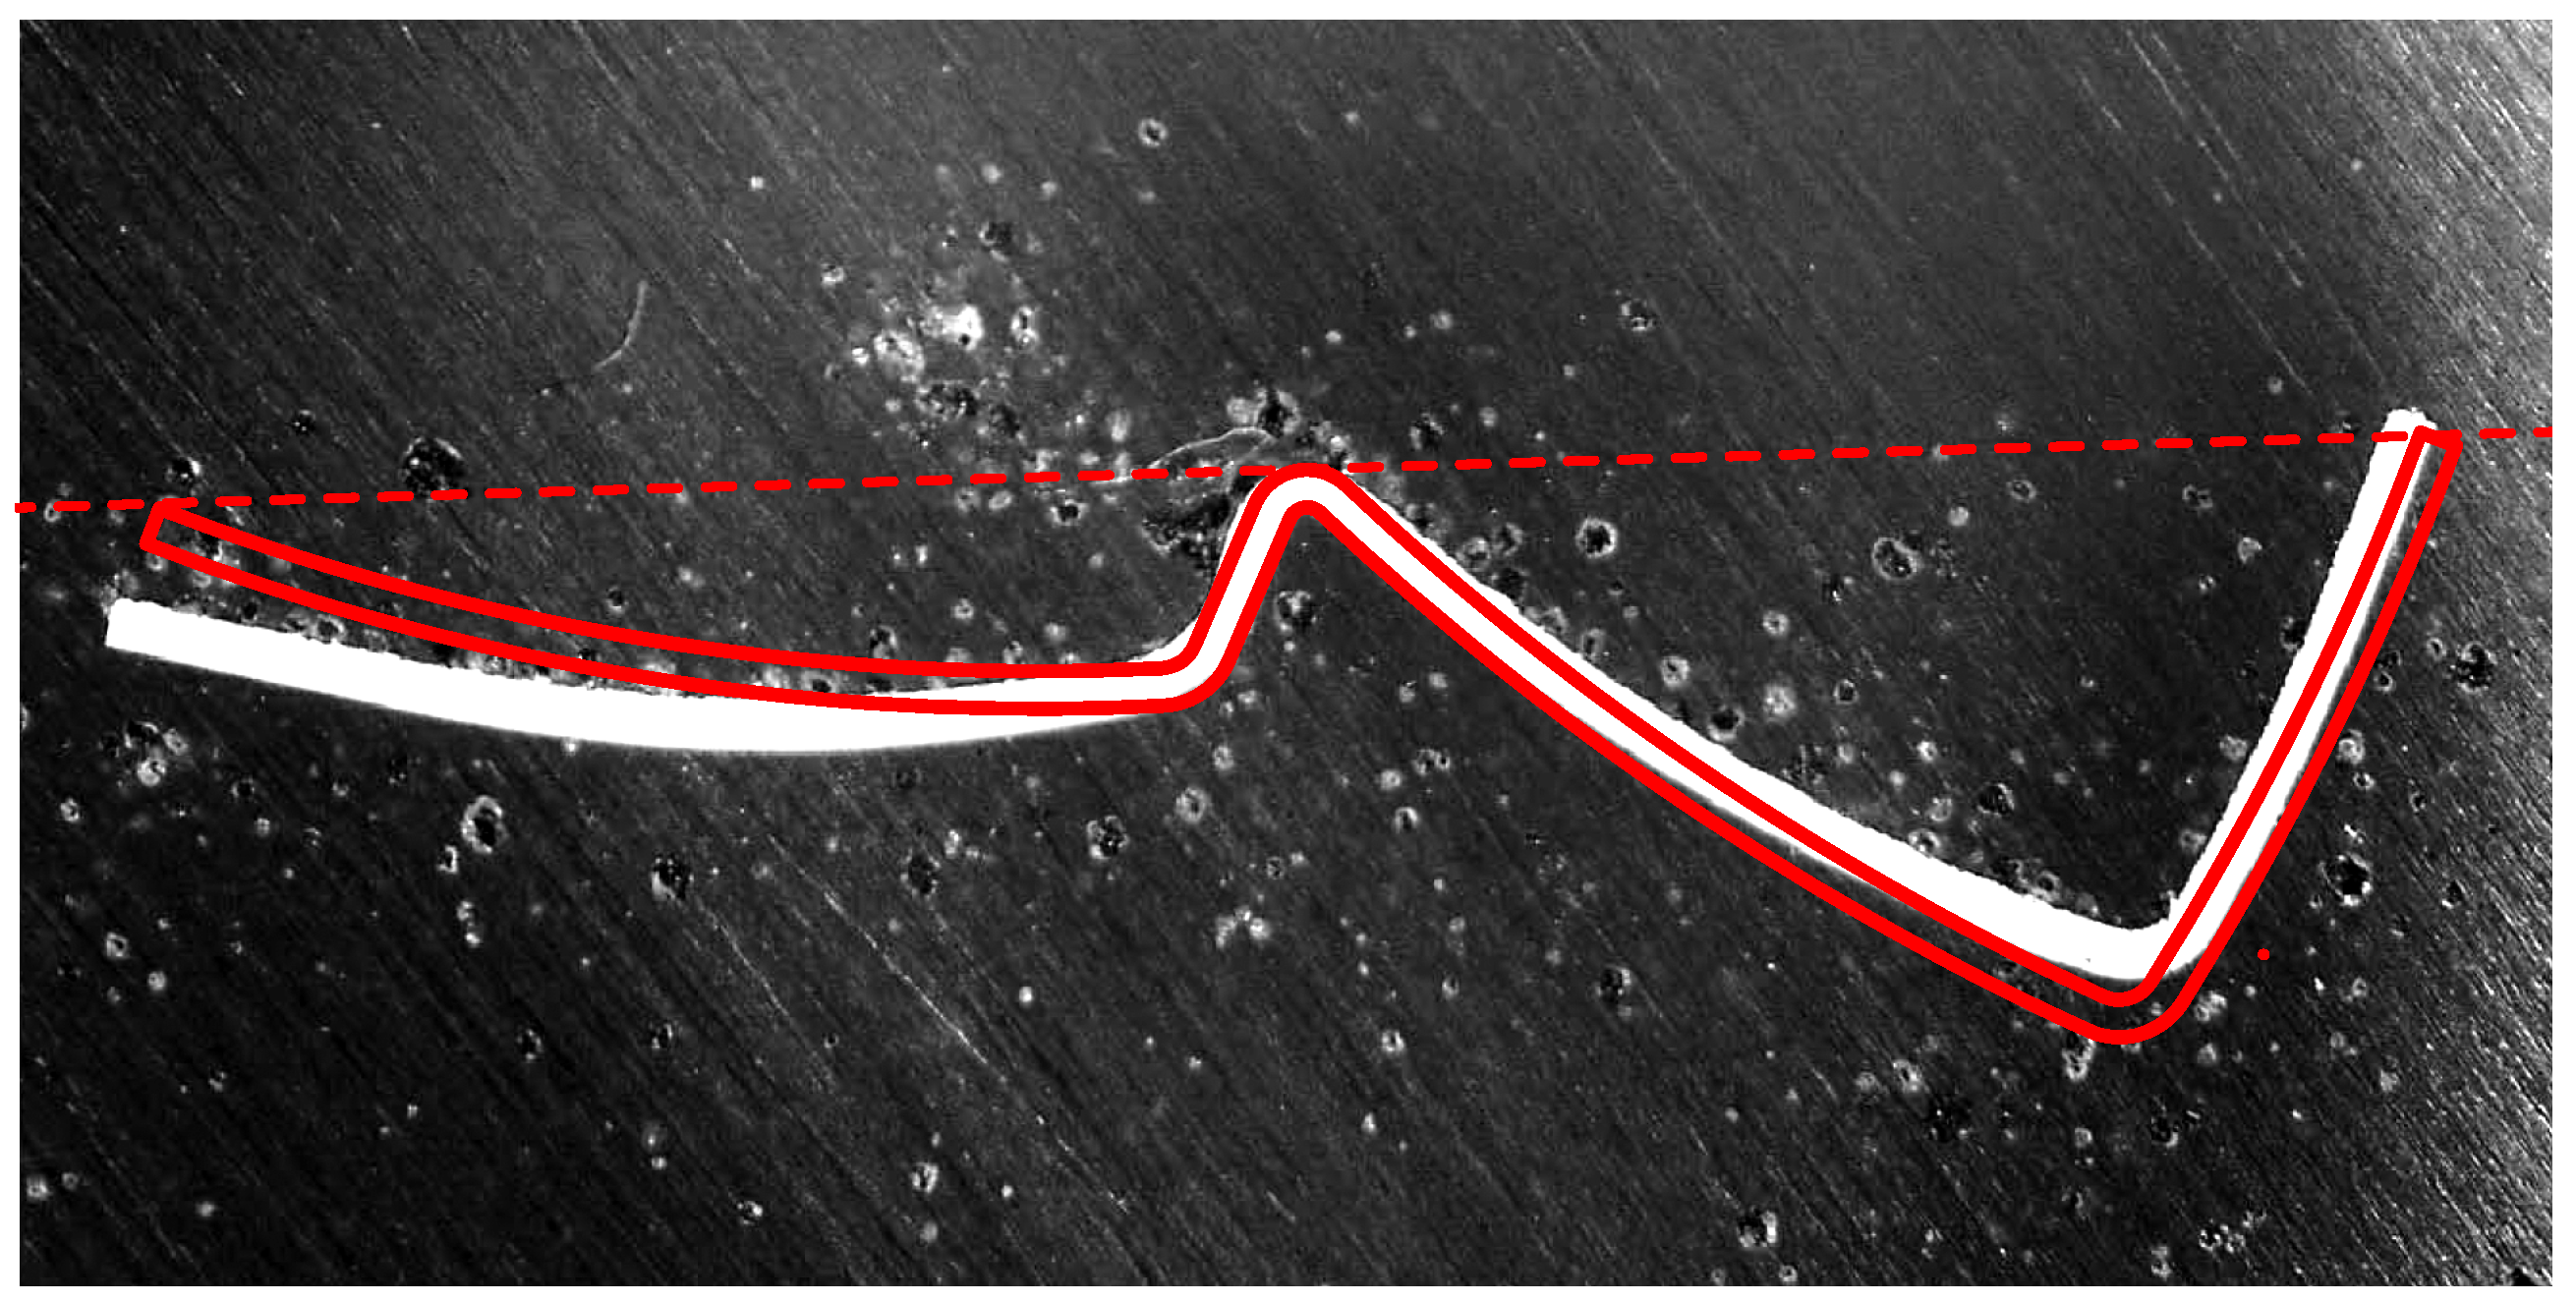
Figure 2.
Cross-section of a production sample of the slats provided by the manufacturer with an overlay showing the design geometry. Note that the endpoints and the apex in the middle of the profile are collinear in the design but not so in the de-facto section. Also note that the curvature of the profiles slightly diverge (Source: H. Köster).
Figure 3.
Schema of the Virtual Goniophotometer (VGP) and the geometry of the measured properties. Note that the light is emitted by a distant light source that is only defined by a direction and a central angle. The beam is formed by a baffle with an aperture.
Figure 3.
Schema of the Virtual Goniophotometer (VGP) and the geometry of the measured properties. Note that the light is emitted by a distant light source that is only defined by a direction and a central angle. The beam is formed by a baffle with an aperture.
Figure 4.
Non-uniformity of the sample exposed in grazing light (a); Measured area (sampling aperture illuminated by the collimated beam from the light source) for (b).
Figure 4.
Non-uniformity of the sample exposed in grazing light (a); Measured area (sampling aperture illuminated by the collimated beam from the light source) for (b).
Figure 5.
The goniophotometer’s scan paths: A continuous movement of the detector describes a sphere around the sampling aperture and captures all scattering directions (a); It is refined by a set of densely offset orbits parallel to the orientation of the slats, covering up- and downward deflected light (b); To resolve directly transmitted light, the detector moves on a spiral pattern around the expected peak direction (c); Measurements resulting from paths a-c are combined as illustrated by the projection of the effective set of detector positions on the transmission hemisphere for one incident direction (d). (Image courtesy (a–c): pab advanced technolgies Ltd.)
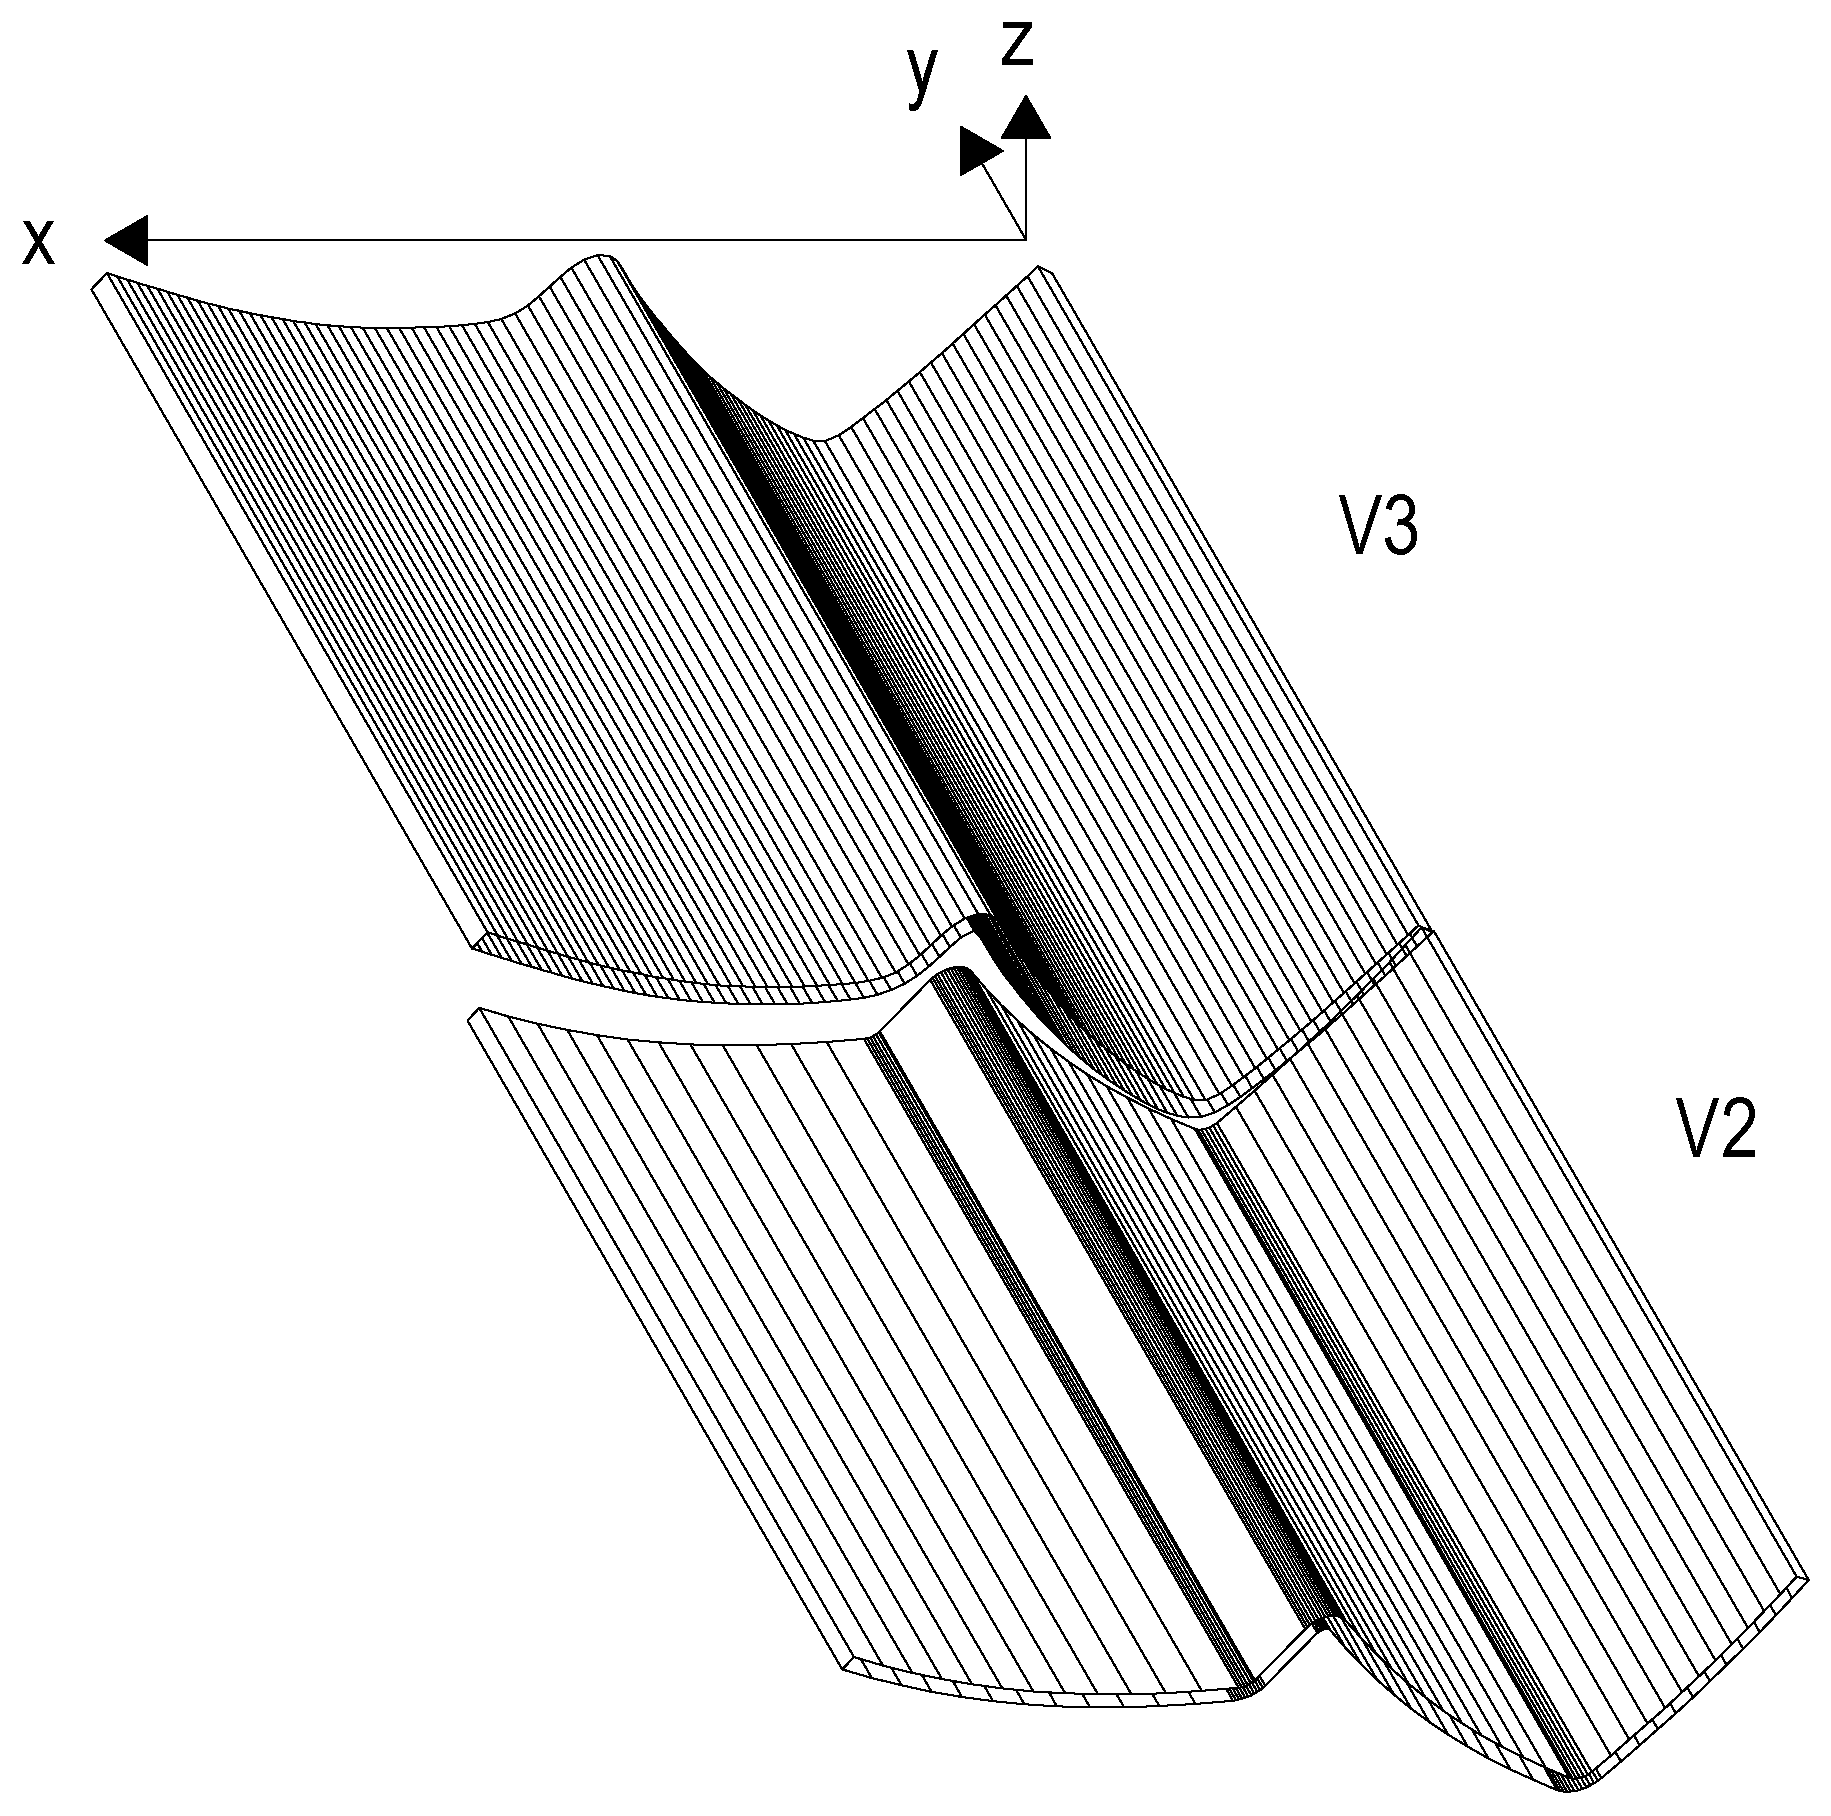
Figure 6.
Two variants of the geometric models showing different inclination and profile. First, the model based on the design geometry and inclination (V2); Second, the model incorporating the shape and inclination of the slats as gathered from the manufacturing process (V3). Note the tessellation of the models.
Figure 7.
Comparison of the illumination systems for measurement and simulation at .
Figure 7.
Comparison of the illumination systems for measurement and simulation at .
Figure 8.
Biconical (direct) transmission: Measurements V1 (black) and model V3 (red) for and . The measurements show irregularities resulting from the non-uniformity of the sample and the reference beam.
Figure 8.
Biconical (direct) transmission: Measurements V1 (black) and model V3 (red) for and . The measurements show irregularities resulting from the non-uniformity of the sample and the reference beam.
Figure 9.
Geometric estimation of direct transmission through the louver system in its design geometry (V2) at selected incident angles.
Figure 9.
Geometric estimation of direct transmission through the louver system in its design geometry (V2) at selected incident angles.
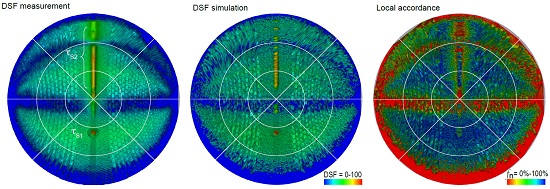
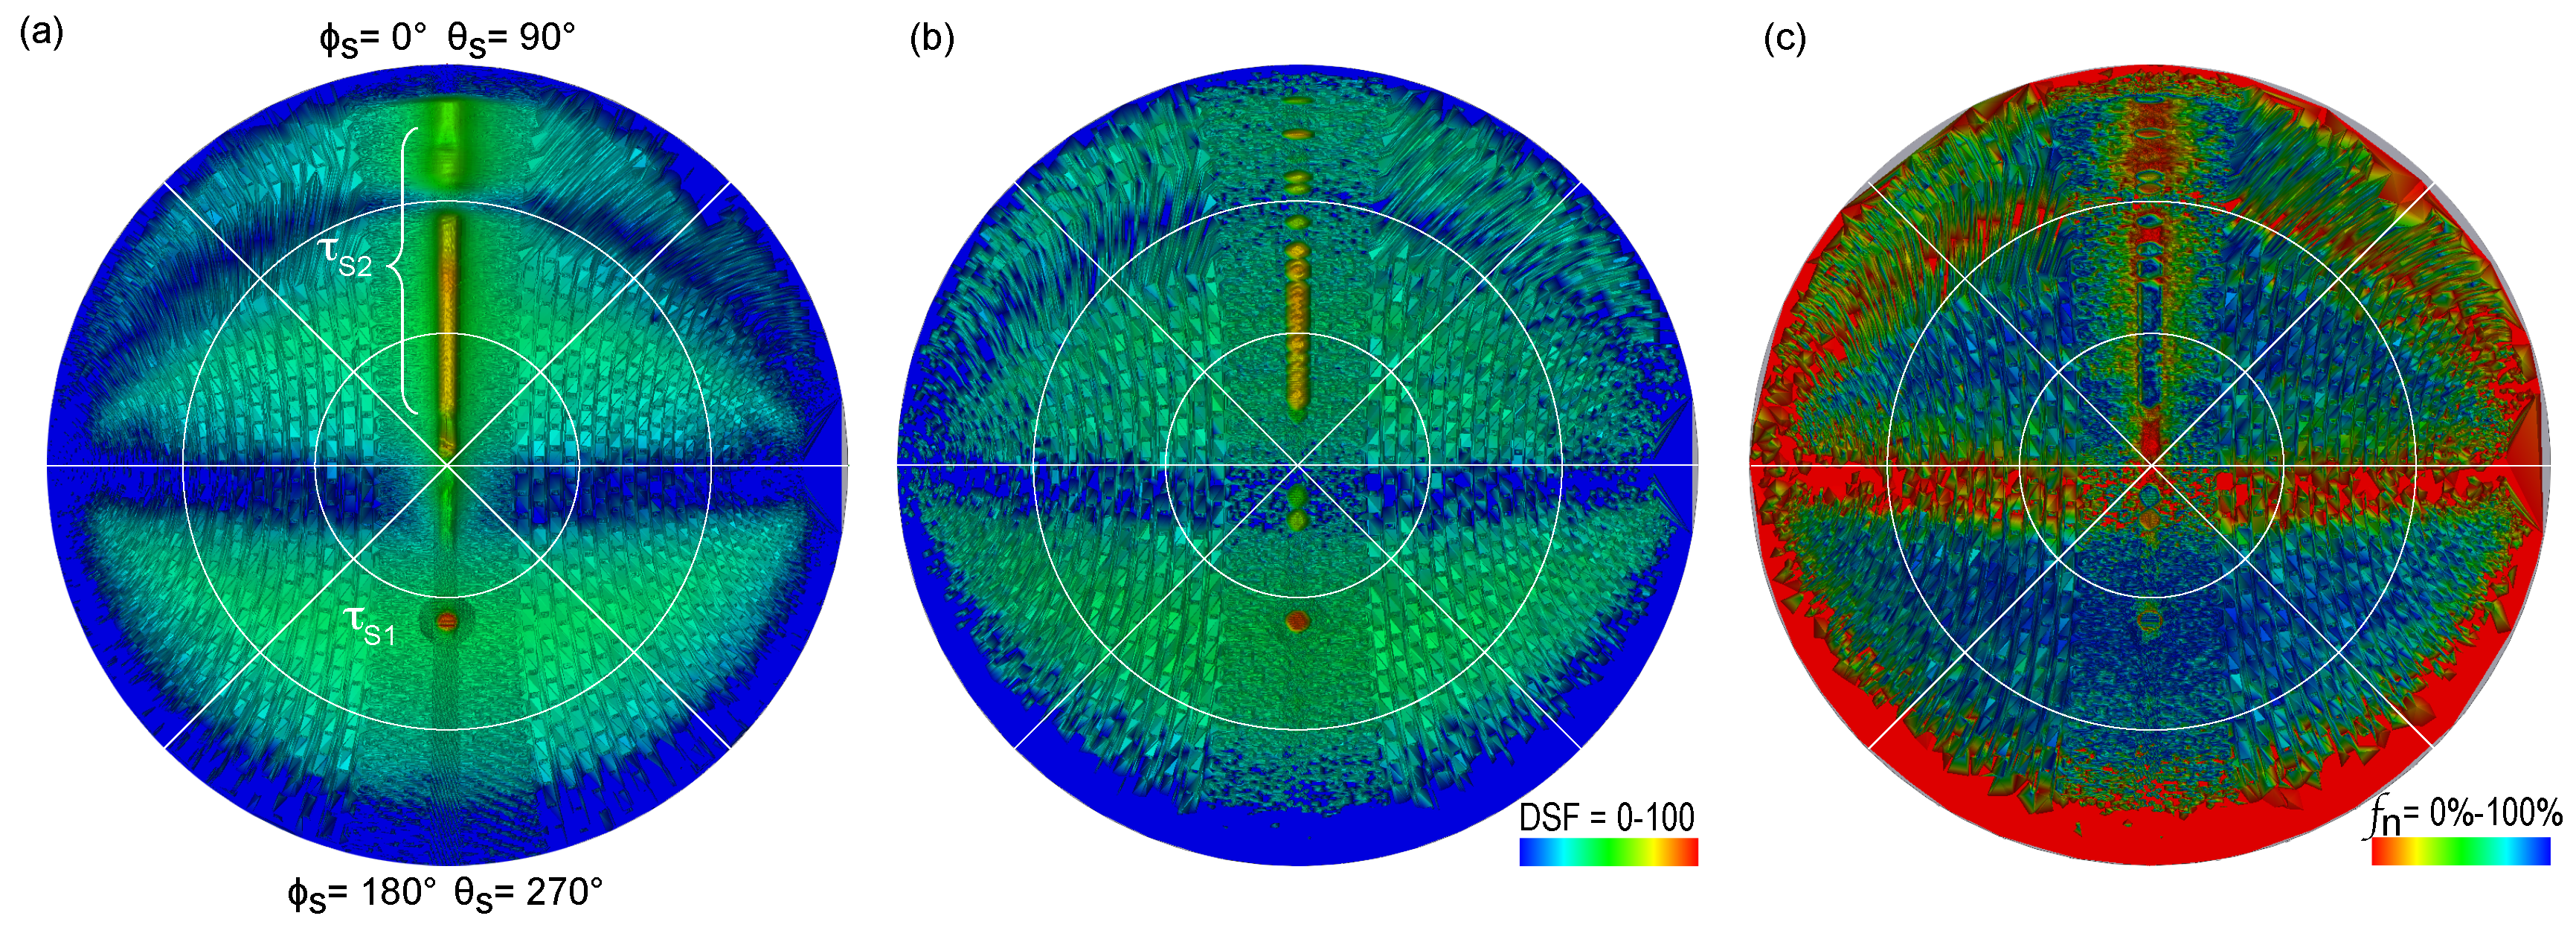
Figure 10.
DSF (logarithmic) for and in the transmission hemisphere: (a) The measurement V1 and (b) the simulation V3 show prominent features such as the directly transmitted () or the redirected light () in the same topology. The diffuse background has a similar form but is obscured by noise in the simulation. The measurement shows a continuous ridge along while in the simulation tessellation is manifested in discrete peaks; (c) This leads to areas of lower local accordance () along the ridge. The lowest local accordance is reached for very low DSF where the simulation is affected by noise.
Figure 11.
Linear section in the scattering plane: Measurements V1 (black), model V2 (design geometry, blue) and model V3 (red) for and for (a) and (b).
Figure 11.
Linear section in the scattering plane: Measurements V1 (black), model V2 (design geometry, blue) and model V3 (red) for and for (a) and (b).
Table 1.
Simulation parameters applied in the implementation of a Virtual Goniophotometer in Radiance.
Table 1.
Simulation parameters applied in the implementation of a Virtual Goniophotometer in Radiance.
| Command | Parameter | Description | Value | |
|---|
| mkpmap | -ap pmap | Photon map file pmap, target photon count | | =8,000,000 |
| | -apo pmod | Modifier pmod of photon port at aperture | | |
| | -aps rmod | Modifier rmod of spherical receiver surface | | |
| rtrace | -ap pmap k | Photon map file pmap, lookup bandwith k | k | =2000 |
| | -am | Initial maximum photon search radius | | =0.009 |
| | -ab | Ambient bounces, set to −1 irradiance is exclusively calculated form the photon map | | = |
Table 2.
Conical-hemispherical transmission for measurements and simulation results and .
Table 2.
Conical-hemispherical transmission for measurements and simulation results and .
| | | | | |
|---|
| | | | | |
| | | | | |
| | | | | |
| 13% | 6% | 7% | 9% | 13% |
| 10% | 3% | 12% | 10% | 9% |
Table 3.
Biconical transmission for measurements and simulation results and .
Table 3.
Biconical transmission for measurements and simulation results and .
| | |
|---|
| | |
| | |
| | |
| 28% | 88% |
| 14% | 28% |
Table 4.
Global accordance of models V2 and V3 with the measurements (V1) expressed in . The global accordance of the reference beams () of the physical and virtual (VGP) illumination system is given for comparison.
Table 4.
Global accordance of models V2 and V3 with the measurements (V1) expressed in . The global accordance of the reference beams () of the physical and virtual (VGP) illumination system is given for comparison.
| | | | | | |
|---|
| – | | | | | |
| – | | | | | |
| 92% | – | – | – | – | – |
Table 5.
Overview significant results: global accordance and biconical transmission for show significant differences between the BSDF of the design geometry and the production sample. The results are better for the comparison of the production sample (V1) with the model (V3) that includes the observed small geometric deviations. The result from the comparison of the virtual and physical reference beams shows the maximal level of global accordance.
| | Global Accordance (f) | Biconical Transmission Error () |
|---|
| V2 vs. V1 | | |
| V3 vs. V1 | | |
| Reference beams | 92% | – |
© 2016 by the authors; licensee MDPI, Basel, Switzerland. This article is an open access article distributed under the terms and conditions of the Creative Commons Attribution (CC-BY) license (http://creativecommons.org/licenses/by/4.0/).


