


Abstract
This study evaluated the crack-bridging capacity of textured coating systems across 60 test specimens using an adapted UEAtc test method, comparing analog dial gauges with two-dimensional Digital Image Correlation (2D-DIC) on acrylic and mortar substrates. Acrylic substrates achieved higher mean bridged crack widths (0.97 to 1.20 mm via dial gauges and 0.39 to 0.51 mm via DIC) than mortar prisms (0.30 to 0.42 mm via dial gauges and 0.21 to 0.36 mm via DIC). The elastomeric topcoat increased nominal crack-bridging by up to 46.2% in DIC measurements, although substrate type was the mechanically dominant factor in the ANOVA (). Bland–Altman analysis indicated a systematic mean bias of and significant proportional bias (), demonstrating close agreement for narrow cracks (<0.40 mm) and progressive divergence at larger openings due to mechanical contact seating effects (). The main limitations stem from the spatial disparity between discrete substrate fixtures and continuous surface tracking. In conclusion, DIC is a reliable, non-contact technique for mapping continuous strain fields and identifying initial microcracking, but it cannot directly replace mechanical contact gauges across large deformation ranges without bias compensation.
1. Introduction
Traditional experimental instrumentation employs devices that measure displacements at specific points prepared in advance for measurement. According to [1], the analysis of engineering problems has increasingly utilized optical techniques, such as Digital Image Correlation (DIC). These measurements are becoming more widely accepted in experimental analyses for evaluating macroscopic parameters, such as strain and displacement. One issue that can be analyzed with the assistance of these techniques is the occurrence of cracking. The DIC instrumentation method can complement traditional instrumentation by enabling the measurement of the displacement field across the observed surface.
The appearance of cracks is observed in both innovative and conventional building systems. In the past, cracks were treated as inevitable consequences of natural phenomena; today, however, it is known that their onset can be congenital and that actions can still be taken to minimize the problem [2]. Among the various pathological manifestations identified in studies and in civil engineering practice, cracking is a recurring issue in buildings.
Cracks can be symptoms of the action of one or more degradation agents. They result from a build-up of stresses that exceed the material’s strength and form an opening to relieve these stresses. Cracks can be classified according to their dimensions (depth and crack width), opening characteristics, movement activity, and causes, which assume different nomenclatures. The authors [3,4,5] establish that cracks are openings smaller than or equal to 0.5 mm. This definition will also be adopted in this work.
Regarding activity, in agreement with [6], active cracks undergo movement, altering their dimensions over time, whereas passive cracks exhibit no changes in shape, length, or width for years. The authors further subdivide active cracks into seasonal (varying with temperature) and progressive (consistently expanding over time).
The causes of cracking are diverse and, in most cases, involve movements that can occur in the walling system, structural framework, rendering/coatings, among other systems that comprise the building. Cracks occurring in external renderings are influenced by weathering agents, which can exacerbate the issue, compromising the continuity of the building envelope. The building envelope is the physical separation between the internal and external environments, according to [7]. In this work, the focus will be on cracks observed on the facade, defined according to [5], as the outermost face of the building.
The investigation of cracks and the knowledge of materials have led to the use of coating systems (paint systems) as a sealant/closure for certain types of cracks. This characteristic of coating systems represents an advancement toward restoring satisfactory performance, made possible by the technological development of paints and textured coatings. Studies such as that by [8] discuss how properly formulated paints can serve as a barrier against aggressive environmental agents—such as water, water vapor, carbon dioxide, and chloride ions—for porous substrates. Coating systems consist of a set of materials that, when applied in overlapping layers—respecting the curing limits of each stage, substrate conditions, and application recommendations—form a system that combines the properties of its constituents.
Published studies on testing the crack-bridging ability of paint membranes or waterproofing coatings applied to concrete substrates can be cited: [9,10]. However, when looking beyond concrete and the structural framework to the building envelope as a whole—namely the walling system—studies regarding crack-bridging ability are less frequentlyfound: [11,12]. The UEAtc Directives for the Assessment of Thin Synthetic Resin Render Coatings for Walls [11] play a fundamental role in the implementation of this type of test. Additionally, evaluating textured wall coatings, by increasing the thickness of the coating system, focusing on a property other than water permeability, and using the DIC technique make this work novel.
According to [13], Digital Image Correlation (DIC) is an optical-based technique that allows for the measurement of two-dimensional coordinates on the surface of a specimen during a mechanical test. The technique enables measurement without physical contact. The use of DIC to monitor the deformation of a substrate and a membrane by deformation fields was observed in the work of [9]. Besides deformation, the study by [9] also evaluated the mode of crack opening and measured its width in adhered waterproofing systems on a concrete substrate. Two recent studies stand out for their use of DIC in verifying concrete beams in bendingtests: [14,15]. These studies use DIC for verifying cracks and microcracks, with [14] also verifying surface displacement using DIC.
In the incorporation of new technologies for database studies, both from data obtained through numerical or experimental modeling and from public data without testing, it is also important and was verified in the worksof [16,17]. The study presented by [16] simulated different scenarios by varying the location and degree of deterioration, through changes in the location of the applied load and the stiffness of the element. The different results obtained from modal frequency and modal curvature indicators were used to train a deep learning framework that allowed determining where the damage occurs and its severity in the beams. In the study by [16], the use of Artificial Intelligence (AI) was employed to assist in building inspections. The authors used a database of real images of cracks in mortar coatings with different finishes. Additionally, they encountered challenges such as the presence of noise and the classification of surfaces. The type of surface finish influenced the detection of substrate cracks by the authors; moreover, there was an imbalance in the relationships and overfitting in the AI training sessions. The authors highlight that an important limitation was the absence of a test group.
This work aims to evaluate the application of the DIC technique to assist in the characterization of painting systems regarding the concealment of substrate cracks in the Adapted UEAtc (1978) test. Statistical analysis will be conducted between the data acquisition methods using dial indicators or DIC. The actual thickness transmitted to the surface by the substrate will be evaluated by comparing the surface displacement measured by the DIC technique with the substrate displacement measured by analog dial indicators.
2. Materials and Methods
2.1. UEAtc (1978) Crack-Bridging Test
The test, described by the Common Directives [11], consists of determining, with the assistance of an optical system, the exact opening width of a crack transmitted from the substrate to the coating. The coating is applied according to the manufacturer’s specifications. The specified substrate is fiber cement consisting of three elements with dimensions of 150 mm in length, 50 mm in width, and 10 mm in thickness, featuring two chamfered corners aligned with the width and thickness of the components. The edges of the substrate components are rounded, and the three elements are secured together using a clamp to form a single test specimen with two joints of less than 0.1 mm each. The coating (paint system) is applied, cured for the required time, and the clamp holding the three substrate components together is removed. The specimen is tested with the coated face facing downward, taking care not to load the joints prior to the test procedure. The curing of the test specimens must take place over one month. The insertion of a wedge into the chamfered corners is then initiated to induce crack opening. The crack width determination is performed by taking 5 to 10 measurements divided across the two joints, indicating the maximum and minimum joint width values that cause coating failure. Failure is detected by observation through an optical reading device positioned above, aligned with the light beam emitted by a light source placed beneath the specimen.
2.2. Adapted UEAtc (1978) Crack-Bridging Test
The adaptation of the UEAtc crack-bridging test (1978) [11] became necessary to reduce test variability and address the difficulty of using the described optical system. The Institute for Technological Research (IPT) developed a test method based on the UEAtc method (1978) that considered the wedge insertion mechanism and a substrate with a discontinuity to guide the crack. The adapted UEAtc (1978) method used in this work is described in the following paragraph.
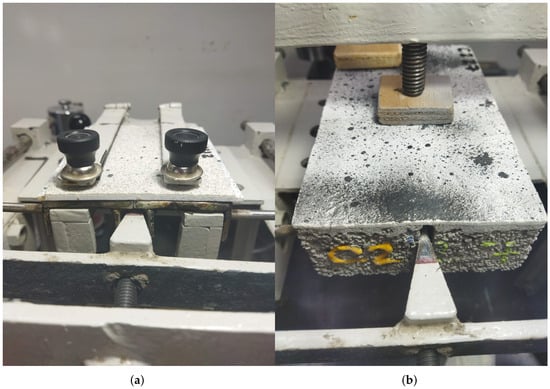
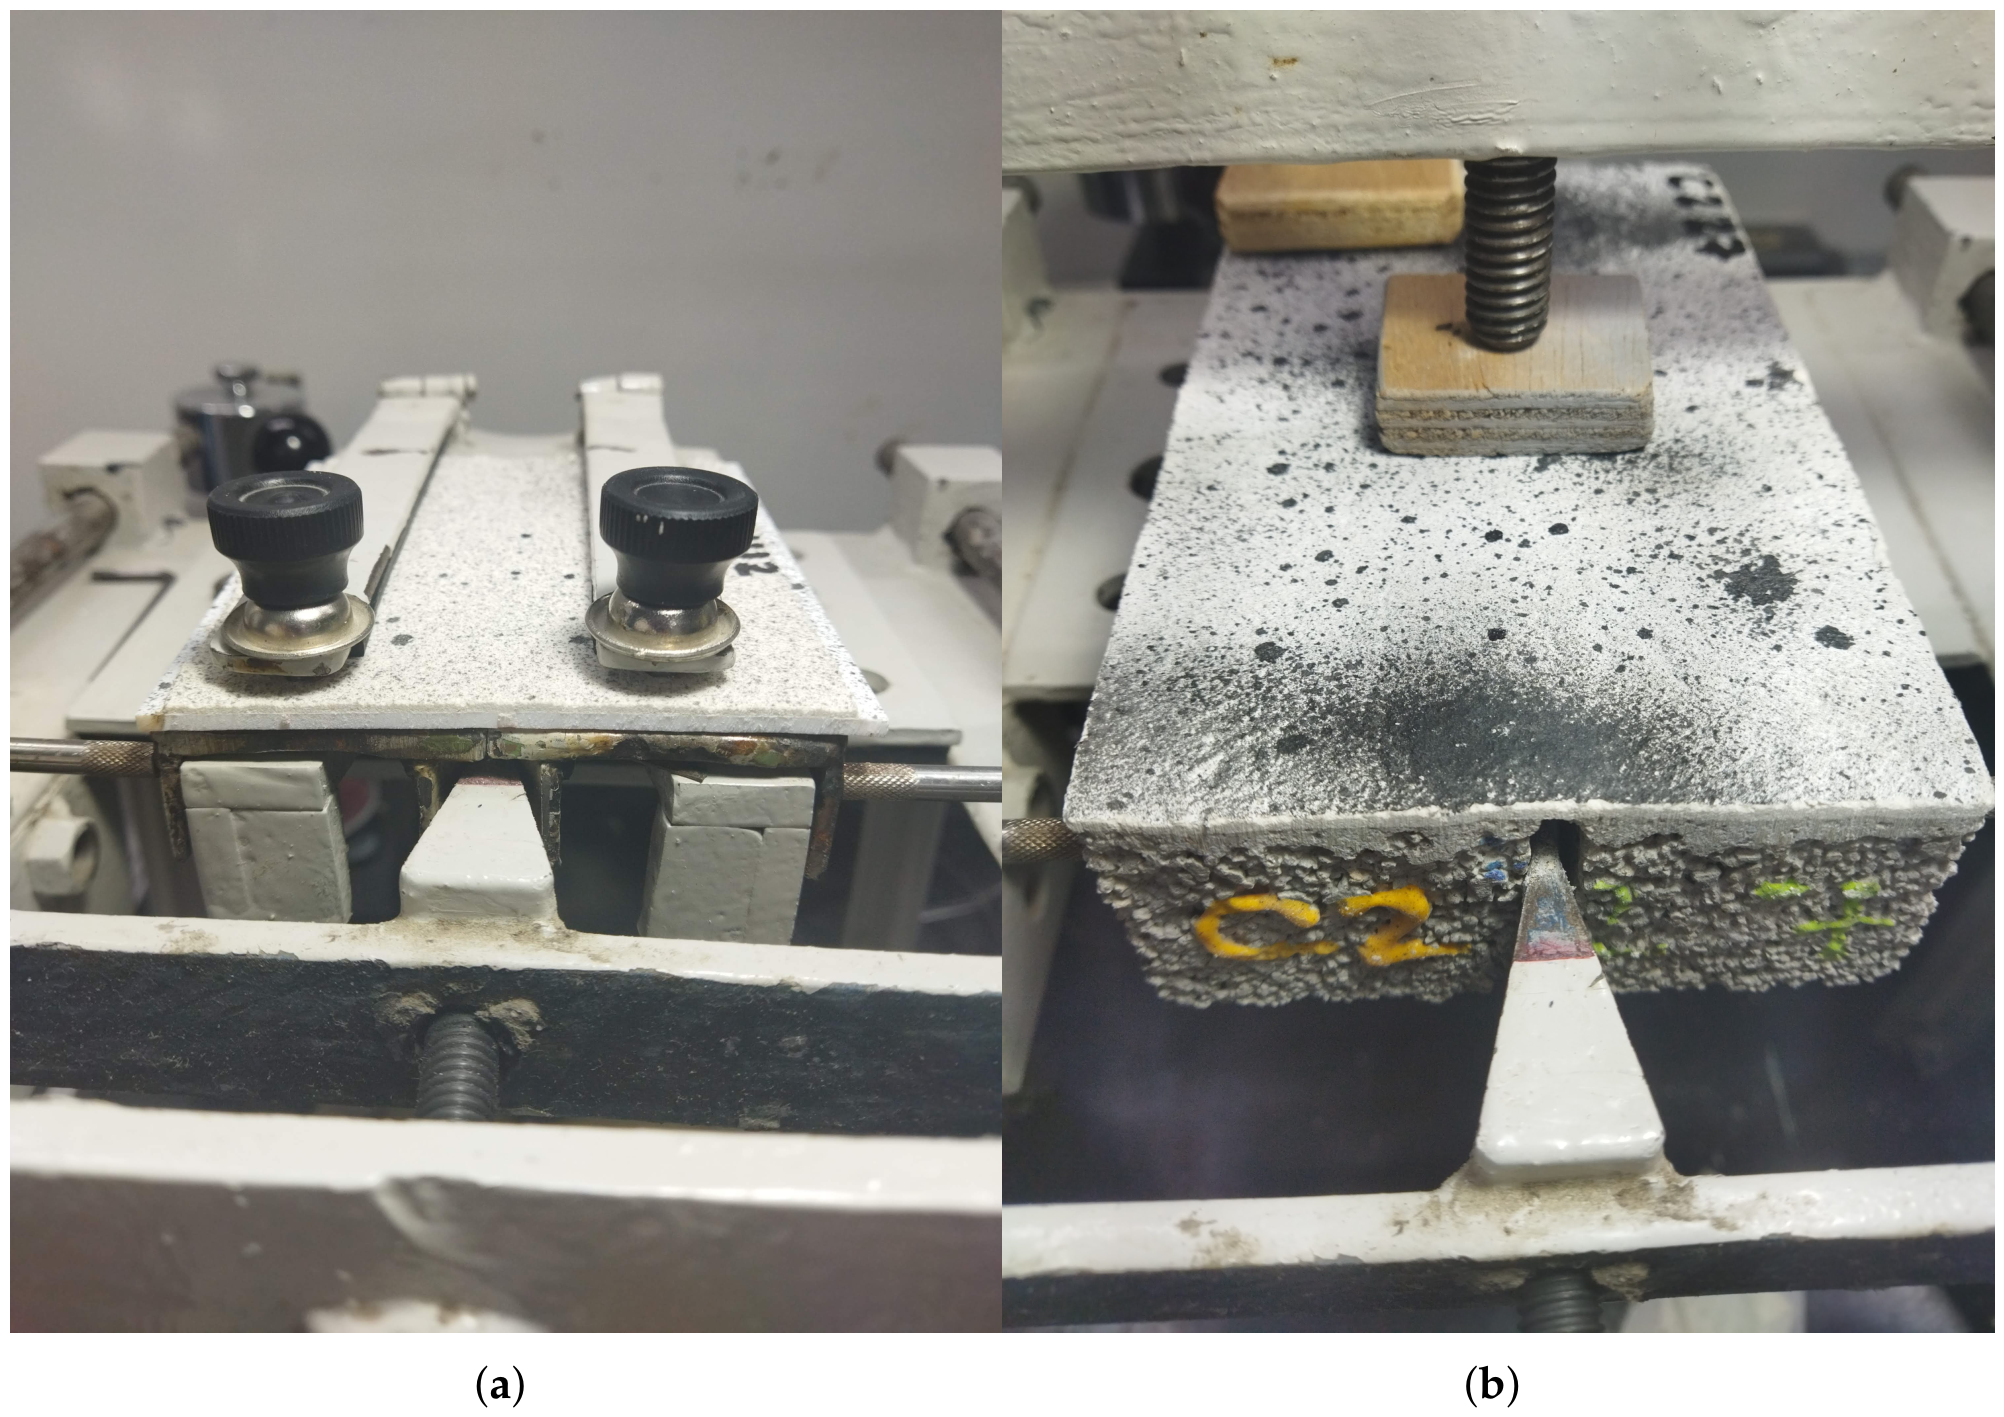
The test equipment comprises a structure supported by four profile sections joined by a metal frame. The equipment can be adapted for tests on mortar substrates as well as acrylic substrates. The substrate is made of cement, hydrated lime, and sand mortar, forming a 50-mm prism, or of acrylic with a thickness of 3 mm. For mortar, a wedge positioned in a pre-cut chamfer is driven directly into the substrate to induce cracking. In the case of the acrylic substrate, the mechanism used is the insertion of the same wedge into a metal plate that slides as the wedge is driven. Securing the specimen to the plate allows the load to be transmitted from the plate to separate the two parts of the acrylic substrate specimen. The acrylic substrate is prepared with a central opening. Fastening the specimen to the plate is accomplished using four pins. Records of the wedge position during testing on mortar and acrylic specimens are shown in Figure 1.
Figure 1.
Test mechanisms according to the UEAtc Directives (1978) [11]: (a) Test on acrylic specimens. (b) Test on mortar specimen.
A crack is generated in the coating system by driving a wedge into a pre-cut opening in the substrate. The fundamental principle of the test lies in the propagation of the crack from the substrate through the coating system layers until it reaches the surface. Both substrates are intentionally chamfered to guide crack initiation. The force exerted on the specimen, directed away from its center due to the wedge insertion, induces an increase in the central opening where the polyurethane sealant or the chamfer is located, as described in Section 2.2.2 and Section 2.4, respectively.
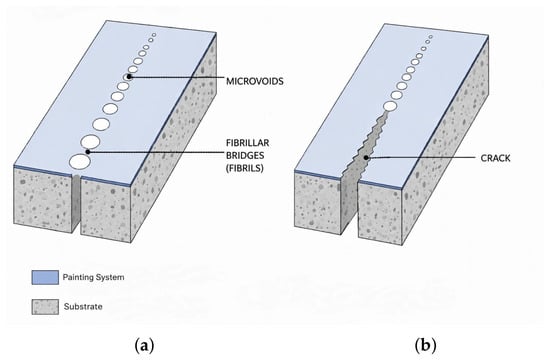
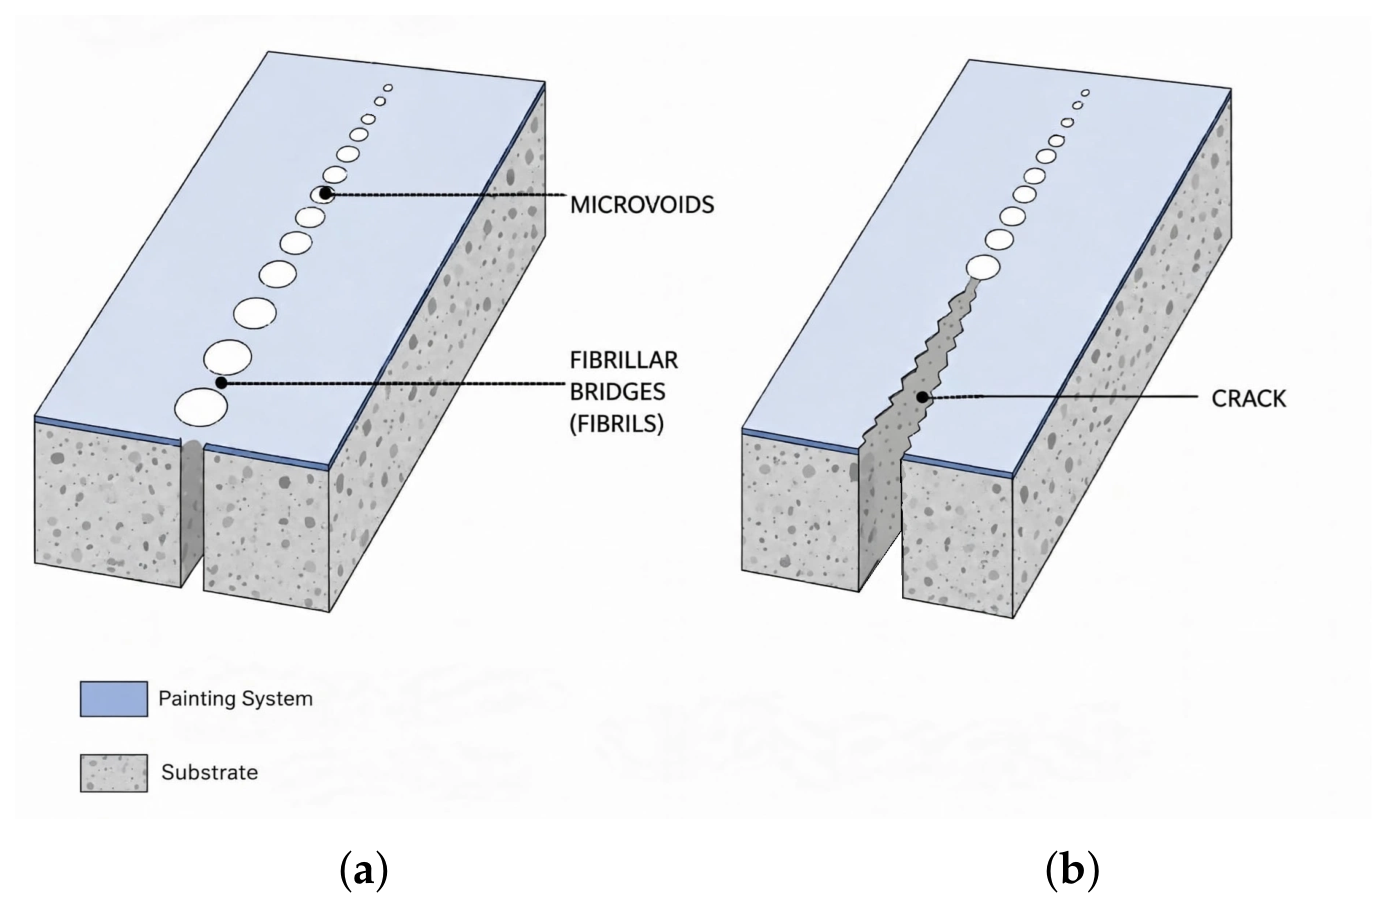
During the insertion of the wedge into the substrate, an operator inspects the surface of the specimen to detect crack initiation, conducting an inspection at each increment of wedge movement. At the earliest sign of crack opening, the operator pauses the test and measures the crack width. The failure mode observed on the specimen surface follows the models presented by [18] in Figure 2.
Figure 2.
Schematic drawings conceptually adapted from [18] showing (a) Crazing failure illustrating microvoids and fibrillar bridges (fibrils) on surface of painting system. (b) Crazing followed by crack formation.
Crack width is measured using two dial gauges anchored either to the substrate or to the plate attached to the substrate. The gauges have a resolution of 1 μm. Readings from both gauges are recorded immediately upon detecting failure on the specimen surface. The dial gauges measure the displacement of each part of the substrate separated by the wedge at the location where the crack is intentionally induced. At the beginning of each test, the initial position of the gauge needles is checked and recorded. At the end, the new needle positions are recorded, and the displacement of each part of the substrate is calculated by subtracting the initial reading from the final reading. The result of this test is obtained by summing the displacements of each part of the test specimen and is expressed in millimeters. This value corresponds to the crack width beyond which the coating system can no longer bridge or conceal the crack opening.
2.2.1. Mortar Substrate
The molding of the mortar specimens was carried out in two distinct batches (Batch 1 and Batch 2) in a controlled environment with regulated temperature and humidity. This substrate constitutes Type “C” substrate. The date and time of casting were recorded. The mix proportion used was identical to that used by [12], 1:0.7:7 (cement:hydrated lime:sand, by mass), with a water-to-dry-materials ratio of 16%. The only difference relative to the mix proportion in [12] was the sand used. In this study, standard sand was used according to [19], specifically fraction No. 16, with material retained between sieve openings of 2.4 mm and 1.2 mm. Conversely, ref. [12] used sand passing through the No. 20 fraction sieve. The water absorption measured in the mortar substrates averaged 12.9%, with a maturity period exceeding 28 days, according to [20]. Mixing was conducted in accordance with [21], by dividing the water into 75% and 25% portions and adding it to the mixture in two stages.
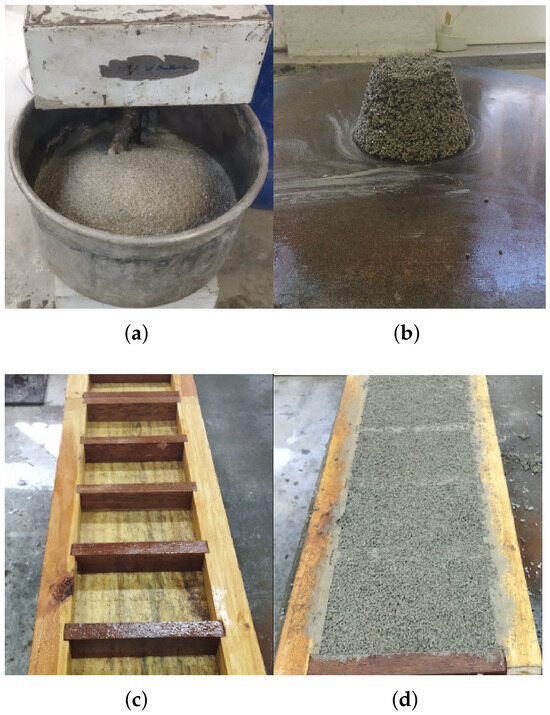
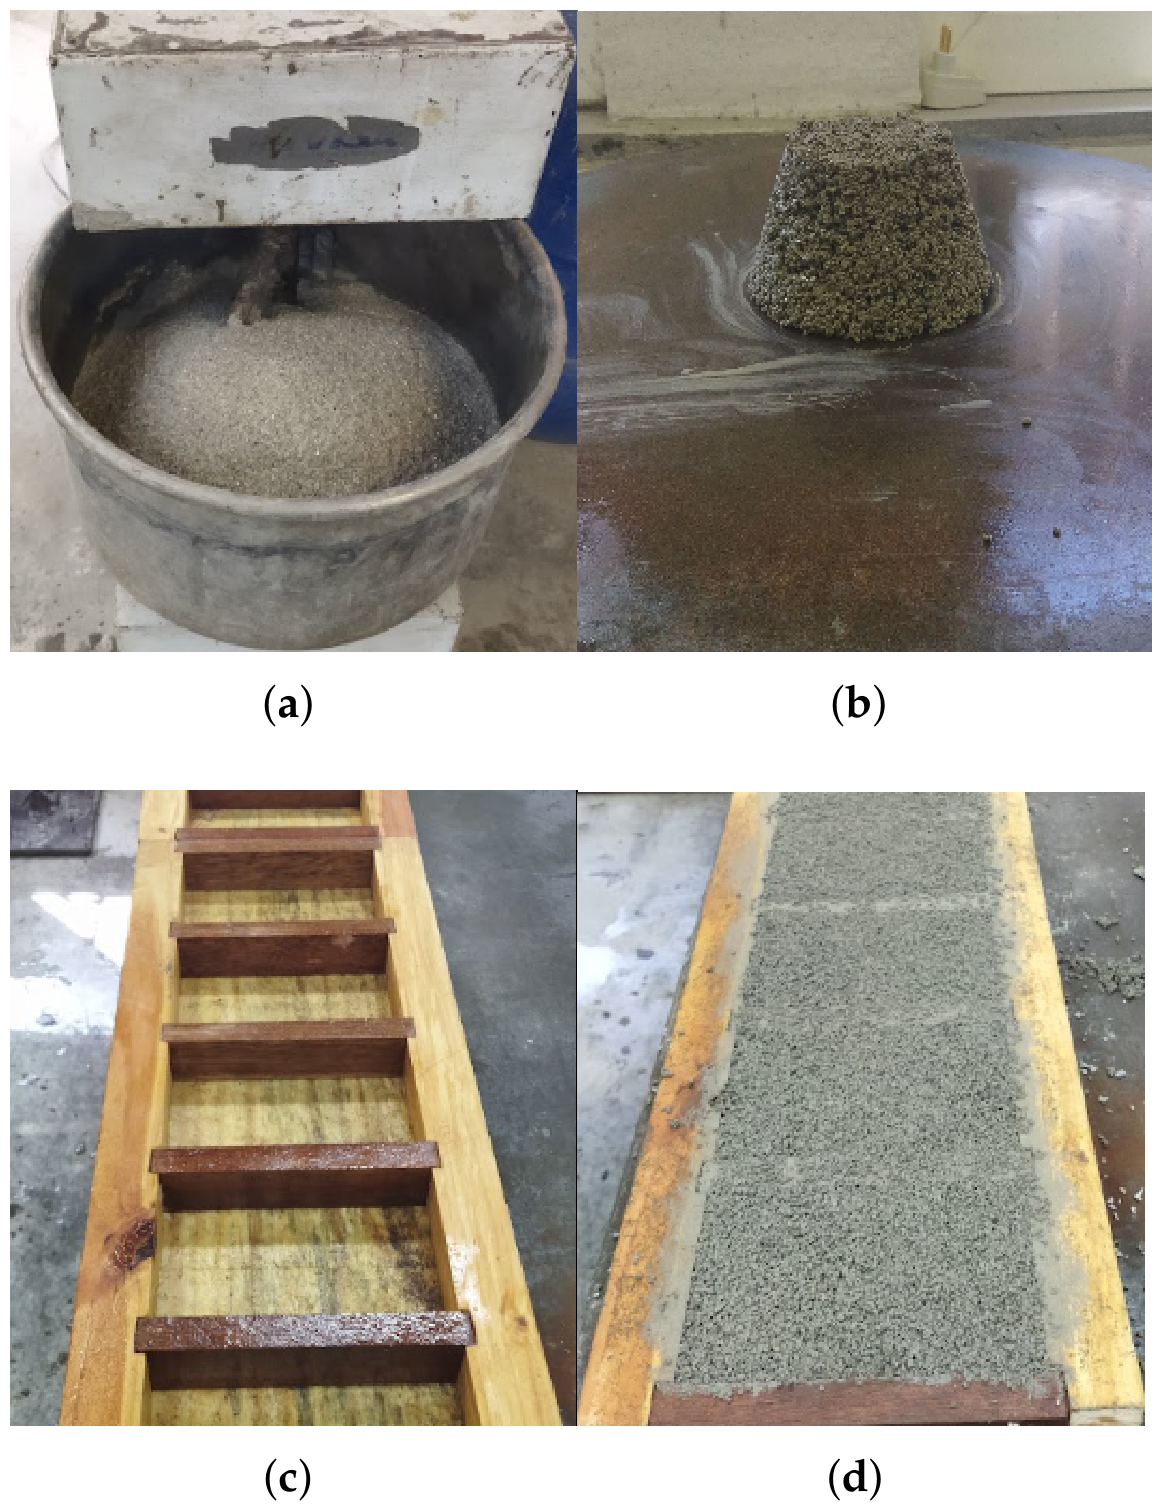
Figure 3 displays photographs of material weighing, mixing, and substrate molding.
Figure 3.
Preparation of mortar test specimens: (a) Mixing of dry constituents (cement, lime, and sand). (b) Flow mold cone for consistency testing. (c) Molding after consolidation. (d) Demolding.
A sample of the mixture was taken to determine the mortar flow table consistency in accordance with [22]. The measured flow table value for the mortar was 207.7 mm. Following mixing and consistency determination, specimens were molded for mortar characterization. The flexural tensile strength and compressive strength of the mortar at 28 days were 3.52 MPa and 6.51 MPa, respectively, in accordance with [23].
After molding the characterization specimens, the substrates for the crack-bridging tests were molded. The demolding of the mortar substrates occurred one day after mixing and casting. The substrates remained in the moist room from the completion of molding until 28 days of curing were completed, and they were labeled according to their casting date (Batch 1 and Batch 2). The molds used for casting the substrates were designed to facilitate demolding without damaging the specimen. Consequently, three mold sets were fabricated, capable of molding a total of 15 substrates. The mold sets were constructed from Pinus wood, and a release agent was applied to the inner faces of the molds prior to specimen casting. The molds consisted of 9 fully collapsible components to facilitate specimen demolding. The mortar substrates had final dimensions of 170 mm in length, 100 mm in width, and 40 mm in thickness. Figure 3 also includes photographs of the mortar specimen preparation.
Each of the 30 mortar test specimens was associated with a batch based on its molding date. Fifteen specimens were from Batch 1, and fifteen specimens were from Batch 2. Twenty-eight days after molding the mortar specimens, the coating system was applied to the smoothest surface of the mortar prisms. The systems were randomly applied to the mortar specimens, with fifteen specimens allocated to each system (with paint or without paint).
2.2.2. Acrylic Substrates
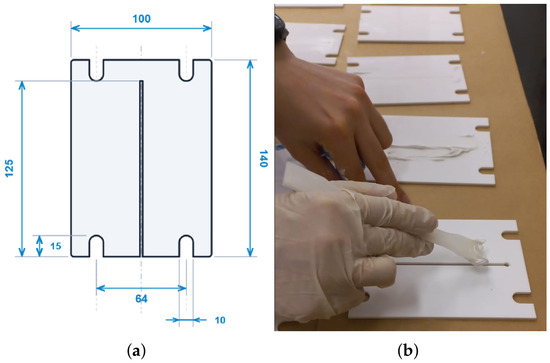
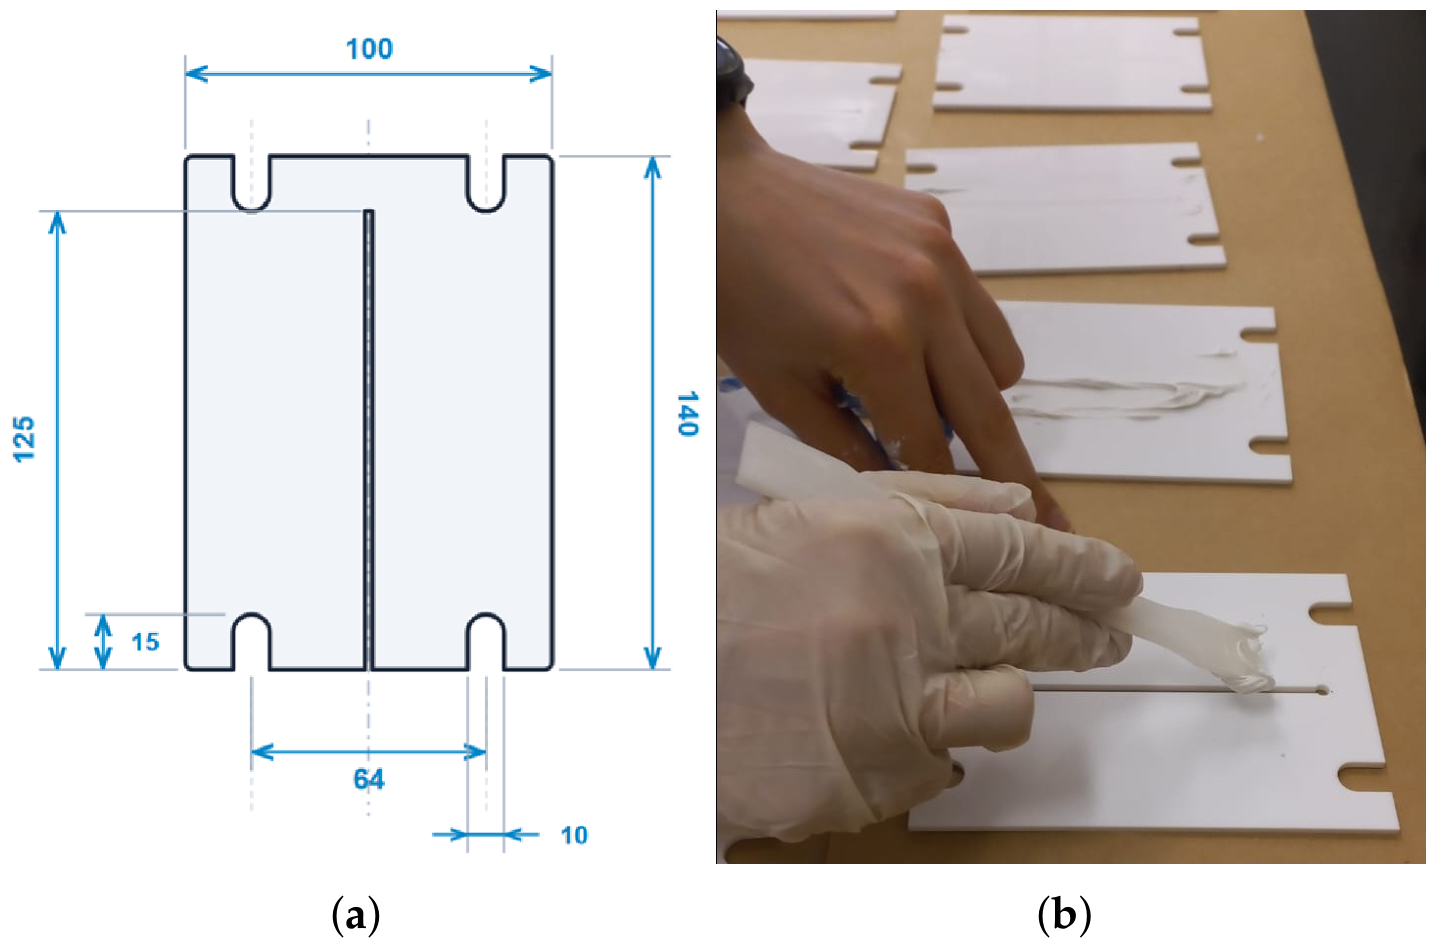
The acrylic substrates were acquired in a single batch (Batch 1) with dimensions and characteristics previously defined. The acrylic substrates followed the dimensions and guidelines of the Adapted UEAtc (1978) test method. The acrylic substrates are shown in Figure 4. A total of 30 laser-cut acrylic units were obtained, with dimensions of 140 mm in length, 100 mm in width, and 3 mm in thickness, featuring a central opening to guide the crack.
Figure 4.
Acrylic Substrate: (a) Dimensions of the acrylic substrate in millimeters. (b) Prior preparation of the acrylic substrate with polyurethane sealant.
The acrylic substrates underwent surface preparation prior to the application of the coating systems, as shown in Figure 4. First, the acrylic substrates were placed on the workbench, and the protective film was removed from both sides of each substrate. After removing the film, clear adhesive tape was applied over the central opening of each substrate. The specimen was then rotated 180°, and a single-component polyurethane-based sealant was applied to the central opening to enable the application of paint over this point, which will guide the crack. Twenty-four hours after the application of the polyurethane sealant, the mass of the specimens was measured, and the sealant was applied.
2.3. Coating System
The coating systems used were designated as System 1 (without paint) and System 2 (with paint), comprising two or three components that are described in this section according to the manufacturer’s technical datasheets.
The sealer used is an acrylic sealer formulated with aqueous resins, inert mineral fillers, additives, and water. According to the manufacturer, the sealer is suitable for exterior and interior applications to equalize substrate absorption. The sealer is white with a smooth texture and is classified as 4.1.2.5 according to [24], opaque sealer for interior/exterior masonry. The function of this product category, according to the standard, is to seal and equalize the absorption of general masonry surfaces to be skim-coated or painted. The manufacturer-reported sealer coverage was 0.25 kg/m2.
The textured coating used was an acrylic texture based on aqueous resins, inert fillers, organic and inorganic pigments, additives, and water. According to the manufacturer, this coating provides a sandy textured finish that conceals substrate imperfections. The color of the texture used is white, featuring a “sponge-rolled” (stippled) texture style. Furthermore, the manufacturer highlights that the product exhibits good weathering resistance, adhesion, and water repellency, and can be used without a finishing paint layer. The recommended application is for rendered walls, concrete blocks, precast panels, fiber cement, and timber, particularly building facades. The texture consumption reported by the manufacturer was 0.57 kg/m2.
The paint used is formulated from elastomeric acrylic resins, organic and inorganic pigments, inert fillers, additives, and water. According to the manufacturer, the paint is suitable for exterior and interior painting of masonry and concrete. The primary function of this paint is to protect the surface against weathering. The available colors follow the catalog, and the product has a smooth, matte finish. The paint in question is classified by the manufacturer, according to [24], as flexible crack-bridging latex paint for exterior and interior masonry, Type 4.5.16. The function of this paint classification, according to the standard, is to paint and accommodate expansion and shrinkage of general masonry surfaces up to 0.3 mm. The manufacturer specified a paint coverage of 0.20 kg/m2.
Testing was conducted 18 days after texture application and 14 days after paint application.
The coating system application was performed in a climate-controlled room at a temperature of 23 °C and a relative humidity of 50%.
2.4. Coating System Application
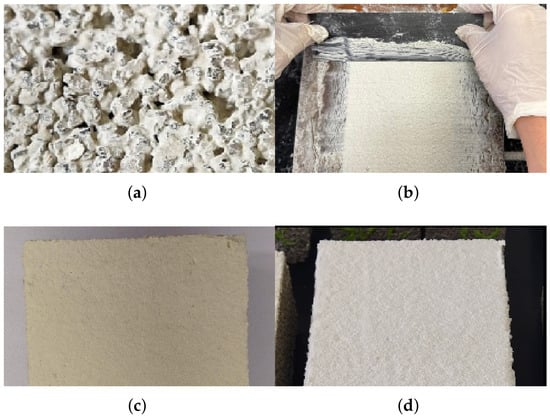
Two different coating systems were used: one with a finishing paint and one without. The application of the coating systems took place in an environment with controlled temperature and humidity. The coating system was applied to the least irregular face of the mortar specimens, shown in Figure 5.
Figure 5.
Surfaces of mortar substrate specimens: (a) Mortar substrate prior to coating. (b) Texture layer thickness limiting device. (c) Textured surface. (d) Surface with finishing paint.
The first step in applying the coating system was the sealer application, described in Section 2.3. Sealer application was performed according to the manufacturer’s guidelines: the package was opened, the product was homogenized, a single coat was applied with 10% dilution, the application surface was cleaned, and one coat of sealer was applied using a roller. After applying the sealer, the mass of each specimen was recorded. Care was taken to apply the sealer by rolling over the specimen surface the same number of passes for each specimen.
After applying the sealer, a 24-h waiting period was observed, followed by the application of the texture layer. For this layer’s application, a depth gauge device was used to limit the texture thickness to 2 mm. Both the acrylic and mortar specimens had dedicated thickness-limiting devices for the texture layer, shown in Figure 5. The specimens exhibited the visual appearance shown in Figure 5. This procedure constitutes the application of the coating system without the finishing paint (Type 1).
Finally, 48 h after texture application, three coats of paint were applied to 30 of the 60 specimens, respecting a 6-h interval between coats. The first coat was applied with a 10% paint dilution, while the second and third coats were applied undiluted. This setup constitutes the coating system with the finishing paint (Type 2). Figure 5 shows the painted coating system applied to the mortar specimens. It is worth noting that a roller was used to apply both the sealer and the paint, whereas a trowel was used for the texture application.
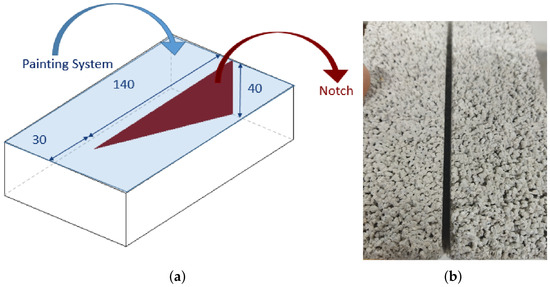
The mortar test specimens required detailed manufacturing following the application of the coating systems: a central cut serving as a notch to guide crack initiation. This cut is shown in Figure 6. The cut was executed using a 3-mm-thick diamond saw and a guiding device that enabled angled cutting without damaging the coating system.
Figure 6.
Notch to guide crack opening in mortar specimens: (a) Dimensions of the notch. (b) Notch.
2.5. Digital Image Correlation
The manual [13] defines Digital Image Correlation (DIC) as a non-contact technique used to measure the evolution of a two dimensional coordinate field on the surface of a specimen during a mechanical testing procedure. The manual also clarifies that the obtained coordinate field can be used to calculate derived quantities from the measured data. Furthermore, the manual indicates that the DIC is used to characterize solid deformation regardless of the material type or scale of interest.
The author [25] explains that DIC operates by comparing an undeformed reference image with subsequent deformed images. The images are captured using a camera with its optical axis perpendicular to the analyzed plane. The basic principle involves illuminating the object under analysis with a light source [1]. The region of interest must be defined and the specimen prepared; Section 2.5.1 addresses specimen preparation. The speckle pattern is a crucial step in this technique, as the artificial pattern covering the specimen surface enables accurate image processing [25].
The working principle of the technique relies on an algorithm, previously developed for processing video or image signals, to compute deformations across a discretized area of the surface under analysis [25,26].
According to [1], two main limitations to using optical technologies like DIC can be cited: the instability of the testing environment and the data processing, which is labor-intensive and time-consuming. Ref. [13] highlights a list of software programs developed to process the measured data. In this study, the software used for data processing was GOM Correlate.
2.5.1. Specimen Preparation for the DIC Technique
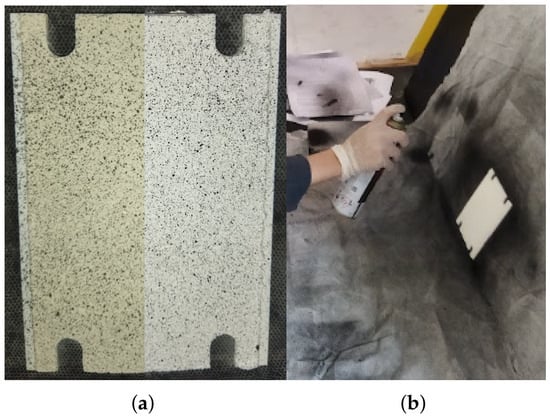
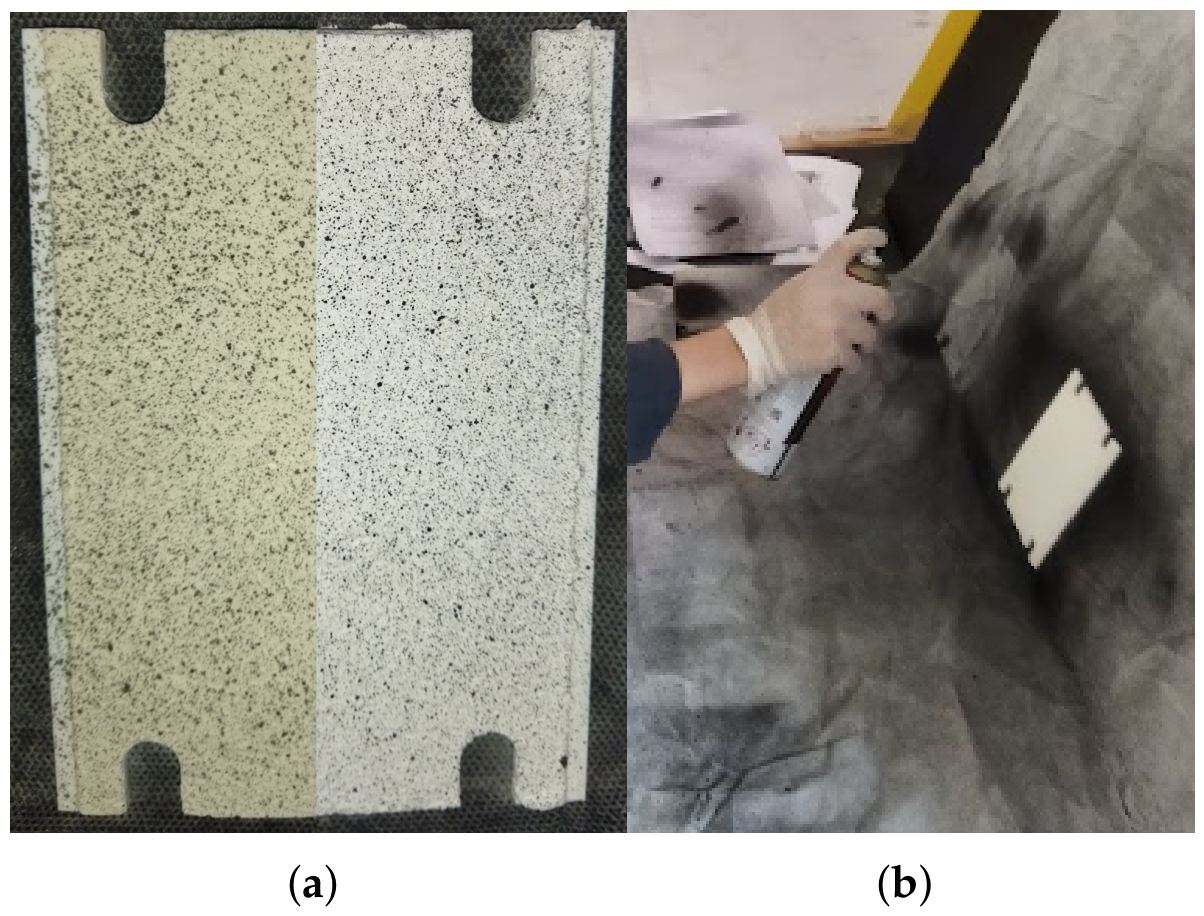
Following the application of the coating systems on the substrates, the pattern used for DIC imaging—the speckle pattern—was applied. The process of applying pattern and its execution are shown in Figure 7. This pattern was employed by [25] and is produced by applying black spray paint over a white background. Validation was conducted visually by comparison with the images from [25]. Ref. [25] emphasizes that the contrast between the background and the points of the speckle pattern is essential to achieve proper image processing. The spray paint application must ensure that droplets marking the specimen surface are large enough to function as the necessary speckle pattern for DIC analysis. Three spray paint brands were purchased, and only one achieved the desired effect. Application was performed by exerting gentle pressure on the black spray valve combined with a sweeping motion from left to right (and vice versa) directed toward the specimen surface, allowing the dispersion of dots without forming a continuous coat. The spraying distance was approximately 25 cm from the nozzle to the specimen surface. A side-by-side image of two specimens—one with System 1 (without paint) and the other with System 2 (with paint)—was prepared to compare the final surface after spray application, as shown in Figure 7.
Figure 7.
Surface pattern preparation: (a) Spray application. (b) Image prepared to compare the surface with spray application with or without finishing paint.
After applying the spray pattern, the specimens were stored in a climate-controlled room with regulated temperature and relative humidity. Twenty days later, the specimens were tested.
2.5.2. Instrumentation for the DIC Technique
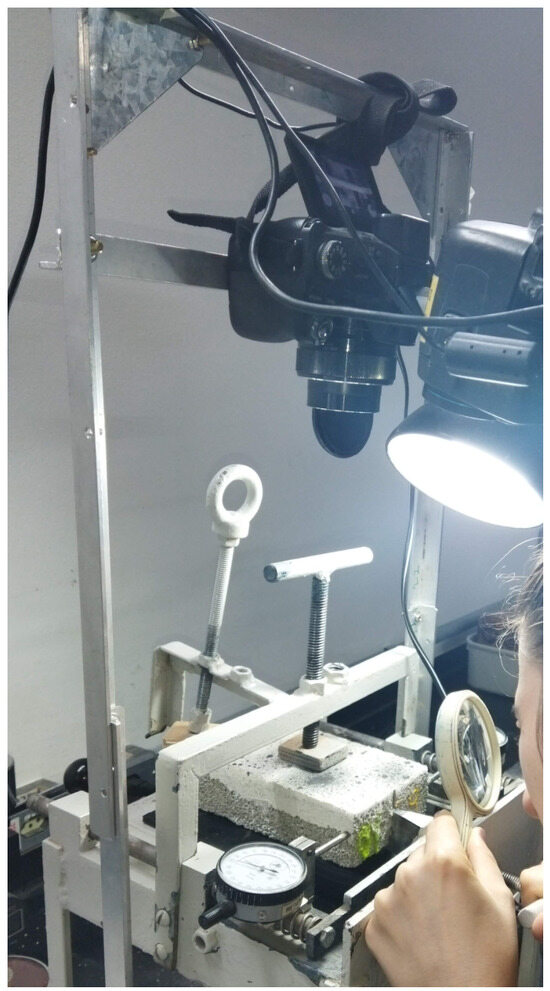
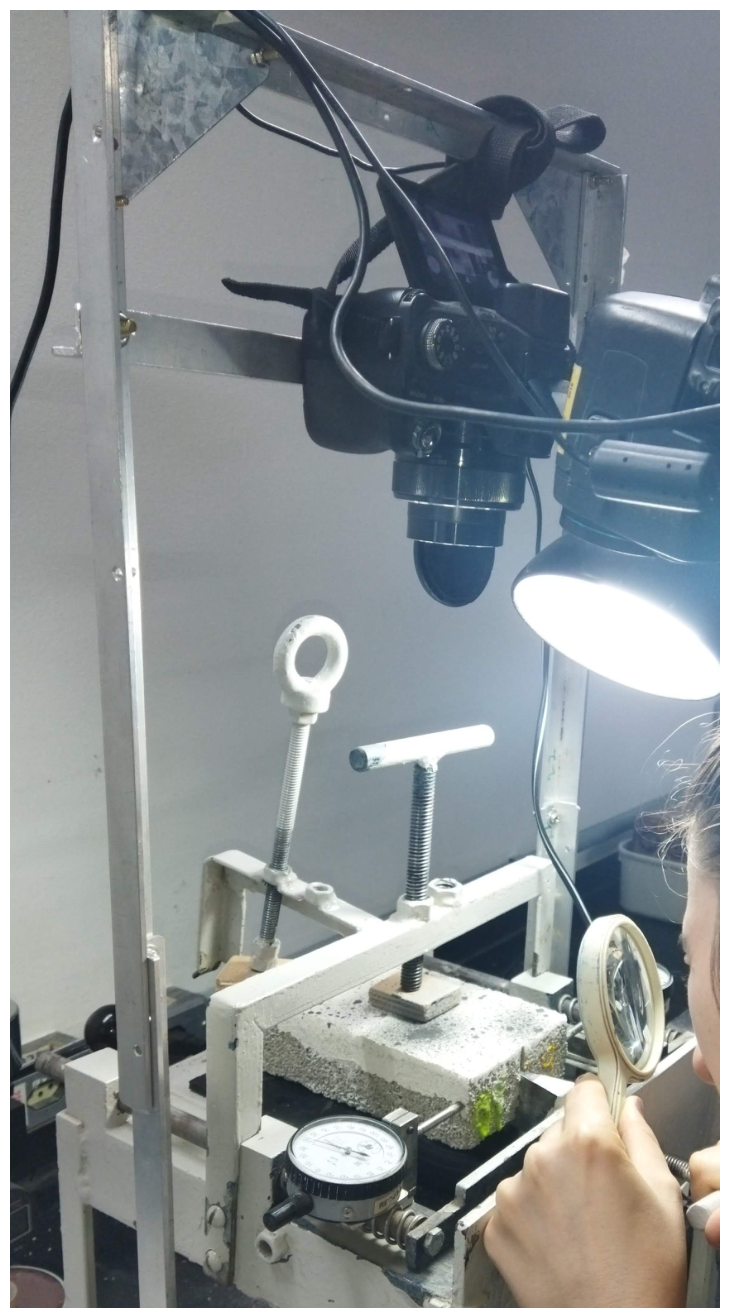
To enable the capture of the images necessary for using the DIC technique, a gantry made of aluminum profiles was produced, capable of capturing videos perpendicular to the test execution. This gantry was used by attaching a professional camera to it, as shown in Figure 8. The camera used was a professionalSony brand camera, model DSC-HX100V, made in Japan, with a resolution of 16.2 Megapixels. However, the video processing in GOM Correlate was performed with a resolution reduction to 1.56 Megapixels ( pixels), which is a reduction from the original pixels. The fixed lens, Carl Zeiss Vario-Sonnar T*, was positioned approximately 32 cm from the surface of the test specimens. In addition to the camera and gantry, a cold light source was used. Before the test began, the camera was activated and recorded the video of the test execution. After the crack was verified on the surface, the video recording was stopped.
Figure 8.
Camera support frame.
2.5.3. Processing of DIC Videos
Video processing was performed using the GOM Correlate Software. The version that was used is GOM Software 2019 (2019 Hotfix 8, Rev. 131186, Build 10 September 2020). Prior to processing, the video timestamp corresponding to when the operator observed failure in the coating system was verified by reviewing each video and identifying the exact moment the operator announced failure. It is worth emphasizing that having an operator trained to identify the earliest sign of failure was essential for this analysis.
Processing in the GOM Correlate software begins by importing the video, which the software converts into a series of images at a conversion rate of 0.67 s per frame. Each 0.67-s conversion interval is designated as a “stage.” The sum of these stages equals the total duration of the video. The converted images have dimensions of pixels% and a resolution of 90 dots per inch (DPI).
The surface processing time approximately matched the video conversion duration. It is estimated that processing each video took an average of 60 min. The computer used was equipped with a 12th Gen Intel® Core™ i5-12450H processor (2.00 GHz), NVIDIA GeForce RTX 2050 (4 GB) and Intel® UHD Graphics (128 MB) graphics cards, 16 GB of RAM, a 500 GB SSD, and a 64-bit operating system. Six virtual extensometers were deployed for each test specimen.
The version of GOM Correlate used in this study was GOM Software 2019 (2019 Hotfix8, Rev. 131186, Build 10 September 2020 ), including Inspection Kernel GOM v2.0.1, tested and certified by NIST and PTB.
After the video was converted, the calibration was edited according to the scale factor of the images based on previously measured distance points. Subsequently, a surface was created where the main deformations were located (closest to the wedge insertion). A subset size of 20 pixels and a distance of 2 pixels between points within the created surface area were defined according to the pattern quality. The table below (see Table 1) summarizes the properties used for analysis in the GOM Correlate Software.
Table 1.
Digital image correlation (DIC) computation and analysis parameters.
2.5.4. GOM Correlate Processing
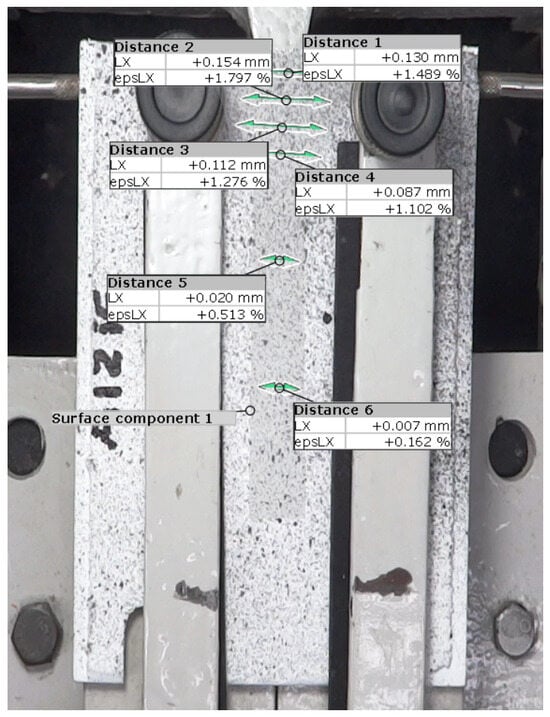
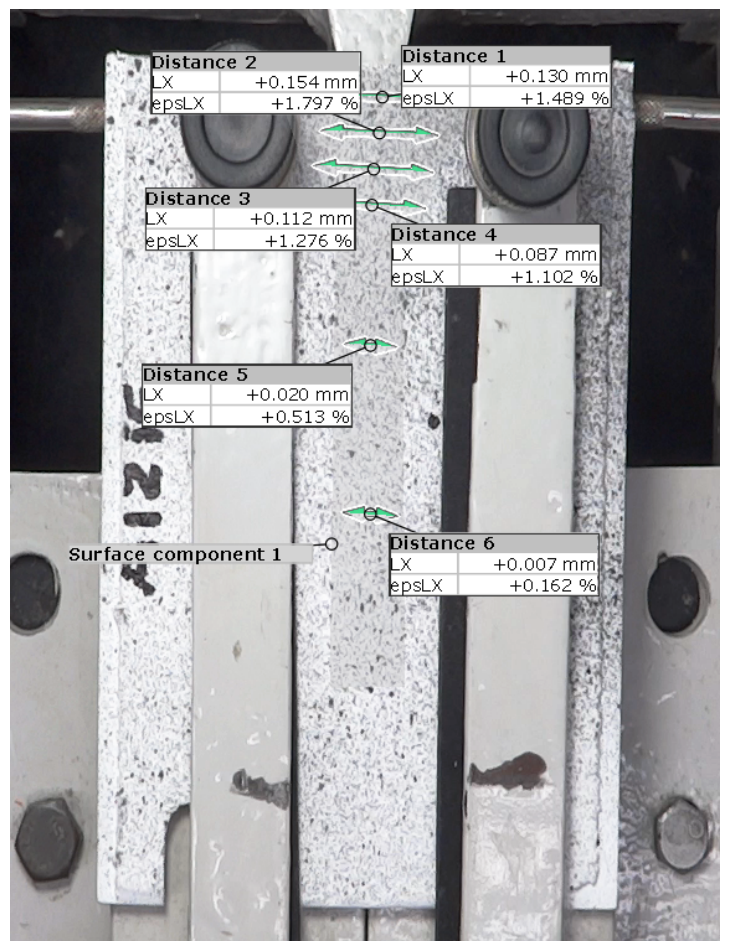
The analysis of the videos was conducted with the aim of recording the time at which the crack was observed, that is, the opening of the substrate from which it is no longer concealed. This time was used to find the data from the analysis obtained by the GOM Correlate software. The transmission of the effort to the surface of the painting system by the substrate will be understood in the following sections. The DIC analysis was conducted using the GOM Correlate software. Each of the 60 videos was imported into the program. After importing the video, the analysis begins with the calibration of the software and the definition of the scale. Then, the stages of the video were filtered to obtain a set of stages of 0.667 s. The analysis surface was then created, as shown in Figure 9. After creating the surface, six lines or virtual extensometers were created. The average of the six extensometers was used to calculate the displacement values in x of each test specimen relative to the initial stage. Each analysis resulted in two graphs: displacement vs. time and strain vs. time.
Figure 9.
GOM Correlate Analysis: surface component and two point distances creation.
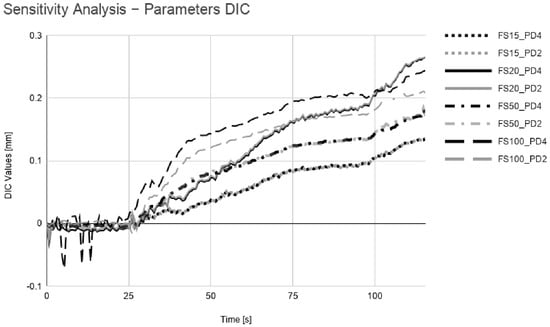
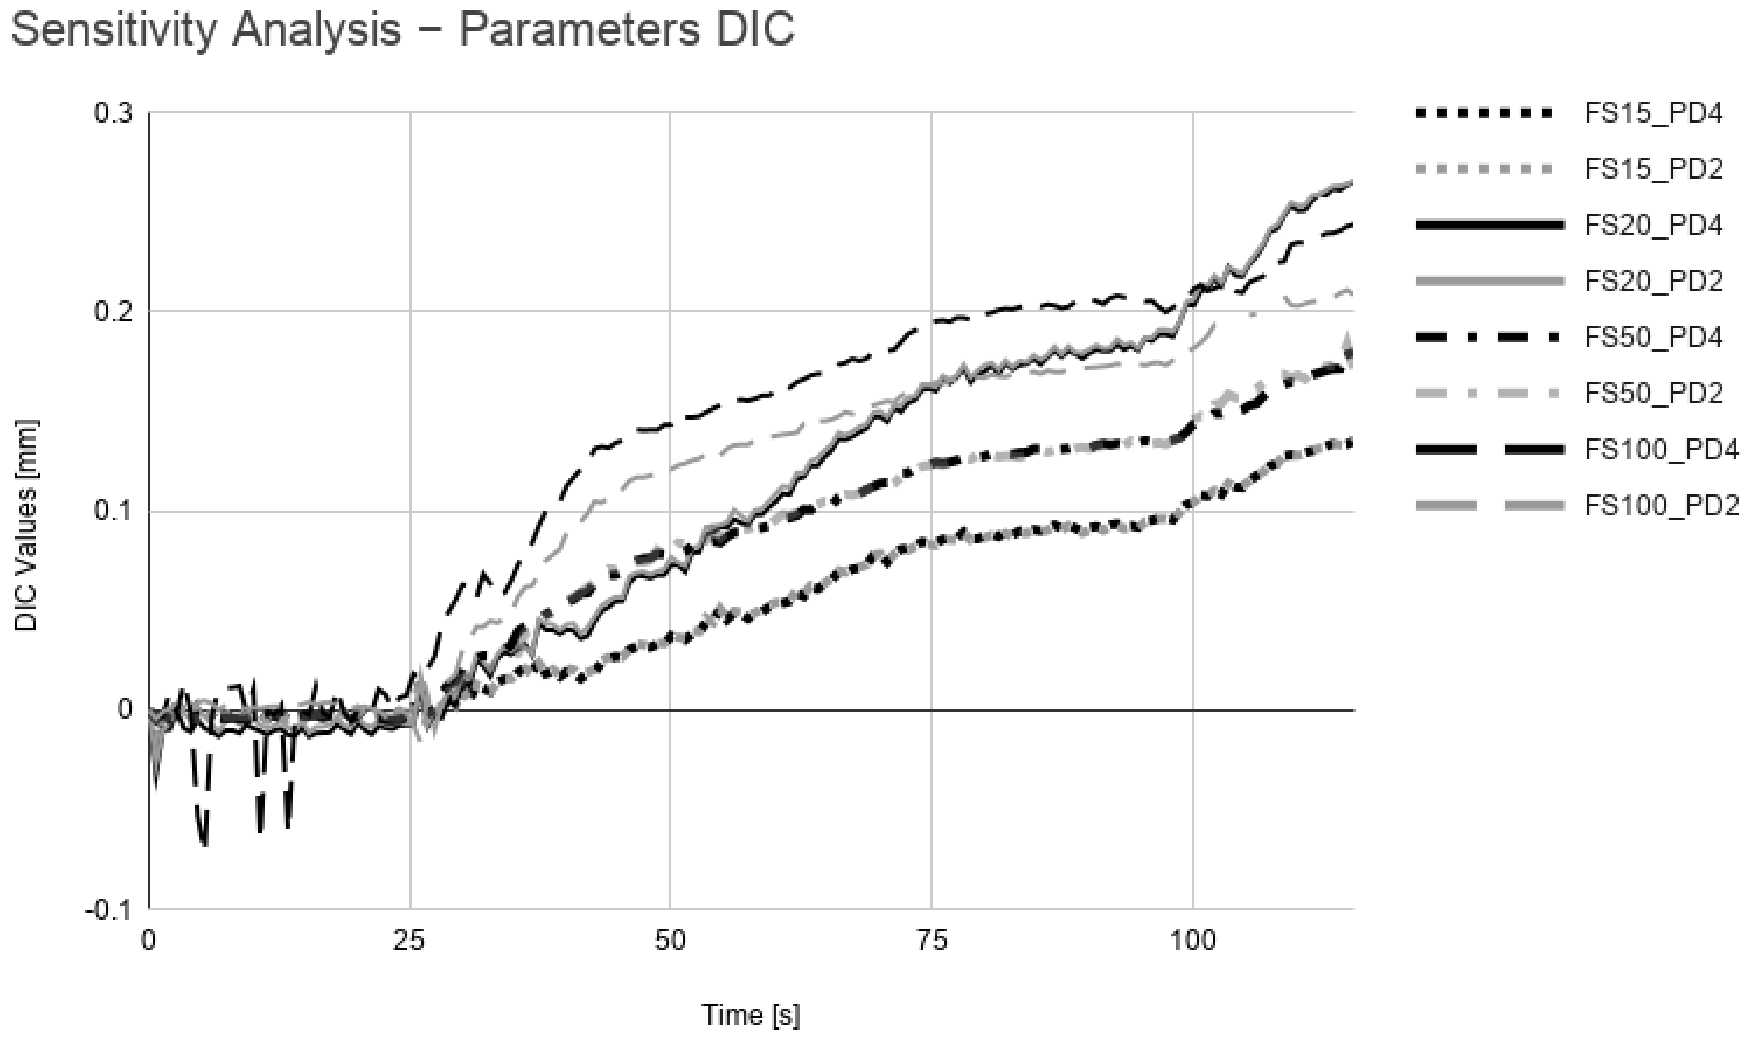
A sensitivity analysis was conducted to evaluate the similarity of pattern intensity between the reference subset and the intended one. The objective was to obtain the values of facet size and point distance to create the surface component. The results of this analysis are presented in Figure 10.
Figure 10.
Diagram from sensitivity analysis of DIC.
About the DIC sensitivity analysis made in the Section 2.5.4, it is shown that a facet size smaller than ideal does not encompass a sufficient number of contrast points, making the algorithm susceptible to the camera sensor’s intrinsic noise and lighting fluctuations [13]. Excessively large facets (50 px and 100 px) act as a low-pass filter (spatial smoothing). In regions of heterogeneous deformation or stress concentration (crack opening), large facets dilute the real gradient in the facet’s calculation domain [13]. With very large subsets subject to non-affine deformation gradients or local rotations during the test, the premise of planar deformation of the facet fails to converge (loss of correlation/decorrelation) [27]. Step size determines the density of the calculation grid but does not alter the individual correlation shape function (subset shape function). As long as the step size is sufficient to cover the inspection points, the temporal point response remains consistent, validating the mesh’s robustness [13].
In GOM Correlate, the software manual clarifies that the correlation criterion is based on the zero-normalized sum of squared differences (ZNSSD), which is mathematically equivalent to the normalized cross-correlation (NCC) criterion with linear illumination correction. Sub-pixel positions are determined through bicubic spline gray-value interpolation using a first-order affine subset shape function.
From the Figure 10, it can be observed that: with very small facet sizes, such as 15, there are fluctuations during the first 25 s, and the signal improves when the facet size is increased to 20. Curves with smaller facet sizes show greater displacement magnitudes at the end of the test, while those with larger facet sizes, 50 and 100, record smaller values. The curve with a facet size of 100 shows discontinuity and breaks between 95 and 105 s. When comparing curves with the same facet size but different point distances, it is noted that the curves coincide most of the time. Thus, a facet size of 20 and a point distance of 2 were chosen, which allowed for sufficient contrast related to facet size and did not show excessive smoothing of peaks, attenuating even the displacement obtained up to rupture.
3. Results
The data in this study were categorized by substrate type (mortar or acrylic), coating system type (without finishing paint or with finishing paint), batch type (Batch 1 or Batch 2), Batch 2 applicable only to mortar substrates, and displacement data acquisition method: via analog dial gauges or via the digital image correlation (DIC) technique. The statistical analysis include Bland–Altman analysis, reporting the mean difference (bias) and 95% limits of agreement, correlation and agreement between two different measurement approaches (dial gauges and DIC) used to characterize the same crack-bridging event.
3.1. Specimen Mass and Physical Characteristics
In this section, the physical characteristics of the test specimens will be presented to confirm their homogeneity prior to testing. The initial mass and the mass following the application of each coating system layer were recorded. Table 2 presents the mean values, standard deviations, coefficients of variation, and maximum and minimum masses for each dataset obtained during the mass measurements. The stages after which the masses were recorded were: complete substrate preparation (initial), sealer application (Stage 1), texture application (Stage 2—without paint), and paint application (Stage 3—with paint).
Table 2.
Specimen mass according to substrate and coating system application stage.
From the data in Table 2, it can be observed that although the mean mass was expected to increase at each stage of the application process, for the mortar specimens, the mean mass decreased from Stage 2 to Stage 3—that is, after the paint application. It can be verified that the coefficient of variation found in each stage ensures that the variability remains within the 5% limit indicated by [28].
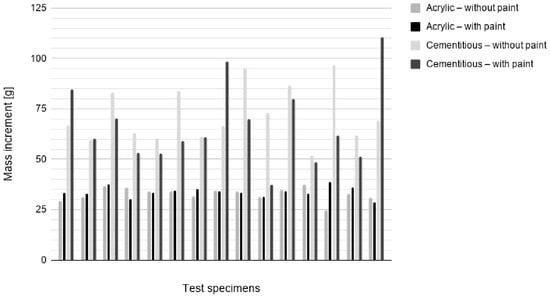
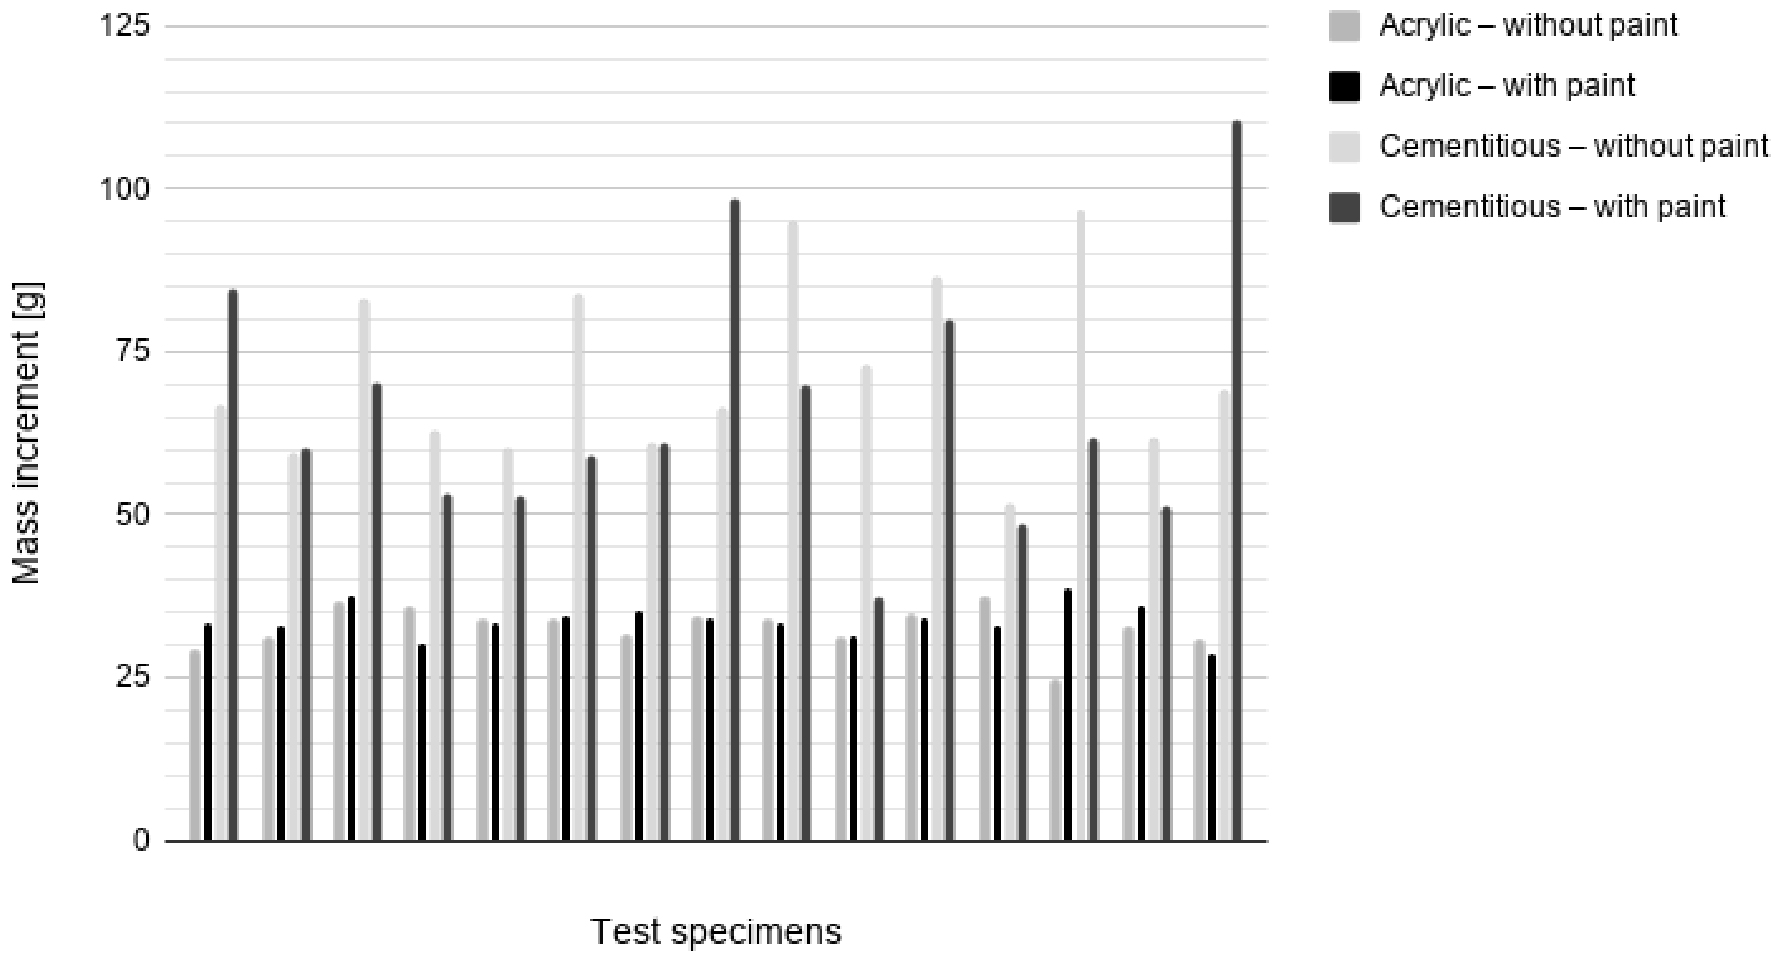
The mortar specimens have a mass ranging between 1200 and 1600 g, whereas the acrylic specimens have a mass between 40 and 90 g. Plotting a chart showing the total mass variations of both the acrylic and mortar specimen sets together is not the best approach, as the mass variation of the acrylic would be nearly imperceptible relative to the mass of the mortar specimens. Therefore, the data were organized in terms of mass increment, mass increase of the final specimen configuration relative to the mass of the substrate without any applied coating system. This increment was divided between mortar or acrylic specimens, with or without paint, the chart is presented in Figure 11.
Figure 11.
Coating System Mass Increment.
It can be observed that the significant mass gain of the test specimens occurs as a result of the textured coating. The acrylic specimens gained an average of 33.5 g, which corresponds to 76.46% of their initial mean mass. The mortar specimens experienced an average mass gain of 64.5 g, corresponding to 4.63% of their initial mean mass. The measured consumption rates for the complete coating system were calculated for the mortar and acrylic specimens as 3.94 kg/m2 and 2.41 kg/m2, respectively.
3.2. Crack Bridging—Dial Gauges
In this section, the results of the tests conducted using the Adapted UEAtc (1978) crack-bridging method are presented. Two different substrate types were used: mortar and acrylic. Both substrates were tested with two types of coating systems (one with finishing paint and one without finishing paint). Furthermore, the mortar substrates were prepared in two batches, whereas the acrylic substrates were prepared in a single batch. This section aims to present the crack-bridging capacity results obtained via analog instrumentation (dial gauges) for the set of 60 test specimens. This scenario is illustrated by the results organized in Table 3. Cells containing a hyphen represent non-existent data for that configuration—for instance, there is no data for Batch 2 of acrylic, as only one batch of acrylic substrates was produced.
Table 3.
Measurement results of crack opening in millimeters from the crack-bridging test using analog dial gauges.
The tests were conducted on sixty specimens, yielding three negative results. Table 4 was compiled to summarize the data, presenting the mean, minimum value, maximum value, and coefficient of variation for these values.
Table 4.
Summary of crack opening in millimeters measured using dial gauges for acrylic and mortar substrates.
Table 4 shows that the maximum value was 1.95 mm and the minimum was −0.59. The minimum and maximum values for the acrylic specimens were higher than those for the mortar specimens. Consequently, the highest value in Table 4 was found among the acrylic substrate data, whereas the lowest value was among the mortar data.
When analyzing the means in Table 4, it was observed that the acrylic substrate dataset presented mean crack openings of 0.97 mm (without paint) and 1.20 mm (with paint), while the means for the mortar substrate data did not exceed 0.42 mm. Furthermore, it can be stated that applying paint to the acrylic substrate specimens resulted in an increase in the width of the bridged cracks. This was also observed for the mortar specimens in Batches 1 and 2. The percentage increase in the mean for the acrylic substrates that showed improved results with paint was around 23.8%. For the mortar substrates, the mean increase was 13.14%.
Still referring to Table 4, high coefficients of variation were observed. These values were higher for the mortar specimens than for the acrylic ones. Negative crack opening displacements occurred exclusively in the mortar specimens. In order to verify the impact of these negative values the analysis without the negative results was made and is presented in Section “Crack Bridging—Dial Gauges—Without the Negative Values”.
Crack Bridging—Dial Gauges—Without the Negative Values
Negative crack openings are physically inconsistent with crack propagation; therefore, these readings were treated as spurious artifacts and omitted in Table 5.
Table 5.
Summary (without the negative values) of crack opening in millimeters measured using dial gauges for acrylic and mortar substrates.
The maximum crack openings remained identical between both datasets. As expected, the minimum value for mortar shifted the negative thresholds to positive baseline values ranging between 0.06 to 0.25 mm. Acrylic substrates remain exhibiting a larger mean crack opening compared to mortar substrates. Within the same substrate type, the application of finishing paint increased the mean crack capacity.
Removing the spurious negative readings reduced the standard deviation and coefficient of variation.
3.3. Analysis of Variance—ANOVA
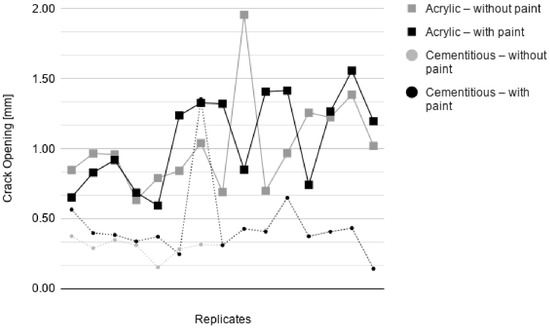
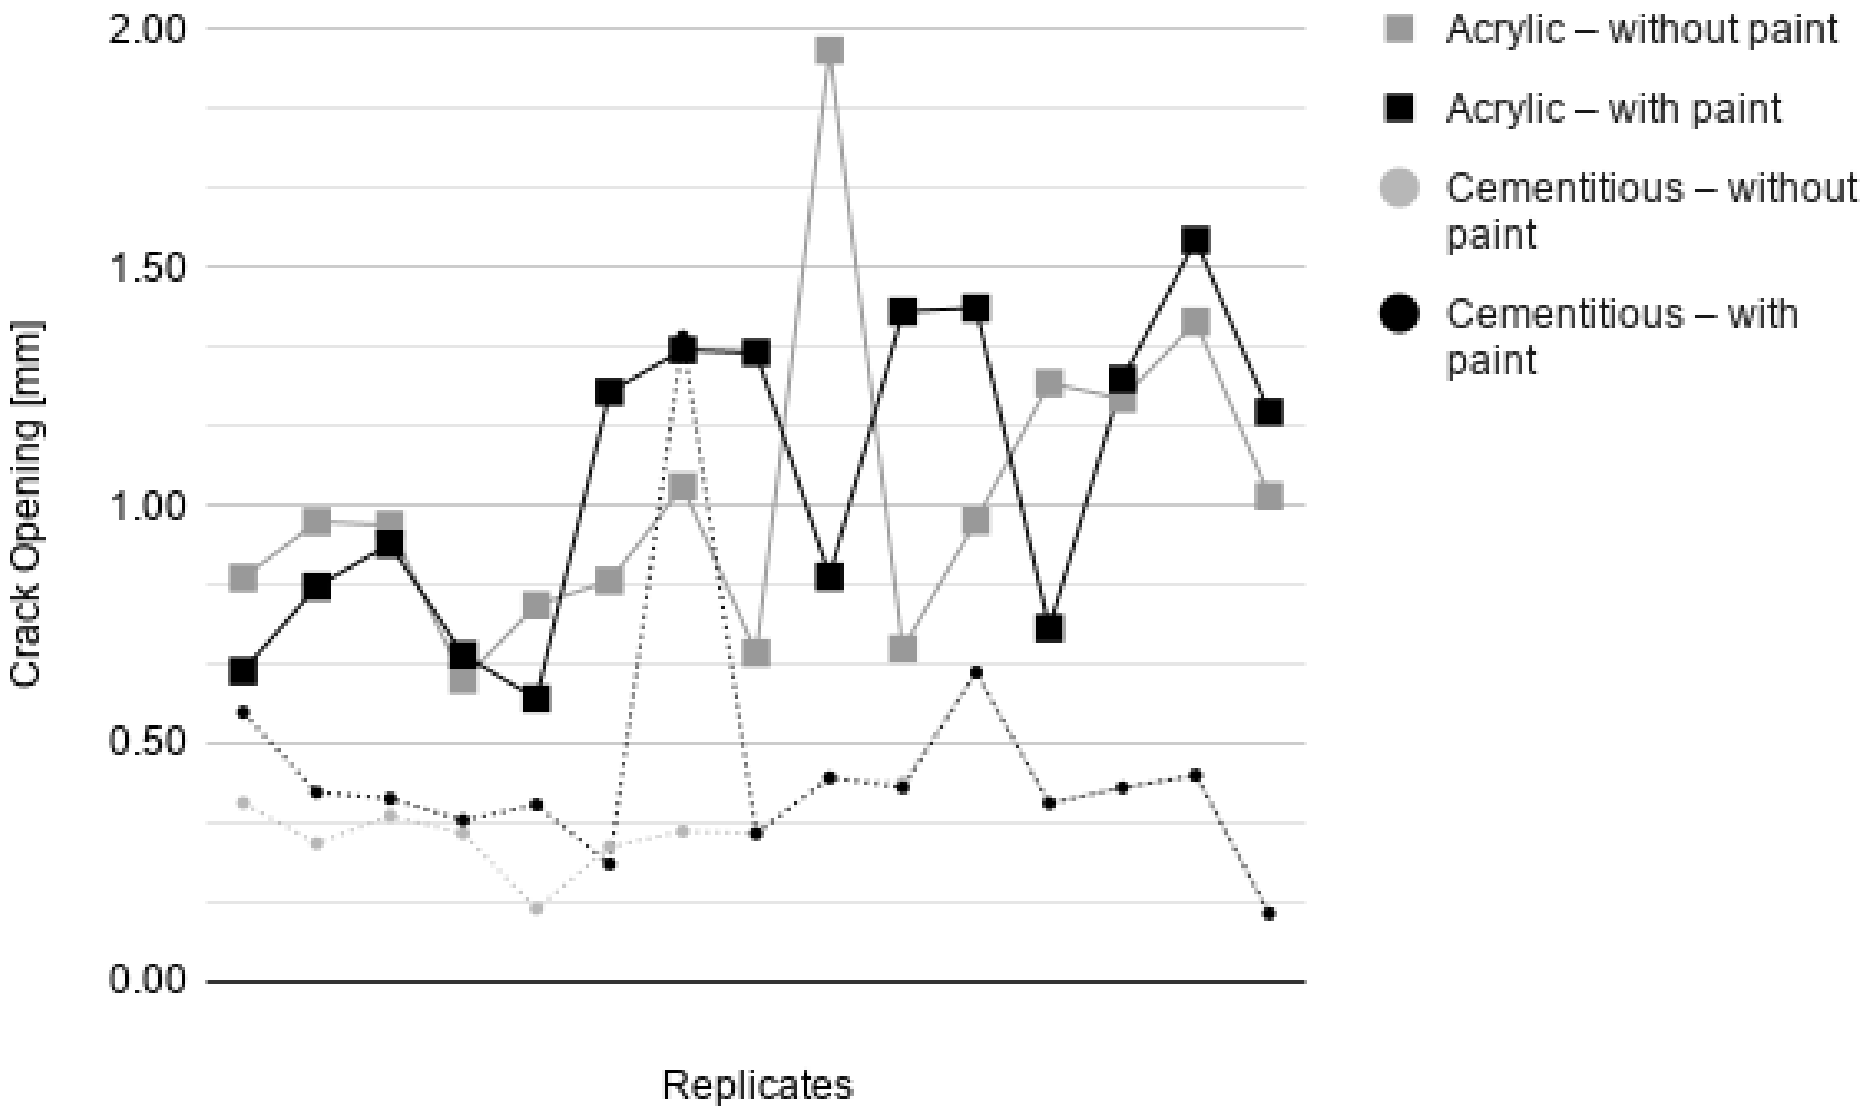
Based on the crack-bridging results by Dial Gauges with the negative values, an analysis of variance (ANOVA) was also performed. First, plot was created, as shown in Figure 12, to facilitate the visualization of the replicates for each defined configuration. These plots present the crack width on the y-axis and the number of occurrences or replicates on the x-axis. This graph illustrates the presence of noise in the tests, as in the absence of noise, all data points within the same group would be perfectly aligned.
Figure 12.
Line plots indicating the replicates for each controllable factor by Dial Gauge Data.
Considering that process parameters are all production line variables that can be altered and may have an effect on the response variables [29], the experimental parameters were categorized. The response variable for the analysis of variance (ANOVA) is the crack opening in millimeters, measured exclusively via dial gauges (). The measurement method was decoupled from the factorial design and evaluated separately using paired comparison analyses (Bland–Altman and ICC). Prior to the primary ANOVA, batch repeatability for the cementitious substrate was evaluated; as no statistically significant difference was observed between batches (), the batch factor was excluded from the main factorial model. Consequently, the primary controllable factors evaluated in the full factorial ANOVA are: substrate type, tested at two levels (cementitious mortar, Section 2.2.1, and white acrylic, Section 2.2.2), and coating system composition, analyzed at two levels (without finishing paint and with finishing paint), each condition comprising fifteen replicates (). Process parameters kept constant included the texture and paint formulations, the material application procedure, and the mechanical testing setup. The controllable factors and their respective levels are presented in Table 6.
Table 6.
Controllable factors and their respective levels.
According to Table 6, the analyzed system has two controllable factors (A and B), each tested at two levels. Therefore, the number of different combinations is equal to , resulting in 4 different configurations in the dataset. Each configuration has 15 replicates. Regarding the degrees of freedom (DoF), there is one for each replicate—that is, 15 DoF. For the error, it considers the four configurations multiplied by the DoF of the replicates minus one unit. The total degrees of freedom of the system is equal to the total number of observations (60) minus one unit. Following the statistical model by [29], an Excel (R) spreadsheet was developed with the formulations, and the calculations were performed. Based on these formulations, Table 7 was produced.
Table 7.
Two-way ANOVA results for crack width measurements ().
The first row of Table 7 displays the source of variation, sum of squares, degrees of freedom, mean squares, p-value, and F-test. The analyzed system consists of a dataset with a The two-way analysis of variance ( ANOVA, ).
The analysis revealed that substrate type had a statistically significant and dominant effect on crack width, accounting for approximately of the total sum of squares. In contrast, the coating system (with vs. without paint) did not exhibit a statistically significant main effect. Furthermore, the interaction between substrate type and paint application () was not statistically significant.
3.4. DIC Analysis
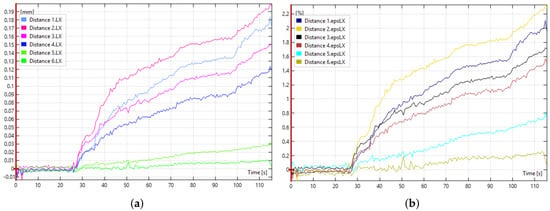
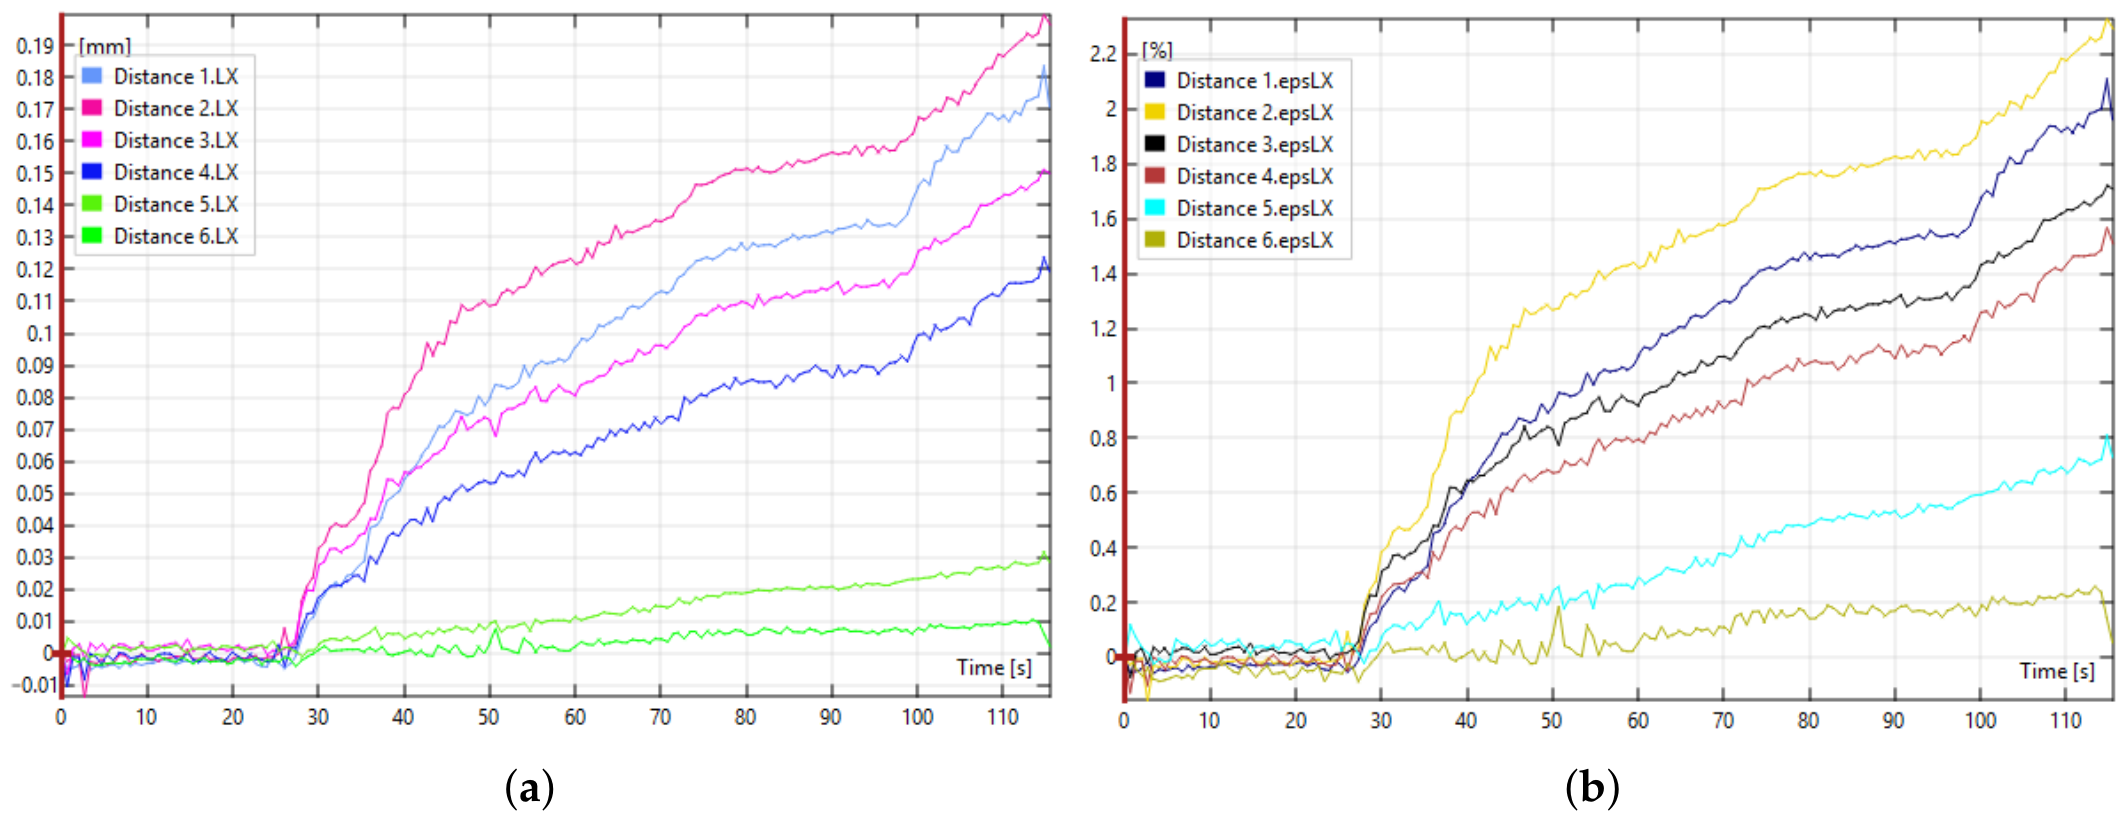
The mean value obtained from the six virtual extensometers was used to calculate the displacement values of each test specimen in relation to the initial stage. This average for each of the test specimens was used in statistical analyses. Each analysis resulted in two graphs: displacement vs. time and strain vs. time. These graphs for one of the test specimens are presented in Figure 13.
Figure 13.
Diagram GOM Correlate Analysis: (a) Displacement (mm) vs. time (s). (b) Length change or strain (%) vs. time (s).
The video of each test specimen was analyzed to determine the moment a crack appeared. After this analysis, the videos were processed using the GOM Correlate software. Finally, the data obtained from the software analysis were related with those obtained from the dial gauges.
Crack Bridging—DIC
Regarding the results obtained from processing the Digital Image Correlation (DIC) data analyzed using the GOM Correlate software, Table 8 was compiled.
Table 8.
Measurement results of crack opening [mm] using Digital Image Correlation (DIC).
From the DIC crack opening data, Table 9 was compiled, presenting means, standard deviations, maximum and minimum values, and coefficients of variation. It can be noted that an issue occurred during data acquisition for one of the mortar specimens.
Table 9.
Summary of crack opening displacement values measured using Digital Image Correlation (DIC) for acrylic and mortar substrates.
The presented DIC dataset shows that applying the finishing paint resulted in an increase in the mean values for both acrylic and mortar substrate specimens. The mean increase was 31.07% for the acrylic specimens and 46.24% for the mortar specimens.
It can also be observed that the mortar was the substrate with the highest coefficient of variation. An increase in the average width of the concealed crack was observed in all groups after the application of the paint. The minimum value recorded in the obtained data was 0.01 mm; however, it cannot be stated that this is a detected crack width value due to the absence of a noise study. The maximum opening observed was 0.7 mm.
3.5. Bland-Altman Analysis
According to the presentation by [30], it was possible to perform the analysis of the two methods used to measure the opening in painting systems. The approach presented by the authors offers an alternative method based on graphical techniques and simple calculations. The technique aims at comparing measurement methods, not in terms of calibration where the result of one method is compared to the true result, but in terms of verifying the degree of agreement between the methods.
The process of checking the correlation coefficient, which indicates the strength of the relationship between two variables, does not indicate if they agree with each other. In samples with many values, correlation is almost guaranteed. The significance test is irrelevant for agreement; the authors [30] emphasize that data that appears to have weak agreement can produce high correlation.
Comparison of means and correlation alone is insufficient to establish agreement between two measurement techniques. Because measurements from both techniques were obtained from the same specimens, a Bland–Altman analysis is appropriate for quantifying systematic bias and limits of agreement.
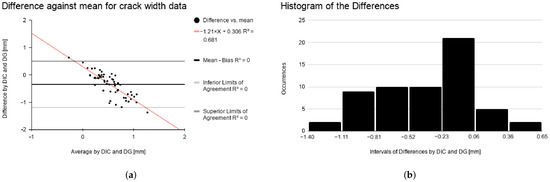
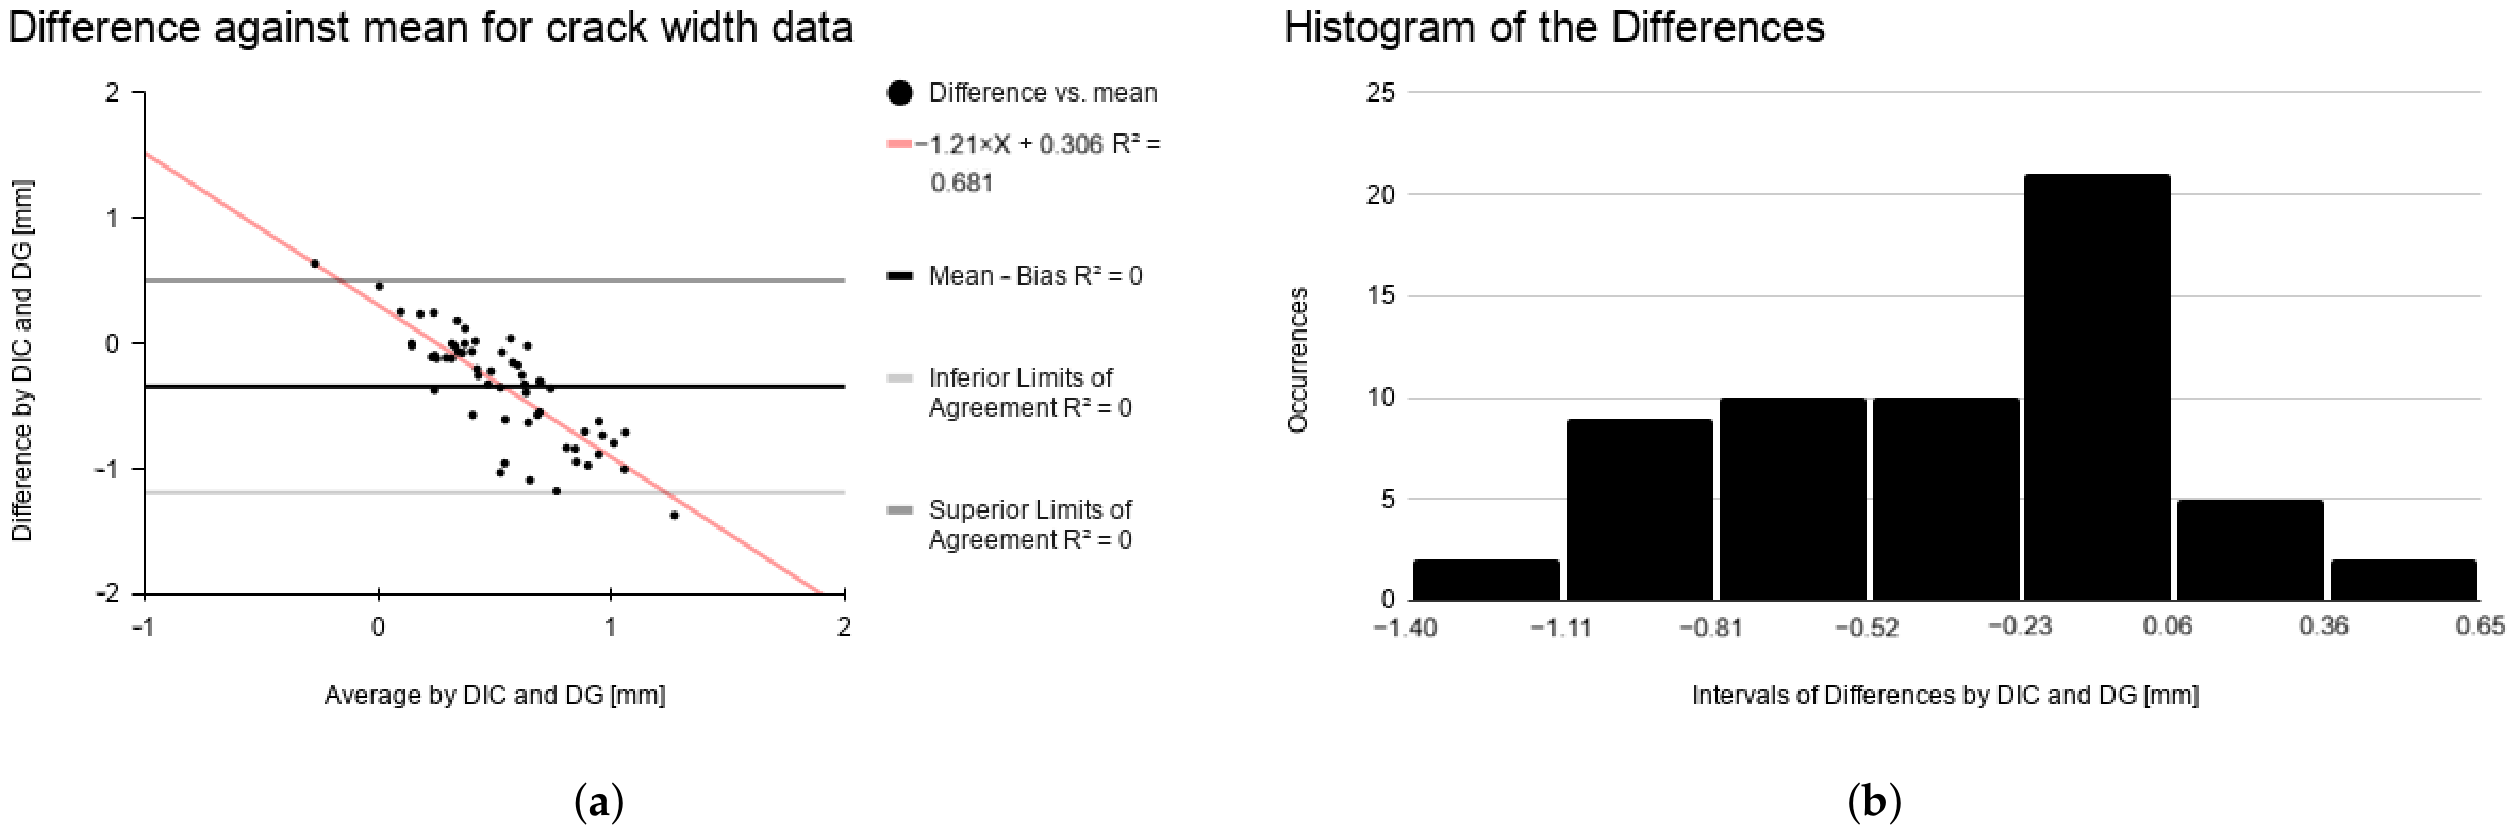
The issue, according to the authors [30], is how much the measurements can differ without causing significant difficulties. The Bland-Altman analysis begins by plotting the differences of the measurements against the averages of the measurements on a graph presented in Figure 14. The difference between the correlation graph and the Bland-Altman graph can be seen in the images. The graph of differences against averages provides more information about method comparison. The discrepancy between the methods reaches 0.85 mm. The mean difference between the methods (bias) is −0.34 mm and the standard deviation of the differences is 0.43 mm. The bias is negative so the DIC measureaments are underestimating the crack width. According to the authors [30], it can be expected that the differences lie between − 1.96 s and + 1.96 s. The histogram of the differences was drawn in order to check the distribution and is presented in Figure 14.
Figure 14.
Bland-Altman Analysis (a) With negative results. (b) Without negative results.
The Bland–Altman analysis results of the paired dataset () presented that the Dial Gauges may be 1.19 mm below or 0.5 above the Digital Correlation measurements, considering the differences mean of −0.34 mm (bias) and the 95% limits of agreement. The linear regression of the differences against the means () revealed a significant proportional bias, indicating close agreement at narrow crack widths (<0.30 mm) and a progressive divergence for larger openings.
A sensitivity analysis excluding the three physically inconsistent negative readings from dial gauges confirmed that mechanical seating artifacts widened the initial limits of agreement.
Following the sensitivity analysis, the Bland–Altman plot was reconstructed after excluding the three physically inconsistent negative dial gauge readings, yielding a refined paired dataset of specimens. All data points now lie entirely within the physically valid domain ( 0.15 mm). The overall mean difference (bias) was approximately , with limits of agreement ranging from (lower limit) to (upper limit). Removing these mechanical artifacts eliminated extreme outliers and yielded a more reliable representation of instrument agreement: the two techniques show close alignment at smaller crack openings (≤0.40 mm), whereas for larger crack widths (>0.70 mm), dial gauges consistently recorded higher displacements than DIC, reflecting cumulative mechanical gauge seating and localized deformation captured by mechanical contacts. Linear regression of the differences against the means for the filtered dataset () yielded (), confirming the persistence of a statistically significant proportional bias even after the removal of negative readings.
3.6. Intraclass Correlation Coefficient (ICC)
To rigorously evaluate the interchangeability between Digital Image Correlation (DIC) and dial gauges (DG) beyond simple linear association, the two-way intraclass correlation coefficient for absolute agreement— as formulated by [31] was evaluated alongside the Bland–Altman limits of agreement [30]. While Bland–Altman analysis quantifies systematic bias and identifies proportional divergence across increasing crack widths, the incorporates both between-instrument variance and residual measurement error into a standardized reliability index.
The two-way intraclass correlation coefficient for absolute agreement, , was calculated following the formulation by [31] based on a two-way mixed-effects ANOVA ( specimens, measurement techniques):
where BMS is the between-subjects mean square (), JMS is the between-methods mean square (), and EMS is the residual error mean square (). Substituting these variance components yields , confirming that systematic instrumental differences () penalize single-measure absolute agreement across the full deformation range, in direct alignment with the Bland–Altman findings. The complete two-way ANOVA partition used for the ICC determination is presented in Table 10.
Table 10.
Two-way ANOVA table for ICC(2,1) estimation (, ).
The two-way ANOVA conducted to compute the intraclass correlation coefficient yielded consistent variance components (, , and ), confirming a statistically significant difference between measurement techniques (, ). This significant between-methods effect directly substantiates the systematic measurement bias previously identified in the Bland–Altman analysis (mean bias of ). Consequently, the resulting single-score absolute agreement coefficient, , is heavily penalized by this constant and proportional offset, quantitatively corroborating the Bland–Altman findings where mechanical contact seating and gauge displacement systematically inflate dial gauge readings relative to DIC at larger crack widths.
3.7. Shapiro–Wilk Results for Your Datasets
The assumption of normality for the paired differences was evaluated using the Shapiro–Wilk test. For the complete dataset (), the differences between DIC and dial gauge measurements conformed to a normal distribution (), validating the standard parametric limits of agreement () formulated by Bland-Altman Method.
4. Discussion
The pronounced difference in crack-bridging thresholds between the acrylic (0.97–1.20 mm) and cementitious (0.30–0.42 mm) substrates is intrinsically linked to the fracture kinematics of each base material. The acrylic substrate operates through a rigid-body sliding separation along a pre-machined notch with low interfacial friction, distributing tensile stresses more uniformly across the elastomeric coating. In contrast, the cementitious mortar is a quasi-brittle composite that exhibits localized stress concentration at the notch tip during wedge penetration. A hypothesis for the differences between the mortar and acrylic substrates, as well as the negative crack-bridging results observed in the mortar specimens, is surface irregularity, which may have compromised the positioning of the dial gauge contact tips. Also, this difference can be attributed to the issue of compensation/movement/adjustment of the dial gauges.
Regarding the dataset, in order to restore physical coherence, statistical analysis was conducted with and without negative values from the mortar substrate. The analysis in Section “Crack Bridging—Dial Gauges—Without the Negative Values” showed that excluding the negative readings substantially restores the physical coherence of the mortar dataset, reducing artificial variability without altering the underlying trend that finishing coats enhance crack-bridging performance across both substrate systems. The application of paint acts as a complementary functional layer for both mortar and acrylic, noticeably increasing their crack-bridging limit in the first statistical analysis; however, this was not confirmed when the ANOVA was performed.
The complete ANOVA results, summarized in Table 7, demonstrate that the mechanical substrate composition is the governing factor controlling crack opening displacement, whereas the application of paint does not significantly influence crack width or modify the deformation behavior across either substrate. Consequently, the performance of the coating system remained homogeneous regardless of finish painting, indicating that surface finishing does not induce structural bridging effects capable of altering overall crack kinematics.
Although descriptive statistics indicated a clear increase in mean bridged crack width following paint application (a increase for acrylic and to for mortar), the two-way ANOVA revealed that the main effect of paint was not statistically significant at the 5% level (). This discrepancy arises from the high intrinsic scatter and coefficient of variation observed in the cementitious specimens ( up to ), which elevated the residual error variance within the factorial design.
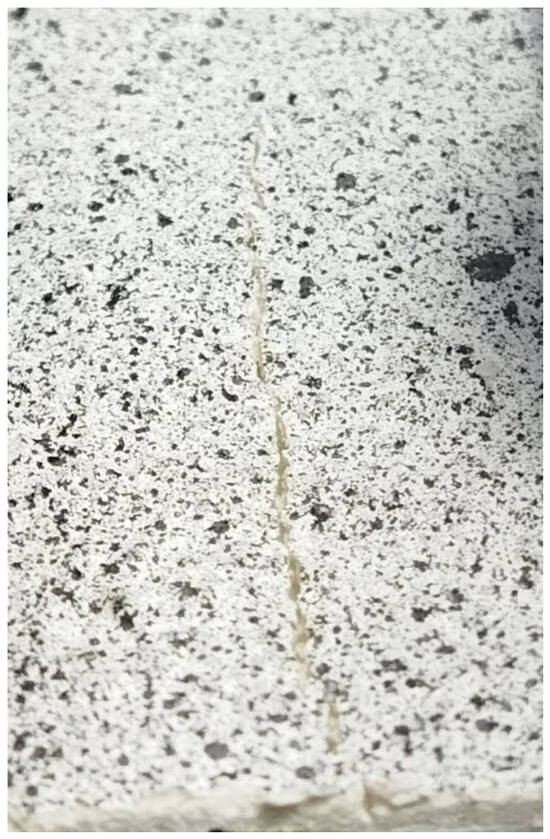
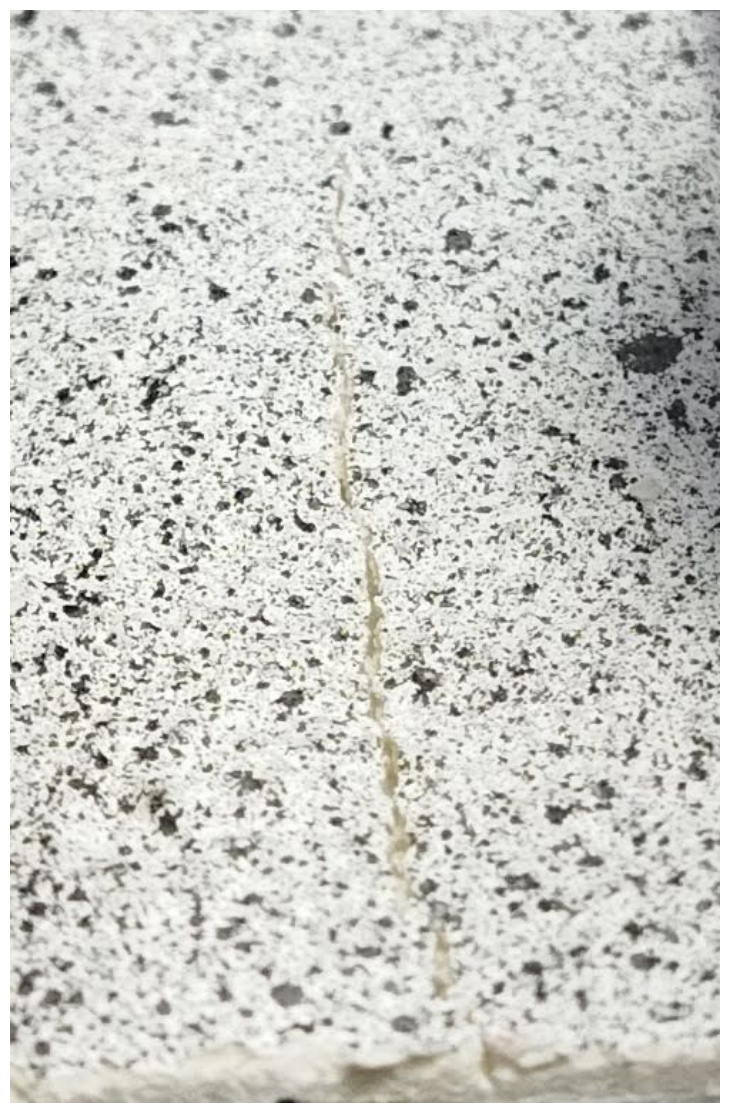
From a polymer mechanics perspective, the elastomeric topcoat provides an additional compliant layer that facilitates localized crazing and fibril bridging (as illustrated in Figure 2, delaying macro-crack propagation through the outer film as can be seen in the Figure 15.
Figure 15.
Crack transmited to the painting system.
However, the dominant mechanical stiffness and notch severity of the substrate (, accounting for approximately of the total sum of squares) govern the global crack kinematic envelope, partially masking the secondary elastomeric contribution under rigorous variance partitioning.
It is important to emphasize that the DIC analysis displays the deformation at the exact moment the failure becomes visible to the operator on the surface. Results obtained via the DIC technique demonstrate the positive influence of paint on the performance of coating systems. In the initial statistical analysis, the paint layer functioned as an elastic bridge across the separated crack faces, bridging the substrate opening and delaying crack propagation to the surface. ANOVA analysis was not performed for this group of values.
In terms of the relation between the dial gauges and DIC measurements, it was observed that dial gauges provide relative substrate displacement at two discrete locations, whereas DIC provides a displacement field on the observed coating surface. Consequently, the two techniques do not measure exactly the same physical quantity at exactly the same spatial locations. Thus, a Bland-Altman analysis was performed in Section 3.5 with the aim to evaluate the relationship and agreement between two different measurement approaches used to characterize the same crack-bridging event.
Following the framework established by [30] to assess measurement agreement beyond simple linear correlation, the initial analysis of the full paired dataset () showed a mean bias of with limits of agreement ranging from to (). A sensitivity analysis excluding three negative readings caused by mechanical contact seating yielded a refined dataset () with a mean bias of and tightened limits of agreement from to . The corresponding linear regression () confirmed a persistent, statistically significant proportional bias across both datasets, demonstrating that while Digital Image Correlation (DIC) and dial gauges exhibit close agreement for narrow crack widths (≤0.40 mm), mechanical contact effects lead to progressive divergence at larger crack openings (>0.70 mm).
The expectation that dial gauges will capture the crack width at the exact moment of crack initiation is often not met. A dial gauge displays the relative displacement of the point where it is positioned. The propagation of the crack to the surface occurs gradually from the substrate as a result of stress concentrations. Furthermore, determining the end of the test still depends on visual verification of film tearing by the operator. Therefore, dial gauges record displacement at the support points, whereas DIC records local displacement on the analyzed surface. Consequently, differences between the values may stem from distinct measurement positions and dynamics rather than method error.
One of the advantages highlighted by [9] is the capability of digital image correlation to measure deformations in multiple directions simultaneously. In this work, only one dimension was evaluated. However, future work should consider evaluating other dimensions, such as the deformation of the substrate membrane.
The experimental material consumption rates exceeded the manufacturer’s nominal catalog specifications () by a factor of 3.9 for mortar () and 2.4 for acrylic (). This discrepancy is primarily attributed to substrate absorption dynamics, surface roughness, and the manual troweling procedure employed to maintain a uniform 2 mm nominal thickness. In the porous mortar substrate (water absorption of ), initial capillary suction rapidly extracts water from the acrylic paste during application, altering the effective rheology and increasing the required material mass to ensure continuous leveling. For practical facade applications, these findings demonstrate that nominal coverage metrics established on impermeable, non-absorbent surfaces underestimate the on-site product consumption required to achieve equivalent crack-bridging film thicknesses on porous renderings.
5. Conclusions
This study evaluated the crack-bridging performance of textured coating systems applied to cementitious mortar and acrylic substrates using the adapted UEAtc (1978) method, comparing analog dial gauges against 2D Digital Image Correlation (DIC). The primary findings and scientific conclusions are exposed in the next paragraphs.
Measurement Agreement and proportional divergence were observed. Bland–Altman analysis confirmed that 2D-DIC provides a reliable, non-contact measurement method for narrow crack openings (<0.40 mm), where optical surface tracking closely aligns with dial gauge readings. However, a statistically significant proportional bias () emerges at larger crack widths (>0.70 mm), where mechanical gauge contact seating and fixture deformation lead to higher recorded displacements, resulting in a low absolute agreement intraclass correlation coefficient ().
The spatial disparity and contact artifacts by dial gauges measure discrete boundary displacements at the substrate fixture, whereas DIC captures continuous strain fields directly on the coating surface. Spurious negative values (down to ) recorded exclusively by dial gauges on mortar specimens are identified as mechanical contact and surface seating artifacts, absent in optical surface tracking.
A substrate kinematic influence was observed as well. The substrate composition and geometry mechanically govern the failure limit (), with compliant acrylic substrates achieving higher bridging values () than brittle mortar prisms (), where localized notch-tip stresses accelerate coating tearing.
Applying an elastomeric finishing paint systematically increased the nominal crack-bridging limit across all groups (improving mean values by to ), serving as an elastic bridging membrane across substrate discontinuities, but this was not observed in ANOVA analysis.
Substrate suction and surface texture generated experimental consumption rates ( for mortar and for acrylic) significantly higher than catalog specifications (), emphasizing the role of mortar porosity in practical on-site application.
Author Contributions
Conceptualization, C.D.A.D. and L.S.L.; methodology, C.D.A.D., A.C.d.S., O.H.B. and L.S.L.; validation, C.D.A.D., A.C.d.S., O.H.B., C.P.B. and L.S.L.; formal analysis, C.D.A.D., A.C.d.S., O.H.B., C.P.B. and L.S.L.; investigation, C.D.A.D., A.C.d.S., O.H.B. and L.S.L.; resources, C.P.B. and L.S.L.; data curation, C.D.A.D.; writing—original draft preparation, C.D.A.D.; writing—review and editing, C.D.A.D., A.C.d.S., O.H.B., C.P.B. and L.S.L.; visualization, C.D.A.D.; supervision, C.P.B. and L.S.L.; project administration, L.S.L.; funding acquisition, C.P.B. and L.S.L. All authors have read and agreed to the published version of the manuscript.
Funding
This study was financed in part by the Coordenação de Aperfeiçoamento de Pessoal de Nível Superior do Brasil (CAPES), Finance Code 001, by the Programa de Pós-Graduação em Engenharia de Minas, Metalúrgica e de Materiais (PPGE3M/UFRGS) at the Universidade Federal do Rio Grande do Sul (UFRGS) through the CAPES/PROEX Program. This work was also funded by: Laboratório de Ensaio e de Modelos Estruturais (LEME), the Instituto de Desempenho de Edificações da UFRGS (idUFRGS) and the Instituto de Pesquisas Tecnológicas de São Paulo (IPT).
Data Availability Statement
The data presented in this study are available on request from the corresponding author.
Conflicts of Interest
The authors declare no conflicts of interest. The funders had no role in the design of the study; in the collection, analyses, or interpretation of data; in the writing of the manuscript; or in the decision to publish the results.
References
- Chu, T.C.; Ranson, W.F.; Sutton, M.A.; Peters, W.H. Applications of Digital-Image-Correlation Techniques to Experimental Mechanics. Exp. Mech. 1985, 25, 232–244. [Google Scholar] [CrossRef] [Scilit]
- Thomaz, E. Trincas em Edifícios: Causas, Prevenção e Recuperação. Master’s Thesis, Escola Politécnica da USP, São Paulo, Brazil, 1986. [Google Scholar]
- Marcolino, L.D.; Reis, L.P.; Porto, T.M.R.; Monteiro, H.B.S. Fissuras, trincas e rachaduras em edificações residenciais unifamiliar: Estudo de caso em Triunfo-PB. In Proceedings of the I Congresso Internacional de Meio Ambiente e Sociedade (CONIMAS), Triunfo, PB, Brazil, 20–22 November 2019. [Google Scholar]
- Instituto Brasileiro de Avaliações e Perícias de Engenharia de Minas Gerais. IBAPE-MG 003: Norma de Vistoria Cautelar; IBAPE: Belo Horizonte, Brazil, 2014. [Google Scholar]
- Associação Brasileira de Normas Técnicas. NBR 12554: Tintas para Edificações Não Industriais—Terminologia; ABNT: Rio de Janeiro, Brazil, 2022. [Google Scholar]
- Marques, L.F.; Pedrosa, M.S.; Dutra, J.F.; Dimas, M.S. Tratamento de fissuras ativas e passivas em edificações. Pensar Acad. 2024, 22, 173–191. [Google Scholar] [CrossRef] [Scilit]
- ASHRAE. 2009 ASHRAE Handbook—Fundamentals; American Society of Heating, Refrigerating and Air-Conditioning Engineers: Atlanta, GA, USA, 2009. [Google Scholar]
- Uemoto, K.L. Influência da Formulação das Tintas de Base Acrílica Como Barreira Contra a Penetração de Agentes Agressivos Nos Concretos. Ph.D. Thesis, Escola Politécnica da Universidade de São Paulo—USP, São Paulo, Brazil, 1998. [Google Scholar]
- dos Santos, J.A.B.; Monte, R. Evaluation of the crack bridging ability of waterproofing membranes using indirect tensile test and digital image correlation. J. Build. Eng. 2022, 45, 103667. [Google Scholar] [CrossRef] [Scilit]
- Delucchi, M.; Barbucci, A.; Cerisola, G. Crack-bridging ability of organic coatings for concrete: Influence of the method of concrete cracking, thickness and nature of the coating. Prog. Org. Coat. 2004, 49, 336–341. [Google Scholar] [CrossRef] [Scilit]
- Directivas Comuns UEAtc (Union Européenne pour l’Agrément Technique dans la Construction) para a Homologação de Revestimentos Delgados de Massas Plásticas para Paredes; Laboratório Nacional de Engenharia Civil: Lisboa, Portugal, 1978.
- Augusto, L. Análise Crítica dos Métodos e Critérios de Avaliação das Texturas Acrílicas com Vistas a Uma Proposta de Diretriz SINAT. Master’s Thesis, Instituto de Pesquisas Tecnológicas do Estado de São Paulo—IPT, São Paulo, Brazil, 2013. [Google Scholar]
- International Digital Image Correlation Society. A Good Practices Guide for Digital Image Correlation, 2nd ed.; Jones, E.M.C., Iadicola, M.A., Eds.; International Digital Image Correlation Society: New York, NY, USA, 2025. [Google Scholar]
- Özkılıç, Y.O.; Başaran, B.; Aksoylu, C.; Karalar, M.; Zeybek, Ö.; Althaqafi, E.; Beskopylny, A.N.; Stel’makh, S.A.; Shcherban, E.M.; Umiye, O.A. Bending performance of reinforced concrete beams with partial waste glass aggregate replacement assessed by experimental, theoretical and digital image correlation analyses. Sci. Rep. 2025, 15, 36737. [Google Scholar] [CrossRef] [Scilit]
- Aksoylu, C.; Başaran, B.; Karalar, M.; Zeybek, Ö.; Althaqafi, E.; Beskopylny, A.N.; Stel’makh, S.A.; Shcherban, E.M.; Umiye, O.A.; Özkılıç, Y.O. Experimental, theoretical and digital image correlation methods to assess bending performance of RC beams with recycled glass powder replacing cement. Sci. Rep. 2025, 15, 25163. [Google Scholar] [CrossRef] [Scilit]
- De Maio, U.; Garro, A.; Greco, F.; Pranno, A.; Silvestri, A. Vibration-based damage identification in concrete beams via a decomposed deep learning approach. Prog. Eng. Sci. 2026, 3, 100280. [Google Scholar] [CrossRef] [Scilit]
- Garcia Sobrinho, R.A.; Piauhy Neto, F.; Fernandes, H. Public Database of Cracks Images in Mortar Coating with Different Types of Surface Finishes. Buildings 2023, 13, 1872. [Google Scholar] [CrossRef] [Scilit]
- Hearle, J.W.S. Polymers and Their Properties; Fundamentals of Structure and Mechanics; Ellis Horwood, Ltd.: Chichester, UK, 1982; Volume 1. [Google Scholar]
- Associação Brasileira de Normas Técnicas. NBR 7214: Areia Normal para Ensaio de Cimento—Especificação; ABNT: Rio de Janeiro, Brazil, 2015. [Google Scholar]
- Associação Brasileira de Normas Técnicas (ABNT). ABNT NBR 9778: Argamassa e Concreto Endurecidos–Determinação da Absorção de Água, Índice de Vazios e Massa Específica, 2nd ed.; ABNT: Rio de Janeiro, Brazil, 2005. [Google Scholar]
- Associação Brasileira de Normas Técnicas. NBR 16541: Argamassa para Assentamento e Revestimento de Paredes e Tetos—Preparo da Mistura para a Realização de Ensaios; ABNT: Rio de Janeiro, Brazil, 2016. [Google Scholar]
- Associação Brasileira de Normas Técnicas. NBR 13276: Argamassa para Assentamento e Revestimento de Paredes e Tetos—Determinação do Índice de Consistência; ABNT: Rio de Janeiro, Brazil, 2016. [Google Scholar]
- Associação Brasileira de Normas Técnicas (ABNT). ABNT NBR 13279: Argamassa para Assentamento e Revestimento de Paredes e Tetos—Determinação da Resistência à Tração na Flexão e à Compressão, 2nd ed.; ABNT: Rio de Janeiro, Brazil, 2005. [Google Scholar]
- Associação Brasileira de Normas Técnicas (ABNT). ABNT NBR 11702: Tintas para Construção Civil—Tintas, Vernizes, Texturas e Complementos para Edificações Não Industriais—Classificação e Requisitos, 4th ed.; ABNT: Rio de Janeiro, Brazil, 2021; pp. 1–15. [Google Scholar]
- Ottoni, T.P. Correlação Digital de Imagens: Perspectivas para a Análise da Deformabilidade de Peças Estruturais de Concreto. Ph.D. Thesis, Universidade Federal do Rio Grande do Sul, Porto Alegre, Brazil, 2024. [Google Scholar]
- Sutton, M.A.; Wolters, W.J.; Peters, W.H.; Ranson, W.F.; McNeill, S.R. Determination of displacements using an improved digital correlation method. Image Vis. Comput. 1983, 1, 133–139. [Google Scholar] [CrossRef] [Scilit]
- Schreier, H.W.; Sutton, M.A. Systematic errors in digital image correlation due to undermatched subset shape functions. Exp. Mech. 2002, 42, 303–310. [Google Scholar] [CrossRef]
- Gomes, F.P. Curso de Estatística Experimental, 13th ed.; Livraria Nobel S.A.: Piracicaba, Brazil, 1990. [Google Scholar]
- Ribeiro, J.L.D.; Ten Caten, C.S. Projeto de Experimentos; Série Monográfica Qualidade; Editora FEENG: Porto Alegre, Brazil, 2011; p. 153. [Google Scholar]
- Bland, J.M.; Altman, D.G. Statistical methods for assessing agreement between two methods of clinical measurement. Lancet 1986, 327, 307–310. [Google Scholar] [CrossRef] [Scilit]
- Shrout, P.E.; Fleiss, J.L. Intraclass correlations: Uses in assessing rater reliability. Psychol. Bull. 1979, 86, 420–428. [Google Scholar] [CrossRef] [Scilit]

Disclaimer/Publisher’s Note: The statements, opinions and data contained in all publications are solely those of the individual author(s) and contributor(s) and not of MDPI and/or the editor(s). MDPI and/or the editor(s) disclaim responsibility for any injury to people or property resulting from any ideas, methods, instructions or products referred to in the content. |
© 2026 by the authors. Licensee MDPI, Basel, Switzerland. This article is an open access article distributed under the terms and conditions of the Creative Commons Attribution (CC BY) license.