Optimal Control Method for HVAC Systems in Offices with a Control Algorithm Based on Thermal Environment

1
School of Architectural Civil, Environmental and Energy Engineering, Kyungpook National University, Daegu 41566, Korea
2
Department of Architectural, Kyungpook National University, Daegu 41566, Korea
3
School of Architecture, Kyungpook National University, Daegu 41566, Korea
*
Author to whom correspondence should be addressed.
Buildings 2020, 10(5), 95; https://doi.org/10.3390/buildings10050095
Submission received: 13 April 2020
/
Revised: 14 May 2020
/
Accepted: 19 May 2020
/
Published: 21 May 2020
(This article belongs to the Section Building Energy, Physics, Environment, and Systems)
Abstract
:This study examined a method to reduce energy consumption in office buildings. Correspondingly, an optimal control method was proposed for heating, ventilation, and air conditioning (HVAC) systems via two control algorithms that considered the indoor thermal environment. The control algorithms were developed by considering temperature and humidity as the factors of the indoor thermal environment that influence the control of HVAC systems and the predicted mean vote comfort ranges. Furthermore, an experiment was performed using office equipment that incorporated the two control algorithms for HVAC systems, and the correlation between changes in the thermal environment within the office and the occupant’s comfort levels was estimated via an actual survey. The results demonstrated that the proposed control method for HVAC systems, which considered the comfort ranges of temperature and humidity and the thermal adaptation capability, can efficiently maintain the occupant’s comfort with lower energy usage compared with conventional HVAC systems. Thus, the use of the control method contributes to the reduction of total energy consumption in buildings with HVAC systems.
1. Introduction
Total greenhouse gas emissions of buildings are responsible for 40–50% of the total global carbon dioxide emissions [1,2,3]. This has now become a global problem.
Due to the industrialization of nations, people are now spending more time indoors. Hence, compared with previous years, energy consumption is considerably increasing.
The demand for electricity for indoor heating and cooling in office rooms continues to increase [4,5] and is responsible for 42% of the total energy consumption for commercial uses in office buildings, particularly for building cooling and heating purposes [6,7].
To address the problem of excessive energy consumption, different governments including that of South Korea have announced measures to regulate the usage of cooling and heating devices in offices to conserve energy. However, these regulations may reduce the occupants’ comfort and the productivity of workers [8]. A study on the correlation between the thermal environment of offices and the working efficiency of occupants [9,10,11,12] demonstrated that the thermal environment (44.1%) has considerable influence on work efficiency.
Therefore, regulating the HVAC system’s usage enables prompt energy-saving, but also results in an uncomfortable environment that neglects the occupants’ comfort [13]. Hence, studies on energy usage within an office and the occupants’ comfort should be both reviewed and studied. This study proposes an optimal control method for heating, ventilation, and air conditioning (HVAC) systems to efficiently reduce the energy consumption in offices and enhance the occupants’ comfort.
In this study, a, control experiment was performed in an office with a control algorithm that regulated the temperature comfort range and predicted the mean vote (PMV) factor. Moreover, based on the occupants’ comfort, we analyzed the operating pattern and the thermal environment factor changes derived from the system [14,15].
To satisfy the legal requirements for the ventilation rate, the method used was based on the energy recovery ventilator (ERV) system. Furthermore, to analyze the pattern of usage of the heating equipment and the occupants’ comfort, the ventilation system and the heating equipment were controlled based on the control standards of the indoor thermal environment. For this purpose, the ninth floor office of a 17-floor office building was used as an experimental space in South Korea.
The experimental space enabled the specific control of the HVAC system. One-day experiments were conducted for both the experimental and control groups (temperature and PMV). The data were collected using laboratory equipment from 9 December 2019 to 11 December 2019 (inclusive). Furthermore, a total of 8 h [16] was required per day as the experimental hours from 09:00 to 12:00 and from 13:00 to 18:00 were based on office working hours. Data were gathered six times per hour with the designated time based on an actual survey and a questionnaire.
This study introduces the process of deriving the optimal control method for the existing HVAC system. While there is a lack of supply and demand for the experimental spaces subject to the experiment, the quantity of experimental equipment, and the limitations pertaining to a single case in an experiment that considers the external weather, this study may provide critical data for future related research.
2. Materials and Method
2.1. Comfort Range of Indoor Thermal Environment Evaluation Index
2.1.1. Temperature and Humidity
The indoor thermal environment within the existing multifamily housing controlled the heating equipment based on the temperature and humidity indices. In South Korea, the optimal temperature for winter is stipulated to be in the range of 18–21 °C and the optimal humidity is in the range of 40–60%. If the room temperature is not appropriate for the occupants, they would be exposed to various diseases. However, if the room is humid, various microorganisms are likely to grow and multiply [17]. Therefore, it is necessary to ensure that the indoor environment is maintained at an appropriate temperature and humidity.
2.1.2. Predicted Mean Vote
Predicted mean vote (PMV) quantifies the human response to an indoor thermal environment. As one of the representative thermal comfort indices, the PMV calculation formula proposed by Fanger, P. O. (1982) [18] is identical to Equation (1):
PMV = [0.028 + 0.303·exp(−0.036·M/ADu)]·(H/ADu − Ed − Esw − Ere − L − R − C)
Equation (1) is a theoretically expressed index of the perceived thermal comfort of the occupants based on the comprehensive consideration of the human body’s metabolic rate, quantity of clothing and temperature, average radiation temperature, air flow, and humidity. PMV demonstrated that within the range of −3 to +3, the comfort range is −0.5 to +0.5 [19].
2.2. Indoor Thermal Environment Control Algorithm Following the Control Standards by an Evaluation Indicator
As summarized in Table 1, experiments were conducted by setting criteria for each control setting. When the temperature, humidity, and PMV indices were controlled, the ventilation system was used to satisfy the ventilation rate at 0.5 times per hour [18]. Furthermore, the experimental environment was controlled by the ventilation system (ERV system) and heating equipment only.
The experiment was conducted in the same experimental space for three days. On the first day, the control group measured the atmosphere within the office without any external control.
On the second day, the experimental group (A) set the reference temperature and humidity control to 19 °C and 40%, respectively [6]. When group (A) was controlled, the humidity control was achieved by operating the ERV system, while the temperature was controlled with the use of the heating equipment. Figure 1a shows the control algorithm for the experimental group (A).
There are multiple criteria used to control the PMV index (B). Comfort is achieved when the composite value that reflects six factors (temperature, humidity, air velocity, average radiation temperature, quantity of clothing, and performance activity) is higher than −0.5 and lower than +0.5 [19]. Figure 1b shows the control algorithm for experimental group (B). The PMV index control was evaluated with a PMV-measuring apparatus (Amenity Meter Model AM-101) that simultaneously calculated the results associated with the six factors.
The PMV is automatically calculated based on the real-time measurements of the temperature, air velocity, humidity, and average radiation temperature as well as the settings for the performance activity and quantity of clothing. We used a measuring device that displayed the calculated PMV value in real time.
The data obtained were acquired eight times per day during the experiment, and six times per hour (i.e., every 10 min). Hence, 48 datasets were obtained for each control criterion and a total of 144 datasets were collected.
3. Experimental
3.1. Experimental Details
In this study, a control experiment was conducted according to the temperature and comfort range of the PMV. The ERV system was used to satisfy the legal rate requirement of 0.5 ventilations per hour. The temperature standard was 21 °C, and is the domestically recommended temperature. Furthermore, within the experimental space, the occupants’ quantity of clothing (clo) was limited to 1.0, and performance activity (met) to typing (1.1) [20].
On the first day of the experiment, without any external interference or condition, the normal daily activity was examined for the control group. On the second day, temperature and humidity for the experimental group (A) were controlled. These constitute the basic factors among the indoor thermal environment factors. On the third day, the experimental group (B) controlled the HVAC system based on the PMV index.
The experimental space had an occupancy density of 0.05 person/m2 in an office (26 m2) on the ninth floor of a building with 17 floors, and corresponded to a nondense space. The experimental space enabled the individual control of the HVAC system.
An important feature of the experimental space is the fact that two out of the four walls are front glass windows that are highly affected by the outer temperature and the intensity of sunlight per hour.
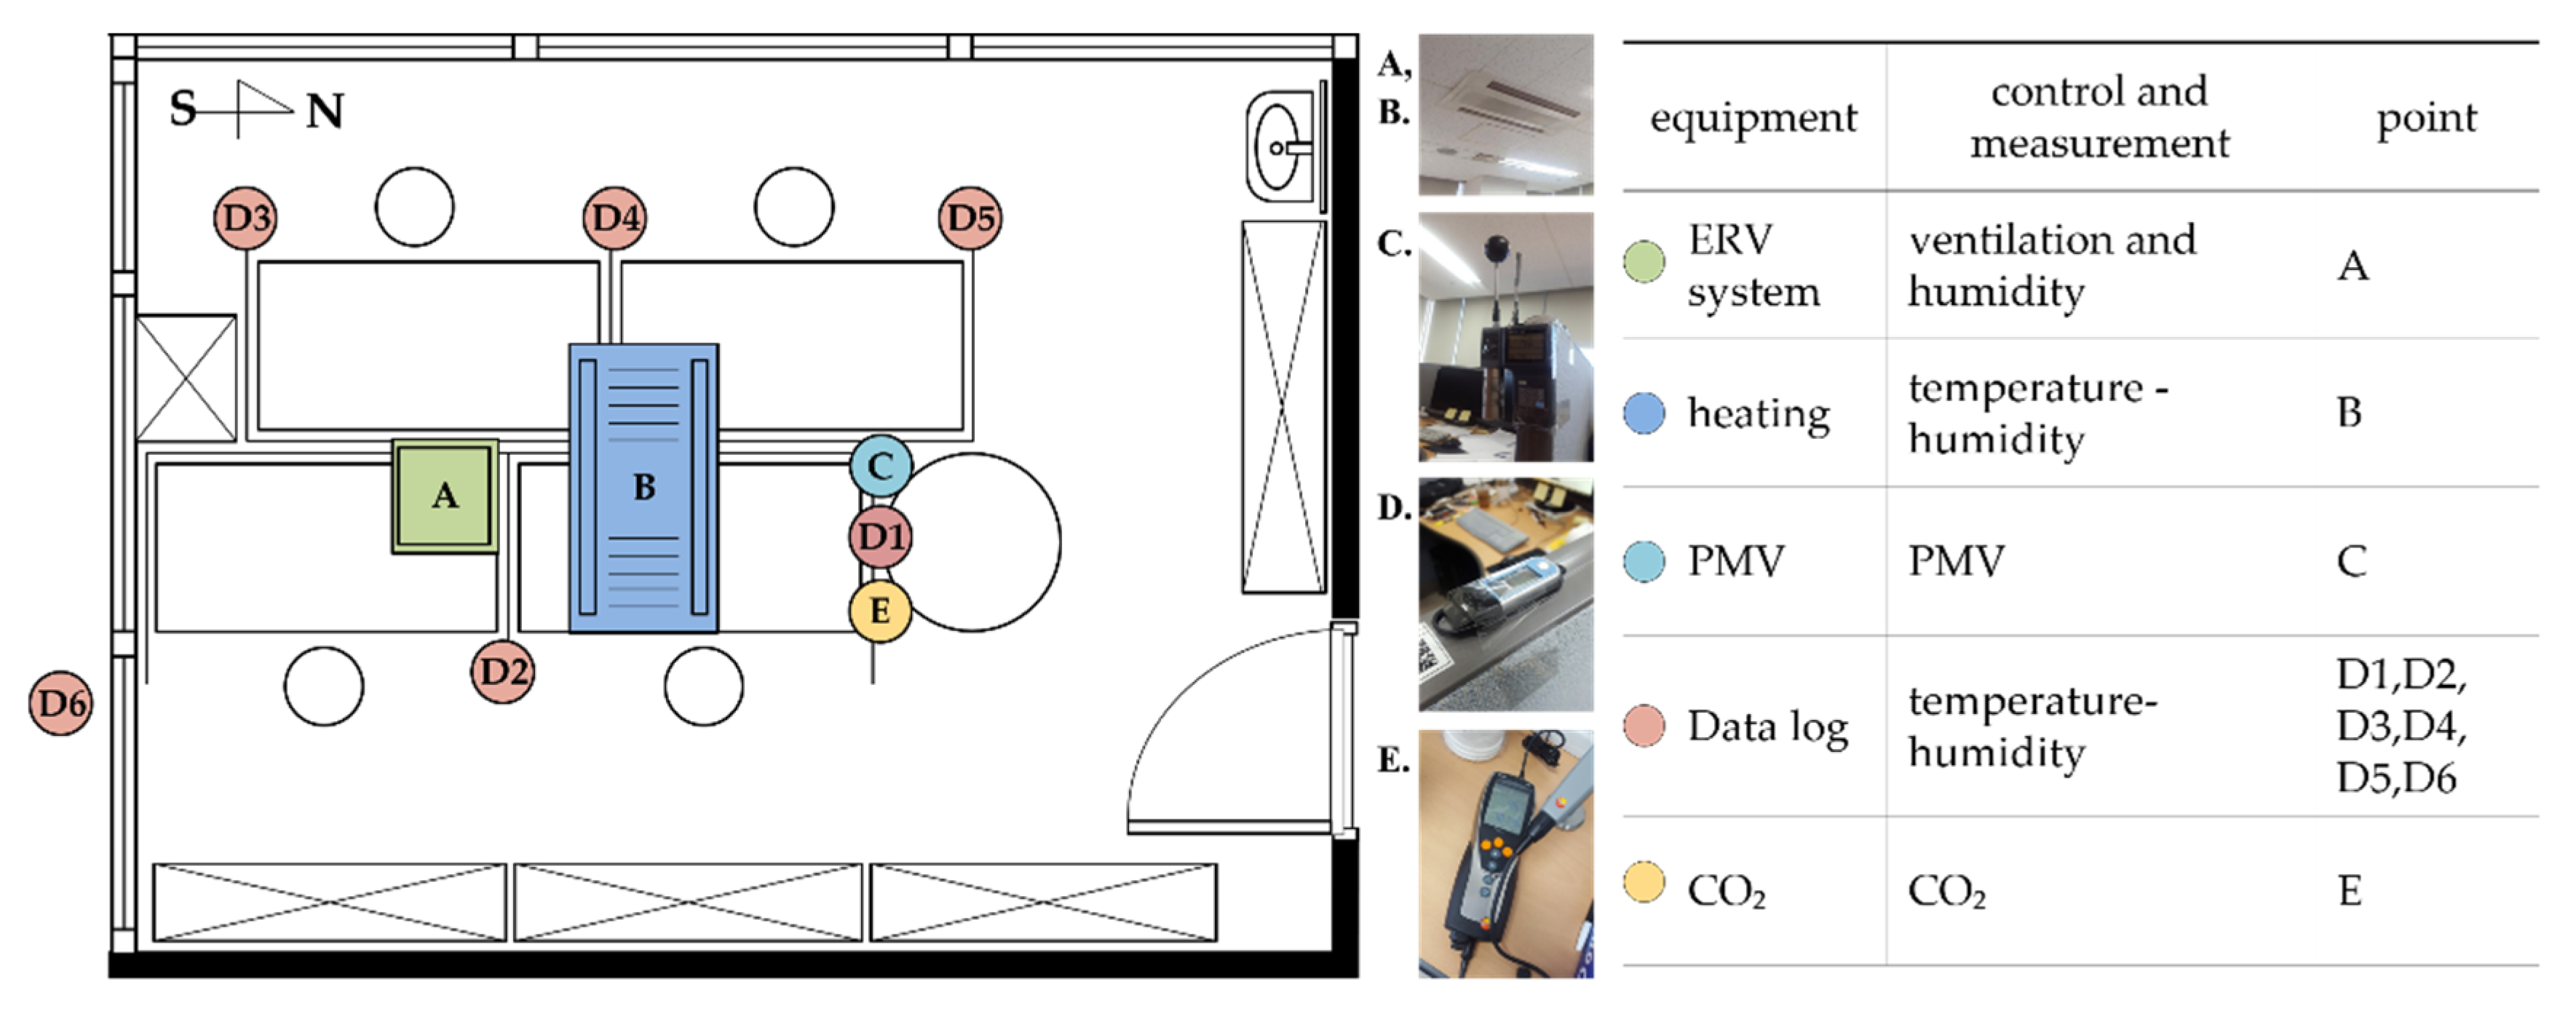
Table 2 lists the questionnaire survey items and evaluation. Additionally, Figure 2 shows the installation position of the measurement apparatus.
Furthermore, to investigate the comfort of the occupants, questionnaires were distributed to the experimental space occupants, and the comfort evaluation was conducted. As shown in Table 2, based on the seven-step sensory scale defined by the American Society of Heating, Refrigerating, and Air-Conditioning Engineers, the questionnaire was drafted to record the indoor comfort (CSV) and sense of heat and cold (TSV) every hour [21,22,23]. Similar to the actual data, the questionnaire was recorded for three days at six measurement intervals per hour (i.e., every 10 min). Regarding the questionnaire data, 24 datasets were collected per day from each occupant and for four people for three days. In total, 288 datasets were collected.
Figure 2 shows the equipment used for the experiment and the installation locations. We used a ventilation system (ERV system) that influenced indices, heating equipment, dataloggers for temperature and humidity measurements, a PMV device for measuring PMV values, and a CO2 concentration meter for measuring the CO2 concentration [24,25,26].
The ERV system and heating equipment were installed on the ceiling. With the exception of the ERV system and heating equipment, all of the remaining equipment were installed at 1.2 m above the floor. As shown in Figure 2, the dataloggers (D1), PMV measurement device (C), and the CO2 concentration meter (E) provided the reference points for all data.
3.2. Heating, Ventilation, and Air Conditioning (HVAC) System’s Operating Pattern Determined by the Control Algorithm
3.2.1. Control Group
On the first day of the experiment, no external interference or conditions were applied, as shown in Figure 3. During the experiment, the average outer temperature was 4 °C and the humidity was 50%. Figure 3 also shows the results graph of the control group.
The initial temperature of the control group was 15 °C. As soon as the occupants entered the experimental space, the heating equipment and the ERV system were operated. Subsequently, the heating equipment was operated continually until the temperature reached the reference temperature of 24 °C. The duration was 3 h. Furthermore, the heating equipment was not operated until lunchtime, but the temperature of the experimental space was maintained by the increased sunlight intensity combined with the indoor temperature and time. In the afternoon, the operation of the heating equipment was cumulative and was based on an average time window of 3 h, similar to the morning. The average temperature of the experimental space of the control group was 24.8 °C.
A preliminary monitoring of the outdoor air conditions is necessary before monitoring the indoor conditions of the parameter CO2 [27]. However, the CO2 concentration was reported to be >11,000 parts per million (ppm) at and after 11:00 am, as shown in Figure 3. If the CO2 concentration exceeds 1000 ppm, a level of discomfort can be observed [8], thus indicating that the CO2 concentration increased to a significantly uncomfortable level during the experiment. However, although the CO2 concentration temporarily declined when the ERV system was operated, it could not hold for >20 min. Moreover, the PMV graph results demonstrated that the comfort range was not reached.
3.2.2. Control According to Temperature and Humidity Index
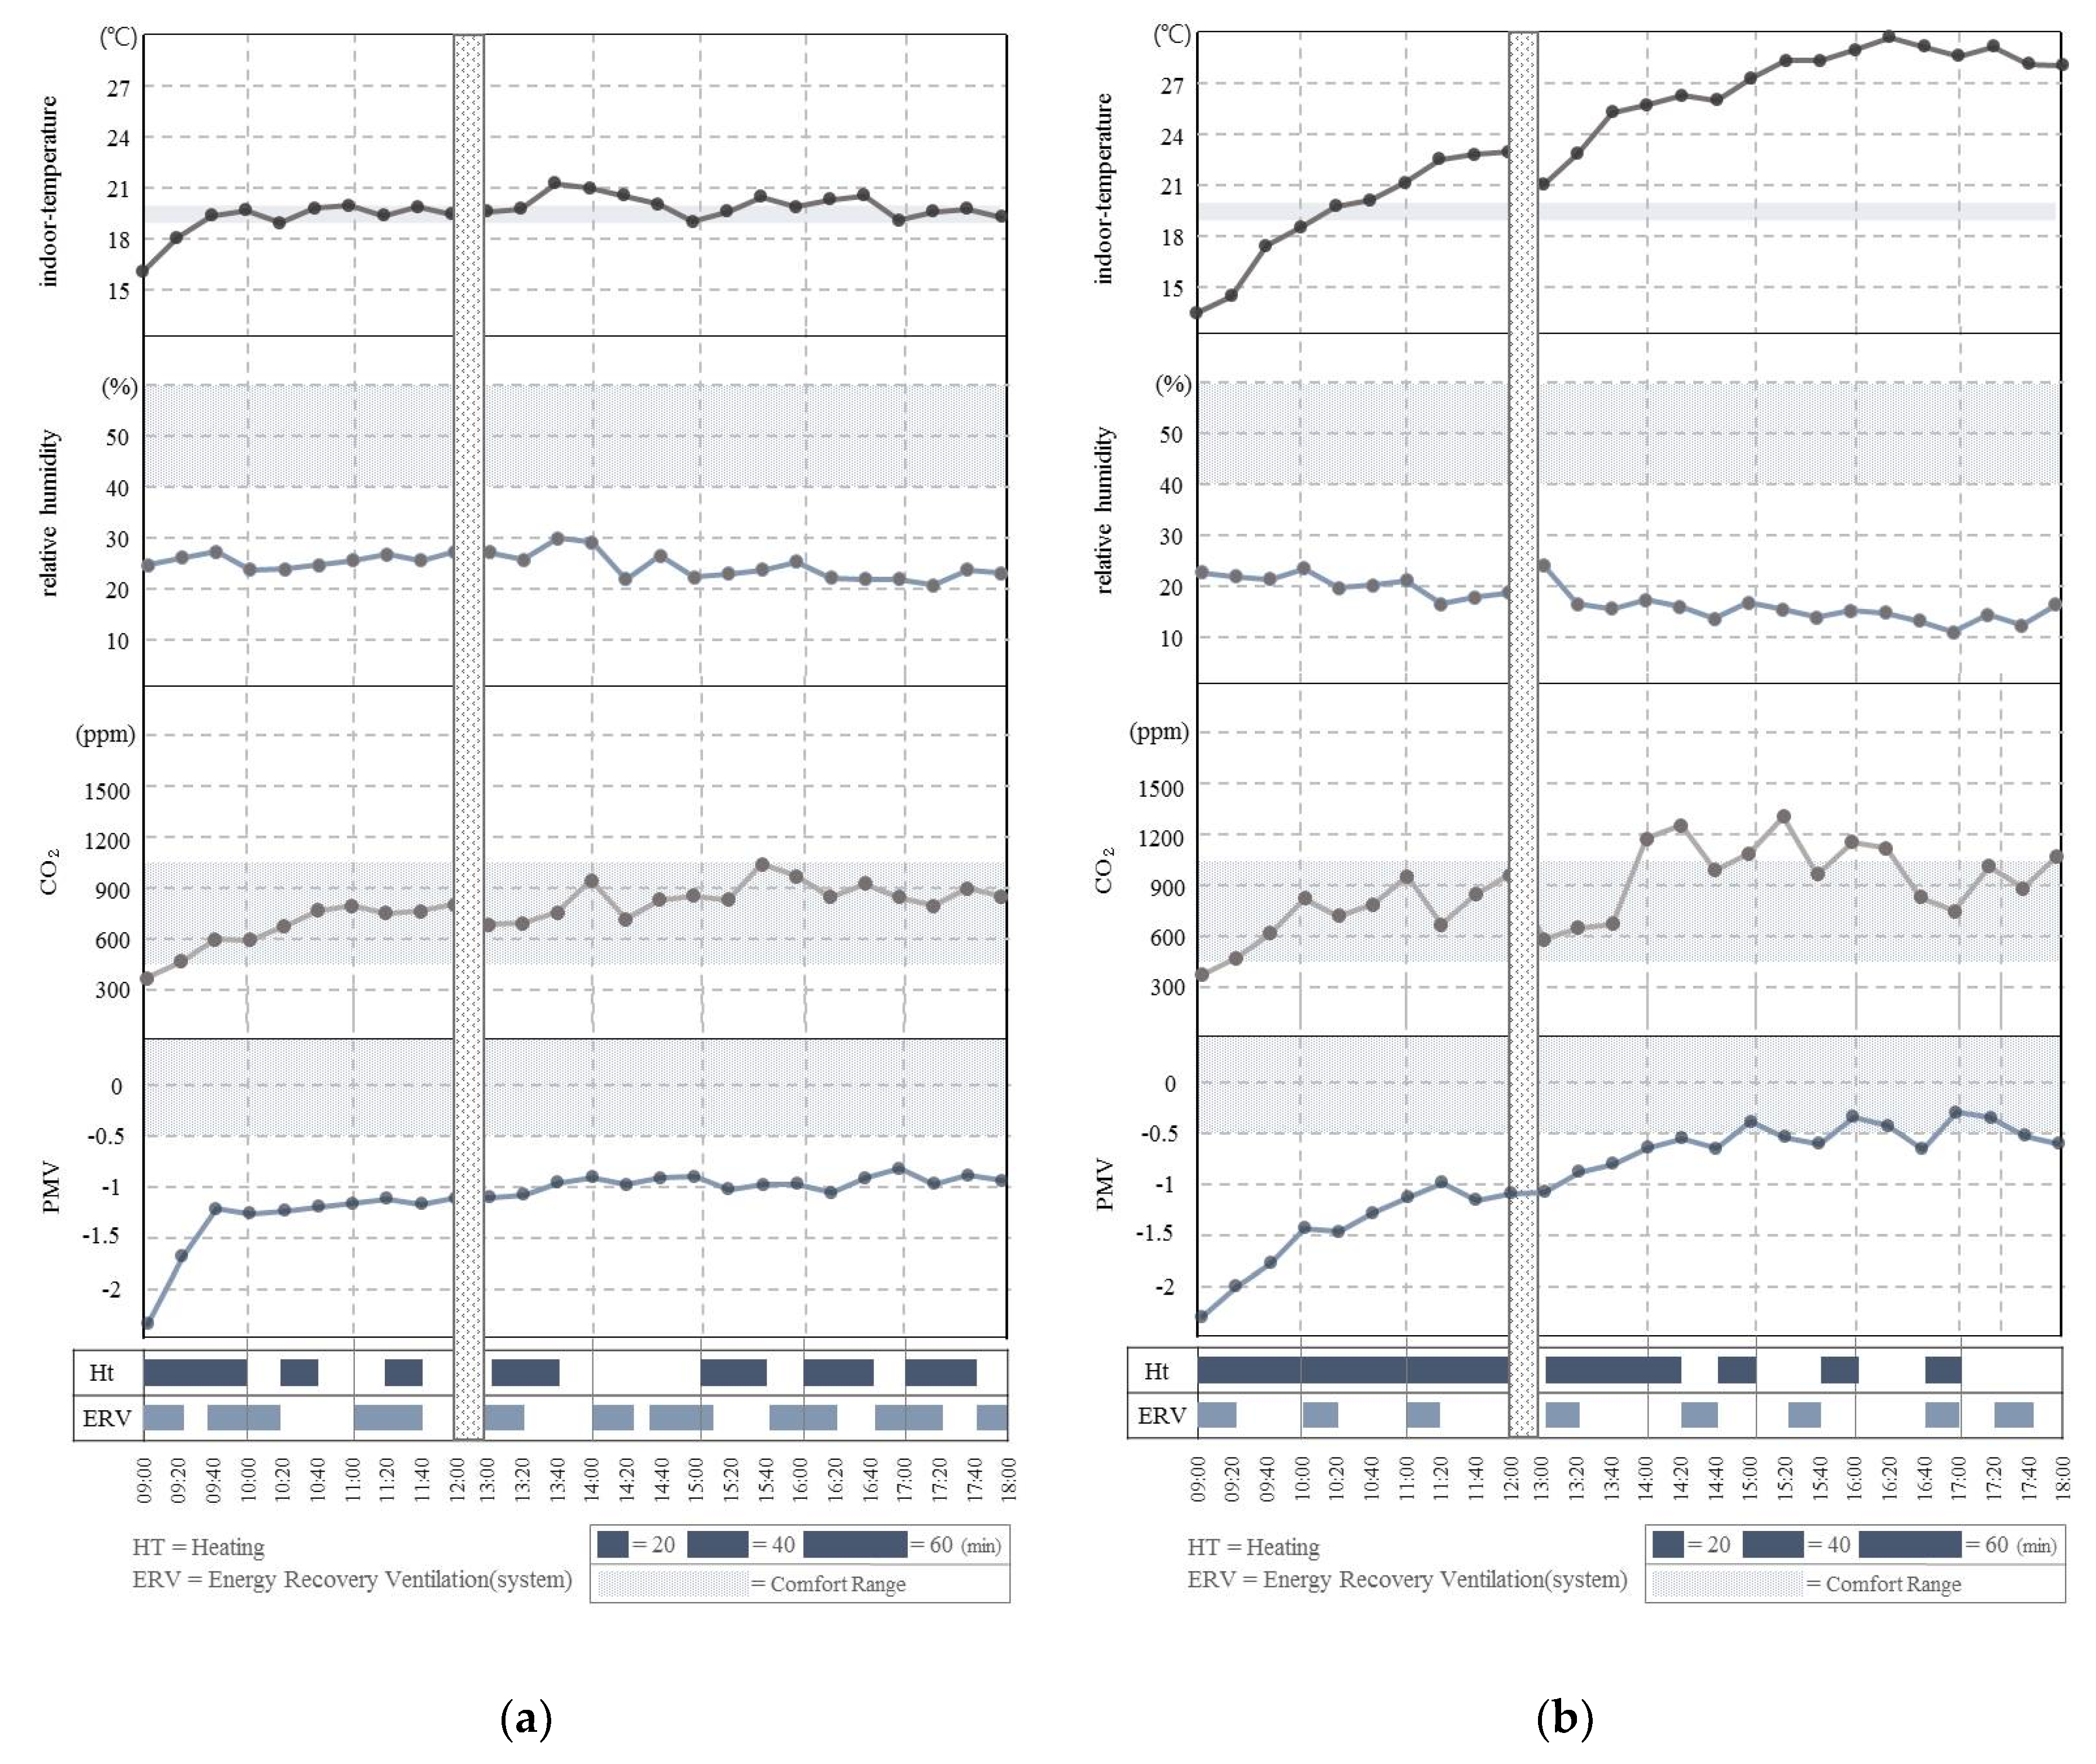
Figure 4 shows the results graph of the experimental group.
The experimental group (A) provides the reference temperature and humidity index data based on the control algorithm. Among the indoor thermal environment factors, both the temperature and humidity are physical indices that provide reference standards. As shown in the control group plots in Figure 4a, the results were obtained when the ERV system and heating equipment were operated according to the temperature and humidity standards. The average outside temperature for (A) was 3.7 °C and the humidity was 43%. Figure 4 shows the results graph of the control group.
The first temperature for (A) was 16 °C, which demonstrated a temperature difference of 1 °C from the control group. The operation of the heating equipment according to the algorithm was developed based on the comfort range of the temperature that demonstrated a low-operation rate for the heating equipment. The average temperature of the experimental space was 20.9 °C
With the ERVs, there were certain limitations that needed to reach the comfort range of humidity in the office. The CO2 concentration was observed within the comfort range at 20 min at the start and end of the experiment. However, neither the humidity nor the PMV reached the comfort range.
3.2.3. Control According to PMV Index (B)
Experimental group (B) was involved in the experiment conducted according to the control algorithm, and acts as a reference for the PMV index. When the ERV system and heating equipment were operated according to the PMV’s comfort range, the results were obtained, are shown in Figure 4b. The average outside temperature in Figure 4b was 3.8 °C and the humidity was 58%.
The first temperature for group (B) was 13 °C, which was 3 °C less than that for group (A). During the morning hours, the heating equipment continued to operate to reach the PMV’s comfort range. The temperature reached the highest value of 23.1 °C beyond the comfort range because of the cumulative operational time period of 3 h of the heating equipment. However, the temperature did not reach the PMV’s comfort range. After 13:00, the heating equipment was operated for 2 h, while the PMV reached a value of −0.43, which was within the comfort range. Once the comfort range was reached, the PMV value was sensitive to the heating equipment. The CO2 concentration indicated a significant change in response to the ERV system’s operation.
4. Results and Discussion
4.1. Indoor Comfort (CSV) and Sense of Heat and Cold (TSV) Based on Control Standards
Figure 5 shows the thermal comfort of the occupants.
The questionnaire for comfort (CSV) and sense of heat and cold (TSV) was based on a seven-point scale. As shown in Figure 5, the results were expressed as average percentage units for each item.
The average score of the occupants’ CSV for the first control group was 5.8, and was close to “comfortable.” Reviewing the TSV, the average value was shown across the items of “normal” as a whole.
The average of CSV value for group (A) was 5.5, and was similar to that of the control group. Moreover, similar to the control group, most of the occupants responded that they felt “comfortable (62.8%).” Furthermore, similar to the control group, TSV demonstrated the highest rate of response to “normal.”
The CSV results for group (B) yielded the highest response rate for the choice of “normal (36.5%).” However, when compared with the control group (A), various responses were obtained that ranged from “uncomfortable” to “comfortable.” Furthermore, the TSV derived responses ranged from “cold” to “hot”. Therefore, the results of (B) indicated that the occupants reacted sensitively to changes in the thermal environment. Hence, it is considered that when the human thermal adaptation capability is considered, the operation of the HVAC system, according to the PMV standards, has certain limitations [28]. When the control group was compared with (A) and (B), (A) yielded positive results (1%). This indicates that, according to the control standards of temperature and humidity, the HVAC system control can play a positive role with regard to the comfort of the occupants and its energy-saving capacity [29,30,31].
4.2. Analysis of the Simultaneous Satisfaction of the HVAC System Operation and Resident Comfort According to Control Standards
Figure 6 shows the results of the experiment in the survey.
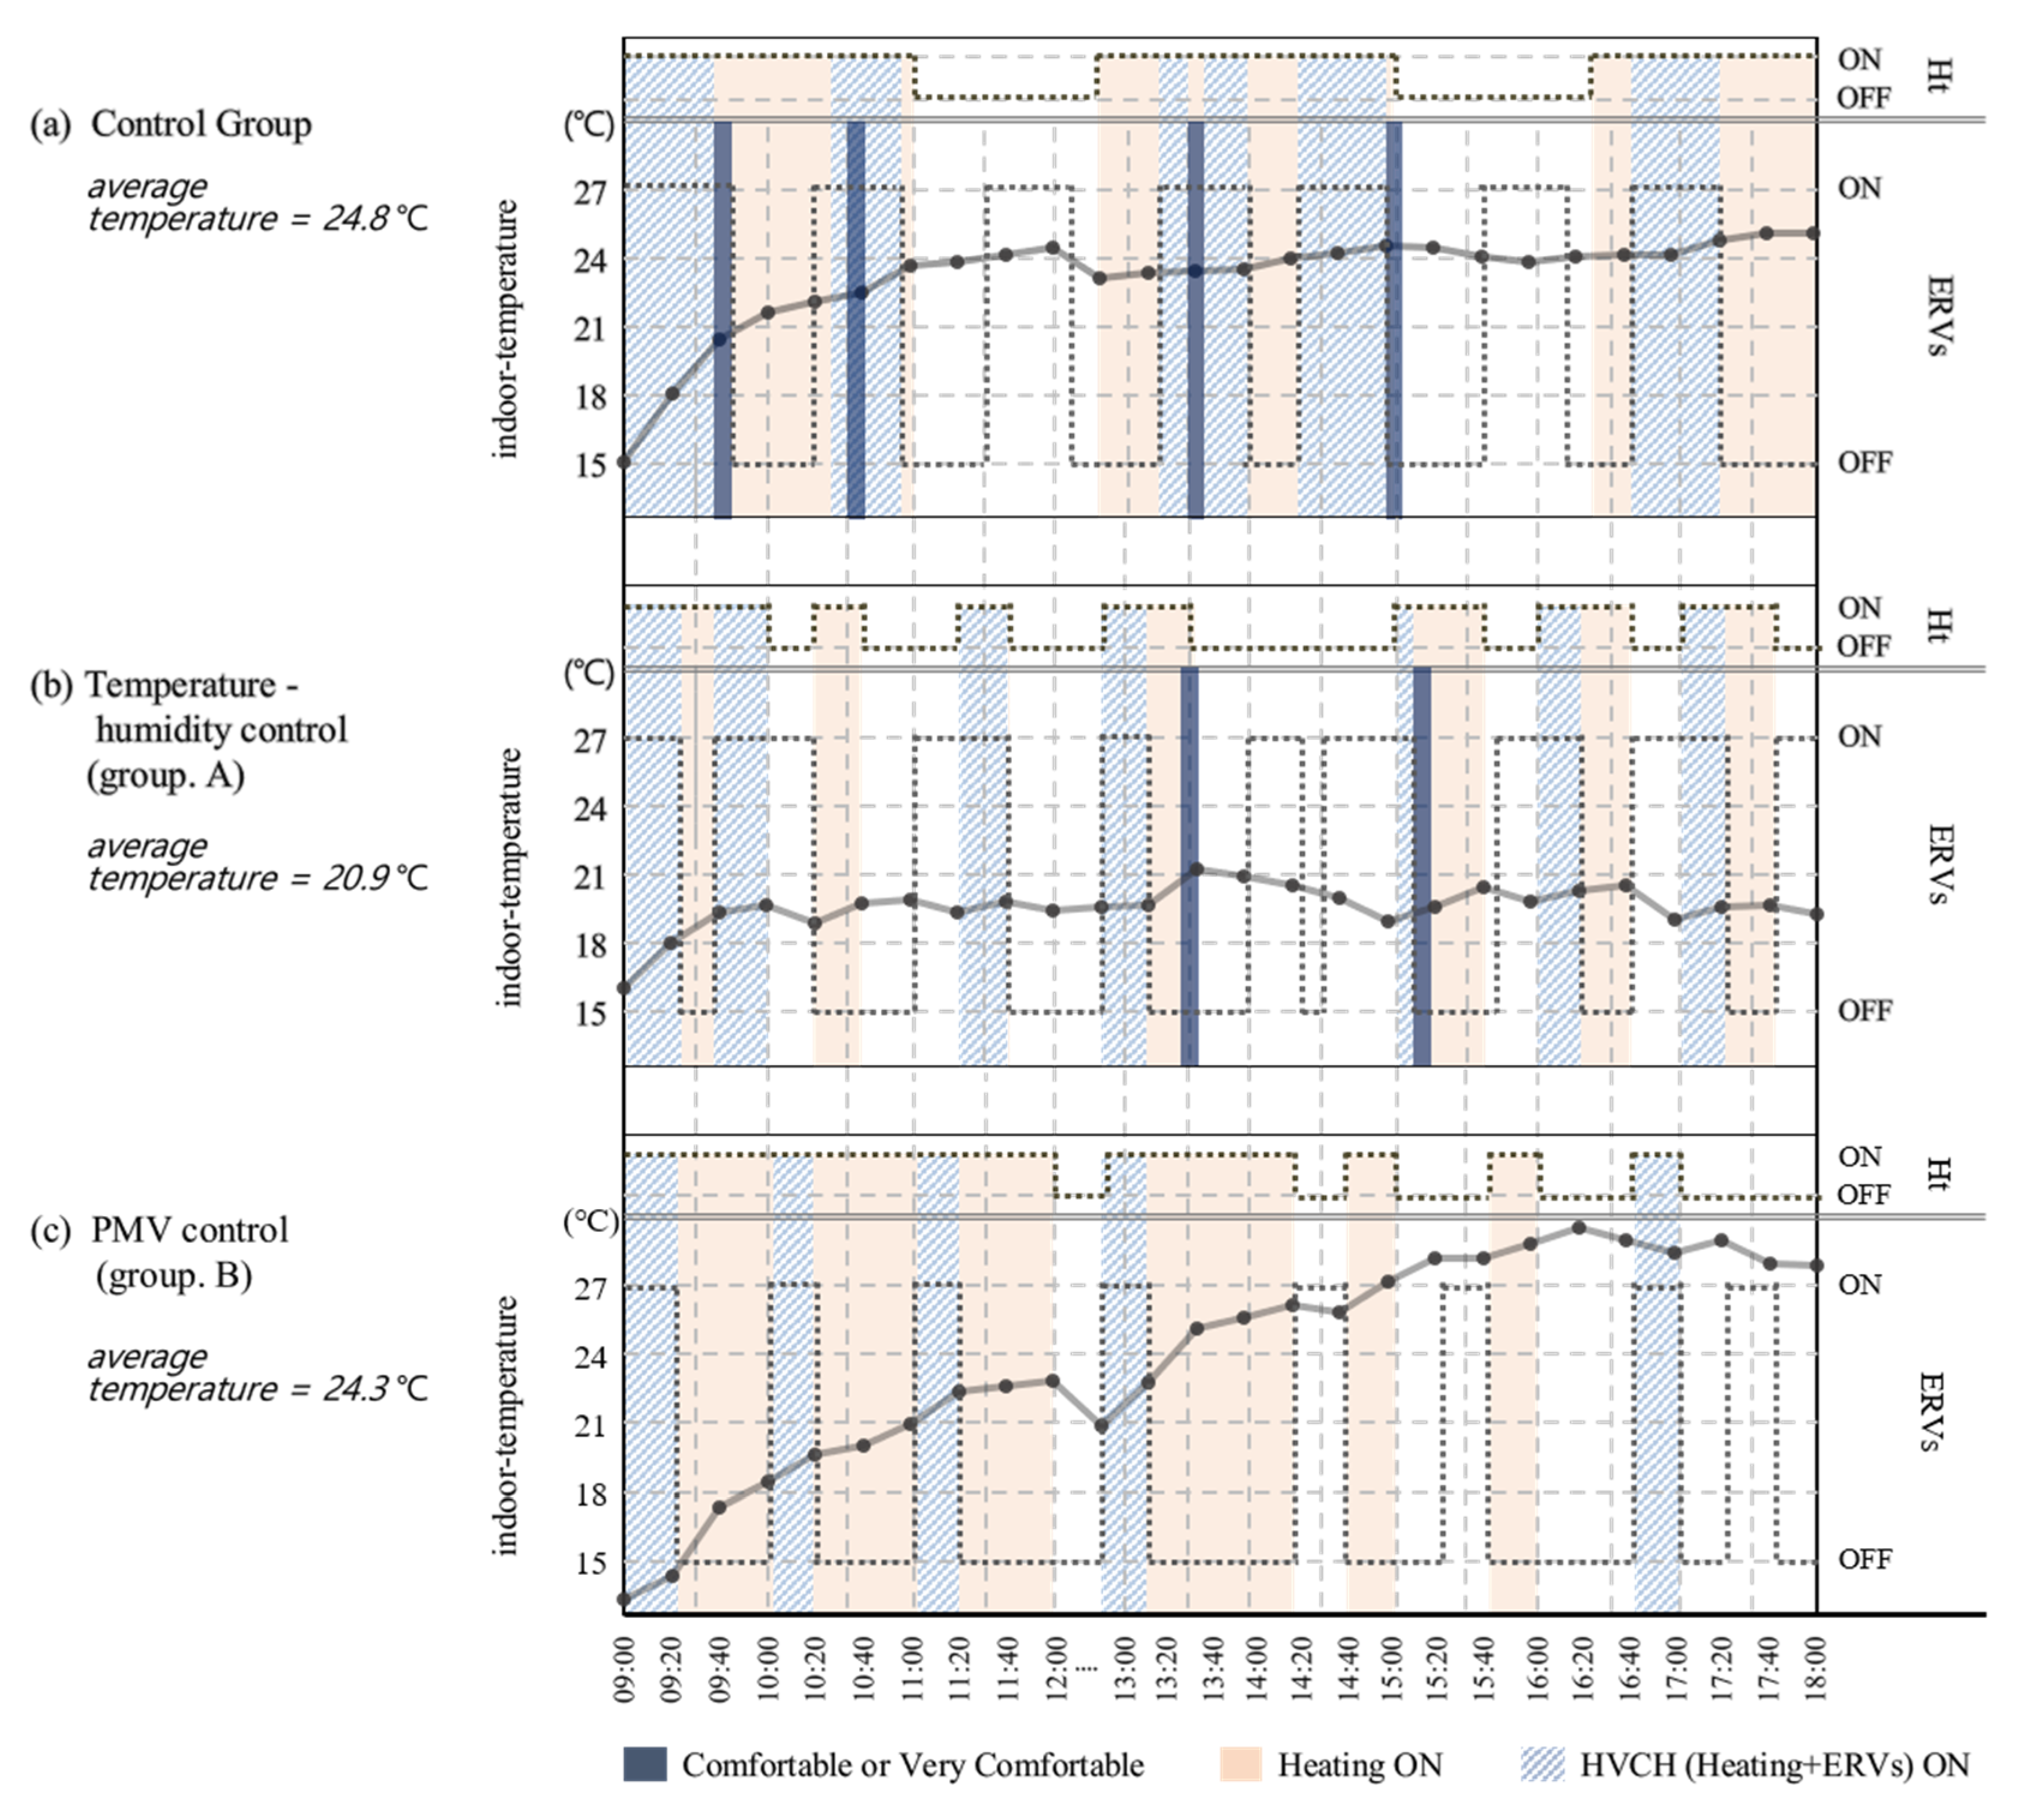
The category “comfort” was considered only for the hours in which all occupants simultaneously responded that they felt “comfortable (6)” and “very comfortable (7).”
Due to the experiment, the average temperature of the control group was 24.8 °C, that of (A) was 20.9 °C, and that of (B) was 24.3 °C, Thus, group (B) demonstrated an average temperature that was similar to that of the control group when they were reviewed.
Figure 6 shows the comparison of the comfort levels of the occupants at various HVAC system operation patterns.
Unlike the control group (-), group (B) did not have any responses. This indicated that all of the occupants indicated that they felt “comfortable.” When experimenting with (B), it was determined that the operation of the heating equipment that was controlled based on the PMV’s comfort range adversely affected the comfort of the occupants.
Furthermore, the temperature graph of group (B) steadily increased during the afternoon hours. The maximum temperature reached 30.4 °C at 16:20. This was related to the special characteristics of the experimental space. In this study, the experimental space contained two of the four walls as front glass windows that allowed the outer heated air to flow in. Hence, both the inner (heating equipment) and outer heated air were affected and led to the increased temperatures of the experimental space.
The energy consumption attributed to the simultaneous operation of the HVAC system demonstrated that group (A) resulted in a slightly improved operation performance compared with group (B). The operation of ERVs for the adjustment of humidity affected the energy consumption of group (A). However, when the total energy consumption was considered, it was determined that the continuous operation of the heating equipment of group (B) led to an accumulated energy consumption. Thus, the total energy consumption of group (B) will probably be greater than that of group (A).
Therefore, according to the algorithm of group (B), the PMV control has limitations when used as a control for energy savings in the HVAC system. Considering the temperature and humidity control according to the algorithm of group (A), if the HVAC system is controlled, it is possible to achieve the comfort levels of the occupants consuming less energy than that consumed by existing methods [29,30,31,32,33,34]. Group (A) is a control group that can consider the capability of humans to adapt thermally because of the low variation range of the room temperature. This indicates that the use of the heating equipment positively affects the reduced energy consumption of the HVAC system [8,29].
5. Conclusions
In this study, the following results were obtained with respect to the optimal control method for the HVAC system to achieve energy savings. These outcomes were based on office experiments with an algorithm that was developed based on the comfort standards of temperature, humidity, and PMV. The conclusions are as follows:
- The CO2 concentration was related to indoor comfort. Outcomes demonstrated that it was more comfortable in group (A) compared with the control group. Moreover, there were limitations in reaching the comfort range of office humidity with ERVs. Furthermore, group (B) demonstrated an increased cumulative consumption of the heating equipment for reaching the comfort range.
- Regarding the comfort levels of the occupants, group (A) yielded results that were similar to those of the control group. Group (B) exhibited small deviations among the provided responses and can be considered as a control method that does not consider the thermal adaptation capability of humans.
- When the HVAC system is controlled based on the temperature and humidity, as implemented in the algorithm of group (A), the use of the HVAC system can be reduced due to the human capability to thermally adapt after reaching the comfort range of temperature.
Therefore, after considering the indoor thermal environment and the comfort of the occupants, the optimal control method of the HVAC system may be expected to yield an energy consumption that is lower than the existing energy consumption. Furthermore, the reduced usage of the HVAC system will probably have a positive impact on the reduced energy usage throughout the building.
Author Contributions
Writing—review and editing, S.-K.K.; project administration, J.-H.H., M.-S.J. and Y.-S.P.; supervision, W.-H.H.; All authors have read and agreed to the published version of the manuscript.
Funding
This work was supported by the National Research Foundation of Korea (NRF) grant funded by the Korea government (MSIT) (No. 2019R1A2C3002219).
Conflicts of Interest
The authors declare no conflict of interest.
References
- Directive 2004/8/EC of the European Parliament and of the Council of 11 February 2004 on the promotion of cogeneration based on a useful heat demand in the internal energy market and amending Directive 92/42/EEC. Off. J. Eur. Union 2004, 52, 50–60. Available online: https://www.buildup.eu/en/node/37848 (accessed on 21 April 2013).
- Dincer, I. Renewable and Sustainable Energy Reviews, Renewable energy and sustainable development: A crucial review. Renew. Sustain. Energy Rev. 2000, 4, 157–175. [Google Scholar] [CrossRef]
- Park, H.S.; Lee, M.; Kang, H.; Hong, T.; Jeong, J. Development of a new energybenchmark for improving the operational rating system of office buildingsusing various data-mining techniques. Appl. Energy 2016, 173, 225–237. [Google Scholar] [CrossRef]
- Sibilio, S.; Rosato, A.; Ciampi, G.; Scorpio, M.; Akisawa, A. Renewable and Sustainable Energy Reviews Building-integrated trigeneration system: Energy, environmental and economic dynamic performance assessment for Italian residential applications. Renew. Sustain. Energy Rev. 2017, 68, 920–933. [Google Scholar] [CrossRef]
- Li, C.; Zhou, J.; Cao, Y.; Zhong, J.; Liu, Y.; Kang, C.; Tan, Y. Interaction between urban microclimate and electric air-conditioning energy consumption during high temperature season. Appl. Energy 2014, 117, 149–156. [Google Scholar] [CrossRef]
- Jang, J.; Baek, J.; Leigh, S.-B. Prediction of Optimal Heating Timing with Empirical Data of the Office Building. J. Archit. Inst. Korea Spring Conf. 2017, 37, 537–538. [Google Scholar] [CrossRef]
- Ma, Z.; Li, H.; Sun, Q.; Wang, C.; Yan, A.; Starfelt, F. Statistical analysis of energy consumption patterns on the heat demand of buildings in district heating systems. Energy Build. 2014, 85, 464–472. [Google Scholar] [CrossRef]
- Oh, G.-S.; Jung, G.-J.; Im, Y.-B. Impact of Indoor CO2 Concentration on Work Performance. J. Archit. Inst. Korea 2010, 30, 385–386. [Google Scholar]
- Azar, E.; Menassa, C.C. A comprehensive analysis of the impact of occupancy parameters in energy simulation of office buildings. Energy Build. 2012, 55, 841–853. [Google Scholar] [CrossRef]
- Andersen, P.D.; Iversen, A.; Madsen, H.; Rode, C. Dynamic modeling of presence of occupants using inhomogeneous Markov chains. Energy Build. 2014, 69, 213–223. [Google Scholar] [CrossRef]
- Yang, R.; Wang, L. Development of multi-agent system for building energy and comfort management based on occupant behaviors. Energy Build. 2013, 56, 1–7. [Google Scholar] [CrossRef]
- Widén, J.; Wäckelgård, E. A high-resolution stochastic model of domestic activity patterns and electricity demand. Appl. Energy 2010, 87, 1880–1892. [Google Scholar] [CrossRef]
- Hong, T.; Taylor-Lange, S.C.; D’Oca, S.; Yan, D.; Corgnati, S.P. Advances in research and applications of energy-related occupant behavior in buildings. Energy Build. 2016, 116, 694–702. [Google Scholar] [CrossRef] [Green Version]
- Liang, H.-H.; Lin, T.-P.; Hwang, R.-L. Linking occupants’ thermal perception and building thermal performance in naturally ventilated school buildings. Appl. Energy 2012, 94, 355–363. [Google Scholar] [CrossRef]
- Ma, Z.; Leijon, A. Bayesian Estimation of Beta Mixture Models with Variational Inference. IEEE Trans. Pattern Anal. Mach. Intell. 2011, 33, 2160–2173. [Google Scholar] [CrossRef] [PubMed]
- Lin, H.; Wang, Q.; Wang, Y.; Liu, Y.; Sun, Q.; Wennersten, R. The energy-saving potential of an office under different pricingmechanisms—Application of an agent-based model. Appl. Energy 2017, 202, 248–258. [Google Scholar] [CrossRef]
- Ministry of Environment of KOREA. Manual for Indoor Indoor Air Quality Management. 2017. Available online: https://www.gov.kr/portal/locgovNews/1994168 (accessed on 27 September 2019).
- Fanger, P.O. (Ed.) Thermal Comfort: Analysis and Applications in Environmental Engineering; Danish Technical Press: Copenhagen, Denmark, 1970; 244p. [Google Scholar]
- ISO 7730. Ergonomics of the Thermal Environment; Ergonomics of the physical environment: Geneva, Switzerland, 2005; Available online: https://www.iso.org/standard/39155.html (accessed on 15 November 2005).
- ASHRAE Standard 55-2010 Thermal Environment Conditions for Human Occupancy. ASHRAE standard ISSN 1041-2336: Atlanta, GA, US. Available online: www.ashrae.org (accessed on 24 July 2013.).
- Kim, S.-K.; Hong, W.-H.; Ryu, J.-H. A Study on the Residents Comfort in the Operation of Air-conditioner by using the Control Criteria of Indoor Thermal Environment in Apartment Buildings. J. Archit. Inst. Korea Struct. Constr. 2017, 33, 43–52. [Google Scholar] [CrossRef]
- Ryu, J.-H.; Hong, W.-H.; Seo, H.-C.; Seo, Y.-K. Determination of an acceptable comfort zone for apartment occupants in South Korea: An empirical analysis of cooling operation. Build. Environ. 2017, 125, 484–501. [Google Scholar] [CrossRef]
- Kim, J.; Hong, T.; Jeong, J.; Koo, C.; Jeong, K. An optimization model for selecting the optimal green systems by considering the thermal comfort and energy, consumption. Appl. Energy 2016, 169, 682–695. [Google Scholar] [CrossRef]
- Cannistraro, G.; Cannistraro, M.; Restivo, R. Smart control of air climatization system in function on the values of mean local radiant temperature. Smart Sci. 2015, 3, 157–163. [Google Scholar] [CrossRef] [Green Version]
- Cannistraro, G.; Cannistraro, M.; Restivo, R. Some observations on the radiative exchanges influence on thermal comfort in rectangular open-space environments. Int. J. Heat Technol. 2015, 33, 79–84. [Google Scholar] [CrossRef] [Green Version]
- Cannistraro, G.; Cannistraro, M.; Restivo, R. The local media radiant temperature for the calculation of comfort in areas characterized by Radiant surfaces. Int. J. Heat Technol. 2015, 33, 115–122. [Google Scholar] [CrossRef]
- Cannistraro, M.; Ponterio, L.; Cao, J. Experimental study of air pollution in the urban centre of the city of Messina. Model. Meas. Control. C 2018, 79, 133–139. [Google Scholar] [CrossRef] [Green Version]
- Nguyen, A.T.; Singh, M.K.; Reiter, S. An Analysis of the Occupant’s Thermal Comfort controlled by System air conditioner under Hot and Humid region. J. Archit. Inst. Korea 2011, 31, 419–420. [Google Scholar] [CrossRef] [Green Version]
- Cannistraro, M.; Trancossi, M. Enhancement of indoor comfort in the presence of large glazed radiant surfaces by a local heat pump system based on Peltier cells. Therm. Sci. Eng. Prog. 2019, 14, 100388. [Google Scholar] [CrossRef]
- Akimoto, T.; Tanabe, S.-I.; Yanai, T.; Sasaki, M. Thermal comfort and productivity evaluation of workplace environment in a task conditioned office. Build. Environ. 2010, 45, 45–50. [Google Scholar] [CrossRef]
- Diakaki, C.; Grigoroudis, E.; Kolokotsa, D. Towards a multi-objective optimization approach for improving energy efficiency in buildings. Energy Build. 2008, 40, 1747–1754. [Google Scholar] [CrossRef]
- Dounis, A.I.; Caraiscos, C. Advanced control systems engineering for energy and comfort management in a building environment—A review. Renew. Sustain. Energy Rev. 2009, 13, 1246–1261. [Google Scholar] [CrossRef]
- Xu, X.; Taylor, J.E.; Pisello, A.L.; Culligan, P.J. The impact of place-based affiliation networks on energy conservation: An holistic model that integrates the influence of buildings, residents and the neighborhood context. Energy Build. 2012, 55, 637–646. [Google Scholar] [CrossRef]
- Karyono, T.H.; Sri, E.; Sulistiawan, J.G.; Triswanti, Y. Thermal Comfort Studies in Naturally Ventilated Buildings in Jakarta, Indonesia. Buildings 2015, 5, 917–932. [Google Scholar] [CrossRef]
Figure 1.
Control algorithm: (a) control algorithm for the experimental group A; (b) control algorithm for experimental group B.
Figure 1.
Control algorithm: (a) control algorithm for the experimental group A; (b) control algorithm for experimental group B.
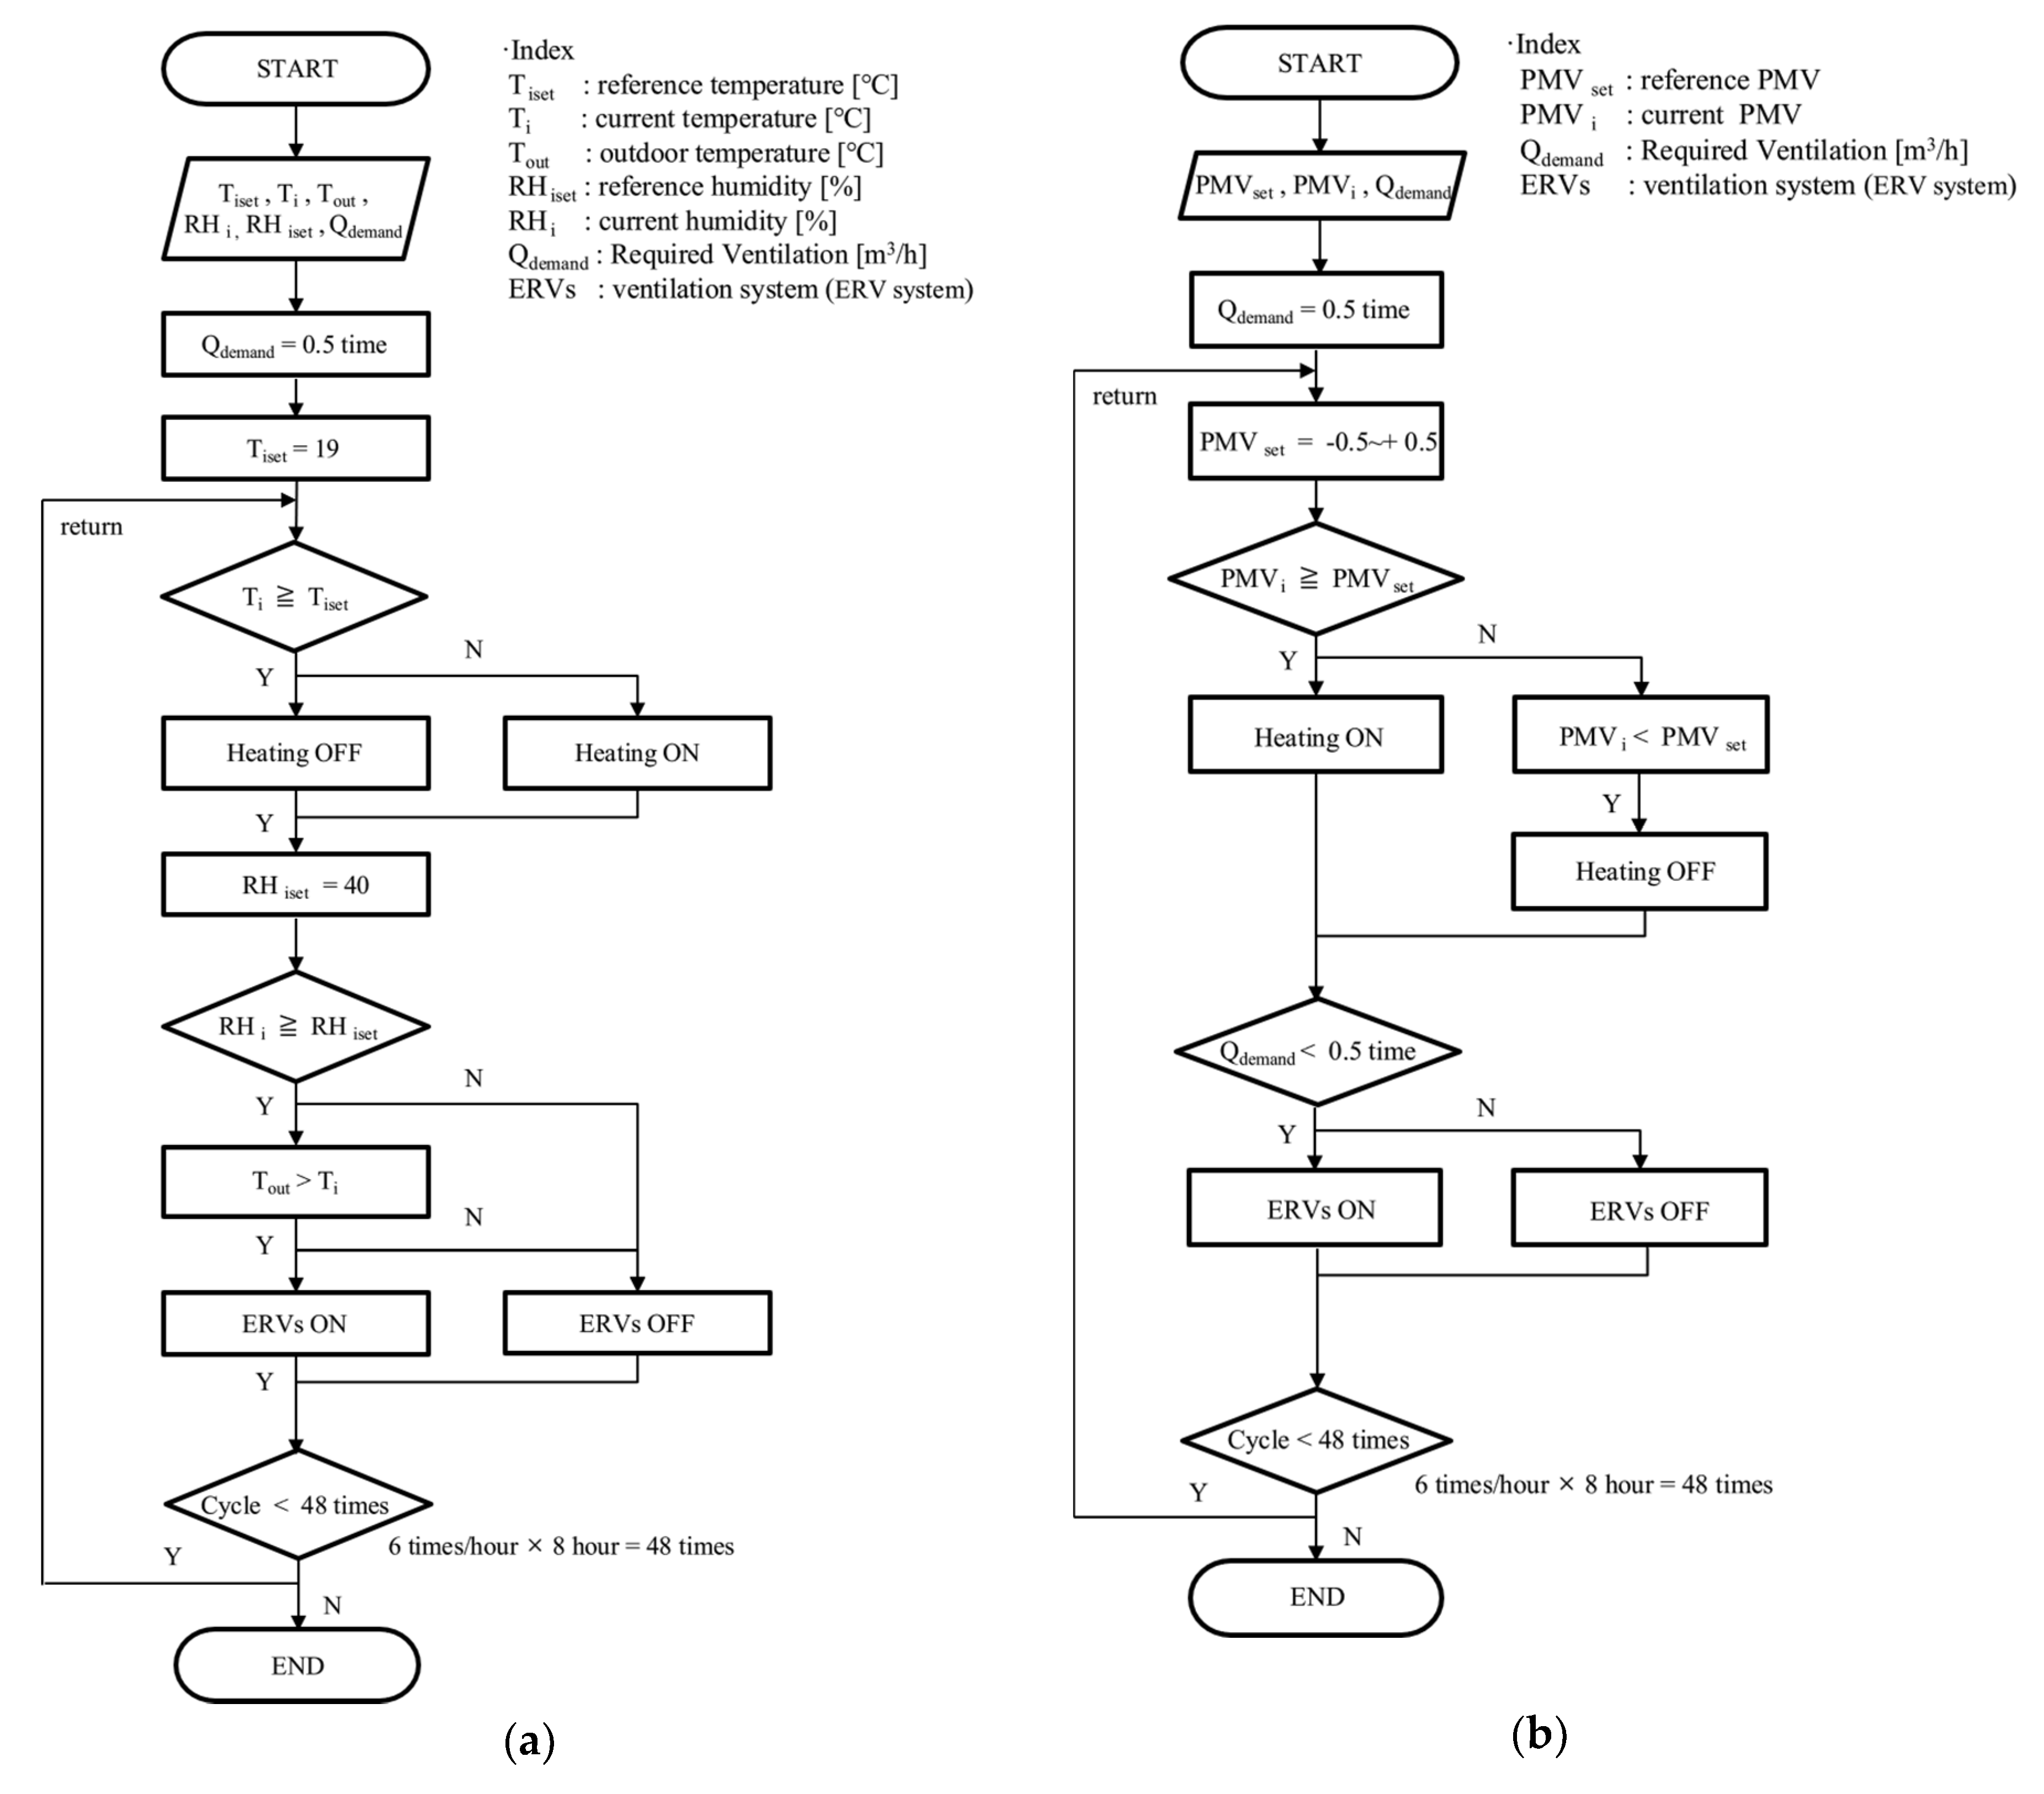
Figure 2.
Installation position of the measuring apparatus.

Figure 3.
Results graph of the control group.
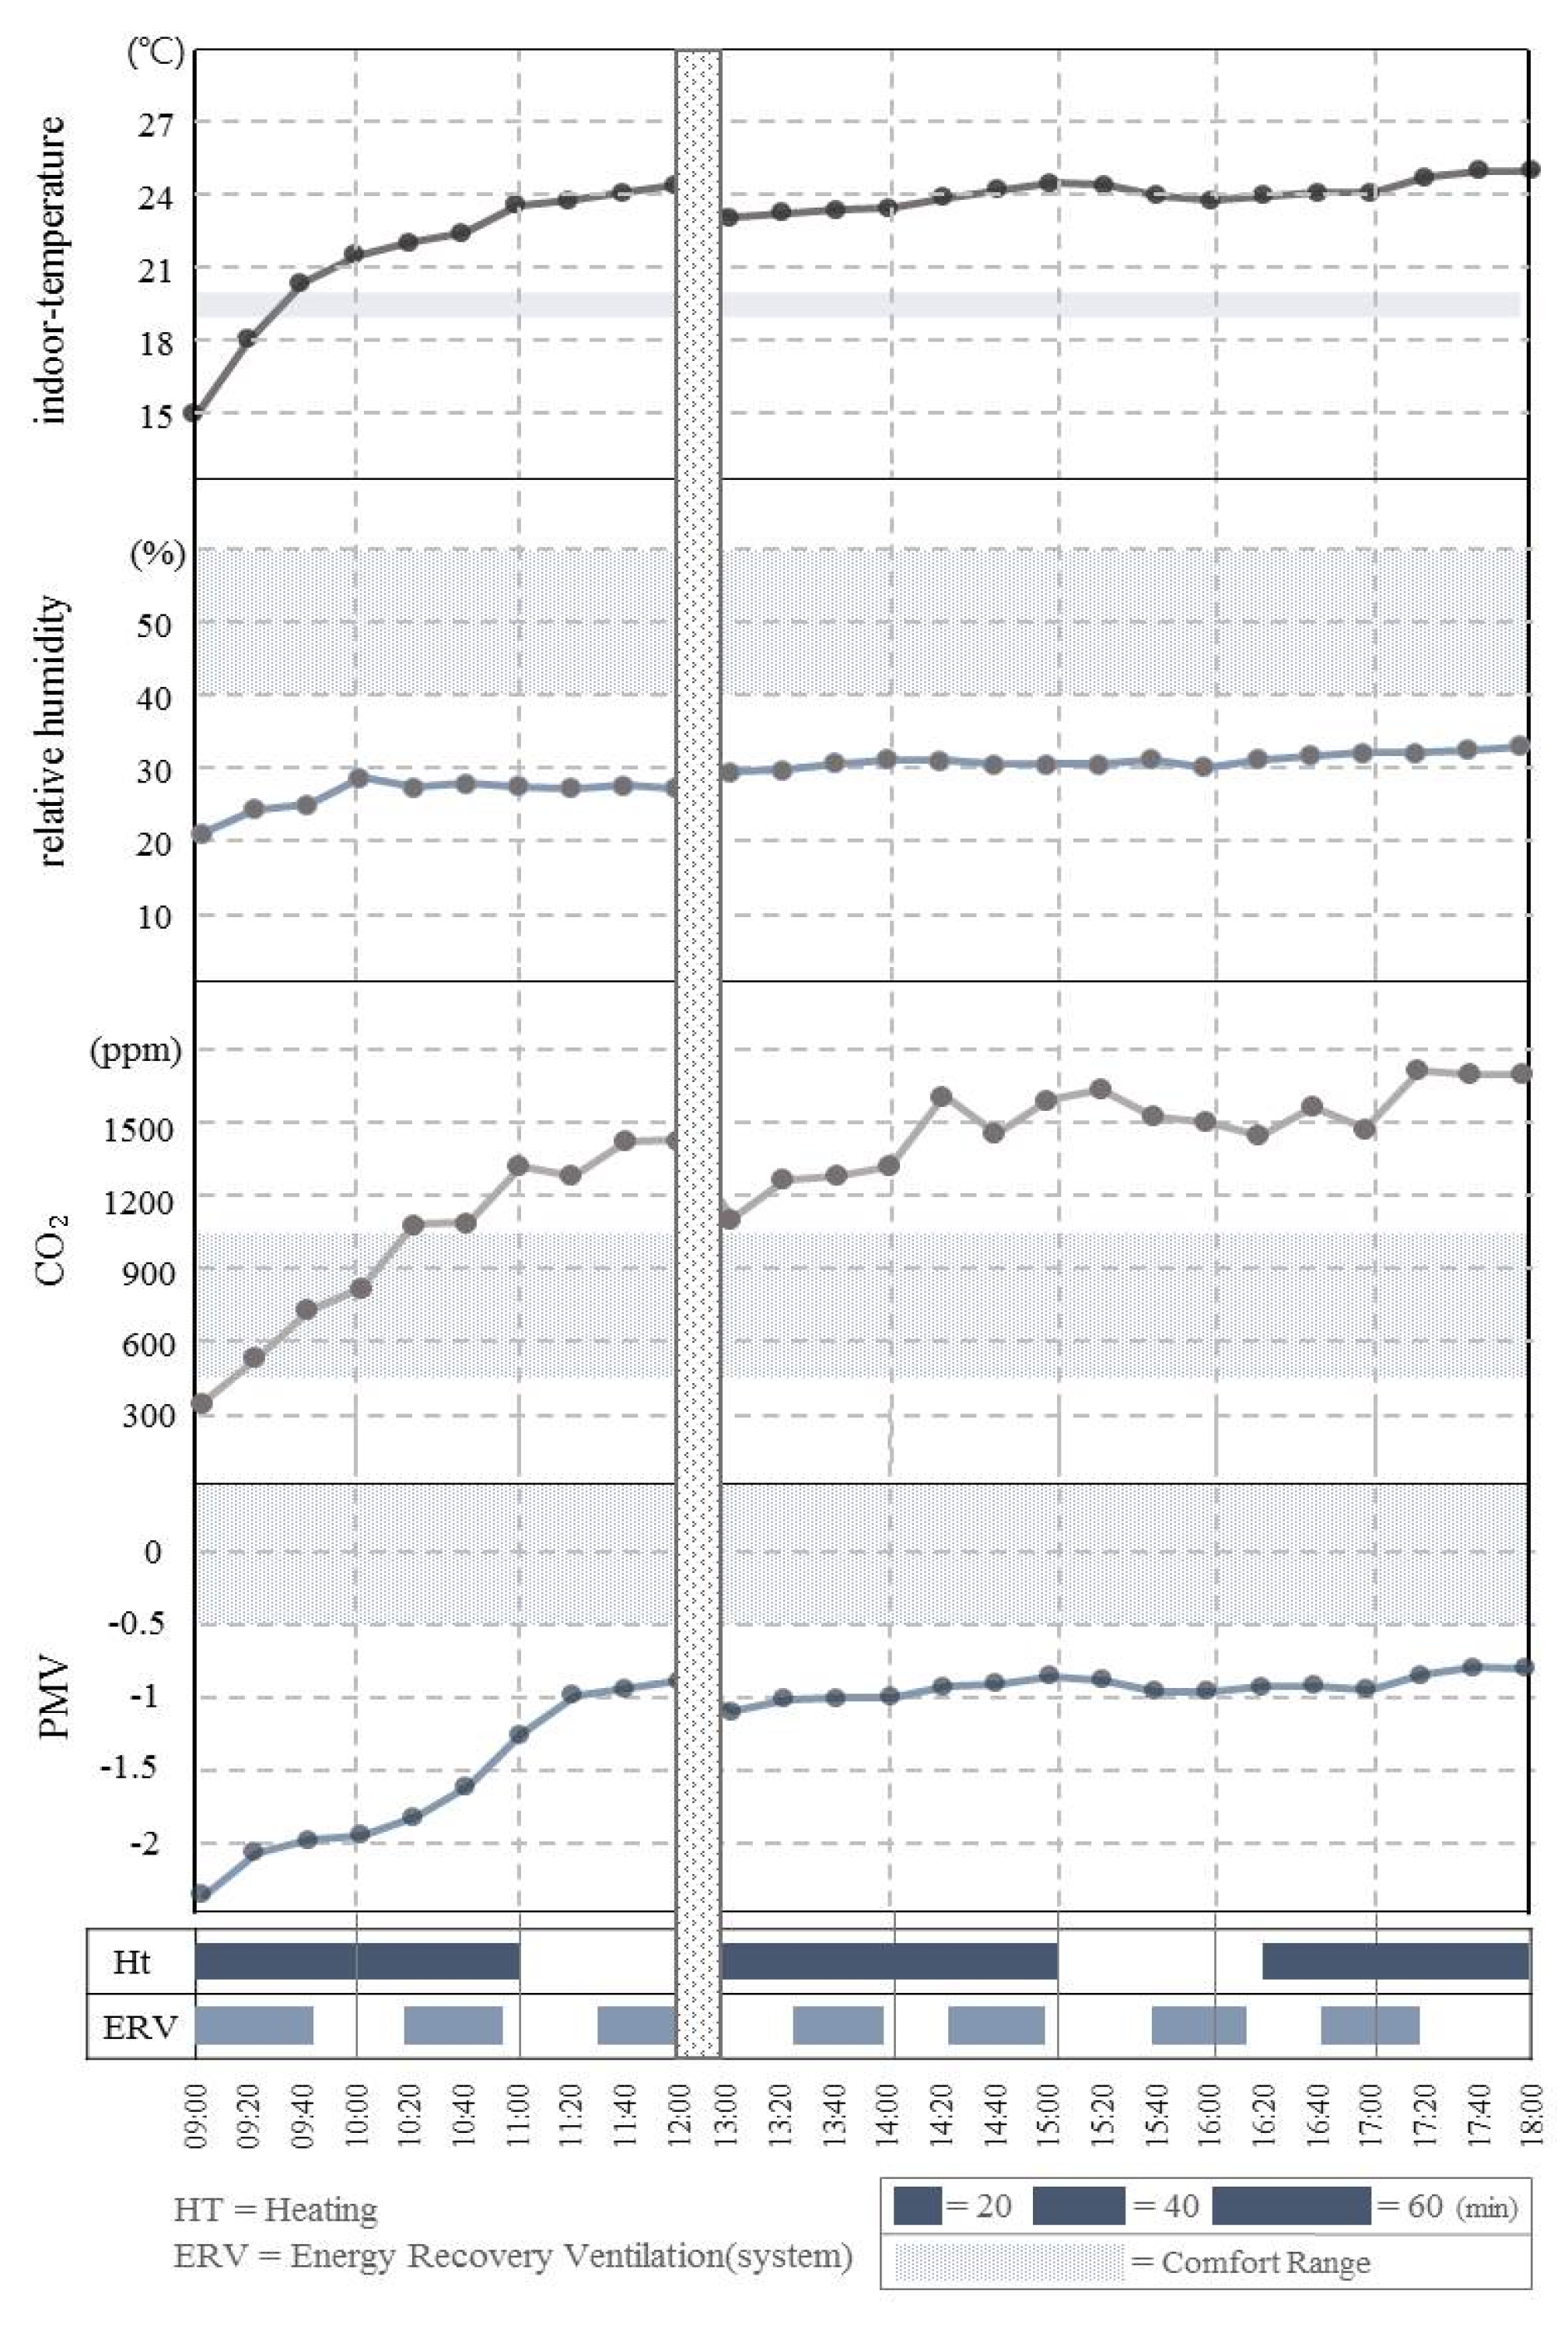
Figure 4.
Results graph of the experimental group: (a) results graph of the experimental group A (temperature and humidity index); (b) results graph of the experimental group B (PMV index).
Figure 4.
Results graph of the experimental group: (a) results graph of the experimental group A (temperature and humidity index); (b) results graph of the experimental group B (PMV index).

Figure 5.
Thermal comfort of the occupants: (a) results graph of thermal comfort to control group; (b) results graph of thermal comfort to experimental group A; (c) results graph of thermal comfort to experimental group B.
Figure 5.
Thermal comfort of the occupants: (a) results graph of thermal comfort to control group; (b) results graph of thermal comfort to experimental group A; (c) results graph of thermal comfort to experimental group B.
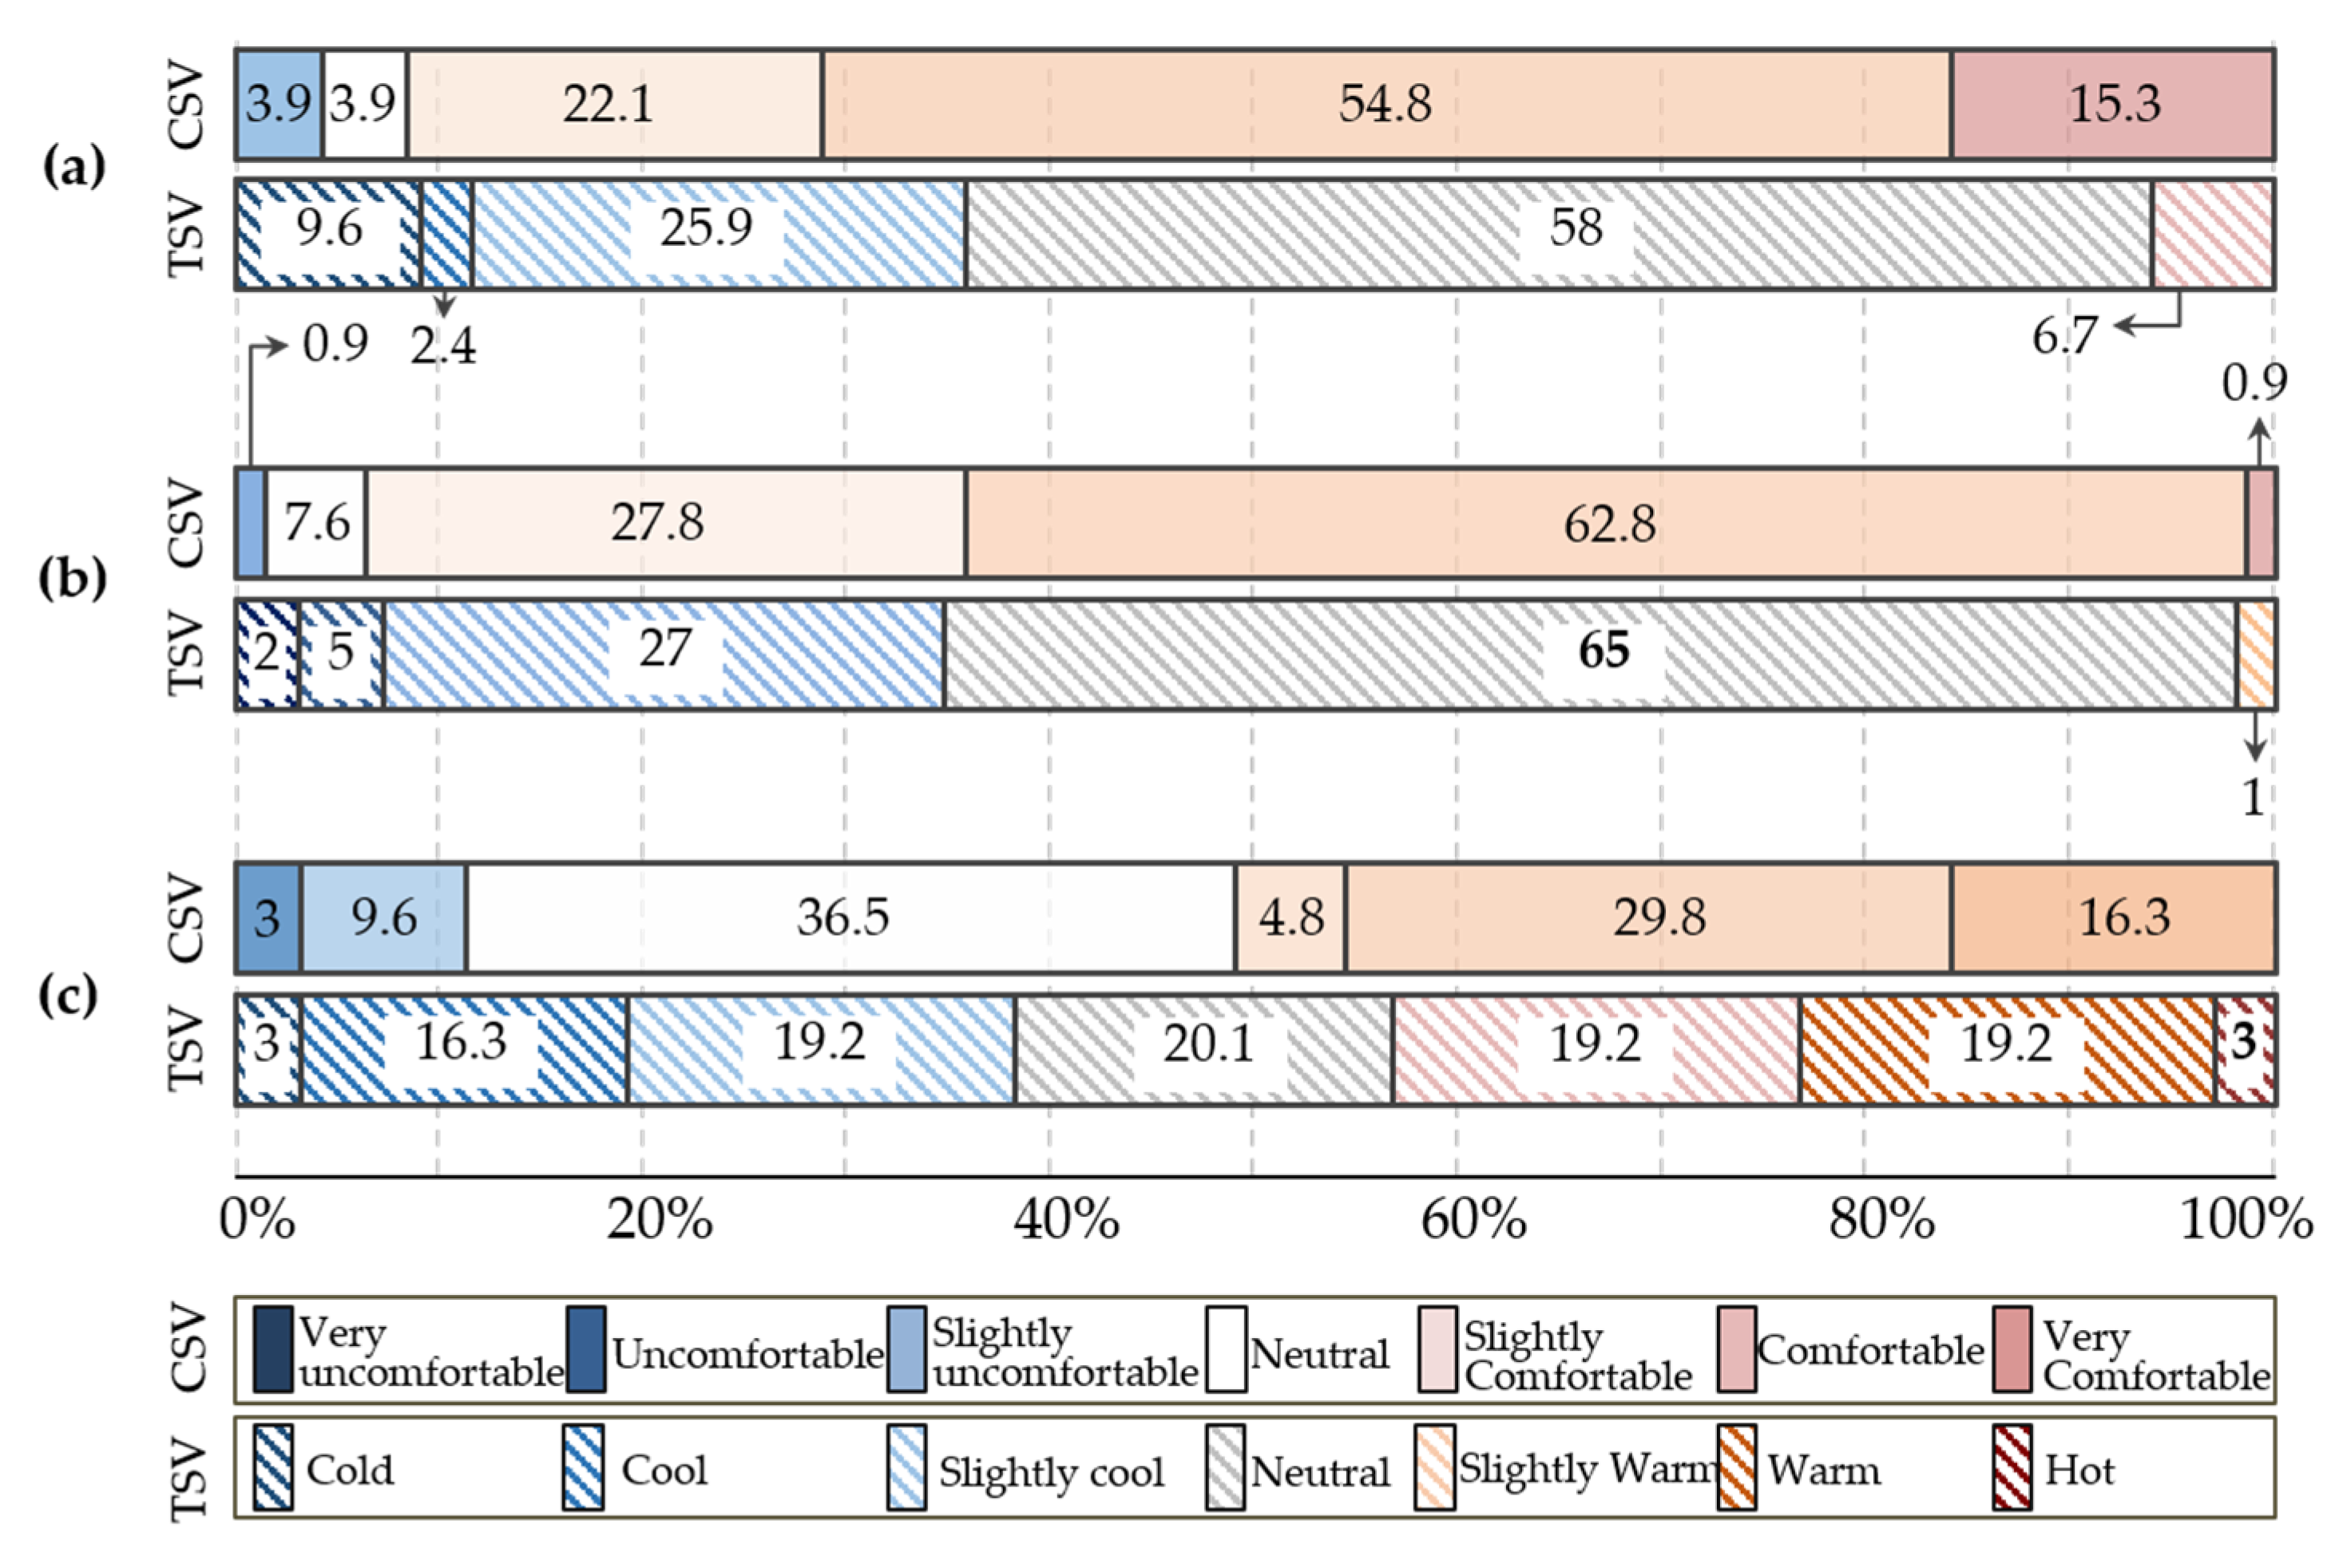
Figure 6.
Comparison of the comfort levels of occupants at various heating, ventilation, and air conditioning (HVAC) operating patterns.: (a) results graph of the control group; (b) results graph of the experimental group A; (c) results graph of the experimental group B.
Figure 6.
Comparison of the comfort levels of occupants at various heating, ventilation, and air conditioning (HVAC) operating patterns.: (a) results graph of the control group; (b) results graph of the experimental group A; (c) results graph of the experimental group B.

Table 1.
Control criteria of the physical indicators.
| Element Item | Experimental Group 1/Temperature and Humidity (A) | Experimental Group 2/PMV (B) | |
|---|---|---|---|
| common standards for thermal environment | ERV system ≧ 0.5 times/h | ||
| control criteria | T 1 = 19 °C | −0.5 < measurement data < + 0.5 | |
| RH 2 = 40% | |||
| control device | ERVs 3, heating | ||
| control device influence | ERVs | RH | RH |
| heating | T | T, PMV | |
| repetition | 6 times/h × 8 h = 48 times/1 day | ||
1 T = Indoor temperature [°C], 2 RH = Relative humidity [%], 3 Energy Recovery Ventilation System.
Table 2.
Questionnaire survey items and evaluation.
| (A) Comfort Sensation Vote (CSV) | ||||||
| very uncomfortable | uncomfortable | slightly uncomfortable | neutral | slightly comfortable | comfortable | very comfortable |
| 1 | 2 | 3 | 4 | 5 | 6 | 7 |
| (B) Thermal Sensation Vote (TSV) | ||||||
| cold | cool | slightly cool | neutral | slightly warm | warm | hot |
| −3 | −2 | −1 | 0 | 1 | 2 | 3 |
© 2020 by the authors. Licensee MDPI, Basel, Switzerland. This article is an open access article distributed under the terms and conditions of the Creative Commons Attribution (CC BY) license (http://creativecommons.org/licenses/by/4.0/).
Share and Cite
MDPI and ACS Style
Kim, S.-K.; Hong, W.-H.; Hwang, J.-H.; Jung, M.-S.; Park, Y.-S. Optimal Control Method for HVAC Systems in Offices with a Control Algorithm Based on Thermal Environment. Buildings 2020, 10, 95. https://doi.org/10.3390/buildings10050095
AMA Style
Kim S-K, Hong W-H, Hwang J-H, Jung M-S, Park Y-S. Optimal Control Method for HVAC Systems in Offices with a Control Algorithm Based on Thermal Environment. Buildings. 2020; 10(5):95. https://doi.org/10.3390/buildings10050095
Chicago/Turabian StyleKim, Sung-Kyung, Won-Hwa Hong, Jung-Ha Hwang, Myung-Sup Jung, and Yong-Seo Park. 2020. "Optimal Control Method for HVAC Systems in Offices with a Control Algorithm Based on Thermal Environment" Buildings 10, no. 5: 95. https://doi.org/10.3390/buildings10050095
Note that from the first issue of 2016, this journal uses article numbers instead of page numbers. See further details here.