Study on Porous Mg-Zn-Zr ZK61 Alloys Produced by Laser Additive Manufacturing

1
Laser Processing Research Center, School of Mechanical and Electric Engineering, Soochow University, Suzhou 215131, China
2
Wuxi Institution of Supervision and Testing on Product Quality, Wuxi 214000, China
*
Author to whom correspondence should be addressed.
Metals 2018, 8(8), 635; https://doi.org/10.3390/met8080635
Submission received: 7 July 2018
/
Revised: 24 July 2018
/
Accepted: 8 August 2018
/
Published: 13 August 2018
Abstract
:This study reports the effect of Zn contents on surface morphology, porosity, microstructure and mechanical properties of laser additive manufacturing (LAM) porous ZK61 alloys. The surface morphology and porosity of the LAMed porous ZK61 alloys depend on the laser energy input. With increasing Zn contents, the surface quality of porous Mg-Zn-Zr alloys became worse, the grains are obviously refined and the precipitated phases experienced successive transitions: MgZn → MgZn + Mg7Zn3 → Mg7Zn3. The microhardness was improved significantly and ranged from 57.67 HV to 109.36 HV, which was ascribed to the fine grain strengthening, solid solution strengthening and precipitation strengthening. The LAMed porous Mg-15 wt.% Zn-0.3 wt.% Zr alloy exhibits the highest ultimate compressive strength (73.07 MPa) and elastic modulus (1.785 GPa).
1. Introduction
As one of the long-standing biological materials, due to their good properties, metal materials have been widely used in orthopedics, prosthodontics and cardiovascular treatment [1,2]. In recent years, magnesium alloys have been regarded as one of the most potential bone tissue engineering materials [3]. As biomedical materials, compared with existing biomedical metal materials, magnesium and its alloys, especially porous magnesium alloys, have a lot of advantages. Firstly, as biodegradable biomaterials, porous magnesium alloys can provide three-dimensional growth space for cells. The three-dimensional pore structure can be useful for the exchange of nutrients and metabolites, can promote tissue regeneration and reconstruction and speed up the healing process [4]. In addition, when served as the temporary implants such as bone needles, bone nails, and so on, magnesium alloys can degrade in the human body to prevent an extra surgery after healing [5]. Finally, by changing the porosity and pore size of the magnesium alloys, the elastic modulus of magnesium alloy implants can match well with that of human bone and the implants and human body can achieve the desired mechanical compatibility due to the elimination of the stress shielding effect [6,7].
At present, the manufacturing methods of porous magnesium alloys mainly include lost-wax casting, powder metallurgy and melt direct foaming. Y. Yamada [8] et al. used lost-wax casting to manufacture a porous AZ91 alloy whose density and compressive yield strength were 0.05 g/cm3 and 0.11 MPa, respectively. C.E. Wen [9] et al. manufactured porous pure magnesium by powder metallurgy. The porosity is between 35% and 55% and the pore size is between 70 μm and 400 μm. When the porosity is 35%, the Young’s modulus is 1.8 GPa and ultimate compressive strength (UCS) is 17 MPa. However, when the porosity reaches 45%, the Young’s modulus is 1.3 GPa and UCS is 16 MPa. S.H. Park [10] et al. adopted melt direct foaming to produce AM60 magnesium foam material and the apparent porosity is 51%. However, the integrity of pore structure is relatively poor. Compared with the dense metal materials, the structure of porous metal is more complicated and the control of the process is stricter. The difficulty of preparing porous metal is to control the distribution and ensure the homogenization of the pores through processing.
Laser additive manufacturing (LAM), as a typical rapid melting and rapid solidification technology that can effectively enhance the performance of metal materials [11,12]. LAM is mainly composed of laser melting deposition (LMD) and selective laser melting (SLM) [13] and the preparation method used in this experiment is SLM technique. The cooling rate during the LAM process can be up to 103–104 K/s [14,15], which results in fine grains of metal parts and grain refinement that can improve the mechanical properties of the materials. Relative to the traditional preparation methods, the experimental materials which can be used by LAM are wide [16]. LAM can form complex parts and the mechanical properties of the forming parts are excellent, meanwhile, the product precision and purity are high. Moreover, the production cycle is short and no post processing is required. Above all, for porous materials, adjusting the laser processing parameters can adjust the pore size, thus changing the porosity of the materials [17,18].
There are many methods regarding the fabrication of porous biomaterials, especially for porous metals/alloys. For example, commercially pure titanium (CP-Ti) and Ti–TiB composite parts with three different porosity levels (i.e., 10%, 17% and 37%) were produced by selective laser melting (SLM) [19]. Scanning electron microscopy (SEM) investigations show that martensitic (α′) microstructure exists in SLM-processed CP-Ti parts, whilst SLM-processed Ti–TiB composites present needle-shape TiB particles distributed in α-Ti matrix. Mechanical properties of these porous samples decrease with an increase in porosity level. It was evident that the mechanical properties, i.e., Young’s modulus and compressive strengths, of the porous samples exhibited reducing trend with increasing of porosity levels. On increasing the levels of porosity, porous CP-Ti samples showed a typical three-stage compressive behavior of porous metals [19]. For 37% porous CP-Ti samples, unlike corresponding Ti-TiB composite samples, ideal compression behavior of porous metals was observed. Also, the elastic moduli of both 37% porous CP-Ti and Ti–TiB samples are similar to that of human bone [19].
H. Attar also presented the results of using SLM to produce CP-Ti parts starting from powder with a wide grain size range up to 100 μm [20]. Accurate manipulation of SLM manufacturing parameters were applied to produce nearly full dense (>99.5%) CP-Ti parts without any post-treatments [20]. The effect of chemical composition on microstructure and tensile properties of a series of low modulus Ti-Nb-Cu-Ni-Al alloys was studied [21]. The morphology of the intermetallic phases is strongly affected by composition [21]. Due to the composite microstructure, the alloys exhibit a low Young's modulus (77–84 GPa) together with a high yield strength of about 1000 MPa as well as moderate tensile ductility [21]. The results demonstrate that complete substitution of Al by Ti reduces the Young's modulus by 5%. Increasing Nb content at the expense of Ti causes a significant improvement of tensile ductility [21]. A group of Ti-xNb-7Fe (x = 0, 1, 4, 6, 9, 11 wt.%) alloys was designed and produced by cold crucible levitation melting process [22]. The microstructural characteristic of the alloys with Nb addition and its effect on their mechanical properties as well as wear resistance were investigated [22]. It is proposed that increasing the Nb content enhances β phase stability and its proportion in the microstructure of the designed alloys. Depending on the proportion of β and α” phases, Ti-xNb-7Fe alloys show varied hardness (3.57–5.92 GPa) and compressive strength (1990–2093 MPa). Among the studied alloys, Ti-11Nb-7Fe with β phase microstructure, presents the lowest elastic modulus (86 GPa) and the highest compressive strain (41.5%) along with high compressive strength, hardness and wear resistance. Therefore, it is suggested that this β-type Ti-11Nb-7Fe alloy is a promising candidate, more suitable than the commercially used CP-Ti and Ti-6Al-4V, for orthopedic applications [22].
ZK61 with a nominal composition of Mg-5.2 wt.% Zn-0.3 wt.% Zr is one of the new types of magnesium alloys with excellent strength [23], which has been extensively studied lately. Zn is not only one of the important alloying elements of magnesium alloys, but also the essential element that the human body usually needs. Zr is an alloying element in magnesium alloys and it has no obvious toxicity to the human body. At the same time, Zr can refine the grain size of magnesium alloys evidently [24], which could improve the properties of magnesium alloys. K.W. Wei [25] et al. adopted SLM technique to prepare ZK60 (Mg-5.2 wt.% Zn-0.5 wt.% Zr) samples and the change in compositions results in the refined microstructure and relatively higher microhardness, which can compare with that of the wrought ZK60. C.J. Shuai [26] et al. studied the formability, microstructure, mechanical properties of the laser melted ZK60 with different energy input. Y. Yang [27] et al. adopted powder metallurgy to fabricate Mg-Zn alloys and they mentioned that Mg-Zn alloys were suitable for the human body when Zn content is no more than 14.5 wt.%. So far, there are lack of researches on porous Mg-Zn-Zr alloys added with different Zn content fabricated by LAM.
In the present work, ZK61 alloy powder was used as the original material, and then Zn powder was added to prepare Mg-Zn-Zr mixed powders with Zn content of 15 wt.% and 30 wt.%. The effect of different Zn content on surface morphology, porosity, microstructure and mechanical properties of porous Mg-Zn-Zr alloys produced by LAM were investigated systematically.
2. Materials and Methods
2.1. Materials Preparation
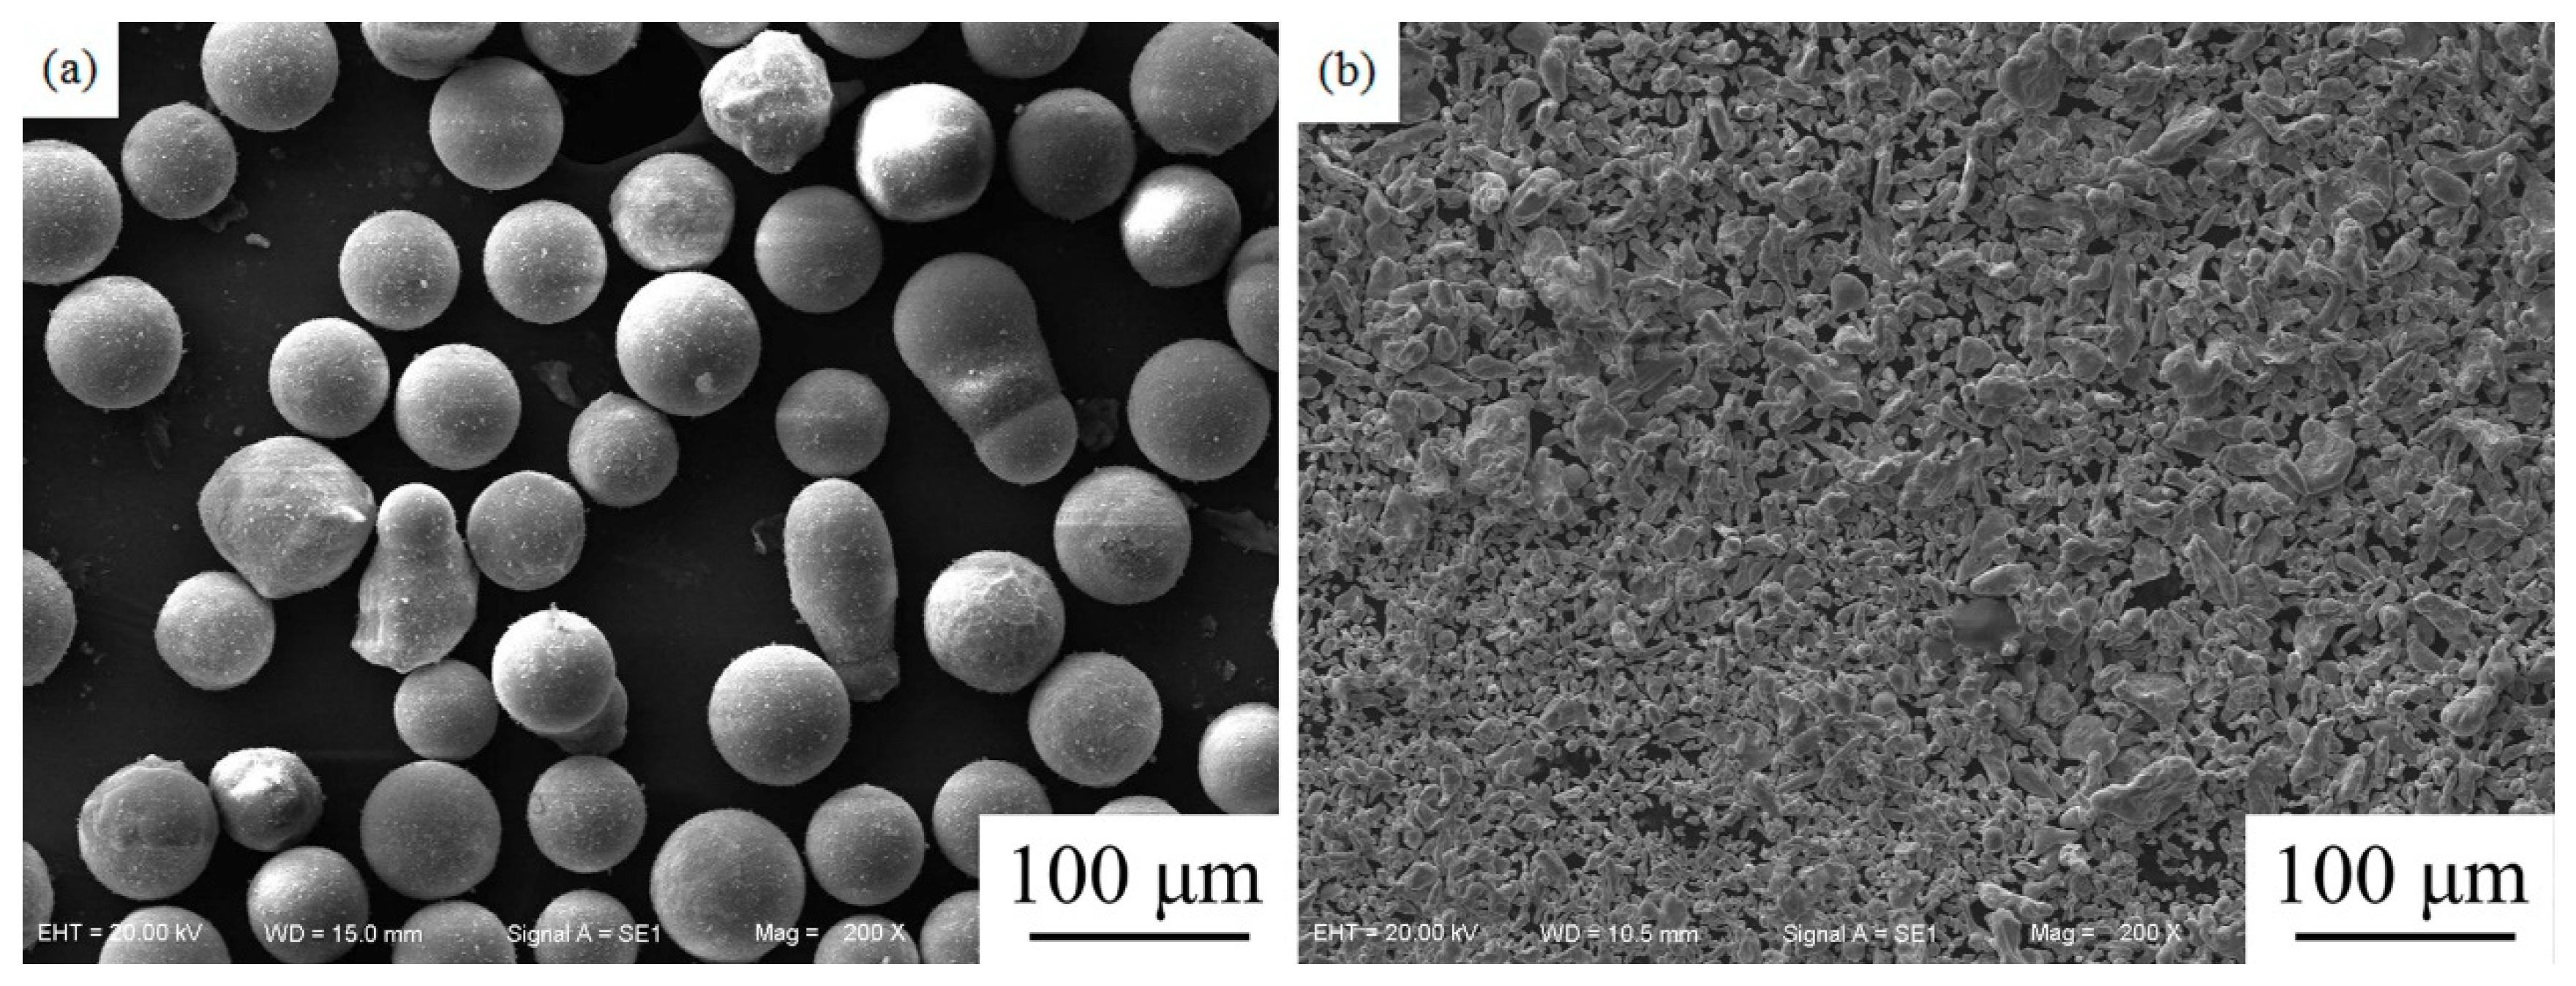
Commercial spherical gas atomized ZK61 alloy powder (Mg-5.2 wt.% Zn-0.3 wt.% Zr) and the Mg-x wt.% Zn-0.3 wt.% Zr mixed powder (x = 15 and 30) were used as the original materials in LAM experiment. As can be seen from Figure 1a, ZK61 powder particles are regular spherical and the mean particle size is 50 μm. Figure 1b presents the morphology of Zn powder particles, whose shape was irregular, and the particle size is between 5 μm and 30 μm. The two kinds of powder were mixed together according to ZK61: Zn weight ratio of 89.7:10.3 and 73.9:26.1 in a rotary ball mill with an argon atmosphere for 24 h. The abbreviations of Mg-Zn-Zr powders with different compositions are summarized in Table 1.
2.2. LAM Process
The samples were prepared on a LAM system, which mainly consisted of a Nd, YAG pulse laser (MD-FOCUS 0300, Laser Processing Research Center, Soochow University, Suzhou, China), a computer system, a workbench and protective argon gas. Details about the LAM system (A method named selective laser melting process, i.e., SLM) and laser processing could be found in our previous publication [28]. The laser parameters used in LAM process were finally determined after a series of pre-experiments, which were summarized in Table 2. To better express laser energy input, six different energy density E of 764 J/mm3, 892 J/mm3, 1019 J/mm3, 1146 J/mm3,1273 J/mm3 and 1400 J/mm3 could be calculated by [29]
where P is the laser power, V is the scanning speed and t is the layer thickness and the scanning space (known as the hatching distance (h). Laser power has considerable influence on the resulting microstructure. Generally, increasing the laser power causes a significant increase in the processing temperature, whereas the temperature is slightly reduced with increased laser scanning speed. The laser power is located on numerator and usually may be changed largely on the numerical value when compared to the scanning speed value (the same situation for powder thickness and hatch distance) located in denominator. So, in the present study, we only changed laser power to study the influence of energy density on the microstructure, mechanical properties of the obtained samples [30].
The laser parameters used in the LAM process were finally determined after a series of pre-experiments, which were summarized in Table 2. The cubic specimens with a size of 6 × 6 × 9 mm3 were prepared on a ZM5 (A magnesium alloy in China Trademark Registration, the composition and properties are similar to AZ91) plate.
2.3. Microstructure and Composition Characterizations
After the LAMed samples were removed from the substrate plate, the porosity of the samples was measured by Archimedes Principle [31]. The prepared metallography samples were ground, polished and following etched using an acetic-picral solution (10 g picric acid, 26 mL acetic acid, 140 mL ethanol and 24 mL distilled water) for 10 s. The surface morphology and microstructure of the samples were characterized by S4700 (Hitachi, Hitachi, Japan) and Sigma scanning electron microscopy (SEM) (Hitachi, Hitachi, Japan). The composition and element distribution were analyzed by SEM with energy dispersive spectroscopy (EDS) (Oxford Instruments, London, UK). The phase composition was identified by X-ray diffraction (XRD: X’-Pert-Pro MPD) (GE Measurements&Control, Seifert, Germany).
2.4. Mechanical Properties
The microhardness of the samples was measured by a microhardness tester (HXD-1000TMC/LCD)(Shanghai Optical Instrument Factary, Co., Ltd., Shanghai, China) with the load of 50 g and the indentation time of 10 s. The microhardness value is the average value of 20 points selected from the sample surface. The compression tests of LAMed samples were performed by RGM-4100 type Electro-mechanical universal testing machine (Shenzhen Reger Instrument, CO., Ltd., Shenzhen, China) and the compression speed was 0.5 mm/min. The schematic diagrams of compression tests were shown in Figure 2, and after compression tests, the fracture morphologies were observed by SEM.
3. Results and Discussion
3.1. Surface Morphology and Porosity
ZK61 (E1) alloy powders were used to determine the laser processing parameters for the preparation of LAMed samples, and the laser processing parameters adopted in this experiment are listed in Table 2. The surface morphologies of LAMed porous ZK61 deposited at different E values are shown in Figure 3. It can be seen that the surface morphologies varied obviously and directly depend on the laser energy input. At a low E of 764 J/mm3, the laser energy is so low that ZK61 powders cannot be melted completely and the “balling effect” [32] and “glue powder phenomenon” on the surface of the samples are serious. With the increasing E at 892 J/mm3, the “balling effect” and “glue powder phenomenon” ease, and when E is between 1019 J/mm3 and 1146 J/mm3, the surface quality of the samples is relatively high. However, with a high E of 1273 J/mm3, excessive laser energy makes the sample surface become rough and uneven. This phenomenon can be explained using the following theory. Due to the lower melting point and boiling point of the magnesium alloy, lower energy input also can adequately melt ZK61 powders to form molten pool, which then absorbed the most of the remaining energy. As a consequence, the temperature of the molten pool quickly reached the boiling point of ZK61 (about 1107 °C). The extremely high vapor pressure (more than 51 KPa) [33] caused by high temperature will make the sample surface rough and uneven. According to Figure 3, the optimum energy density for the preparation of porous ZK61 alloys was 1146 J/mm3.
As can be seen from Figure 3, besides the reserved aperture, there are plenty of regular circular or oval holes on the surface of all the samples and the size of these holes is 150–200 μm. It is because that the laser mode adopted in this experiment is pulse laser. The pulse laser has a Gaussian distribution and the instantaneous energy is very high [34], which caused ZK61 powders to evaporate into gas to escape from the sample surface.
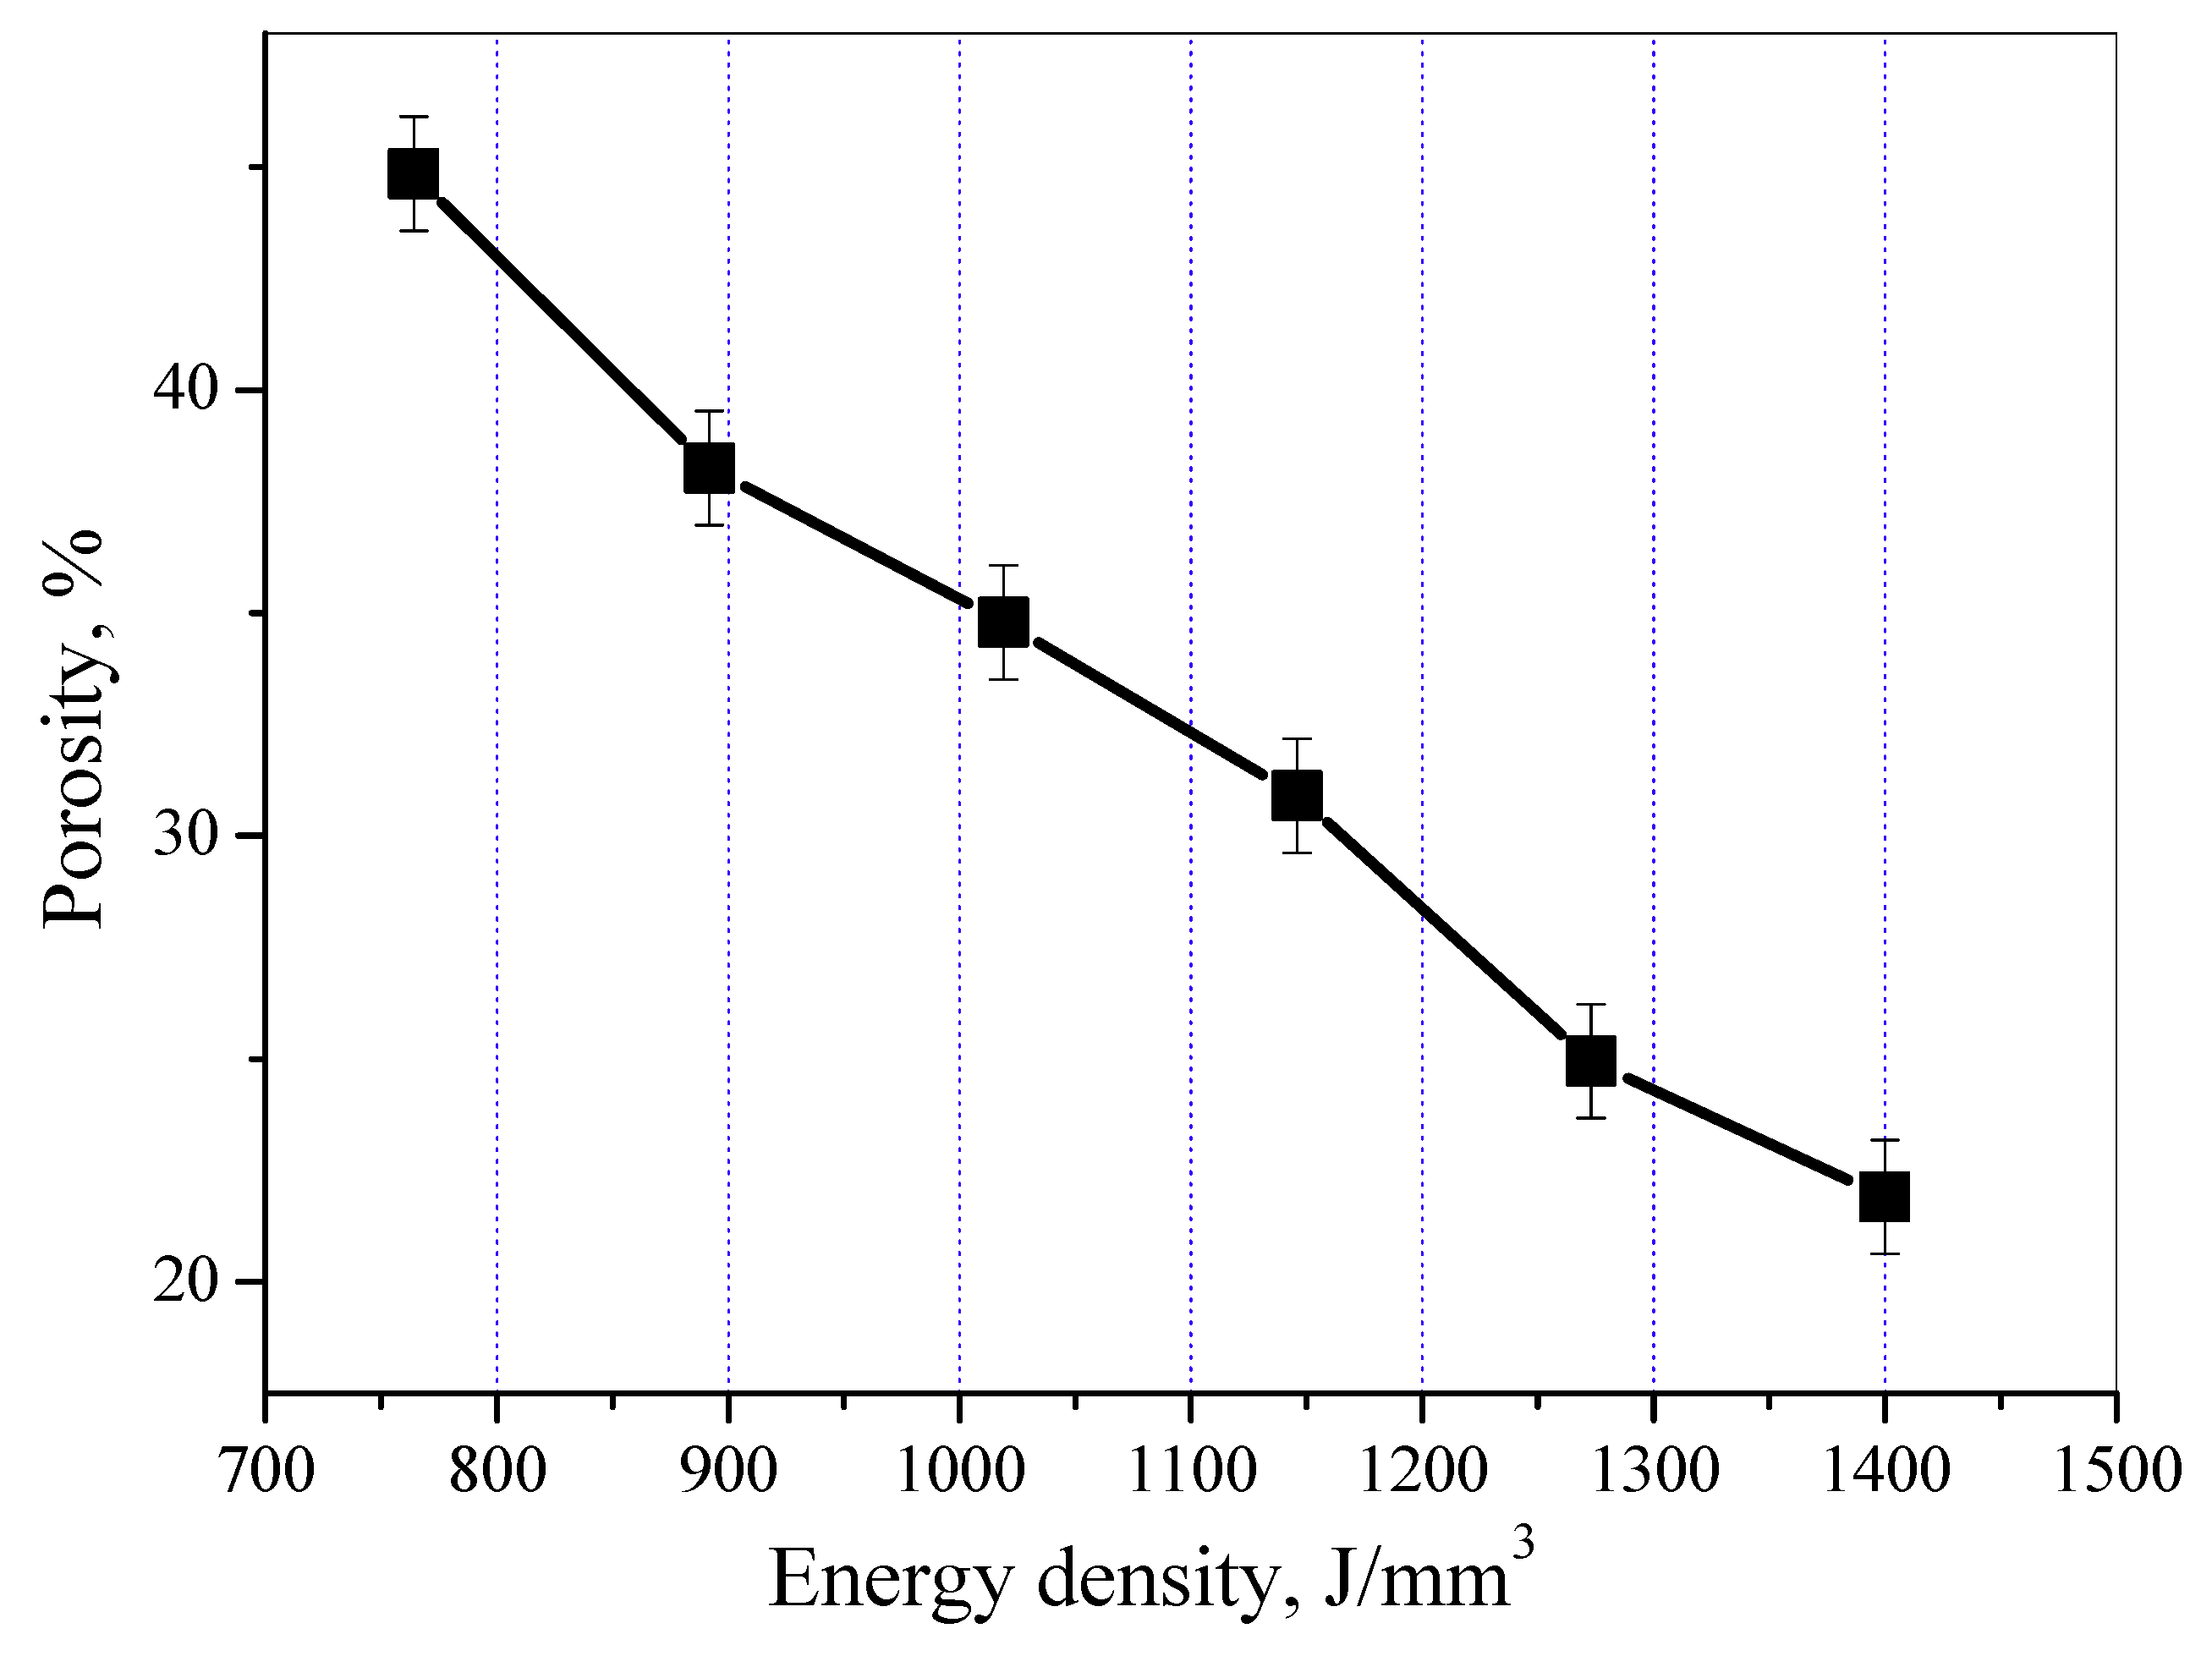
Figure 4 presents the porosity of porous ZK61 alloys at different E. With the increase of E, the melting track of the samples is widened and the porosity is reduced. On the contrary, when E increases from 1273 J/mm3 to 1400 J/mm3, the porosity changes marginally, which demonstrates that when E reaches a certain value, the preset metal powders have been melted and solidified completely and the width of the melting track has reached a certain value, eventually resulting in such a phenomenon.
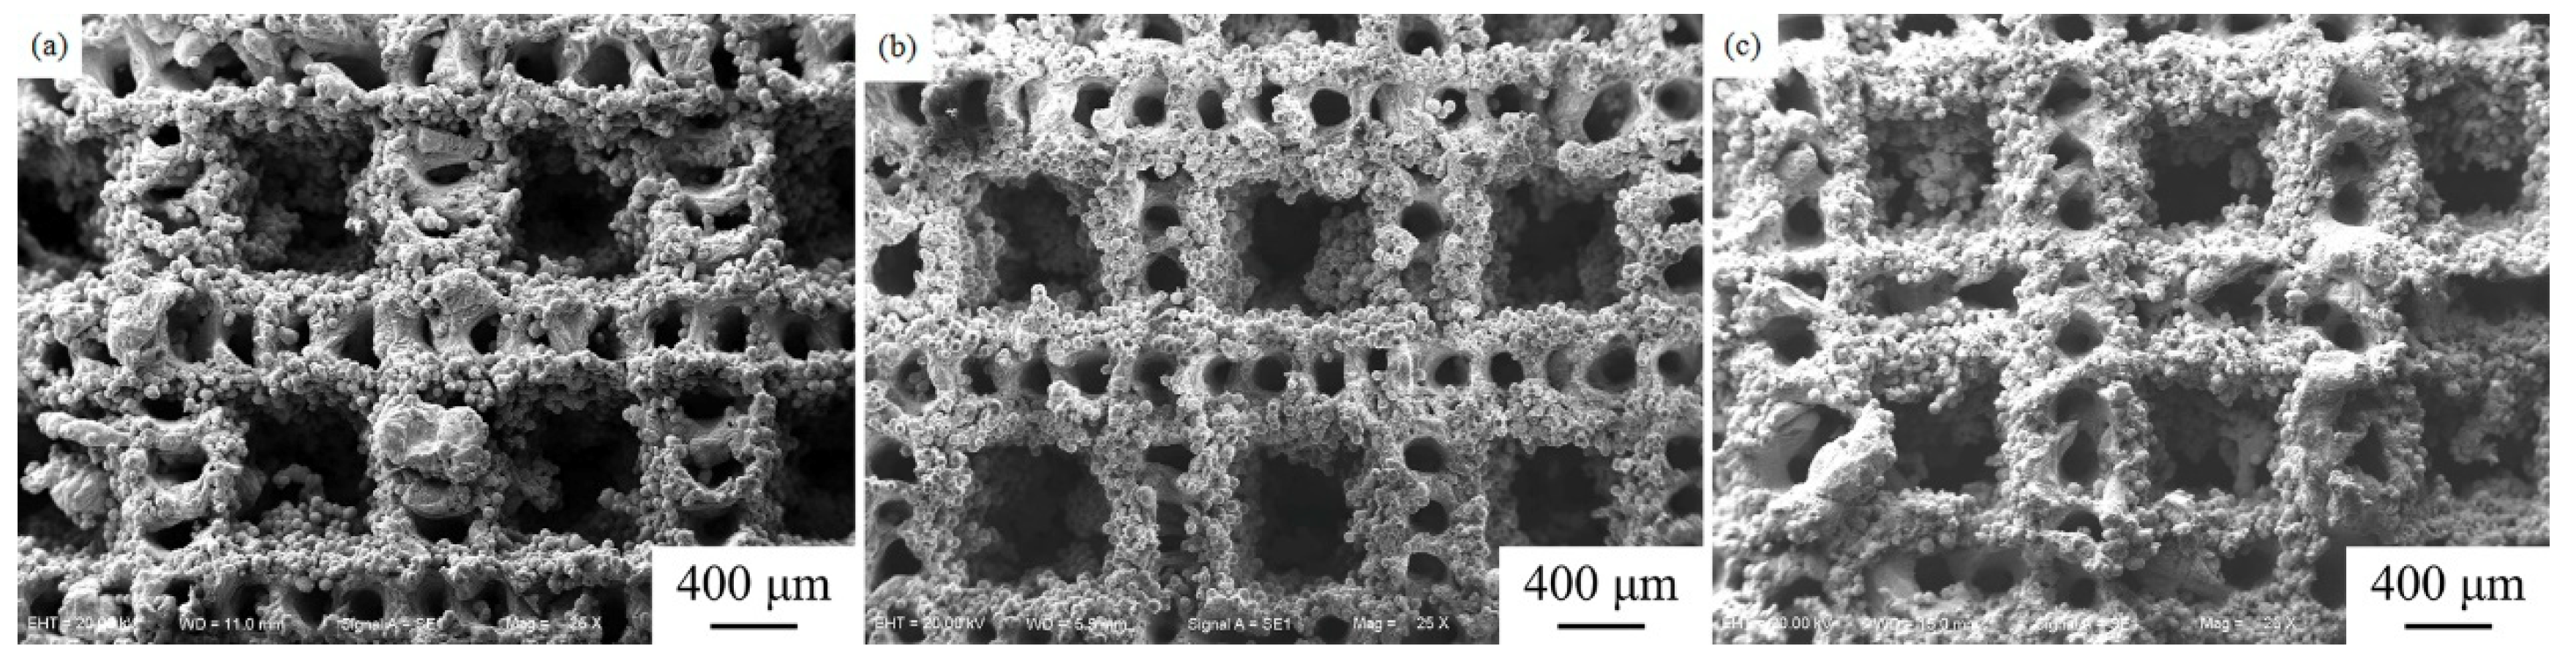
Comparing the surface morphologies of the above samples, E selected in this experiment was determined as 1146 J/mm3. Figure 5 shows the surface morphologies of different Mg-Zn-Zr alloys with E of 1146 J/mm3. It can be seen that with the increasing Zn content, the surface quality of porous Mg-Zn-Zr alloys becomes worse and there is a more serious collapse in E3 sample, which may have an adverse effect on its mechanical property. E1, E2 and E3 samples have little difference in porosity, which is between 28.94% and 30.90%.
3.2. Microstructure, Phase and Composition
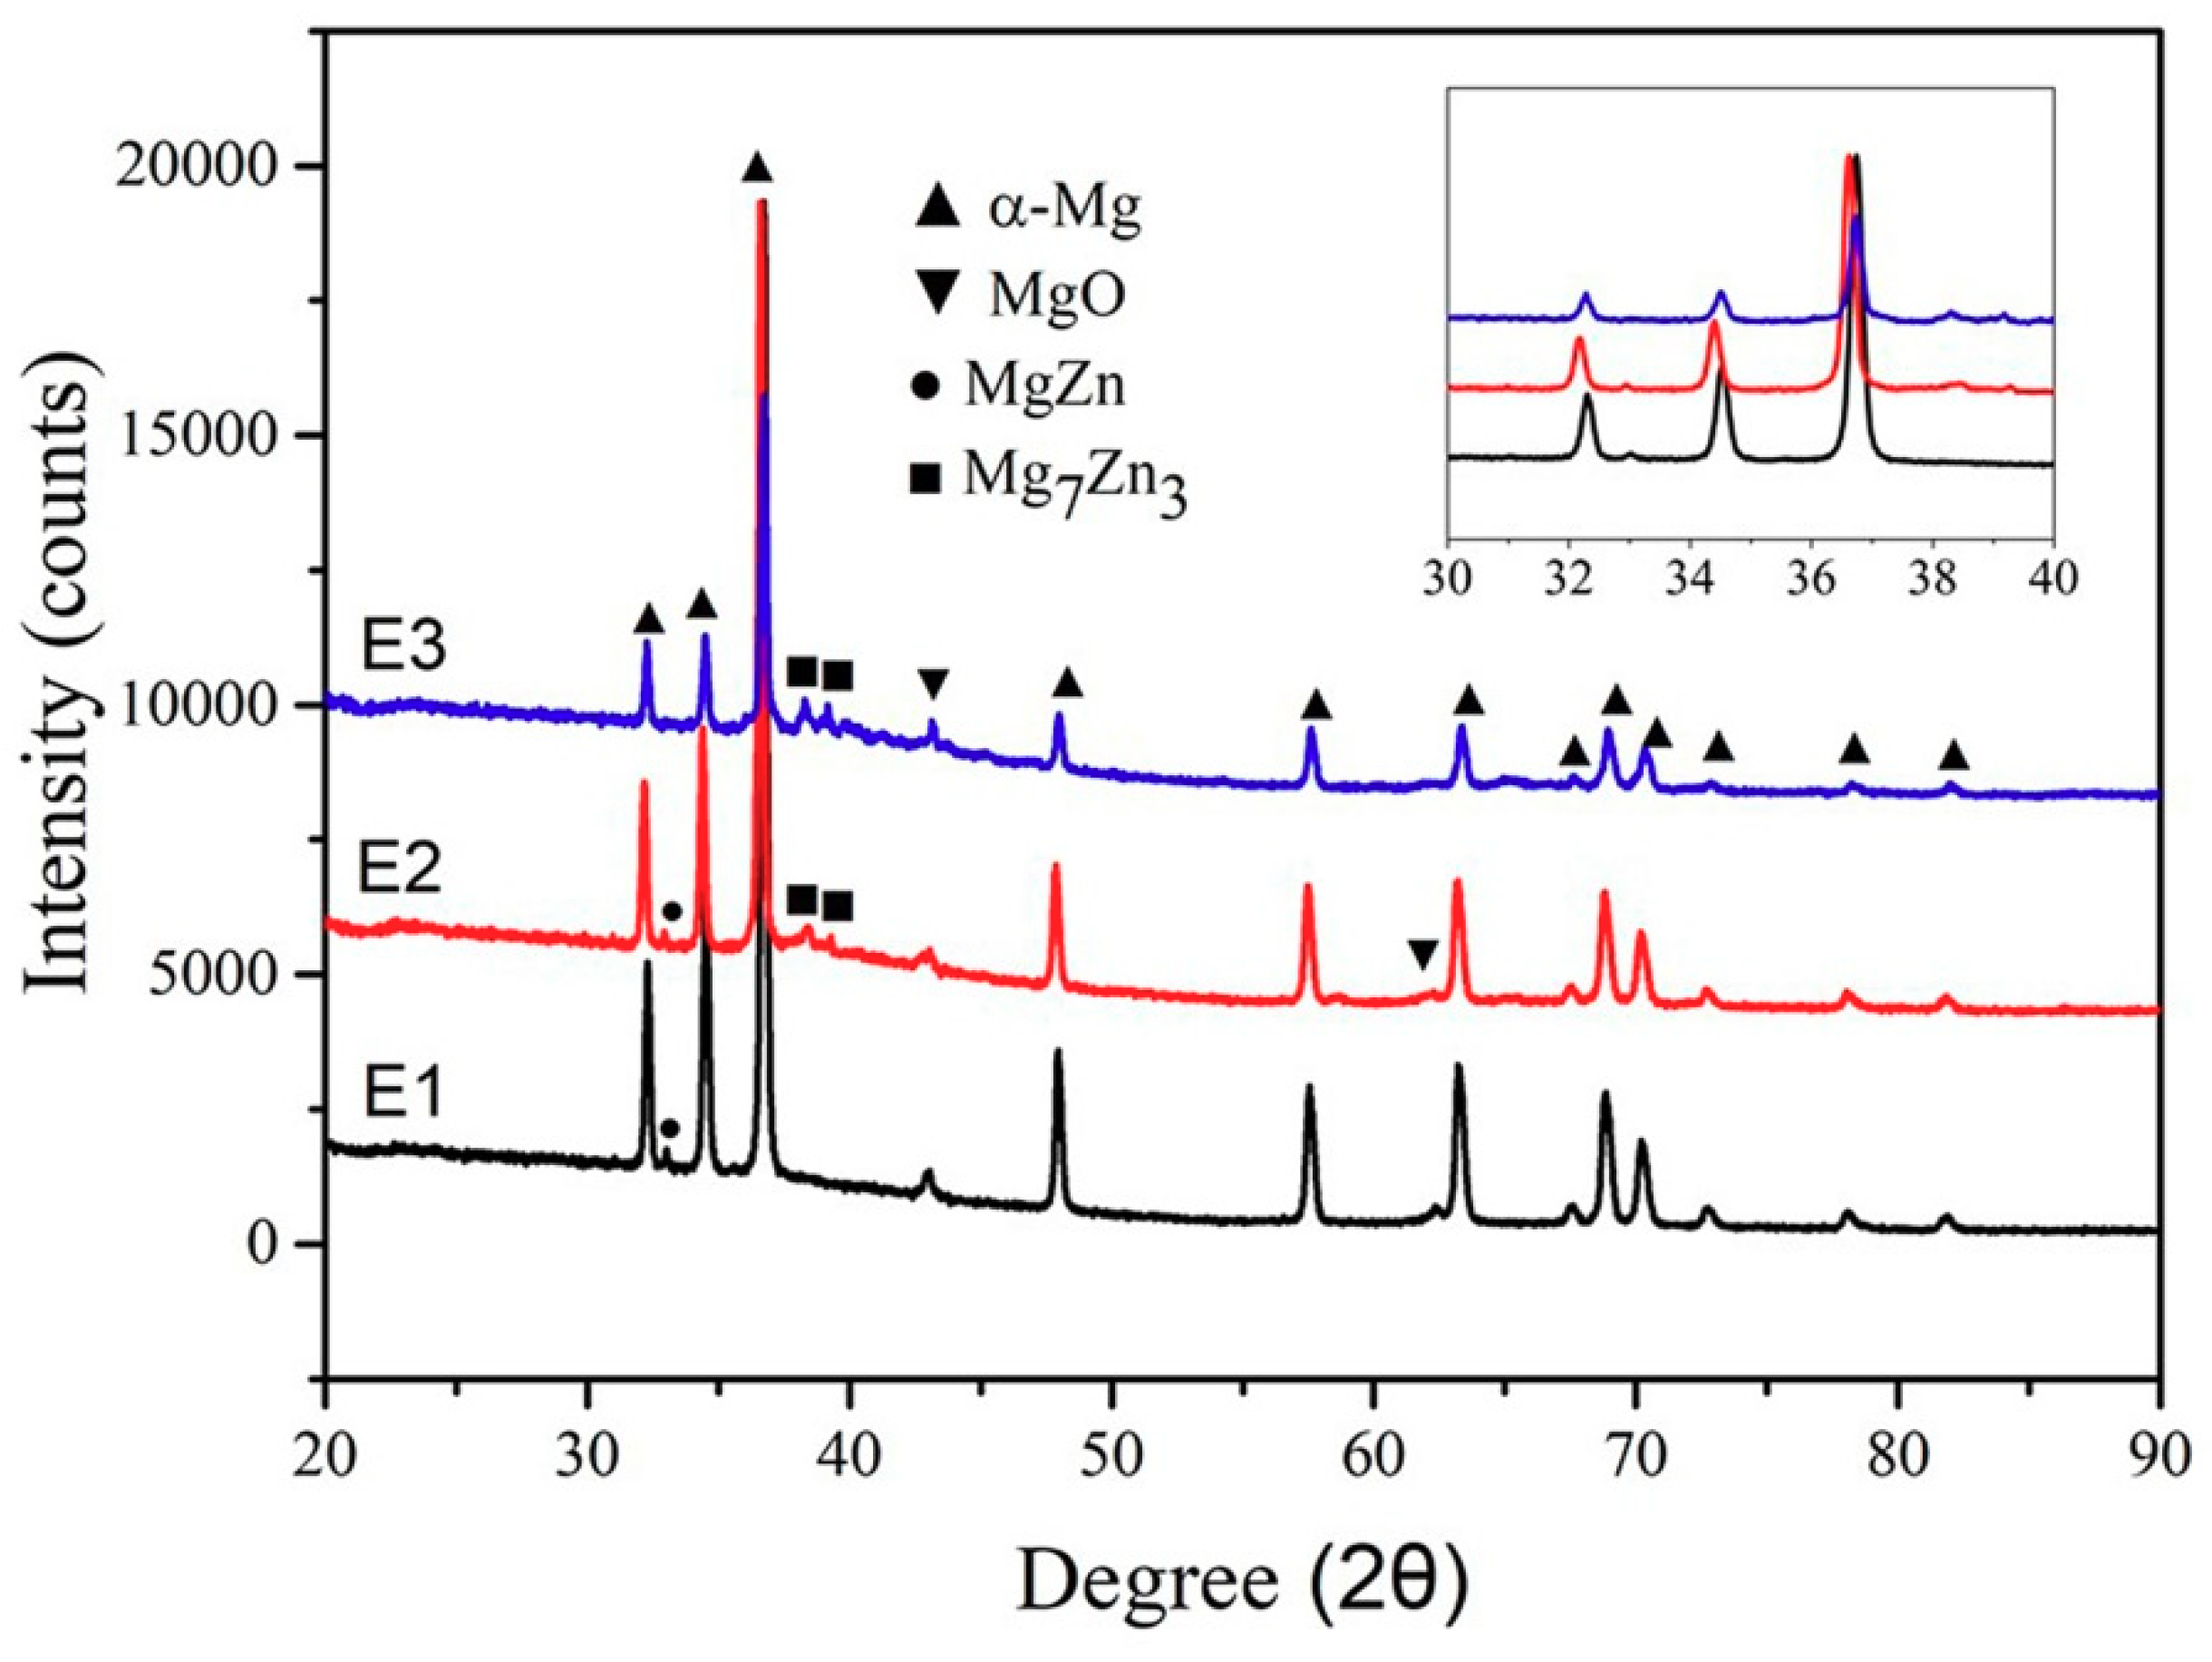
XRD patterns of LAMed porous Mg-Zn-Zr alloys with a wide 2θ = 20–90° are presented in Figure 6. The insert figure is a plane view XRD for 30–40°. E1 was composed of α-Mg, MgO and lesser MgZn phases. When Zn content reached 15 wt.%, besides α-Mg, MgO and MgZn phase, Mg7Zn3 peaks were detected. With further increase of Zn content, MgZn phase almost disappeared and the diffraction intensity of Mg7Zn3 phase increased in E3. It can be inferred that as the Zn content increases, the Mg7Zn3 phase increases as well. Since the content of Zr is less, no phases with respect to Zr were detected.
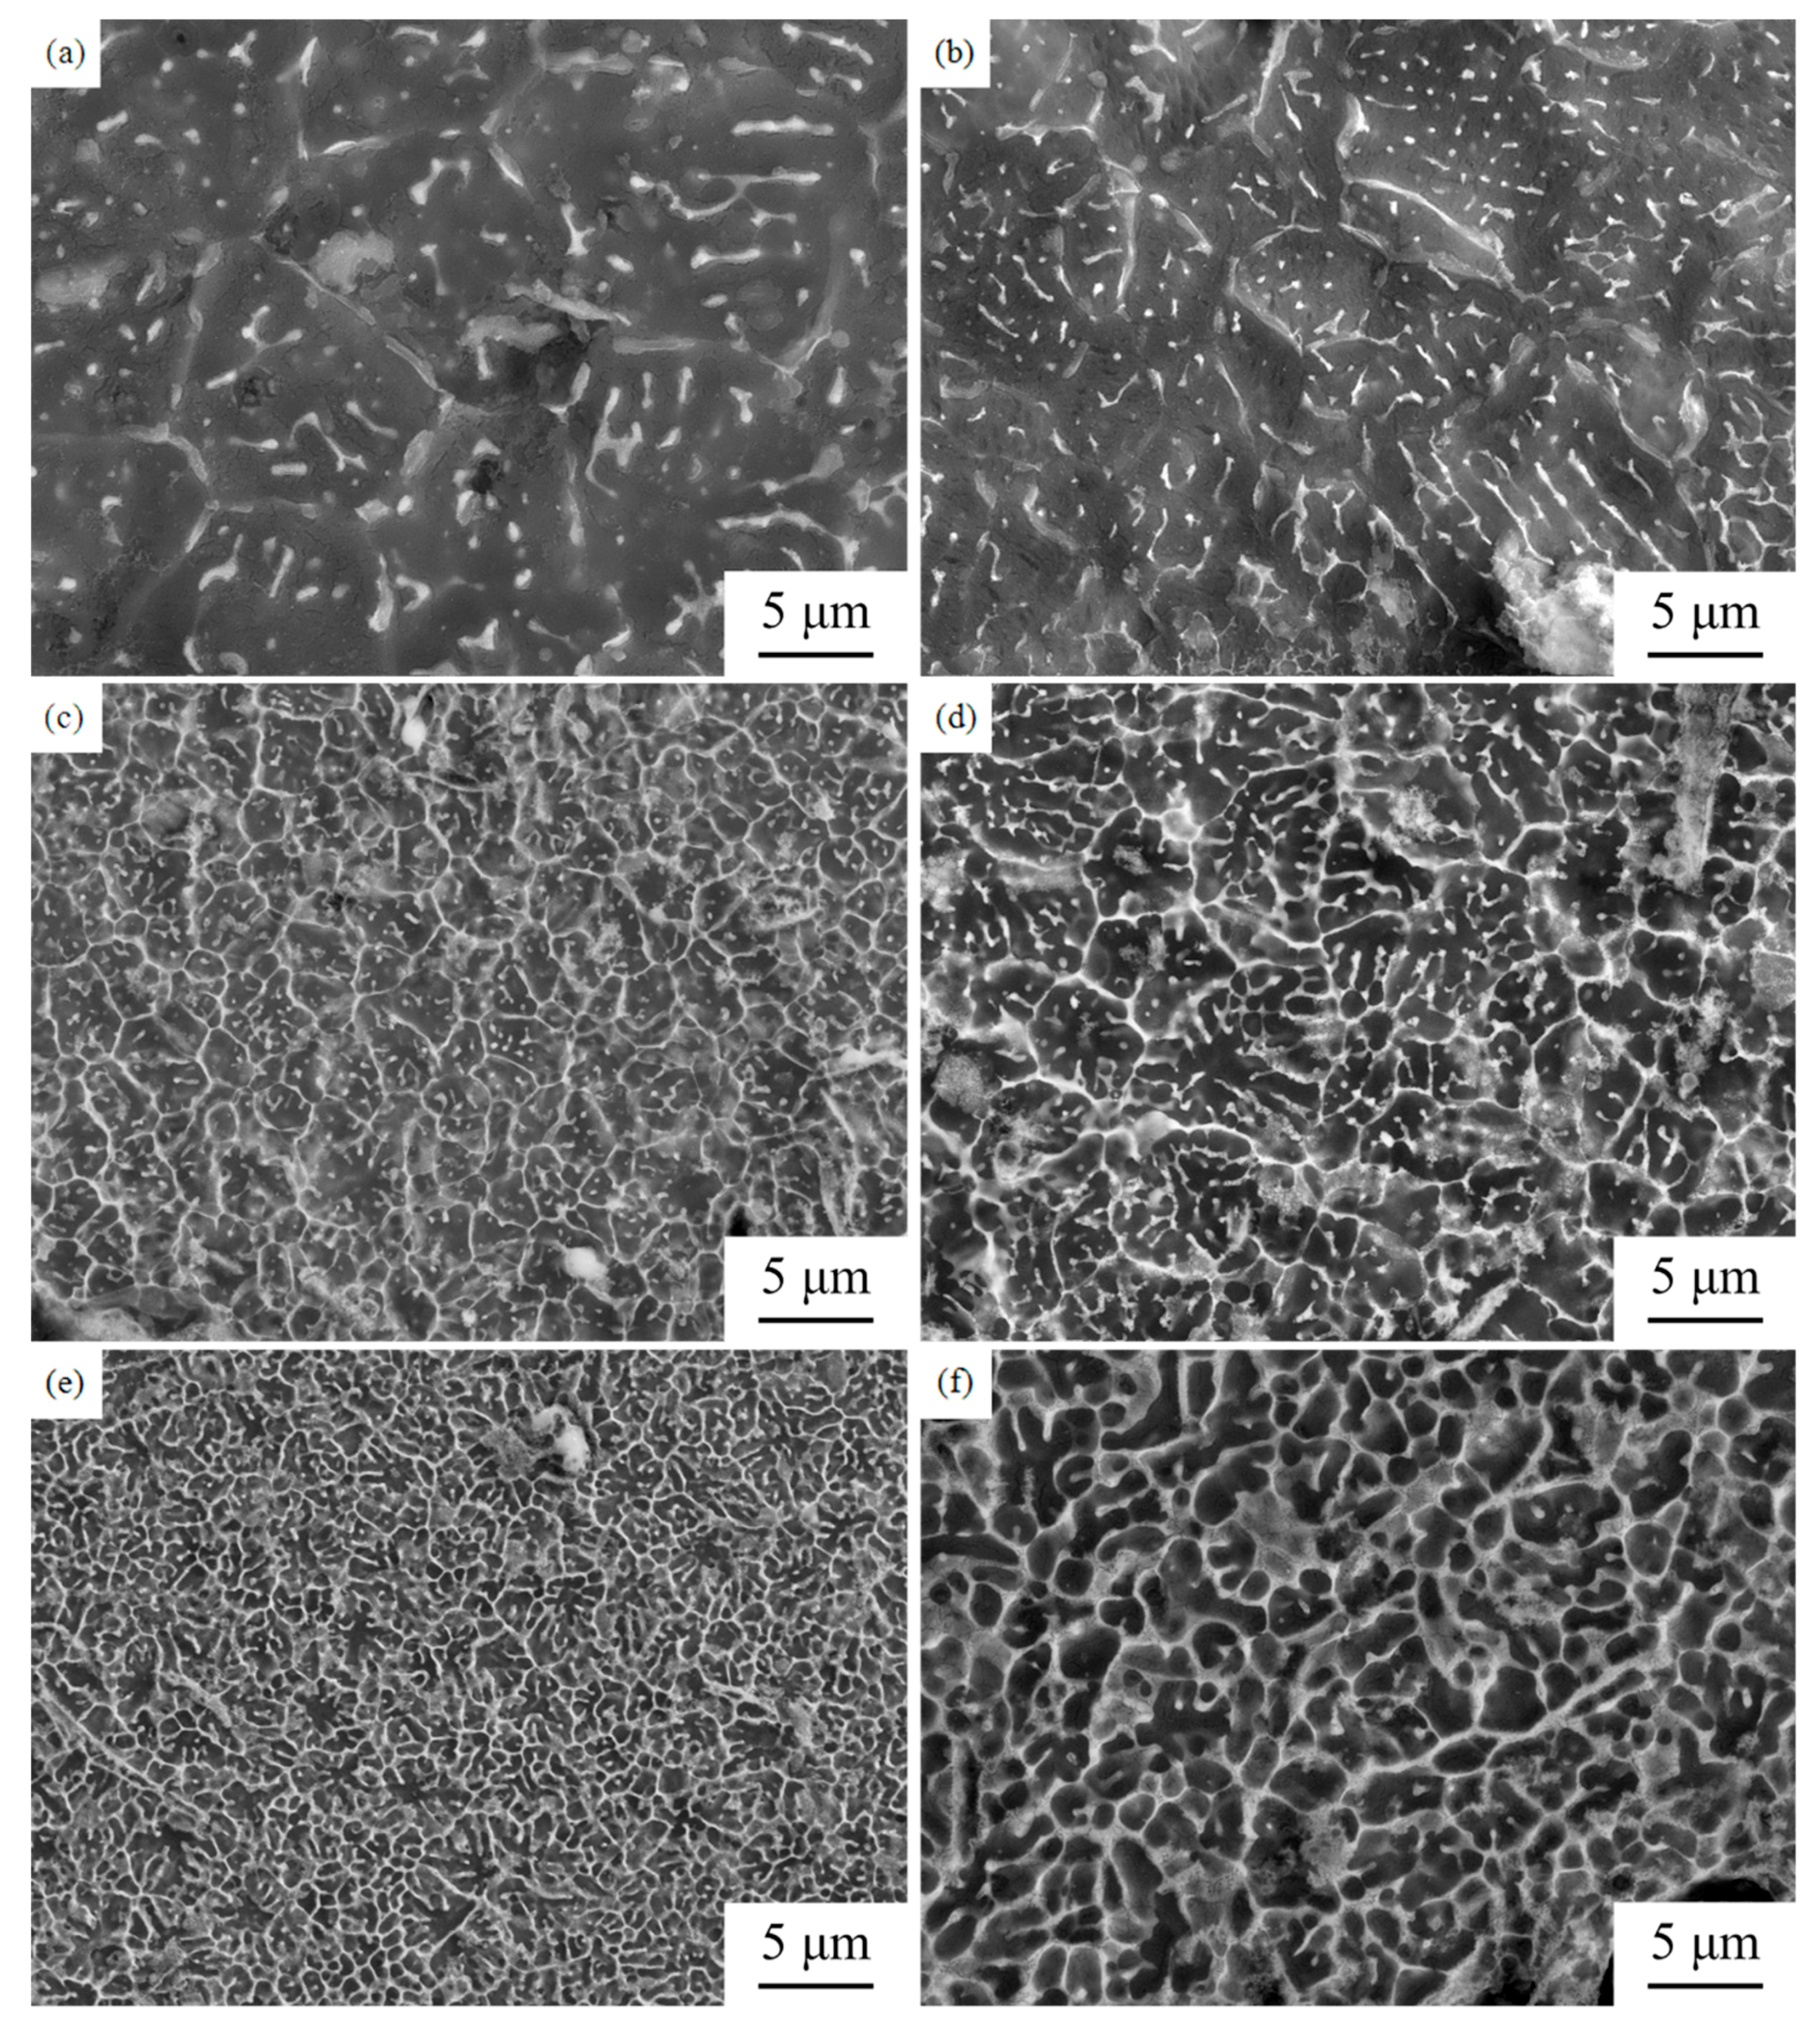
Figure 7 presents SEM micrographs of the molten pool of the LAMed Mg-Zn-Zr alloys, and the corresponding grain size was measured using the intercept method [35]. SEM micrographs of the cross section and longitudinal section of LAMed E1 are shown in Figure 7a,b. Besides the particle/rod-like phases formed inside the grains, there are a small number of phases distributing along the grain boundary. As can be seen from Figure 7c,d, relative to E1, the grain boundary precipitates of E2 increase obviously, and there still exists a large number of particle/rod-like phases inside the grains. In Figure 7e,f, the microstructure of LAMed E3 presents a characteristic of equiaxed α-Mg with fully divorced eutectic distributing reticularly along the grain boundary, however, the particle/rod-like phases inside the grains almost completely disappeared and this phenomenon would be discussed later.
Table 3 lists the average grain size of the molten pool of the samples. Based on the results of the measurement and calculation, with the increasing Zn content, the grain size of Mg-Zn-Zr alloys has been obviously refined (cross section: 6.1 μm → 2.3 μm → 1.1 μm, longitudinal section: 5.2 μm → 2.9 μm → 1.6 μm), and the transit order of intermetallic phase was MgZn → MgZn + Mg7Zn3 → Mg7Zn3. As a high temperature phase, the appearance of Mg7Zn3 phase was attributed to the rapid solidification during the LAM process limited its decomposition (Mg7Zn3 → α-Mg + MgZn). The appearance of Mg7Zn3 phase revealed that the solidification rate of the molten pool increases with the increasing Zn content. Therefore, this proves that as the Zn content increases, the grain size has been significantly refined.
Recent papers [36,37] demonstrated that dendritic microstructural evolution during the solidification of Mg-Zn alloys was investigated as a function of Zn concentration using in situ synchrotron X-ray tomography (Shanghai Synchrotron Radiation Facility, Shanghai, China). They reveal that increasing Zn content from 25 wt.% to 50; wt.% causes a Dendrite Orientation Transition (DOT) from a six-fold snow-flake structure to a hyper-branched morphology and then back to a six-fold structure. This transition was attributed to changes in the anisotropy of the solid-liquid interfacial energy caused by the increase in Zn concentration [36,37]. Further, doublon, triplon and quadruplon tip splitting mechanisms were shown to be active in the Mg-38 wt.% Zn alloy, creating a hyper-branched structure. Using the synchrotron tomography datasets, we quantify, for the first time, the evolution of grain structures during the solidification of these alloys, including dendrite tip velocity in the mushy zone, solid fraction, and specific surface area. Using 4D synchrotron X-ray tomography, the dendritic growth dynamics of primary α-Mg grains during the solidification of Mg-Zn alloys with various Zn concentrations was investigated both qualitatively and quantitatively. These in situ observations demonstrate conclusively that a dendritic morphology transition occurs in Mg-Zn alloys. This finding, along with prior similar findings in fcc Al, strongly supports the hypothesis that Zn modifies the anisotropy in interfacial energy in alloy systems that have inherently weak anisotropy in interfacial energy (e.g., Mg, Al). Analysis of the time resolved 3D images allowed the first quantification of the microstructural evolution of Mg-Zn alloys during solidification, including: solid fraction ((fs ), dendrite tip growth velocity (Vtip), and specific surface area (Sv ). The fs variations with temperature were found to correlate well with lever rule. Dendrite tip growth was found to decelerate continuously with solidification time, and dendrite tip growth as a mechanism of dendrite morphology evolution was found to dominate only at a very early stage of solidification. The evolution of Sv during dendritic growth demonstrated the rate of dendritic coarsening decreases with increasing Zn concentration. The data was also fit to Cahn and Rath's equation to reveal the evolution of Sv with fs during solidification. These 4D observations provide both the first quantification of dendritic growth dynamics during the solidification of these magnesium alloys, providing a method for both informing and validating numerical models of microstructural evolution, e.g., phase field simulations and cellular automata methods. In particular, for Mg-Zn, a dendrite orientation transition was observed in which seaweed-like α-Mg structures grew for Zn content between 20 and 45 wt.%, while 18-branch (<20 wt.% Zn) and 12-branch (>45 wt.% Zn) morphologies were observed outside this range. In a similar post-mortem X-ray tomography study, Shuai et al. [36] also observed a dendrite orientation transition, however the seaweed structure was not seen until 38 wt.% Zn. These studies showed the possibility to control the dendritic formation patterns of Mg alloys through alloy additions. So, the enhanced solidification rate leads to the refined grain, which will enhance the microhardness.
It is known that ZK series wrought alloys (Mg-Zn-Zr alloy), which are applied widely in industry, possess the greatest precipitation hardening among Mg-based alloys. Since grain size of pure Mg-Zn alloys is very large, Zr is added to refine the grain [38,39]. In Mg-Zn-Zr alloys, Zr can enhance the stability of β1′ phase, and it induces the formation of more stable Mg (Zn, Zr) instead of less stable MgZn2. It is found that Mg (Zn, Zr) even exists at about 300 °C. Therefore, the growth of grain can be prevented by Mg (Zn, Zr) in the hot extrusion at about 300 °C, and finally the grain is refined [40,41]. The refined grain will enhance the hardness form Hall-Petch equation.
Figure 8 shows EDS images of the LAMed Mg-Zn-Zr alloys and Table 4 summarizes EDS results marked A–H in Figure 8. It can be seen that all the samples exist a certain degree of element segregation. The dark regions were α-Mg matrix, where Zn and O content were relatively low. However, the precipitates (bright regions) were rich in Zn and O elements, and Zn content of grain boundary phase were lower than particle/rod-like phase inside the grains. Since there is no systematic Mg-Zn-Zr phase diagram and the Zr content is relatively low, the Mg-Zn-Zr phase diagram can be roughly replaced by the Mg-Zn phase diagram. According the Mg-Zn phase diagram [42] and XRD results, it can be determined that the grain boundary phase of the LAMed Mg-Zn-Zr alloys is Mg7Zn3 phase, while the particle/rod-like phase inside the grain is MgZn phase. Because the diffusion of extraneous O atoms along the grain boundary is faster than that inside the grains [43], the O elements were mainly enriched at the grain boundary. On the basis of the Mg-Zn phase diagram, the limit solid solubility of Zn in α-Mg matrix at the equilibrium state is lesser than 2 wt.%, while the Zn content in α-Mg matrix of E1, E2 and E3 alloys respectively are 6.03 wt.%, 12.05 wt.% and 20.33 wt.%, which is because the rapid cooling effect during LAM process can increase the solubility of Zn in α-Mg. The significant difference in microstructures may lead to a significant difference in mechanical properties like microhardness and compressive performance.
From Table 4 and Figure 8, there also can be seen some preferential evaporation. In a recent paper, J. P. Oliveira et al. demonstrated that the extremely high temperatures reached during laser processing promoted preferential Ni evaporation, owing to its higher vapor pressure, resulting in Ni depletion [44]. In a published paper by D. Dubé et al. [45], the measurement of aluminum concentration indicates that, for both the AZ91D and AM60B alloys, there is more aluminum in the laser melted layer than in the substrate. This relative enrichment in aluminum was likely caused by the preferential evaporation of magnesium from the melt pool during laser melting. The aluminum enrichment can explain the presence of superior quantities of β phase in AZ91D alloy after laser melting. In the AM60B, the excess aluminum does not contribute to an increase in β phase but it remains in solid solution. Zinc, which is present as a minor element in AZ91D, was also affected by laser melting, indicates that it has evaporated at a rate relatively higher than magnesium during laser melting. This strong zinc loss occurs because zinc has a vapor pressure one order of magnitude higher than magnesium in the molten state [45]. The concentrations of iron, nickel and copper in the laser melted layer and die cast substrate were compared which have a relatively low vapor pressure could have concentrated during the evaporation in the same way aluminum did. However no significant difference was found in the average concentration of these elements within the laser melted layer and in the substrate. Large variations of manganese concentrations were found within the substrates, and variations were associated with the microsegregation in die cast plates. By contrast, a relatively steady manganese concentration was noted within the laser-melted layer indicating a better distribution of manganese. The average concentration of manganese measured in the melted layer of AZ91D and AM60B alloys indicates that a significant enrichment occurred at the surface of both alloy [45]. The oxidation of the magnesium and zinc vaporized during laser treatment and their subsequent deposition at the surface of the melt pool was suspected to introduce oxygen within the melt pool. The search for localized oxygen contamination within the melted layer has been carried out by EPMA. Linescans in the laser melt pool and at the substrate/melt pool interface failed to reveal any significant difference in oxygen concentrations across the melted layer. In the present study, the preferential evaporation of magnesium and Zn from the melt pool during laser additive manufacturing can be clearly seen from Figure 8 and Table 4.
3.3. Mechanical Properties
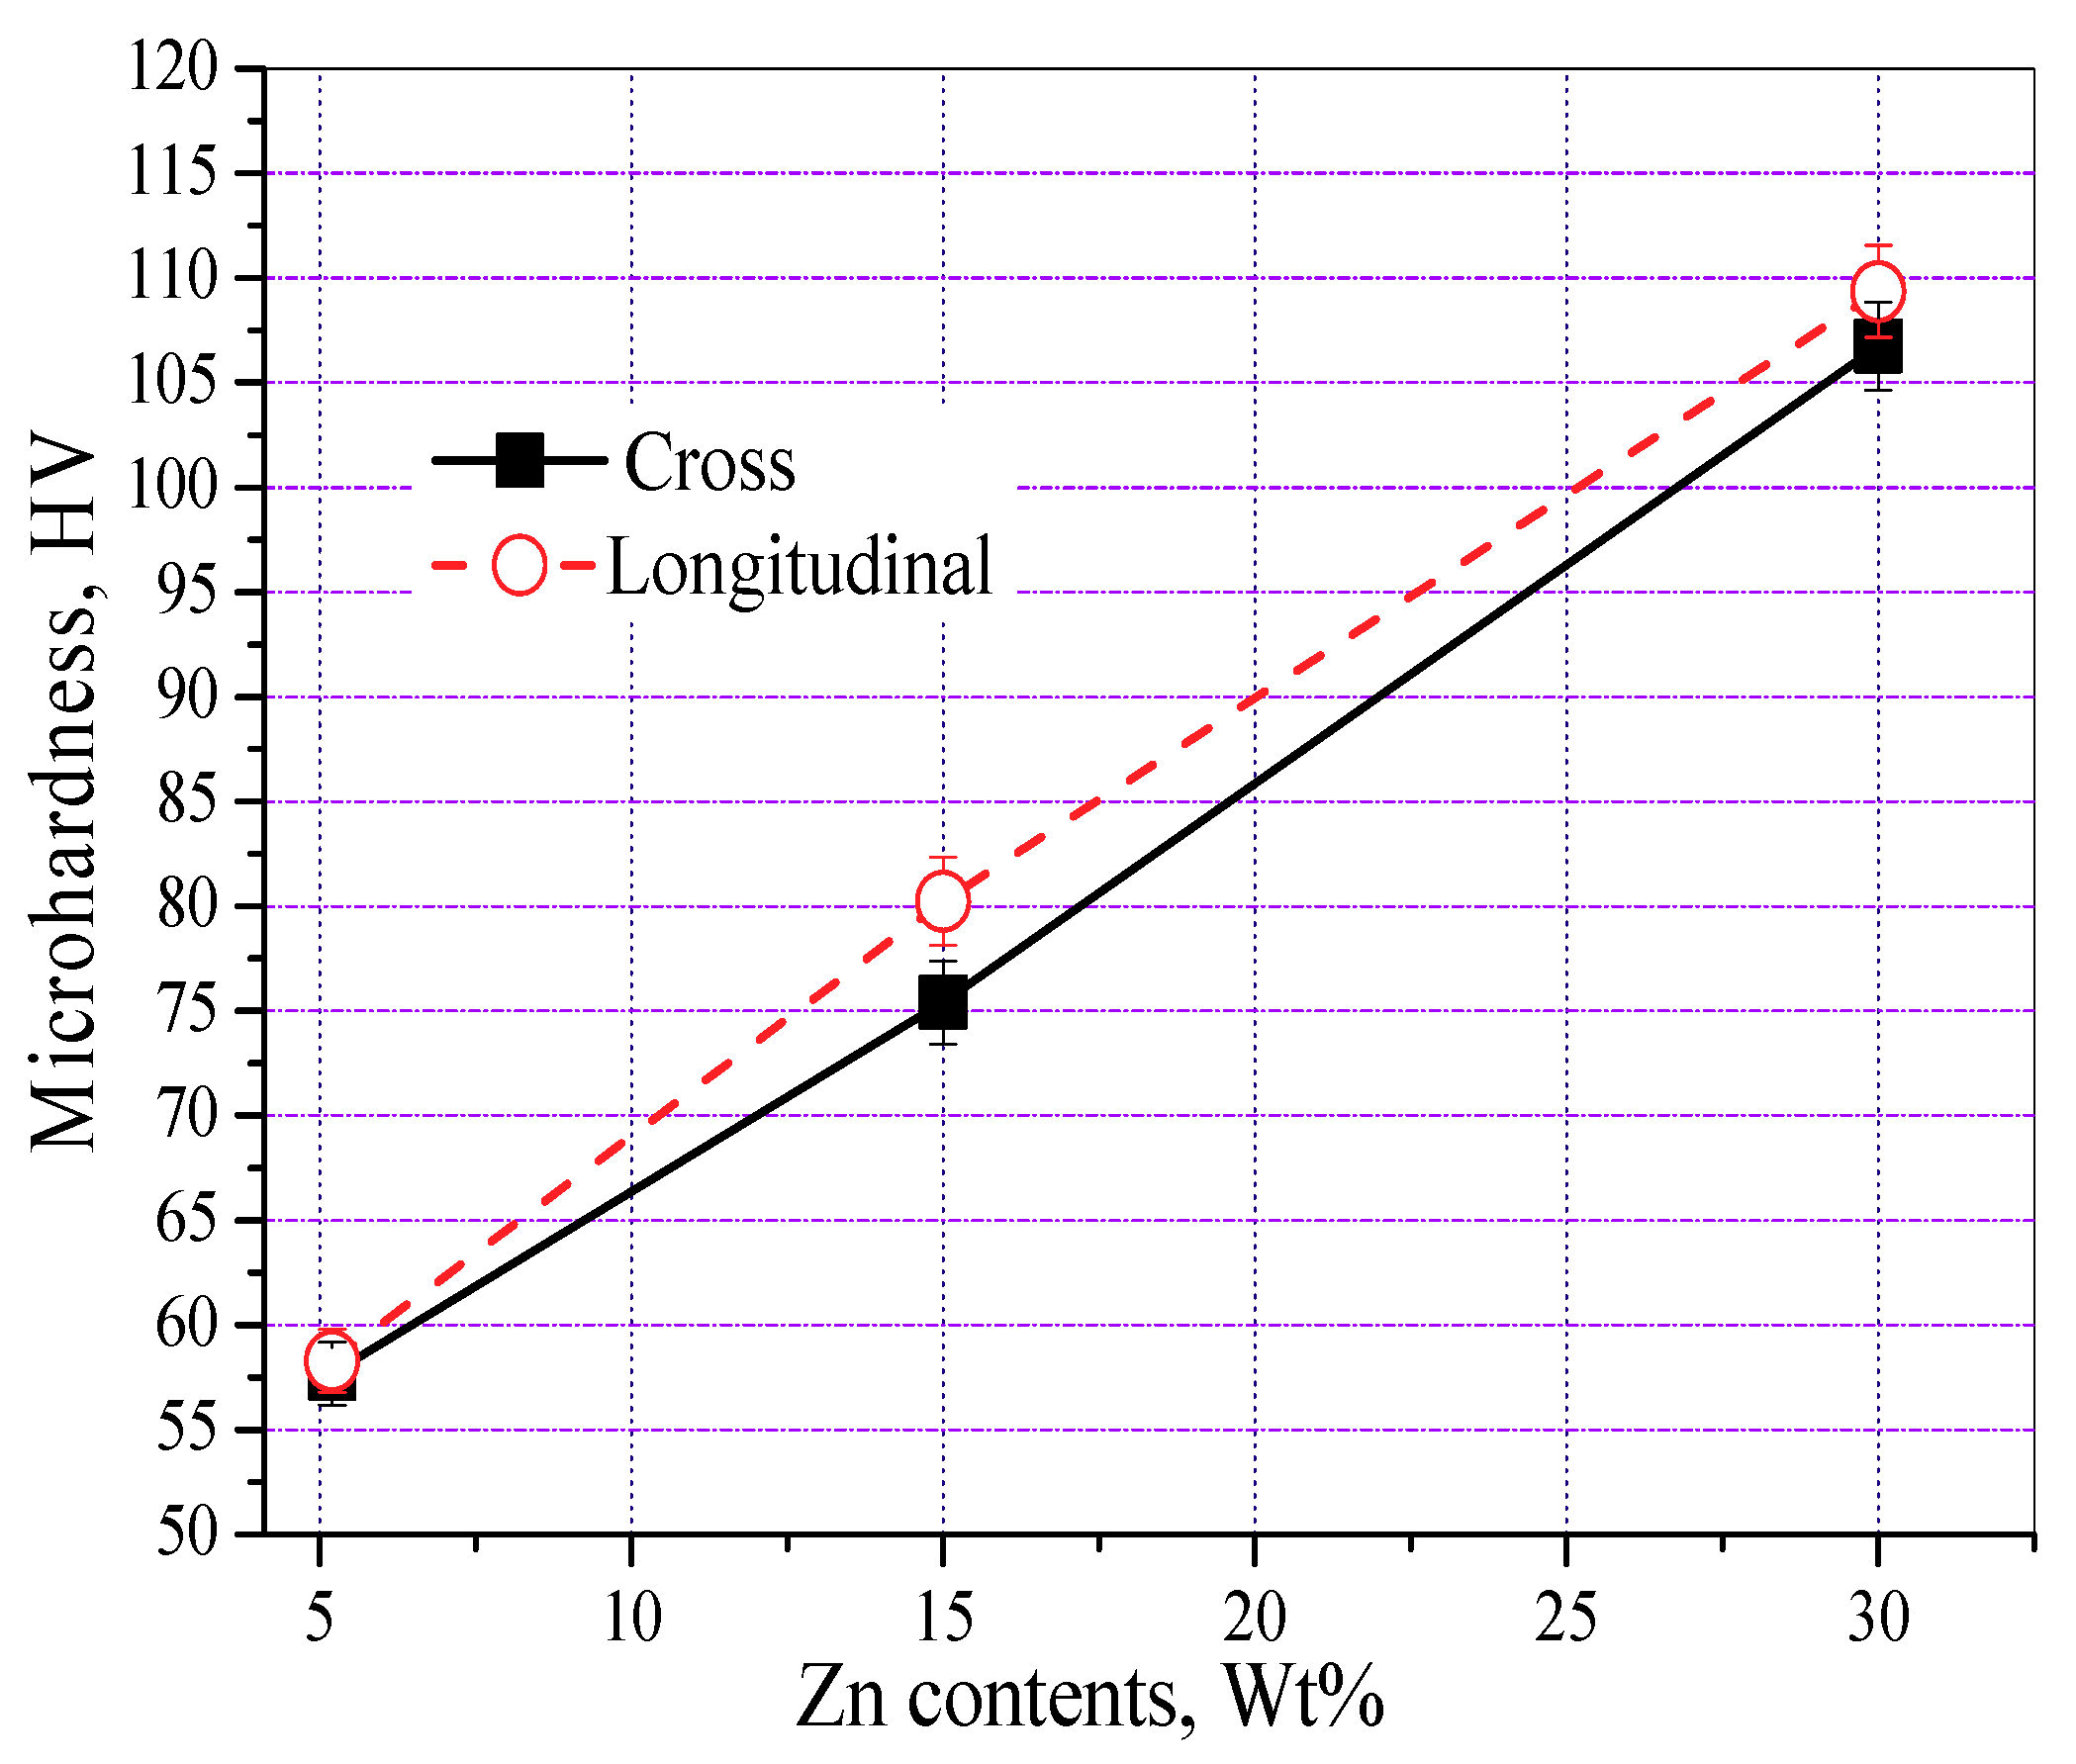
Figure 9 presents the microhardness measured on the polished sections of the LAMed porous Mg-Zn-Zr alloys. The microhardness of Mg-Zn-Zr alloys increased obviously with the increasing Zn. The average microhardness of the cross section and longitudinal section of E1 alloy was 57.67 HV and 58.28 HV. The microhardness of the cross section and longitudinal section of E2 alloy was 75.51 HV and 80.23 HV, while the microhardness of the cross section and longitudinal section of E3 alloy reached 106.75 HV and 109.36 HV. There are several main reasons for the improvement of the microhardness. Firstly, as the Zn content increases, the grain size of LAMed Mg-Zn-Zr alloys has been obviously refined. In accordance with the Hall-Petch relation [46], grain refinement can improve the microhardness of the magnesium alloys significantly. Secondly, with the increasing Zn content, the solubility of Zn in α-Mg matrix increases. On the basis of the solid solution strengthening theory [47], high solid solubility will induce excellent properties. For Mg-Zn-Zr alloys, the microhardness value is proportional to the solid solubility of Zn in α-Mg, therefore, solid solution strengthening is conductive to the increase of the microhardness as well. In addition, the effect of homogeneously precipitated hard brittle Mg7Zn3 phase on microhardness also should not be neglected. With the increase of Zn content, Mg7Zn3 phase increases and gets coarsen. The homogeneously distributed Mg7Zn3 phase with higher microhardness could impede the dislocation movement between the grains [48], resulting in the increased microhardness.
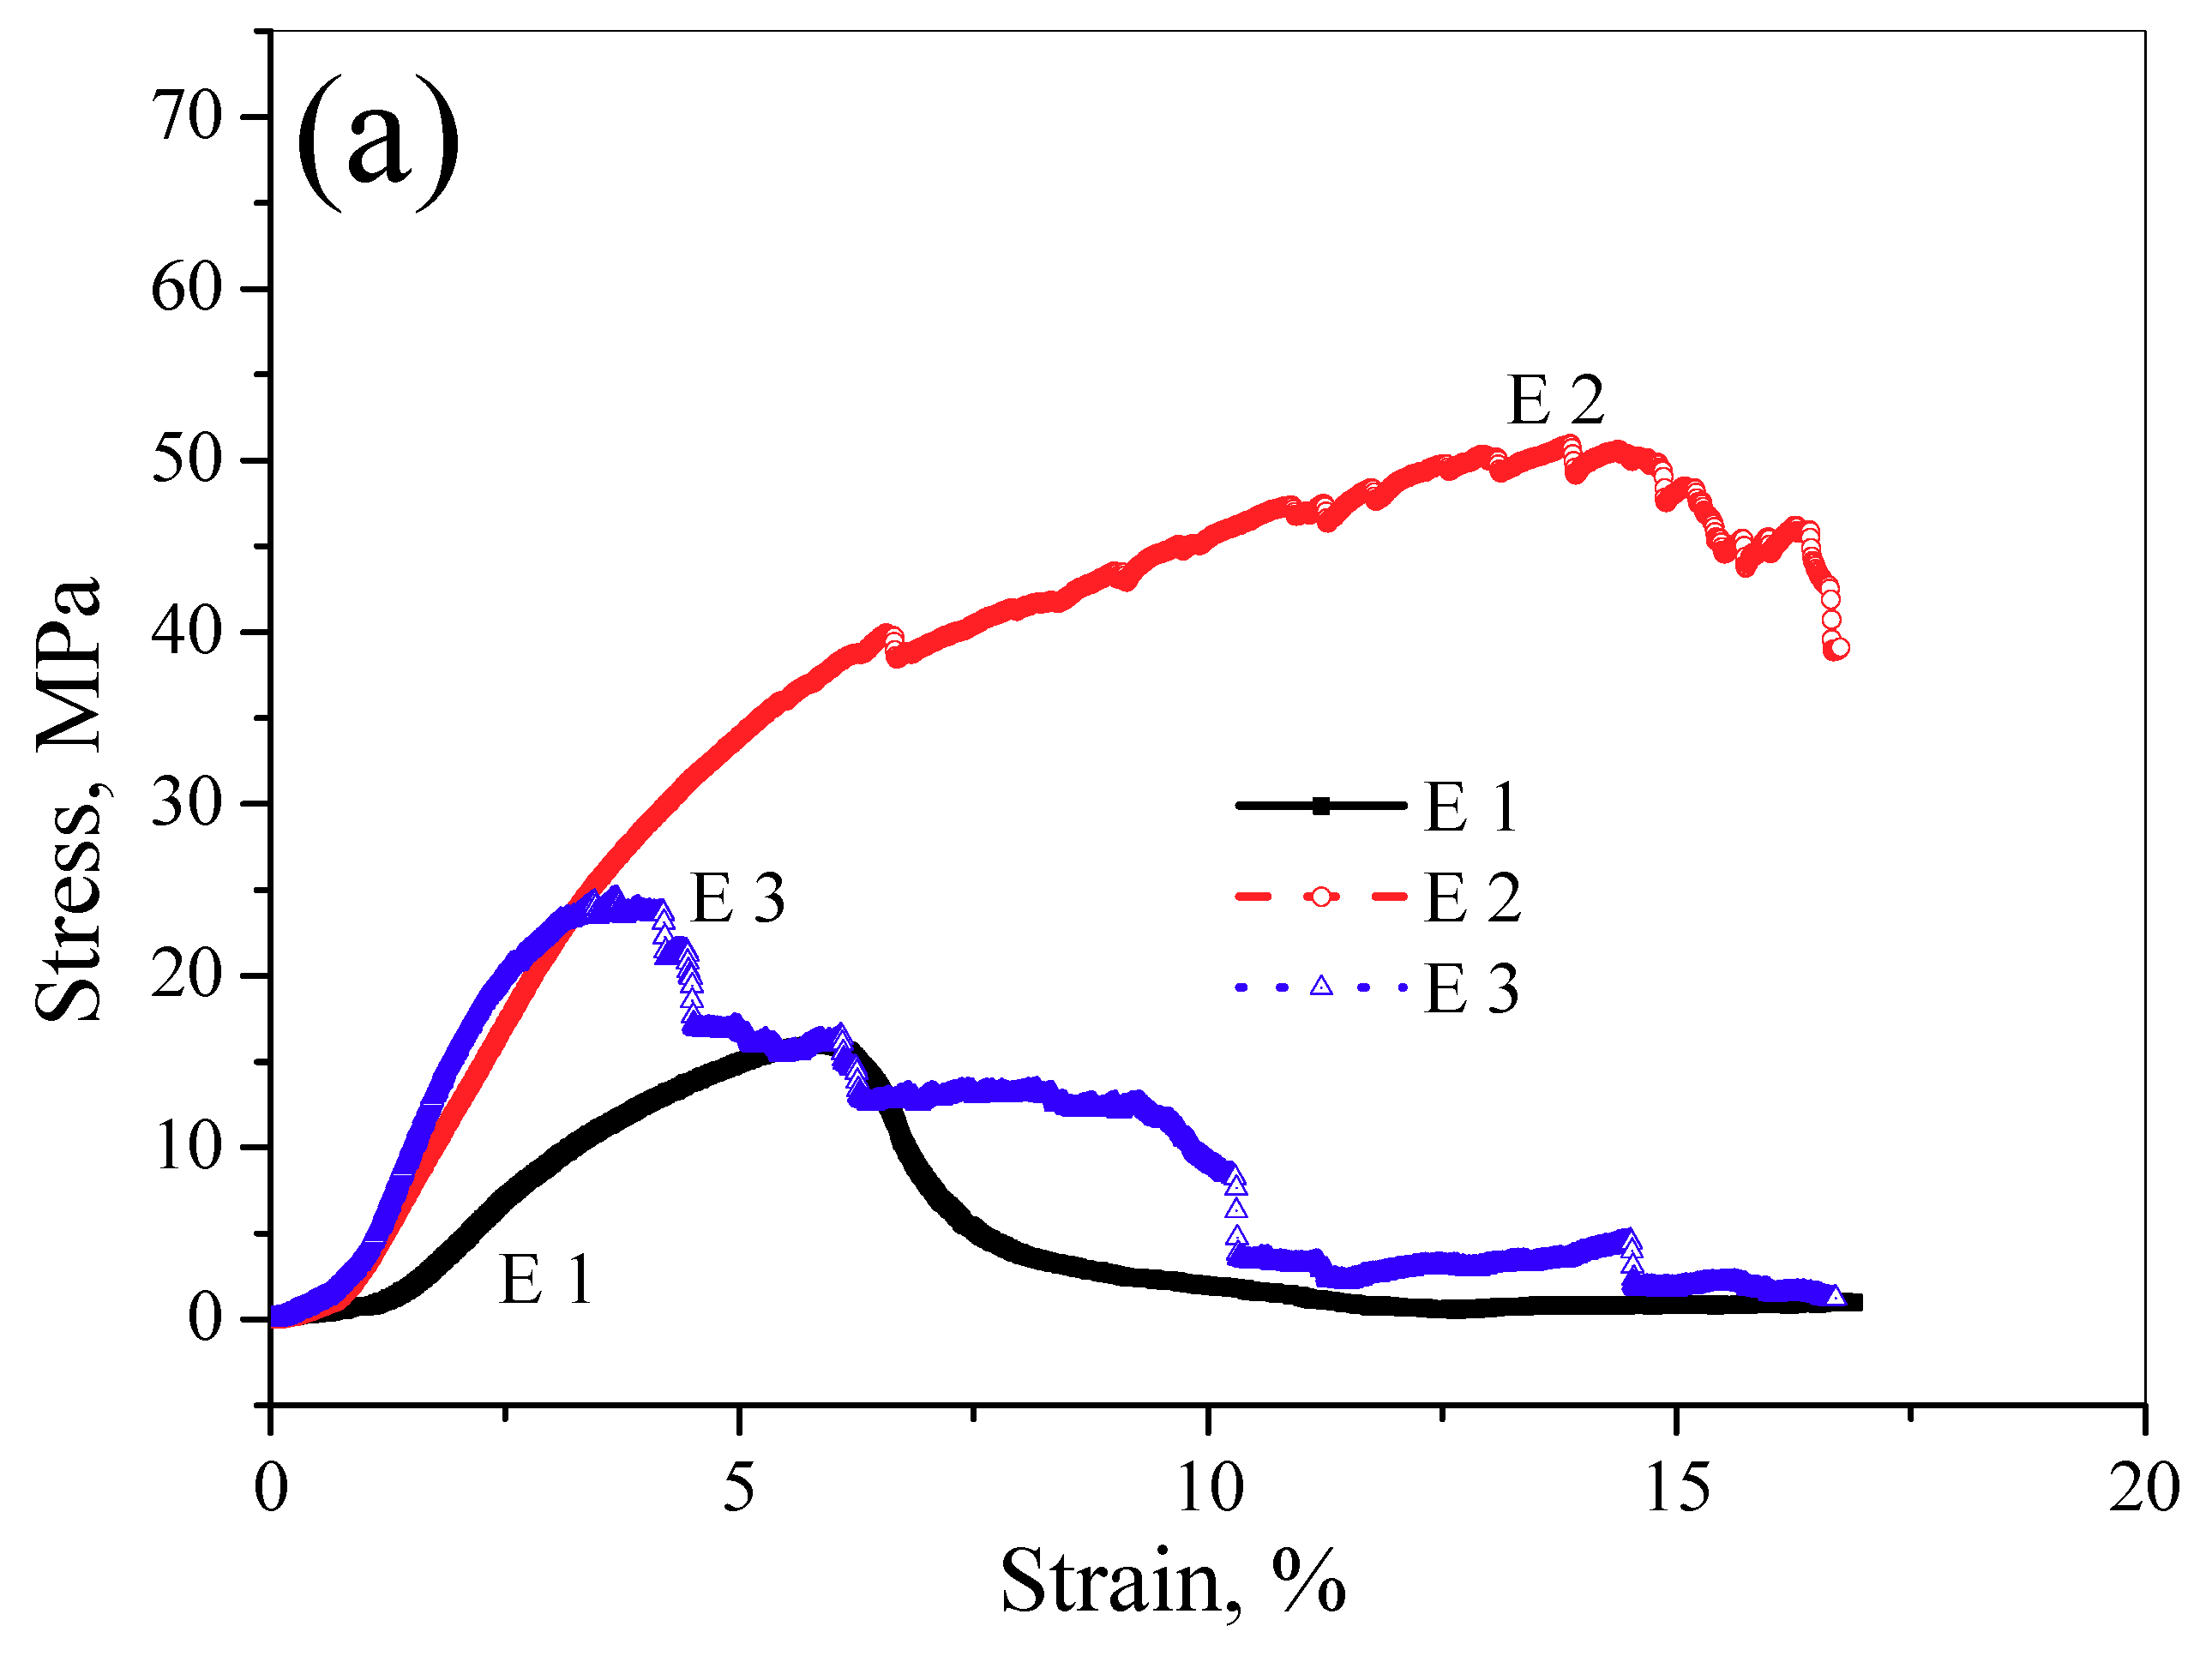
Figure 10 presents the compressive stress-strain curves of the LAMed porous Mg-Zn-Zr alloys and Table 5 lists the compression performance and microhardness of the LAMed porous Mg-Zn-Zr alloys and human bone. With the increasing Zn content, the UCS and elastic modulus values first improved obviously. In accordance with the Orowan mechanism [49,50], the enhancement of mechanical properties mostly ascribed to the precipitation strengthening of intermetallic compound Mg7Zn3 phase and MgZn phase. Besides, the effect of fine grain strengthening and solid solution strengthening could not be ignored. On the contrary, when Zn content reached 30 wt.%, the mechanical properties of E3 alloy decreased significantly. As can be seen from Figure 5c, the surface of E3 was uneven and collapsed, therefore, the density of the skeleton part of E3 is relatively poor. Furthermore, the coarsening of intermetallic compound Mg7Zn3 phase tends to generate the source of cracks at grain boundaries. Due to the design of distribution mode of the reserved apertures in the experiment, the longitudinal mechanical properties of porous Mg-Zn-Zr alloys are superior to the horizontal mechanical properties. As listed in Table 5, the UCS and elastic modulus of the LAMed porous Mg-Zn-Zr alloys are slightly lower than those of the compact bone but much higher than those of the cancellous bone [7,51]. As a result, the porous Mg-Zn-Zr alloys prepared by LAM, especially with Zn content no more than 15 wt.%, are very promising biodegradable materials for cancellous bone.
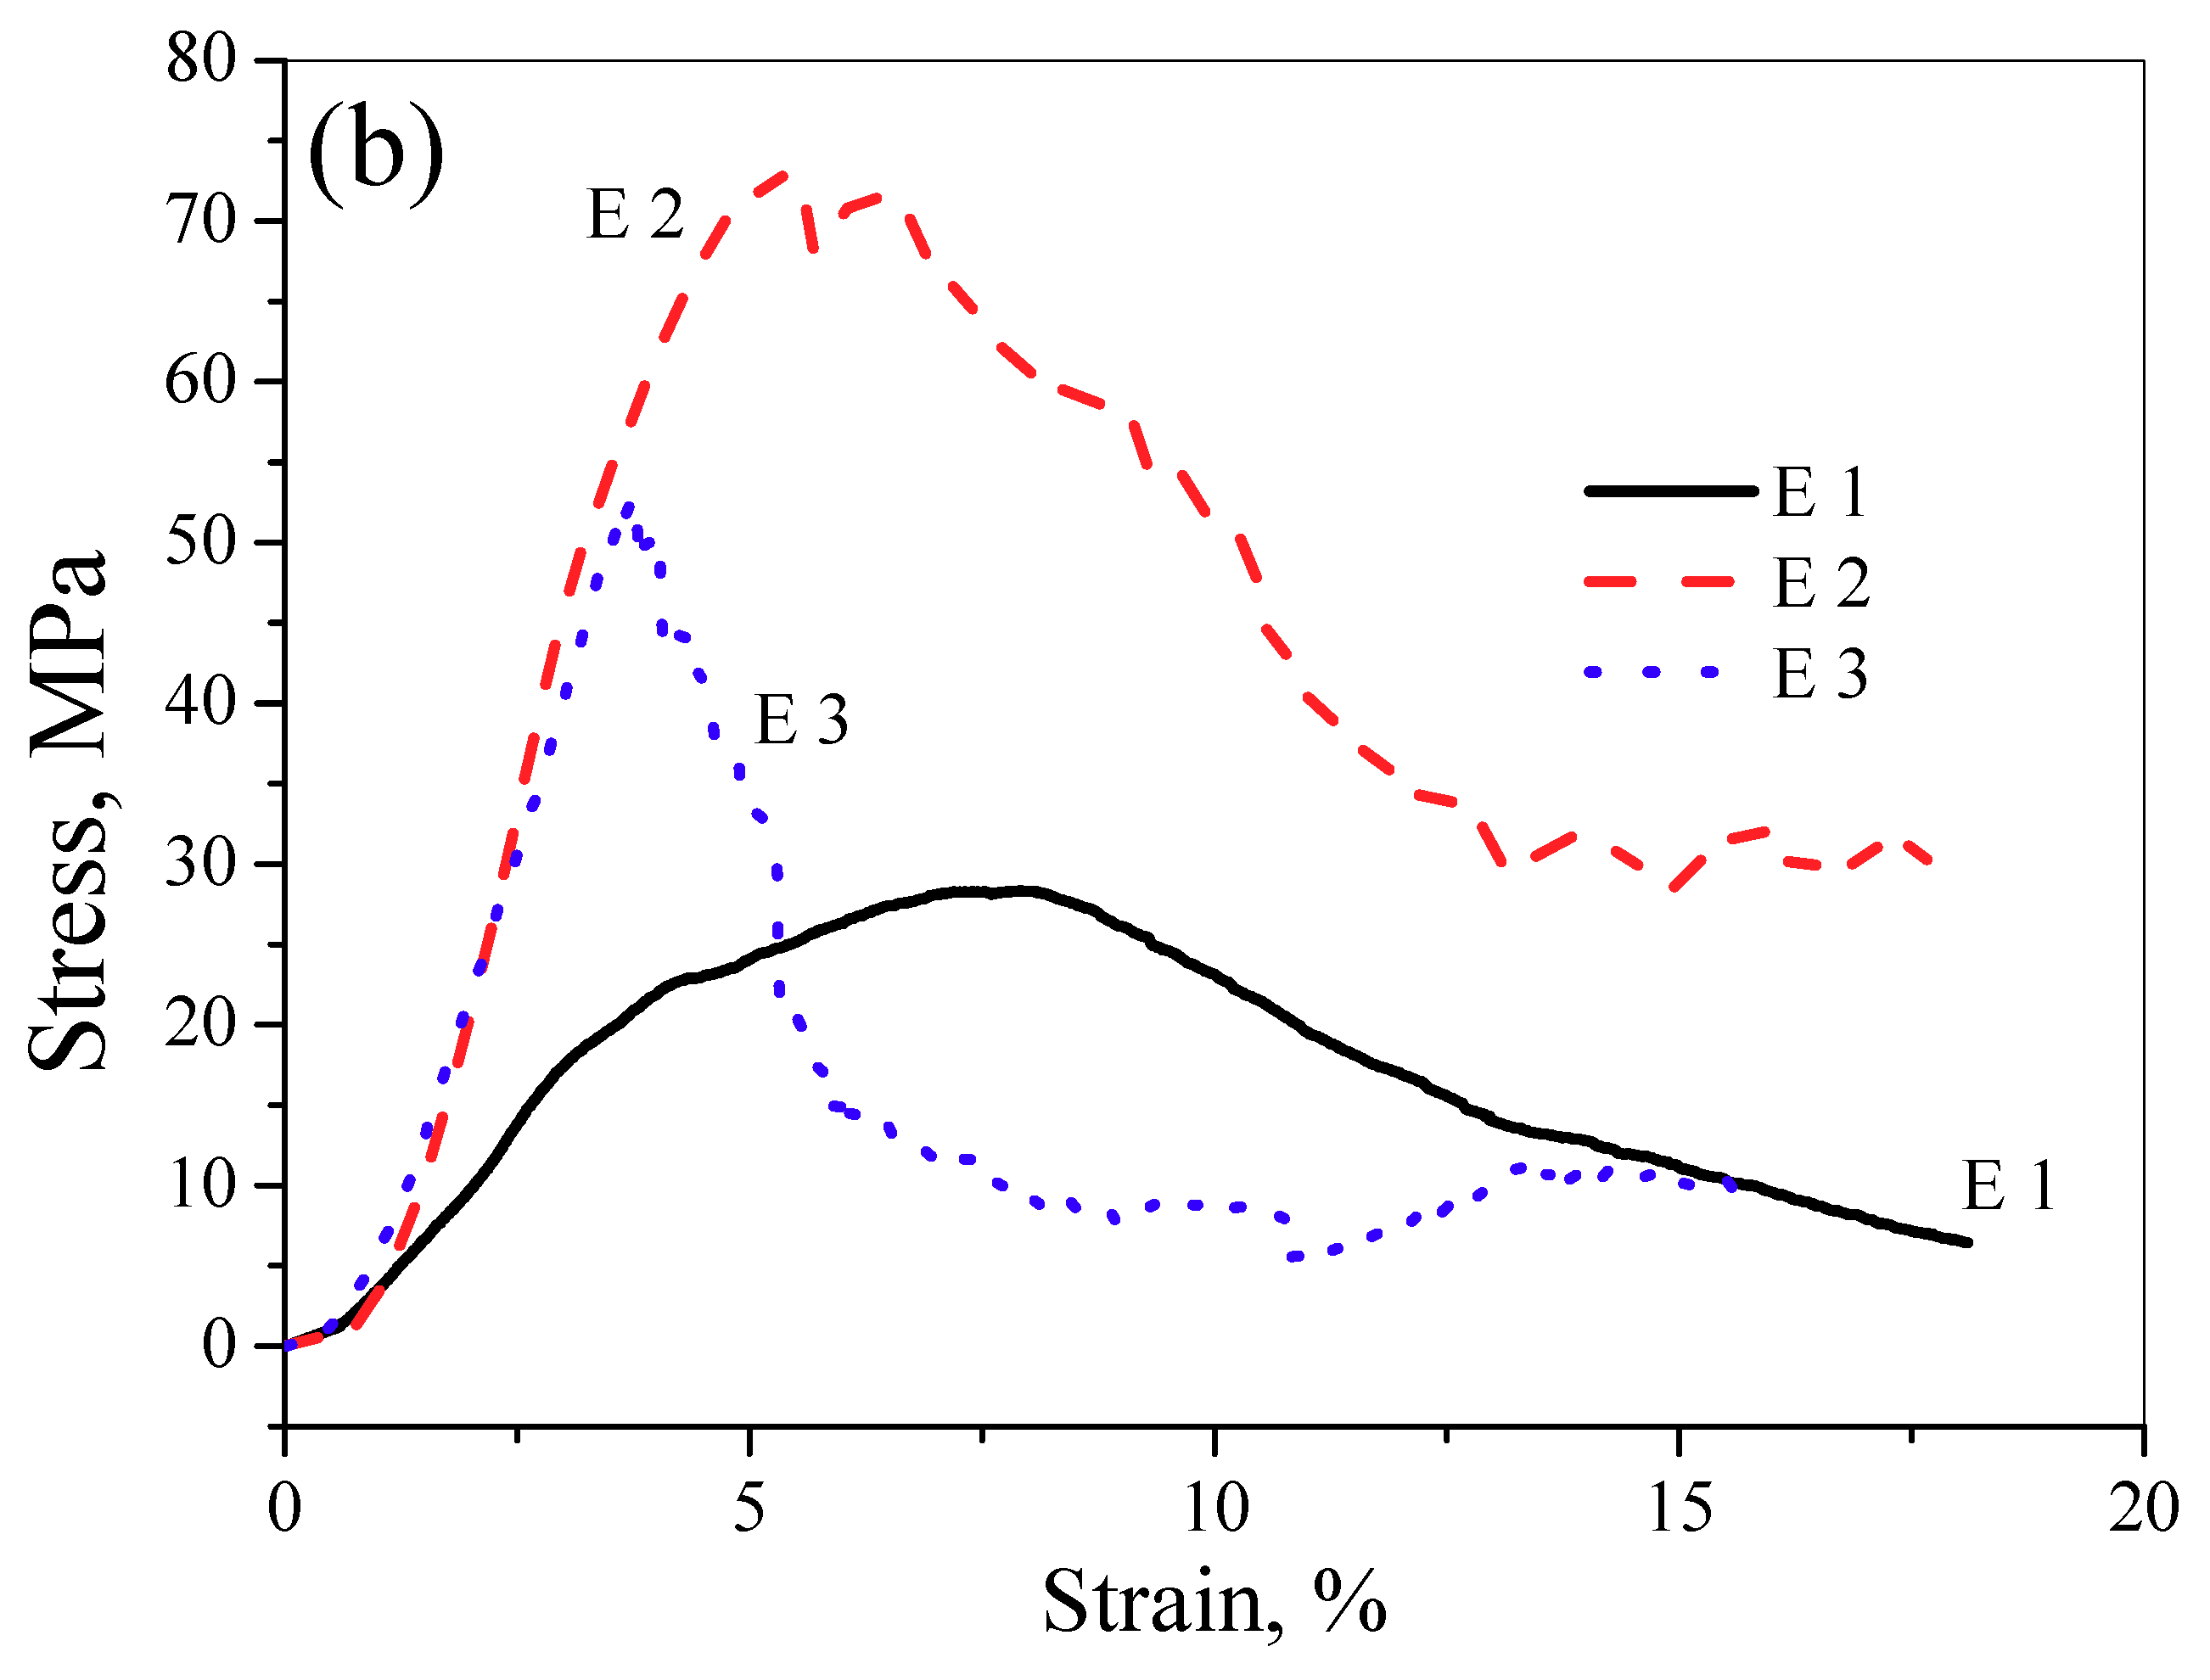
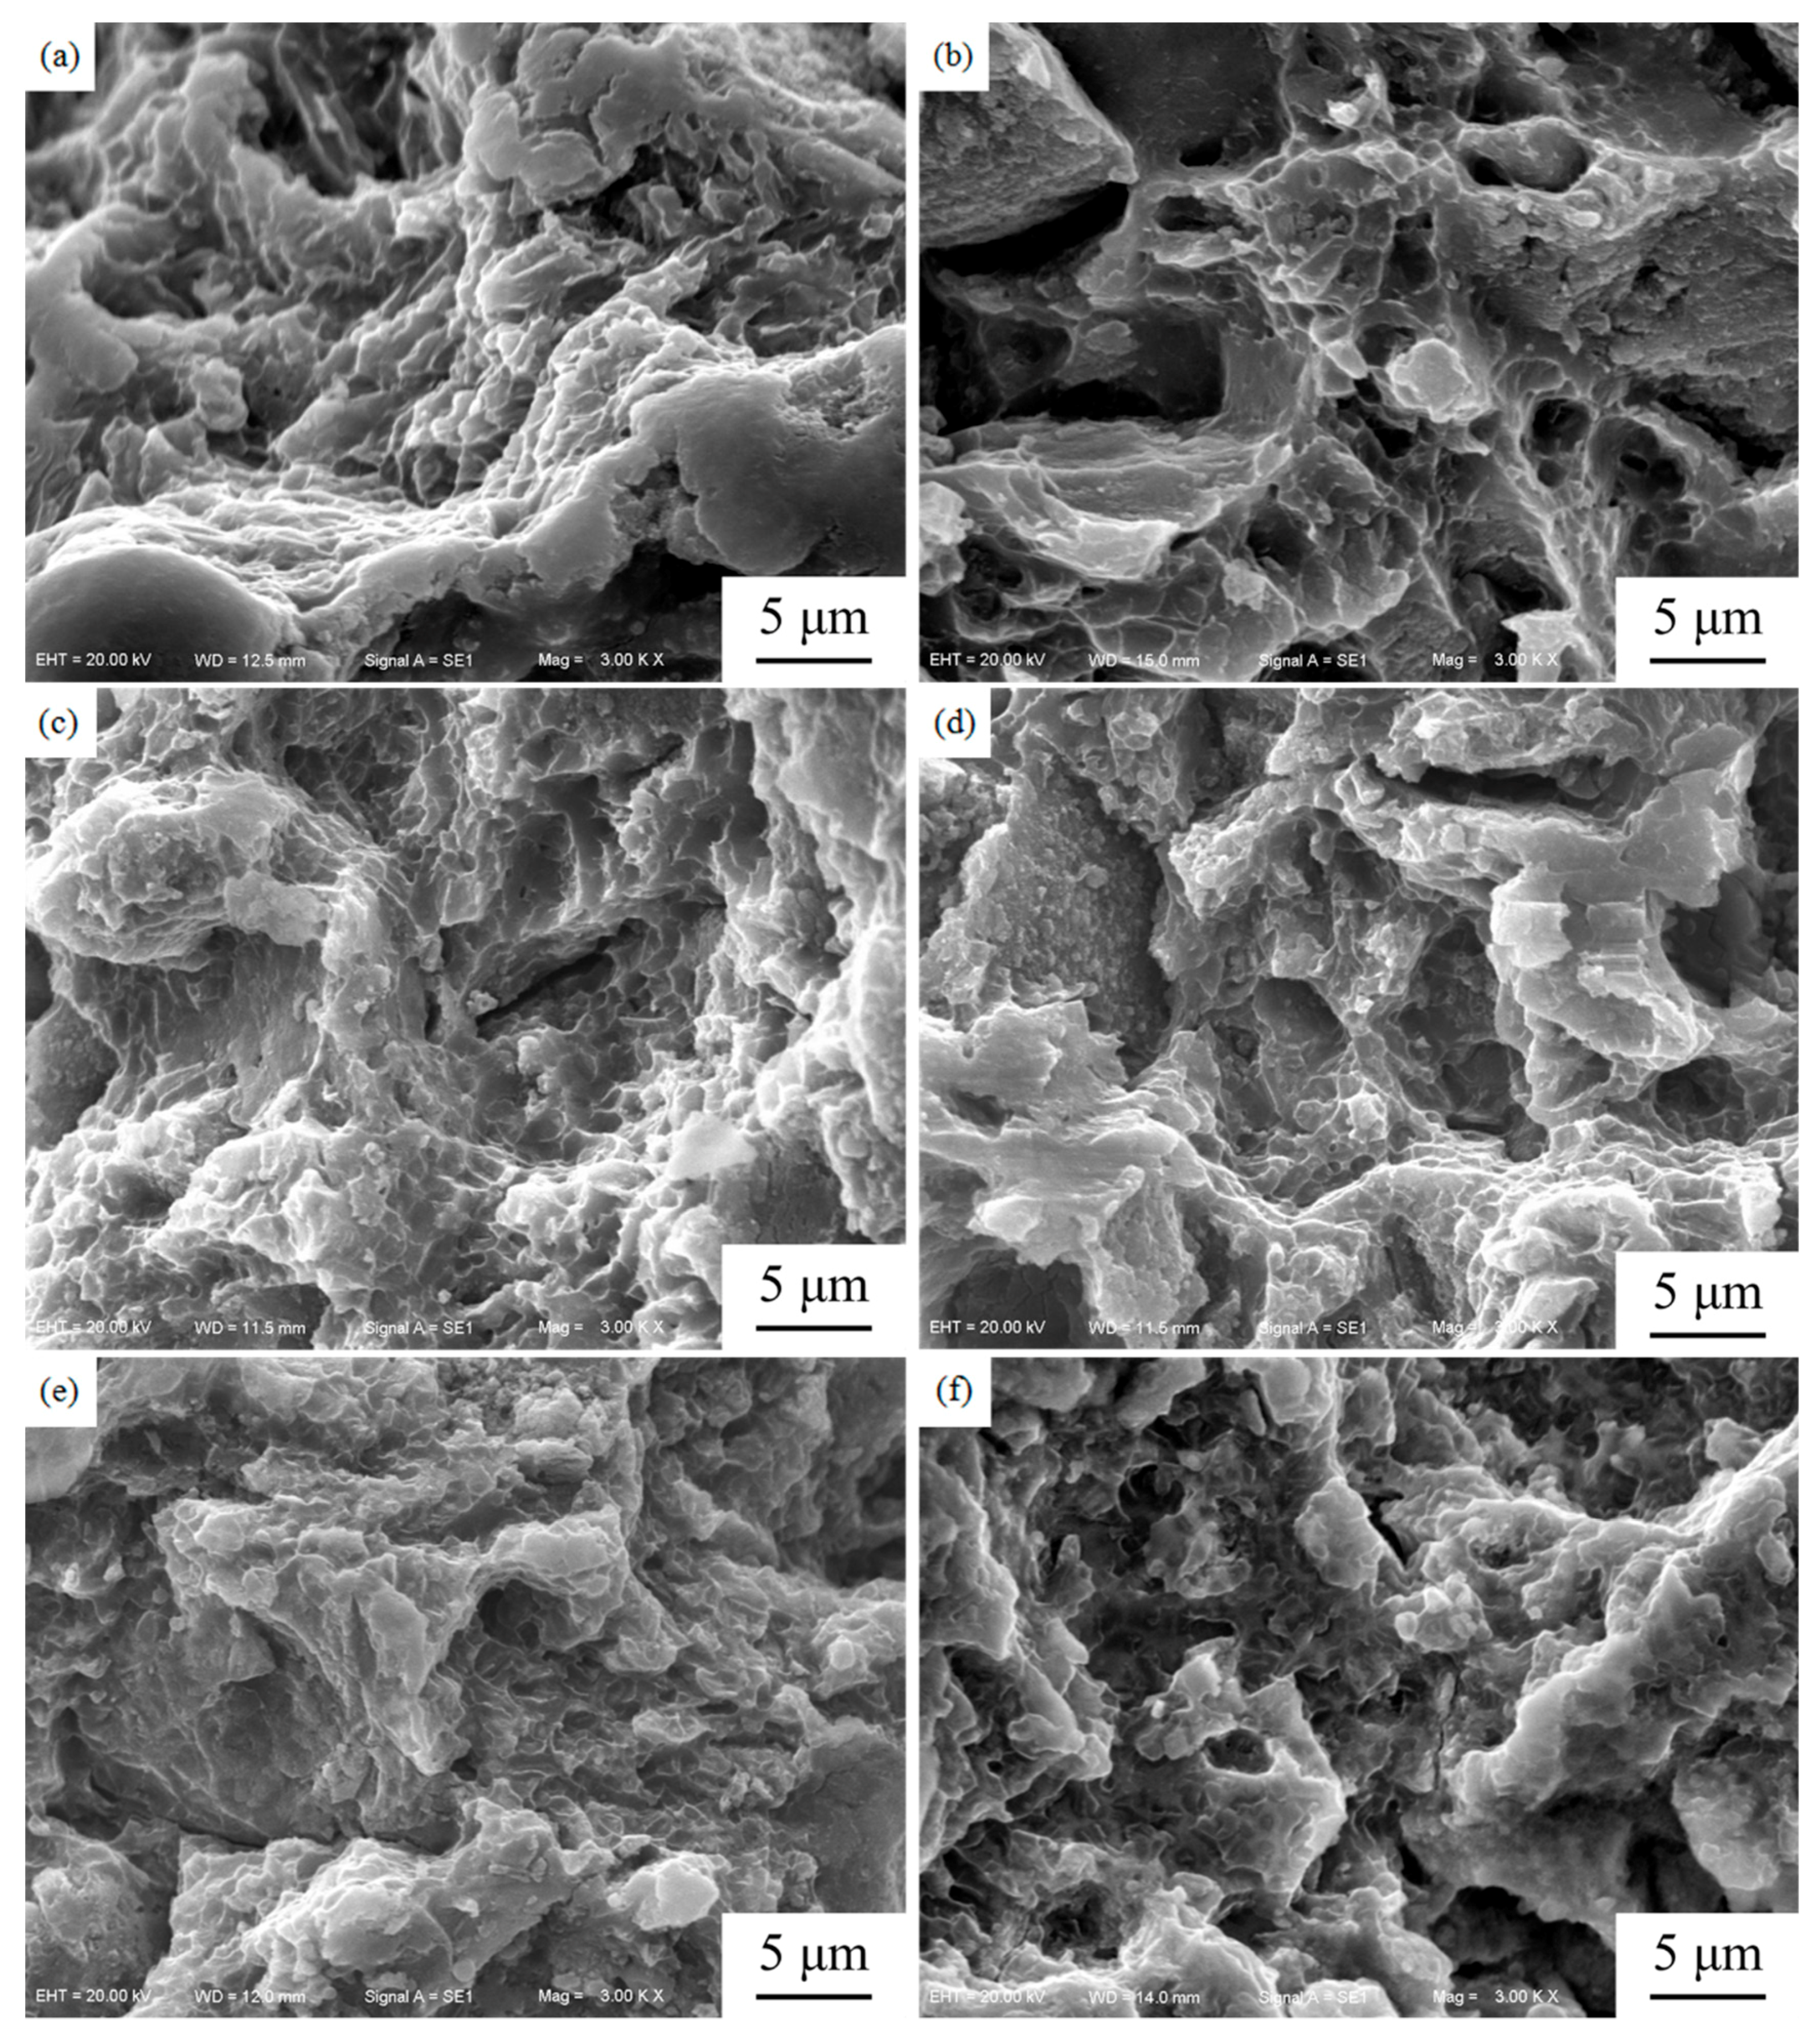
The fracture morphologies of compression samples are shown in Figure 11. As presented in Figure 11a,b, there are plenty of tearing ridges and cracks on the surface, which demonstrates that the facture mode of E1 was apparent quasi-cleavage facture. Figure 11c,d shows the fracture morphologies of horizontal compression and longitudinal compression of E2. Besides the tearing ridges, a certain quantity of dimples can be observed on the surface and these dimples indicates that the ductility of E2 is superior to that of E1, which is consistent with the stress-strain curves. The fracture mode of E2 alloy exhibits a quasi-cleavage with a certain quantity of dimples. As can be seen from Figure 11e,f, as the Zn content further increases, the fracture morphology of E3 alloy exhibits a quasi-cleavage with a large number of tearing ridges and secondary cracks. In conclusion, the facture mode of the LAMed porous Mg-Zn-Zr alloys exhibits a quasi-cleavage facture.
The effect of laser power and scanning speed on the microstructures, phase constitutes and their morphologies is also related to the solidification rate which is dependent on the thermal gradients and cooling rates during deposition by the following Equation [29]:
where is the solidification rate, is the thermal gradient and is the cooling rate. As stated in [29], increased laser power for a fixed scan speed (i.e., increasing energy density) acts to decrease the thermal gradient and, hence, cooling rate. Therefore, higher energy densities tend to reduce both solidification and cooling rates. Considering laser power in respect to the current work, the laser power used for SLM of 110 W is almost more than twice the laser power applied for 60 W. Therefore, porous magnesium alloy obtained by higher laser energy input (110 W) accumulates significant heat in the melt pool which reduces the cooling rate, whereas the much lower heat input (when laser power is set as 60 W) during the present SLM promotes much higher cooling rates. The comparison of grain size and compressive strength under different energies will be discussed in another paper. This paper mainly discusses the effect of Zn contents on the fabricated porous ZK61 magnesium alloy.
It was clearly demonstrated that from the Mg-25 wt.% Zn onwards, the well-recognized preferred orientation <11 0> was no longer presented; instead, the orientations off the basal plane started to take over and thus dendritic morphology and branching structure transition performed [31]. Three distinctive growth patterns of α-Mg dendrites were presented when the zinc additions increase from 10 wt.% to 50 wt.% except for hyperbranch structure in the 38 wt.% [36]. The growth patterns were observed to transform from anisotropy (low Zn addition) with six symmetric snow-flake structure to relative isotropy (intermediate Zn addition) where seaweed morphology presented and then back to anisotropy (high Zn addition) when only 12 branches with preferred <11 1> orientations were observed.
4. Conclusions
The surface morphology, porosity, microstructure and mechanical properties of the LAMed porous Mg-Zn-Zr alloys with different Zn content were analyzed systematically. Conclusions are listed as follows:
- The surface morphology and porosity of the LAMed porous Mg-Zn-Zr alloys depend on the laser energy input during LAM process. ZK61 samples with higher quality could be acquired between 1019 J/mm3 and 1146 J/mm3, and with increasing E, the porosity of porous ZK61 alloys decreases gradually.
- With the increasing Zn content, the surface morphology gets worse and the grains of the alloys are significantly refined. Zk61 (E1) alloy mainly contains α-Mg, MgO, MgZn phase and lesser Mg7Zn3 phase. The amount of particle/rod-like MgZn phase and grain boundary Mg7Zn3 phase first increase with the increase of Zn content. However, When the Zn content reaches 30 wt.%, the particle/rod-like MgZn phases inside the grains almost completely disappeared and grain boundary Mg7Zn3 phase further increases and becomes coarsen.
- The microhardness of the LAMed porous Mg-Zn-Zr alloys increases obviously with the increasing Zn content, which ranges from 57.67 HV to 109.36 HV. The increase of microhardness is mainly attributed to the fine grain strengthening, solution strengthening and precipitation strengthening of MgZn phase and Mg7Zn3 phase.
- The UCS and elastic modulus of the LAMed porous Mg-Zn-Zr alloys are slightly lower than those of the compact bone but much higher than those of the cancellous bone. The fracture mode of the LAMed porous Mg-Zn-Zr alloys exhibits a quasi-cleavage and the longitudinal compression performance is better than the horizontal compression performance. The LAMed porous Mg-Zn-Zr alloys are promising biodegradable materials for bone tissue engineering.
Author Contributions
Conceptualization, M.Z. and C.C.; Methodology, C.C.; Validation, C.L.; Investigation, C.L.; Writing: Original Draft Preparation, C.L.; Writing: Review and Editing, C.C.; Visualization, M.Z.; Supervision, S.W. and C.C.
Funding
This research was funded by open fund from State Key Laboratory of Advanced Processing and Recycling of Non-ferrous Metals, Lanzhou University of Technology (SKLAB02014006), Suzhou Science and Technology Bureau with grant No. SYG201231, No. SYG201642, Jiangsu province 333 talent project (BRA2017098) open fund for Jiangsu Key Laboratory of Advanced Manufacturing Technology (HGAMTL-170).
Acknowledgments
The authors thank Wang Xingcheng, Zhu Zhaoyu, Wang Xiaonan, Hu Zengrong and Chan Yufei for their assistance during the experimental work.
Conflicts of Interest
The authors declare no conflict of interest.
References
- Ryan, G.; Pandit, A.; Apatsidis, D.P. Fabrication methods of porous metals for use in orthopaedic applications. Biomaterials 2006, 27, 2651–2670. [Google Scholar] [CrossRef] [PubMed]
- Locci, P.; Marinucci, L.; Lilli, C.; Belcastro, S.; Staffolani, N.; Bellocchio, S.; Damiani, F.; Becchetti, E. Biocompatibility of alloys used in orthodontics evaluated by cell culture tests. J. Biomed. Mater. Res. 2000, 51, 561–568. [Google Scholar] [CrossRef]
- Agarwal, S.; Curtin, J.; Duffy, B.; Jaiswal, S. Biodegradable magnesium alloys for orthopaedic applications: a review on corrosion, biocompatibility and surface modifications. Mater. Sci. Eng. C 2016, 68, 948–963. [Google Scholar] [CrossRef] [PubMed]
- Anselme, K. Osteoblast adhesion on biomaterials. Biomaterials 2000, 21, 667–681. [Google Scholar] [CrossRef]
- Heublein, B.; Rohde, R.; Kaese, V.; Niemeyer, M.; Hartung, W.; Haverich, A. Biocorrosion of magnesium alloys: A new principle in cardiovascular implant technology. Heart 2003, 89, 651–656. [Google Scholar] [CrossRef] [PubMed]
- Haefeli-Bleuer, B.; Weibei, E.R. Morphometry of the human pulmonary acinus. Anat. Rec. 1988, 220, 401–414. [Google Scholar] [CrossRef] [PubMed]
- Gibson, L.J. The mechanical behavior of cancellous bone. J. Biomech. 1985, 18, 317–328. [Google Scholar] [CrossRef]
- Yamada, Y.; Shimojima, K.; Sakaguchi, Y.; Mabuchi, M.; Nakamura, M.; Asahina, T.; Mukai, T.; Kanahashi, H.; Higashi, K. Processing of an open-cellular AZ91 magnesium alloy with a low density of 0.05 g/cm3. J. Mater. Sci. Lett. 1999, 18, 1477–1480. [Google Scholar] [CrossRef]
- Wen, C.E.; Yamada, Y.; Shimojima, K.; Chino, Y.; Hosokawa, H.; Mabuchi, M. Compressibility of porous magnesium foam: Dependency on porosity and pore size. Mater. Lett. 2004, 58, 357–360. [Google Scholar] [CrossRef]
- Park, S.-H.; Um, Y.-S.; Kum, C.-H.; Hur, B.-Y. Thermophysical properties of Al and Mg alloys for metal foam fabrication. Coll. Surf. A 2005, 263, 280–283. [Google Scholar] [CrossRef]
- Qin, L.; Chen, C.; Zhang, M.; Yan, K.; Cheng, G.; Jing, H.; Wang, X. The microstructure and mechanical properties of deposited-IN625 by laser additive manufacturing. Rapid Prototyp. J. 2017, 23, 1119–1129. [Google Scholar] [CrossRef]
- Li, G.C.; Li, J.; Tian, X.J.; Cheng, X.; He, B.; Wang, H.M. microstructure and properties of a novel titanium alloy Ti-6Al-2V-1.5Mo-0.5Zr-0.3Si manufactured by laser additive manufacturing. Mater. Sci. Eng. A 2017, 684, 233–238. [Google Scholar] [CrossRef]
- Liu, Q.; Wang, Y.; Zheng, H.; Tang, K.; Ding, L.; Li, H.; Gong, S. microstructure and mechanical properties of LMD-SLM hybrid forming Ti-6Al-4V alloy. Mater. Sci. Eng. A 2016, 660, 24–33. [Google Scholar] [CrossRef]
- Wang, L.; Felicelli, S.; Gooroochurn, Y.; Wang, P.T.; Horstemeyer, M.F. Optimization of LENS process for steady molten pool size. Mater. Sci. Eng. A 2008, 474, 148–156. [Google Scholar] [CrossRef]
- Vilaro, T.; Colin, C.; Bartout, J.D. As-fabricated and heat-treated microstructures of the Ti-6Al-4V alloy processed by selective laser melting. Metall. Mater. Trans. A 2011, 42, 3190–3199. [Google Scholar] [CrossRef]
- Lee, H.; Lim, C.H.J.; Low, M.J.; Tham, N.; Murukeshan, V.M.; Kim, Y.-J. Laser in additive manufacturing: A review. Int. J. Precis. Eng. Manuf-Gr. Technol. 2017, 4, 307–322. [Google Scholar] [CrossRef]
- Chen, S.Y.; Huang, J.C.; Pan, C.T.; Lin, C.H.; Yang, T.L.; Huang, Y.S.; Ou, C.H.; Chen, L.Y.; Lin, D.Y.; Lin, H.K.; et al. Microstructure and mechanical properties of open-cell porous Ti-6Al-4V fabricated by selective laser melting. J. Alloy. Compd. 2017, 713, 248–254. [Google Scholar] [CrossRef]
- Zhang, L.C.; Attar, H. Selective laser melting of titanium alloys and titanium matrix composites for biomedical applications: a review. Adv. Eng. Mater. 2016, 18, 463–475. [Google Scholar] [CrossRef]
- Attar, H.; Löber, L.; Funk, A.; Calin, M.; Zhang, L.C.; Prashanth, K.G.; Scudino, S.; Zhang, Y.S.; Eckert, J. Mechanical behavior of porous commercially pure Ti and Ti–TiB composite materials manufactured by selective laser melting. Mater. Sci. Eng. A 2015, 625, 350–356. [Google Scholar] [CrossRef]
- Attar, H.; Calin, M.; Zhang, L.C.; Scudino, S.; Eckert, J. Manufacture by selective laser melting and mechanical behavior of commercially pure titanium. Mater. Sci. Eng. A 2014, 593, 170–177. [Google Scholar] [CrossRef]
- Okulov, I.V.; Volegov, A.S.; Attar, H.; Bönisch, M.; Ehtemam-Haghighi, S.; Calin, M.; Eckert, J. Composition optimization of low modulus and high-strength TiNb-based alloys for biomedical applications. J. Mech. Behav. Biomed. Mater. 2017, 65, 866–871. [Google Scholar] [CrossRef] [PubMed]
- Ehtemam-Haghighi, S.; Prashanth, K.G.; Attar, H.; Chaubey, A.K.; Cao, G.; Zhang, L. Evaluation of mechanical and wear properties of Ti-xNb-7Fe alloys designed for biomedical applications. Mater. Des. 2016, 111, 592–599. [Google Scholar] [CrossRef]
- Watanabe, H.; Mukai, T.; Mabuchi, M.; Higashi, K. High-strain-rate superplasticity at low temperature in a ZK61 magnesium alloy produced by powder metallurgy. Scr. Mater. 1999, 41, 209–213. [Google Scholar] [CrossRef]
- Qin, L.L.; Chen, C.J.; Zhang, M.; Yan, K.; Cheng, G.P.; Jing, H.M.; Wang, X.N.; Zou, T. Effect of Zr on microstructure and mechanical properties of magnesium alloy by laser additive manufacturing. Appl. Laser 2016, 36, 391–396. (In Chinese) [Google Scholar]
- Wei, K.; Wang, Z.; Zeng, X. Influence of element vaporization on formability, composition, microstructure, and mechanical performance of selective laser melted Mg-Zn-Zr components. Mater. Lett. 2015, 156, 187–190. [Google Scholar] [CrossRef]
- Shuai, C.; Yang, Y.; Wu, P.; Lin, X.; Liu, Y.; Zhou, Y.; Feng, P.; Liu, X.; Peng, S. Laser rapid solidification improves corrosion behavior of Mg-Zn-Zr alloy. J. Alloy. Compd. 2017, 691, 961–969. [Google Scholar] [CrossRef]
- Yan, Y.; Cao, H.; Kang, Y.; Yu, K.; Xiao, T.; Luo, J.; Deng, Y.; Fang, H.; Xiong, H.; Dai, Y. Effects of Zn concentration and heat treatment on the microstructure, mechanical properties and corrosion behavior of as-extruded Mg-Zn alloys produced by powder metallurgy. J. Alloy. Compd. 2017, 693, 1277–1289. [Google Scholar] [CrossRef]
- Liu, C.; Zhang, M.; Chen, C. Effect of laser processing parameters on porosity, microstructure and mechanical properties of porous Mg-Ca alloys produced by laser additive manufacturing. Mater. Sci. Eng. A 2017, 703, 359–371. [Google Scholar] [CrossRef]
- Hooyar, A.; Ehtemam-Haghighi, S.; Kent, D.; Wu, X.; Dargusch, M.S. Comparative study of commercially pure titanium produced by laser engineered net shaping, selective laser melting and casting processes. Mater. Sci. Eng. A 2017, 705, 385–393. [Google Scholar] [CrossRef]
- Hooyar, H.; Ehtemam-Haghighi, S.; Kent, D.; Dargusch, M.S. Recent developments and opportunities in additive manufacturing of titanium-based matrix composites: A review. Int. J. Mach. Tool. Manuf. 2018, 133, 85–102. [Google Scholar] [CrossRef]
- Wits, W.W.; Carmignato, S.; Zanini, F.; Vaneker, T.H.J. Porosity testing methods for the quality assessment of selective laser melted parts. CRIP Ann. 2016, 65, 201–204. [Google Scholar] [CrossRef]
- Zhou, X.; Liu, X.; Zhang, D.; Shen, Z.; Liu, W. Balling phenomena in selective laser melted tungsten. J. Mater. Process. Technol. 2015, 222, 33–42. [Google Scholar] [CrossRef]
- Davis, J.R. Metals Handbook Desk Edition, 2nd ed.; ASM International: Cleveland, OH, USA, 1998. [Google Scholar]
- Akin, M.; Veli, I.; Erdur, E.A.; Aksakalli, S.; Uysal, T. Different pulse modes of Er:YAG laser irradiation: Effects on bond strength achieved with self-etching primers. J. Orofac. Orthop. 2016, 77, 151–159. [Google Scholar] [CrossRef] [PubMed]
- Abrams, H. Grain size measurement by intercept method. Metallography 1971, 4, 59–78. [Google Scholar] [CrossRef]
- Shuai, S.; Guo, E.; Zheng, Q.; Wang, M.; Jing, T.; Fu, Y. Three-dimensional α-Mg dendritic morphology and branching structure transition in Mg-Zn alloys. Mater. Charact. 2016, 118, 304–308. [Google Scholar] [CrossRef]
- Shuai, S.; Guo, E.; Wang, J.; Phillion, A.B.; Tao, J.; Ren, Z.; Lee, P.D. Synchrotron tomographic quantification of the influence of Zn concentration on dendritic growth in Mg-Zn alloys. Acta Mater. 2018, 156, 287–296. [Google Scholar] [CrossRef]
- Ma, H.T.; Yuan, R.; Xie, Y.P.; Gao, H.; Hu, L.J.; Li, X.D.; Qian, Y.C.; Dai, Z.H. The role of Ag, Ca, Zr and Al in strengthening effects of ZK series alloys by altering G.P. zones stability. Acta Mater. 2018, 147, 42–50. [Google Scholar] [CrossRef]
- Kim, W.J.; Moon, I.K.; Han, S.H. Ultrafine-grained Mg-Zn-Zr alloy with high strength and high-strain-rate superplasticity. Mater. Sci. Eng. A 2012, 538, 374–385. [Google Scholar] [CrossRef]
- Shahzad, M.; Wagner, L. The role of Zr-rich cores in strength differential effect in an extruded Mg-Zn-Zr alloy. J. Alloy. Compd. 2009, 486, 103–108. [Google Scholar] [CrossRef]
- Bhattacharjee, T.; Mendis, C.L.; Sasaki, T.T.; Ohkubo, T.; Hono, K. Effect of Zr addition on the precipitation in Mg-Zn-based alloy. Scr. Mater. 2012, 67, 967–970. [Google Scholar] [CrossRef]
- Wagner, D.C.; Chai, X.; Tang, X.; Kou, S. Liquation cracking in arc and friction-stir welding of Mg-Zn alloys. Metall. Mater. Trans. A 2015, 46, 315–327. [Google Scholar] [CrossRef]
- Matthews, R.P.; Knusten, R.D.; Westraadt, J.E.; Couvant, T. Intergranular oxidation of 316L stainless steel in the PWR primary water environment. Corros. Sci. 2017, 125, 175–183. [Google Scholar] [CrossRef]
- Oliveira, J.P.; Cavaleiro, A.J.; Schell, N.; Stark, A.; Miranda, R.M.; Ocana, J.L.; Fernandes, F.M.B. Effects of laser processing on the transformation characteristics of NiTi: A contribute to additive manufacturing. Scr. Mater. 2018, 152, 122–126. [Google Scholar] [CrossRef]
- Dubé, D.; Fiset, M.; Couture, A.; Nakatsugawa, I. Characterization and performance of laser melted AZ91D and AM60B. Mater. Sci. Eng. A 2001, 299, 38–45. [Google Scholar] [CrossRef]
- Furukawa, M.; Iwahashi, Y.; Horita, Z.; Nemoto, M.; Tsenev, N.K.; Valiev, R.Z.; Langdon, T.G. Structural evolution and the hall-petch relationship in an Al-Mg-Li-Zr alloy with ultra-fine grain size. Acta Mater. 1997, 45, 4751–4757. [Google Scholar] [CrossRef]
- Varvenne, C.; Leyson, G.P.M.; Ghazisaeidi, M.; Curtin, W.A. Solute strengthening in random alloys. Acta Mater. 2017, 124, 660–683. [Google Scholar] [CrossRef] [Green Version]
- Xie, G.M.; Ma, Z.Y.; Geng, L. Effect of microstructural evolution on mechanical properties of friction stir welded ZK60 alloy. Mater. Sci. Eng. A 2008, 486, 49–55. [Google Scholar] [CrossRef]
- Galindo-Nava, E.I.; Rae, C.M.F. Microstructure-sensitive modelling of dislocation creep in polycrystalline FCC alloys: Orowan theory revisited. Mater. Sci. Eng. A 2016, 651, 116–126. [Google Scholar] [CrossRef]
- Hahn, S.-I.; Hwang, S.J. Estimate of the Hall-Petch and Orowan effects in the nanocrystalline Cu with Al2O3 dispersoid. J. Alloy. Compd. 2009, 483, 207–208. [Google Scholar] [CrossRef]
- Stamboulis, A.G.; Boeeaeeini, A.R.; Hench, L.L. Novel biodegradable polymeb/bioactive glass composites for tissue engineering application. Adv. Eng. Mater. 2002, 4, 105–109. [Google Scholar] [CrossRef]
Figure 1.
Morphologies of powders. (a) ZK61, (b) Zn.

Figure 2.
Schematic diagrams of compression tests. (a) Building direction of the samples, (b) Longitudinal compression (LC), (c) Horizontal compression (HC).
Figure 2.
Schematic diagrams of compression tests. (a) Building direction of the samples, (b) Longitudinal compression (LC), (c) Horizontal compression (HC).
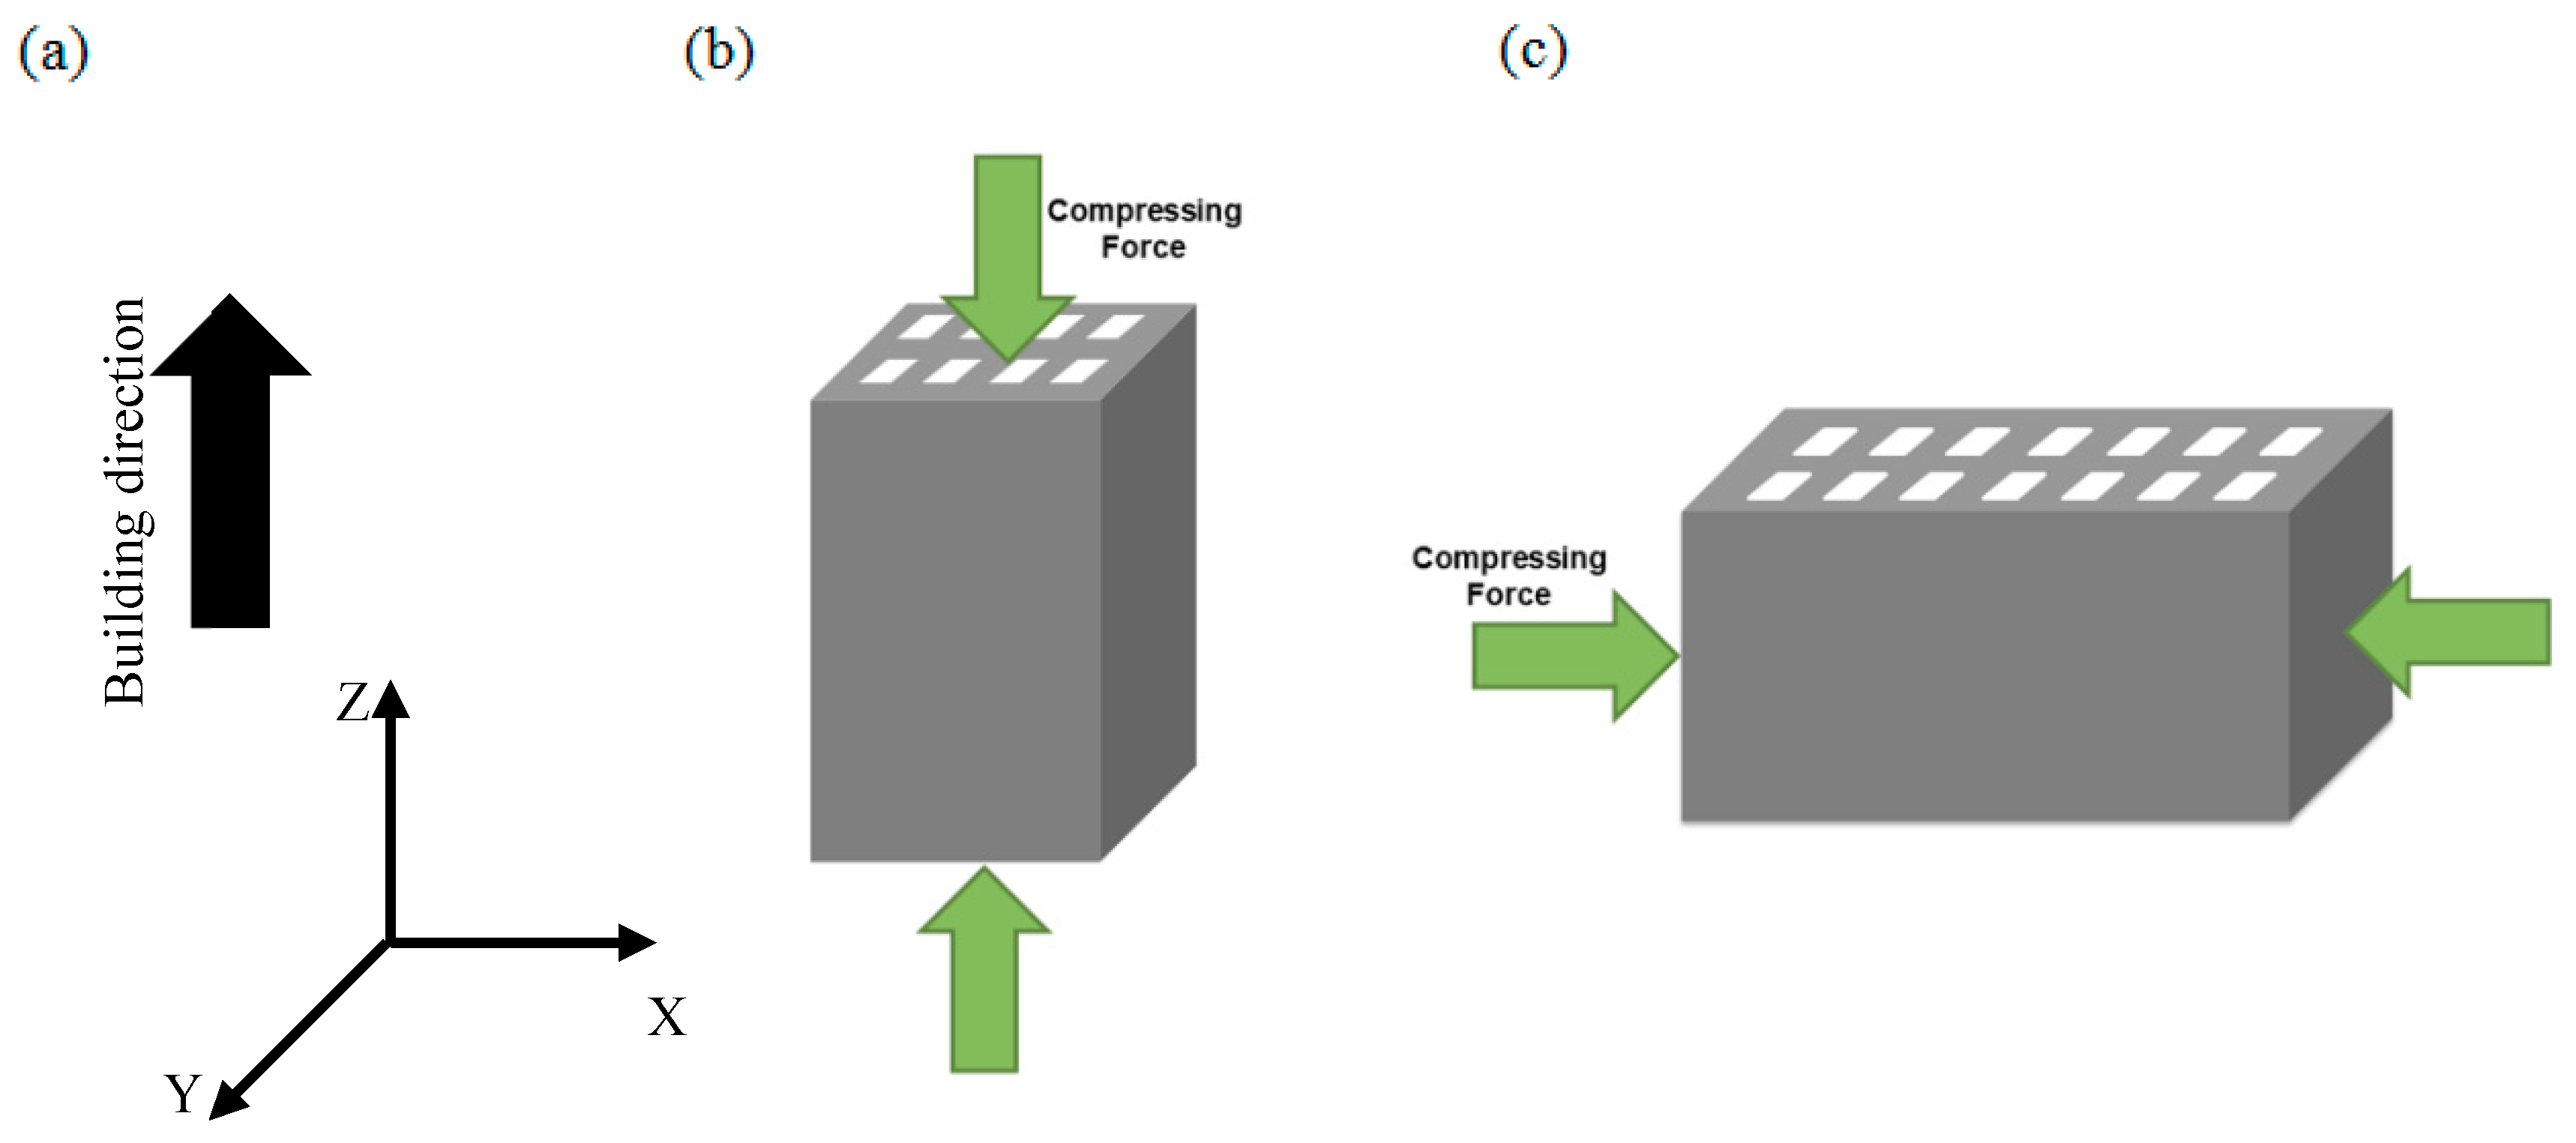
Figure 3.
Cross-section morphologies of the LAMed ZK61 prepared at different E. (a) 764 J/mm3, (b) 892 J/mm3, (c) 1019 J/mm3, (d) 1146 J/mm3, (e) 1273 J/mm3, (f) 1400 J/mm3.
Figure 3.
Cross-section morphologies of the LAMed ZK61 prepared at different E. (a) 764 J/mm3, (b) 892 J/mm3, (c) 1019 J/mm3, (d) 1146 J/mm3, (e) 1273 J/mm3, (f) 1400 J/mm3.
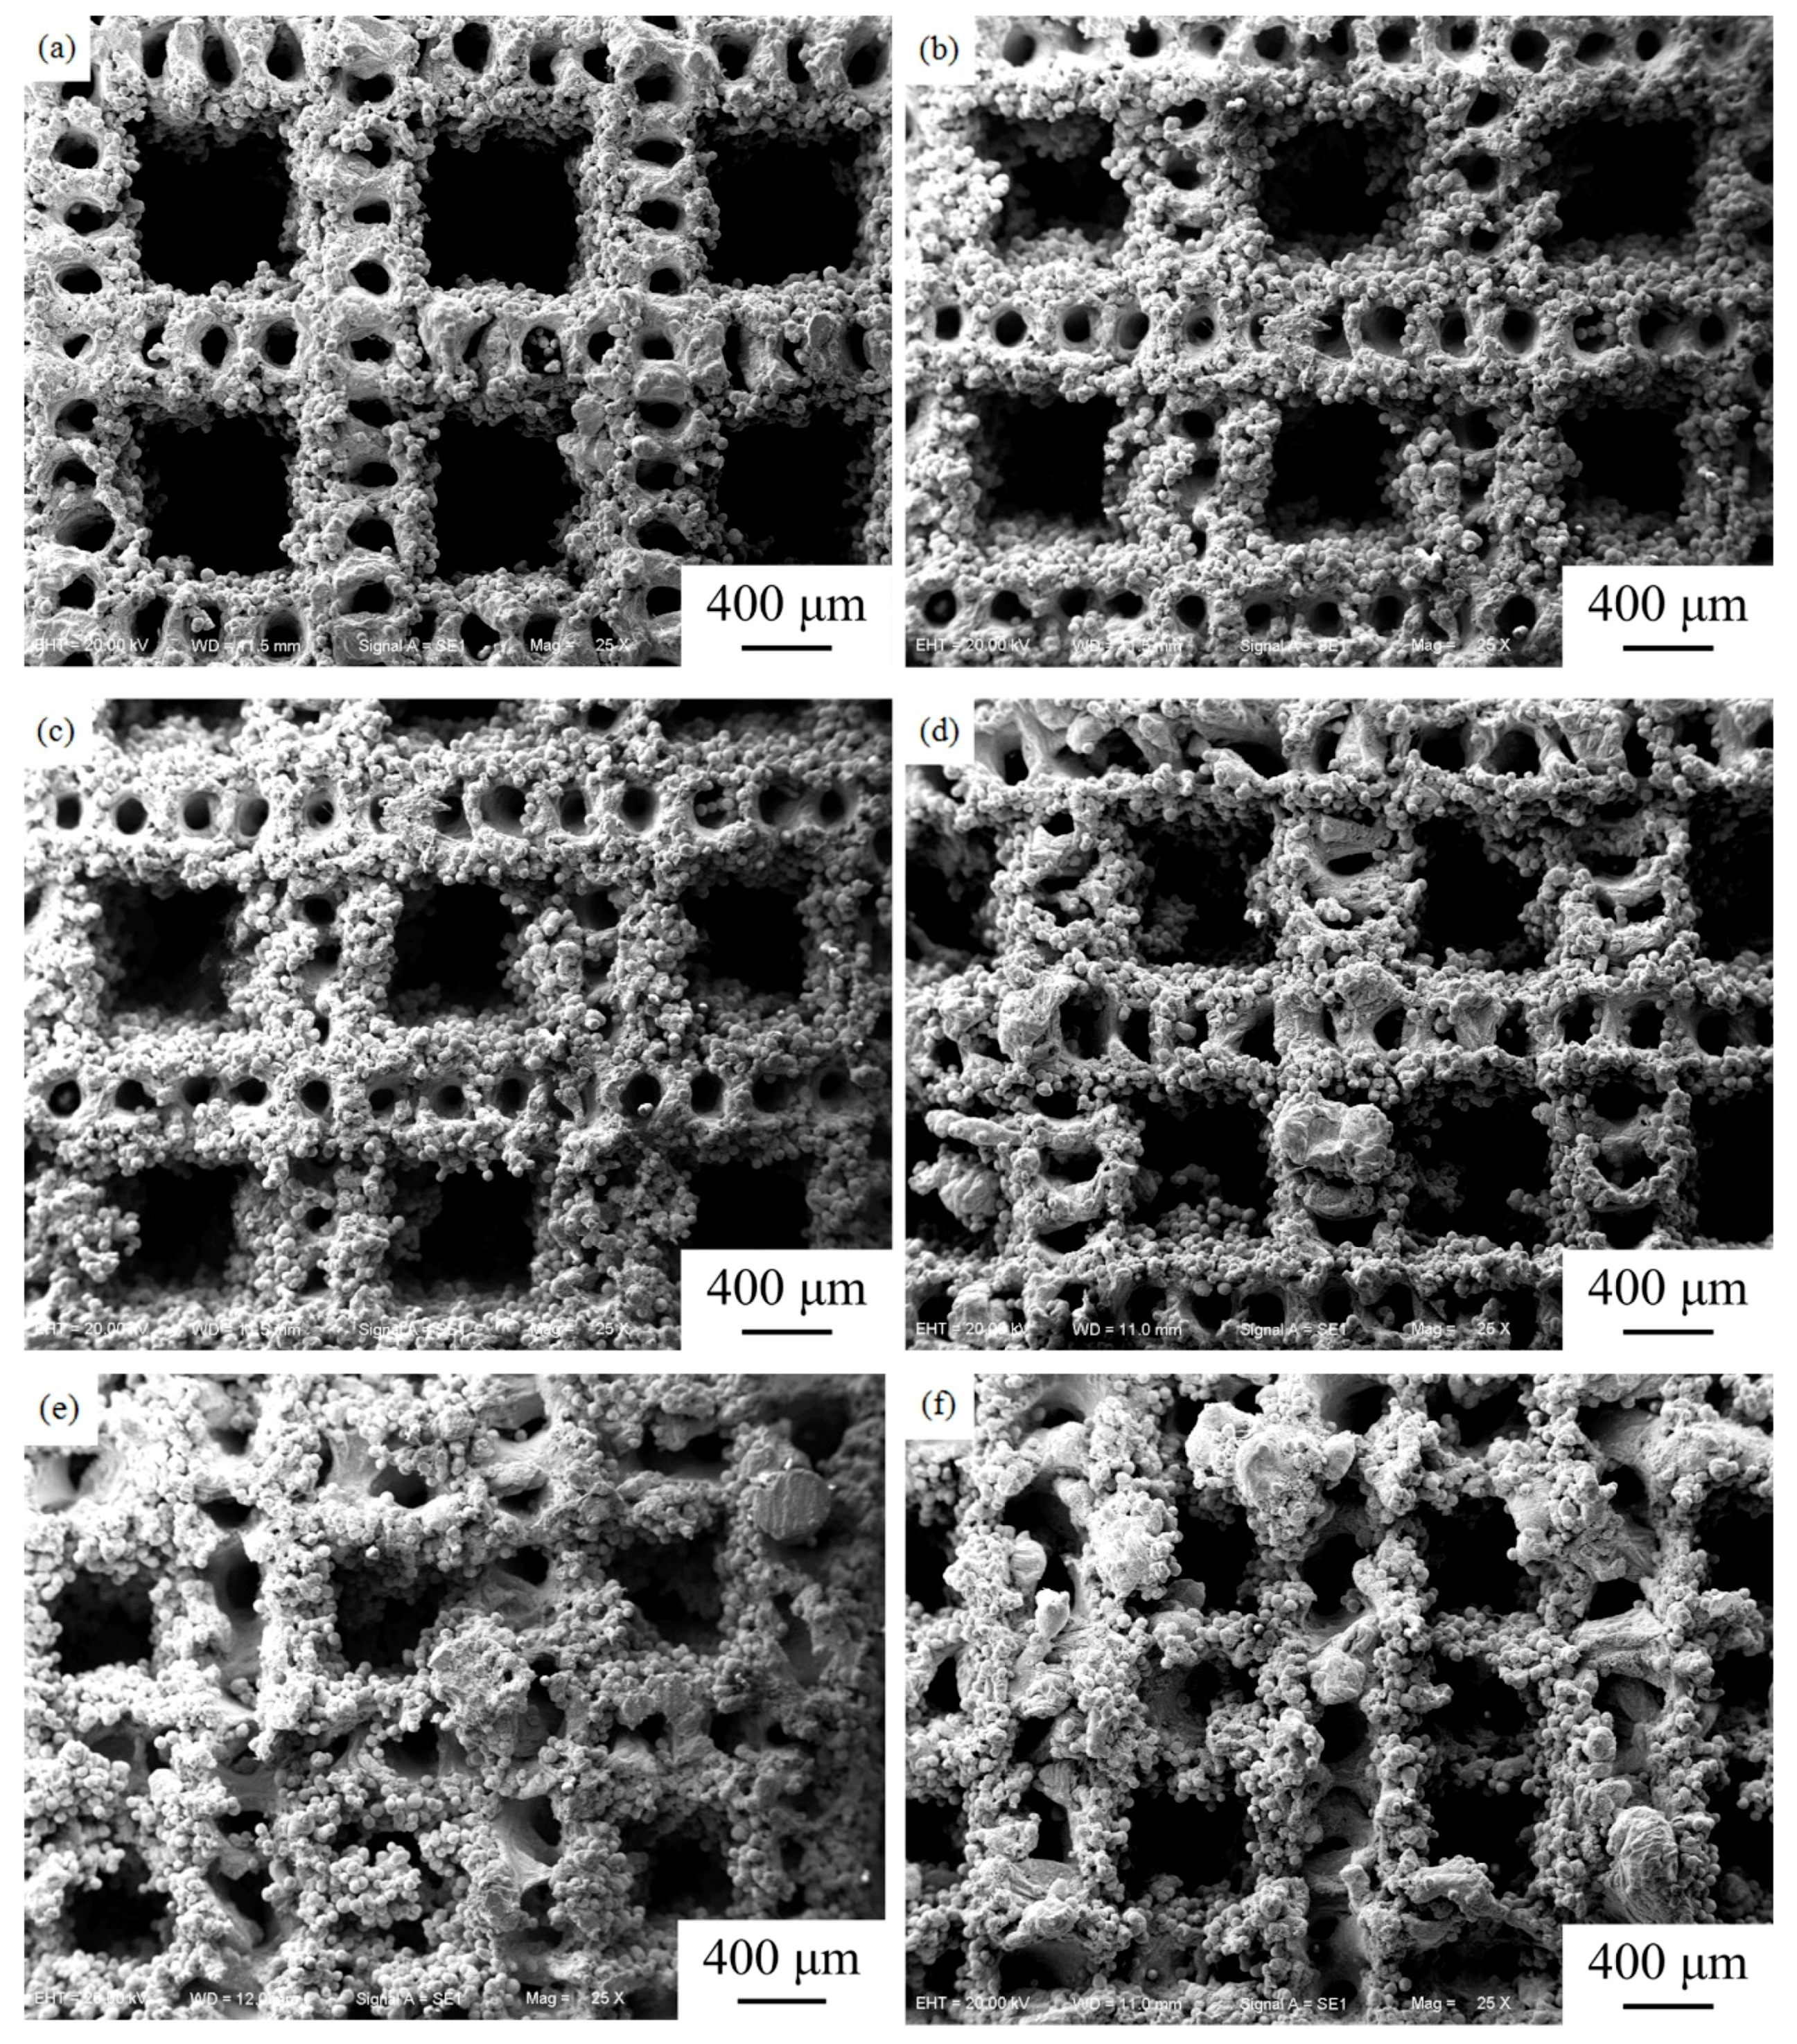
Figure 4.
Porosity variation curve of the LAMed ZK61 deposited at different E.

Figure 5.
Cross-section morphologies of the LAMed Mg-Zn-Zr alloys. (a) E1, (b) E2, (c) E3.

Figure 6.
XRD patterns of the LAMed Mg-Zn-Zr alloys over 20–80°.

Figure 7.
SEM micrographs of the molten pool of the LAMed porous Mg-Zn-Zr alloys. (a) E1 (Cross section), (b) E1 (Longitudinal section), (c) E2 (Cross section), (d) E2 (Longitudinal section), (e) E3 (Cross section), (f) E3 (Longitudinal section).
Figure 7.
SEM micrographs of the molten pool of the LAMed porous Mg-Zn-Zr alloys. (a) E1 (Cross section), (b) E1 (Longitudinal section), (c) E2 (Cross section), (d) E2 (Longitudinal section), (e) E3 (Cross section), (f) E3 (Longitudinal section).

Figure 8.
SEM and corresponding EDS images of the LAMed Mg-Zn-Zr alloys. (a) E1, (b) E2, (c) E3.
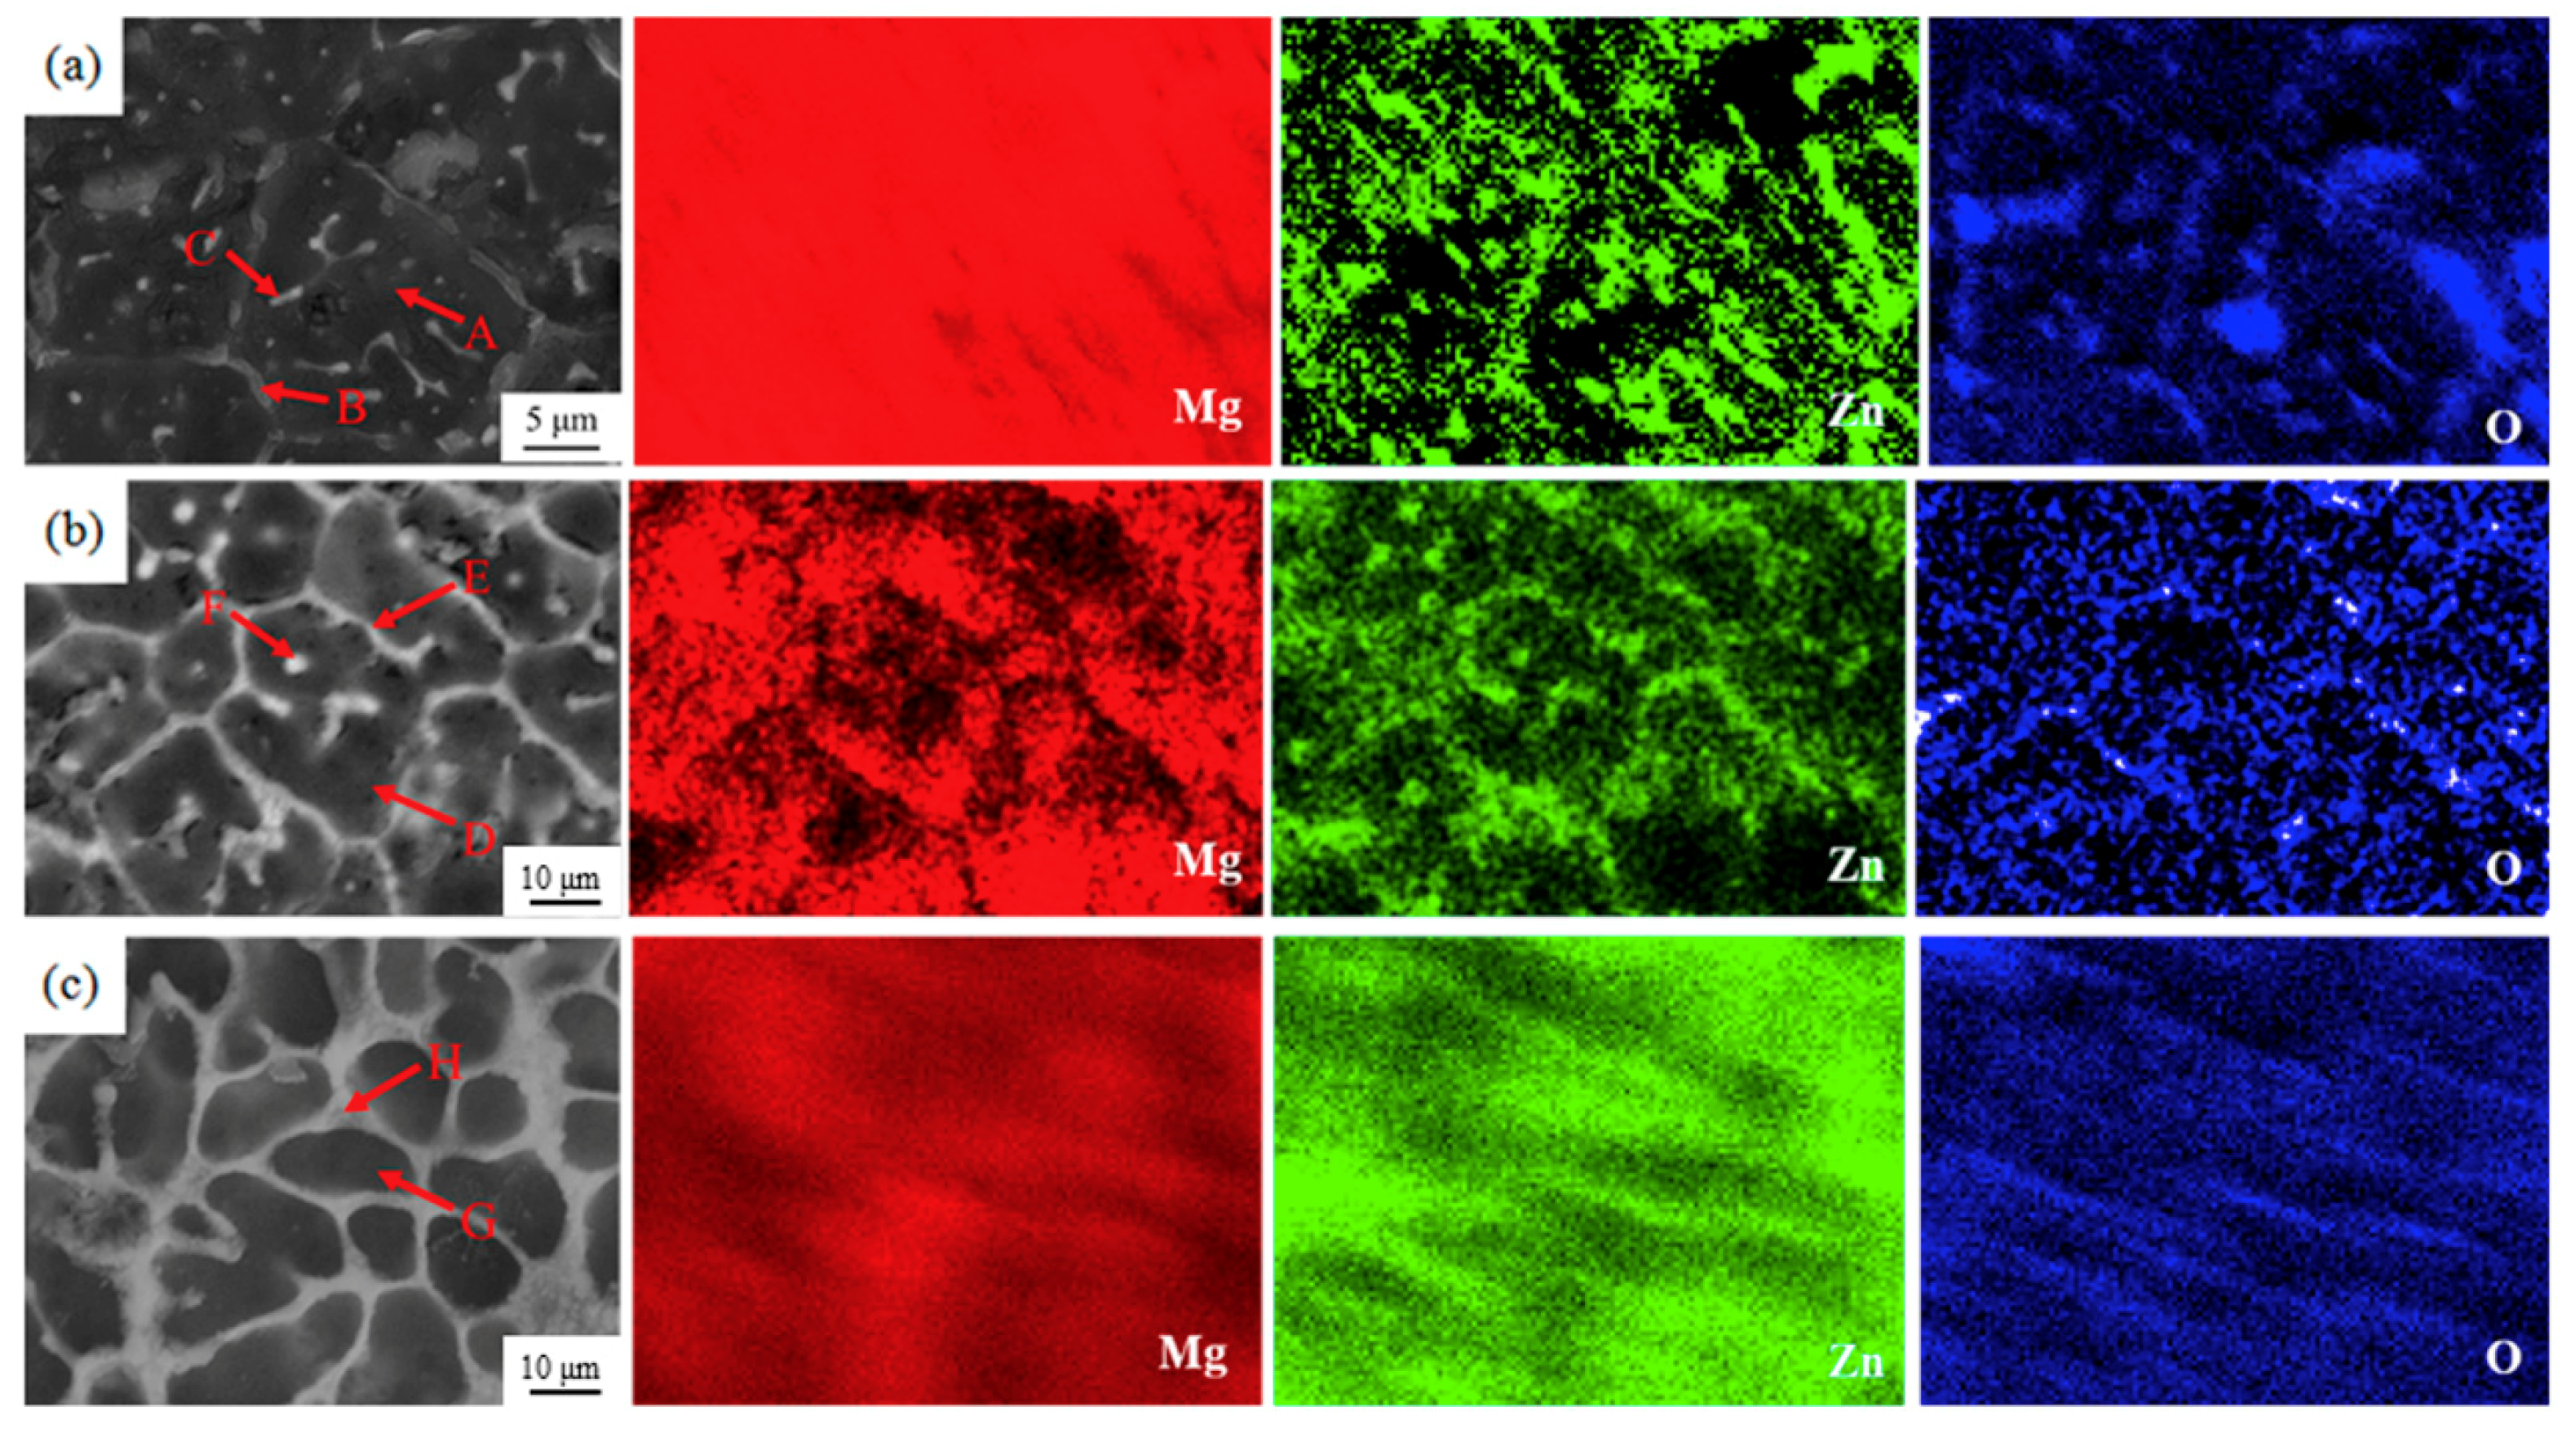
Figure 9.
Microhardness of the LAMed Mg-Zn-Zr alloys.

Figure 10.
Compressive stress-strain curves of the LAMed Mg-Zn-Zr alloys. (a) Horizontal compression, (b) Longitudinal compression.
Figure 10.
Compressive stress-strain curves of the LAMed Mg-Zn-Zr alloys. (a) Horizontal compression, (b) Longitudinal compression.


Figure 11.
Compressive fracture morphologies of the LAMed porous Mg-Zn-Zr alloys. (a,c,e) E1, E1 and E3 (the horizontal compression), (b,d,f) E1, E2 and E3 (the longitudinal compression).
Figure 11.
Compressive fracture morphologies of the LAMed porous Mg-Zn-Zr alloys. (a,c,e) E1, E1 and E3 (the horizontal compression), (b,d,f) E1, E2 and E3 (the longitudinal compression).


Table 1.
The abbreviations of different Mg-Zn-Zr alloys.
| Abbreviation | Powder Component (wt.%) | Zn | Zr | Mg |
|---|---|---|---|---|
| E1 | Mg-5.2%Zn-0.3%Zr | 5.2 | 0.30 | Bal. |
| E2 | Mg-15%Zn-0.3%Zr | 15.0 | 0.27 | Bal. |
| E3 | Mg-30%Zn-0.3%Zr | 30.0 | 0.22 | Bal. |
Table 2.
LAM parameters used in present study.
| Processing Parameters | Value |
|---|---|
| Laser power P, (W) | 60, 70, 80, 90, 100, 110 |
| Pulse width W, (ms) | 2.5 |
| Frequency f, (HZ) | 30 |
| Hatch spacing d, (mm) | 1.5 |
| Scanning velocity V, (mm/s) | 10 |
| Laser spot size D, (mm) | 0.1 |
| Defocusing amount J, (mm) | 0 |
| Layer thickness T, (mm) | 0.04 |
Table 3.
Grain size of the molten pool of the LAMed Mg-Zn-Zr alloys.
| Samples | Grain Size (μm) | Grain Szie (μm) |
|---|---|---|
| Cross Section | Longitudinal Section | |
| E1 | 6.1 | 5.2 |
| E2 | 2.3 | 2.9 |
| E3 | 1.1 | 1.6 |
Table 4.
EDS results marked A–H in Figure 8.
Table 4.
EDS results marked A–H in Figure 8.
| Position | Mg (wt.%) | Zn (wt.%) | O (wt.%) | Zr (wt.%) |
|---|---|---|---|---|
| A | 88.81 | 6.30 | 5.09 | 0.80 |
| B | 75.70 | 12.65 | 9.80 | 1.85 |
| C | 71.53 | 17.55 | 8.75 | 2.28 |
| D | 80.53 | 12.05 | 6.62 | 0.80 |
| E | 67.51 | 16.68 | 15.07 | 1.85 |
| F | 67.77 | 21.20 | 9.38 | 1.55 |
| G | 75.69 | 20.33 | 5.10 | 0.88 |
| H | 61.69 | 30.52 | 6.21 | 1.58 |
Table 5.
Mechanical properties of the LAMed porous Mg-Zn-Zr alloys and human bone (HC: horizontal compression, LC: longitudinal compression).
Table 5.
Mechanical properties of the LAMed porous Mg-Zn-Zr alloys and human bone (HC: horizontal compression, LC: longitudinal compression).
| Samples | UCS (MPA) | Elastic Modulus (GPA) | Microhardness (HV) |
|---|---|---|---|
| E1 (HC) | 16.03 | 0.529 | 57.67 |
| E2 (HC) | 50.95 | 0.870 | 75.51 |
| E3 (HC) | 23.96 | 0.910 | 106.75 |
| E1 (LC) | 28.36 | 0.667 | 58.28 |
| E2 (LC) | 73.07 | 1.785 | 80.23 |
| E3 (LC) | 53.11 | 1.333 | 109.36 |
| Compact bone | 100–230 | 3–20 | |
| Cancellous bone | 0.2–80 | 0.01–2 |
© 2018 by the authors. Licensee MDPI, Basel, Switzerland. This article is an open access article distributed under the terms and conditions of the Creative Commons Attribution (CC BY) license (http://creativecommons.org/licenses/by/4.0/).
Share and Cite
MDPI and ACS Style
Zhang, M.; Chen, C.; Liu, C.; Wang, S. Study on Porous Mg-Zn-Zr ZK61 Alloys Produced by Laser Additive Manufacturing. Metals 2018, 8, 635. https://doi.org/10.3390/met8080635
AMA Style
Zhang M, Chen C, Liu C, Wang S. Study on Porous Mg-Zn-Zr ZK61 Alloys Produced by Laser Additive Manufacturing. Metals. 2018; 8(8):635. https://doi.org/10.3390/met8080635
Chicago/Turabian StyleZhang, Min, Changjun Chen, Chang Liu, and Shunquan Wang. 2018. "Study on Porous Mg-Zn-Zr ZK61 Alloys Produced by Laser Additive Manufacturing" Metals 8, no. 8: 635. https://doi.org/10.3390/met8080635
Note that from the first issue of 2016, this journal uses article numbers instead of page numbers. See further details here.