Effects of Electromagnetic Stirring on the Cast Austenitic Stainless Steel Weldments by Gas Tungsten Arc Welding


Nuclear Fuels and Materials Division, Institute of Nuclear Energy Research, Taoyuan 32546, Taiwan
*
Author to whom correspondence should be addressed.
Metals 2018, 8(8), 630; https://doi.org/10.3390/met8080630
Submission received: 20 June 2018
/
Revised: 25 July 2018
/
Accepted: 7 August 2018
/
Published: 10 August 2018
Abstract
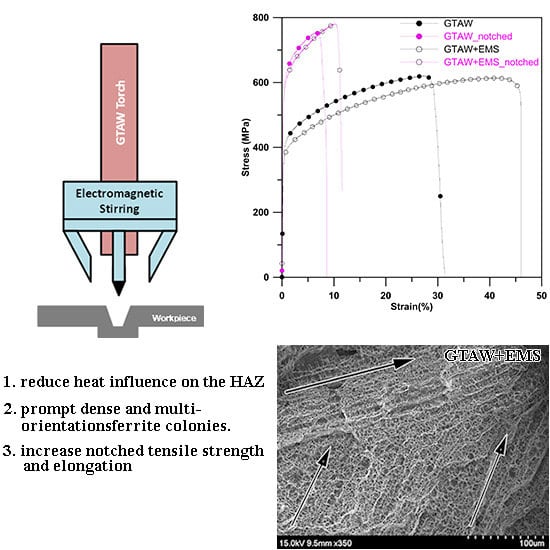
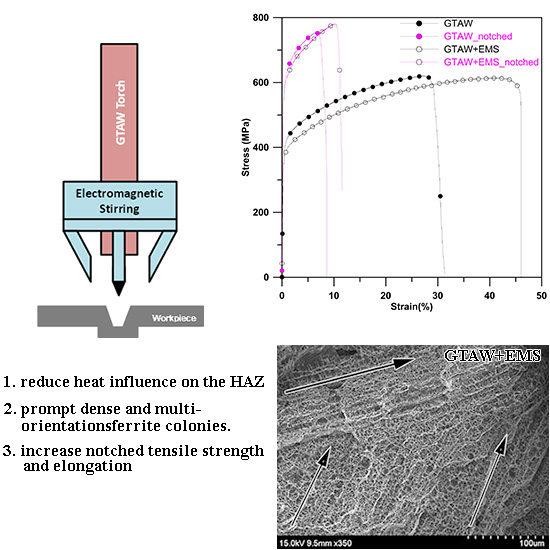
:Cast austenitic stainless steel (CASS) often contains high contents of silicon, phosphorus, and sulfur to prompt low melting phases to form in the welds. As a result, welding defects can be induced to degrade the welds. This study’s purpose was to investigate the effects of electromagnetic stirring (EMS) on the CASS weldments. The results showed that the ferrites in the heat affected zone (HAZ) had tortuous grain boundaries, while those that were close to the fusion lines had transformed austenites. EMS could reduce the influence of the welding heat to make the grain boundaries less tortuous and the transformed austenites smaller. Although their temperature profiles were almost the same, the gas-tungsten-arc-welding (GTAW) weld had smaller grains with massive ferrite colonies and more precipitates, while the GTAW+EMS weld had denser ferrite colonies with multi-orientations, but fewer precipitates. The hardness of the base metals and HAZs were typically higher than that of the welds. For both of the welds, the root was the region with the highest hardness. The hardness decreased from the root to the cap regions along the thickness direction. The GTAW weld had a higher hardness than the GTAW+EMS weld. At room temperature, the GTAW+EMS weld had a higher notched tensile strength and elongation than the GTAW weld. This could be attributed to the observation that the GTAW+EMS weld had dense and intersecting dendrites and that more austenites were deformed during tensile testing.
1. Introduction
Cast austenitic stainless steel (CASS), with excellent mechanical properties and corrosion resistance, is a material that is often used for the essential components of pressurized water reactors (PWRs), such as reactor coolant pipes. With long-term operation at elevated temperatures, CASS components could be degraded by thermal embrittlement, affecting the safety of nuclear power plants, owing to the spinodal decomposition of ferrites [1].
The heat exchange tubes of PWR steam generators are made of Nickel-based alloy 600. These tubes are often plugged due to the leakage resulting from stress corrosion cracking (SCC) [2]. However, with an increase of plugged tubes, the efficiency of the power generation would suffer as a consequence. Welding CASS piping, a connection between hot/cold nozzles and the steam generator, is often performed to repair defected hot/cold leg welds or to replace inefficient steam generators with new ones.
In general, CASS has a high silicon content to improve its castability and corrosion resistance. However, the high Si content could prompt the formation of low melting phases, which could induce hot cracking of CASS weldments [3]. Besides, CASS has a large number of ferrites to dissolve more phosphorus and sulfur than ordinary austenitic stainless steels. As a result, it could improve its weldability significantly by the reduction of low-melting phases resulting from the phosphorus and sulfur.
Electromagnetic stirring (EMS) is often adopted in the processes of gas tungsten arc welding (GTAW) and plasma arc welding (PAW) to refine grains and to modify the characteristics of the grain boundary to improve weldability [4,5,6,7,8,9,10,11,12,13,14]. It is mainly contributed to the Lorentz force resulting from the interaction between the welding current and the imposed magnetic field. With the formation of the Lorentz force, the liquid of the weld pool could rotate to reduce the temperature gradient, increase the number of nuclei, and change the direction of the steepest temperature gradient. The weld grains could be refined too as a result [15]. Studies with another welding process, such as gas metal arc welding, spot resistance welding, and laser welding, have also reported the positive effect of EMS [16,17,18,19].
It has been reported that electromagnetic stirring with a frequency of about 2.5 Hz could remarkably refine the grain size of aluminum alloy [9]. Low-frequency electromagnetic stirring can efficiently refine the grains of nickel-based alloys. At the stirring frequency 7 Hz, the nickel-based alloy weldments show the lowest fraction of columnar dendrites [4,5].
ER308L is used as a filler metal for welding Type 300 austenitic stainless steels and for welding CASS as well. As a result of a higher dilution by the CASS base metal, welding defects could be readily induced in the welds, especially for the CASS with a higher content of phosphorus and sulfur. This work sought to investigate the effects of electromagnetic stirring (EMS) on the microstructure and mechanical properties of the CASS weldments to provide technical support for future repair work.
2. Materials and Methods
CASS plates, with the dimensions of 140.0 × 65.0 × 9.0 (mm), were used as the base metals of this study. They were machined from the static castings with reference to ASTM A351/CF8A. Of the compositions of this casting specification, the sulfur content was intended to increase to the upper limit for a study with a high susceptibility to hot cracking. ER308L with a diameter of 0.9 mm was employed as the filler metal. The welding process was performed with a mechanical gas tungsten arc welding (GTAW) process with/without the application of EMS. The EMS effects on the microstructure and mechanical properties of the CASS weldments were investigated. Table 1 gives the compositions of the base metal and the filler metal.
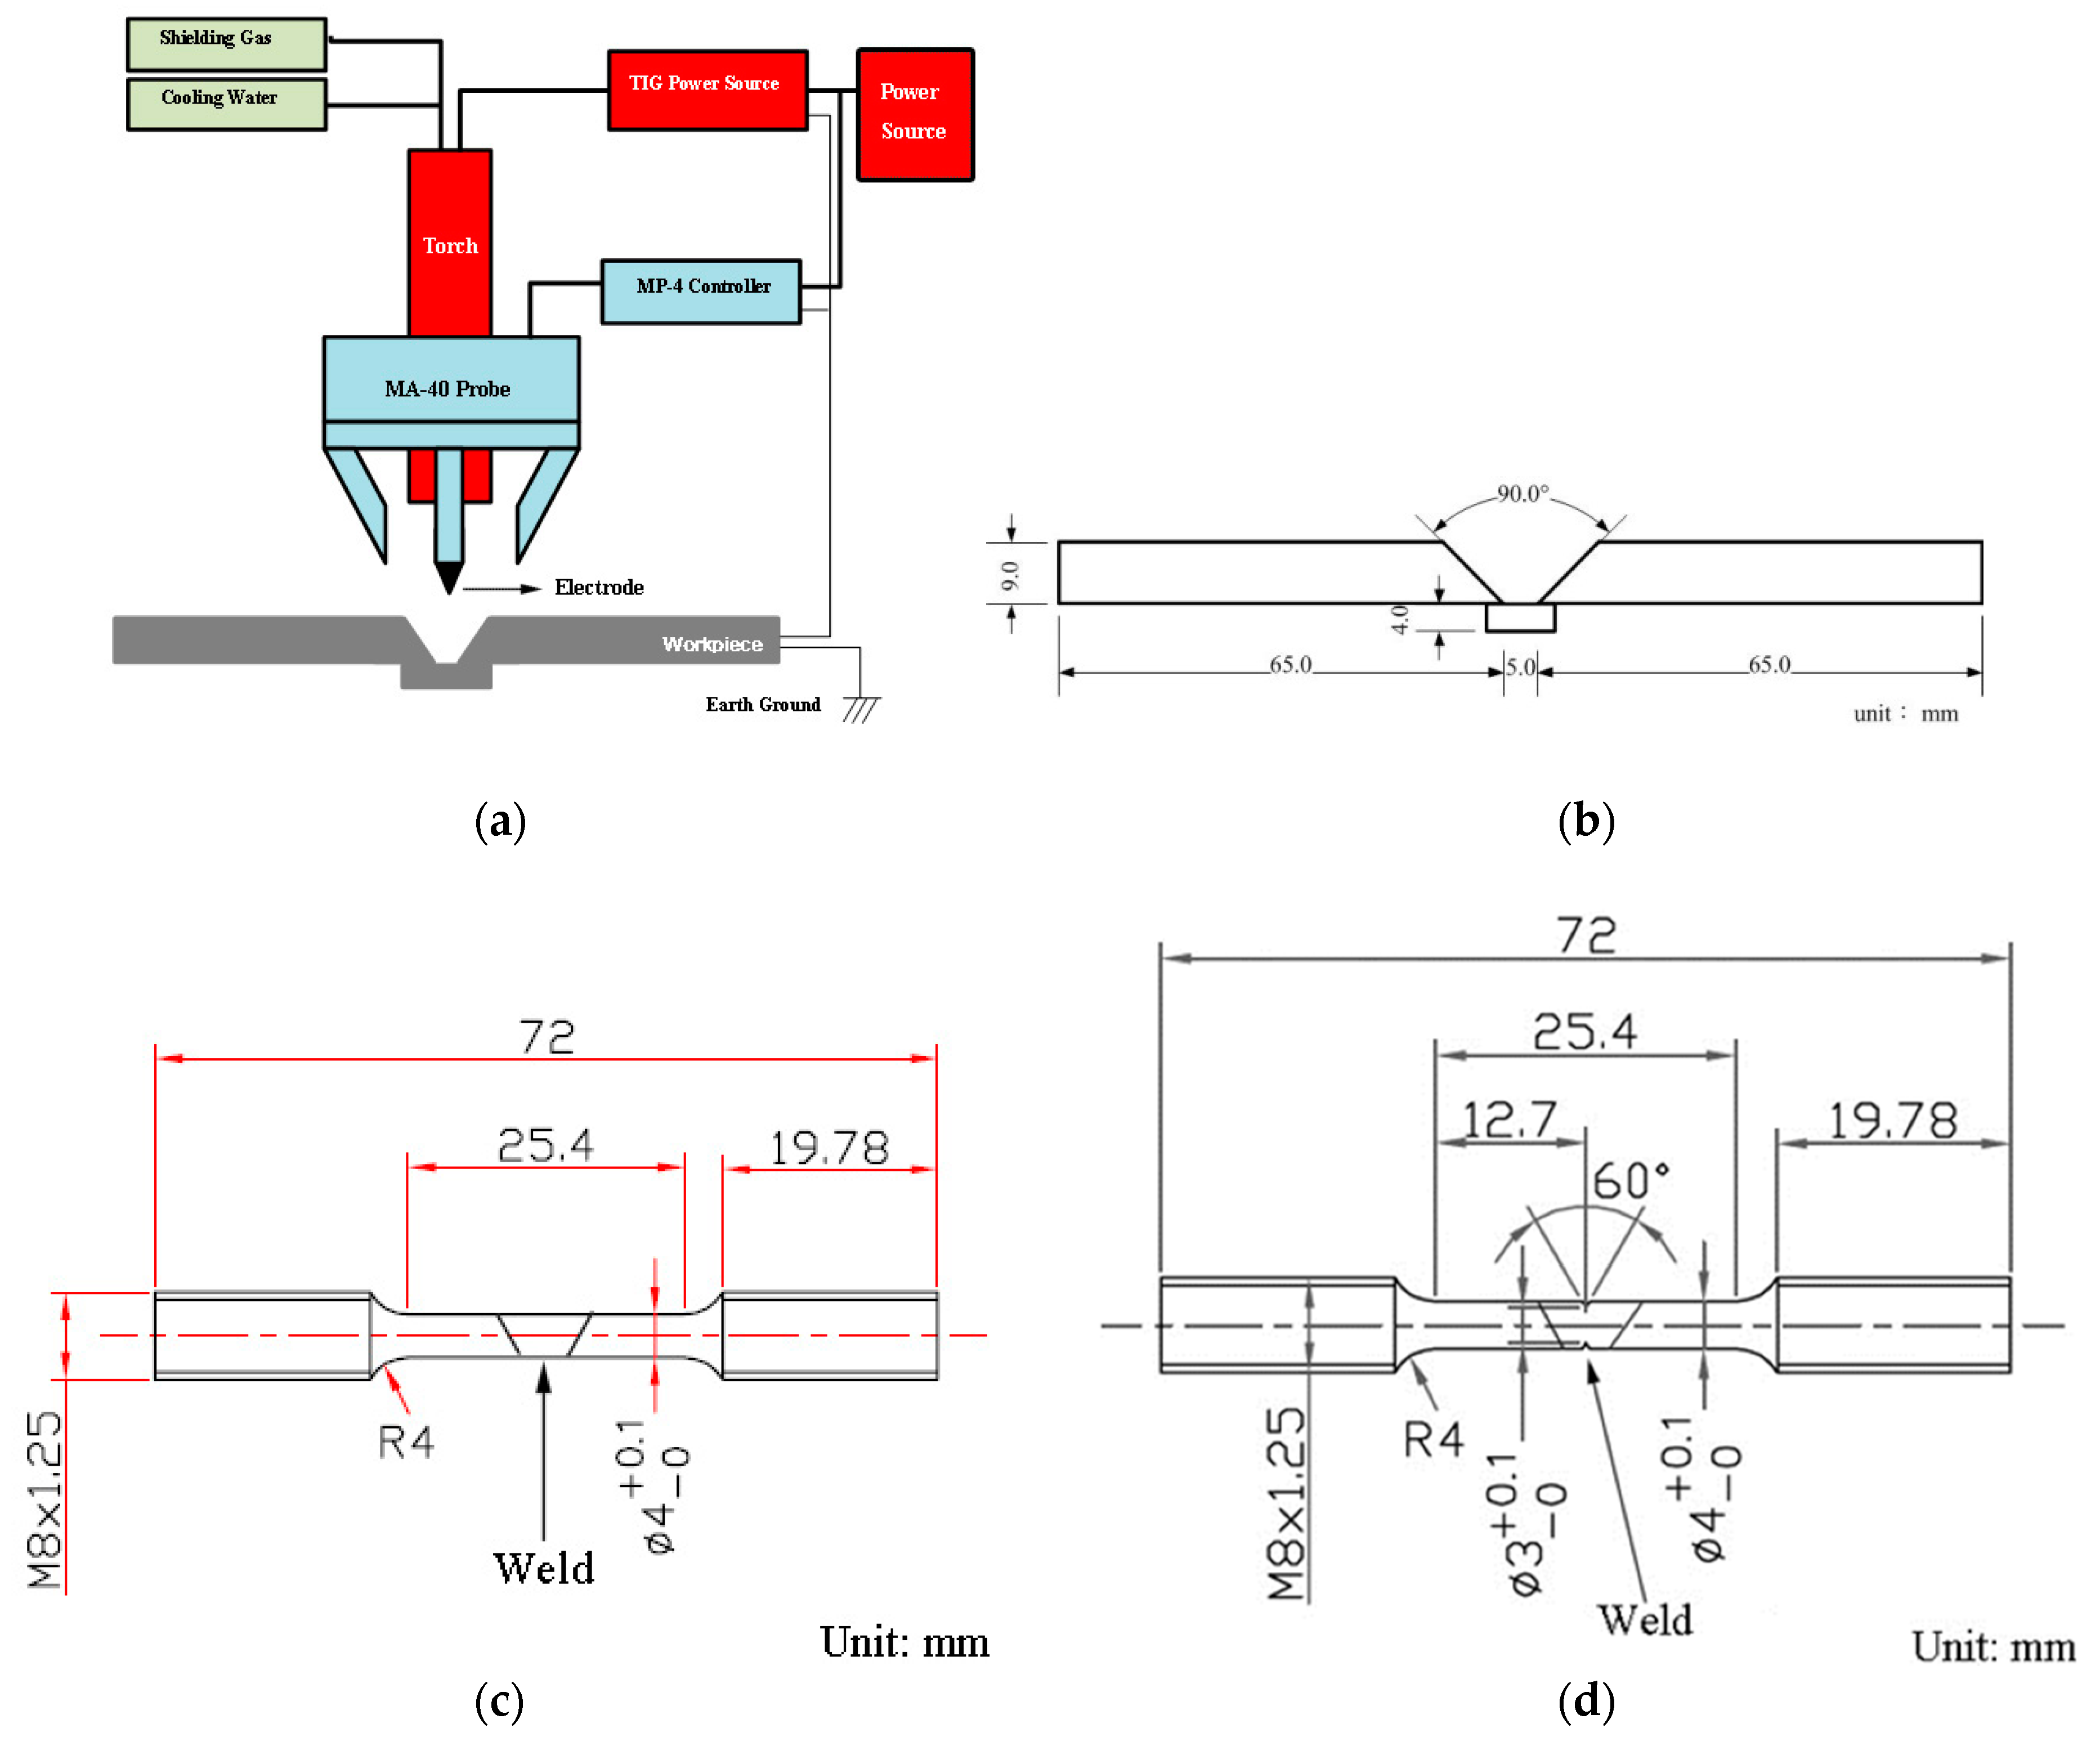
Before welding, the specimens were positioned on the fixture of the welding machine. The grooved surface of the specimens were cleaned with alcohol. The welding was performed with a mechanical GTAW process under a mode of direct current electrode negative (DCEN). The welding current was set at 180 A, while the welding voltage was about 11 V with a fixed distance between the electrode and the base metal. An MA-40 probe and an MP-4 controller, produced by Arc Products Inc., San Diego, CA, USA, were applied for the external EMS equipment. The EMS frequency was set at 3 Hz. The scheme diagram of the experimental set-up for the external EMS equipment and the weldment are presented in Figure 1a,b, respectively.
After welding, visual inspection and a radiography test were both conducted to confirm that there were no defects present in the welds. The ferrite content of the welds and the base metals in the weldments were measured using FERITSCOPE® MP30 (Fischer Technology Inc., CT, USA), produced by Fischer Technology Inc., Connecticut, USA, with a testing mode of the ferrite number (FN). Each FN data was an average of seven tests. The specimens were then sampled with a mechanical process.
Bead-on-plate welding tests were performed to evaluate the temperature profiles of the HAZ and the weld areas. The temperature profiles of the heat affected zones were recorded by a high-speed radiation pyrometer, Sensortherm H316, produced by Sensortherm GmbH, Sulzbach, Taunus, Germany, while those for the welds were measured with R-type thermocouples, produced by Grandtek Instruments Co., Ltd., Taipei, Taiwan.
After mechanical polishing, the metallographic samples were electrolytically etched with a solution of 10 g oxalic acid and 100 mL H2O under 6~10 V DC for 30 s. An optical microscope (OM) was employed to examine the microstructure of the welds. Microstructural characterization and compositional analysis were performed with a scanning electron microscope (SEM), JSM-7100F, produced by JEOL Ltd., Tokyo, Japan, that was equipped with an energy dispersive spectroscope (EDS) and an electron backscatter diffraction (EBSD) system, produced by Oxford Instruments, Abingdon, UK. The areal fraction of the phases and the grain size all resulted from the EBSD analysis.
The micro-hardness measurements were taken with a load of 300 g. To further evaluate the influence of the welding heat on the microstructure, the hardness of the ferritic and austenitic phases were both measured at least at 10 points in the heat affected zone and the base metals, respectively. Hardness profiles through the weld metal, HAZ, and the base metal were also measured with a distance of 0.25 mm between two indentations in the root, middle, and the cap regions.
Uniaxial tensile tests were conducted with an MTS810 testing machine at a strain rate of 3 × 10⁻⁴ mm/s at room temperature. The tensile specimens were prepared according to ASTM-E8, as shown in Figure 1b. Some tensile specimens were notched at the welds to test their mechanical properties. The dimensions of the notched specimens are presented in Figure 1c. The fracture surface of the tested tensile specimen was further observed by SEM. The effects of electromagnetic stirring on the welds were then discussed based on the results of mechanical tests, fractographic examinations, and microstructural characterization.
3. Results
3.1. The Measurements of Ferrite Content
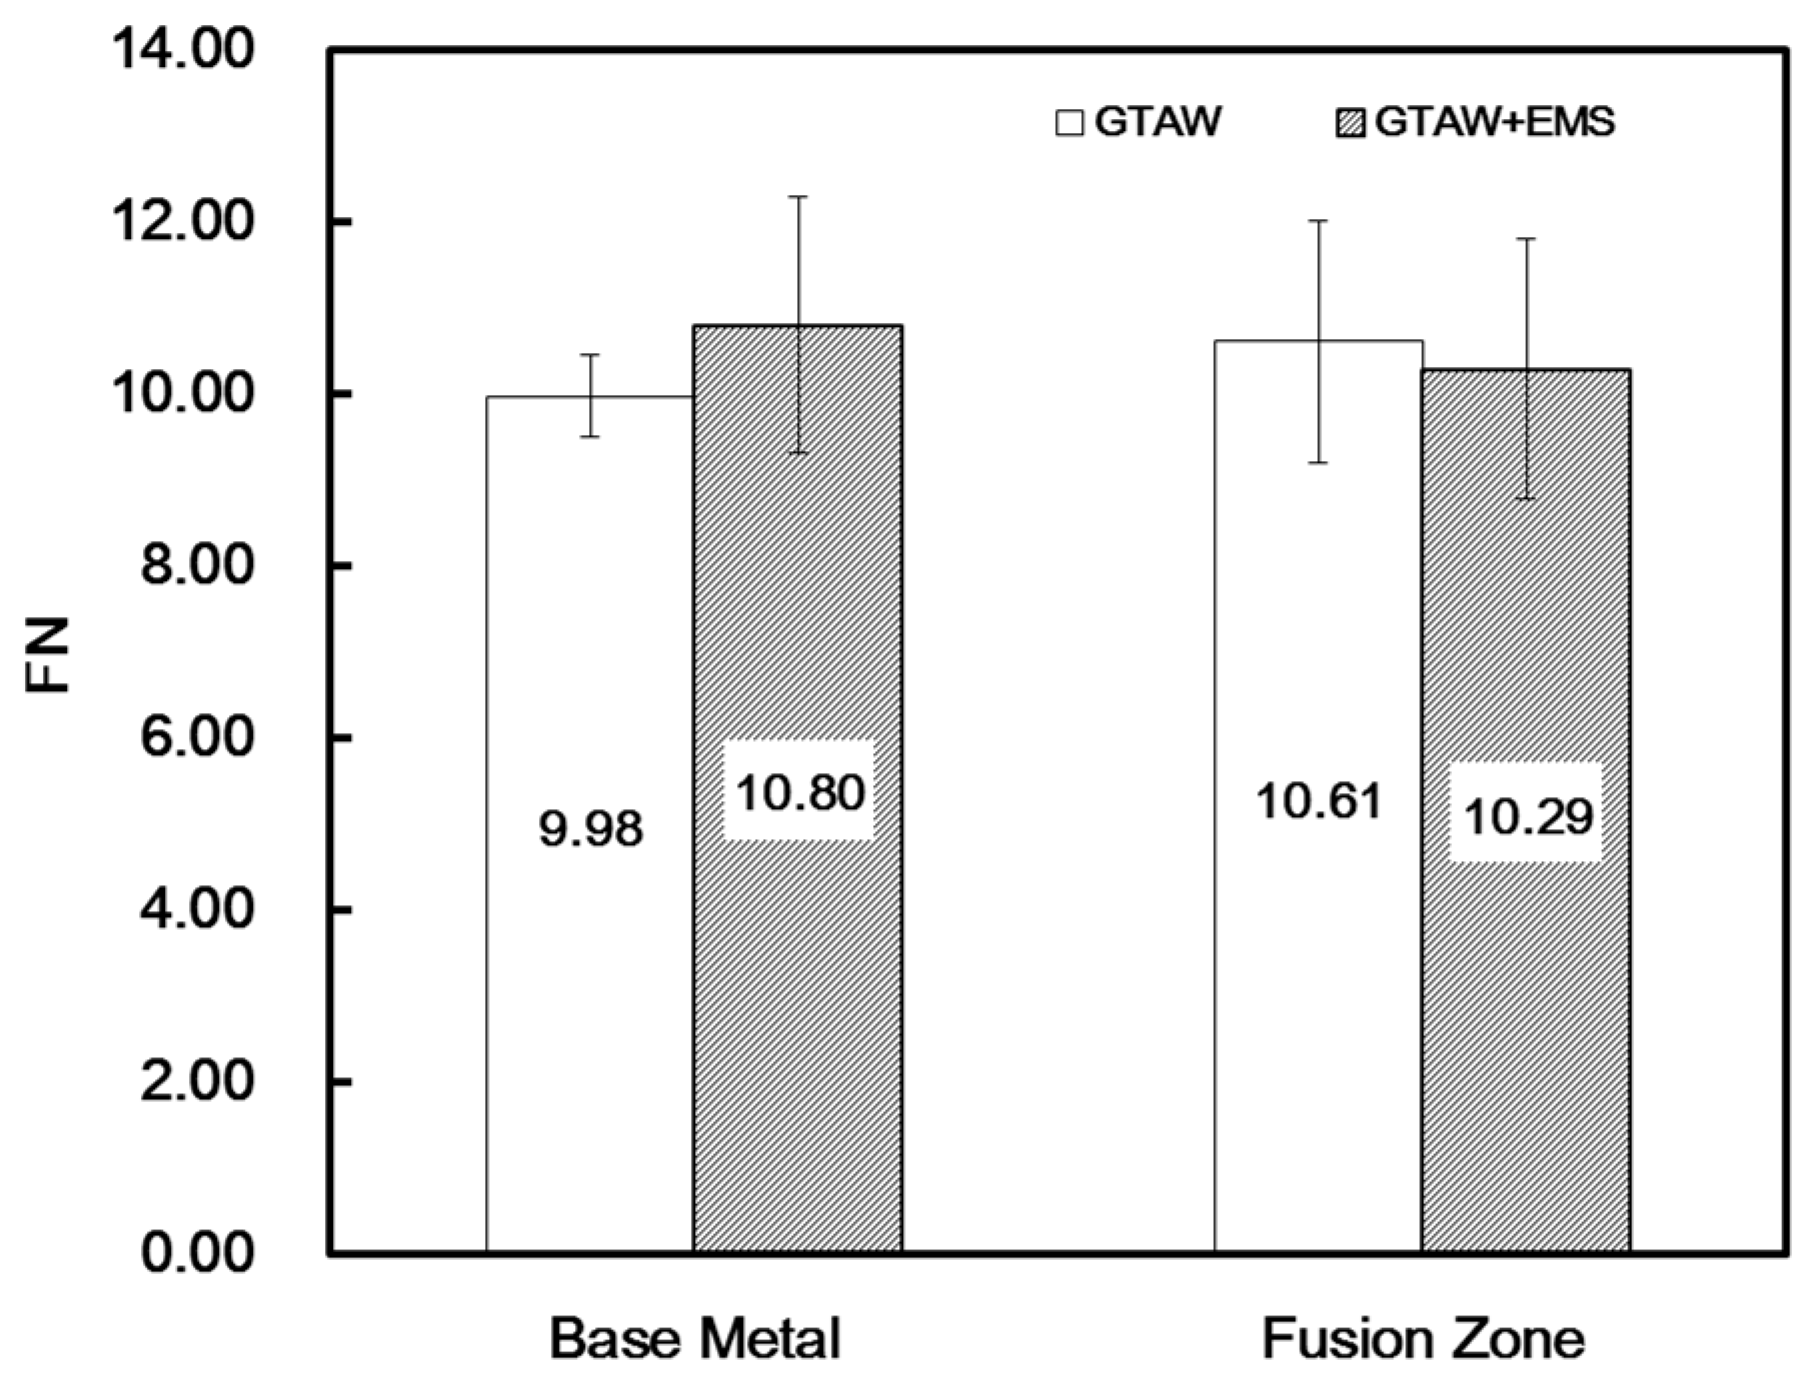
Figure 2 shows the FNs for the welds and base metals using FERITSCOPE® MP30. The welds and base metals are about 10 FN on average. It also indicates that the application of EMS would not significantly affect the average ferrite content of the welds.
3.2. The Microstructure of the Base Metal
The microstructure of the base metal was observed with an un-etched transversal specimen of GTAW+EMS weldments. Figure 3a illustrates that the ferrites are gray in color, while the white austenitic phases are dotted with black spots under the optical microscopic observations. The EDS analysis, Table 2, reveals that the ferrites have a higher Cr and Si content and that the austenitic phases possess more Ni and Mn.
The black spots look like voids under the optical microscopic observations. The EDS mapping, Figure 3b, shows that some dots are rich in Mn, S, and Si and some are rich in Mn, Si, and O. They are thought to be the inclusions that consist of MnS and Mn-Si-S oxides.
3.3. The HAZ Microstructure
Figure 4 shows the temperature profiles of the HAZs that were measured by bead-on-plate tests during welding. There is an apparent peak temperature at 1568 °C for the GTAW weldment, while there is a soaking temperature (1320~1250 °C) for 4.5 s for the GTAW+EMS weldment. Notably, there are serrations in the heating stage of the temperature profile for the GTAW+EMS. Besides, the highest heating and cooling rates of the HAZ were measured to be about 700 °C/s and 390 °C/s for the GTAW weldment, respectively, and about 1100 °C/s and 940 °C/s for the GTAW+EMS weldment. These observations suggest that EMS could lower the peak temperature of HAZ and raise the heating and cooling rates.
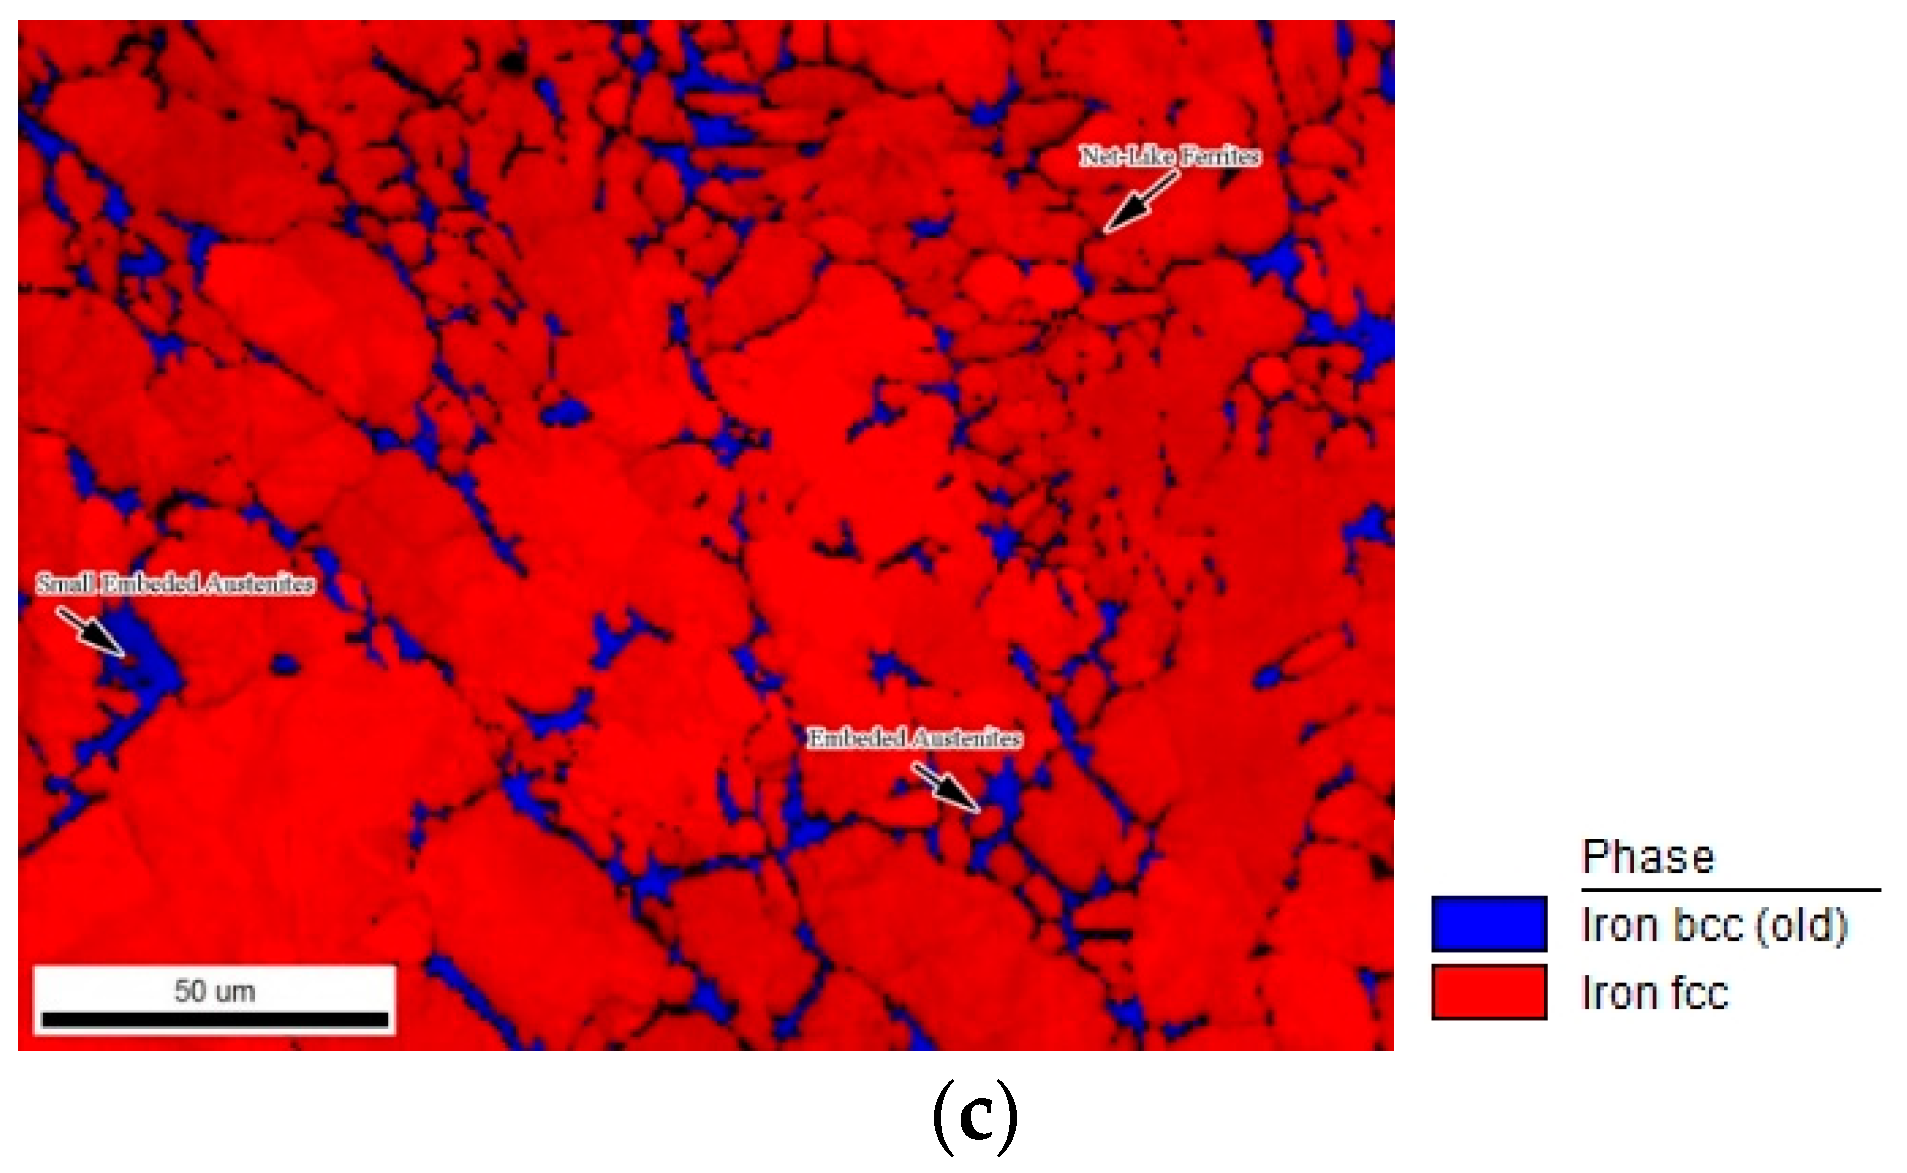
Figure 5a shows the microstructure of the GTAW weldment. The boundary and morphology of the ferrites in the HAZ could reflect the influence level of the welding heat. In the base metal (position 1), the influence of the welding heat was small. There are clear boundaries between the ferrites and the austenitic phases. Position 2 suffers more welding heat than position 1 (the base metal). The ferrites are embedded with austenitic phases, and their boundaries are winding. Position 3, which is more adjacent to the fusion line, was influenced more significantly by the welding heat than the other two. As a result, more net-like ferrites were formed at point 3, possibly resulting from the transformation of the embedded austenitic phases. The ferrites that were embedded with the austenitic phases are noted to form in the HAZ only. The EBSD analysis results of the HAZ in the GTAW weldment, Figure 5c, demonstrate the ferrites with embedded austenitic phases at position 2 and the net-like ferrites at position 3.
The microstructure of the GTAW+EMS weldment is exemplified in Figure 5b. In comparison with the GTAW weldment, the ferritic boundaries are less winding and the austenitic phases that are embedded in the ferrites are smaller, as evidenced by the micrograph of position 2 of Figure 5b. The net-like ferrites are also present in the HAZ near the fusion line, as shown in the micrograph of position 3 of Figure 5b. In terms of the areal fraction, their embedded austenitic phases are smaller than those around position 3 of the GTAW weld, Figure 5a. From the above results, the welding heat affects the HAZ of the GTAW+EMS weldment less than that of the GTAW weldment. EMS is considered to decrease the influence of welding heat on the HAZ.
Figure 6 and Table 3 present the results of the SEM observation and the EDS analysis of the HAZ of the GTAW weldment. The black particles in the HAZ have the same microstructural features and compositions as those in the base metal. They are the oxides with Mn, Si, and S that we have analyzed in the base metals.
3.4. The Microstructure of the Fusion Zone
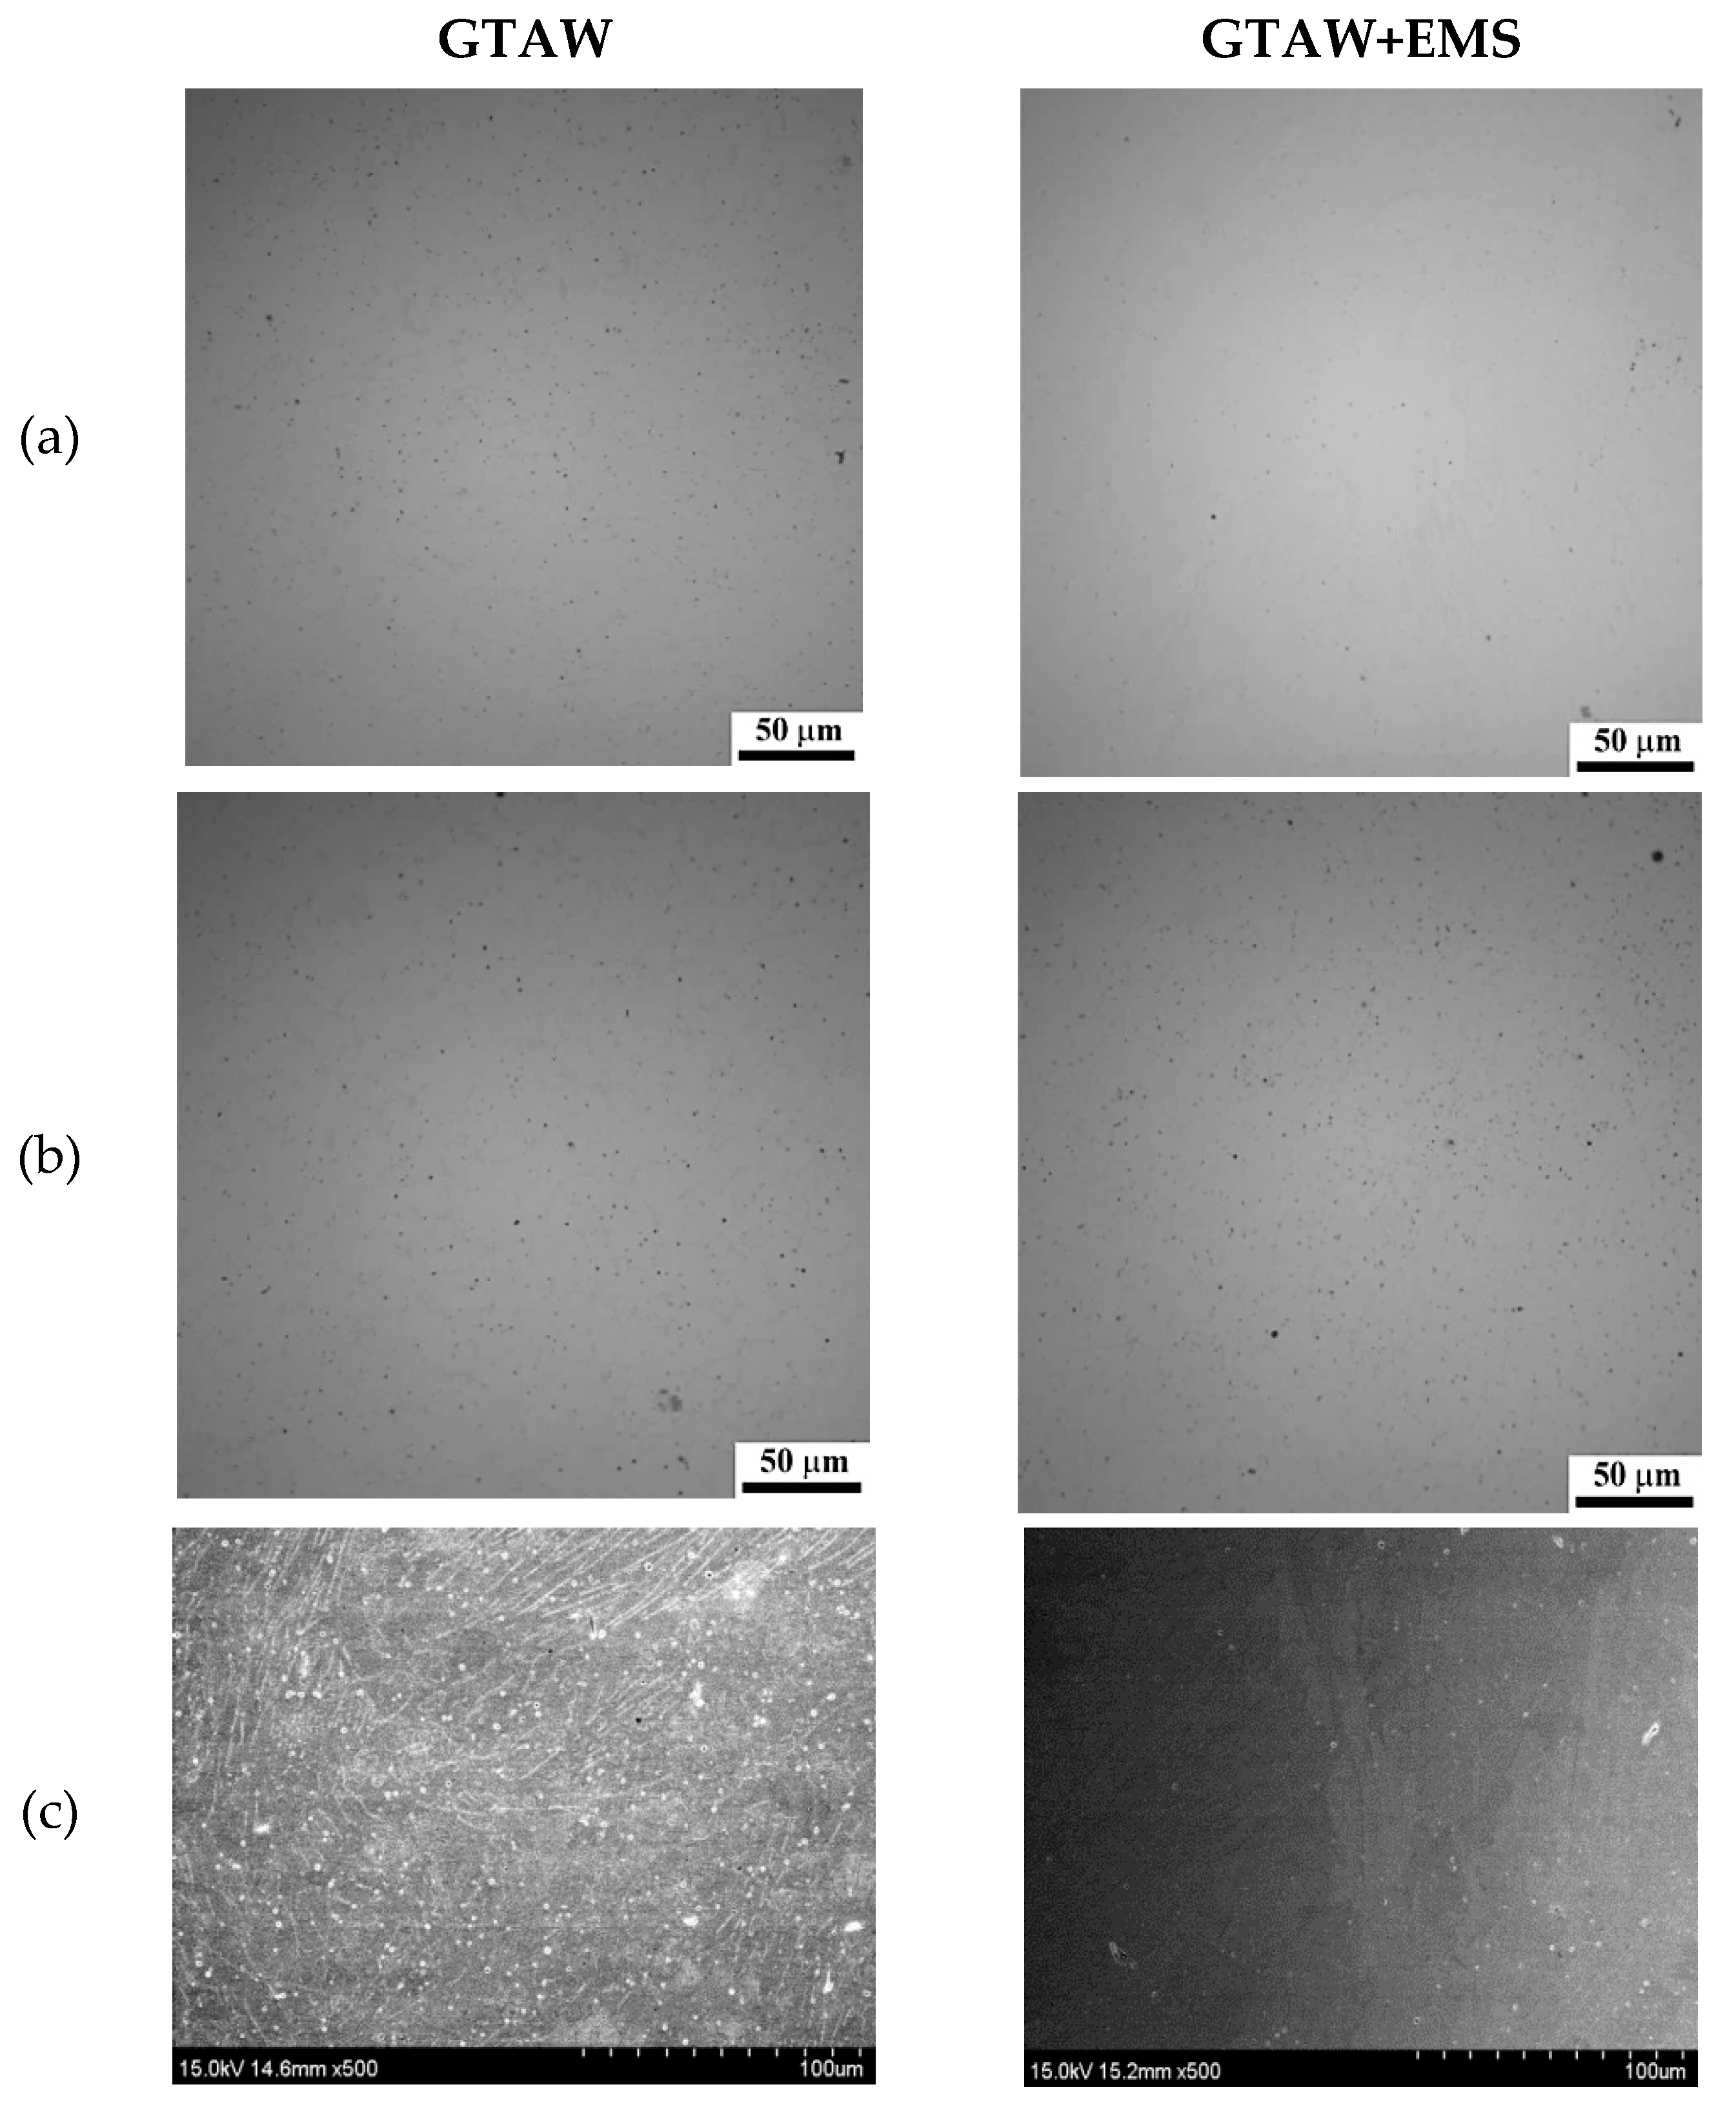
Figure 7a,b, the optical microscopic (OM) images of the polished welds before etching, show that there are black particles in the welds. They reveal that the smallest amount of the black particles are present in the cap region of the GTAW+EMS welds, and that comparable quantities were observed in the root regions of both the GTAW and GTAW+EMS welds. After etching, white points could be found in the welds under the SEM observation, as shown in Figure 7c. They could be the locations where oxides and MnS were formerly occupied. The SEM images also indicate that there are fewer white points in the GTAW+EMS weld than in the GTAW weld.
Figure 8a displays that the austenitic phases between the ferrite colonies are relatively more abundant in the GTAW weld than those in the GTAW+EMS weld. It manifests that the austenitic phases along the grain boundaries surround the ferrite colonies in the GTAW weld. Besides, there are more small precipitates in the GTAW weld and the dendrites in the grains of the GTAW weld are in less diverse orientations, as illustrated in Figure 8b.
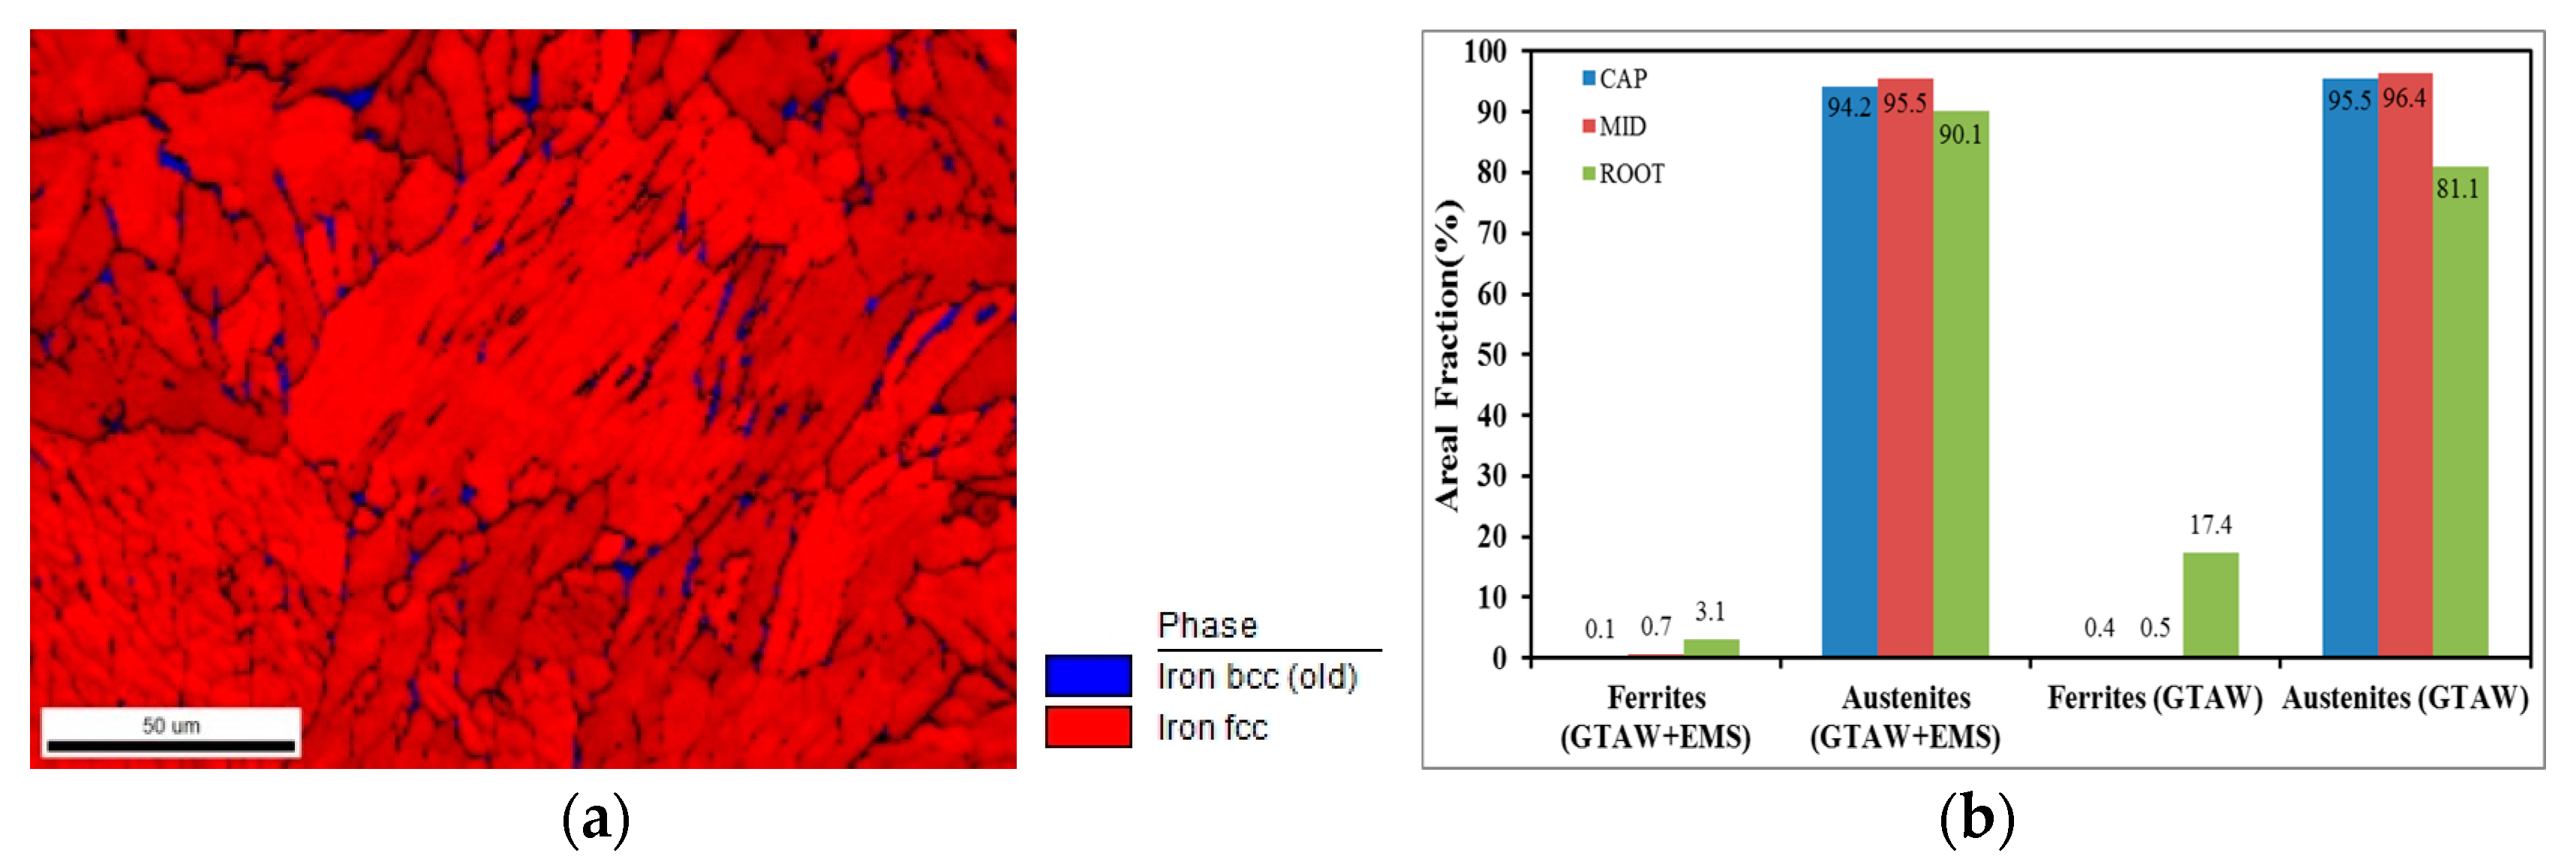
Figure 9a shows the EBSD results of the GTAW weld at the middle. There are some ferrites in the weld. At a magnification of 100, the ferritic content of the welds was measured by EBSD analysis. Figure 9b presents the results in an areal fraction. There is almost no ferrite in the weld, except in the root. It also demonstrates that the ferritic content of the root of the GTAW weld is higher than that of the GTAW+EMS. In the welds, the root is usually more diluted than the others due to the groove design. The higher ferrite content of the root is attributed to the high dilution from the CF8A. With the same groove design, the difference in the ferrite content resulting from the dilution also means that there is a discrepancy in the heat source between the welds.
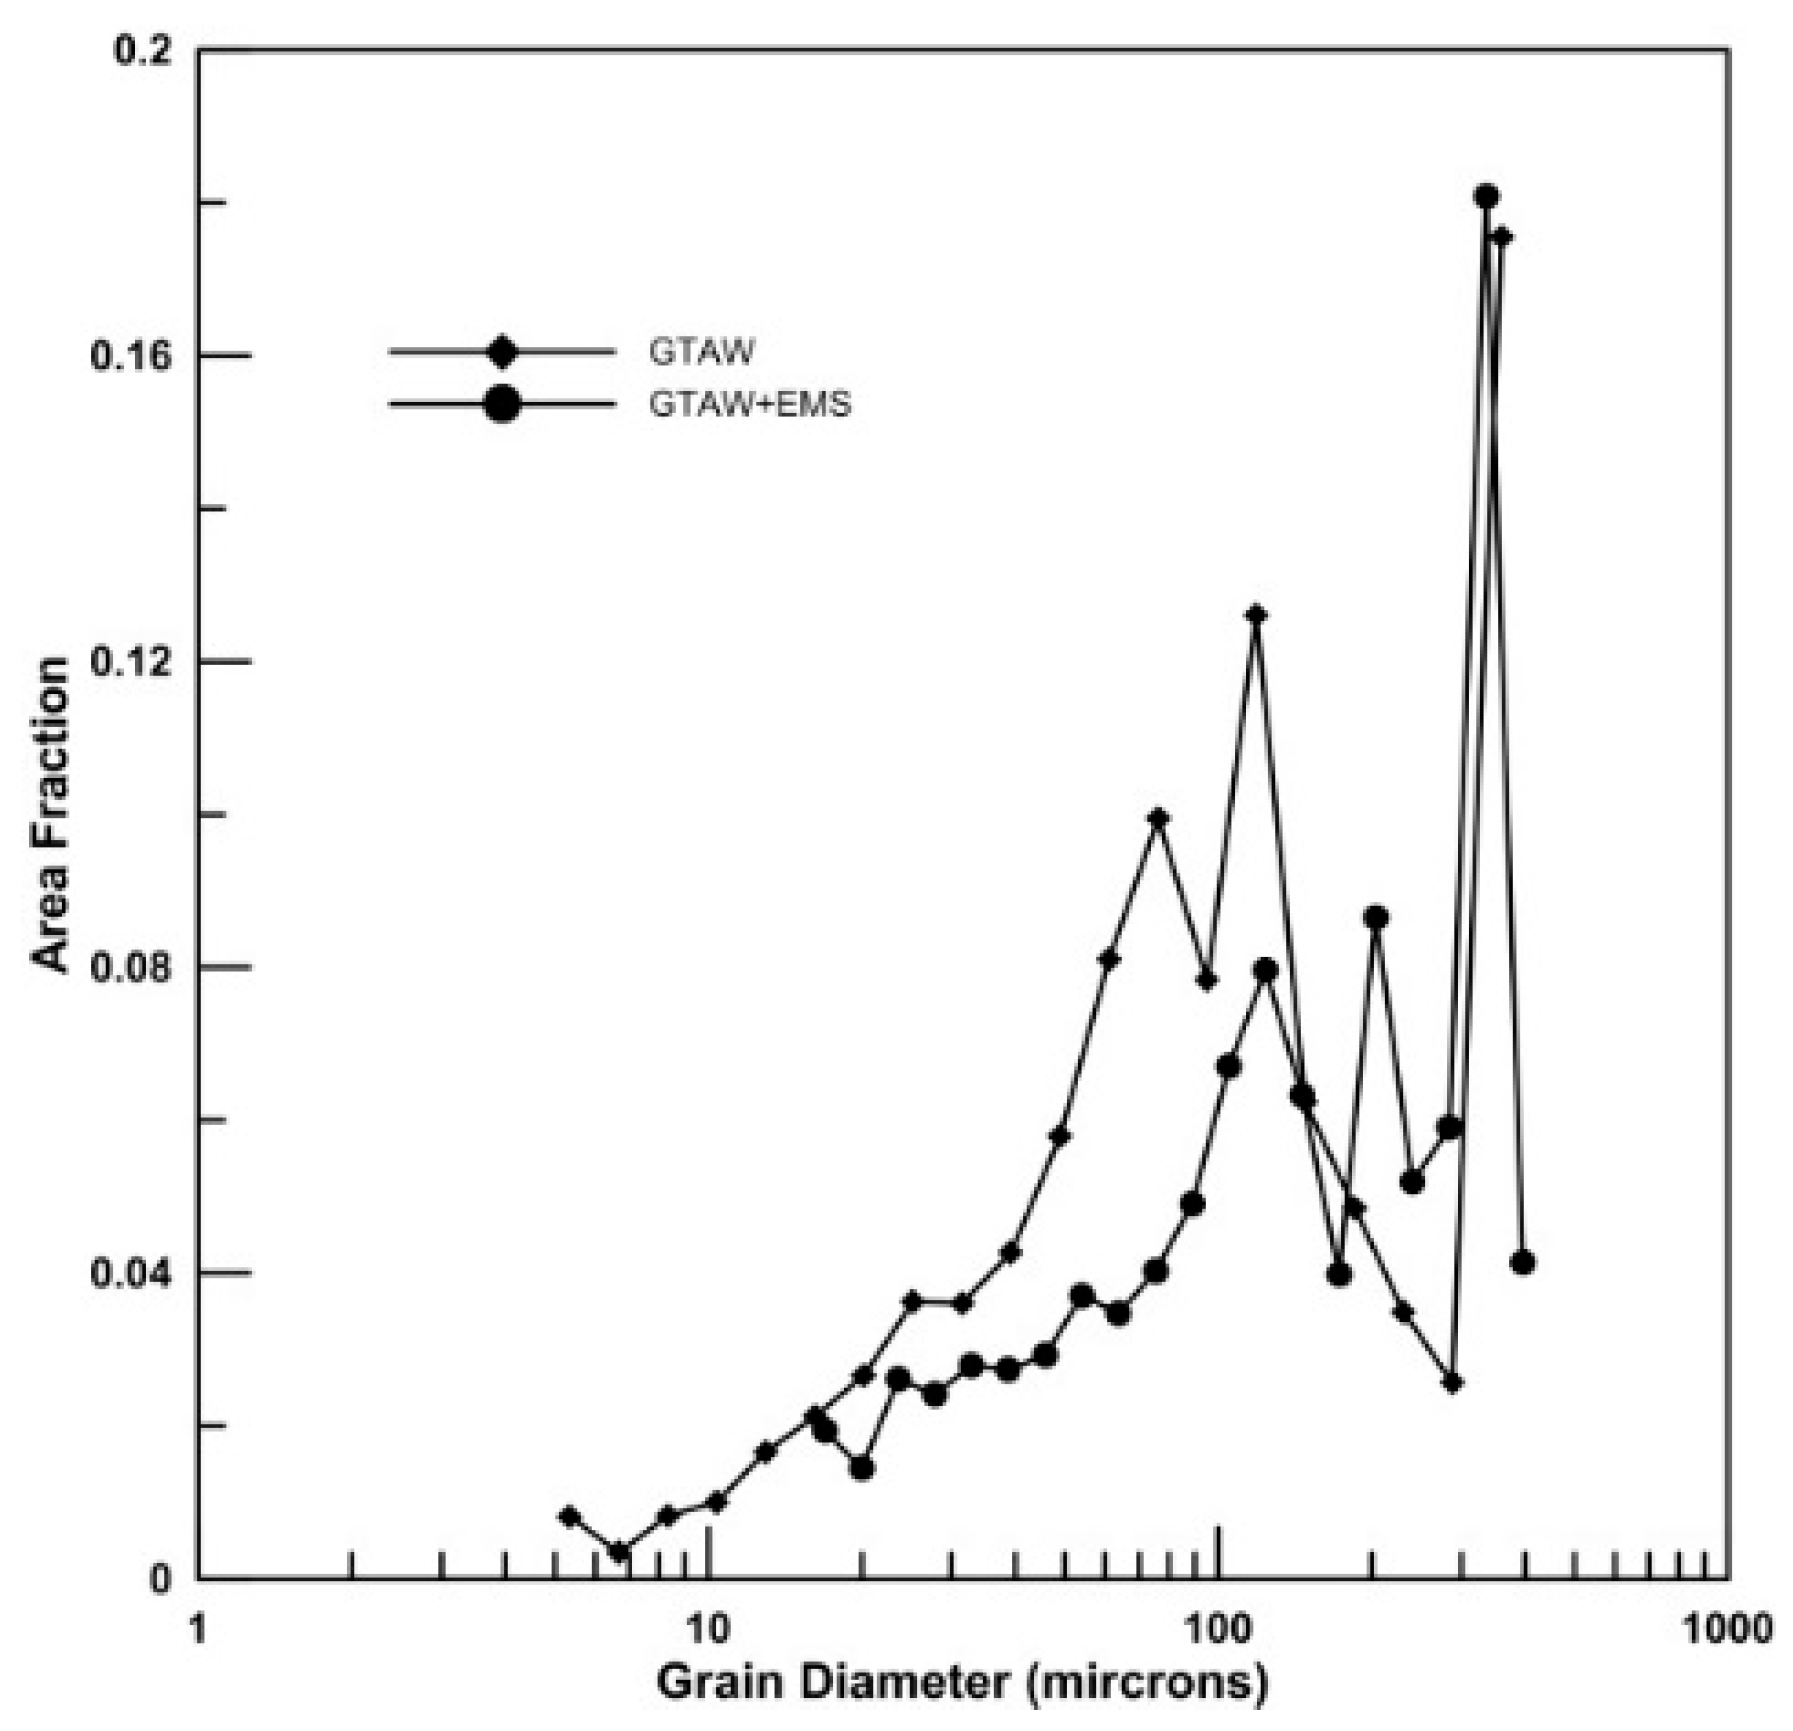
The grain size of the GTAW and GTAW+EMS welds was also measured by EBSD analysis. This was categorized in a series of discrete groups of grain diameter. The relationship between the areal fraction and the grain-diameter group for the welds is demonstrated in Figure 10. It shows that the GTAW weld has more grains with a diameter under 100 μm. Although some reports have indicated that EMS could help refine the grains of the welds, the average grain size of the GTAW+EMS weld is larger than that without EMS. This could be accounted for by the fact that there is a more considerable amount of precipitates in the GTAW.
The results of the SEM observations and EDS analysis of the precipitates in the GTAW weld are shown in Figure 11 and Table 4. The precipitates contain elements Mn, Si, and S. They are assumed to be a mixture of Al-Mn-Si oxides and S-rich phases. In the GTAW+EMS weld, the precipitates are about 2–3 μm in size, which are comprised of the majority of Si-rich particles and a small amount of Al-Mn-Si oxides containing some sulfur, as shown in Figure 12, Table 5 and Table 6. They are similar to those in the HAZs and base metals.
3.5. Hardness Measurements
The average hardness for the ferrites and the austenitic phases in the base metals and HAZs are shown in Figure 13a. The hardness of the ferrites is higher than that of the austenitic phases. It also presents that the hardness for the HAZs is about 50 Hv higher than that for the base metals.
Figure 13b, the hardness profiles for both welds, shows that the base metals and HAZs have a higher hardness than the welds. For both welds, the root is the region with the highest hardness. The hardness decreases from the root along the thickness direction of the welds. Furthermore, the GTAW weld is harder than the GTAW+EMS weld.
3.6. Tensile Tests
Figure 14 and Table 7 summarize all of the tensile test results of the weldments at room temperature. The results of the standard tensile tests show that the GTAW weldment has a higher Young’s modulus, tensile strength, and yield strength, and that the GTAW+EMS weldment shows a better elongation. However, the results also show that the specimens of the GTAW weldment ruptured in the weld, but that the GTAW+EMS weldment ruptured in the base metal.
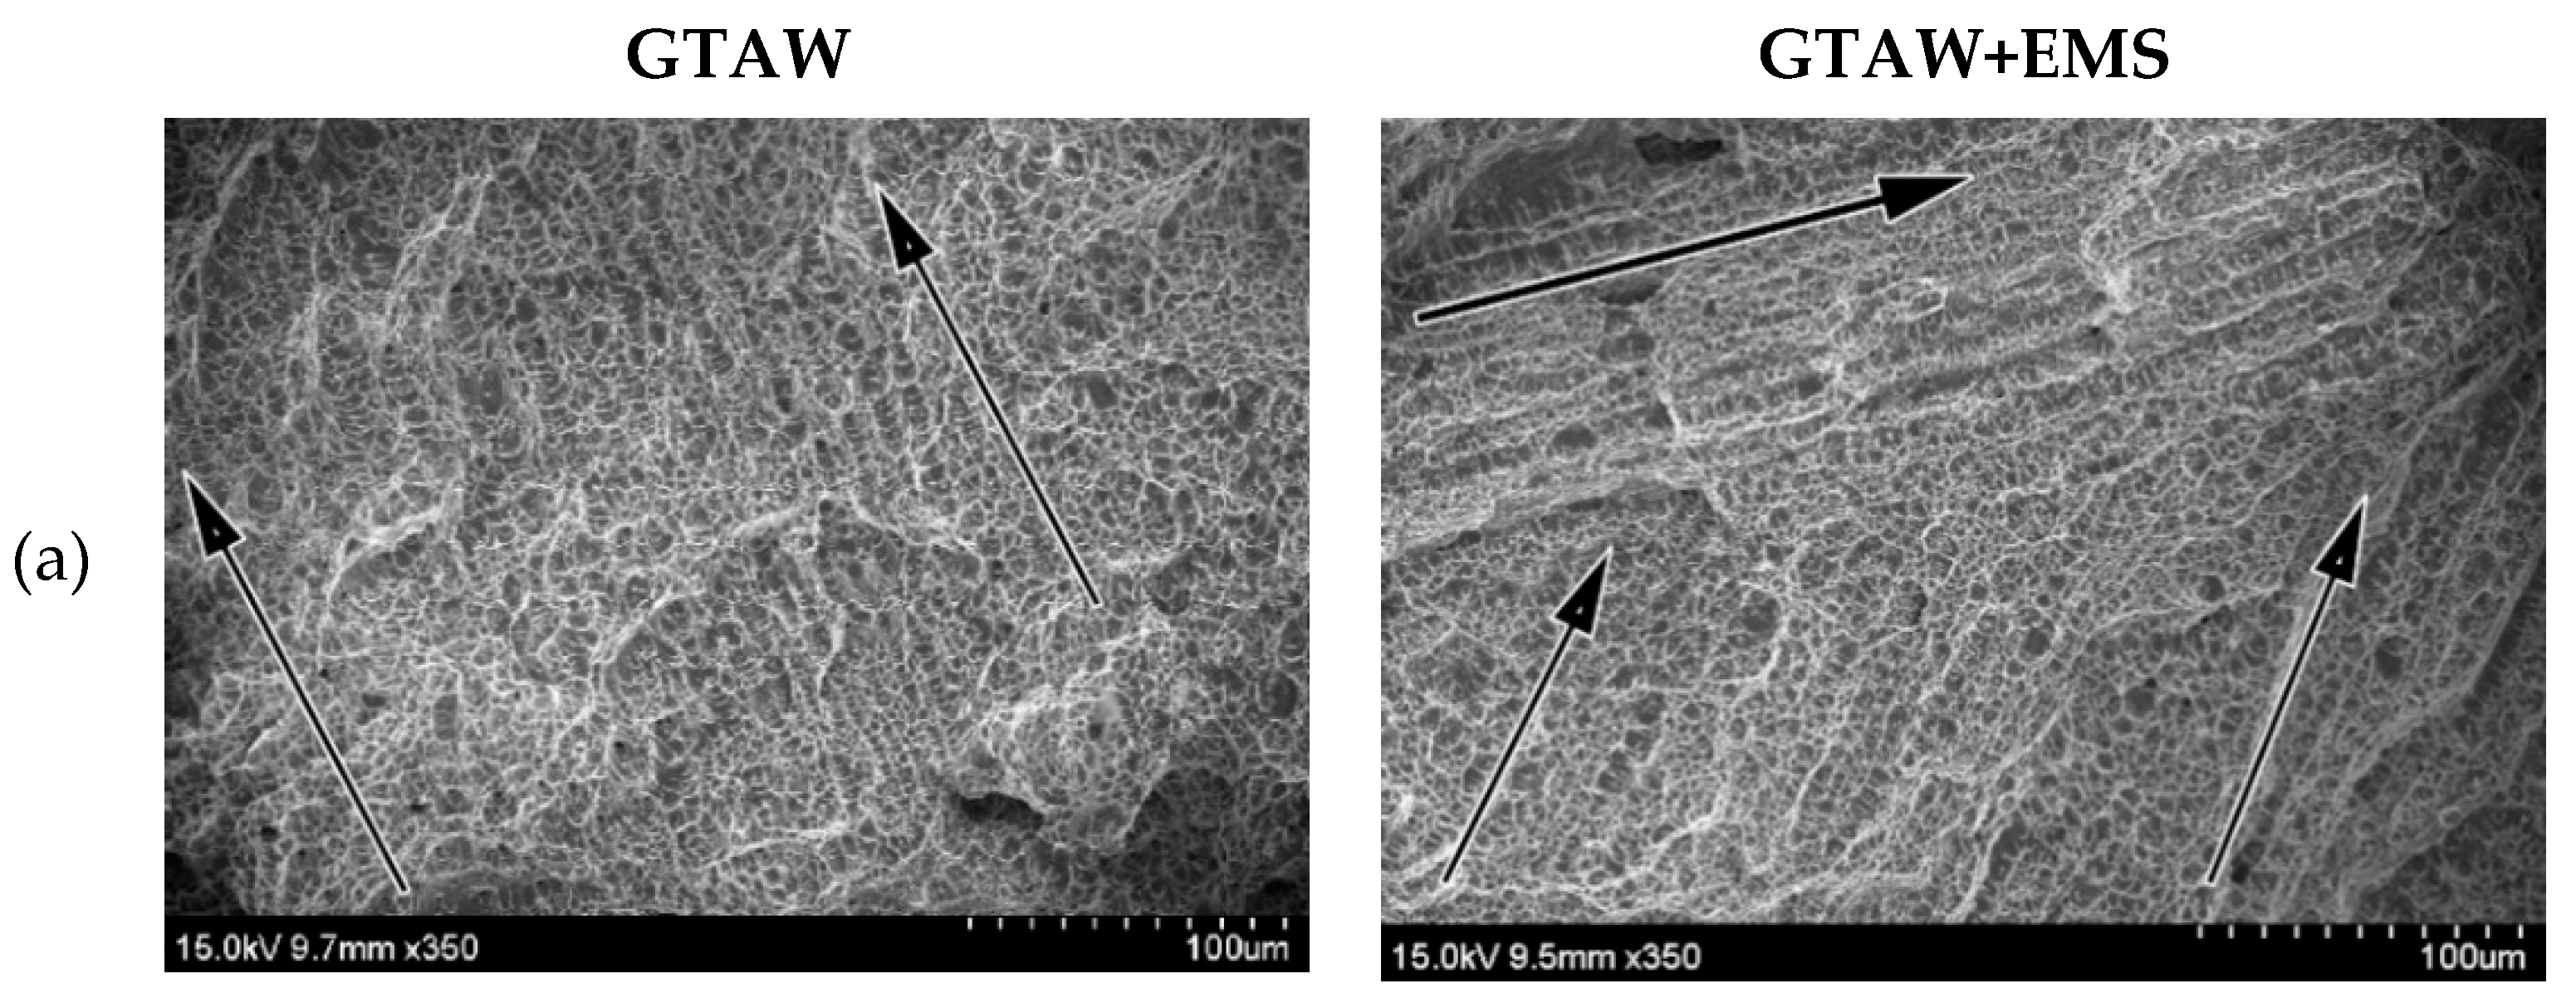
A dendrite-like fracture feature and dimples are the dominant fracture features of both of the notched weld specimens that were tested in tension at room temperature, as shown in Figure 15. Parallel dendrites are the fracture feature of the GTAW weld, while dense and intersecting dendrites are predominant on the fracture surface of the GTAW+EMS weld.
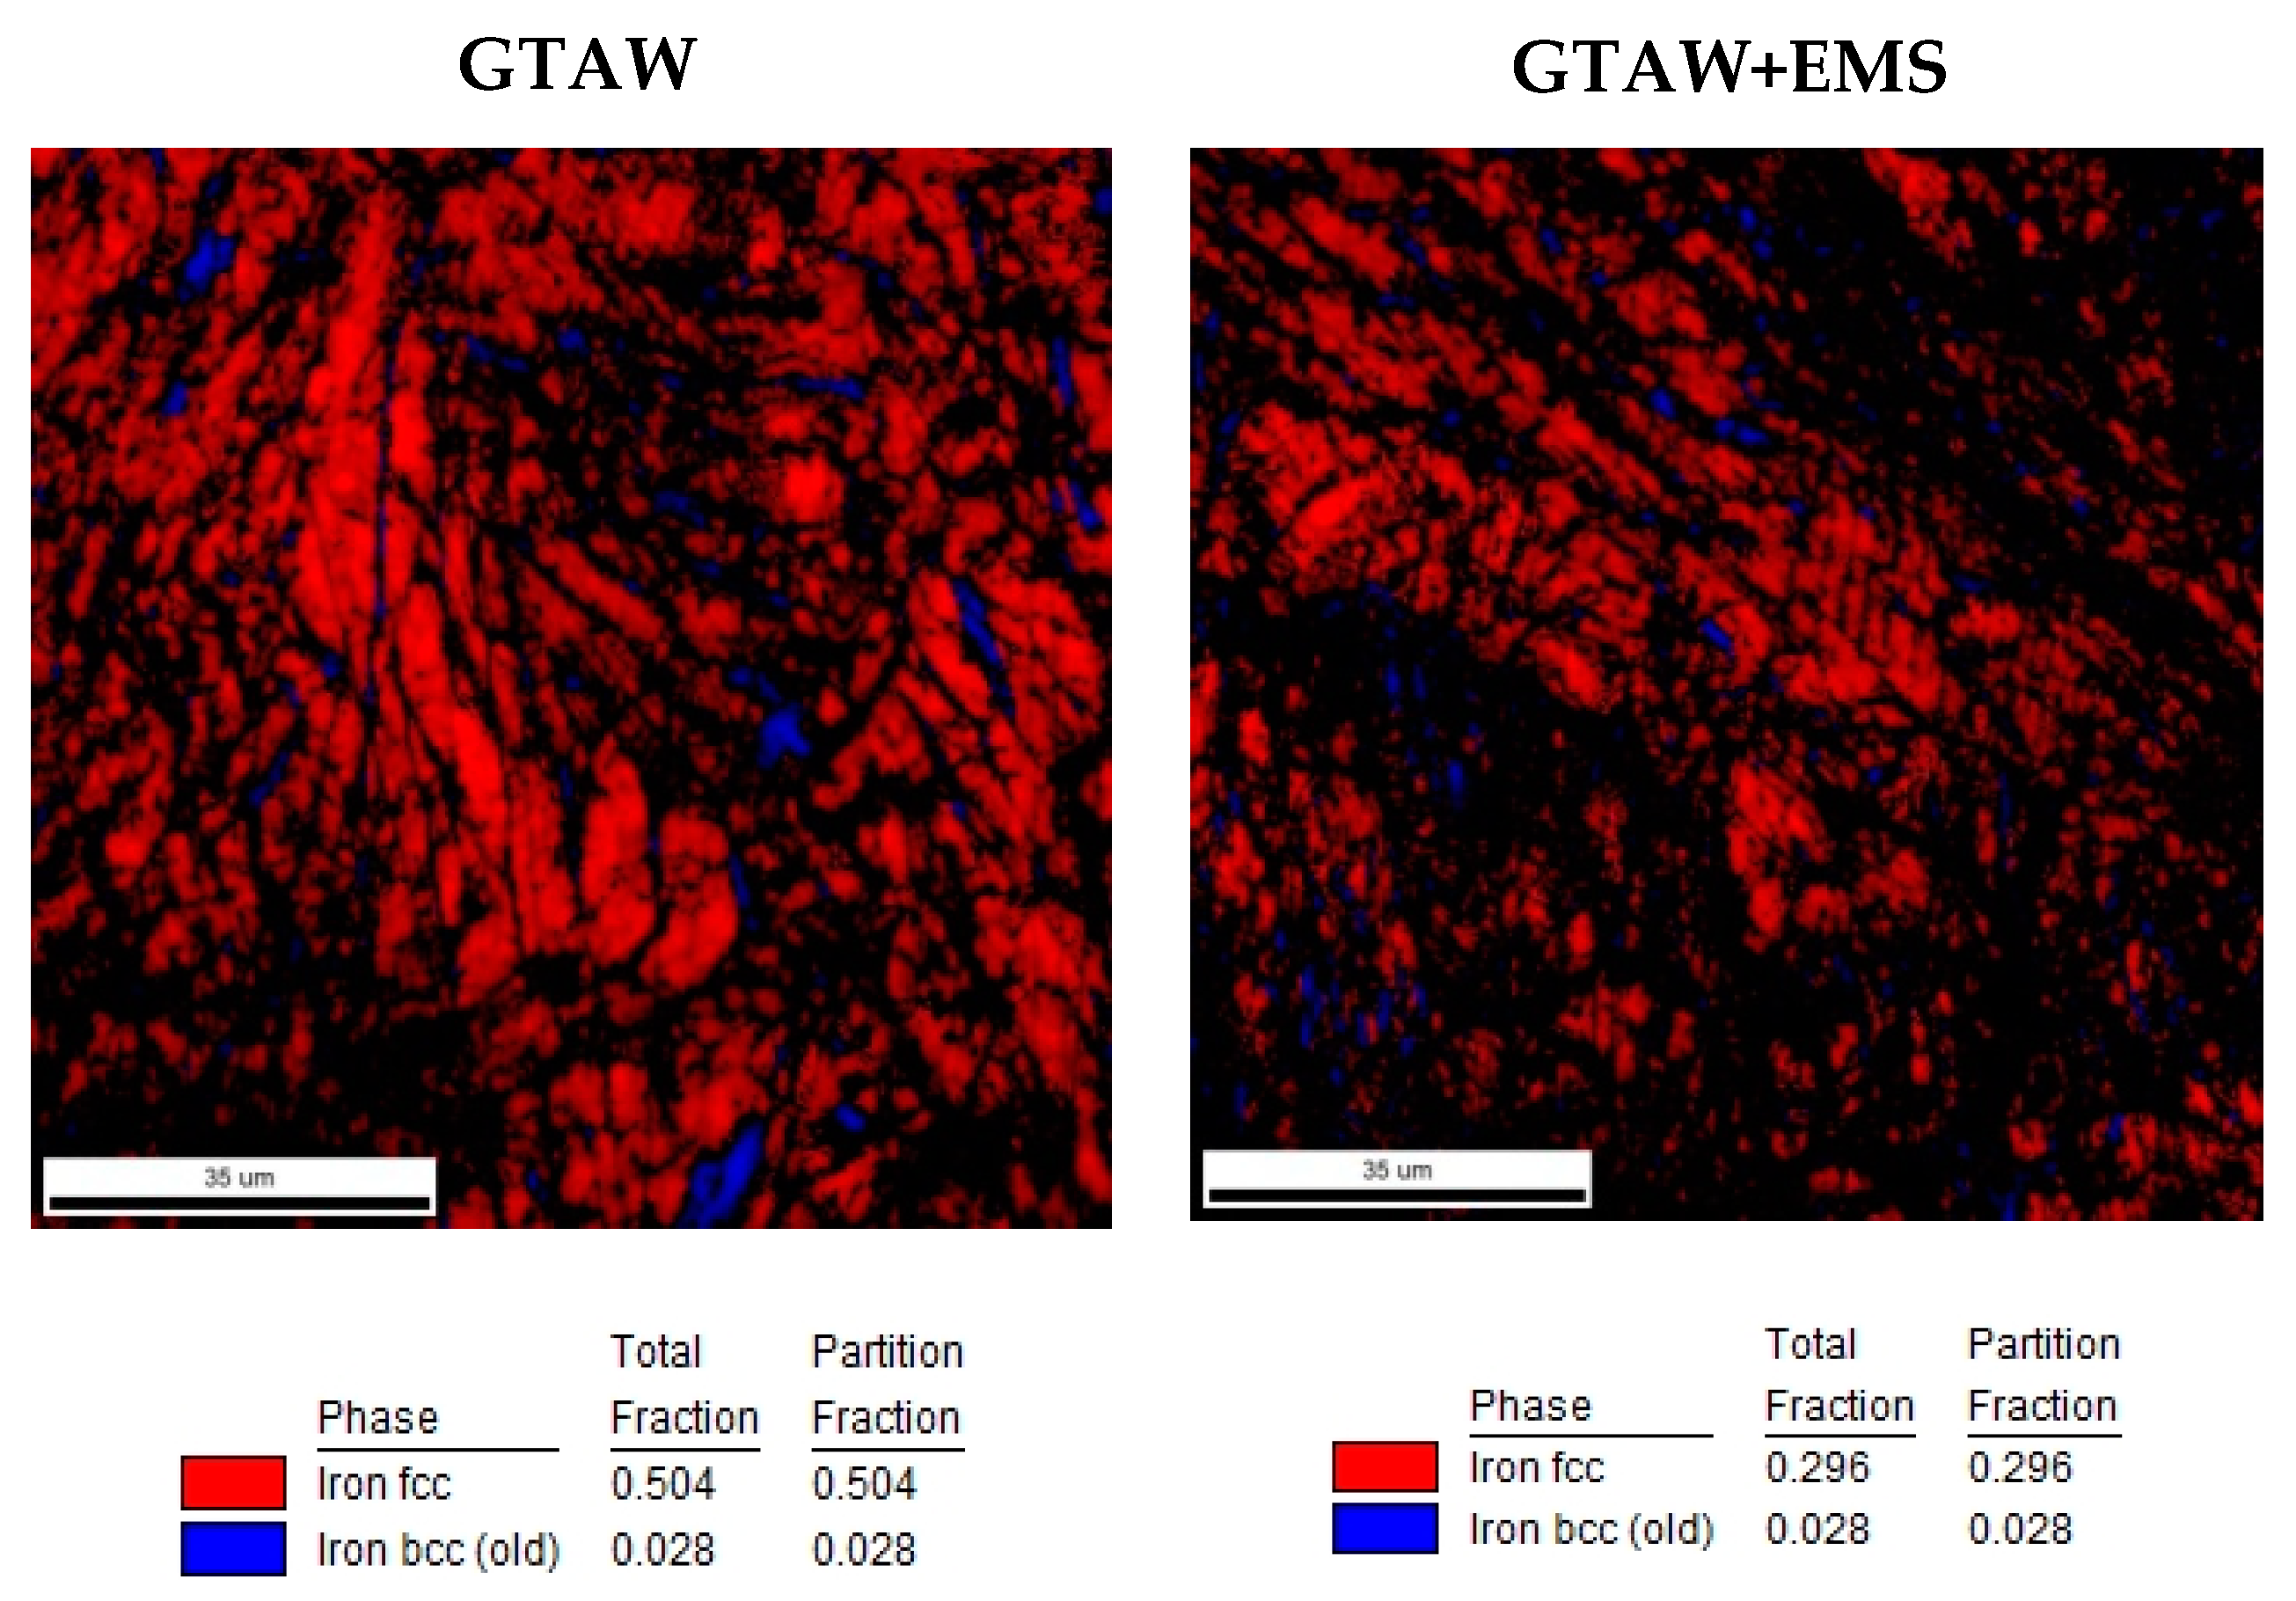
Figure 16 shows the EBSD results of the cross-section of the rupture specimens. In comparison to the as-welded specimens in Figure 9b, the face centered cubic (FCC) fractions, i.e., the austenitic fractions, decrease from about 96.4% and 95.5% to 50.4% and 29.6%, respectively, after testing for the GTAW and GTAW+EMS welds. The body centered cubic (BCC) fractions, i.e., the ferritic fractions, for both of the specimens increase slightly to 2.8%. Despite the same BCC fractions, the FCC fractions of the GTAW+EMS weld is much smaller than that of the GTAW weld after testing. This means that there was more FCC deformed in the GTAW+EMS weld. It is thought that the increased BCC could be the strain-induced martensites that formed from the austenites during testing.
4. Discussion
The base metal (CF8A) and filler metals (308L) of this study were Fe-Cr-Ni steel alloys which have similar compositions to 304 stainless steel. According to the constitution diagram, their main phases are austenites and ferrites [3]. The ferrite content, which is governed by the compositions, is often denoted by FN. At present, WRC-1992 is the most reliable and accurate diagram that is available for the ferritic prediction in the austenitic and duplex stainless steel weld metal [20]. Its FN is predicted with the relationship between the Cr-and Ni-equivalent. These two equivalency formulas are given as:
Creq = Cr + Mo + 0.7Nb,
Nieq = Ni + 35C + 20N + 0.25Cu,
The FN, which is predicted by WRC-1992, is about 14~16 and 24 for the welds and the base metals, respectively. This is similar to the measured FN for the welds, about ten on average, as depicted in Figure 2. However, the FN for the base metals by WRC-1992 is significantly different from that by FERITSCOPE® MP30. This difference should result from the microstructural distinction between them. This is because the basis of FERITSCOPE® MP30 for FN measurement is the magnetic field that the microstructural homogeneity can easily affect. In the welds, the microstructure is relatively homogenous with the small ferrites and austenites.
Although the FN, which is measured by the FERITSCOPE® MP30, is almost the same for both the GTAW and GTAW+EMS welds, as shown in Figure 2, EBSD results demonstrate that the ferrite content varies with the depth of the welds which have distinct dilutions due to the groove design and EMS effects. As stated above, the magnetic field is the basis of FERITSCOPE® MP30. The distance/location is also a critical point for accurate FN measurement by the FERITSCOPE® MP30.
The HAZ microstructure of the GTAW+EMS weldment, Figure 4b, shows that the ferrite boundaries and the embedded austenitic phases are both less winding and smaller, respectively, than that of the GTAW weldment, Figure 4a. As demonstrated by Lippold’s study [20], the faster the cooling rate of the weld bead is, the more the stable ferrites could form. Figure 5a also depicts that the HAZ of the GTAW+EMS weldments have a lower peak temperature and a faster cooling rate than that of the GTAW weldments. This could be the reason why the ferrites embedded with smaller austenitic phases in the HAZ of the GTAW+EMS weldments.
Many studies indicated that ferrites could become harder owing to the occurrence of spinodal decomposition by thermal aging [1]. When the spinodal decomposition occurs, the ferrites start to decompose into nano-meter scale Fe-rich (α–domains) phases, Cr-rich (α’–domains) phases, and G-phases [1,21,22]. With the formation of these phases, the ferrites become brittle and increase in hardness. It is thought that the increase of the hardness of the ferrites in HAZs could result from the spinodal decomposition.
The hardness increase of the ferrites in the HAZ of this study is assumed to be as a result of the mechanism of spinodal decomposition that was induced by welding heat.
According to the prediction by WRC-1992 and the measurement by the FERITSCOPE® MP30, the solidification of welds should be Type F. This is saying that the weld microstructure is fully ferritic at the end of solidification. When the weld cools below the ferrite solvus, austenite form within the microstructure, usually first at the ferrite grain boundaries [20]. The microstructure of both the GTAW and GTAW+EMS welds, as shown in Figure 8, is a mixture of the ferrite colonies and austenites. Of them, the microstructure of the GTAW weld is very consistent with the solidification mode, as predicted, while that of the GTAW+EMS weld is not.
Figure 5b presents the temperature profiles of the welds. The temperature profile of the GTAW weld is almost the same as that of the GTAW+EMS weld. With a similar temperature profile, the microstructure of these two welds should be alike. However, their microstructure is entirely different from each other, as presented in Figure 8. This means that the temperature profiles of the welds, Figure 5b, cannot reflect the microstructural changes, which could be induced by the temperature gradient reduction and the direction change of the steepest temperature gradient by the EMS. In this study, it is conjectured that EMS could alter the dendritic orientations to prompt the formation of dense and intersecting dendrites on the fracture surface of GTAW+EMS welds, as displayed in Figure 15.
The number of black particles revealed in Figure 7a,b is affected by dilution and EMS. They increase with increasing dilution, but decrease with the influence of EMS. According to the results of the compositional analysis, Figure 11 and Figure 12, most of them are oxides and could come from the base metals.
From the number variation of oxides in the cap and the middle areas, it is inferred that EMS could stir the welding pool to prompt the oxide to float on the surface of the welds. With the lower dilution, EMS could effectively reduce the oxides and impurities and improve the mechanical properties of the welds as a consequence.
The higher hardness of the GTAW weld could be accounted for by the previous microstructural observations of more precipitates and smaller grains in the weld that were induced by the higher dilution from the base metals. In the root, the higher dilution also resulted in more ferrites. These ferrites were further subjected to the subsequent welding heat, prompting the spinodal decomposition of the ferrites with an entailed increase of the hardness of the weld root. On similar reasoning, the lowest hardness of the cap could result from the least extent of exposure to welding heat that the ferrites in the cap region suffered. Therefore, the hardness variations in the welds are determined by the position of the weld and the dilution reduction due to the groove design and the EMS application.
It has been indicated previously that the GTAW weld with more precipitates and small grains is harder than the GTAW+EMS weld. The more precipitates and grain boundaries in the welds, the more resistance to dislocation movements there will be. This is the reason why the notched tensile tests and the standard tensile tests all show that the GTAW weld has a higher Young’s modulus and yield strength than the GTAW+EMS weld.
According to the EBSD results of Figure 16, the higher elongation of the GTAW+EMS weld could be accounted for by the deformation of austenites. The observations indicate that fewer precipitates and grain boundaries exist to obstruct the dislocation movement in the GTAW+EMS weld. It is further inferred that the intersecting dendrites in the GTAW+EMS weld could also prompt the deformation of austenites. With an increase of strain, the tensile stress of the GTAW+EMS weld rises due to the mechanism of strain hardening.
5. Conclusions
This study investigated the effects of electromagnetic stirring on the weldments of cast austenitic stainless steel. The following conclusions can be drawn from the present work:
- EMS could change the temperature profiles to reduce the influence of welding heat on the HAZs by GTAW. In the HAZ of the GTAW+EMS weldment, the boundaries of the ferrites are less winding and the austenitic phases within the ferrites are smaller in comparison to those of the GTAW weldment.
- In the fusion zones, the GTAW+EMS weld has denser ferrite colonies in various orientations, however the GTAW weld has larger ferrites, although their temperature profiles are almost the same.
- The GTAW weld has more precipitates that are mainly Al-Mn-Si oxides, while the GTAW+EMS weld has relatively fewer precipitates comprising of the majority of Si-rich particles and a small amount of Al-Mn-Si oxides.
- It is also noted that most of the ferrites of the welds are in the root and that the GTAW weld has more ferrites than the GTAW+EMS weld.
- The hardness is usually higher in the base metals and the HAZs than in the welds. The hardness of the root regions is the highest for both welds. This decreases from the root to the cap regions along the thickness direction. Compared to the GTAW weld, the hardness of the GTAW+EMS weld is lower.
- At room temperature, the GTAW+EMS weld has a higher tensile strength and elongation than the GTAW weld. This could be accounted for by the observation that the GTAW+EMS weld has more deformed austenites than the GTAW weld.
Author Contributions
S.-L.J. designed and planned the experiment. S.-L.J., D.-P.S., and J.-T.L. carried out the experiments and the inspections. J.-Y.H. reviewed the results.
Funding
This research received no external funding.
Acknowledgments
Thank Tai-Jung Wu for welding the specimens.
Conflicts of Interest
The authors declare no conflict of interest.
References
- Byun, T.S.; Yang, Y.; Overman, N.R.; Busby, J.T. Thermal Aging Phenomena in Cast Duplex Stainless Steels. JOM 2016, 68, 507–516. [Google Scholar] [CrossRef]
- Wood, J. Nuclear Power, 1st ed.; The Institution of Engineering of Technology: London, UK, 2007; pp. 74–76. [Google Scholar]
- Folkhard, E. Welding Metallurgy of Stainless Steels, 2nd ed.; Springer: Wien, Austria, 1988; pp. 197–222. [Google Scholar]
- Lim, Y.C.; Yu, X.; Cho, J.H.; Sosa, J.; Farson, D.F.; Babu, S.S.; McCracken, S.; Flesner, B. Effect of magnetic stirring on grain structure refinement: Part 1—Autogenous nickel alloy welds. Sci. Technol. Weld. Joining 2013, 15, 583–589. [Google Scholar] [CrossRef]
- Lim, Y.C.; Yu, X.; Cho, J.H.; Sosa, J.; Farson, D.F.; Babu, S.S.; McCracken, S.; Flesner, B. Effect of magnetic stirring on grain structure refinement: Part 2—Nickel alloy weld overlays. Sci. Technol. Weld. Joining 2013, 15, 400–406. [Google Scholar] [CrossRef]
- Sivaprasad, K.; Raman, S.G.S. Influence of magnetic arc oscillation and current pulsing on fatigue behavior of alloy 718 TIG weldments. Mater. Sci. Eng. A 2007, 448, 120–127. [Google Scholar] [CrossRef]
- Vollertsen, F.; Thomy, C. Magnetic stirring during laser welding of aluminum. J. Laser Appl. 2006, 18, 28–34. [Google Scholar] [CrossRef]
- Mousavi, M.G.; Hermans, M.J.M.; Richardson, M.I.; Ouden, G.D. Grain refinement due to grain detachment in electromagnetically stirred AA7020 welds. Sci. Technol. Weld. Joining 2013, 8, 309–312. [Google Scholar] [CrossRef]
- Janaki Ram, G.D.; Murugesan, R.; Sundaresan, S. Fusion zone grain refinement in aluminum alloy welds through magnetic arc oscillation and its effect on tensile behavior. J. Mater. Eng. Perform. 1999, 8, 513–520. [Google Scholar] [CrossRef]
- Watanabe, T.; Nakamura, H.; Ei, K. Grain refinement by TIG welding with electromagnetic stirring—A study of solidification control of austenitic stainless steel weld metal. Weld. Int. 2010, 3, 312–317. [Google Scholar] [CrossRef]
- Malinowski-Brodnicka, M.; Ouden, G.D.; Vink, W.J.P. Effect of Electromagnetic Stirring on GTA Welds in Austenitic Stainless Steel. Weld. J. 1990, 91, 52s–59s. [Google Scholar]
- Kou, S.; Le, Y. Grain structure and solidification cracking in oscillated arc welds of 5052 aluminum alloy. Metal. Trans. A 1985, 16, 1345–1352. [Google Scholar] [CrossRef]
- Lippold, J.C.; Savage, W.F. Solidification of austenitic stainless steel weldments Part III—The effect of solidification behavior on hot cracking susceptibility. Weld. J. 1982, 61, 388–396. [Google Scholar]
- Pearce, B.P.; Kerr, H.W. Grain refinement in magnetically stirred GTA welds of aluminum alloys. Metall. Trans. B 1981, 12, 479–486. [Google Scholar] [CrossRef]
- Yudodibroto, B.Y. The Effect of Electro-Magnetic Stirring on the Weld Microstructure of Aluminium Alloys. Master’s Thesis, Delft University of Technology, Delft, The Netherlands, August 2000. [Google Scholar]
- Li, Y.B.; Shen, Q.; Lin, Z.Q.; Hu, S.J. Quality improvement in resistance spot weld of advanced high strength steel using external magnetic field. Sci. Technol. Weld. Joining 2011, 16, 465–469. [Google Scholar] [CrossRef]
- Liu, Y.; Sun, Q.; Liu, J.; Wang, S.; Feng, J. Effect of axial external magnetic field on cold metal transfer welds of aluminum alloy and stainless steel. Mater. Lett. 2015, 152, 29–31. [Google Scholar] [CrossRef]
- Hernández-Trujillo, S.; López-Morelos, V.H.; García-Hernández, R.; García-Rentería, M.A.; Ruiz-Marines, A.; Verduzco-Martínez, J.A. Effect of Electromagnetic Field on the Microstructure and Mechanical Properties of the Dissimilar 2205/316L Welded Joint. In Proceedings of the 17th International Conference on New Trends in Fatigue and Fracture, Cancun, Mexico, 25–27 October 2017; Ambriz, R., Jaramillo, D., Plascencia, G., Nait Abdelaziz, M., Eds.; Springer: Cham, Switzerland, 2018. [Google Scholar]
- Chen, R.; Jiang, P.; Shao, X.; Mi, G.; Wang, C. Effect of static magnetic field on microstructures and mechanical properties of laser-MIG hybrid welding for 304 stainless steel. Int. J. Adv. Manuf. Technol. 2017, 91, 3437–3447. [Google Scholar] [CrossRef]
- Lippold, J.C.; Kotecki, D.J. Welding Metallurgy and Weldability of Stainless Steels, 1st ed.; John Wiley & Sons, Inc.: Hoboken, NJ, USA, 2005; pp. 34–42, 158–161. [Google Scholar]
- Mburu, S.; Kolli, P.R.; Perea, D.E.; Schwarm, S.C.; Eaton, A.; Liu, J.; Patel, S.; Bartrand, J.; Ankem, S. Effect of Aging Temperature on Phase Decomposition and Mechanical Properties in Cast Duplex Stainless Steels. Mater. Sci. Eng. A 2017, 690, 365–377. [Google Scholar] [CrossRef]
- Lach, T.G.; Byun, T.S. Microstructural Evolution of Cast Austenitic Stainless Steels Under Accelerated Thermal Aging. In Proceedings of the 18th International Conference on Environmental Degradation of Materials in Nuclear Power Systems—Water Reactors, Portland, Oregon, 13–17 August 2017; Jackson, J., Paraventi, D., Wright, M., Eds.; Springer: Cham, Switzerland, 2018. [Google Scholar]
Figure 1.
(a) Schematic diagram of the experimental set-up for the external electromagnetic stirring equipment, (b) welding configuration, (c) dimensions of the standard tensile specimen, (d) dimensions of the notched tensile specimen.
Figure 1.
(a) Schematic diagram of the experimental set-up for the external electromagnetic stirring equipment, (b) welding configuration, (c) dimensions of the standard tensile specimen, (d) dimensions of the notched tensile specimen.
Figure 2.
The ferrite number of the base metals and welds.

Figure 3.
The OM observation and EDS mapping of the base metal: (a) OM micrograph, and (b) SEM micrograph and elemental mappings.
Figure 3.
The OM observation and EDS mapping of the base metal: (a) OM micrograph, and (b) SEM micrograph and elemental mappings.
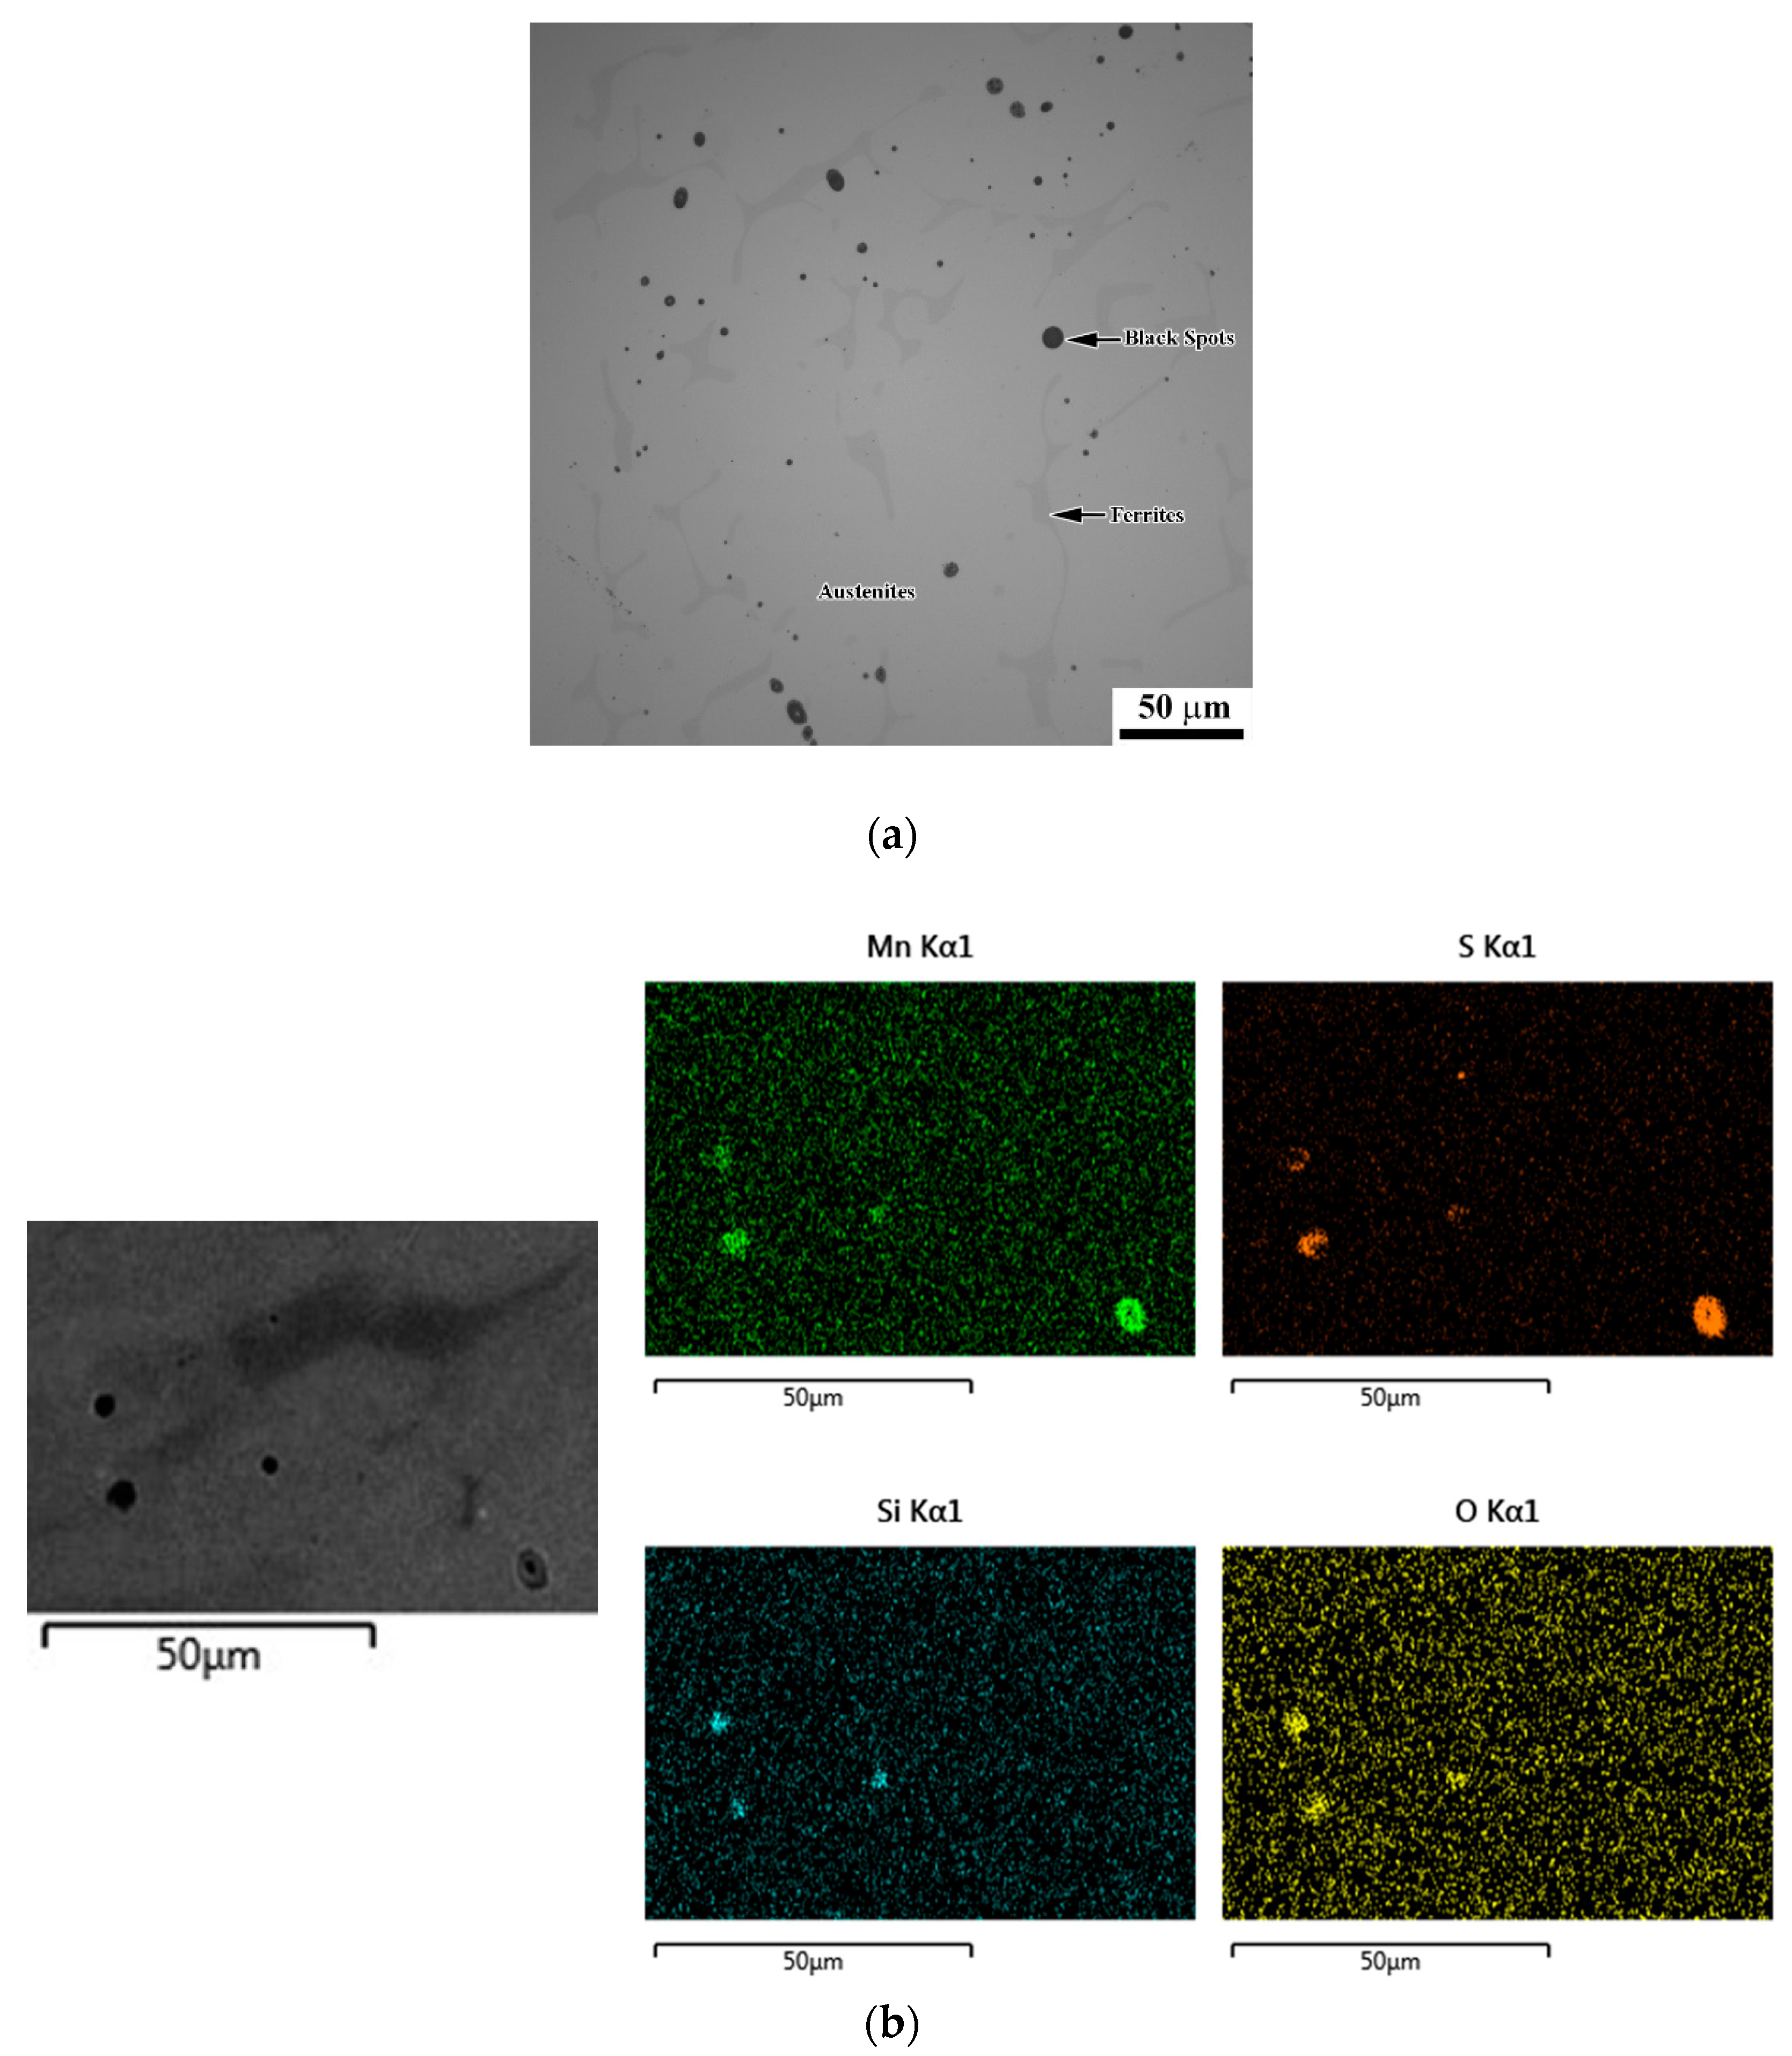
Figure 4.
The temperature profiles by the bead-on-plate tests: (a) the HAZ, and (b) the weld.
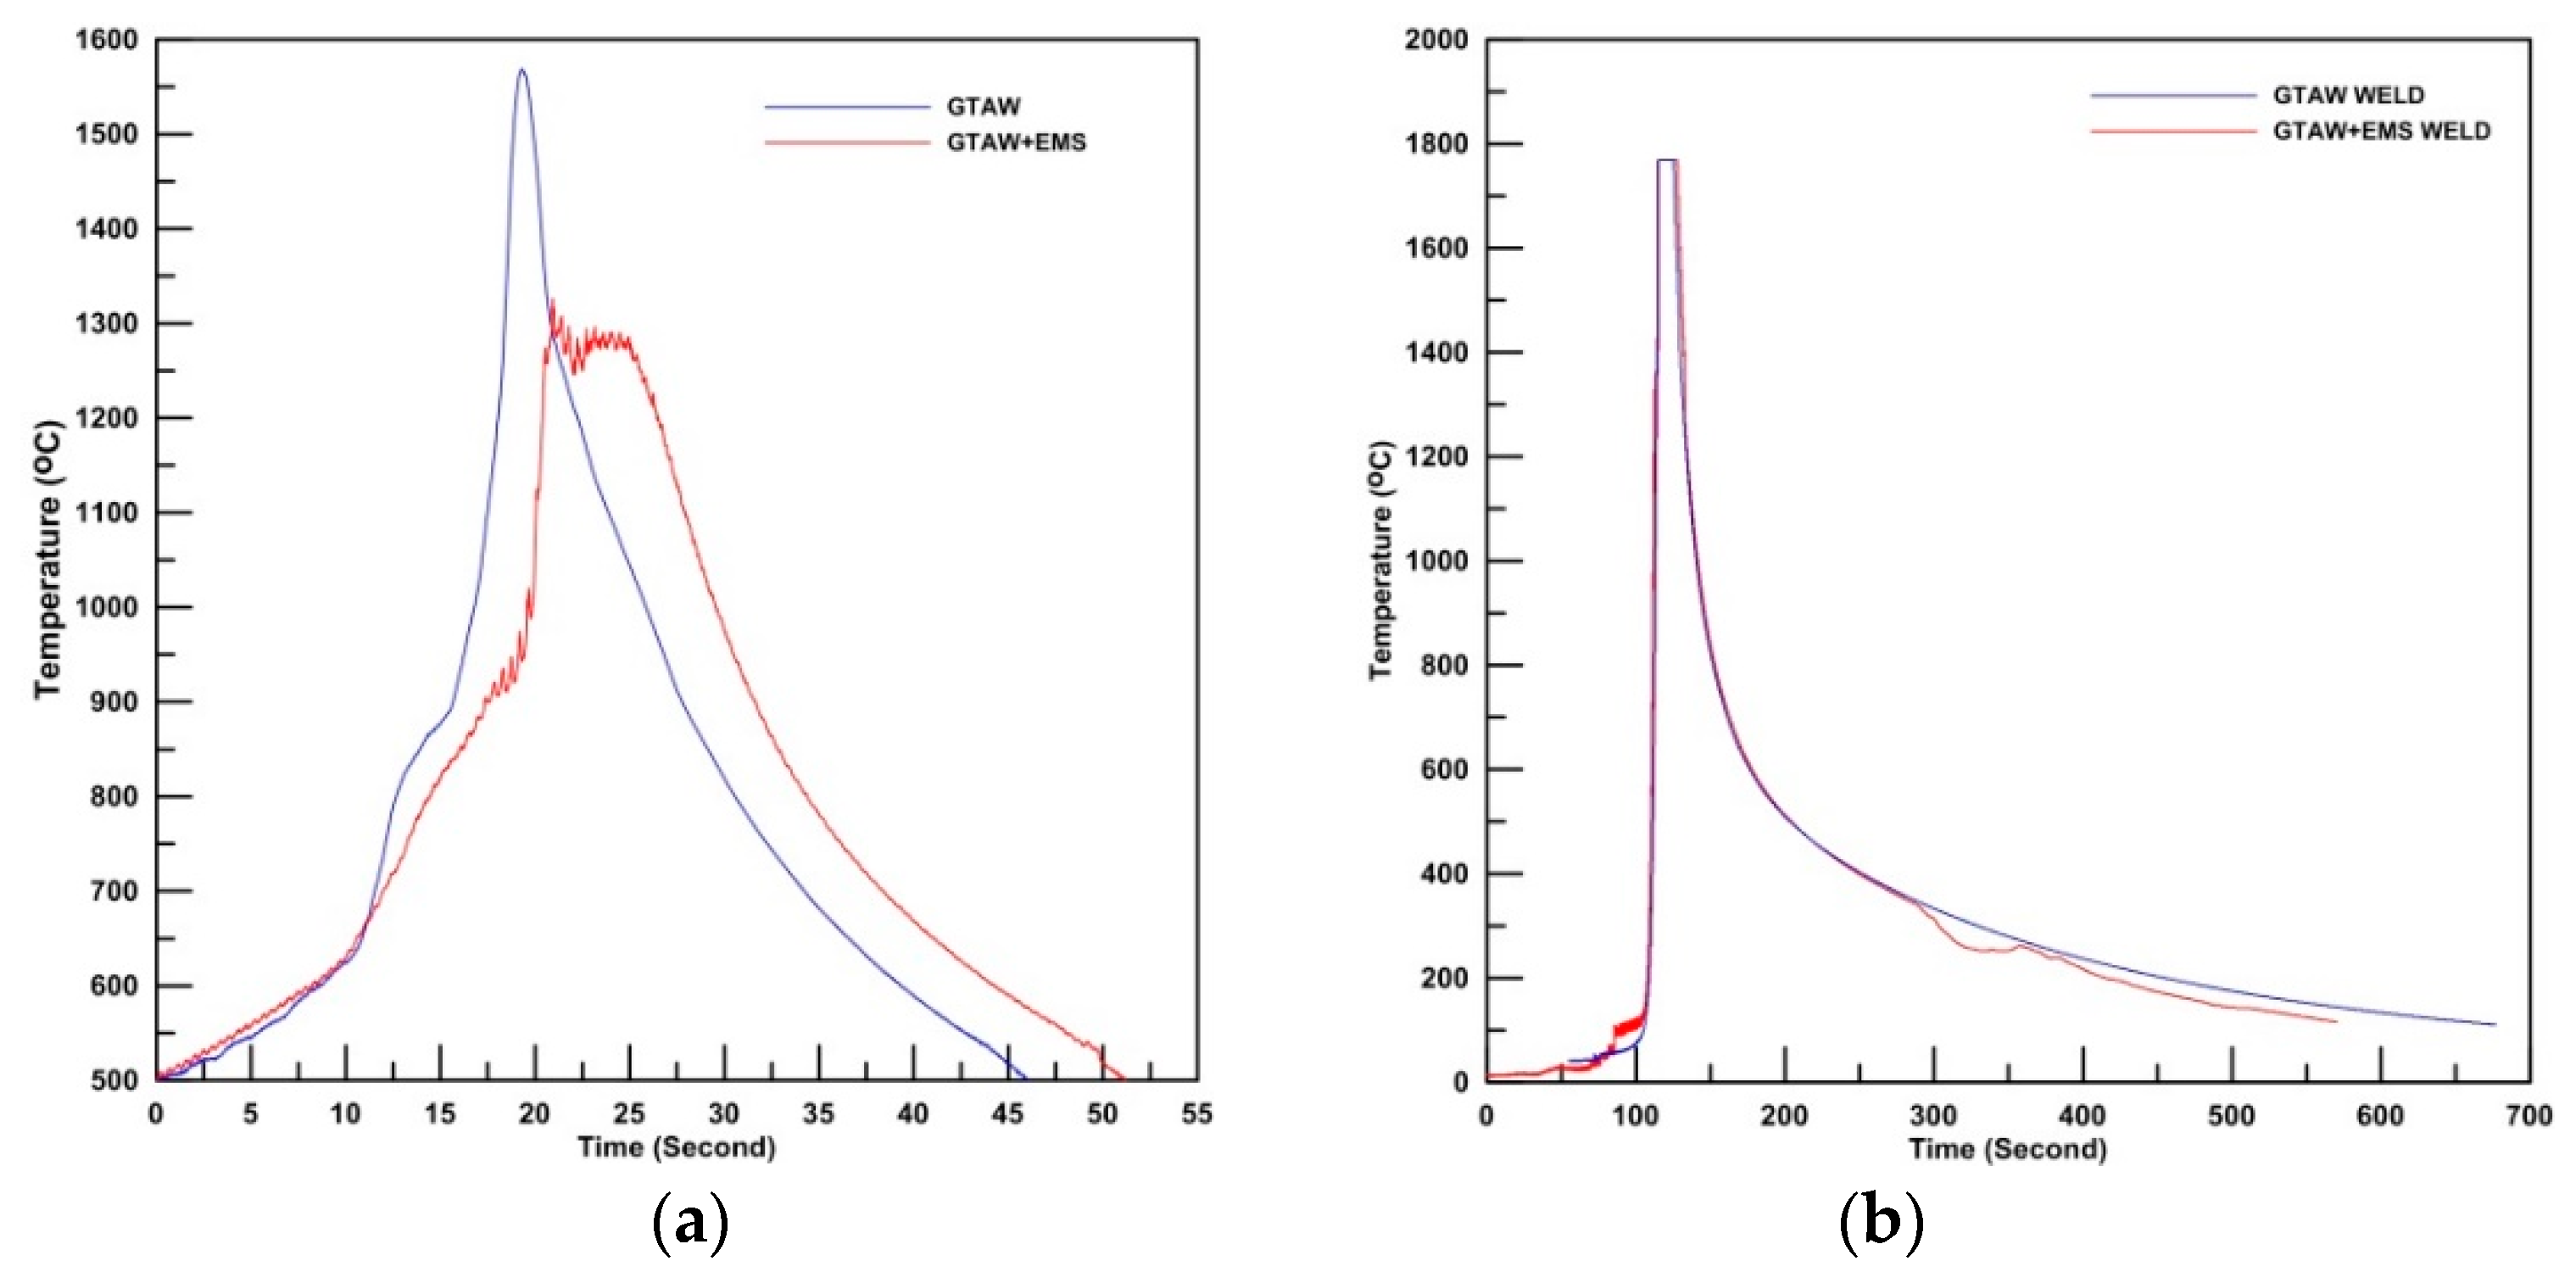
Figure 5.
The OM observations and EDS mapping of HAZ: (a) the OM micrograph of the GTAW weldment, (b) the OM micrograph of the GTAW+EMS weldment, and (c) the EBSD analysis of HAZ in the GTAW weldment.
Figure 5.
The OM observations and EDS mapping of HAZ: (a) the OM micrograph of the GTAW weldment, (b) the OM micrograph of the GTAW+EMS weldment, and (c) the EBSD analysis of HAZ in the GTAW weldment.
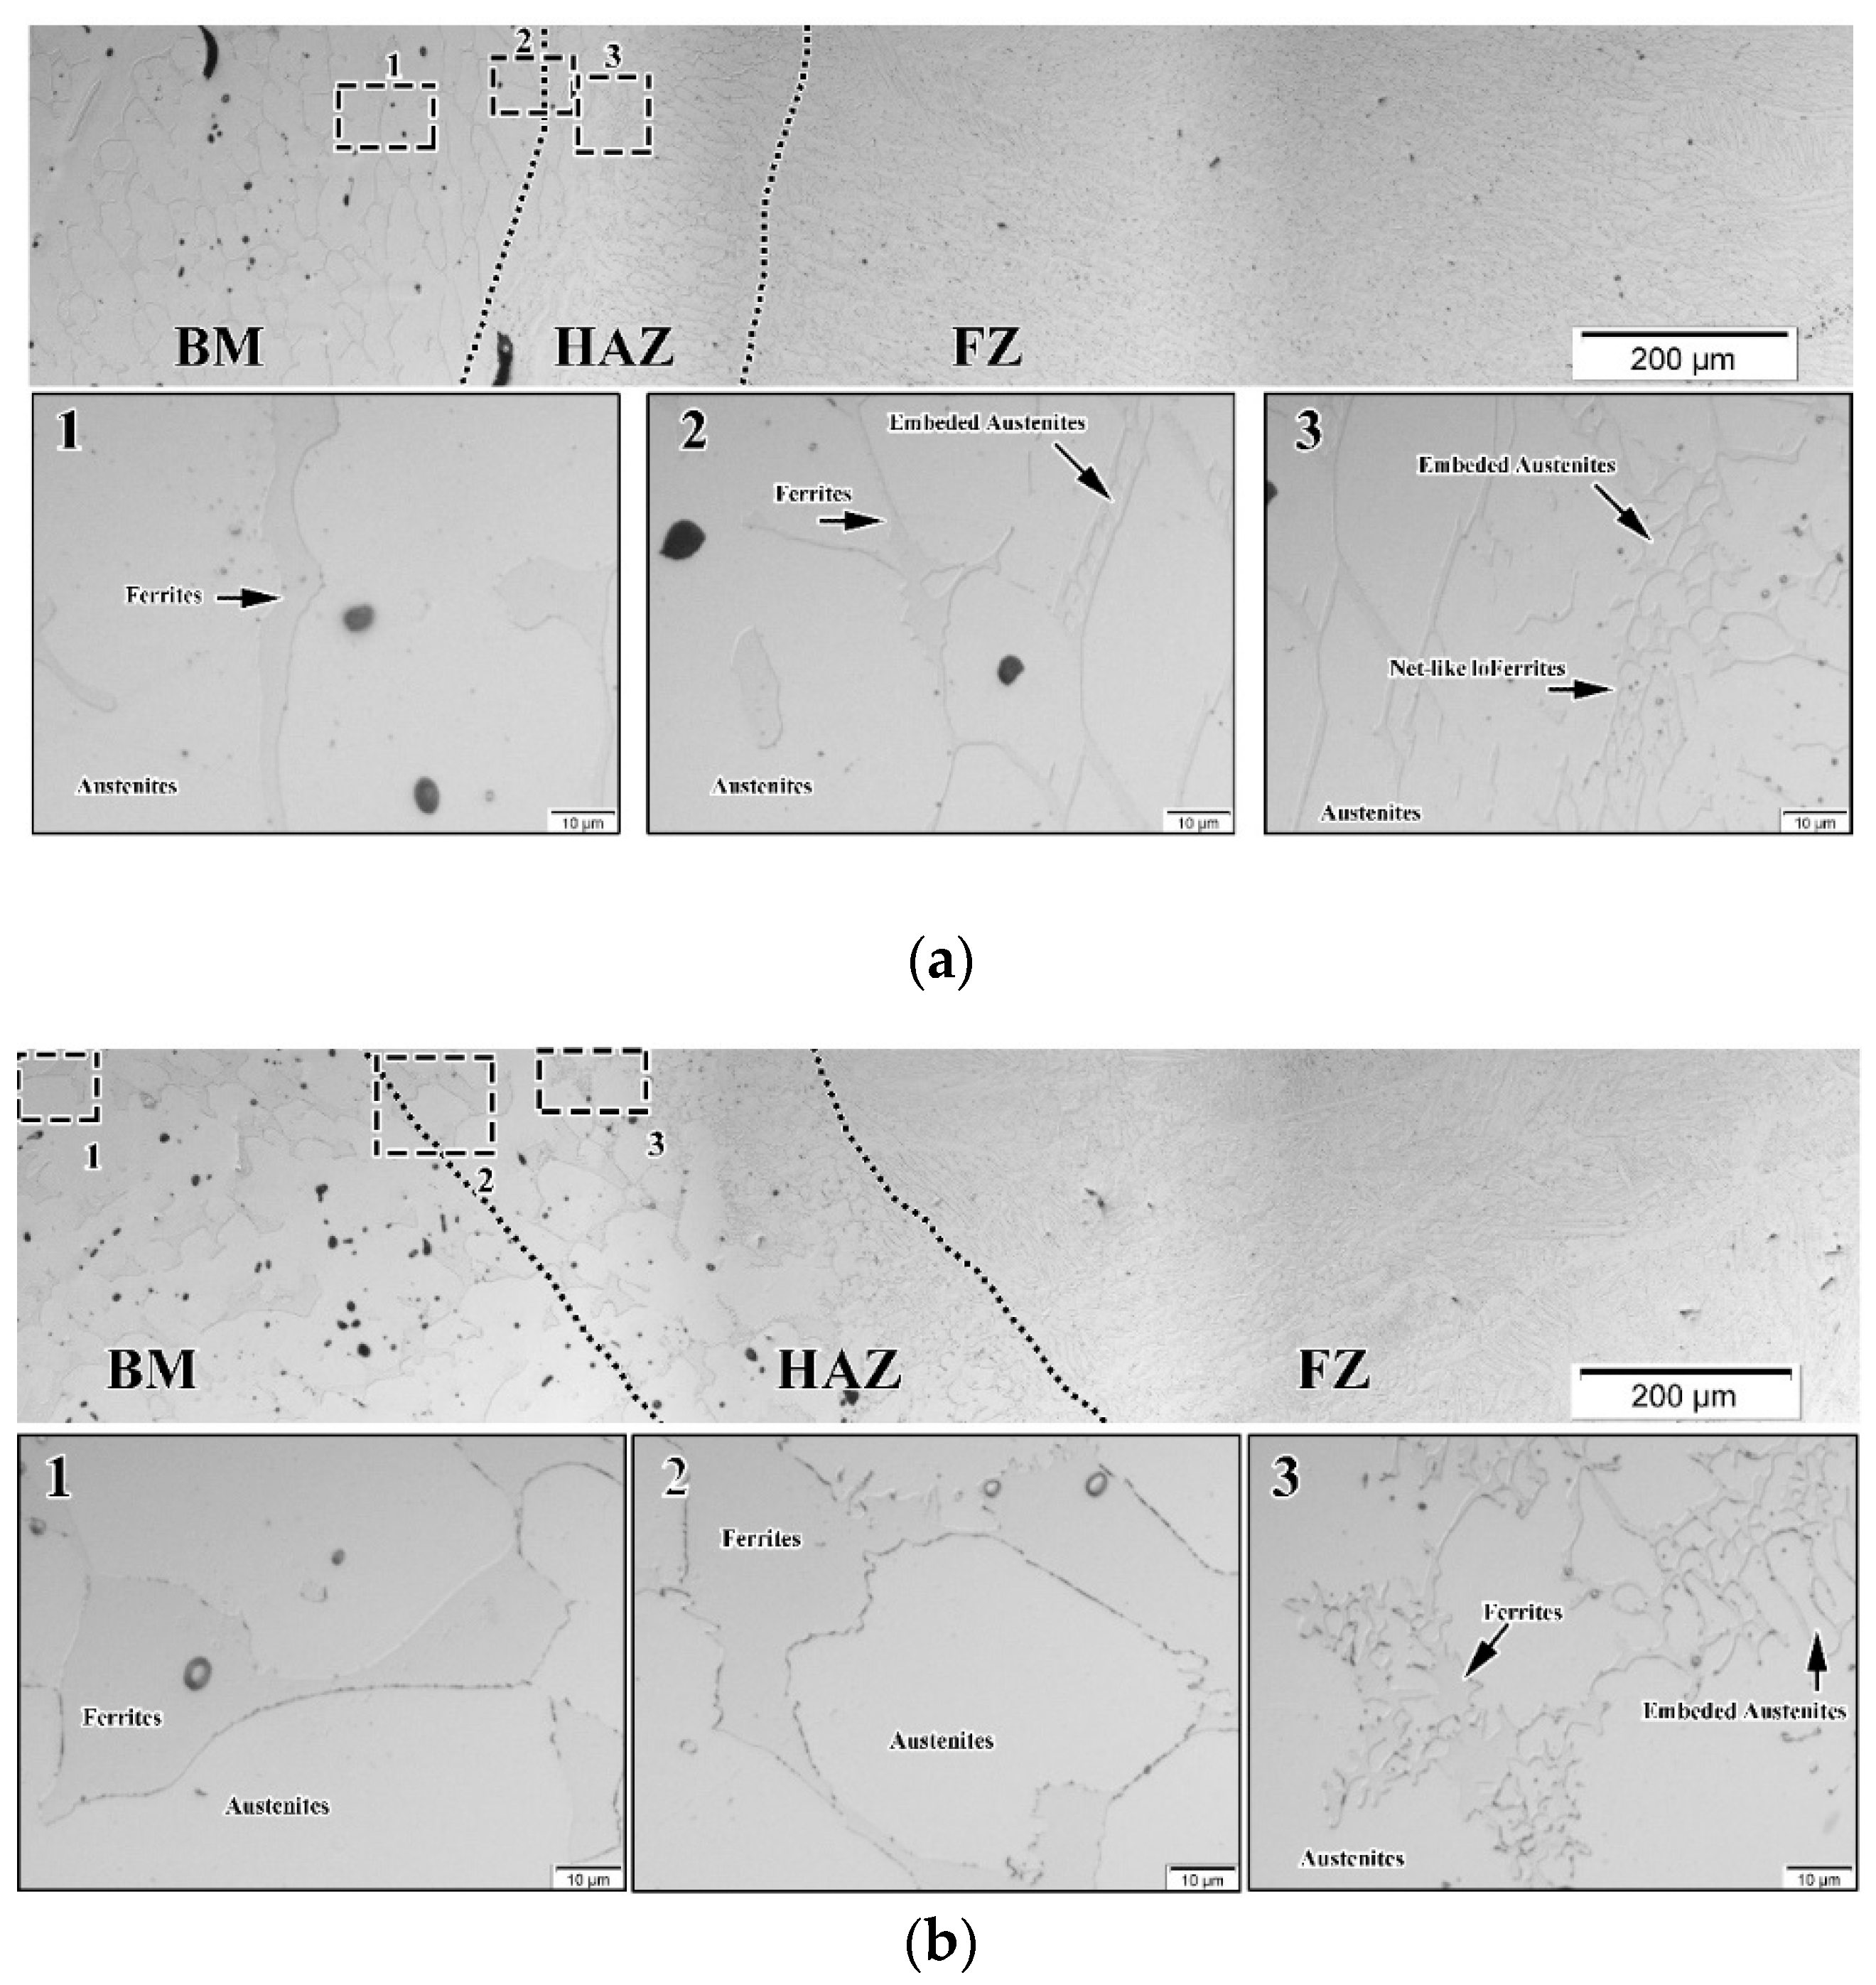
Figure 6.
The SEM micrographs of the oxides and MnS phases in the HAZ of GTAW weldments.
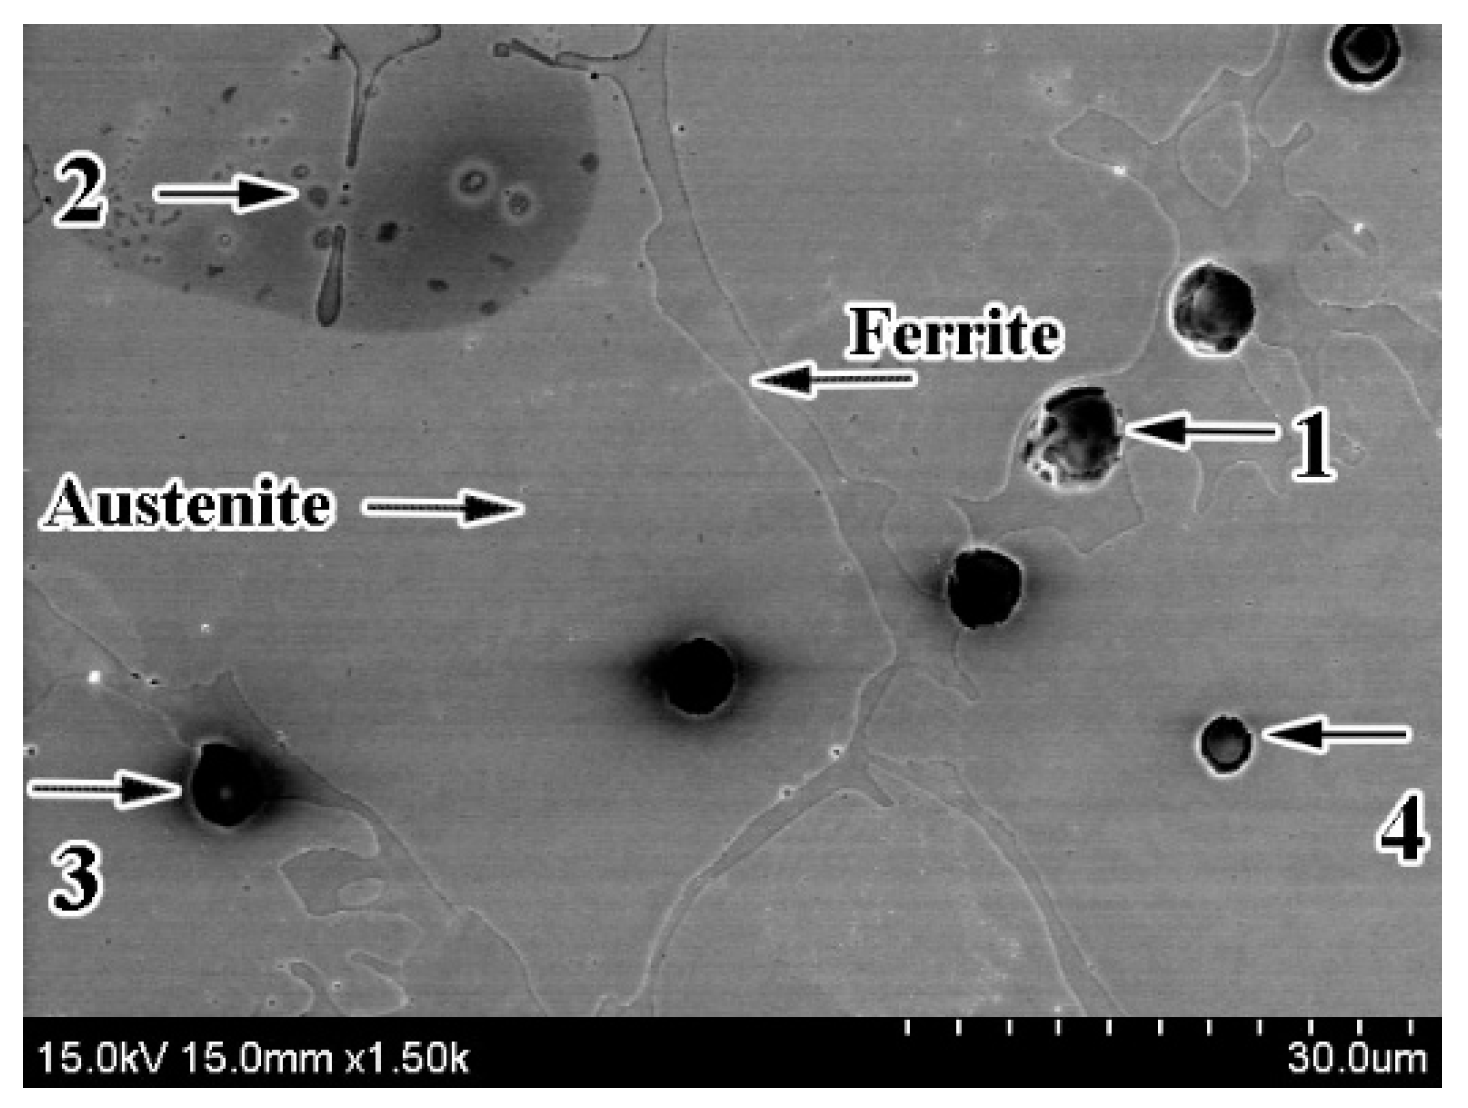
Figure 7.
The micrographs of the GTAW/GTAW+EMS welds: (a) OM micrographs of unetched specimens in the cap region, (b) OM micrographs of unetched specimens in the root region, and (c) the secondary electron image (SEI) micrographs of the etched specimens in the cap region.
Figure 7.
The micrographs of the GTAW/GTAW+EMS welds: (a) OM micrographs of unetched specimens in the cap region, (b) OM micrographs of unetched specimens in the root region, and (c) the secondary electron image (SEI) micrographs of the etched specimens in the cap region.

Figure 8.
The OM micrographs of the middle welds at: (a) low magnification, and (b) high magnification.
Figure 8.
The OM micrographs of the middle welds at: (a) low magnification, and (b) high magnification.
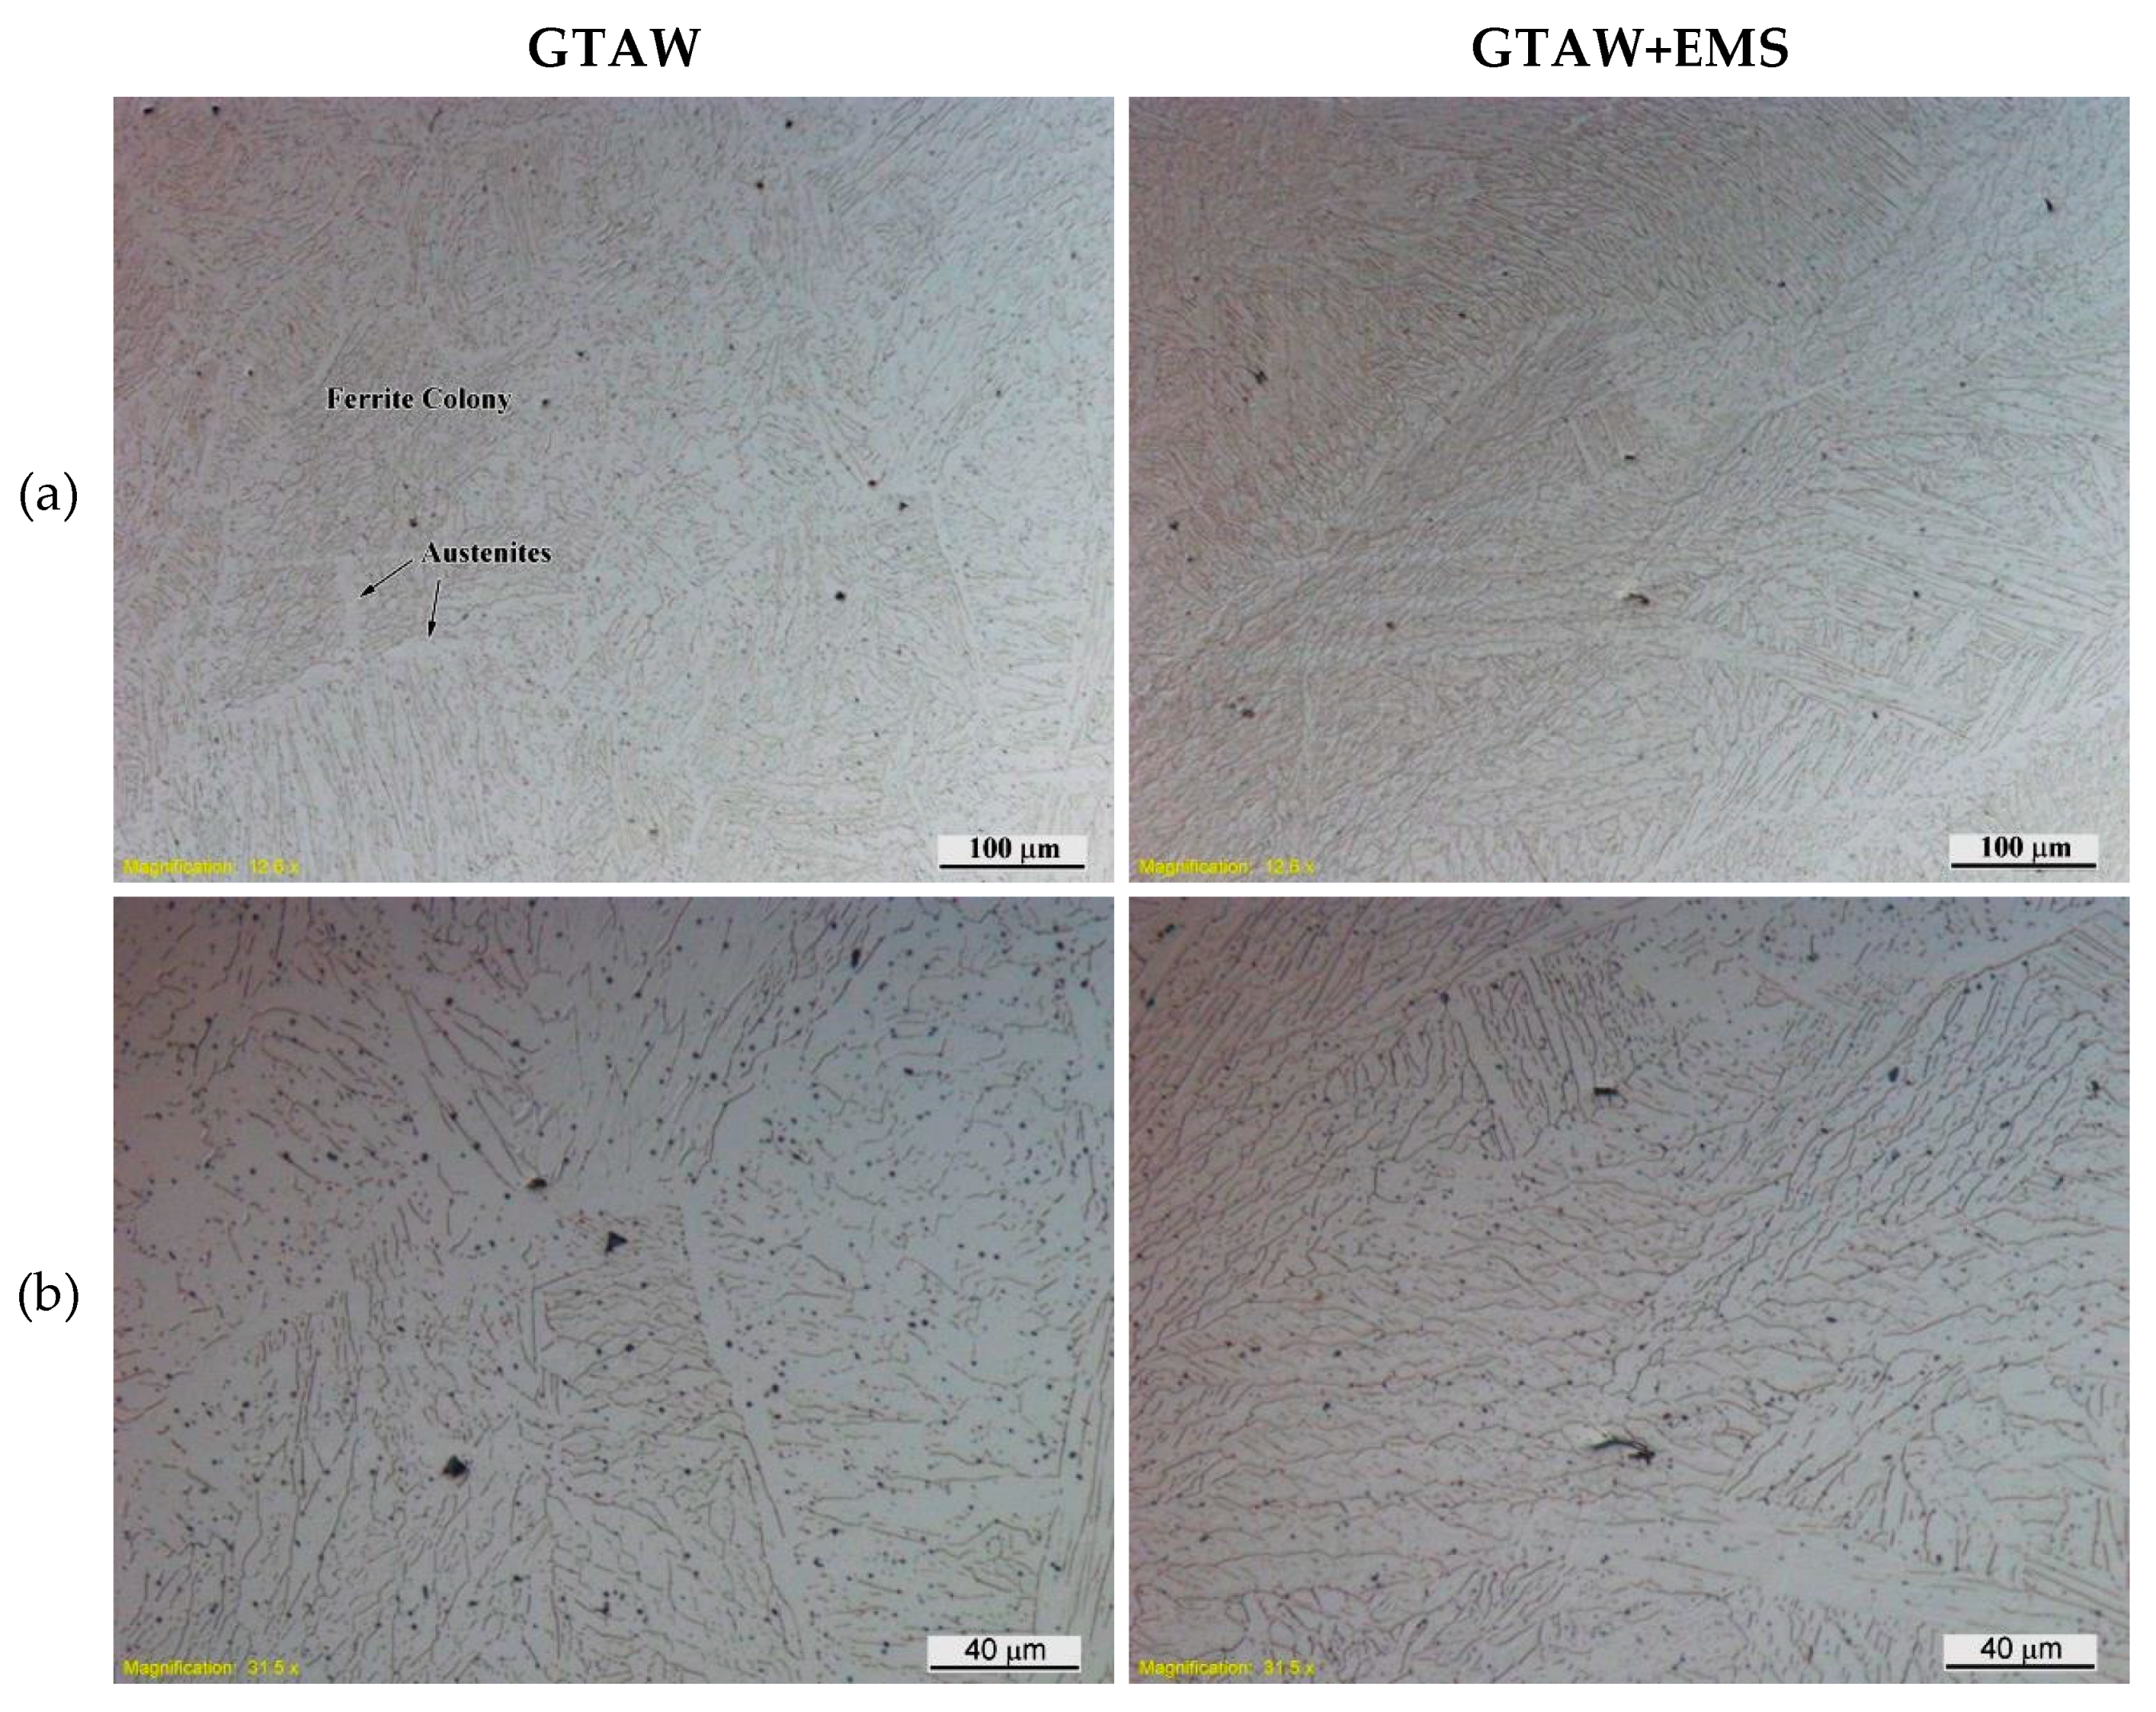
Figure 9.
(a) The EBSD analysis of the GTAW weld in the middle, and (b) the fraction of the austenitic and ferritic phases in the welds.
Figure 9.
(a) The EBSD analysis of the GTAW weld in the middle, and (b) the fraction of the austenitic and ferritic phases in the welds.

Figure 10.
The relationship between the area fraction and grain-diameter group for the welds.
Figure 11.
The SEI micrographs of the GTAW weld.
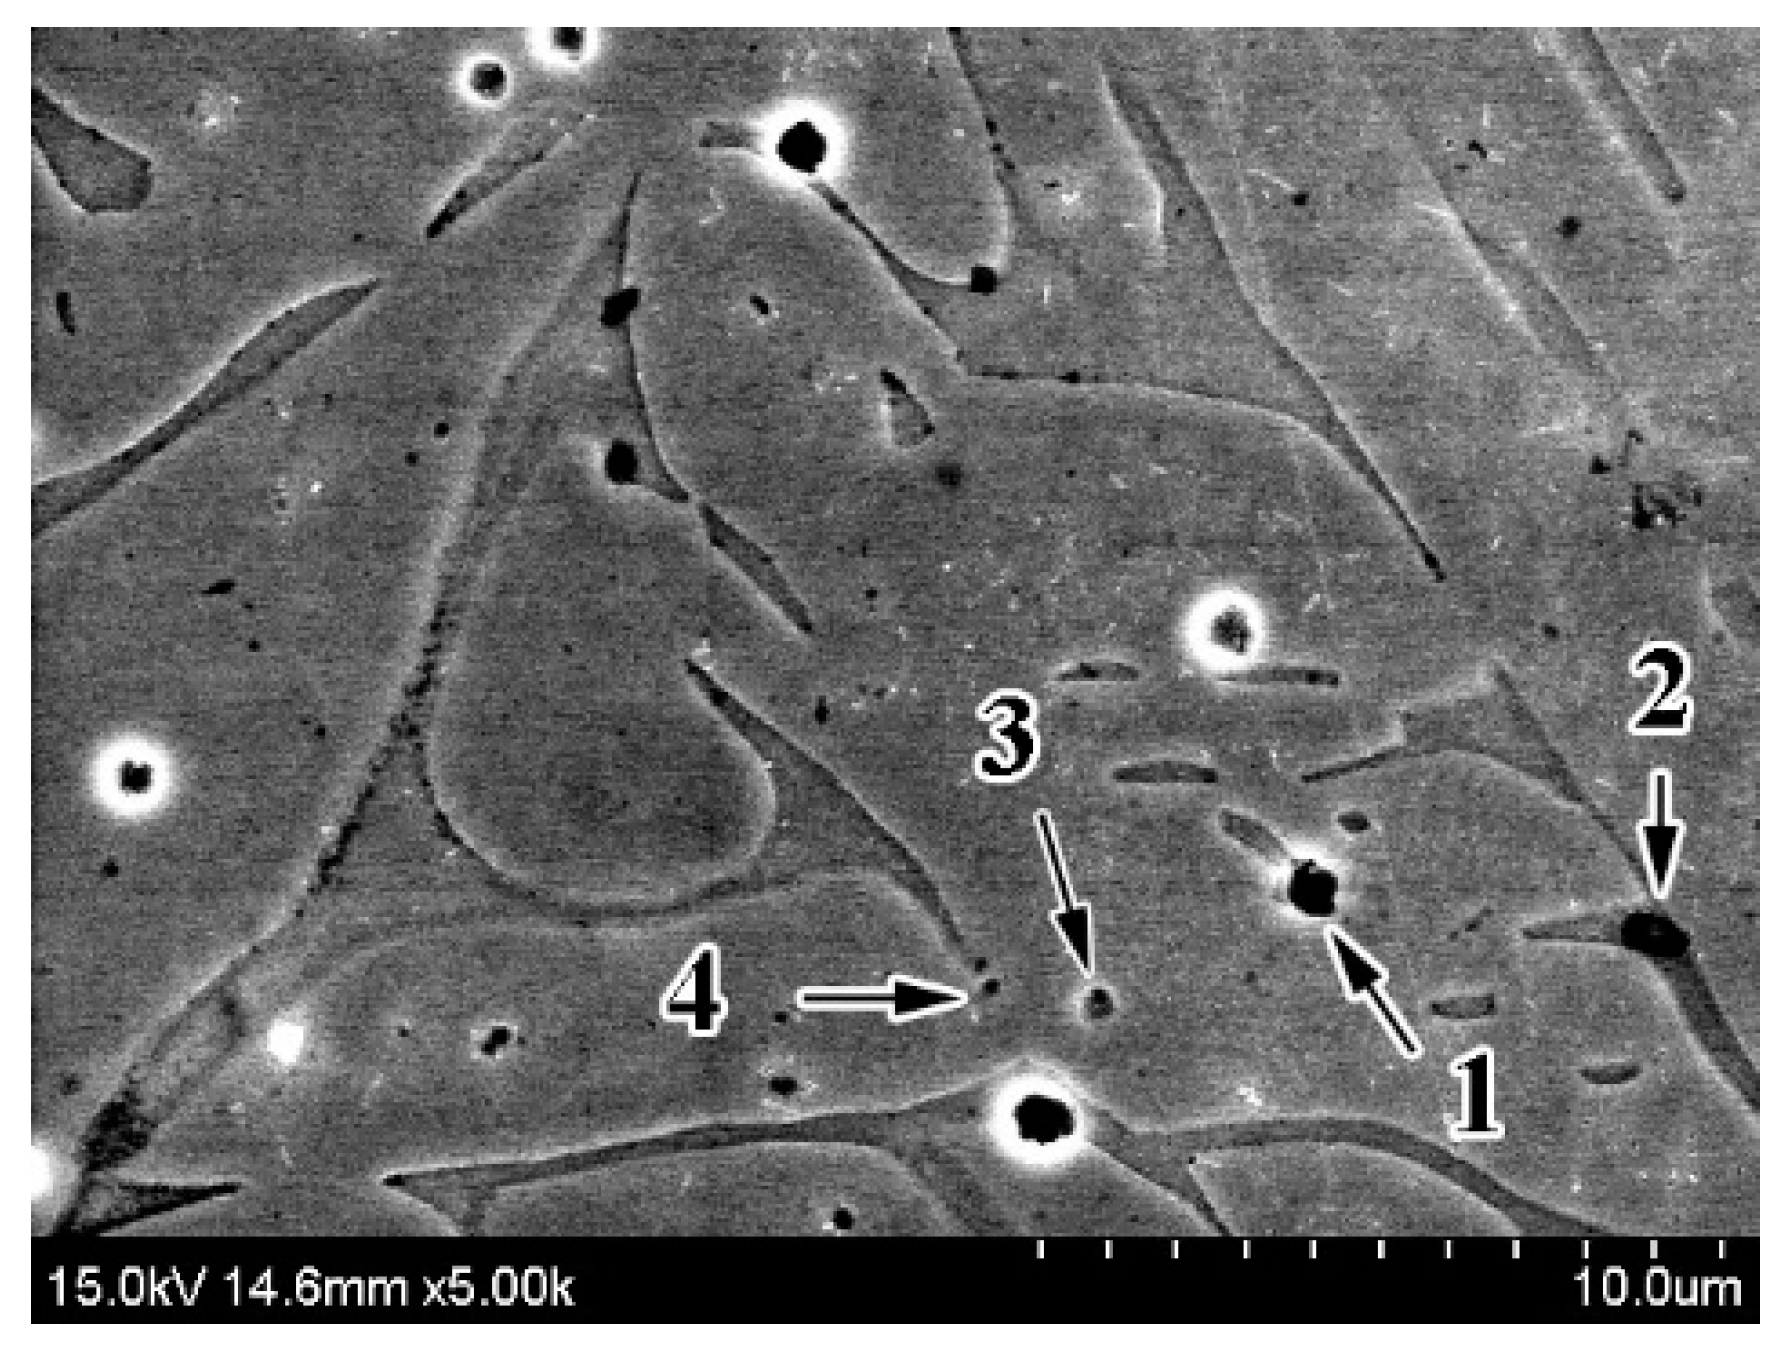
Figure 12.
The SEI micrographs of the GTAW+EMS weld: (a) Si-rich phase, and (b) Al-Si oxide with Sulfur.
Figure 12.
The SEI micrographs of the GTAW+EMS weld: (a) Si-rich phase, and (b) Al-Si oxide with Sulfur.
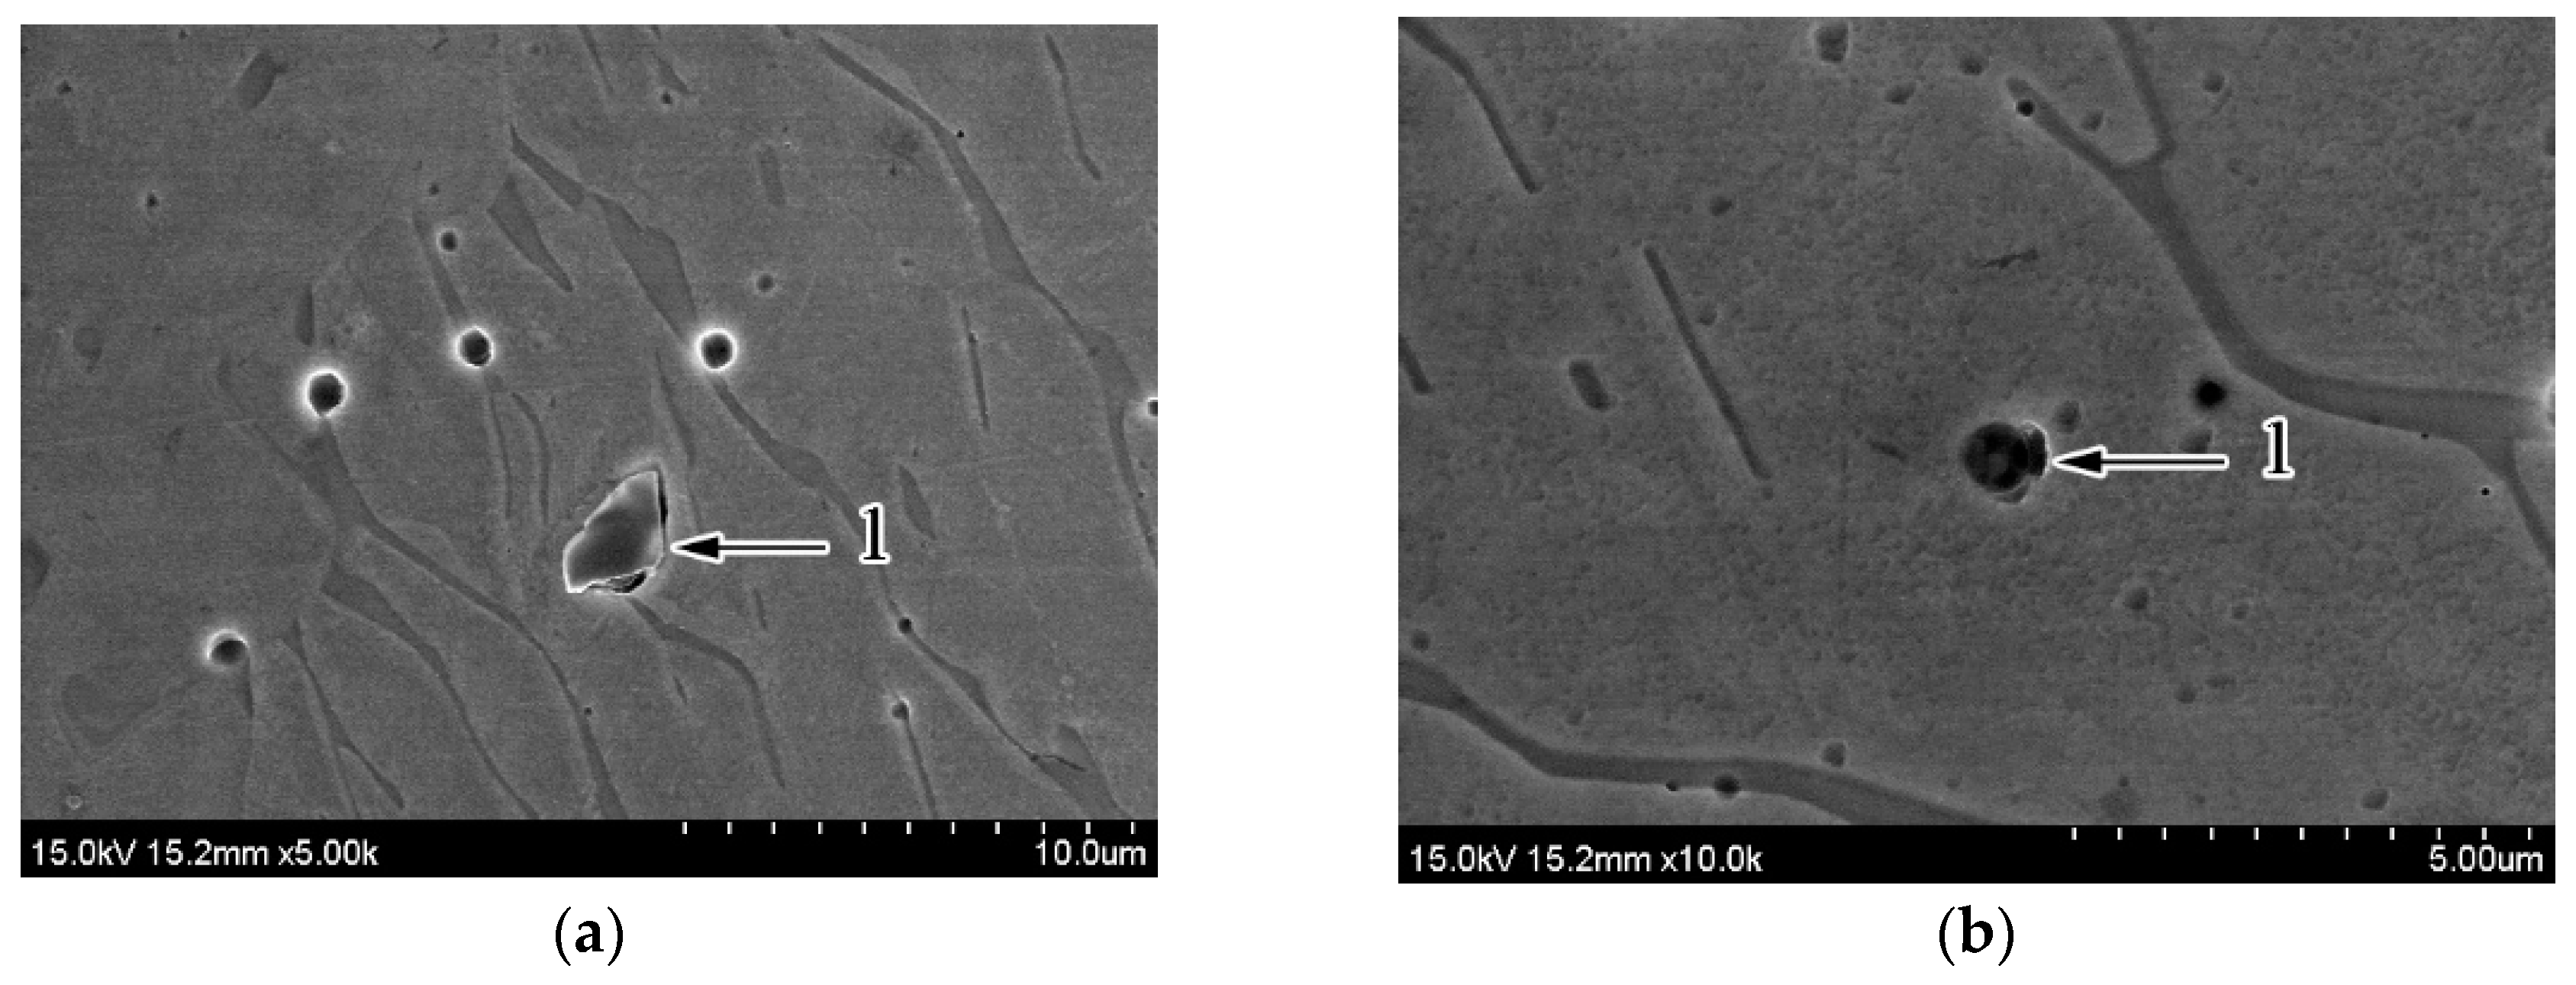
Figure 13.
The results of the micro-hardness test: (a) the hardness measurements of the ferrites and austenites in the base metals and HAZs, and (b) the hardness profiles for the welds.
Figure 13.
The results of the micro-hardness test: (a) the hardness measurements of the ferrites and austenites in the base metals and HAZs, and (b) the hardness profiles for the welds.
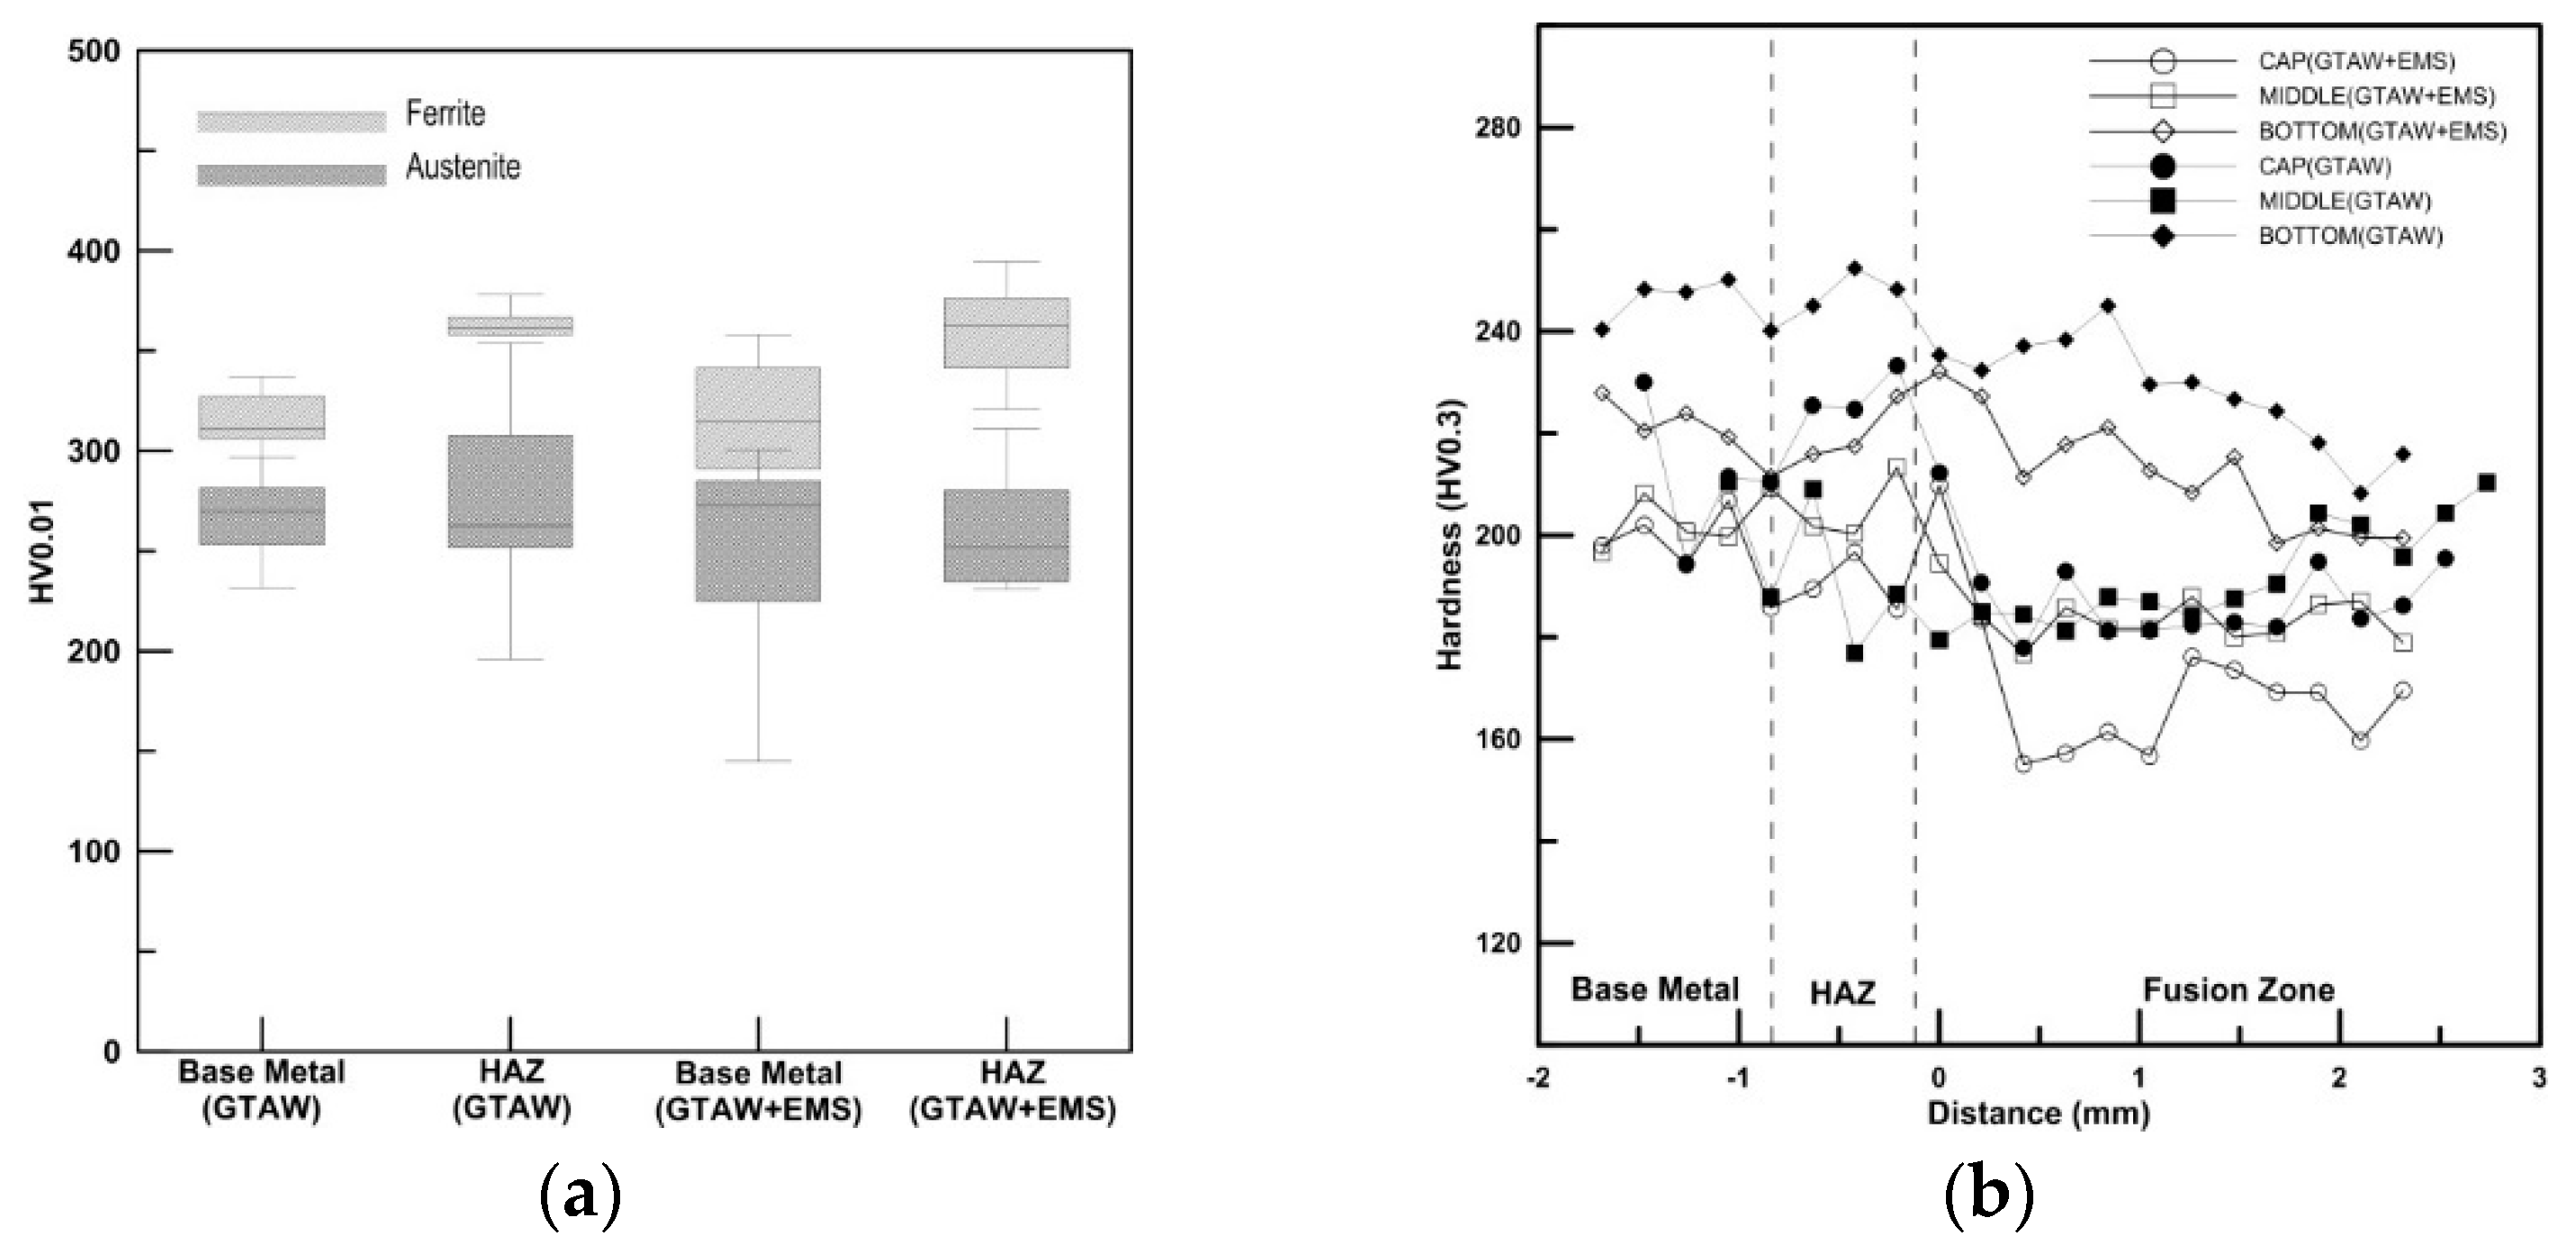
Figure 14.
The stress-strain curves for the tensile tests on the CASS weldments at room temperature.
Figure 14.
The stress-strain curves for the tensile tests on the CASS weldments at room temperature.
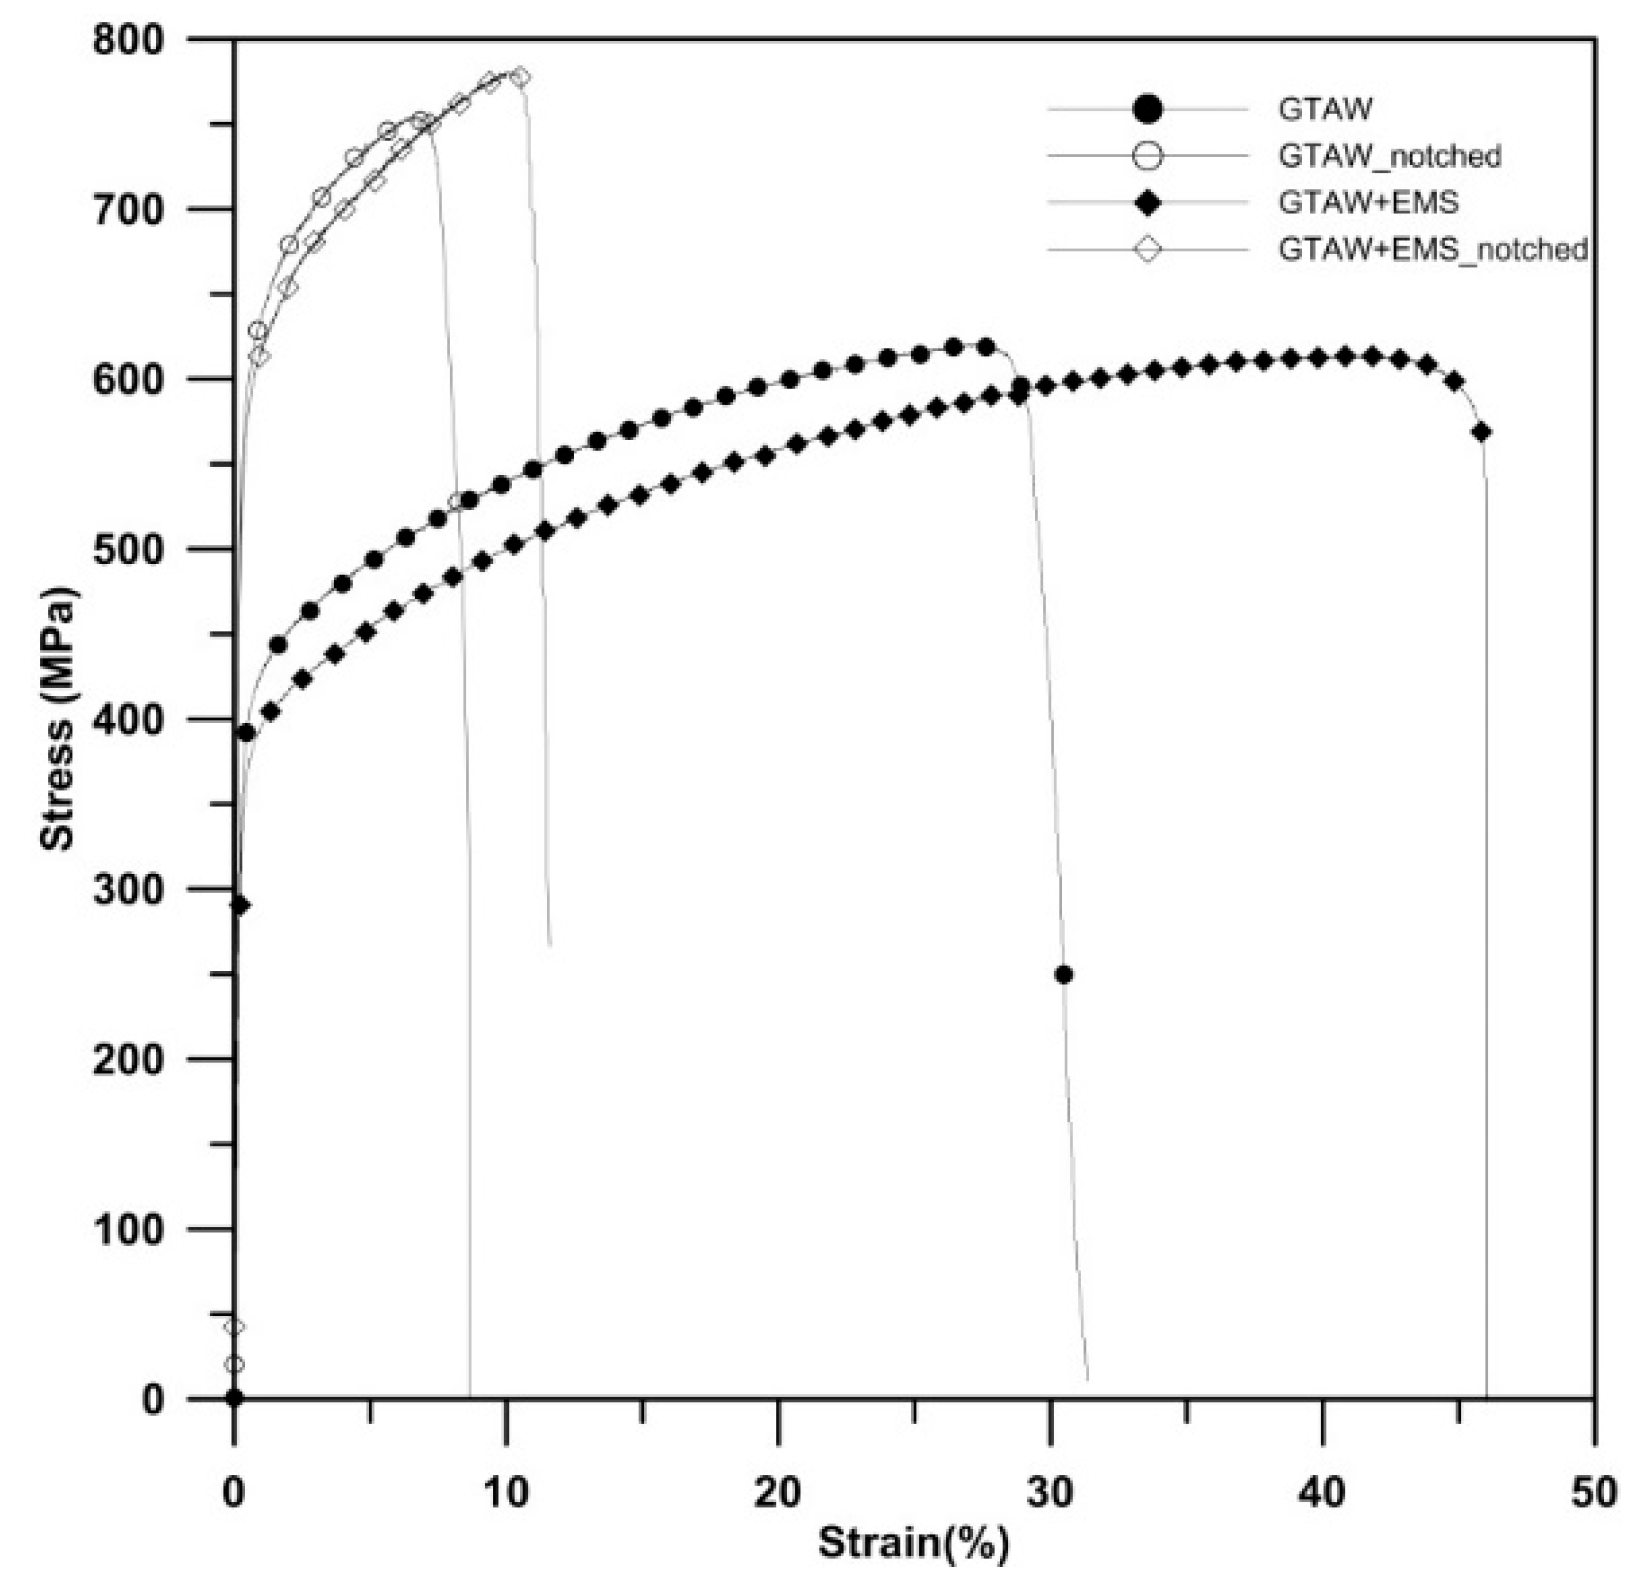
Figure 15.
The fractographs of the notched specimens that were tested at room temperature: (a) a low magnification, and (b) a high magnification.
Figure 15.
The fractographs of the notched specimens that were tested at room temperature: (a) a low magnification, and (b) a high magnification.

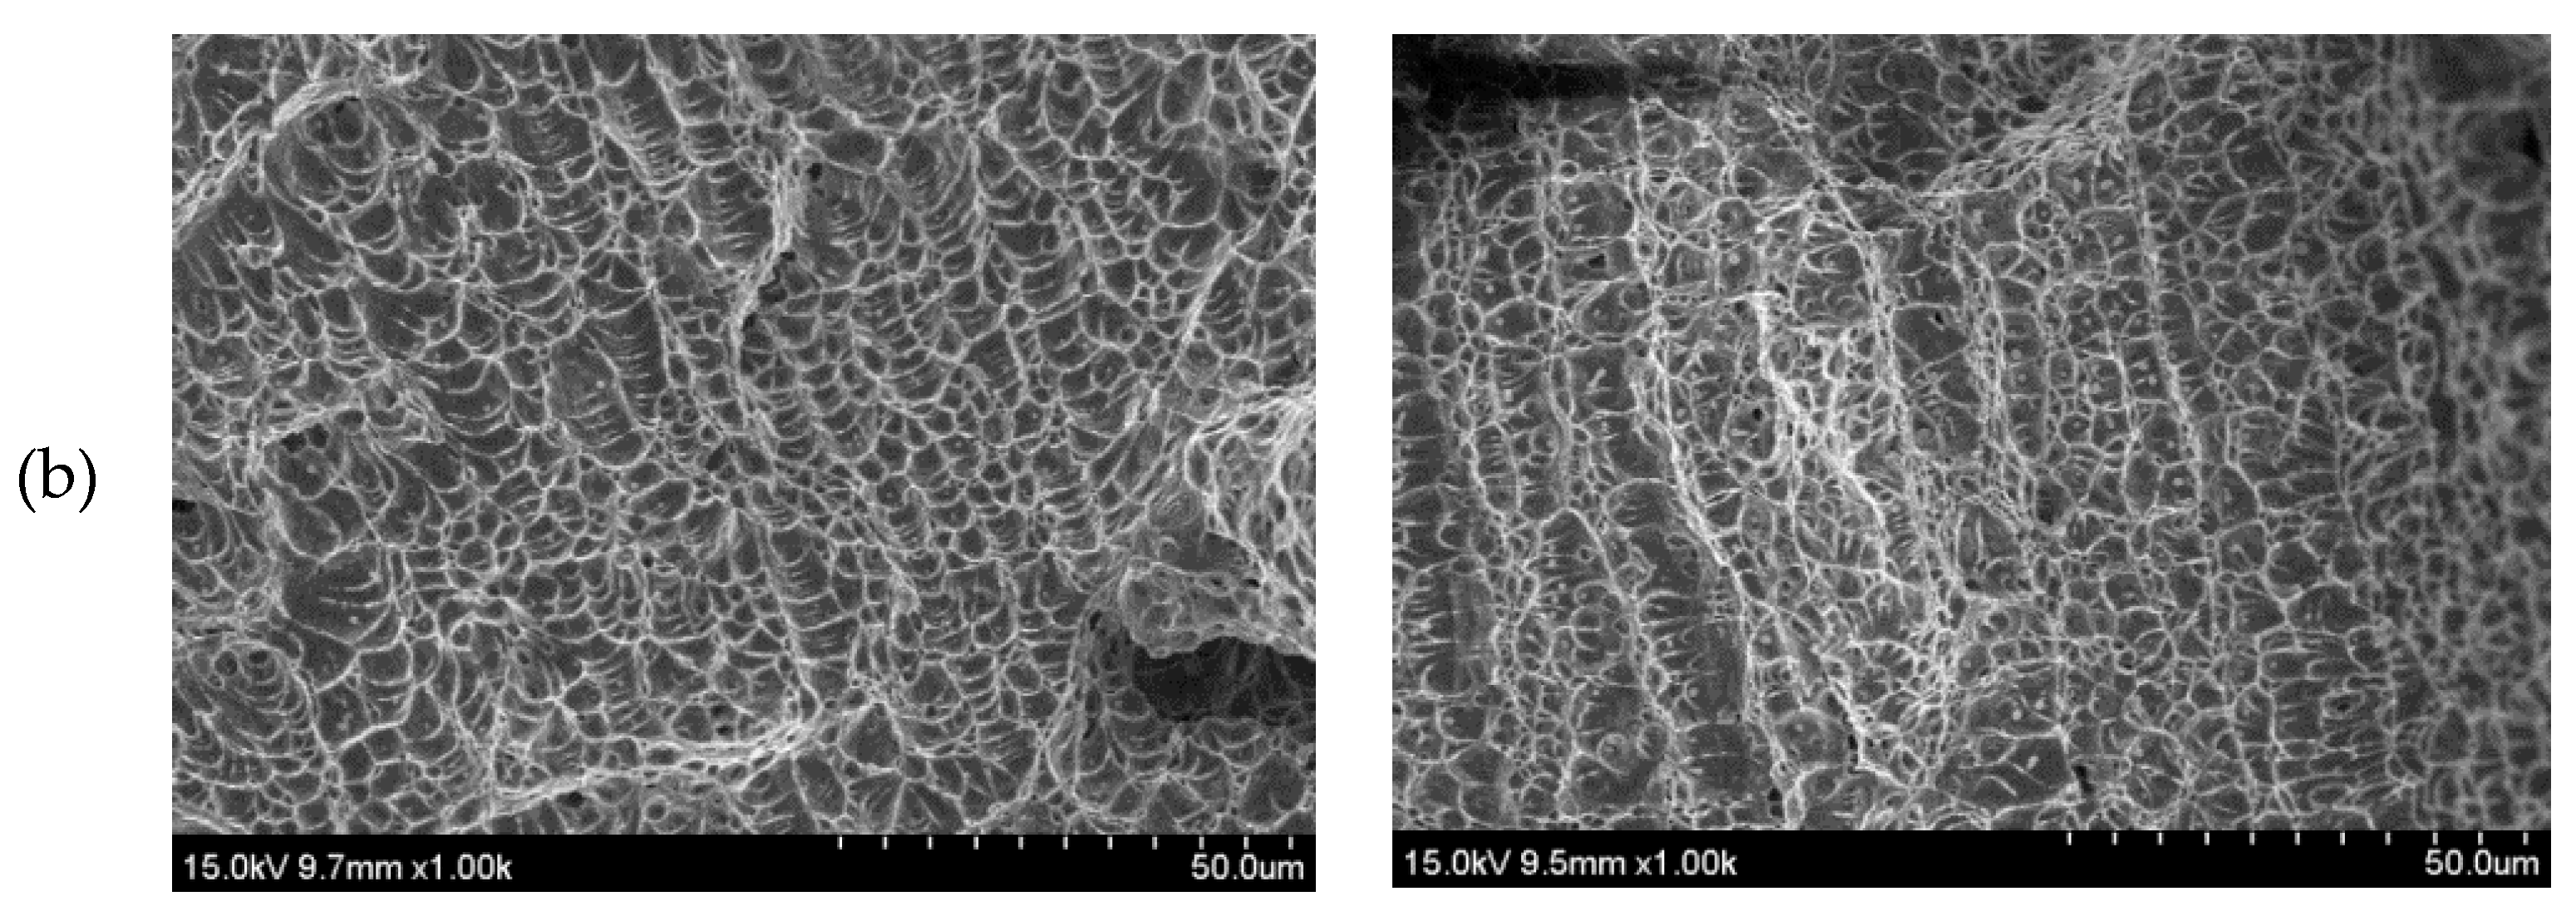
Figure 16.
The EBSD analysis of the cross-section close to the rupture of the notched tensile specimens.
Figure 16.
The EBSD analysis of the cross-section close to the rupture of the notched tensile specimens.

Table 1.
Chemical compositions of the base metal and weld metals (mass %).
| Mater. | C | Cr | Ni | Fe | Mn | Mo | Ti | Si | P | S |
|---|---|---|---|---|---|---|---|---|---|---|
| CF8A | 0.05 | 20.90 | 8.28 | 67.70 | 0.90 | 0.10 | 0.020 | 1.60 | 0.010 | 0.140 |
| 308L | 0.02 | 20.30 | 10.30 | 66.74 | 1.94 | 0.09 | 0.002 | 0.51 | 0.010 | 0.003 |
Table 2.
The EDS results of the ferritic and austenitic phases in the base metal (mass %).
| Phase | No. | Si | Cr | Mn | Fe | Ni |
|---|---|---|---|---|---|---|
| Ferrite | 1 | 2.18 | 25.44 | - | 67.55 | 4.82 |
| 2 | 2.03 | 25.09 | 0.50 | 66.96 | 5.42 | |
| 3 | 2.08 | 25.11 | 0.95 | 66.76 | 5.09 | |
| Average | 2.10 | 25.21 | 0.73 | 67.09 | 5.11 | |
| Austenite | 1 | 1.63 | 19.38 | 0.88 | 68.82 | 9.29 |
| 2 | 1.79 | 19.59 | 1.07 | 68.16 | 9.40 | |
| 3 | 1.79 | 19.43 | 0.90 | 68.28 | 9.59 | |
| Average | 1.74 | 19.47 | 0.95 | 68.42 | 9.43 |
Table 3.
EDS compositional analysis (wt %) of the oxides and MnS phases in the HAZ of GTAW weldments.
Table 3.
EDS compositional analysis (wt %) of the oxides and MnS phases in the HAZ of GTAW weldments.
| No. | C | O | Al | Si | S | Ca | Ti | Cr | Mn | Fe | Ni |
|---|---|---|---|---|---|---|---|---|---|---|---|
| 1 | 2.94 | 35.99 | 2.08 | 17.19 | 0.54 | 0.28 | 0.81 | 12.49 | 7.04 | 19.29 | 1.34 |
| 2 | 3.16 | 4.03 | - | 1.60 | 0.46 | 0.56 | - | 18.06 | 0.75 | 63.01 | 7.76 |
| 3 | 1.64 | 46.65 | 4.92 | 21.50 | 0.68 | 1.11 | 1.08 | 3.36 | 18.00 | 1.06 | - |
| 4 | 2.14 | 43.86 | 4.42 | 19.43 | 0.45 | 1.14 | 0.88 | 5.70 | 13.71 | 7.60 | 0.67 |
| Ferrite | - | - | - | 1.91 | - | - | - | 24.74 | 0.79 | 67.10 | 5.46 |
| Austenite | - | - | - | 1.77 | - | - | - | 19.03 | 0.94 | 68.71 | 9.55 |
Table 4.
EDS compositional analysis (wt %) of the GTAW weld.
| No. | O | Al | Si | S | Cr | Mn | Fe | Ni |
|---|---|---|---|---|---|---|---|---|
| 1 | 16.16 | 0.76 | 9.75 | - | 16.33 | 2.60 | 49.80 | 4.60 |
| 2 | - | - | 1.24 | 0.24 | 25.84 | 0.97 | 67.34 | 4.36 |
| 3 | - | - | 0.88 | - | 19.81 | 0.90 | 69.41 | 9.00 |
| 4 | - | - | 1.11 | - | 20.41 | 1.22 | 69.19 | 8.07 |
| Ferrite | - | - | 1.37 | - | 25.82 | 1.12 | 66.92 | 4.78 |
| Austenite | - | - | 1.14 | - | 19.86 | 1.12 | 69.06 | 8.83 |
Table 5.
EDS compositional analysis (wt %) of the Si-rich phase in the GTAW+EMS weld.
| No. | Si | Cr | Mn | Fe | Ni |
|---|---|---|---|---|---|
| 1 | 57.06 | 10.43 | - | 29.32 | 3.19 |
| Ferrite | 0.91 | 26.76 | 1.23 | 66.18 | 4.92 |
| Austenite | 0.50 | 19.31 | 1.55 | 68.00 | 10.64 |
Table 6.
EDS compositional analysis (wt %) of the Al-Mn-Si oxide with sulfur in the GTAW+EMS weld.
| No. | C | O | Mg | Al | Si | S | Ca | Cr | Mn | Fe | Ni |
|---|---|---|---|---|---|---|---|---|---|---|---|
| 1 | 1.85 | 26.83 | 0.81 | 6.15 | 8.01 | 1.17 | 3.05 | 11.12 | 6.82 | 30.73 | 3.47 |
| Ferrite | - | - | - | - | 0.74 | - | - | 26.34 | 1.29 | 66.19 | 5.45 |
| Austenite | - | - | - | - | 0.70 | - | - | 19.51 | 1.54 | 68.66 | 9.59 |
Table 7.
The tensile test results of the CASS weldments at room temperature.
| Specimen | Standard Tensile Test/Notched Tensile Test | |||
|---|---|---|---|---|
| Young’s Modulus (MPa) | Yielding Strength (MPa) | Tensile Strength (MPa) | Elongation (%) | |
| GTAW | 1.61 × 10⁵/2.40 × 105 | 401.3/684.7 | 638.7/754.1 | 36.5/8.6 |
| GTAW+EMS | 1.45 × 10⁵/1.97 × 105 | 379.9/664.0 | 610.1/781.1 | 41.7/11.6 |
© 2018 by the authors. Licensee MDPI, Basel, Switzerland. This article is an open access article distributed under the terms and conditions of the Creative Commons Attribution (CC BY) license (http://creativecommons.org/licenses/by/4.0/).
Share and Cite
MDPI and ACS Style
Jeng, S.-L.; Su, D.-P.; Lee, J.-T.; Huang, J.-Y. Effects of Electromagnetic Stirring on the Cast Austenitic Stainless Steel Weldments by Gas Tungsten Arc Welding. Metals 2018, 8, 630. https://doi.org/10.3390/met8080630
AMA Style
Jeng S-L, Su D-P, Lee J-T, Huang J-Y. Effects of Electromagnetic Stirring on the Cast Austenitic Stainless Steel Weldments by Gas Tungsten Arc Welding. Metals. 2018; 8(8):630. https://doi.org/10.3390/met8080630
Chicago/Turabian StyleJeng, Sheng-Long, Dai-Ping Su, Jing-Ting Lee, and Jiunn-Yuan Huang. 2018. "Effects of Electromagnetic Stirring on the Cast Austenitic Stainless Steel Weldments by Gas Tungsten Arc Welding" Metals 8, no. 8: 630. https://doi.org/10.3390/met8080630
Note that from the first issue of 2016, this journal uses article numbers instead of page numbers. See further details here.