The In-Plane Structure and Dynamic Property of the Homogeneous Al-Al Solid-Liquid Interface

Key Laboratory for Advanced Materials Processing Technology, Ministry of Education, School of Materials Science and Engineering, Tsinghua University, Beijing 100084, China
*
Authors to whom correspondence should be addressed.
Metals 2018, 8(8), 602; https://doi.org/10.3390/met8080602
Submission received: 3 July 2018
/
Revised: 27 July 2018
/
Accepted: 30 July 2018
/
Published: 2 August 2018
(This article belongs to the Special Issue 5th UK-China Steel Research Forum)
Abstract
:Using molecular dynamics simulation and a newly developed COMB3 potential, the in-plane ordering and diffusion constant profiles at the homogeneous (100), (110), and (111) interfaces between solid and liquid Al have been examined. We found that the in-plane ordering characterized by 2-D density maps and 2-D structure factors existed in the first 6, 10, and 3 out-of-plane layers at the (100), (110), and (111) interfaces, respectively, showing a strong dependence on substrate orientation. In layers with in-plane ordering, the diffusion constant is greatly reduced relative to its value in the bulk liquid, while the influence of layers without in-plane ordering is negligible. The three diffusivity components turn out to be isotropic at the homogeneous interfaces. The Al-Al interfaces studied here will serve as an important reference in comparisons of the structure and properties of different solid-liquid interfaces, which will greatly support the design of grain refiners.
1. Introduction
The structure and properties of solid-liquid interfaces are related to a variety of important phenomena, such as nucleation [1,2], crystal growth [3,4] and the structure of amorphous phases [5,6]. Although they have attracted widespread attention for decades, they are still not well understood. Examining solid-liquid interfaces experimentally is extremely difficult, and such studies are rare [7,8,9,10,11]. As a result, our understanding of the solid-liquid interface has mainly come from molecular dynamics simulations.
Numerical and experimental studies [4,12] have shown that the structure of the solid-liquid interface is quite different from that of the bulk solid or bulk liquid. Liquids adjacent to a crystal exhibit two kinds of ordering: out-of-plane layering perpendicular to the interface and in-plane ordering parallel to the interface. The out-of-plane layering is characterized by gradually decayed atomic density oscillations near the solid-liquid interface. It has been found that out-of-plane layering is a universal phenomenon existing in many different interfacial regions [13,14,15,16,17,18]. It even occurs at the interface between a liquid and a structureless wall [19,20,21]. The in-plane ordering describes the arrangement of atoms within each out-of-plane layer in the interfacial region. Compared with the out-of-plane layering, the in-plane ordering appears less frequently and usually decays faster [7,22] with distance far from the interface. The in-plane ordering is believed to be more important in heterogeneous nucleation, but its experimental characterization is also much more difficult [12,23].
Heterogeneous nucleation plays a critical role in grain refinement; however, the mechanism behind it is still in debate [1,24]. To elucidate the effect of different factors that influence heterogeneous nucleation, it is necessary to investigate the ordering in liquid layers adjacent to different kinds of substrates [12]. While simulations of the out-of-plane layering and the in-plane ordering at several heterogeneous interfaces using realistic EAM (embedded atom method) potentials have been reported [15,16,22,25,26,27,28], most studies at homogeneous interfaces employed simple model potentials, such as Lennard-Jones potential [29], inverse-power potential [30], and hard-sphere potential [14]. Although model potentials can help to study the basic trend, they fall short of obtaining quantitative information. This makes it impossible to directly compare homogeneous interface and heterogeneous interface that have the same liquid phase at one side, which impedes the study of the influence of single factor in heterogeneous nucleation. Accompanying the appearance of the out-of-plane layering and the in-plane ordering at the interface, the dynamic property, which is mainly described by the diffusion constant, also changes, as demonstrated by Guerdane et al. [23]. Guerdane et al. found that the in-plane ordering at the interface between Zr crystal and NiZr melt dramatically reduces the mobility of the solute Ni atoms, and therefore impedes the crystallization of the NiZr melt, as it requires Ni atoms at the interface to be transported away. The diffusion constant is also an important input parameter in phase-field modelling, but its value is hard to measure experimentally, so diffusion constants calculated by molecular dynamics simulations are very useful.
Among different kinds of homogeneous interfaces, Al-Al solid-liquid interfaces are of special interest due to the wide application of aluminum products. The homogeneous Al-Al solid-liquid interfaces have been addressed in two recent studies. Men et al. [31] modelled the (100), (110), and (111) interfaces using a realistic EAM potential [32]. They examined the in-plane ordering with time-averaged atomic positions and a local order parameter, showing that in-plane ordering exists in the first 5, 5, and 3 layers for the (100), (110), and (111) interfaces, respectively. Jesson et al. [33] investigated the structure and dynamic property of the (100) interface using ab initio molecular dynamics simulation. A common problem in the two studies is that they did not explicitly monitor stress profiles. As pointed out by Broughton et al. [29], the stress profile is highly sensitive to transient effects, and accurate interface properties can only be obtained when the stress profile reaches zero at positions away from the interface. Our recent study [2] has also shown that the compressive stress imposed on the liquid significantly hinders the formation of an ordered structure at the interface and therefore is the barrier of nucleation. Because the two studies did not monitor the stress profile, whether the interfaces were under equilibrium is unknown. Men et al. [31] might have also underestimated the in-plane ordering, because the periodicity of atom arrangements may be buried in time-averaged atomic positions. Jesson et al. [33] argued that atoms diffuse faster along directions parallel to the interface than they do along the direction perpendicular to the interface in the first liquid layers. However, considering the small difference between the diffusivity components, it is not a convincing argument, since they did not provide error bars for their calculated values.
The in-plane ordering and dynamic property at three homogeneous Al-Al solid-liquid interfaces—(100), (110), and (111)—are studied in this work. It is an extension of our previous work [34], in which we investigated the out-of-plane layering and mechanical property of these interfaces. In the previous work, simulation parameters were chosen carefully to make sure that the monitored stress profiles are zero in bulk solid and bulk liquid. This guarantees all structure, and properties are indeed derived from equilibrium interfaces. In this paper, by further utilizing the equilibrium interfaces obtained in our previous simulation and by performing more detailed analysis, the 2-D density maps and structure factors for selected layers are presented to give information about the in-plane ordering, along with diffusion constant profiles to characterize dynamic property. In addition, the COMB3 potential developed by Choudhary et al. [35] was employed in our simulation. The COMB3 potentials [36] cover a wide range of elements, such as Cu, Ti, Zn, and Zr, et al., which means they can not only model Al-Al interfaces but also interfaces between liquid Al and other substrates. The aim of this paper is to enrich our understanding of the structure and properties of Al-Al interfaces and to provide an important reference for future studies about heterogeneous interfaces, which are also modelled by COMB3 potentials. By comparing different solid-liquid interfaces, we can see how substrates influence the adjacent Al melt, which will shed light on the design of grain refiners [12].
2. Materials and Methods
The current work is an extension of our previous study, in which the out-of-plane layering and mechanical properties of the homogeneous (100), (110), and (111) interfaces between Al crystal and its melt were examined [34]. The detailed information about creating solid-liquid coexistence systems with the three interface orientations can be found in reference [34]. Here, we only give a brief description about it.
The LAMMPS software (version20161117, SNL, Albuquerque, NM, USA) [37] developed by Sandia National Laboratories was utilized to perform the simulation. It is open-source software and has been widely used for molecular dynamics simulations in different disciplines. It can be downloaded from its website [38]. The solid-liquid coexistence systems were modelled by a recently developed COMB3 potential [39]. Compared with traditional EAM potentials, which can only model metallic bonds, COMB3 potentials can model different types of bonds in a simulation box and cover a variety of elements [36]. This greatly expands the kinds of interfaces that can be addressed and meets our needs.
The method to construct solid-liquid coexistence systems with different orientations is the same. The process of creating the coexistence system with the (100) interface is taken as an example here. The simulation began with the preparation of the solid sample and liquid sample with the same cross-sectional areas in NPZAT runs, respectively. The [100] direction of the solid crystal was oriented along the z direction. Then, the liquid sample was duplicated, and two identical liquid samples were placed on two sides of the solid sample in the z direction to construct a solid-liquid coexistence system, in which two identical solid-liquid interfaces with the (100) orientation were formed.
Each of the coexistence systems contains about 20,000 atoms, approximately two fifths of which are solid atoms located in the middle of the simulation box, and the rest are liquid atoms located at two sides. The sizes of the simulation boxes are about 4.1 × 10⁻⁹ m, 4.1 × 10⁻⁹ m, and 2.1 × 10⁻⁸ m in the x, y, and z direction, respectively. In the previous study [34], after obtaining the melting points (about 1137 K) reproduced by the COMB3 potential, the solid-liquid coexistence systems were used to calculate the density profiles, stress profiles, and potential energy profiles in NVT runs at the calculated melting points using Nosé–Hoover thermostats. One of the main findings in the previous study is that pronounced out-of-plane layers form in the liquid near the crystal. This can be reflected by the distributions of atoms along the z direction in a coexistence system. Figure 1 shows the distributions of atoms along the z direction for the interfaces, which are similar to the density profiles obtained in the previous study. However, the density profiles were calculated from seven coexistence systems for each interface in the previous study, here the profiles in Figure 1 were only calculated from one of the seven coexistence systems for each interface. The red dash line in Figure 1 denotes the Gibbs dividing surface. The red dot lines denote troughs in the oscillations, which can be regarded as boundaries of adjacent layers. The interfacial region is defined to start from the layer having a higher trough than that in the crystal. Layers are numbered in sequence, as shown in Figure 1.
Based on the result presented above, the in-plane ordering and diffusion constants at the three interfaces are examined in the current study. To calculate the in-plane ordering, each of the layers shown in Figure 1 is divided into small 2-D bins in the xy plane. The sizes of the 2-D bins in the x and y direction are 2.5 × 10⁻¹¹ m. Thus, every layer contains about 160 bins in both x and y direction. The number of atoms in each bin is counted every 10−12 s for 200 times to get the 2-D density map . The angled brackets mean that the 2-D density map is an average of the 200 configurations sampled. These configurations have been recorded in the previous study and thus can be reused directly.
Although the 2-D density map provides a direct observation of atom arrangement, it falls short of revealing weak in-plane ordering in layers far from the crystal. To better show the short-range order at the interface, the 2-D density map is then utilized to calculate the 2-D structure factor, which is defined as
in which is the Fourier transform of the 2-D density map calculated from one configuration. As 200 configurations were sampled, the angled brackets mean that the 2-D structure factor is averaged over the 200 recorded configurations.
The diffusion constant in a layer is determined from the Einstein equation:
in which is the average mean-square displacement (MSD) per atom for atoms locating in the layer centered at z at time . The MSD will be linearly dependent on simulation time when it reaches into diffusive regime, and the diffusion constant can be extracted from its changing rate with time. To improve the statistics, the MSD in each layer is calculated from 10 independent time origins separated by 2.0 × 10⁻¹² s, and each time the NVT simulation run lasts for 1.0 × 10⁻¹¹ s, which is long enough to ensure the MSD reaches the diffusive zone. In addition to calculate diffusion constants in the interfacial layers, diffusion constants in the adjacent crystal layers and liquid layers are also evaluated for comparison.
It should be pointed out that the configurations used here for calculation of 2-D density maps and structure factors have been recorded in our previous study [34], in which they have been utilized to calculate the stress profiles. The previous study has shown that these stress profiles reach zero away from the interfaces, demonstrating that the interfaces are under complete equilibrium. Therefore, 2-D density maps and structure factors obtained in the current study are also derived from equilibrium interfaces. For calculation of diffusion constants, a total of 10,000 consecutive steps are needed, while configurations were only recorded every 1000 steps in the previous study. Because the simulation time (1.0 × 10⁻¹¹ s) for calculation of diffusion constants is quite short, even if the interface deviates from equilibrium status, the deviation is negligible and would not significantly affect the calculated diffusion constants. So the diffusion constants are also derived from equilibrium interfaces.
3. Results
3.1. In-Plane Ordering
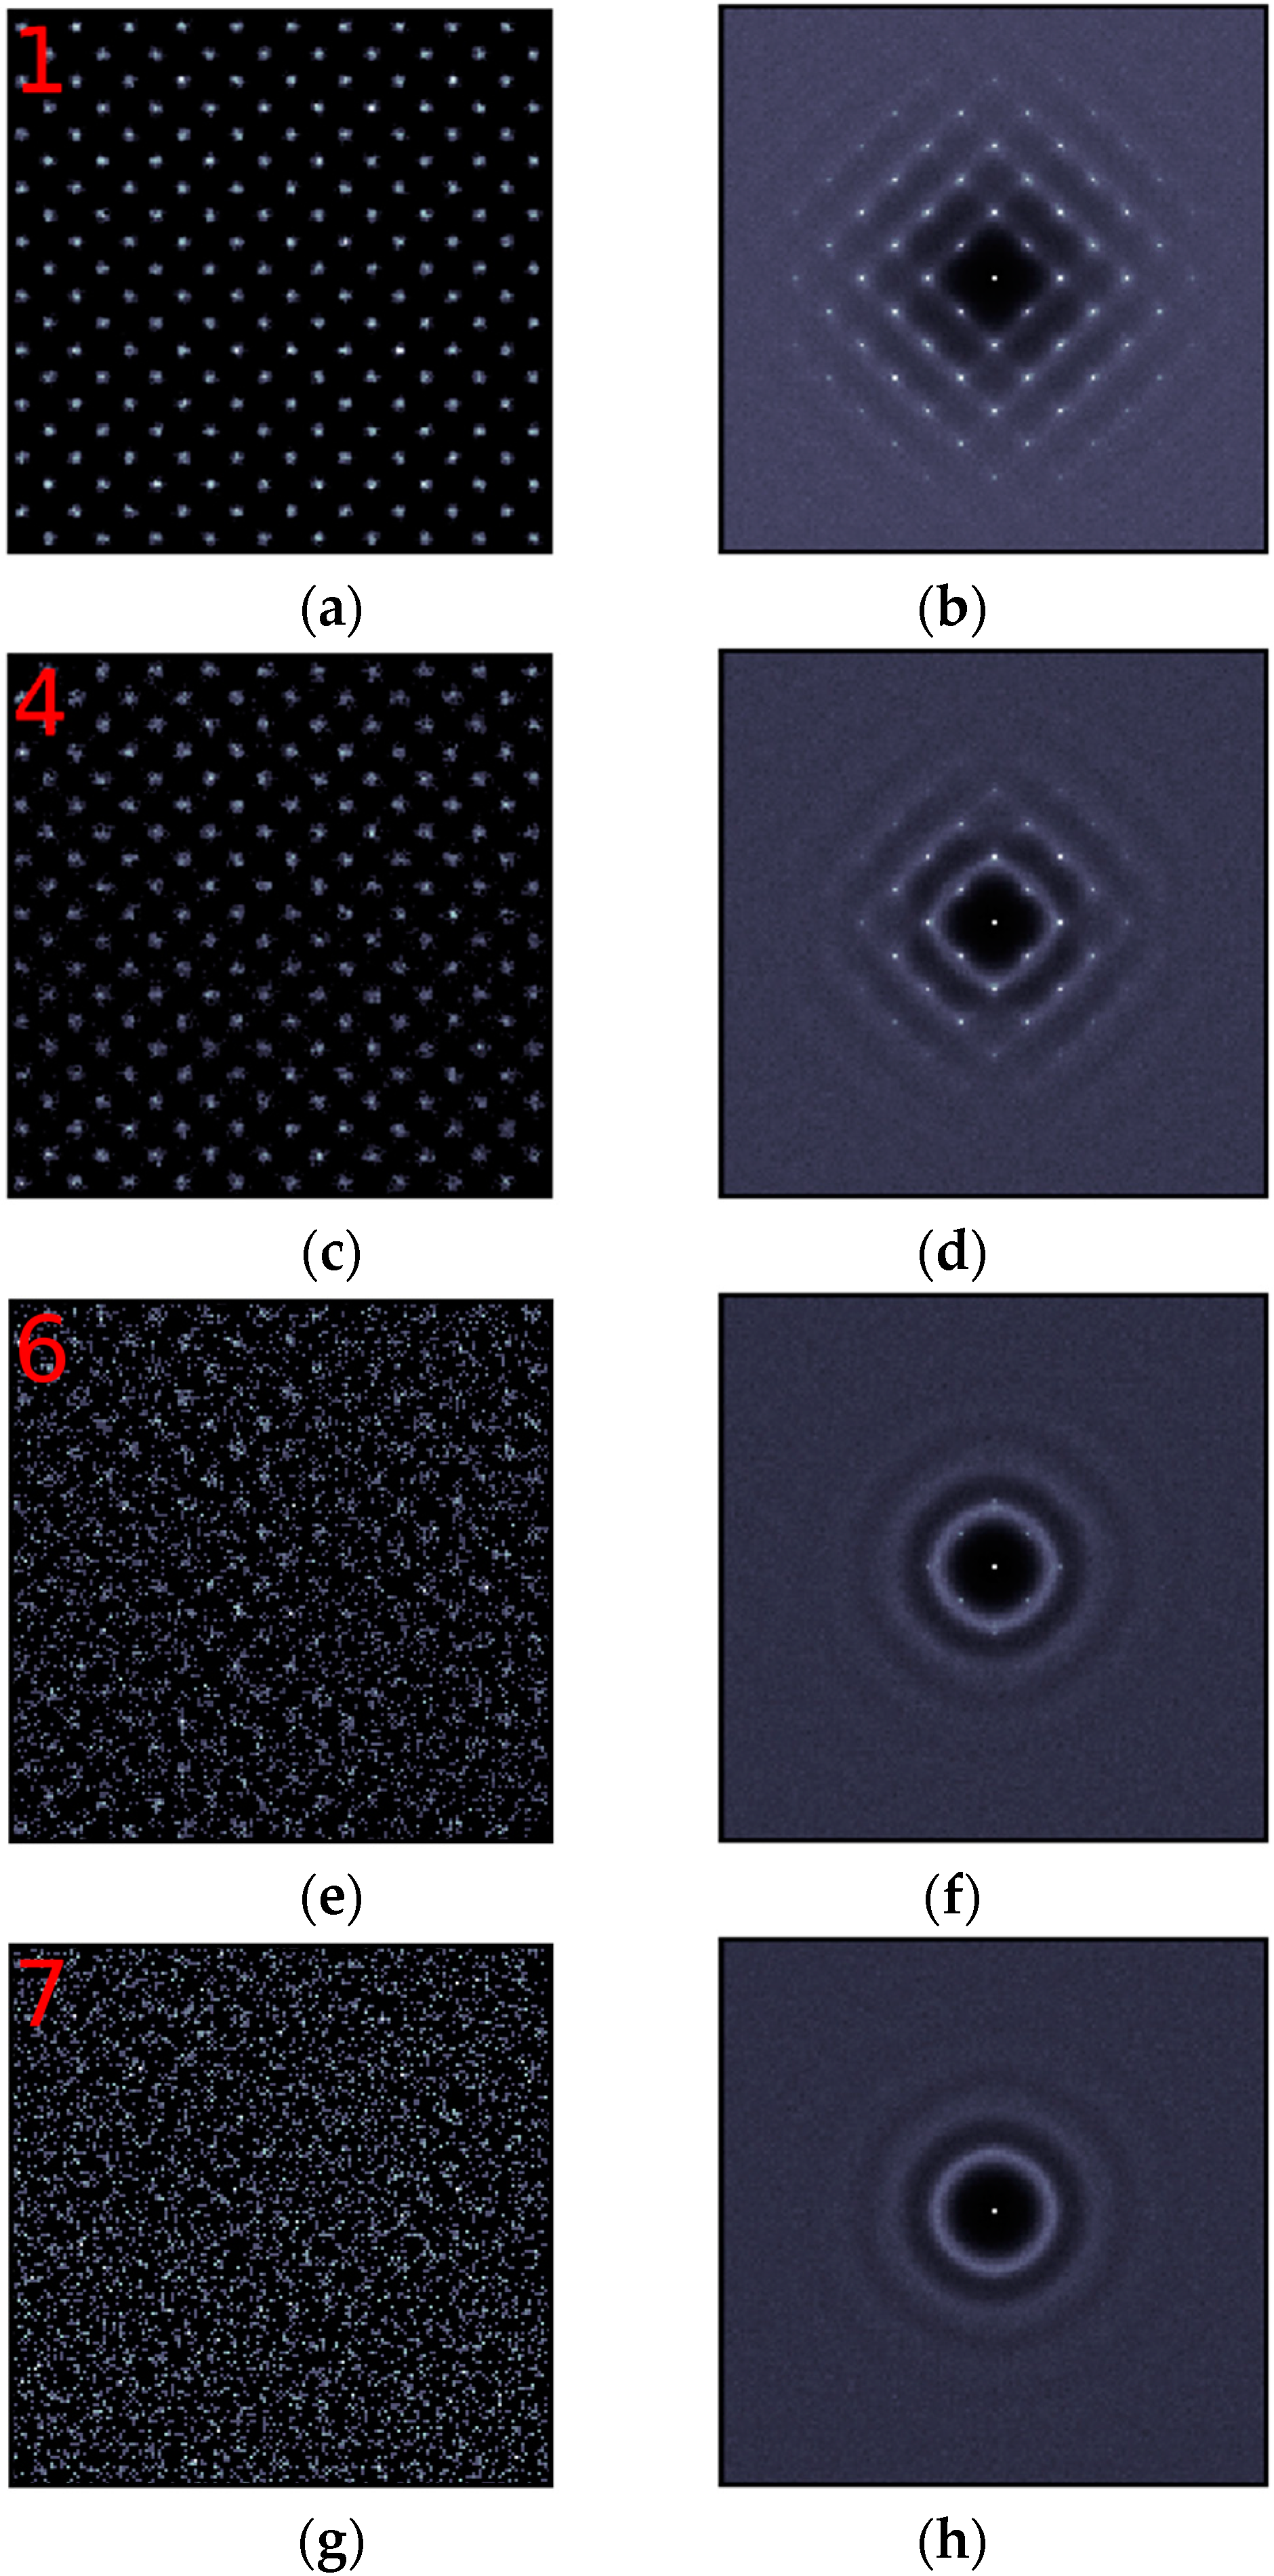
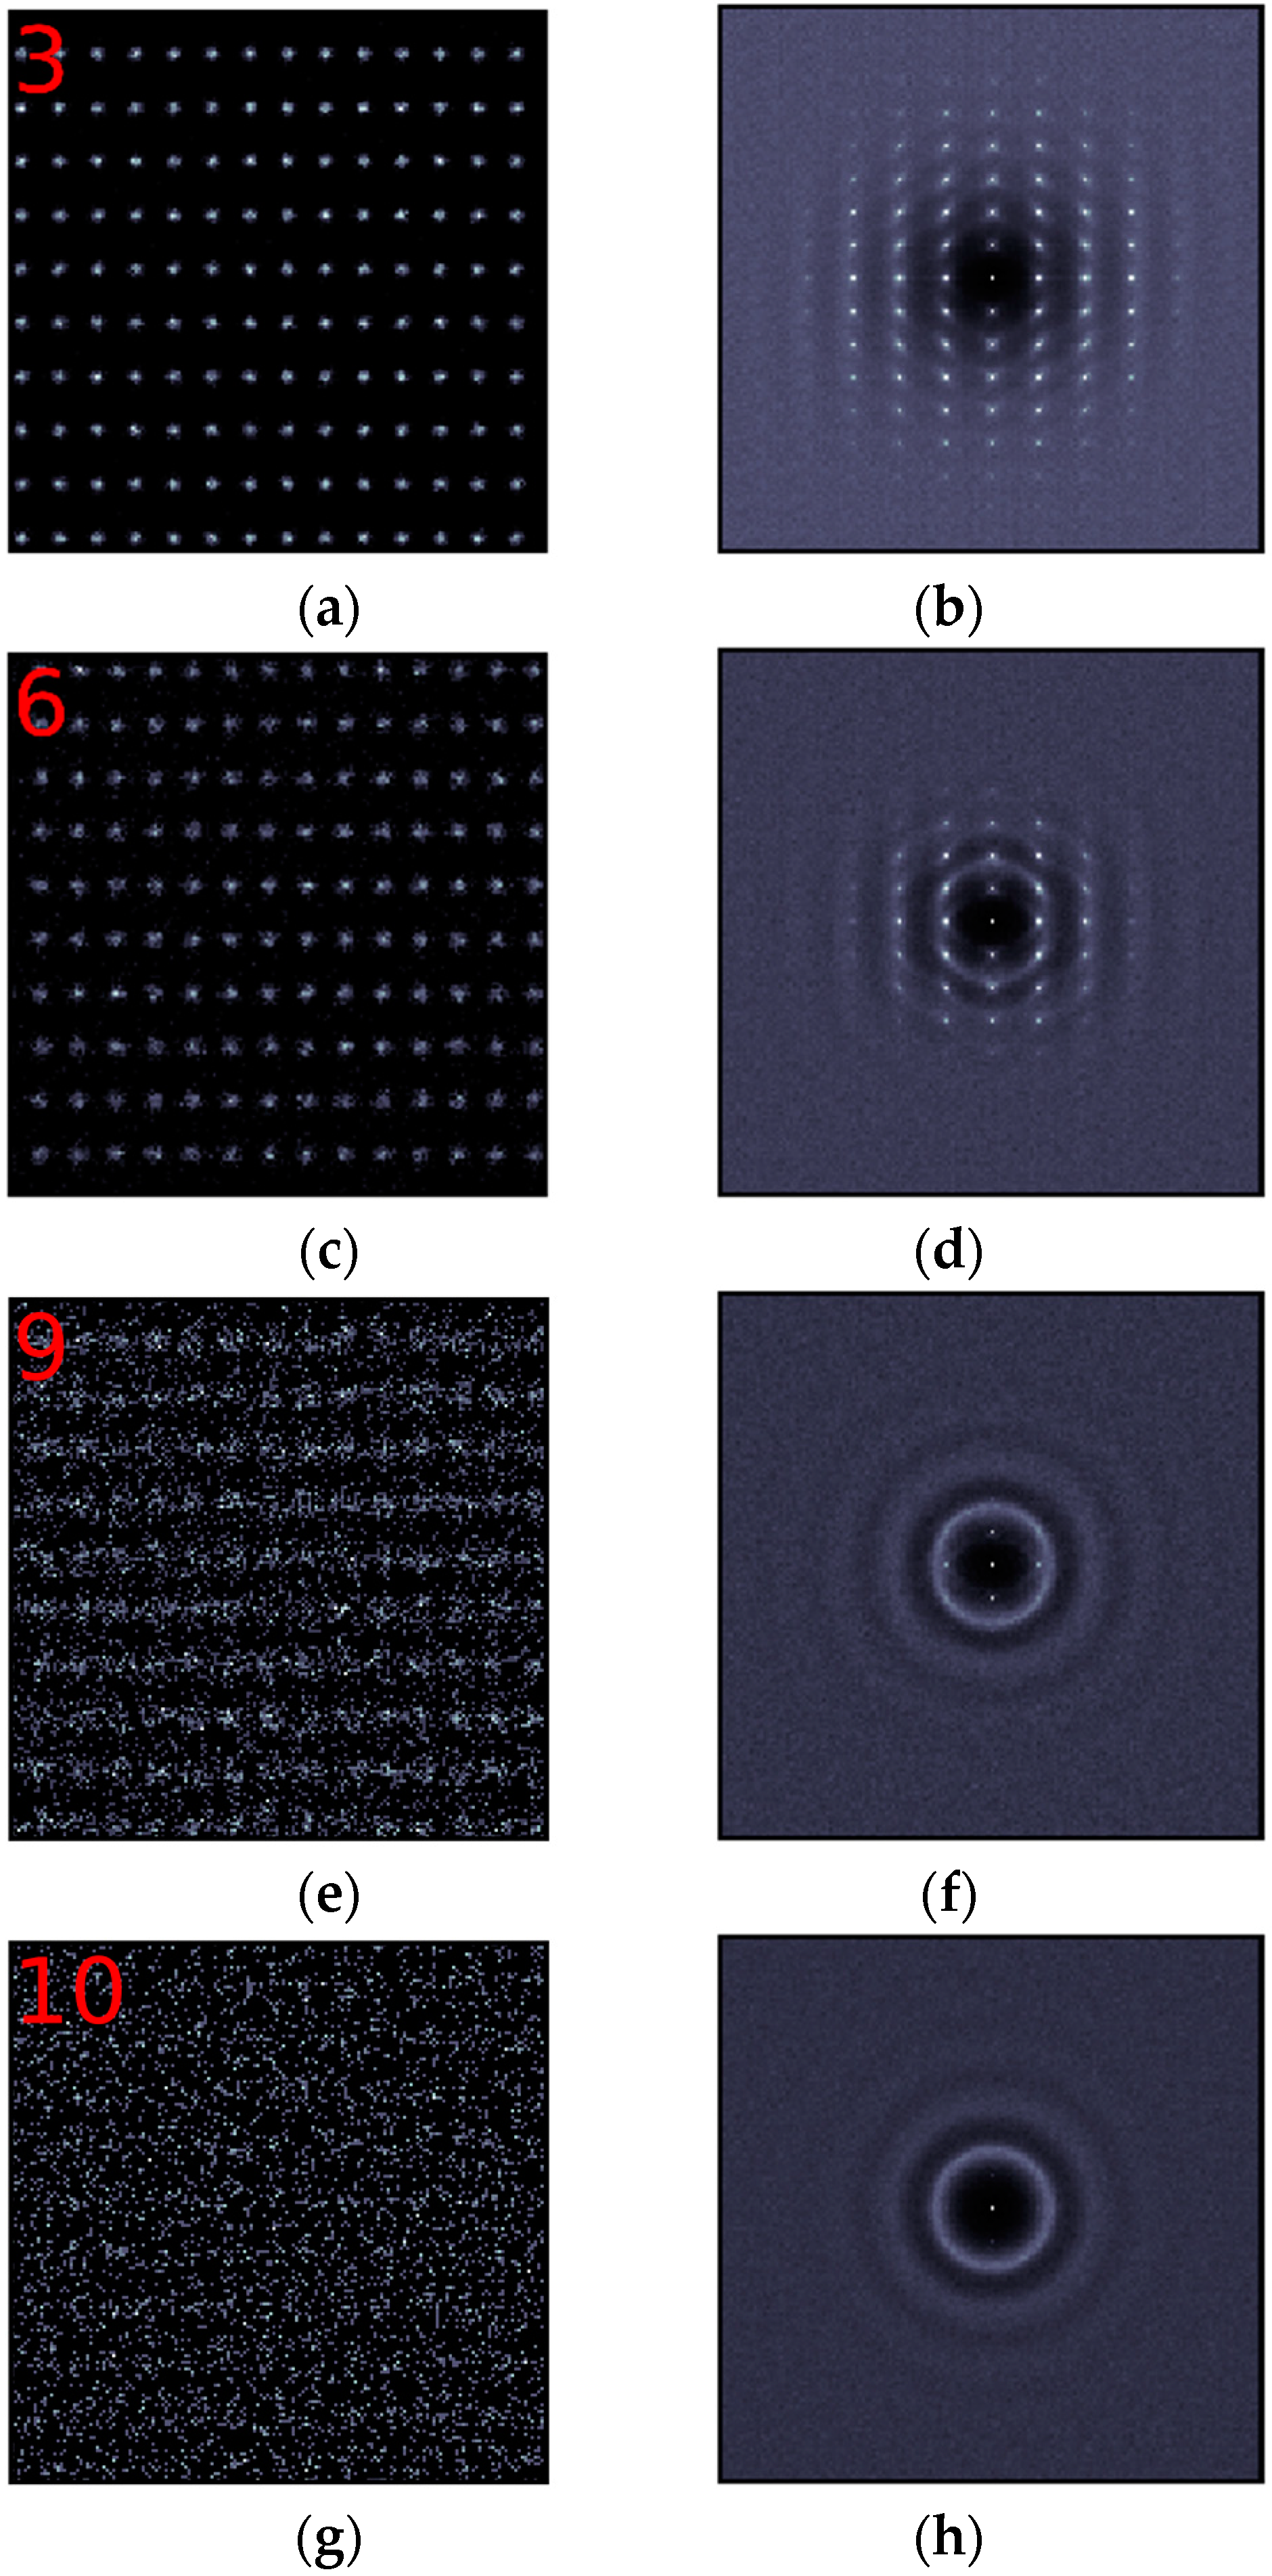
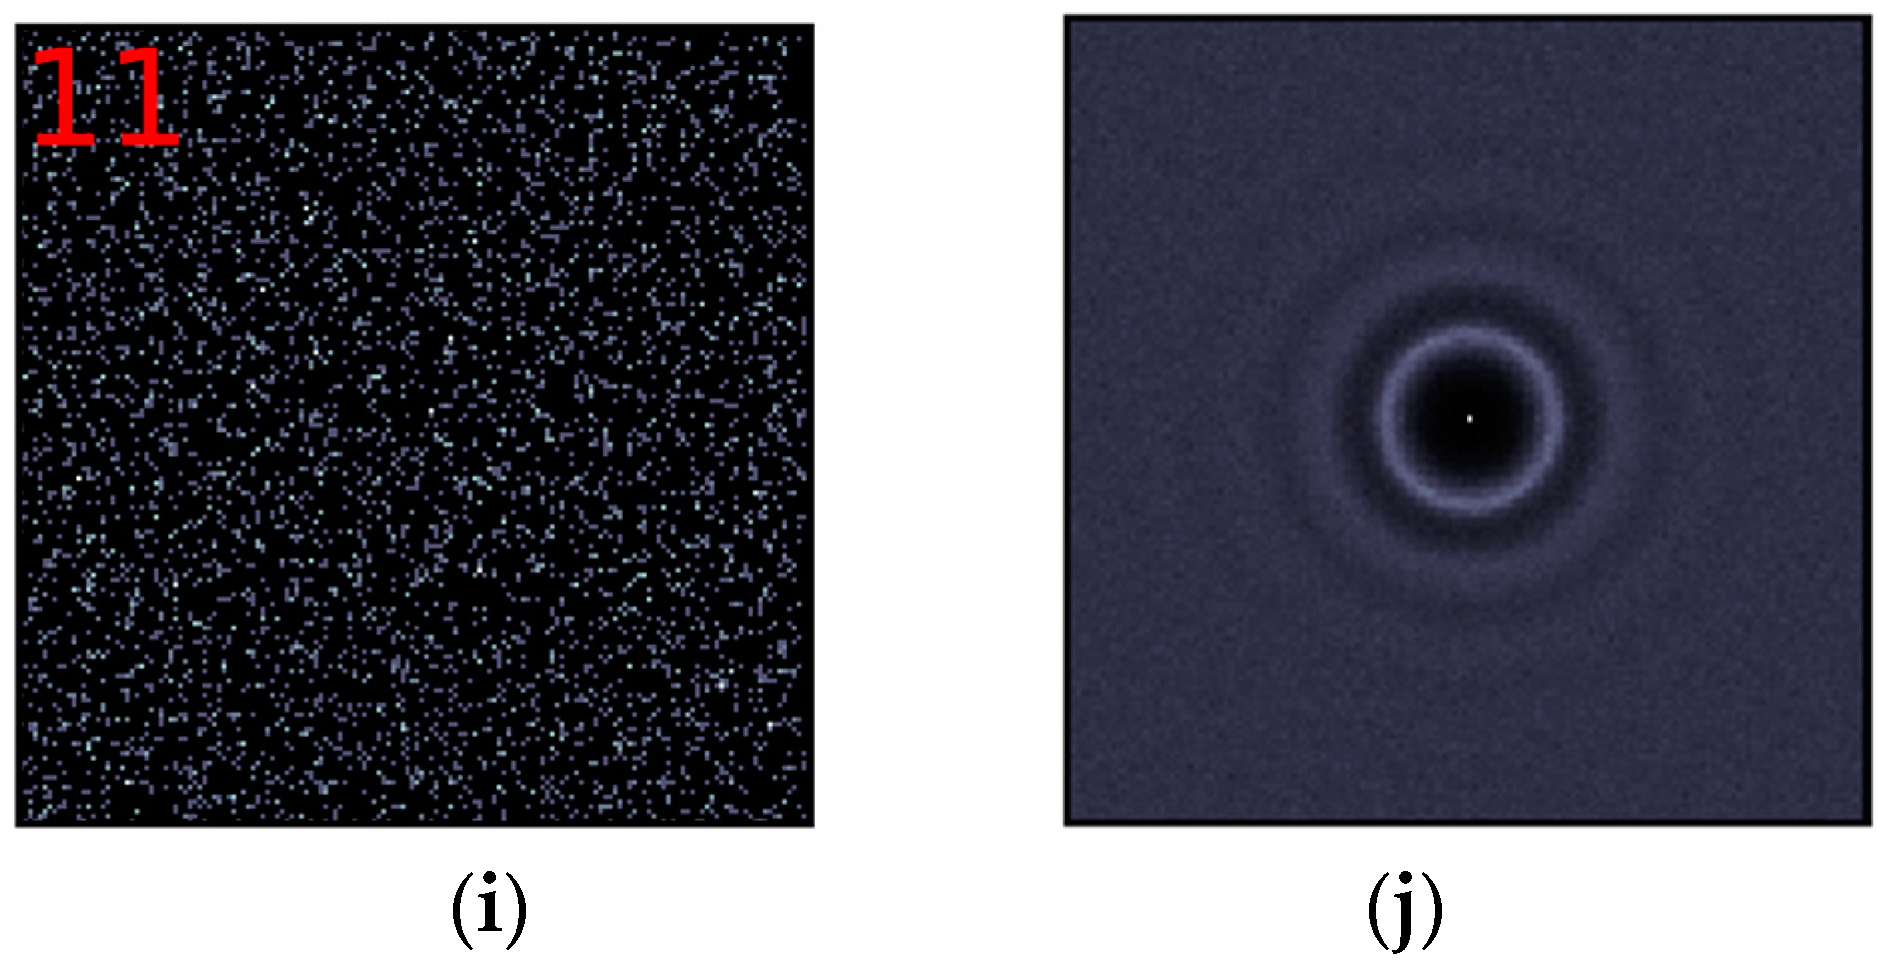
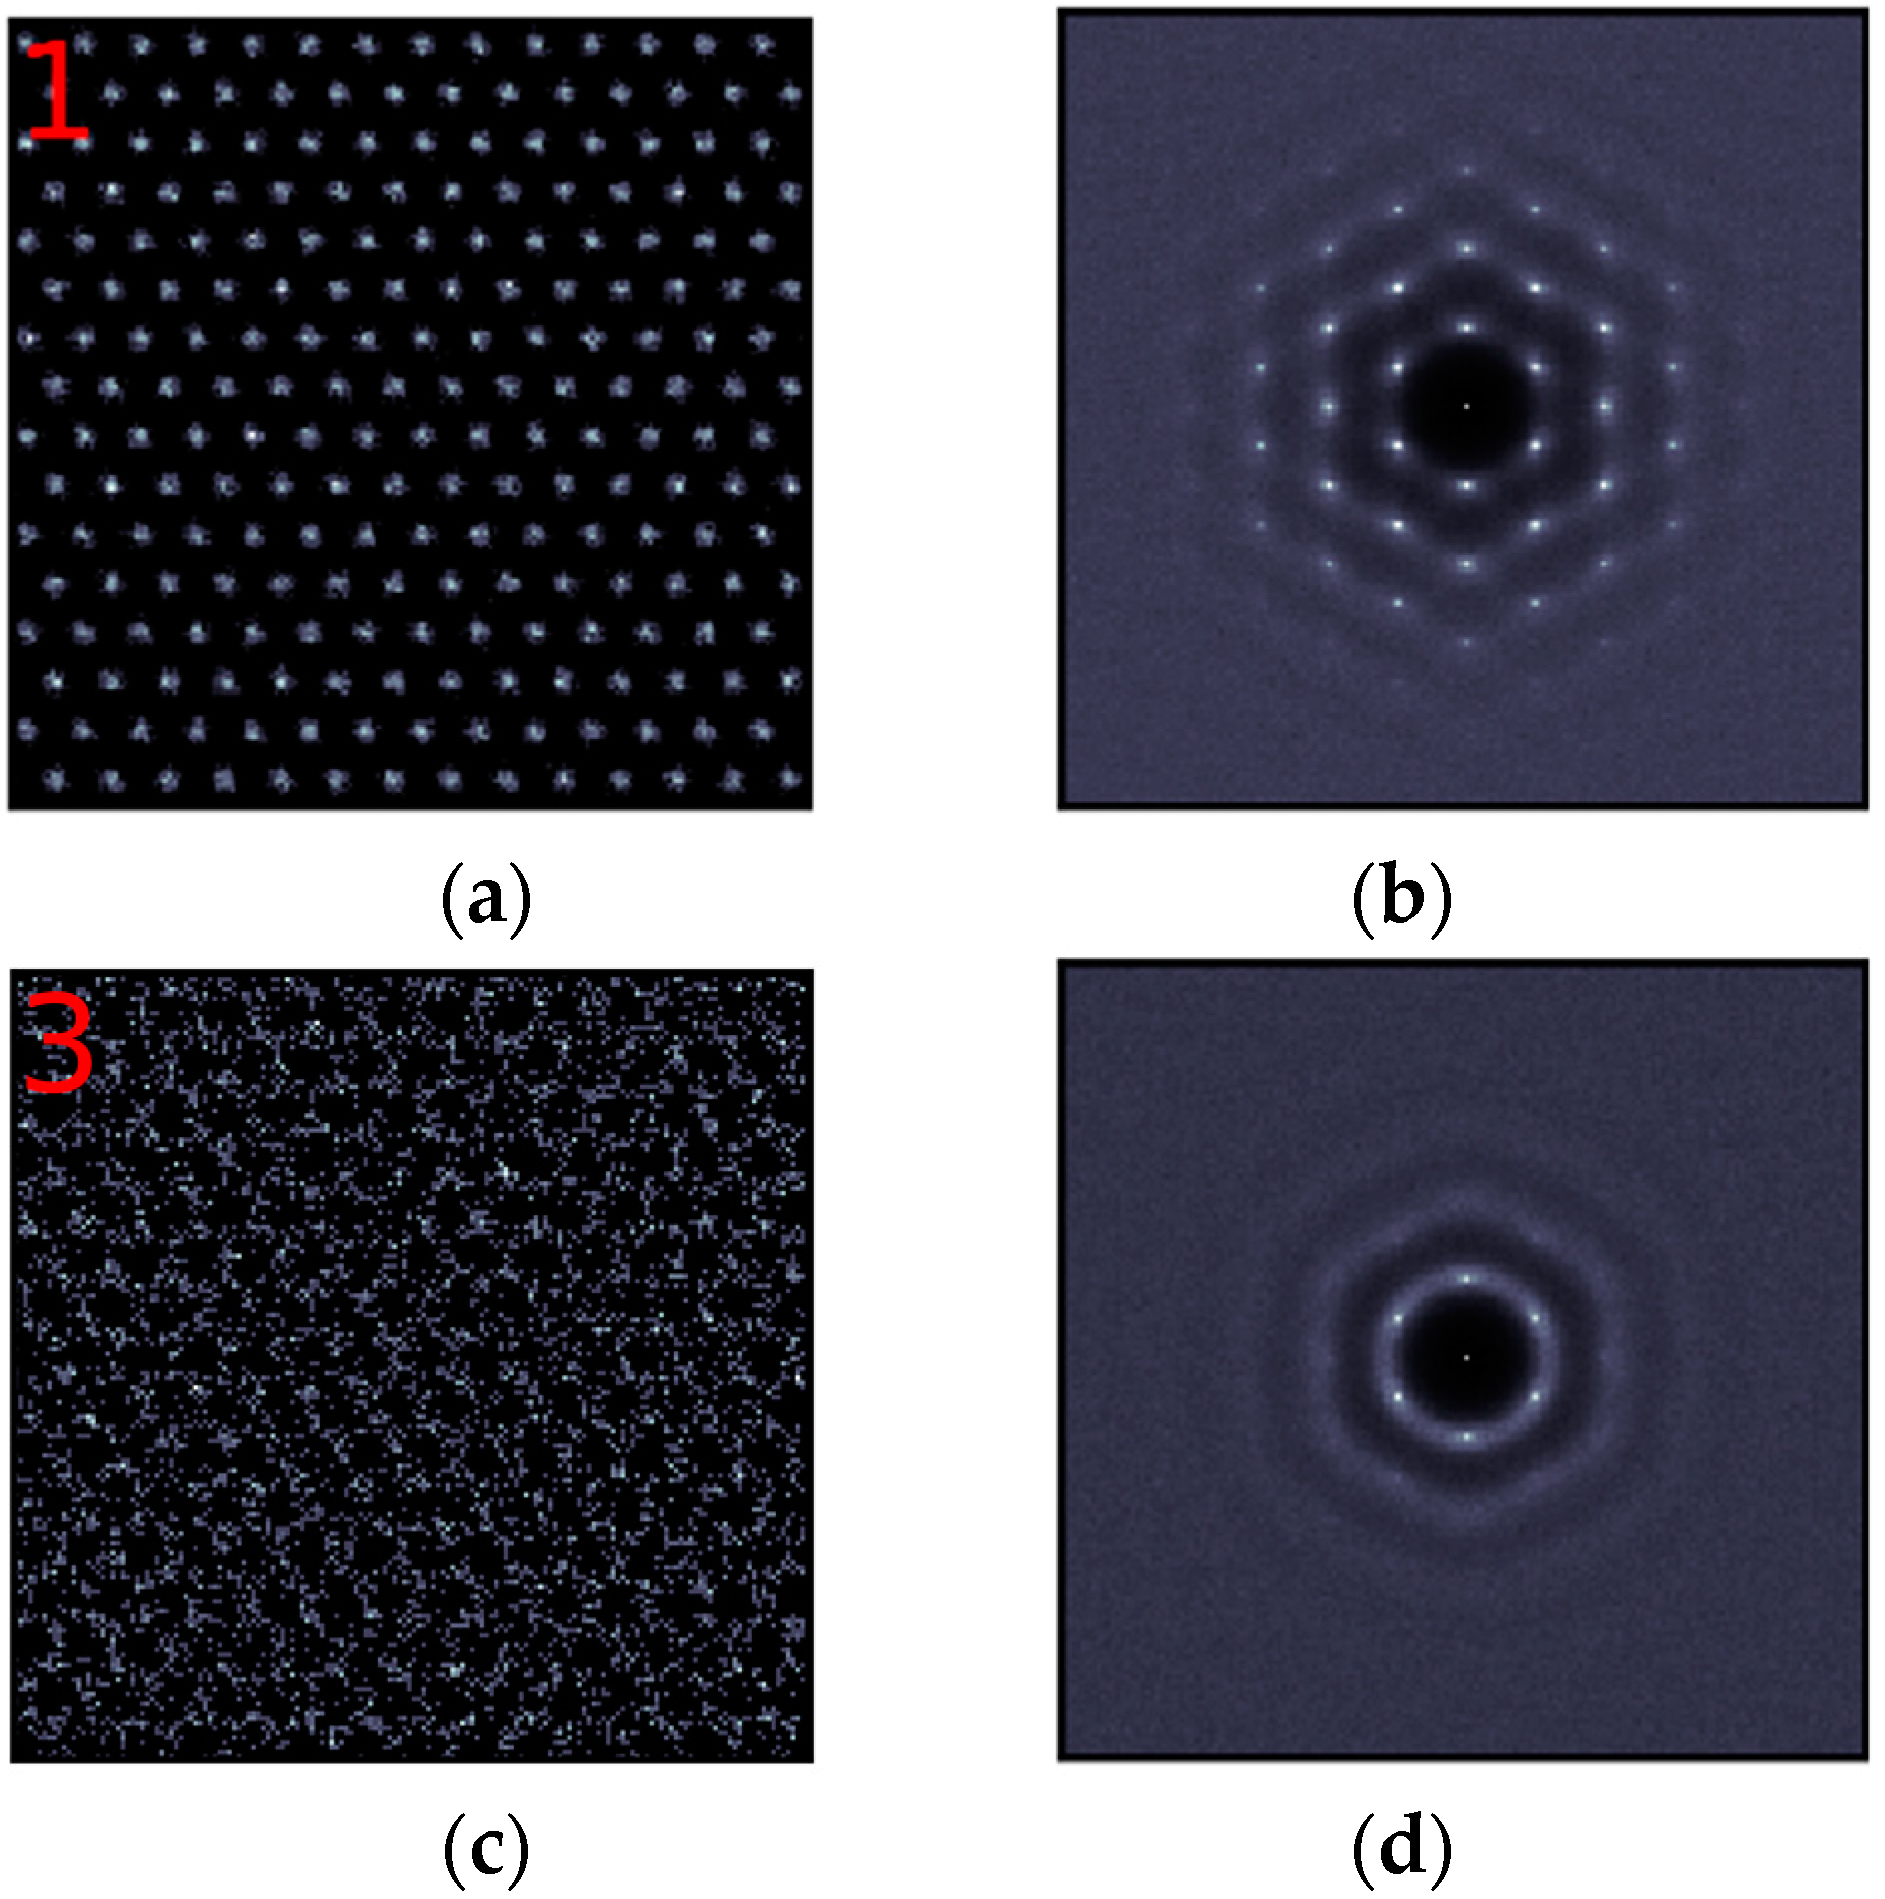
Figure 2, Figure 3 and Figure 4 give the results of 2-D density maps and 2-D structure factors for selected layers at the three interfaces.
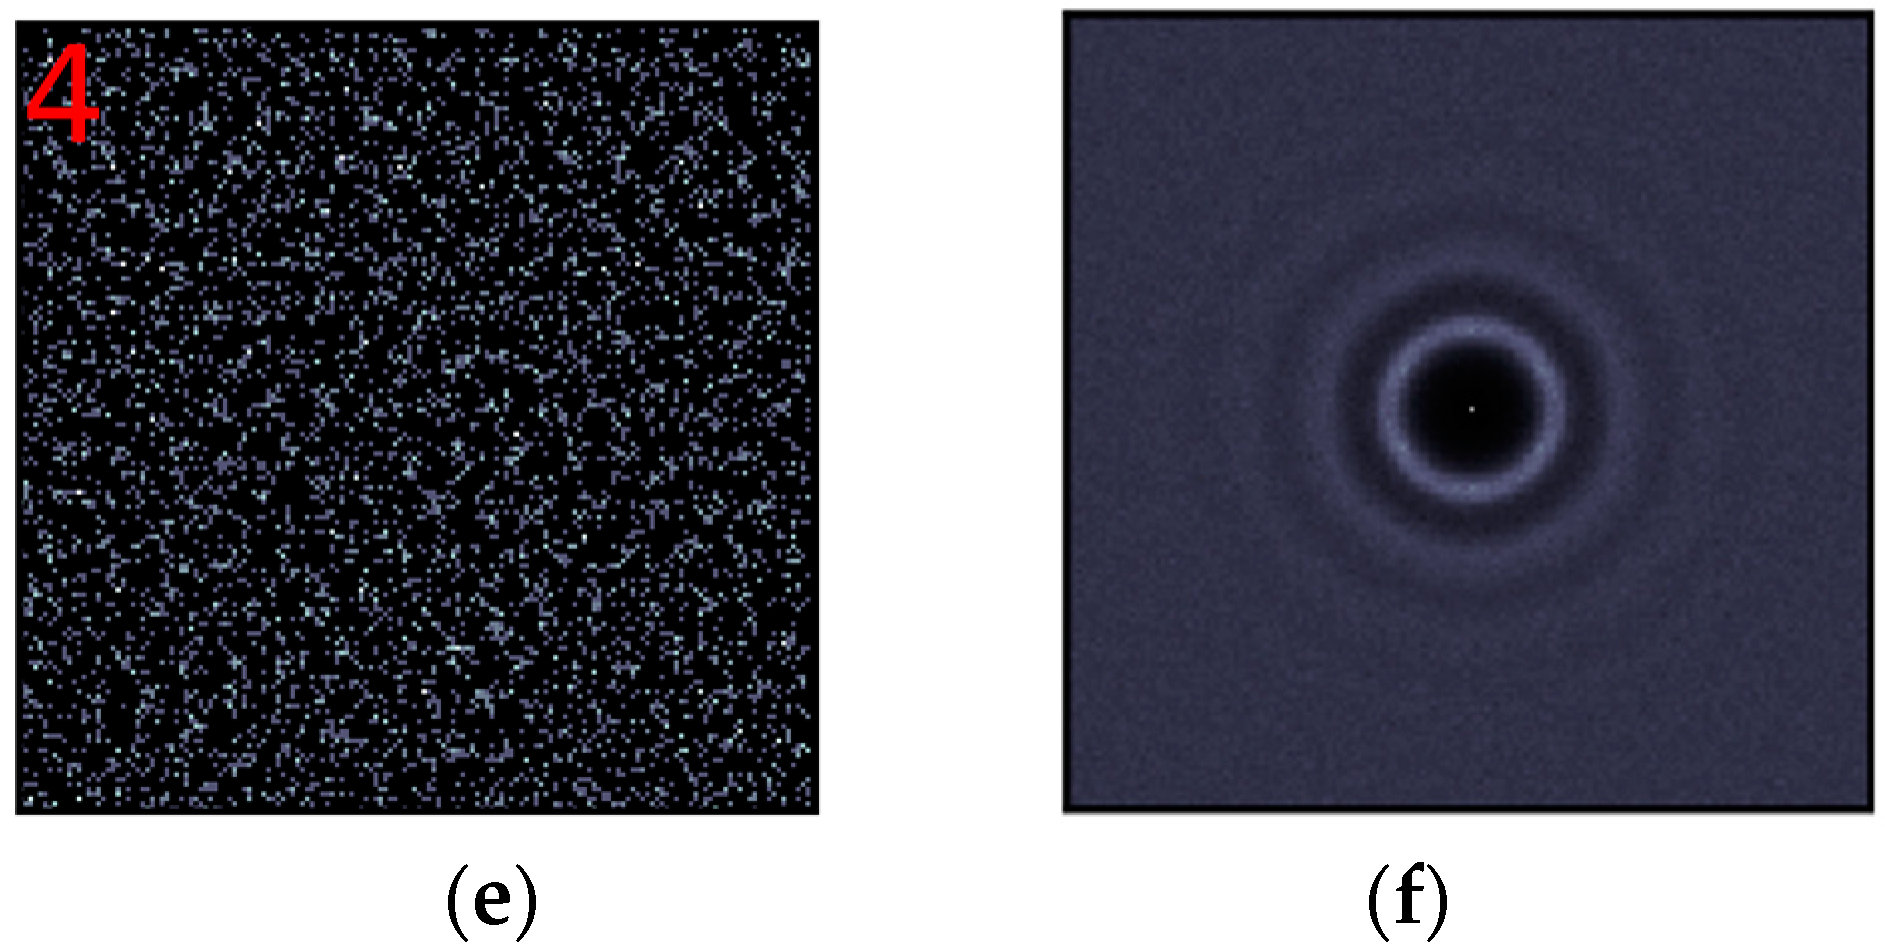
Seen from Figure 2, it is clear that layer 1 preserves the crystalline structure very well, with both the density map and the structure factor plot showing regular pattern. Layer 1 has a higher minimum density at the left foot than layers in the crystal, which means some atoms can hop between layer 1 and layer 2. The well preserved crystalline structure in layer 1 shows that the influence of the hoping of atoms is negligible in this layer. The degree of ordering decreases gradually from layer 1 to layer 3, with some regular spots far from the center of the structure factor map fading slowly, but no other features can be seen in the structure factor maps. Therefore, the corresponding figures are not shown in Figure 2 for clarity. Obvious diffuse rings begin to appear in layer 4, as shown in Figure 2d, indicating that some pronounced disordered local areas can be found in this layer, which corresponds to the blurred areas in Figure 2c. Several regularly distributed spots still exist in Figure 2f, but it has been dominated by diffuse rings representing the liquid structure, indicating that layer 6 is quite liquid-like. When it goes to layer 7, all spots disappear, showing that no in-plane ordering can be found in this layer. Therefore, the in-plane ordering only exists in the first 6 layers at the (100) interface.
The change of the in-plane ordering at the (110) interface is different from that at the (100) interface. The crystalline structure persists very well, even in layer 3 at the (110) interface, while spots far from the center of the structure factor plot of layer 3 at the (100) interface have already faded away. In addition, obvious diffusion rings do not appear until layer 6 at the (110) interface. At the (110) interface, another phenomenon worth noticing is the periodicity along the x direction (the [-110] direction). It lasts much longer. Figure 3e clearly shows this phenomenon. Although it is already in layer 9, periodicity along the x direction is still very obvious. Two weak spots corresponding to this periodicity can also be seen in Figure 3h. We first suspected that this phenomenon might be due to mistakes in our simulation, but we soon found that similar feature can be seen in the paper published by Qi et al. [16] (Figure 7i in the reference) and in another one published by Men et al. [31] (Figure 4d,e in the reference), so we believe that it is an intrinsic feature at the face-centered cubic (FCC) (110) solid-liquid interface. Figure 3j only exhibits diffusion rings, indicating that the ordering along the x direction has disappeared in layer 11. So, the in-plane ordering lasts for 10 layers at the (110) interface.
Contrary to the (110) interface where the in-plane ordering exists in 10 out-of-plane layers, in-plane ordering at the (111) interface only appears in the first 3 layers. As shown in Figure 4, layer 1 at the (111) interface has already begun to show slight disordering, and the in-plane ordering totally disappears in layer 4.
3.2. Diffusion Constant Profiles
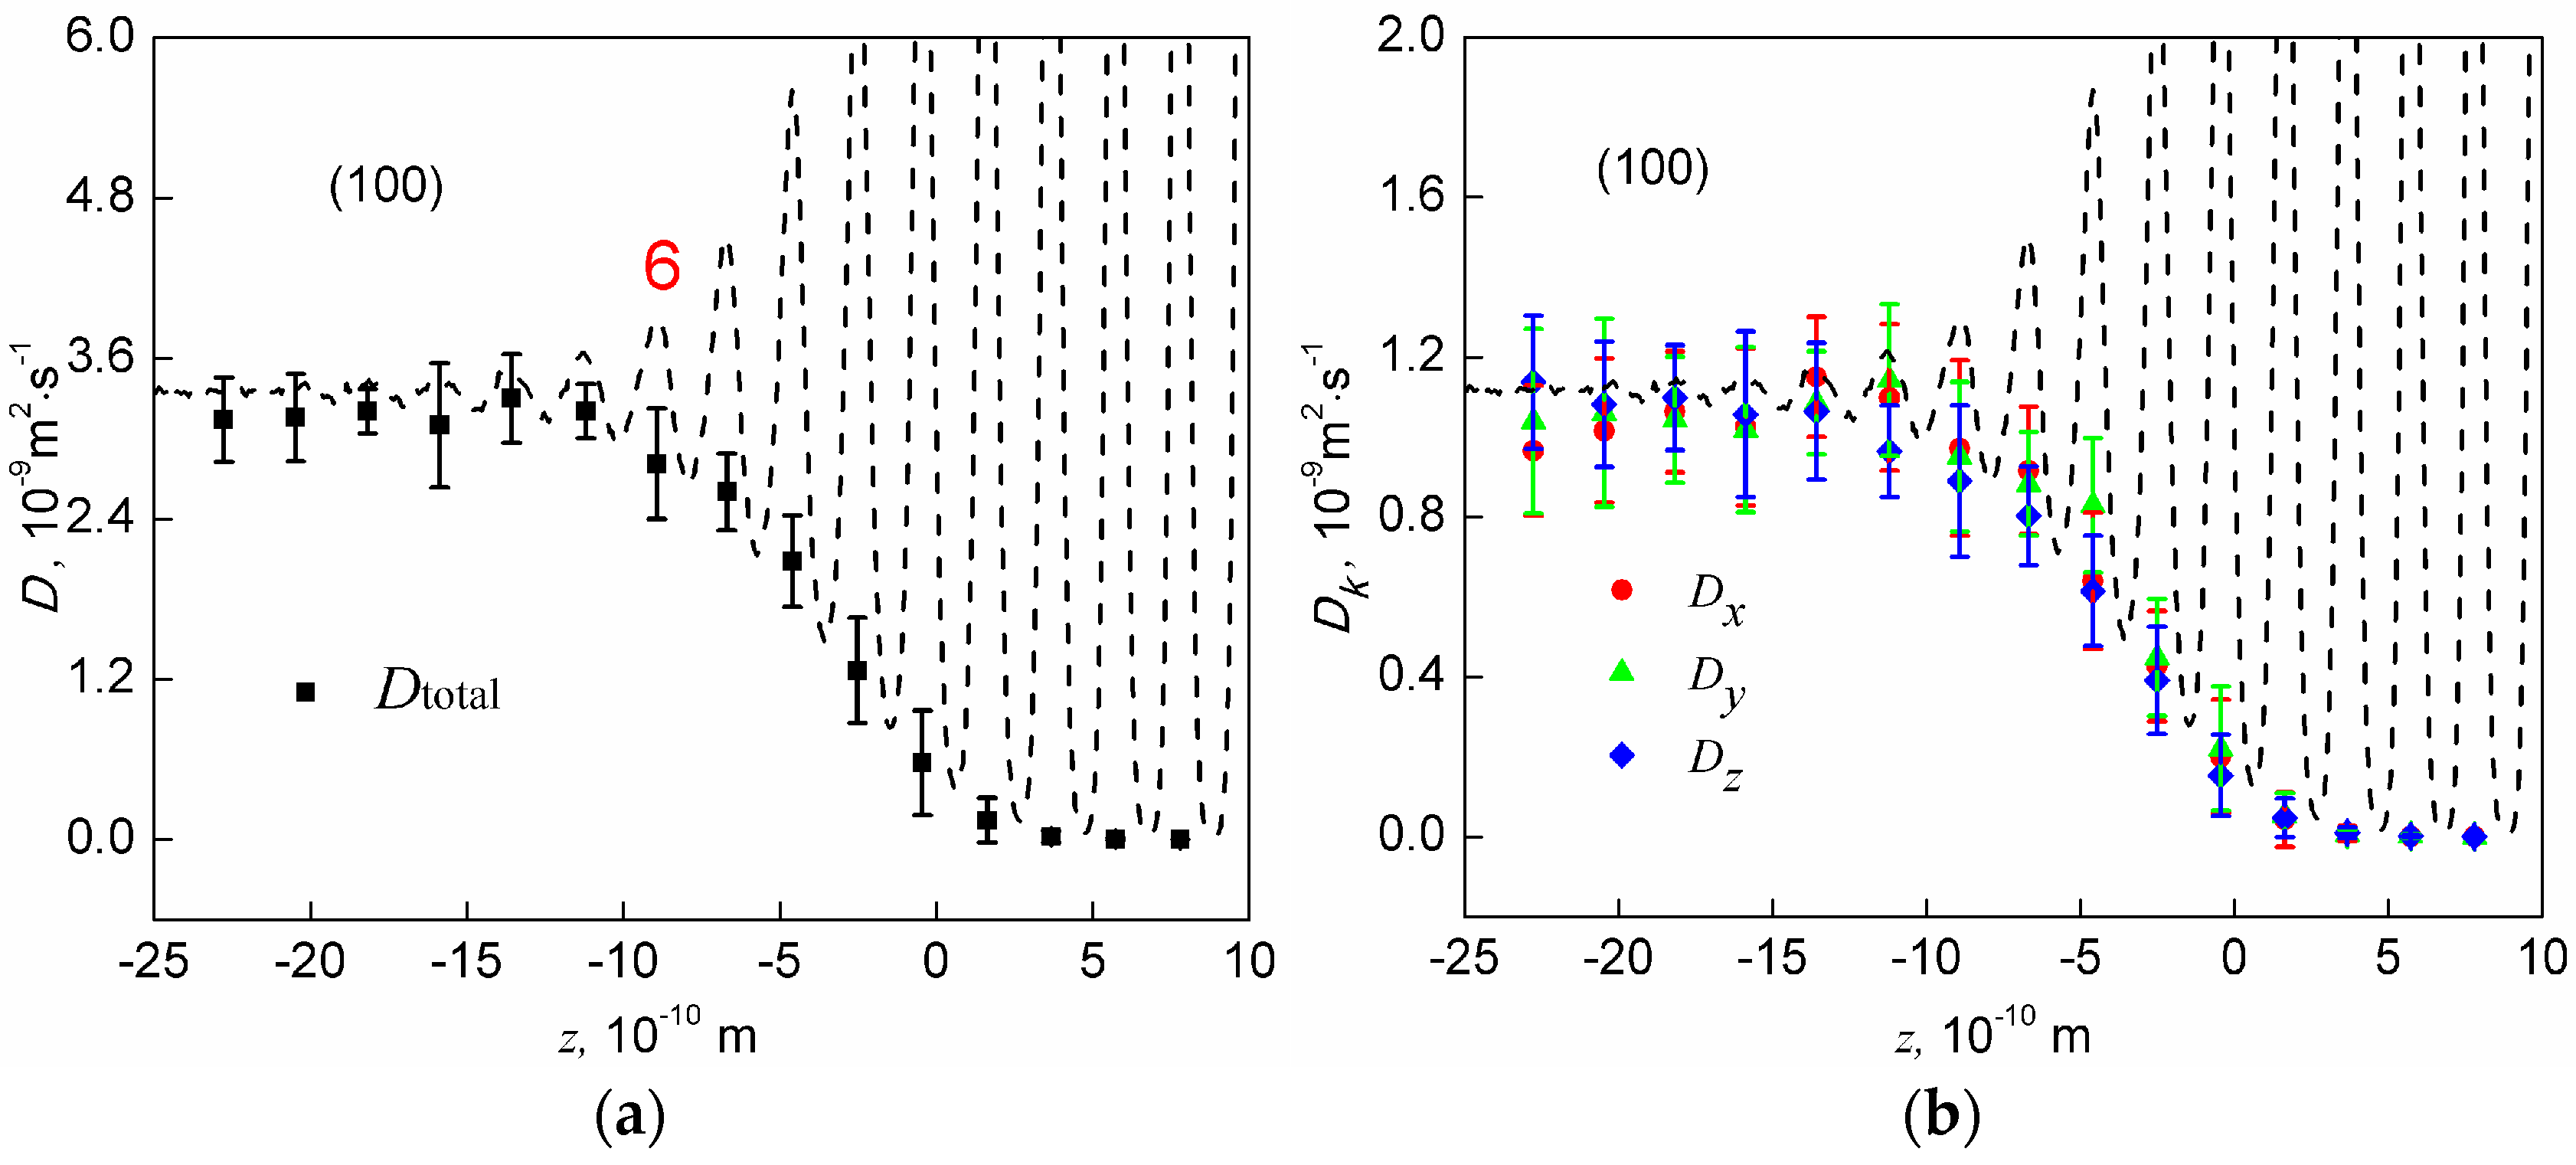
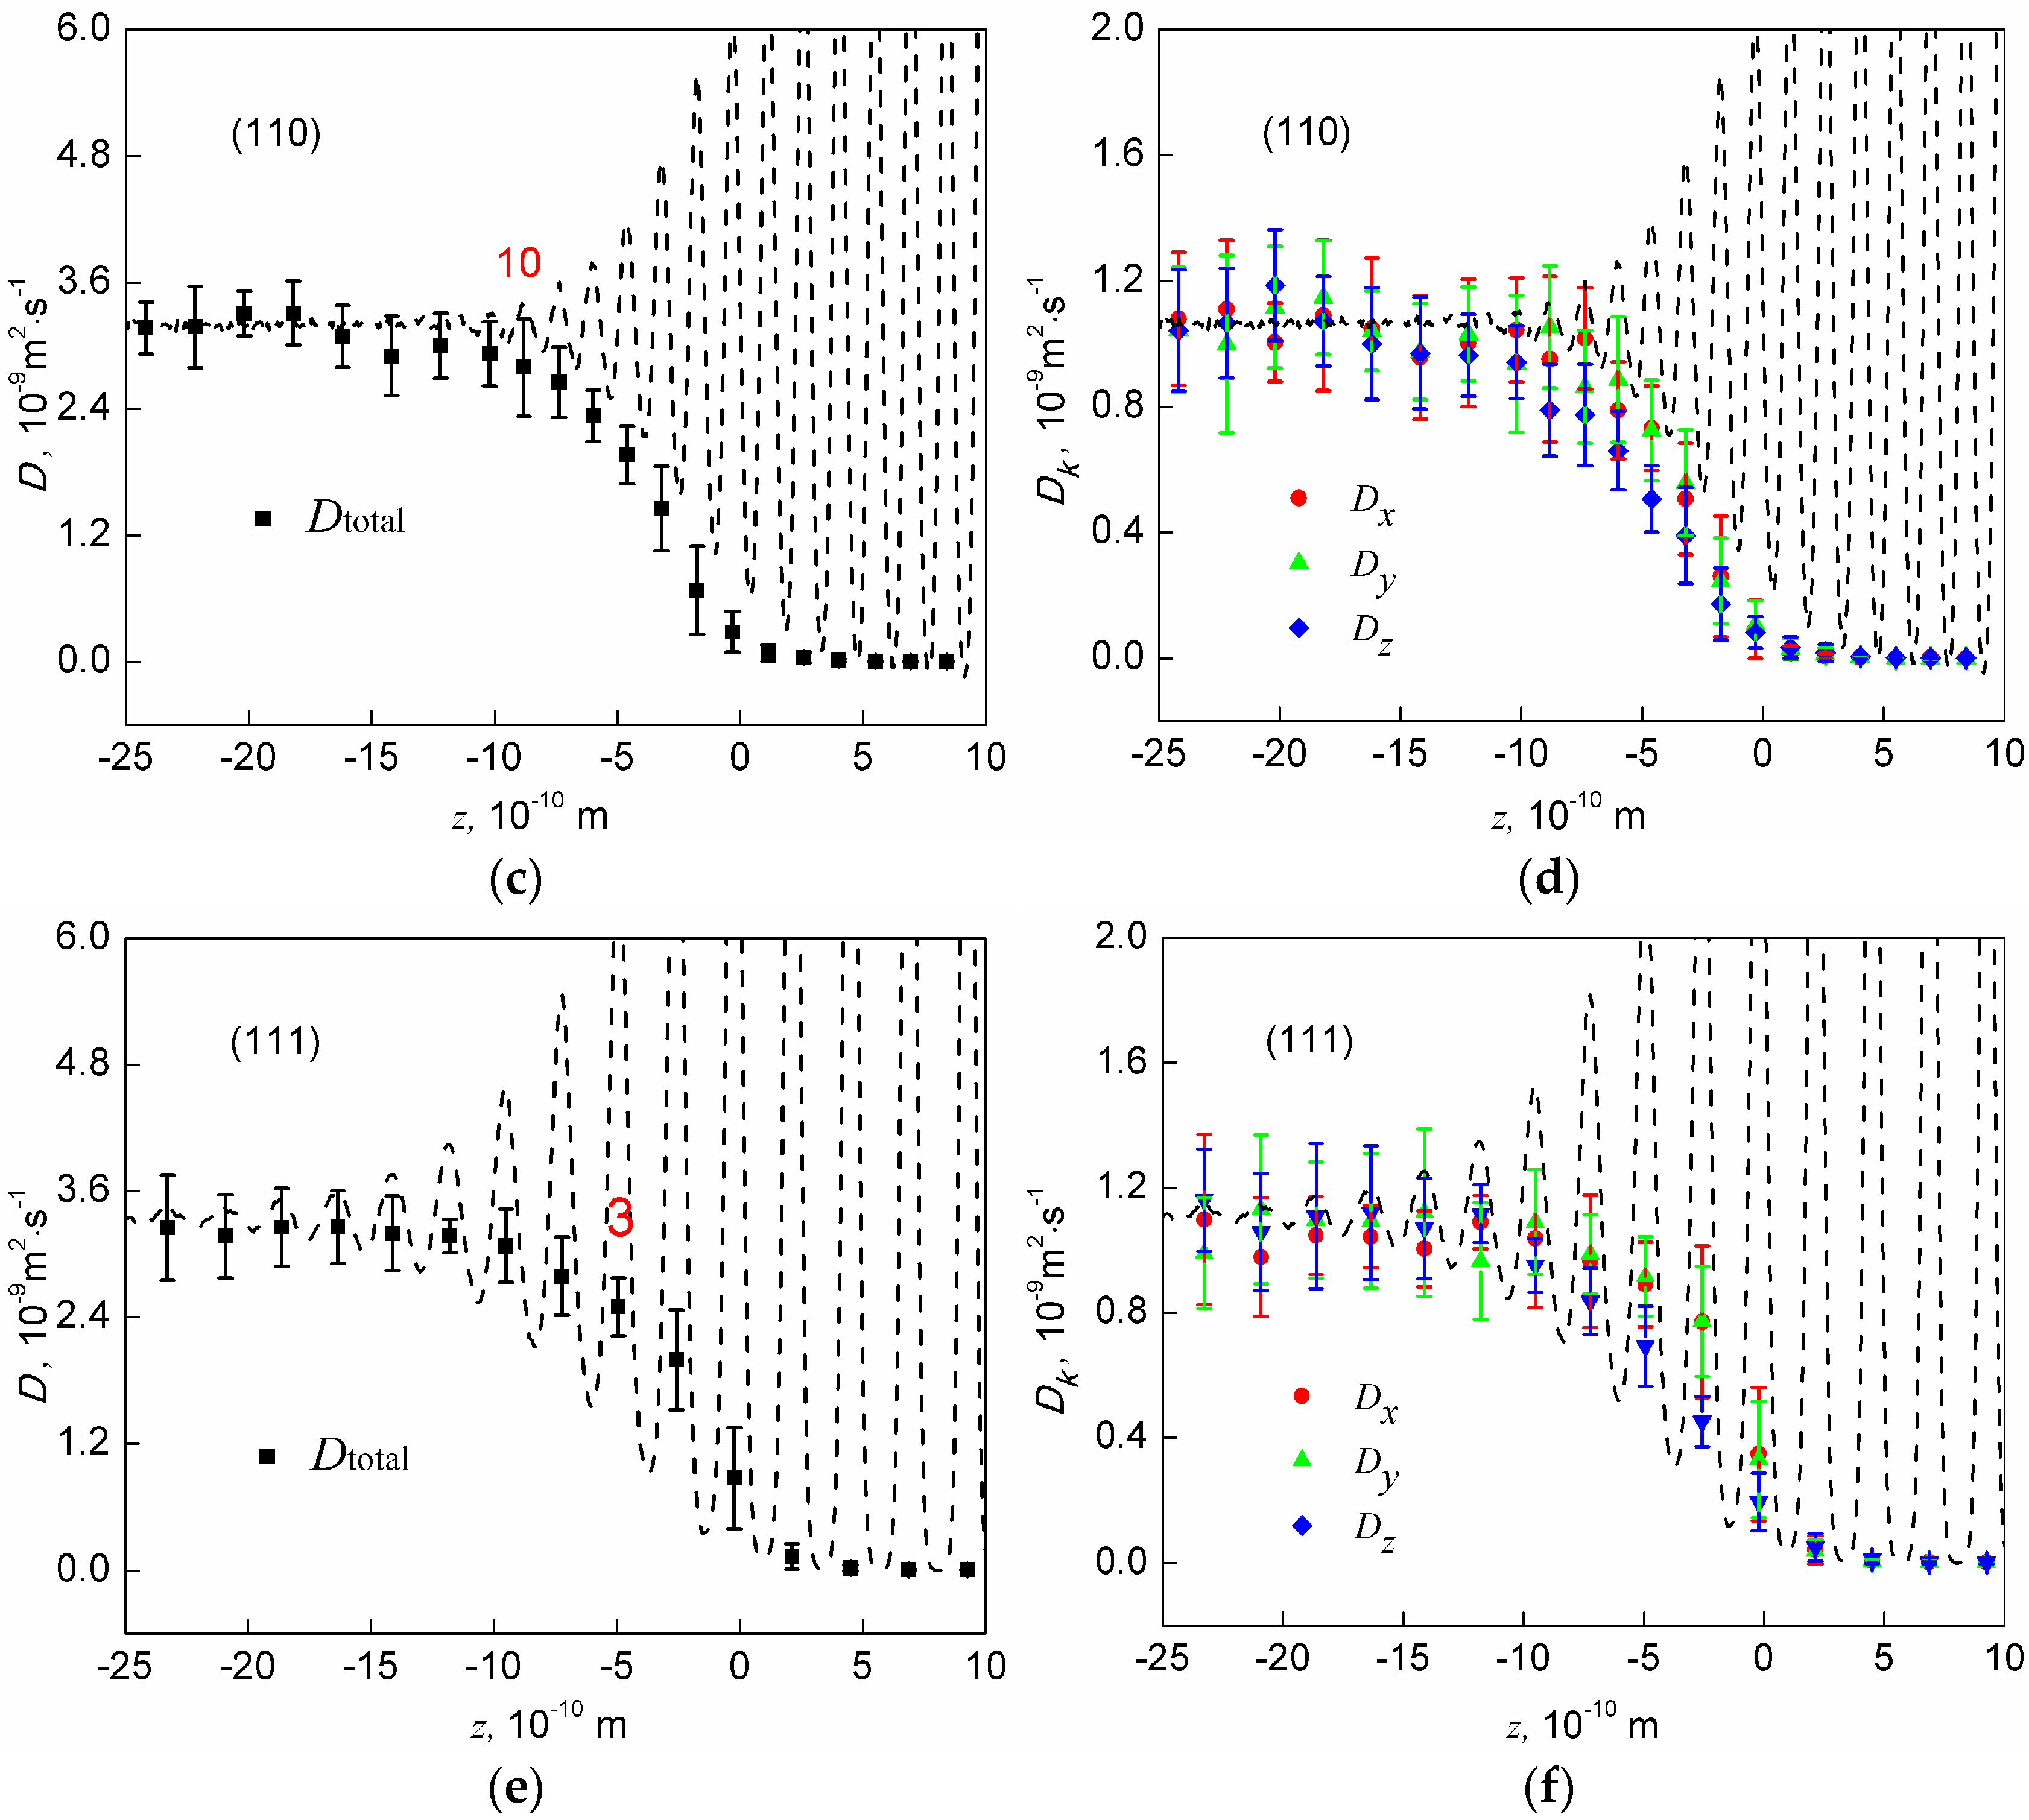
The dynamic property of the interface is characterized by total diffusion constant profiles and profiles for the three components of the diffusion constant, which are shown in Figure 5. Total diffusion constants and the three components all increase monotonically from the bulk solid to the bulk liquid. In addition, total diffusion constants finally converge to the same value regardless of interface orientation, while the three diffusivity components finally converge to the same value regardless of interface orientation and Cartesian direction. This is a sign that the parameters we used to calculate diffusion constants are appropriate. Moreover, the total diffusion constant appears to be significantly influenced by the in-plane ordering. The last out-of-plane layers having in-plane ordering are labelled with their numbers in Figure 5. One sees that once the in-plane ordering disappears, the total diffusion constant is already equal to that in the bulk liquid at the (100) and (110) interfaces, indicating that the remaining out-of-plane layers are too weak to reduce the motion of atoms in any directions at these two interfaces. At the (111) interface, one more layer is needed for the total diffusion constant to increase to its value in the bulk liquid, which is mainly due to the pronounced layer 4.
The three components of the diffusion constant, , and , have often been compared in published papers [15,16,22,33], and all of these studies argue that the they are anisotropic, with and . However, our calculation shows that such a conclusion does not stand up at the homogeneous Al-Al solid-liquid interfaces. As shown in Figure 5, although the average values support this argument, the computational error is relatively too large to distinguish such a small difference. Therefore, we conclude that the three components of the diffusion constant are isotropic at the Al-Al interfaces.
4. Discussion
Our calculation clearly shows that in-plane ordering exists in the first 6, 10, and 3 out-of-plane layers for the (100), (110), and (111) interfaces, respectively. It means that the (111) interface is the smoothest interface, while the (110) interface is the roughest one, which agrees with the finding of Men et al. [31] who also studied the three interfaces with an EAM potential. However, more layers are found to have in-plane ordering in this study. Men et al. used in-plane order parameters to define interfacial layers; by utilizing the density profiles given by them, we can relabel the layers in reference [31]. One can see that for the (100) and (111) interface, layers were labelled with the same numbers as this study did, while for the (110) interface, the first layer in reference [31] corresponds to the layer 3 in this work. According to reference [31], the in-plane ordering exists in the first 5, 7, and 3 layers at the (100), (110), and (111) interface, respectively. Jesson et al. [33] also observed 6 layers (obtained from the density profile and in-plane structure factors in the reference) with in-plane ordering at the (100) interface using ab initio molecular dynamics simulation, which is accordance with our result for the (100) interface. Davidchack et al. [14] have demonstrated that disordered and ordered regions within the interfacial layers are highly mobile. Therefore, the shorter the simulation time lasts, the more layers with in-plane ordering should be observed. Men et al. monitored the in-plane ordering for much shorter time (1.0 × 10⁻¹¹ s) than we did (2.0 × 10⁻¹⁰ s ), but they observed fewer layers with in-plane ordering. The reason for their underestimation is highly due to the method they used for characterization of the in-plane ordering. The time-averaged atomic positions they used are basically 2-D density maps used in the work. Although 2-D density maps provide vivid description of atomic arrangements at the interface, it falls short of revealing the weak short-range order in layers closer to the liquid.
Since it is impossible to characterize homogeneous Al-Al solid-liquid interfaces experimentally, they are compared with α-Al2O3/Al interfaces that have been investigated through experiments. Lee et al. [8] studied two α-Al2O3/Al interfaces, (0001) and (-110-2), using high resolution transmission electron microscopy (HRTEM). They found that the first few liquid layers at the (-110-2) interface exhibit in-plane ordering that is similar to the structure of Al2O; however, liquid layers at the (0001) interface show no in-plane ordering. Kaplan et al. [7] also studied the α-Al2O3(0001)/Al interface, showing that the first three liquid layers have some degree of in-plane ordering, but they did not provide any detail information about it. All of the experimental results are quite different from the results obtained in this study, indicating that the structure of liquid Al at the interface is greatly influenced by substrates. So, interfaces between liquid Al and other substrates, and the influence of different solute atoms, should be studied in the future. Besides, the periodicity along the [-110] direction persists in layers far from the Al (110) interface. The reason behind it should also be further studied.
The diffusion constant at the (100) interface has been examined by Jesson et al. [33]. Their calculation shows that the diffusivity components in the bulk liquid are about 3.50 × 10⁻⁹ m2⋅s−1, much larger than our results, which are about 1.12 × 10⁻⁹ m2⋅s−1. Jesson et al. [33] also argued that the diffusivity components are anisotropic, with . However, it is not a convincing argument. Seen from the diffusion constant profiles provided by them, the difference between and is very small, and big fluctuations exist. In addition, they did not show error bars. Our calculations show that the , and are isotropic within the error range. To our knowledge, the anisotropy of diffusivity components has only been demonstrated in one paper [22] so far, which is about heterogeneous Al-Pb solid-liquid interfaces. The relative sizes of the diffusivity components might be an important factor influencing crystal growth. With and greater than , atoms jumping into an interfacial layer from the liquid will be more likely to stay in that layer because motions parallel to the interface are easier. This helps to increase the in-plane ordering in the layer, which will promote the growth of the crystal. On the contrary, if is about the same magnitude as and , atoms hop more frequently between layers. Therefore, complete crystalline layers are more difficult to form and the crystal growth is reduced. To see whether this is a reasonable hypothesis, more studies about diffusion constants at interfaces between liquid Al and other substrates are needed.
5. Conclusions
In this study, the homogeneous (100), (110), and (111) interfaces between solid and liquid Al have been examined as an extension of our previous work. The in-plane ordering was investigated by calculating 2-D density maps and 2-D structure factors. This study shows that the in-plane ordering exists in the first 6, 10, and 3 out-of-plane layers for the (100), (110), and (111) interfaces, respectively, showing a strong dependence on substrate orientation. The diffusion constant was found to be greatly influenced by the in-plane ordering at the homogeneous interfaces. Once the in-plane ordering disappears, the remaining out-of-plane layers show little influence on motions of atoms due to their weak magnitudes. Within computational error, no anisotropy was found among the three components of the diffusion constant, which is different from that reported at heterogeneous Al-Pb solid-liquid interfaces. Using the more versatile COMB3 potentials, interfaces between liquid Al and many other substrates can be modelled. The information about the homogeneous Al-Al interfaces will serve as an important reference and be compared with those of other interfaces. The comparisons will help to reveal the influence of different factors on the adjacent liquid, which is hopefully to provide theoretical guidance for the design of grain refiners.
Author Contributions
Conceptualization, R.Y. and H.D.; Methodology, R.Y. and S.M.; Software, R.Y.; Validation, R.Y., S.M., T.J., and H.D.; Formal Analysis, R.Y.; Investigation, R.Y. and S.M.; Resources, R.Y.; Data Curation, R.Y. and S.M.; Writing-Original Draft Preparation, R.Y.; Writing-Review & Editing, S.M., T.J., and H.D.; Visualization, R.Y.; Supervision, T.J. and H.D.; Project Administration, H.D.; Funding Acquisition, T.J. and H.D.
Funding
This research was funded by the National Natural Science Foundation of China, grant number [51320105003] and [51674153], and the Chinese Scholarship Council (CSC).
Acknowledgments
The authors acknowledge the National Supercomputer Centre in Tianjing for providing access to TianHe-1(A) where the calculations were performed.
Conflicts of Interest
The authors declare no conflict of interest.
References
- Greer, A.L. Application of heterogeneous nucleation in grain-refining of metals. J. Chem. Phys. 2016, 145, 211704. [Google Scholar] [CrossRef] [PubMed]
- Ma, S.; Yan, R.; Jing, T.; Dong, H. Substrate-induced liquid layering: A new insight into the heterogeneous nucleation of liquid metals. Metals 2018, 8, 521. [Google Scholar] [CrossRef]
- Vlieg, E. The role of surface and interface structure in crystal growth. Prog. Cryst. Growth Charact. Mater. 2016, 62, 203–211. [Google Scholar] [CrossRef]
- Kaplan, W.D.; Kauffmann, Y. Structural order in liquids induced by interfaces with crystals. Ann. Rev. Mater. Res. 2006, 36, 1–48. [Google Scholar] [CrossRef]
- Ghidelli, M.; Gravier, S.; Blandin, J.J.; Pardoen, T.; Raskin, J.P.; Mompiou, F. Compositional-induced structural change in ZrxNi100−x thin film metallic glasses. J. Alloys Compd. 2014, 615, 348–351. [Google Scholar] [CrossRef]
- Hirata, A.; Guan, P.; Fujita, T.; Hirotsu, Y.; Inoue, A.; Yavari, A.R.; Sakurai, T.; Chen, M. Direct observation of local atomic order in a metallic glass. Nat. Mater. 2011, 10, 28–33. [Google Scholar] [CrossRef] [PubMed]
- Kauffmann, Y.; Oh, S.H.; Koch, C.T.; Hashibon, A.; Scheu, C.; Rühle, M.; Kaplan, W.D. Quantitative analysis of layering and in-plane structural ordering at an alumina–aluminum solid–liquid interface. Acta Mater. 2011, 59, 4378–4386. [Google Scholar] [CrossRef]
- Lee, S.B.; Kim, Y.M. Direct observation of in-plane ordering in the liquid at a liquid Al/α-Al2O3(-110-2) interface. Acta Mater. 2011, 59, 1383–1388. [Google Scholar] [CrossRef]
- Oh, S.H.; Kauffmann, Y.; Scheu, C.; Kaplan, W.D.; Ruhle, M. Ordered liquid aluminum at the interface with sapphire. Science 2005, 310, 661–663. [Google Scholar] [CrossRef] [PubMed]
- Schulli, T.U.; Daudin, R.; Renaud, G.; Vaysset, A.; Geaymond, O.; Pasturel, A. Substrate-enhanced supercooling in ausi eutectic droplets. Nature 2010, 464, 1174–1177. [Google Scholar] [CrossRef] [PubMed]
- Gandman, M.; Kauffmann, Y.; Koch, C.T.; Kaplan, W.D. Direct quantification of ordering at a solid-liquid interface using aberration corrected transmission electron microscopy. Phys. Rev. Lett. 2013, 110, 086106. [Google Scholar] [CrossRef] [PubMed]
- Greer, A.L. Liquid metals: Supercool order. Nat. Mater. 2006, 5, 13–14. [Google Scholar] [CrossRef]
- Davidchack, R.L.; Laird, B.B. Simulation of the binary hard-sphere crystal/melt interface. Phys. Rev. E 1996, 54, 5905–5908. [Google Scholar] [CrossRef]
- Davidchack, R.L.; Laird, B.B. Simulation of the hard-sphere crystal-melt interface. J. Chem. Phys. 1998, 108, 9452–9462. [Google Scholar] [CrossRef]
- Yang, G.Q.; Li, J.F.; Shi, Q.W.; Kong, L.T. Structural and dynamical properties of heterogeneous solid–liquid Ta–Cu interfaces: A molecular dynamics study. Comput. Mater. Sci. 2014, 86, 64–72. [Google Scholar] [CrossRef]
- Qi, C.; Li, J.F.; Xu, B.; Kong, L.T.; Zhao, S. Atomistic characterization of solid-liquid interfaces in the Cu-Ni binary alloy system. Comput. Mater. Sci. 2016, 125, 72–81. [Google Scholar] [CrossRef]
- Hashibon, A.; Adler, J.; Finnis, M.W.; Kaplan, W.D. Ordering at solid-liquid interfaces between dissimilar materials. Interface Sci. 2001, 9, 175–181. [Google Scholar] [CrossRef]
- Men, H.; Fan, Z. Atomic ordering in liquid aluminium induced by substrates with misfits. Comput. Mater. Sci. 2014, 85, 1–7. [Google Scholar] [CrossRef]
- Cape, J.N. Molecular dynamics study of a dense fluid at a hard wall. J. Chem. Soc. Faraday Trans. 2 1982, 78, 317–326. [Google Scholar] [CrossRef]
- Dijkstra, M. Capillary freezing or complete wetting of hard spheres in a planar hard slit? Phys. Rev. Lett. 2004, 93, 108303. [Google Scholar] [CrossRef] [PubMed]
- Davidchack, R.L.; Laird, B.B.; Roth, R. Hard spheres at a planar hard wall: Simulations and density functional theory. Condens. Matter Phys. 2016, 19. [Google Scholar] [CrossRef]
- Yang, Y.; Olmsted, D.L.; Asta, M.; Laird, B.B. Atomistic characterization of the chemically heterogeneous Al–Pb solid–liquid interface. Acta Mater. 2012, 60, 4960–4971. [Google Scholar] [CrossRef]
- Guerdane, M.; Teichler, H.; Nestler, B. Local atomic order in the melt and solid-liquid interface effect on the growth kinetics in a metallic alloy model. Phys. Rev. Lett. 2013, 110, 086105. [Google Scholar] [CrossRef] [PubMed]
- Wearing, D.; Horsfield, A.P.; Xu, W.; Lee, P.D. Which wets TiB2 inoculant particles: Al or Al3Ti? J. Alloys Compd. 2016, 664, 460–468. [Google Scholar] [CrossRef]
- Palafox-Hernandez, J.P.; Laird, B.B.; Asta, M. Atomistic characterization of the Cu-Pb solid-liquid interface. Acta Mater. 2011, 59, 3137–3144. [Google Scholar] [CrossRef]
- Gan, X.; Xiao, S.; Deng, H.; Li, X.; Hu, W. Orientation dependences of the Fe-Li solid-liquid interface properties: Atomistic simulations. J. Alloys Compd. 2016, 687, 875–884. [Google Scholar] [CrossRef]
- Landa, A.; Wynblatt, P.; Johnson, E.; Dahmen, U. Computer simulation of Pb/Al interfaces. Acta Mater. 2000, 48, 2557–2563. [Google Scholar] [CrossRef]
- Geysermans, P.; Gorse, D.; Pontikis, V. Molecular dynamics study of the solid-liquid interface. J. Chem. Phys. 2000, 113, 6382–6389. [Google Scholar] [CrossRef]
- Broughton, J.Q.; Gilmer, G.H. Molecular-dynamics of the crystal fluid interface. V. Structure and dynamics of crystal melt systems. J. Chem. Phys. 1986, 84, 5749–5758. [Google Scholar] [CrossRef]
- Laird, B.B.; Haymet, A.D.J. The crystal liquid interface of a body-centered-cubic-forming substance-computer-simulations of the r-6 potential. J. Chem. Phys. 1989, 91, 3638–3646. [Google Scholar] [CrossRef]
- Men, H.; Fan, Z. Molecular dynamic simulation of the atomic structure of aluminum solid–liquid interfaces. Mater. Res. Express 2014, 1, 025705. [Google Scholar] [CrossRef]
- Xiang-Yang, L.; Furio, E.; James, B.A. Aluminium interatomic potential from density functional theory calculations with improved stacking fault energy. Model. Simul. Mater. Sci. 2004, 12, 665. [Google Scholar]
- Jesson, B.J.; Madden, P.A. Structure and dynamics at the aluminum solid–liquid interface: An ab initio simulation. J. Chem. Phys. 2000, 113, 5935–5946. [Google Scholar] [CrossRef]
- Yan, R.; Ma, S.D.; Davidchack, R.L.; Pasquale, N.D.; Jing, T.; Zhai, Q.J.; Dong, H.B. Structural and mechanical properties of homogeneous solid-liquid interface of Al modelled with COMB3 potential. Comput. Mater. Sci. 2018. under processing. [Google Scholar]
- Borgardt, N.I.; Plikat, B.; Schröter, W.; Seibt, M.; Wagner, T. Atomic structure of the interface between silicon (111) and amorphous germanium. Phys. Rev. B 2004, 70. [Google Scholar] [CrossRef]
- Liang, T.; Shan, T.R.; Cheng, Y.T.; Devine, B.D.; Noordhoek, M.; Li, Y.; Lu, Z.; Phillpot, S.R.; Sinnott, S.B. Classical atomistic simulations of surfaces and heterogeneous interfaces with the charge-optimized many body (COMB) potentials. Mat. Sci. Eng. R 2013, 74, 255–279. [Google Scholar] [CrossRef]
- Plimpton, S. Fast parallel algorithms for short-range molecular dynamics. J. Comput. Phys. 1995, 117, 1–19. [Google Scholar] [CrossRef]
- Lammps Molecular Dynamics Simulator. Available online: https://lammps.sandia.gov/ (accessed on 27 July 2018).
- Choudhary, K.; Liang, T.; Chernatynskiy, A.; Lu, Z.; Goyal, A.; Phillpot, S.R.; Sinnott, S.B. Charge optimized many-body potential for aluminum. J. Phys. Condens. Matter 2015, 27, 015003. [Google Scholar] [CrossRef] [PubMed]
Figure 1.
Distributions of atoms along the z direction at the (100), (110), and (111) interfaces.

Figure 2.
In-plane ordering in the (100) interfacial layers. Left panel (a,c,e,g): 2-D density maps. The red numbers correspond to those defined in Figure 1. Right panel (b,d,f,h): 2-D structure factors for the corresponding layers.
Figure 2.
In-plane ordering in the (100) interfacial layers. Left panel (a,c,e,g): 2-D density maps. The red numbers correspond to those defined in Figure 1. Right panel (b,d,f,h): 2-D structure factors for the corresponding layers.

Figure 3.
In-plane ordering in the (110) interfacial layers. Left panel (a,c,e,g,i): 2-D density maps. The red numbers correspond to those defined in Figure 1. Right panel (b,d,f,h,j): 2-D structure factors for the corresponding layers.
Figure 3.
In-plane ordering in the (110) interfacial layers. Left panel (a,c,e,g,i): 2-D density maps. The red numbers correspond to those defined in Figure 1. Right panel (b,d,f,h,j): 2-D structure factors for the corresponding layers.


Figure 4.
In-plane ordering in the (111) interfacial layers. Left panel (a,c,e): 2-D density maps. The red numbers correspond to those defined in Figure 1. Right panel (b,d,f): 2-D structure factors for the corresponding layers.
Figure 4.
In-plane ordering in the (111) interfacial layers. Left panel (a,c,e): 2-D density maps. The red numbers correspond to those defined in Figure 1. Right panel (b,d,f): 2-D structure factors for the corresponding layers.


Figure 5.
The diffusion constant profiles at the (100), (110), and (111) interfaces. Left panel (a,c,e): total diffusion constant profiles. Right panel (b,d,f): profiles for the three components of the diffusion constant. Distribution of atoms (dash lines) are attached to show the positions of the layers. Error bars represent standard deviations.


© 2018 by the authors. Licensee MDPI, Basel, Switzerland. This article is an open access article distributed under the terms and conditions of the Creative Commons Attribution (CC BY) license (http://creativecommons.org/licenses/by/4.0/).
Share and Cite
MDPI and ACS Style
Yan, R.; Ma, S.; Jing, T.; Dong, H. The In-Plane Structure and Dynamic Property of the Homogeneous Al-Al Solid-Liquid Interface. Metals 2018, 8, 602. https://doi.org/10.3390/met8080602
AMA Style
Yan R, Ma S, Jing T, Dong H. The In-Plane Structure and Dynamic Property of the Homogeneous Al-Al Solid-Liquid Interface. Metals. 2018; 8(8):602. https://doi.org/10.3390/met8080602
Chicago/Turabian StyleYan, Rui, Sida Ma, Tao Jing, and Hongbiao Dong. 2018. "The In-Plane Structure and Dynamic Property of the Homogeneous Al-Al Solid-Liquid Interface" Metals 8, no. 8: 602. https://doi.org/10.3390/met8080602
Note that from the first issue of 2016, this journal uses article numbers instead of page numbers. See further details here.