Evolution of Microstructure and Hardness of High Carbon Steel under Different Compressive Strain Rates


Centre for Sustainable Materials Research and Technology (SMaRT@UNSW), School of Materials Science and Engineering, The University of New South Wales (UNSW Sydney), Sydney, NSW 2052, Australia
*
Author to whom correspondence should be addressed.
Metals 2018, 8(8), 580; https://doi.org/10.3390/met8080580
Submission received: 20 June 2018
/
Revised: 23 July 2018
/
Accepted: 24 July 2018
/
Published: 26 July 2018
(This article belongs to the Special Issue Performance of Mechanical Properties of Ultrahigh-Strength Ferrous Steels Related to Strain-Induced Transformation)
Abstract
:Understanding the effect of high strain rate deformation on microstructure and mechanical property of metal is important for addressing its performance as high strength material. Strongly motivated by the vast industrial application potential of metals having excellent hardness, we explored the phase stability, microstructure and mechanical performance of an industrial grade high carbon steel under different compressive strain rates. Although low alloyed high carbon steel is well known for their high hardness, unfortunately, their deformation behavior, performance and microstructural evolution under different compressive strain rates are not well understood. For the first time, our investigation revealed that different strain rates transform the metastable austenite into martensite at different volume, simultaneously activate multiple micromechanisms, i.e., dislocation defects, nanotwining, etc. that enhanced the phase stability and refined the microstructure, which is the key for the observed leap in hardness. The combination of phase transformation, grain refinement, increased dislocation density, formation of nanotwin and strain hardening led to an increase in the hardness of high carbon steel.
1. Introduction
Multiphase high carbon steels with metastable retained austenite (RA) phase are excellent for industrial applications due to their high hardness and abrasion resistance. When the metastable RA in high carbon steel is subjected to harsh environmental conditions; i.e., compression [1,2], abrasion [3], impact [4], etc.; RA transforms to strain induced α′ and ε martensite [5]. The consequence of this transformation is dependent on various parameters, such as morphology [6], chemical composition [1,6,7] and stacking fault energy of austenite [8]. The α′ martensite is found to be nucleated at the intersection of the shear bands, while the ε-martensites are formed due to the overlapping stacking faults [8]. These strain-induced martensites possess more strength and hardness than austenite resulting in increasing the strain hardening ability and strengthening of the material [9,10,11,12].
Ample amount of studies have been proposed to describe the transformation induced plasticity effect in austenitic steel [1,13]. Previous studies have demonstrated that the hardness of steel increases with decreasing grain size, which is known as the Hall-Petch effect [14]. In this effect, the strengthening originates from the fact that grain boundaries block the dislocation movement; hence, the material has more resistance to deformation. The high strain rate induced nanotwin boundaries in the face-centered cubic structure also act as grain boundaries and block the dislocation movements, therefore, enhance the structural strength [15].
Strain rates are considered to have a significant effect on the deformation behavior of steels [16,17]. Superplastic behavior of 0.9% C steel at a low strain rate (up to 10−3/s) was assessed in one study, showed positive strain rate sensitivity of the material. Another study shows the formation of adiabatic shear in 0.77% carbon steel when subjected to high strain rate compression testing conducted at various regimes of temperature [18]. Limited studies have been carrying out on mechanical performance evaluation at various strain rate deformation and its relation with the microstructure of high carbon steel. The hindrance behind conducting mechanical tests on high carbon steel is their exceptional hardness and strength accompanied by machine capabilities, the brittle nature and hence the absence of interest for their mechanical behavior at varying strain rates. However, the study of the mechanical performance of deformation-induced high carbon steels are very important as they are broadly used in a various industrial application where severe impacts and compression are encountered, and high abrasion resistance is required. We carefully chose the compressive stress lower than the fracture stress to avoid fracture or failure of the material. This will help us to demonstrate the mechanical and microstructural behavior of steel at the extreme working condition.
This study focused on dual-phase high carbon steel with martensite and RA phases for the use in extreme operating conditions, i.e., wear, abrasion, impact, compression, etc. Its microstructural behavior at different strains has been investigated by X-ray diffraction, electron backscattering diffraction and transmission electron microscopy. In addition, the strain hardening effect on the overall hardness of the high carbon steel was investigated by nanohardness analyses. Identifying various micromechanisms and their effect on hardness at various strain rates is essential to characterize high carbon steel as a superior material for the different industrial application.
2. Experimental
In this study, duplex martensitic high carbon steel having ~45% of RA with the chemical composition of 1.0%C-0.2%Si-1.0%Mn-0.6%Cr (in wt %), was investigated. Standardized compression tests were performed in a computer-controlled servo-hydraulic uniaxial testing machine (Instron 8510). The tests were conducted for five different strain rates of 2 × 10⁻⁵/s, 2 × 10⁻⁴/s, 2 × 10⁻³/s, 2 × 10⁻²/s and 2 × 10⁻¹/s at room temperature and the load induced until the compressive stress reached 2000 MPa for each sample with the size of 4 mm × 4 mm × 4 mm. We have chosen this compressive stress to understand the hardness and properties of this steel under extreme stress but before failure. Five samples were compressed for each experimental condition for statistical data reliability. Standard metallographic wet grinding and polishing methods were used to prepare the samples for EBSD and X-ray analysis. A PANalytical Empyrean XRD instrument (Malvern Panalytical, Malvern, United Kingdom) was used with unfiltered Co-Kα radiation at 45 kV and 40 mA current for quantitative X-ray diffraction (XRD) to measure the volume fraction of phases from a 2θ spectrum that was acquired at a step size of 0.0260 over an angular range of 40° to 130°. An orientation microscopy investigation of transformed austenite and martensite was conducted by electron back-scattered diffraction (EBSD) technique, using an Oxford system attached with a Carl Zeiss AURIGA® CrossBeam® (Carl Zeiss, Oberkochen, Germany) field emission gun scanning electron microscopy (FEG SEM) workstation at an accelerating voltage of 20 kV. The EBSD patterns were collected at a binning mode of 2 × 2 and scanning step size of 0.15 μm using AZTEC software. Orientation imaging microscopy (OIM) analysis version 8 (EDAX, AMETEK Materials Analysis Division, NJ, USA) has been used for dislocation mapping. Nano-indentation tests were carried out in load control mode on a TI 900 Hysitron Tribolab system (Hysitron, Inc., Minneapolis, USA) at load up to 8000 μN with a Berkovich three-sided pyramidal diamond tip indenter (nominal angle of 65.3° and radius of 200 nm). Effect of high strain rate within a single grain of RA was studied using transmission electron microscopy (TEM). At first, using the SEM we recognized the RA in deformed samples. Then the microstructure of the deformed RA was observed using a TEM equipped with a field emission gun (Philips CM 200, FEI Company, Oregon, USA) after preparing the specimens by using a dual beam FIB (FEI xT Nova Nanolab 200, FEI Company, Hillsboro, OR, USA), and the thickness of the specimens was estimated to be ~100 nm.
3. Results and Discussion
3.1. Base Material
The initial structure of the steel samples contains martensite and ~45% RA, which was observed in the EBSD image in Figure 1a and XRD pattern in Figure 1c. The EBSD phase diagram in Figure 1a revealed the presence of RA (blue areas) with lath and plate-shaped martensite (red areas). The dislocation density, Figure 1b, close to some of the austenite-martensite grain boundaries and within the smaller grains shows a shift in the distribution towards higher dislocation, suggesting that much energy is stored in those regions. In contrast, bigger RA grains have negligible dislocation density.
3.2. Influence of Strain Rates on Phase Transformation
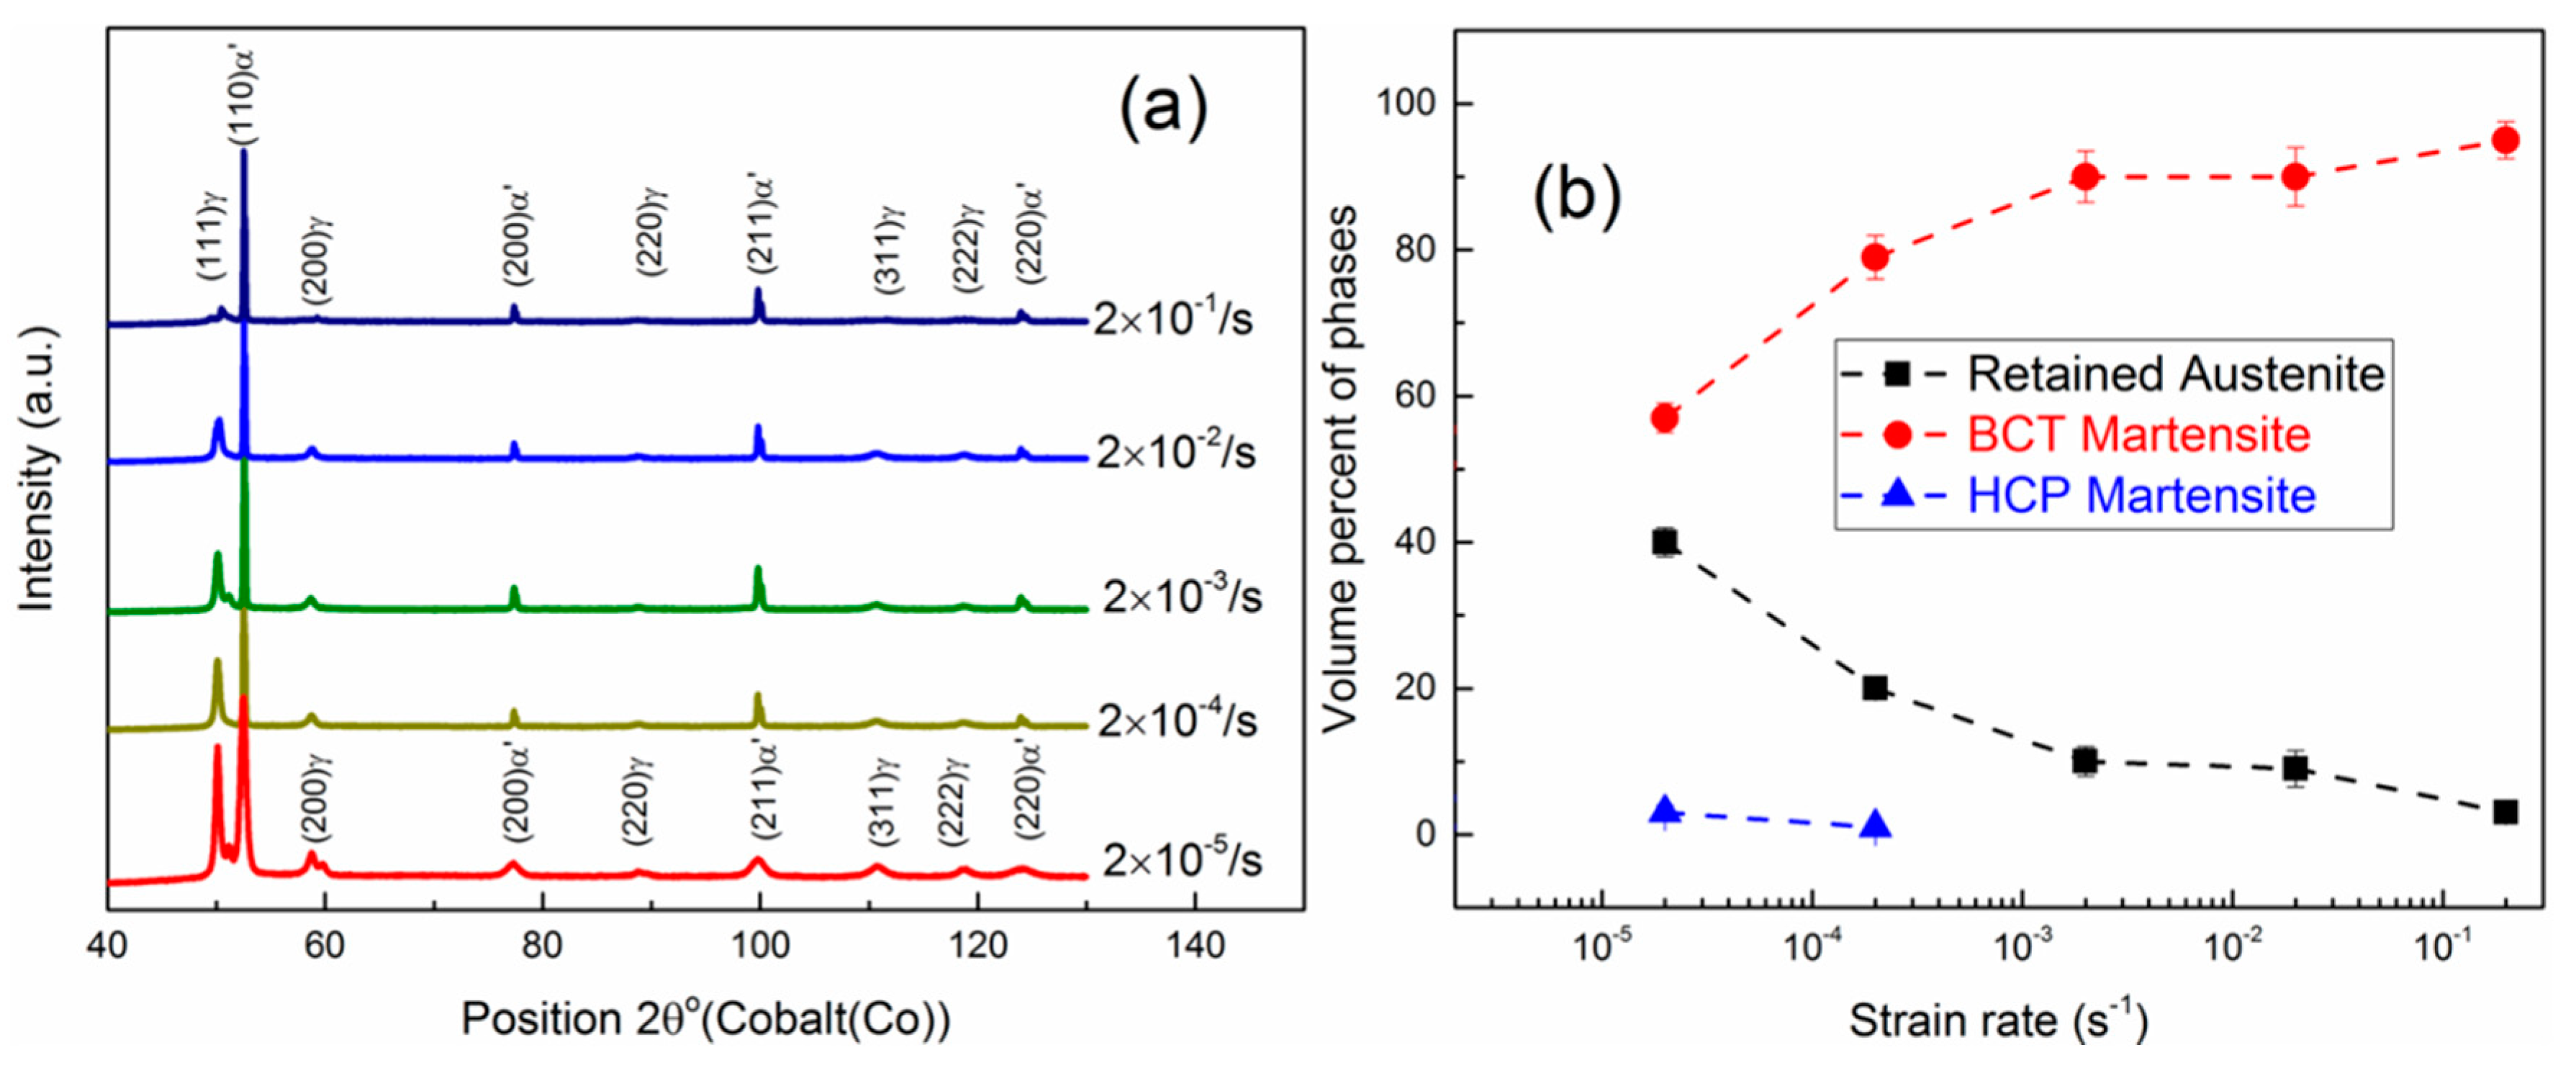
After the compression test, X-ray analysis was carried out to study the stability of phases under different compression stain rates. Figure 2a shows the XRD spectrum of different samples after compression under different strain rate and Figure 2b shows the effect of strain rates on the volume fractions of the phases. X-ray analysis was carried out to study the volume percentage of the RA of the specimen under compression deformation at different strain rates. The volume fraction can be calculated from the XRD spectrum according to the ASTM-E975–13 standard [19], where, each phase’s volume fraction can be calculated based on the following Equation (1):
where,
M = B(sin2 θ)/λ2, BFe = 0.35 ± Å2.
In this equation, Integrated intensity per angular diffraction peak in the i-phase; Intensity of the incident beam; Linear absorption coefficient for the steel; Charge and mass of the electron; Radius of the diffractometer; Velocity of light; Wavelength of incident radiation; Volume of the unit cell; Structure factor which depends on the atomic co-ordinates , the atomic scattering factors and anomalous dispersion corrections the isotropic Debye-Waller factors and the influence of occupations and replacements ; Multiplicity factor of the reflection; Bragg angle; Debye-Waller or temperature factor which is a function of θ; Volume fraction of i-plane. The constant is composed of various physical properties of the material. The terms in the factor involve the unit cell volume, structure factor, crystallographic multiplicity factor, Lorentz polarization factor and the temperature factor.
Hence, for this high carbon steel containing RA , body-centered tetragonal-martensite and hexagonal close-packed-martensite , the total volume of the phases can be written as:
Based on Equation (1) individual volume fractions of each phase can be calculated using equation the following equation,
In a specific X-ray diffraction plane is a constant, therefore,
where and number of peaks examined by X-ray diffraction.
From the X-ray spectrum (Figure 2a), ~40% RA was measured after loading at 2 × 10⁻⁵/s strain rate which indicates the RA did not transform significantly at this stage. However, a very small peak of ε martensite was identified at the very low strain, 2 × 10⁻⁵/s. At the highest strain rate of 2 × 10⁻¹/s, the content of RA decreased to below 7%. When the RA achieves sufficient energy from the induced compressive strain, martensitic transformation takes place [20]. Because of the transformation phenomenon, the amount of RA decreases as the applied strain rate is increased. In these spectrums, the α′-martensitic transformation dominates. When the imposed strain rate was 2 × 10⁻³/s, the volume percent of martensite attained the value of ~90%. At further increase in the strain rate at 2 × 10⁻²/s no significant increase in martensite percentage was observed. However, when the imposed strain rate was higher than 2 × 10⁻²/s, which is 2 × 10⁻¹/s the volume percent of retained austenite increased by ~5% and attained the value of ~95%. At this stage, RA was encapsulated in the newly formed martensite plates and the dislocation defects increases which restricted further transformation.
3.3. Influence of Strain Rates on Microstructure
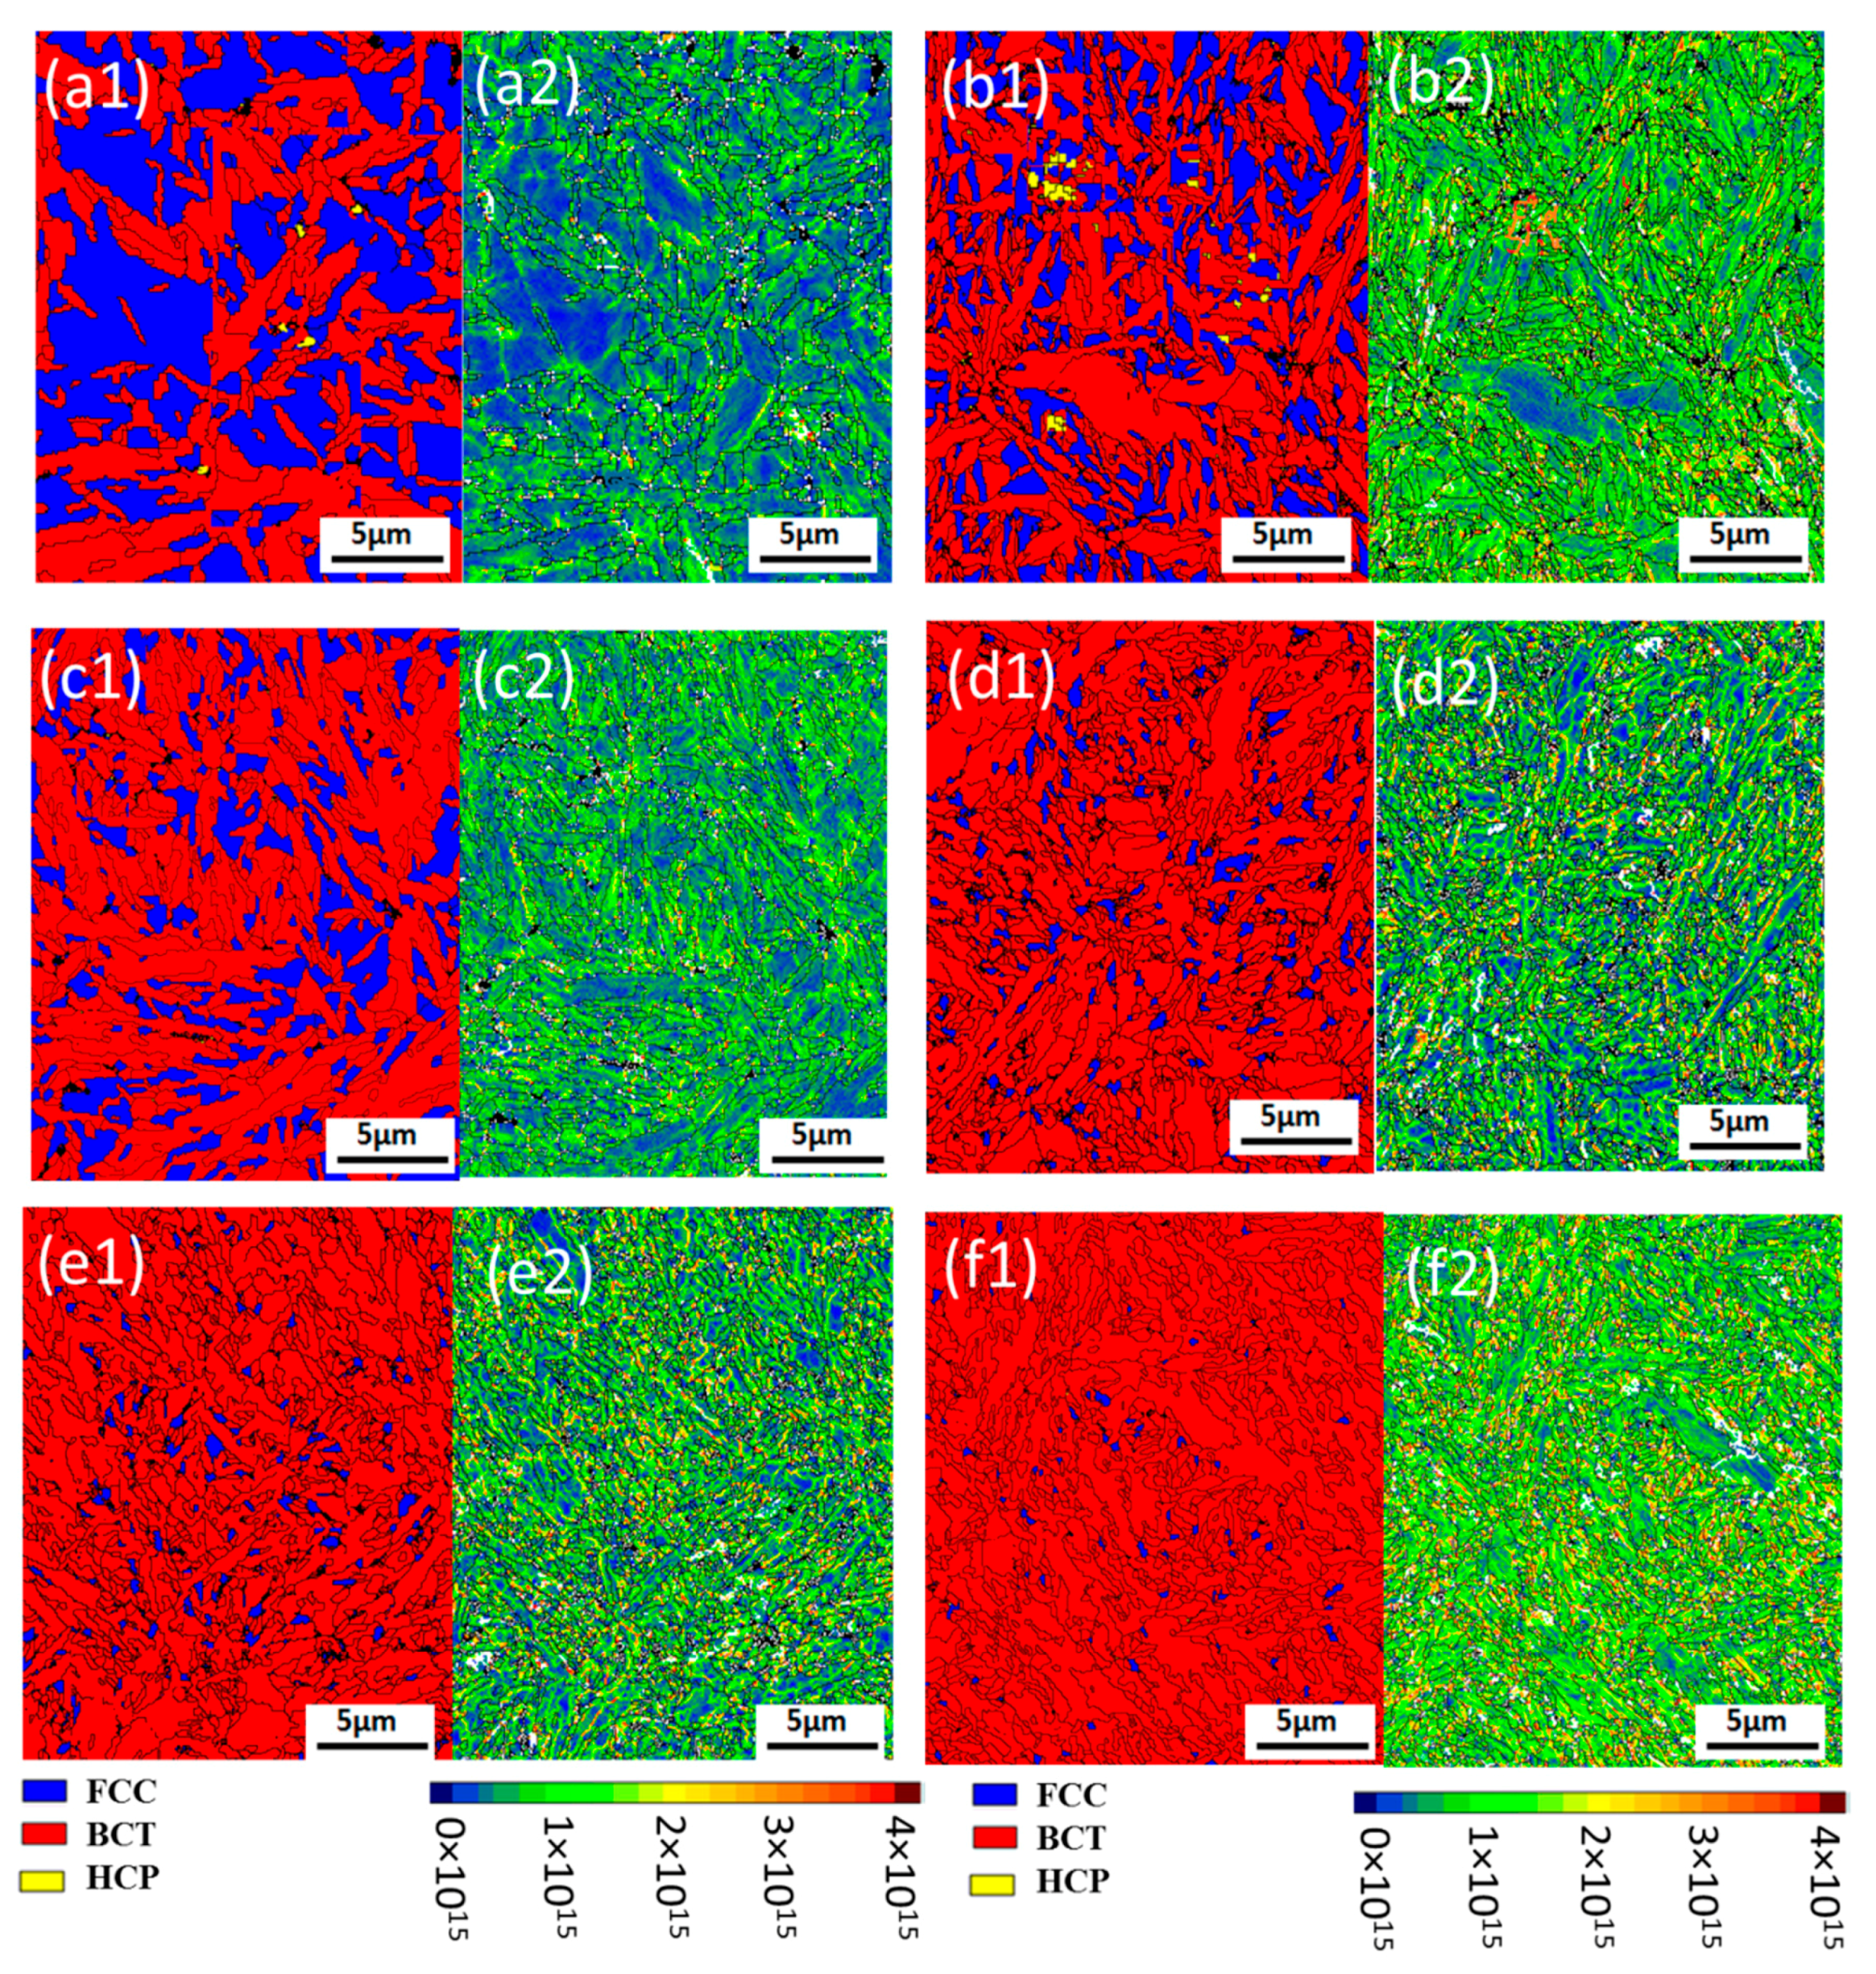
The microstructure and dislocation density of martensite in different specimens that had undergone different strain rates were evaluated. The results are shown in Figure 3. Local variations in the lattice orientation reflect lattice curvature that can be associated with residual strain and geometrically necessary dislocations (GNDs) [21,22]. Different levels of dislocations were observed within the microstructure, which is indicative of the heterogeneity of strain developed through the microstructure at different strain rates of compressive loading. The heterogeneity in the microstructure also shows the phase transformation phenomena. When the RA gets sufficient energy from the compressive stress, the phase transformation takes place. This phenomenon occurs simultaneously with the increasing compressive strain rates. The highly deformed areas following compression are close to the grain boundaries, the locations for the nucleation of new martensite. This study also reveals that a small amount of ε martensite formed at the low strain rate deformation. At higher strain rate only α′ martensite formation was observed. Later, when strain rate reached and exceeded 2 × 10⁻³/s, the formation of the new martensite slowed down. These observations are made based on phase mapping (Figure 3(a1,b1,c1,d1,e1,f1), which are also supported by the XRD data in Figure 2.
It is well-known from the literature that compression deformation and phase transformation both generate high dislocation density in steel. At the base material, in Figure 3(a2), the dislocation density was minimal compared to the compressed samples. As the RA phase has less dislocation density and ~45% RA was present in the microstructure (Figure 3(a1)), the overall dislocation density demonstrates less value. At the 2 × 10⁻⁵/s strain rate (Figure 3(b2)), the overall dislocation density increased due to dislocation of newly transformed martensite. Dislocation density in the parent martensite also increased at this stage due to the increase in misorientation angles within the grains by deformation. It is noteworthy that dislocation density in the microstructure was a little bit less in 2 × 10⁻⁴/s (Figure 3(c2)) compared to 2 × 10⁻⁵/s (Figure 3(b2)) strain rate induced sample. This happened because to compress the sample at a low strain rate (2 × 10⁻⁵/s) needs more time to attain the desired compressive load compared to the slightly high strain rate (2 × 10⁻⁴/s). This extra time for deformation creates more dislocation in the microstructure. However, when the strain is very high, which is 2 × 10⁻¹/s, most of the RA grains transformed to martensite (Figure 3(f1)) and to accommodate the total strain the dislocation density increased further (Figure 3(f2)).
Deformation by compressive loading creates an accumulation of the dislocation density within the microstructure. When we apply the load in high strain rate, the microstructure does not have time to relax by reason of the generation of dislocation. The formation of dislocation is higher than the speed of dislocation movement which results in a much higher concentration of dislocation and more pile-ups, forms low-angle subgrain boundaries. The dislocation density increases continuously within the sub-grain boundary due to the increase in misorientation angle by high strain rate and eventually, this misorientation turns out to be high enough to create new grain boundaries. The amount of such boundaries gradually increases with the increased strain rate. The dislocation density drops with the formation of high angle boundaries, because, new boundaries are composed of dense distributions of dislocations and consumed all the dislocations, hence, the surrounding regions demonstrate a drop in dislocation content. This is the reason behind the slightly decreased dislocation density at 2 × 10⁻⁴/s strain rate (Figure 3(c2)) compared to the 2 × 10⁻⁵/s strain rate (Figure 3(b2)). After this strain rate, the dislocation density increases again. This phenomenon concludes in phase transformation and grain boundary refinement, as confirmed by the microstructural evolution via high-resolution EBSD analysis. If the steel structure is refined by phase transformation and increased dislocation density due to the mechanical deformation, the hardness of the structure increases. The origin of this high hardness is the reduced grain size and grain boundary strengthening results from the hindrance of grain boundaries to dislocation motion.
Apart from phase transformation and grain refinement, the deformation mechanism of steel has also involved the interactions between deformation twins and dislocations. Formation of nanotwins due to the deformation strengthens the structure and restricts the transformation of RA. It is evident from the literature that the increase in strain rate accelerates the formation of deformation twins in order to accommodate the total strain developed. Figure 4 demonstrates the TEM images where at a high strain rate of 2 × 10⁻²/s dislocation interaction and deformation twins were observed simultaneously in the RA grain as shown in Figure 4c. In contrast, at low strain rate, dislocation tangles and dislocation cells are clearly visible (Figure 4a). Figure 4b,c also demonstrates the morphology of the deformation twin bundles in steel at different strain rates. As the strain rate increases, the thickness of the twins decreases. In this study, the strain hardening behavior of austenite grains is governed by two processes: dislocation-dislocation interaction hardening, and dislocation twin boundary interaction hardening which is in line with the previous literature [22].
In the current study, the compressive load and specimen size were the same for each sample; we deformed the sample at different strain rates: 2 × 10⁻⁵/s, 2 × 10⁻⁴/s, 2 × 10⁻³/s, 2 × 10⁻²/s and 2 × 10⁻¹/s. At the low strain rate, more time is needed to attain the desired compressive stress. Therefore, the twin formation process within the grains can get more time to form. In contrast, at a high strain rate, twin cannot have sufficient time to grow due to the speedy deformation. As a result, the width of the nanotwins was more at the low strain rate compared to the high strain rate (Figure 4b,c). However, the density of nanotwins at a high strain rate of 2 × 10⁻²/s was found to be much higher than the nanotwins at a low strain rate of 2 × 10⁻⁴/s. In order to accommodate the total strain, the formation of twins increases at higher strain but cannot grow to become thicker due to less time for deformation. The selected area electron diffraction (SAED) patterns of the nanotwins are showing orientation relationship in both the deformation-induced samples.
3.4. Influence of Strain Rates on Mechanical Property
It is well known that sample hardness increases with the martensitic transformation of RA and grain refinement. Martensite restricts the dislocation movements and hence deformation. The hardness of metallic materials also rises with dislocation density and nano twin formation by deformation. In this current study, plastic deformation and phase transformation both generates dislocation defects.
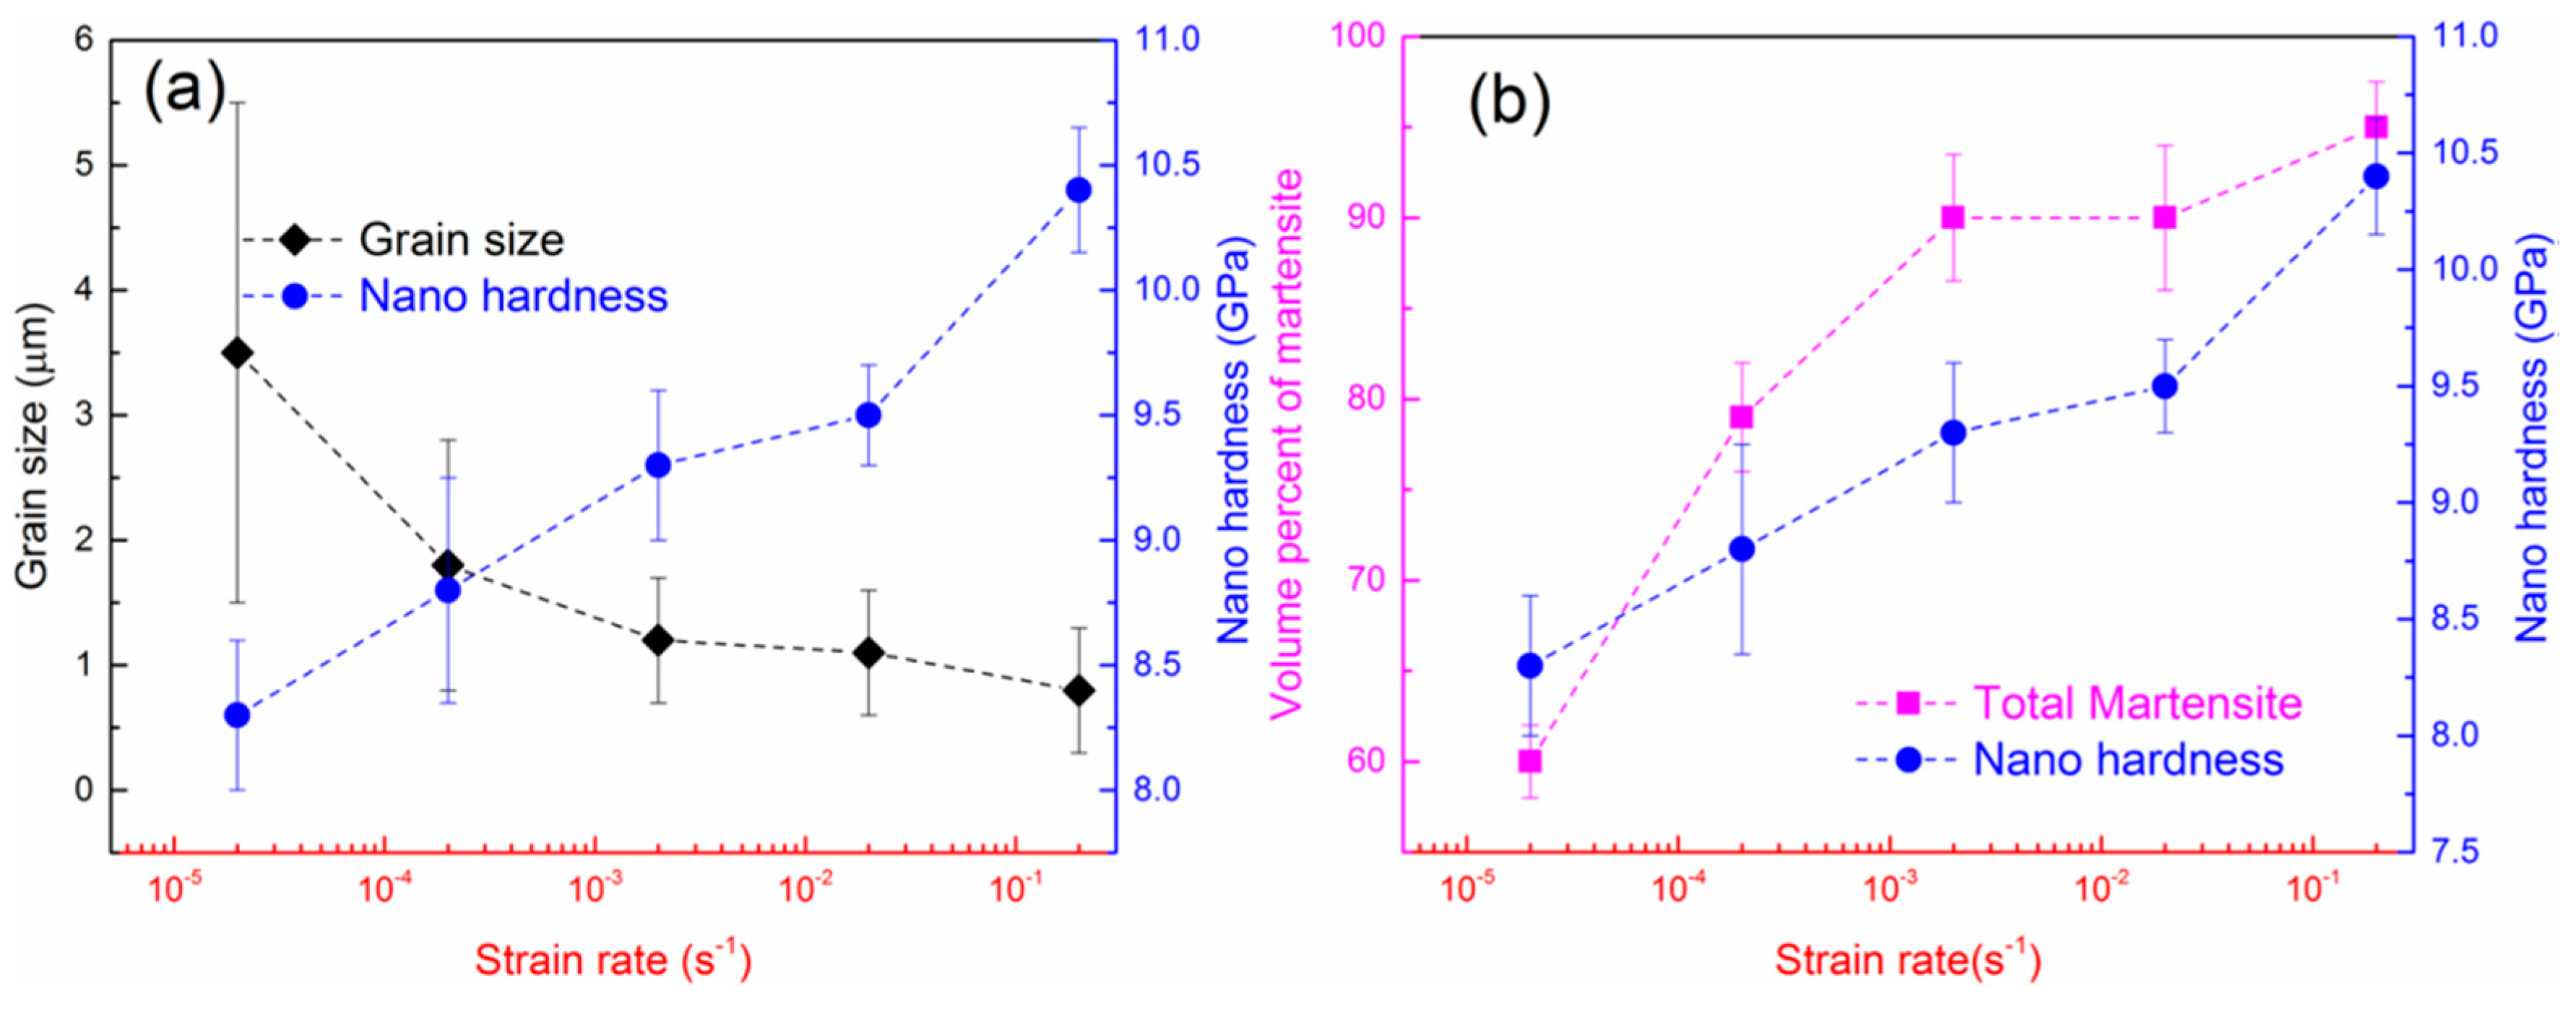
Figure 5 shows the results of samples in nanohardness vs. compressive stress tests. Nanohardness increases gradually with the increased strain rate and decreased grain size up to 2 × 10⁻³/s. As the strain rate researches certain values between 2 × 10⁻³/s and 2 × 10⁻²/s, decreasing trend of the grain sizes is ceased by the saturation in phase transformation which leads to a steady-state condition of dislocation density. However, these two samples have a little difference in nanohardness. EBSD phase diagrams show a slight variation in the size of RA grains; the sample under compressive stress at 2 × 10⁻³/s strain rate has slightly bigger RA grains compared to the 2 × 10⁻²/s strain rate induced sample. The overall distribution of the grains also shows less variation and comparatively less grain size for 2 × 10⁻²/s strain rate induced sample. The decrease in the RA grain size and overall grain size is the reason behind more hardness in the 2 × 10⁻²/s strain rate induced sample. When the strain rate increased and reached 2 × 10⁻¹/s, a sudden increase in hardness occurred, and exceeded 10 GPa (Figure 5a,b). This correlated closely with the proportion of martensite in the structure (Figure 2), the transformation of RA to martensite (as indicated in Figure 5b), the increase in dislocation defects (Figure 3) and grain refinement (Figure 5a). Before compression deformation, the nanohardness was measured at 7.5 MPa. After compression deformation at 2 × 10⁻¹/s strain rate, the nanohardness increased and attained a value of 10.4 GPa. As such, the hardness of the steel was some ~35–40% higher than the hardness of the original steel sample.
4. Conclusions
This work explored the mechanical stability of RA in high carbon steel samples under compressive stress at different strain rates, using a combination of EBSD, XRD, TEM and nano-indentation tests. XRD and EBSD patterns demonstrate the volume of RA at increased compressive strain rate. The volume percentage of martensite increased as the strain rate increased, hence efficiently increases the strength of the structure. EBSD showed a significant reduction in the grain size. Nanohardness tests showed a positive correlation between strain rates and the hardness of the material, which can be attributed to strain hardening and phase transformation.
We have established and comprehensively described how higher strain rate induced plastic deformation produced refine grains of metals and make them very strong. When heavily deformed through compressive loading, metal specimens generated an increasing density of defects or dislocations that effectively strengthens the metal against further deformation. The extraordinary hardness is achieved by simultaneously enabling transformation-induced and dislocation density-induced structural strengthening mechanisms. Another nanoscale mechanism involves strengthening by nano twinning. Such research is essential for controlling the microstructures of high carbon steels under extreme operation condition and, so, for opening up new industrial applications for these relatively low alloyed low-cost steel.
Author Contributions
Conceptualization, R.H.; Methodology, R.H.; Formal Analysis, R.H.; Investigation, R.H.; Writing—Original Draft Preparation, R.H.; Writing—Review & Editing, R.H., F.P. and V.S.; Supervision, F.P. and V.S.; Project Administration, V.S.; Funding Acquisition, V.S.
Funding
This research was funded by Australian Research Council’s Industrial Transformation Research Hub funding scheme, project IH130200025.
Acknowledgments
This research was supported under Australian Research Council’s Industrial Transformation Research Hub funding scheme (project IH130200025). We gratefully acknowledge the technical support provided by the Analytical Centre in the UNSW Australia.
Conflicts of Interest
The authors declare no conflict of interest.
References
- Hossain, R.; Pahlevani, F.; Quadir, M.; Sahajwalla, V. Stability of retained austenite in high carbon steel under compressive stress: An investigation from macro to nano scale. Sci. Rep. 2016, 6, 34958. [Google Scholar] [CrossRef] [PubMed]
- Hossain, R.; Pahlevani, F.; Sahajwalla, V. Solid State Phase Transformation Mechanism in High Carbon Steel Under Compressive Load and with Varying Cr Percent. In Proceedings of the TMS Annual Meeting & Exhibition, Phoenix, AZ, USA, 11–15 March 2018; pp. 797–802. [Google Scholar]
- Kim, J.H.; Ko, K.H.; Noh, S.D.; Kim, G.G.; Kim, S.J. The effect of boron on the abrasive wear behavior of austenitic Fe-based hardfacing alloys. Wear 2009, 267, 1415–1419. [Google Scholar] [CrossRef]
- Hossain, R.; Pahlevani, F.; Witteveen, E.; Banerjee, A.; Joe, B.; Prusty, B.G.; Dippenaar, R.; Sahajwalla, V. Hybrid structure of white layer in high carbon steel—Formation mechanism and its properties. Sci. Rep. 2017, 7, 13288. [Google Scholar] [CrossRef] [PubMed]
- Celada-Casero, C.; Kooiker, H.; Groen, M.; Post, J.; San-Martin, D. In-situ investigation of strain-induced martensitic transformation kinetics in an austenitic stainless steel by inductive measurements. Metals 2017, 7, 271. [Google Scholar] [CrossRef]
- Hossain, R.; Pahlevani, F.; Sahajwalla, V. Effect of small addition of Cr on stability of retained austenite in high carbon steel. Mater. Charact. 2017, 125, 114–122. [Google Scholar] [CrossRef]
- Jeon, J.B.; Chang, Y.W. Effect of nitrogen on deformation-induced martensitic transformation in an austenitic 301 stainless steels. Metals 2017, 7, 503. [Google Scholar] [CrossRef]
- Curtze, S.; Kuokkala, V.-T. Dependence of tensile deformation behavior of TWIP steels on stacking fault energy, temperature and strain rate. Acta Mater. 2010, 58, 5129–5141. [Google Scholar] [CrossRef]
- He, B.; Huang, M.; Liang, Z.; Ngan, A.; Luo, H.; Shi, J.; Cao, W.; Dong, H. Nanoindentation investigation on the mechanical stability of individual austenite grains in a medium-Mn transformation-induced plasticity steel. Scr. Mater. 2013, 69, 215–218. [Google Scholar] [CrossRef]
- Qiao, X.; Han, L.; Zhang, W.; Gu, J. Nano-indentation investigation on the mechanical stability of individual austenite in high-carbon steel. Mater. Charact. 2015, 110, 86–93. [Google Scholar] [CrossRef]
- He, B.; Luo, H.; Huang, M. Experimental investigation on a novel medium Mn steel combining transformation-induced plasticity and twinning-induced plasticity effects. Int. J. Plast. 2016, 78, 173–186. [Google Scholar] [CrossRef]
- Ahn, T.-H.; Oh, C.-S.; Kim, D.; Oh, K.; Bei, H.; George, E.P.; Han, H. Investigation of strain-induced martensitic transformation in metastable austenite using nanoindentation. Scr. Mater. 2010, 63, 540–543. [Google Scholar] [CrossRef]
- Hall, E. The deformation and ageing of mild steel: III discussion of results. Proc. Phys. Soc. Sect. B 1951, 64, 747–753. [Google Scholar] [CrossRef]
- Lu, L.; Chen, X.; Huang, X.; Lu, K. Revealing the maximum strength in nanotwinned copper. Science 2009, 323, 607–610. [Google Scholar] [CrossRef] [PubMed]
- Cadoni, E.; Fenu, L.; Forni, D. Strain rate behaviour in tension of austenitic stainless steel used for reinforcing bars. Constr. Build. Mater. 2012, 35, 399–407. [Google Scholar] [CrossRef]
- Kim, C. Nondestructive evaluation of strain-induced phase transformation and damage accumulation in austenitic stainless steel subjected to cyclic loading. Metals 2017, 8, 14. [Google Scholar] [CrossRef]
- Nakkalil, R. Formation of adiabatic shear bands in eutectoid steels in high strain rate compression. Acta Metallurgica et Materialia 1991, 39, 2553–2563. [Google Scholar] [CrossRef]
- Standard, A. E975-03: Standard Practice for X-ray Determination of Retained Austenite in Steel with Near Random Crystallographic Orientation; ASTM: West Conshohocken, PA, USA, 2008. [Google Scholar]
- Böhner, A.; Niendorf, T.; Amberger, D.; Höppel, H.W.; Göken, M.; Maier, H.J. Martensitic transformation in ultrafine-grained stainless steel AISI 304L under monotonic and cyclic loading. Metals 2012, 2, 56–64. [Google Scholar] [CrossRef]
- Li, H.; Hsu, E.; Szpunar, J.; Utsunomiya, H.; Sakai, T. Deformation mechanism and texture and microstructure evolution during high-speed rolling of AZ31B Mg sheets. J. Mater. Sci. 2008, 43, 7148–7156. [Google Scholar] [CrossRef]
- Gouné, M.; Danoix, F.; Allain, S.; Bouaziz, O. Unambiguous carbon partitioning from martensite to austenite in Fe-C-Ni alloys during quenching and partitioning. Scr. Mater. 2013, 68, 1004–1007. [Google Scholar] [CrossRef]
- Kou, H.; Lu, J.; Li, Y. High-strength and high-ductility nanostructured and amorphous metallic materials. Adv. Mater. 2014, 26, 5518–5524. [Google Scholar] [CrossRef] [PubMed]
Figure 1.
EBSD micrograph and XRD spectrum of the material before compression test. (a) Phase map, here red is martensite and blue is RA; (b) dislocation mapping. Black lines are grain boundaries with a misorientation angle of more than 15°; (c) XRD showing RA and martensite peaks.
Figure 1.
EBSD micrograph and XRD spectrum of the material before compression test. (a) Phase map, here red is martensite and blue is RA; (b) dislocation mapping. Black lines are grain boundaries with a misorientation angle of more than 15°; (c) XRD showing RA and martensite peaks.
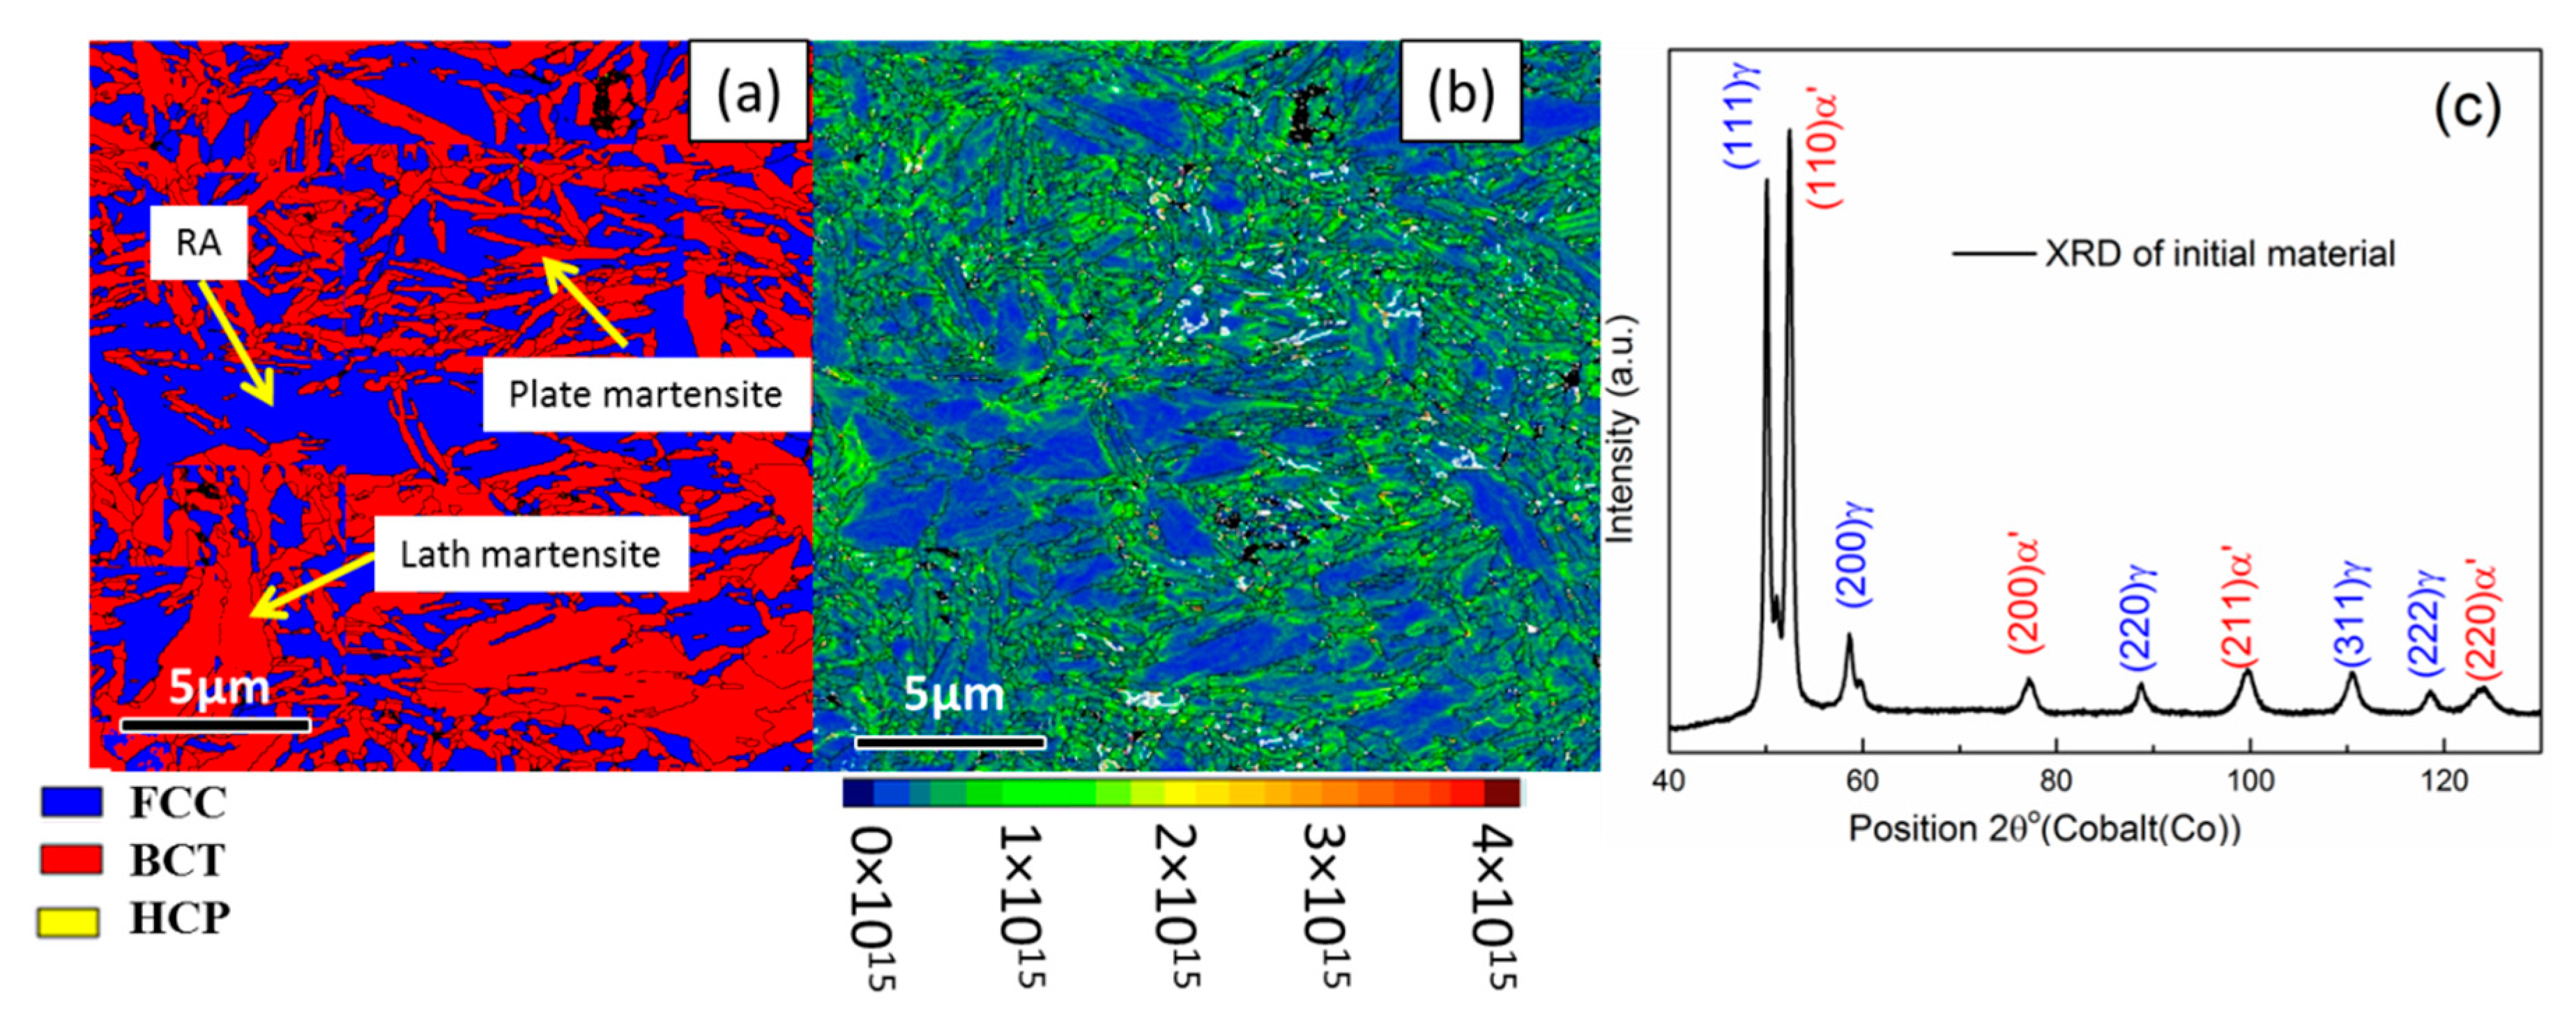
Figure 2.
(a) X-ray diffraction of high carbon steel compressed at different strain rates at room temperature show the martensitic phase transformation of RA; (b) Deformation-induced samples show decreasing RA fraction and increasing martensite with increasing stress.
Figure 2.
(a) X-ray diffraction of high carbon steel compressed at different strain rates at room temperature show the martensitic phase transformation of RA; (b) Deformation-induced samples show decreasing RA fraction and increasing martensite with increasing stress.

Figure 3.
EBSD micrograph of the material (a1) phase map & (a2) dislocation density map of base material; (b1) phase map & (b2) dislocation density of 2 × 10⁻⁵/s; (c1) phase map & (c2) dislocation density of 2 × 10⁻⁴/s; (d1) phase map & (d2) dislocation density of 2 × 10⁻³/s; (e1) phase map & (e2) dislocation density of 2 × 10⁻²/s; (f1) phase map & (f2) dislocation density of 2 × 10⁻¹/s strain rate induced samples.

Figure 4.
Presence of dislocation cell, dislocation tangles, nanotwins in deformed austenite at: (a) 2 × 10⁻⁵/s, (b) 2 × 10⁻⁴/s and (c) 2 × 10⁻²/s strain rates. The SAED pattern of the nanotwins is showing orientation relationship with the parent RA grains.
Figure 4.
Presence of dislocation cell, dislocation tangles, nanotwins in deformed austenite at: (a) 2 × 10⁻⁵/s, (b) 2 × 10⁻⁴/s and (c) 2 × 10⁻²/s strain rates. The SAED pattern of the nanotwins is showing orientation relationship with the parent RA grains.
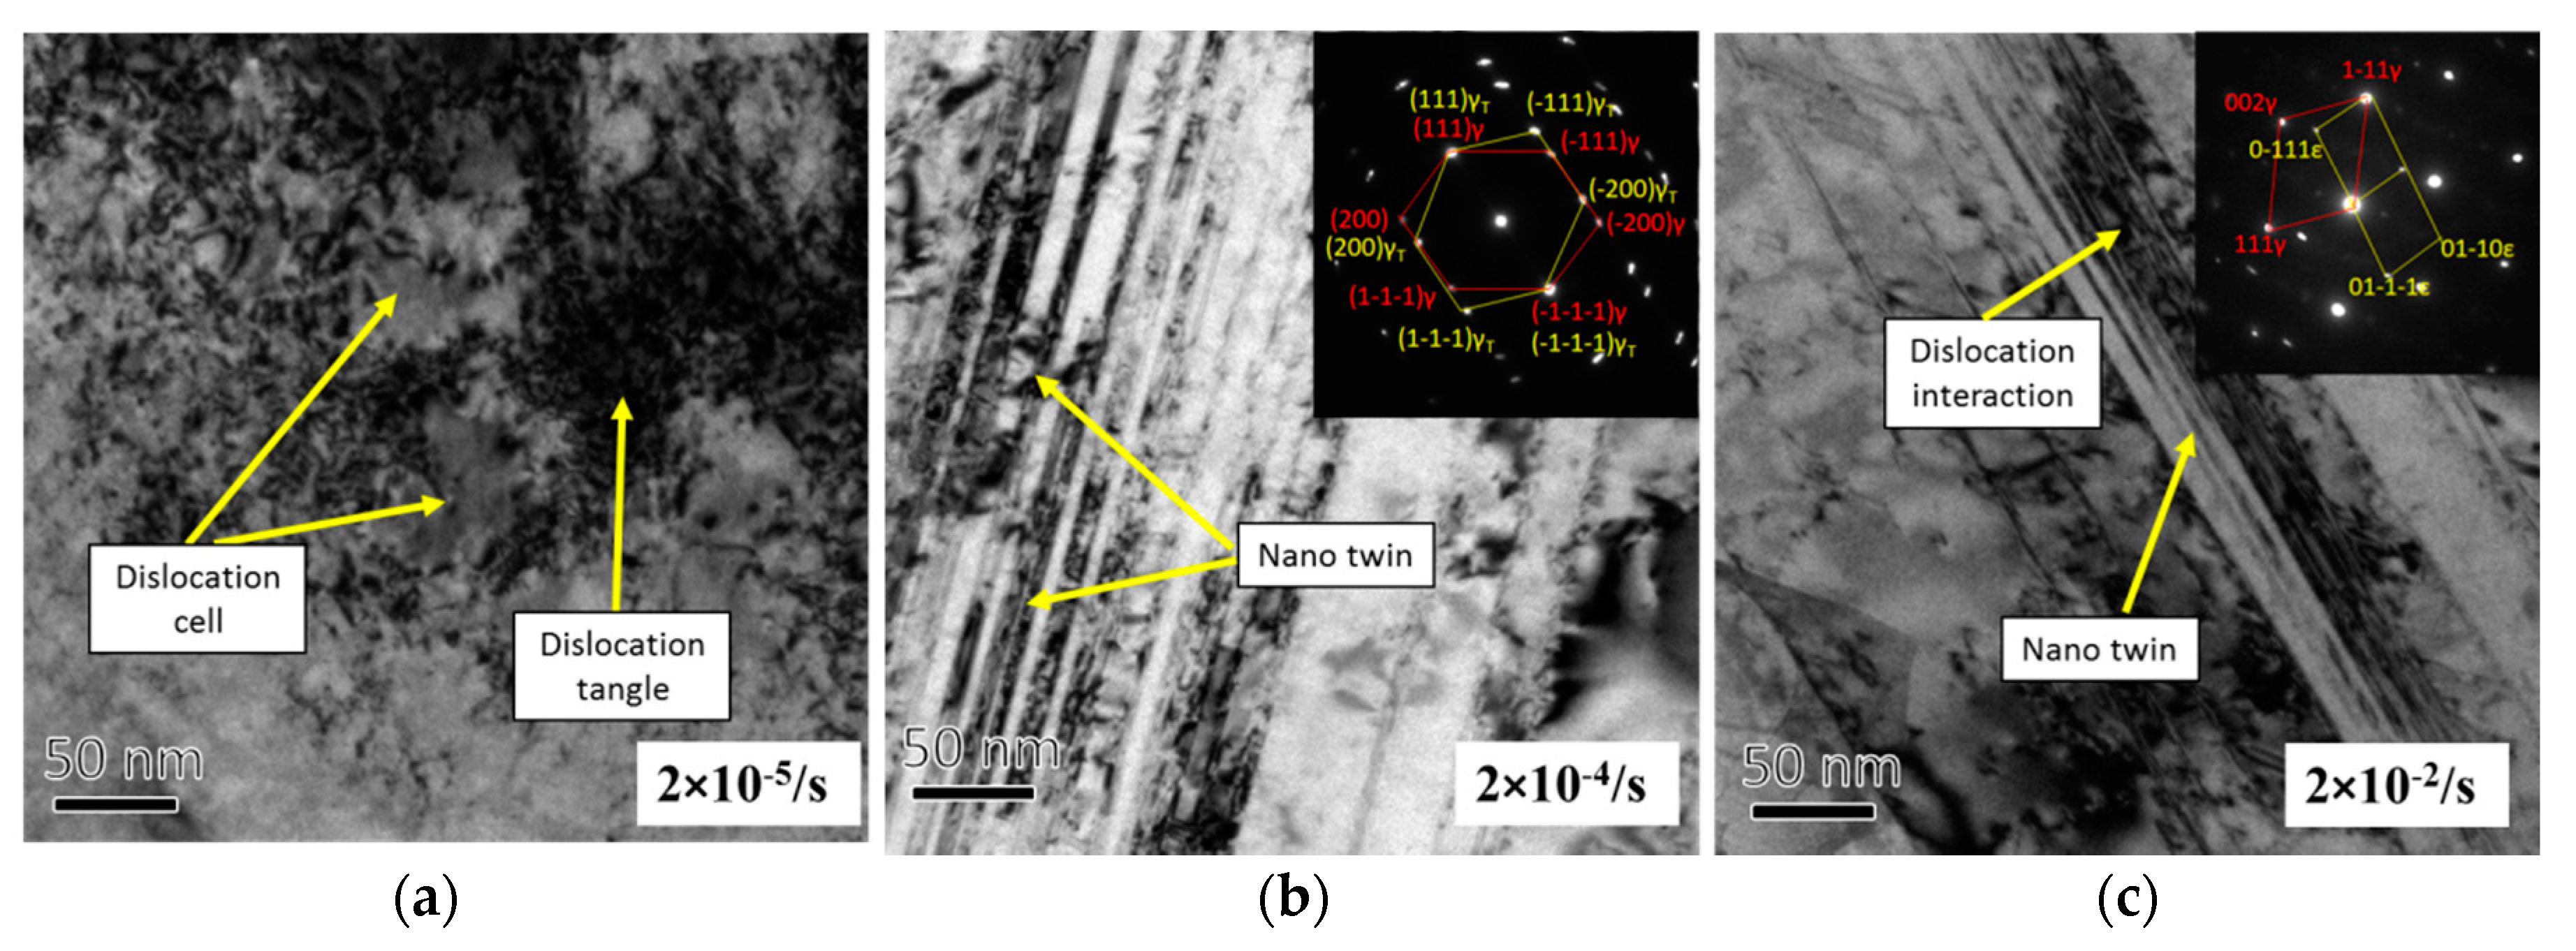
Figure 5.
(a) Grain size profile and nanohardness under compression stress at various strain rates; (b) The volume percent of martensite and nanohardness profile under compressive stress at different strain rates.
Figure 5.
(a) Grain size profile and nanohardness under compression stress at various strain rates; (b) The volume percent of martensite and nanohardness profile under compressive stress at different strain rates.

© 2018 by the authors. Licensee MDPI, Basel, Switzerland. This article is an open access article distributed under the terms and conditions of the Creative Commons Attribution (CC BY) license (http://creativecommons.org/licenses/by/4.0/).
Share and Cite
MDPI and ACS Style
Hossain, R.; Pahlevani, F.; Sahajwalla, V. Evolution of Microstructure and Hardness of High Carbon Steel under Different Compressive Strain Rates. Metals 2018, 8, 580. https://doi.org/10.3390/met8080580
AMA Style
Hossain R, Pahlevani F, Sahajwalla V. Evolution of Microstructure and Hardness of High Carbon Steel under Different Compressive Strain Rates. Metals. 2018; 8(8):580. https://doi.org/10.3390/met8080580
Chicago/Turabian StyleHossain, Rumana, Farshid Pahlevani, and Veena Sahajwalla. 2018. "Evolution of Microstructure and Hardness of High Carbon Steel under Different Compressive Strain Rates" Metals 8, no. 8: 580. https://doi.org/10.3390/met8080580
Note that from the first issue of 2016, this journal uses article numbers instead of page numbers. See further details here.