Article

Effect of H3PO4 Coating, Polyimide Binder, and MoS2/Graphite Lubricants on the Formability and Electromagnetic Properties of Fe-5.0 wt.%Si SMC Toroidal Cores

1
Department of Mechanical Engineering, Keimyung University, Daegu 42601, Republic of Korea
2
Department of Automotive Engineering, Keimyung University, Daegu 42601, Republic of Korea
*
Author to whom correspondence should be addressed.
Metals 2025, 15(11), 1247; https://doi.org/10.3390/met15111247
Submission received: 4 October 2025 / Revised: 13 November 2025 / Accepted: 14 November 2025 / Published: 14 November 2025
(This article belongs to the Special Issue Metallic Magnetic Materials: Manufacture, Properties and Applications)

Abstract

This study examined the effects of phosphoric acid (H3PO4), polyimide (PI), and lubricants (MoS2, graphite) on the phase stability, microstructure, and magnetic performance of Fe-5.0 wt.%Si soft magnetic composites (SMCs). Warm compaction (≤550 °C) and annealing at 700 °C were applied to samples prepared under a full factorial design. X-ray diffraction confirmed stable α-Fe(Si) phases without secondary phases. SEM and TEM–EDS revealed interfacial insulating layers mainly composed of Si-O, with localized phosphorus and carbon. Additive composition strongly influenced magnetic and physical properties. Increasing H3PO4 and PI reduced the density from 7.50 to 7.27 g/cm3 and lowered the permeability (from 189 at 1 kHz to 156), due to thicker interparticle layers that restricted metallic contact and domain wall motion. In contrast, Q-values rose significantly with frequency: for H3PO4 0.25 wt.% + PI 0.25 wt.% + graphite 0.3 wt.%, Q increased from 0.39 (1 kHz) to 2.91 (10 kHz), reflecting effective eddy current suppression. Lubricant type further influenced performance: graphite consistently outperformed MoS2, with 0.3 wt.% graphite providing the best balance of high density, permeability, and a frequency-stable Q-value. Overall, Fe-5.0 wt.%Si performance is governed not by bulk phase changes but by the trade-off between densification and insulation at particle interfaces. The optimal combination of low H3PO4 and PI with 0.3 wt.% graphite offers practical guidelines for designing high-frequency, high-efficiency motor materials.

Graphical Abstract

1. Introduction

The global automotive industry is rapidly transitioning from internal combustion engine (ICE) vehicles to eco-friendly vehicles in response to reduced fossil fuel consumption and stricter environmental regulations. According to the recent Global EV Outlook 2025 report by the International Energy Agency (IEA), the share of electric vehicles (EVs) in worldwide vehicle sales is continuously increasing, with battery demand, charging infrastructure development, and policy support serving as key drivers of EV growth. Major markets such as the European Union (EU), the United States, and China are progressively implementing restrictions or bans on the sale of internal combustion engine vehicles to achieve greenhouse gas emission reduction targets. This is prompting strategic shifts among automakers. These policy and societal demands are decreasing the demand for fossil fuel-based ICE vehicles while accelerating the adoption and spread of eco-friendly vehicles such as electric and hybrid cars [1,2,3,4].
These policy changes require high performance from electric motor technology. Accordingly, enhancing the performance of key components in electric motor drives—such as the efficiency, loss minimization, and high power density of the magnetic core—is essential, with the performance of magnetic core materials playing a critical role. Laminated steel sheets are currently widely used; however, cutting (tabbing/punching) or processing these laminated sheets to fit core shapes generates scrap and losses (chips, burrs, waste), which lead to increased manufacturing costs and resource waste.
As an alternative, soft magnetic composites (SMCs) are gaining attention. SMCs are formed into core shapes by compressing and heat-treating powdered magnetic materials combined with process additives such as insulating coatings, binders, and lubricants. Compared to laminated steel sheets, this method offers greater freedom in shaping, reduces material waste, and provides high mechanical and electromagnetic performance even in complex core geometries [5,6,7,8].
Soft magnetic composites (SMCs) have been primarily developed based on Fe-Al, Fe-Co, Fe-Ni, and Fe-Si alloy systems, with each element directly influencing key electromagnetic properties such as electrical resistivity, saturation flux density, permeability, and coercivity. The Fe-Al system is suitable for high-temperature and corrosive environments due to its oxidation stability and low loss characteristics [9,10]. The Fe-Ni system (Permalloy) is utilized in precision electromagnetic devices because of its very high permeability and low coercivity [11,12,13]. Additionally, the Fe-Co system is applied in specialized electrical machines requiring high saturation flux density and high-power density [14,15].
In particular, Fe-Si-based soft magnetic composites (SMCs) have recently attracted increasing attention as potential materials for high-frequency motor stator cores, compact inductors, and other electromagnetic components in next-generation electric vehicles and power electronic systems due to their low core loss, high resistivity, and design flexibility. Crucially, the Fe-Si system, with silicon additions ranging from 3.5 to 9.0 wt.%, significantly enhances electrical resistivity, effectively suppressing eddy current losses. It is the most widely studied and used core material for electric motors and transformers where high-frequency performance is required [16,17,18,19,20].
Recent research on SMCs has advanced not only by focusing on the intrinsic properties of the alloy systems themselves but also by precisely controlling process variables such as powder surface coatings, binder and lubricant compositions, and forming process conditions to improve electromagnetic performance. In particular, insulating coatings are a key factor that govern eddy current loss suppression and high-frequency response characteristics. Various approaches have been explored, including phosphate coatings, oxide–polymer composite layers, and nano-ceramic hybrid coatings. Moreover, to simultaneously ensure electromagnetic performance and form stability, the roles of process additives such as binders and lubricants, in addition to insulating coatings, are critical. A representative insulating coating agent is phosphoric acid (H3PO4), which forms a phosphate film on the powder surface, increasing electrical resistance and suppressing eddy current losses. Phosphate-based coatings are especially valued as a core technology for minimizing core losses in high-frequency ranges because they maintain relatively stable insulating properties even during heat treatment [21,22,23].
During the compaction process, the polyimide binder undergoes partial glass transition (softening), thereby filling the interparticle voids and promoting adhesion between the powder particles. This significantly enhances the mechanical stability of the initial green compact and suppresses crack formation during subsequent sintering or heat treatment stages by ensuring uniform density distribution. Additionally, polyimide offers excellent thermal stability and electrical insulation, making it particularly suitable for SMC applications requiring high-frequency characteristics [24,25].
Fe-Si powders become more brittle and exhibit reduced formability as silicon content increases, necessitating warm compaction processes [26]. Under these conditions, the role of solid lubricants that provide stable lubrication performance at elevated temperatures becomes important. Molybdenum disulfide (MoS2), a representative solid lubricant, reduces friction between the die wall and powder particles by promoting active sliding due to its layered structure and low shear resistance, thereby lowering the required compaction pressure. At the same time, the amount of MoS2 added directly affects the densification and electromagnetic loss characteristics of the final core [27,28,29].
Graphite, a typical solid lubricant with a layered structure, is well known for enhancing powder particle mobility and reducing residual stresses during forming. Due to these properties, graphite is gaining attention as a promising additive to improve forming stability and density uniformity in SMCs [30,31,32]. However, since graphite is inherently electrically conductive, excessive addition can reduce insulation resistance, necessitating careful optimization of its content.
However, previous studies have mostly addressed the effects of individual additives in a fragmented manner or have been limited to analyzing specific processing conditions. As a result, the independent and comprehensive influence of the composition and content of processing aids such as insulating coatings, binders, and lubricants on the performance of SMCs, while keeping the molding process constant, has not yet been sufficiently clarified. Therefore, in this study, the optimal molding process conditions (550 °C, molding speed 3 mm/s) established through preliminary research on Fe-5.0 wt.%Si-based powders were set as fixed variables [33]. This allowed the focus of the study to be on the independent effects of changes in additive composition and content, rather than variations in molding conditions.
In particular, the insulating coating (H3PO4), binder (polyimide), and lubricants (MoS2 and graphite) each perform distinct yet complementary functions: suppressing electromagnetic losses, ensuring molding stability, and reducing friction in high-temperature molding environments, respectively. However, the comprehensive impact of the composition and content of these additives on the performance of Fe-5.0 wt.%Si-based SMCs has not been fully elucidated. Therefore, this study sets these three additives as variables, quantitatively evaluates macroscopic properties such as density, permeability, and quality value, and supplementarily analyzes the microstructure of the insulating layer through representative specimens, aiming to determine the optimal additive combination for Fe-5.0 wt.%Si SMCs.
The specific research procedures to achieve this are as follows:
  • Setting Additive Conditions: H3PO4 was selected as the insulating coating agent, polyimide as the binder, and MoS2 and graphite as lubricants, with the range of each additive amount established.
  • Experimental Design and Specimen Fabrication: Experimental arrangements were organized according to the set content combinations, and all specimens were fabricated into a toroidal core shape under identical processing conditions.
  • Macroscopic Property Evaluation: The density and electromagnetic properties (permeability, quality value (Q-value)) of the fabricated specimens were quantitatively measured.
  • Microstructure Analysis: Representative specimens were selected, and the morphology and composition of the insulating layer were analyzed using SEM-EDS and TEM.
  • Comprehensive Analysis: Based on the measured results, the effects of varying each additive’s content on density and electromagnetic performance were systematically examined.

2. Materials and Methods

2.1. Fe-Si Powder Materials

The chemical composition and average particle size of the Fe-5.0 wt.%Si alloy powder used in this study are presented in Table 1, citing data from a previous study [26]. The powder exhibits an average particle size of 79.136 μm at Dv50 and was produced via water atomization. Consequently, the particles display an irregular morphology with sharp edges, a typical feature of water-atomized powders. Although such non-spherical particles generally show reduced flowability compared with spherical powders, they are widely employed in powder metallurgy due to their favorable compaction and sintering characteristics. Specifically, the irregular morphology creates additional contact points between adjacent particles during pressing, which can enhance interparticle bonding in the green compact and potentially improve its strength prior to sintering [34].

2.2. Experimental Methods

2.2.1. Design of Experiment

In our previous study, the additive composition was fixed at 1.0 wt.% H3PO4, 0.5 wt.% PI, and 1.0 wt.% MoS2, while compaction parameters such as temperature and punch speed were varied to evaluate their influence on formability and electromagnetic performance [33]. In contrast, the present work focuses on systematically controlling the additive composition itself, thereby differentiating the experimental scope from prior process-oriented investigations.
For the insulating coating, the H3PO4 content was set to 0.25, 0.75, and 1.25 wt.%. Previous studies have reported that phosphate coatings in the range of ~0.3–1.2 wt.% effectively increase interparticle resistivity and suppress eddy current losses, while excessive additions lead to thick coatings that hinder densification and mechanical integrity. The lower bound of 0.25 wt.% was included to probe the minimum addition required for stable insulation, and the upper bound of 1.25 wt.% was selected to examine the influence of thicker coatings, as excessive phosphate has been associated with porosity increases and brittleness in Fe-Si SMCs [23,24,35].
The binder factor, PI, was set to 0.25, 0.50, and 0.75 wt.%. Prior research on phosphate-PI double–coated Fe-Si-Cr SMCs indicated that ~0.4 wt.% PI provides optimum performance under warm compaction and annealing, improving permeability while reducing core loss [36]. In this study, 0.25 wt.% was selected to investigate the minimum region near this reported optimum, 0.50 wt.% was chosen to encompass the literature optimum under our processing route, and 0.75 wt.% was included to explore potential over-addition effects while remaining below the commonly cited 1.5 wt.% threshold for polymer binders in SMCs [25]. This selection ensures that the PI levels remain within experimentally validated ranges while enabling controlled evaluation of the density–loss trade-off.
For the lubricant factor, MoS2 was applied at 0.75, 1.0, and 1.25 wt.%. Prior studies commonly adopted ~1.0 wt.% MoS2 as the representative addition in warm compaction of SMCs, reporting stable lubrication and reduced compaction pressure. Accordingly, 0.75 and 1.25 wt.% were included to examine the effects of slightly reduced and elevated levels, enabling assessment of both under- and over-lubrication regimes. Graphite, in contrast, was introduced at 0.3 and 0.5 wt.% to allow for direct comparison with MoS2. Because graphite has a lower density and layered structure, a smaller weight fraction can provide sufficient lubrication, while limiting the amount also mitigates the risk of decreased resistivity due to its intrinsic electrical conductivity.
The experimental factors and their respective levels are summarized in Table 2.
Considering all combinations of the three factors and their respective levels, a total of 45 experimental conditions were established. The experiments were therefore carried out as a full factorial design, enabling systematic evaluation of both main and interaction effects under identical compaction and heat treatment conditions. To ensure statistical significance and reproducibility, three specimens were fabricated for each condition, resulting in a total of 135 toroidal cores. This comprehensive design provides a consistent basis for assessing the influence of additive composition on the formability and magnetic performance of Fe-Si-based SMCs.

2.2.2. Sample Preparation

The preparation process of H3PO4-PI-coated Fe-Si powders and subsequent SMC cores was divided into three main steps, phosphating, polymer coating, and lubricant mixing/pressing, as shown in Figure 1.
First, Fe-Si powders were coated with phosphate, as illustrated in Figure 1a. The phosphating procedure involved immersing the powders in H3PO4 solution (0.25, 0.75, and 1.25 wt.%) dissolved in acetone, stirring for 3 min, followed by heating at 90 °C for 60 min. After washing with acetone and drying at 150 °C for 30 min, the phosphate-coated Fe-Si powders were obtained.
Secondly, the PI coating was prepared, as shown in Figure 1b. Polyimide (0.25, 0.50, and 0.75 wt.%) was first dissolved in dichloromethane (DCM), and the phosphate-coated Fe-Si powders were subsequently immersed in the PI solution. After impregnation, the powders were dried at 120 °C for 15 min, resulting in phosphate–PI double-coated Fe-Si powders.
Finally, the powders were subjected to lubricant mixing and pressing, as described in Figure 1c. The coated powders were mixed uniformly with MoS2 (0.75, 1.0, and 1.25 wt.%) or graphite (0.3 and 0.5 wt.%) for 15 min. The mixtures were subsequently compacted into toroidal cores through a two-step warm compaction process: the first pressing step was carried out at 100 °C and the second pressing step at 550 °C under an axial pressure of 800 MPa. The resulting green compacts, with an outer diameter of 20.3 mm, an inner diameter of 12.7 mm, and a height of 5 mm, were then annealed at 700 °C for 30 min in a nitrogen atmosphere to relieve residual stress and stabilize the microstructure.

2.3. Measurement Methods

The density of the toroidal cores was determined using the Archimedes method in accordance with the KS-D-0033 standard for sintered metallic materials [37]. To avoid liquid penetration into open pores, each specimen was coated with a thin paraffin layer prior to immersion, and buoyancy corrections were applied considering the density of distilled water at 25.0 ± 0.5 °C. The balance used for all measurements was a METTLER-TOLEDO XS204 (METTLER-TOLEDO, Columbus, OH, USA), and three replicates were prepared for each condition to ensure measurement repeatability.
The permeability of the toroidal cores was determined from the reactance of 10-turn copper winding applied to each specimen. Inductance values were obtained using a Precision LCR meter (4284A, Agilent Technologies, Santa Clara, CA, USA) over a frequency range of 100–10,000 Hz. The effective magnetic path length and cross-sectional area of each core were determined from the measured dimensions, enabling the calculation of relative permeability using Equations (1) and (2) based on the inductance data. In Equations (1) and (2), L represents the inductance, l e the effective magnetic path length, μ 0 the permeability of free space, N the number of coil turns, and A the effective cross-sectional area of the core.
l e = π ( D o u t e r D i n n e r ) ln ( D o u t e r / D i n n e r )
μ r = L × l e μ 0 × N 2 × A
The Q-value was obtained directly from the LCR meter using the measured inductance and series resistance. This parameter, expressed in Equation (3) as the ratio of inductive reactance to equivalent series resistance, represents the balance between stored magnetic energy and resistive loss. In this equation, ω represents the angular frequency and R the equivalent series resistance. A higher Q-value corresponds to lower magnetic losses and therefore indicates a more efficient material. In the case of SMC cores, the Q-value provides an integrated index that simultaneously reflects permeability and iron loss characteristics. Although it does not directly quantify absolute core loss under real motor operating conditions, it serves as a reliable comparative measure of the overall iron loss performance of different additive formulations when tested under identical laboratory conditions.
Q = 1 tan δ = ω L R
After completing the experiments, the measured results—including density, permeability, and Q-value at 1, 5, and 10 kHz—were organized using the exp_tidy format and are presented in Table S1.

3. Results

3.1. Effect of H3PO4-PI–Lubricant Content on Phases of Fe-5.0 wt.%Si SMC

X-ray diffraction (XRD) analysis was performed to evaluate the crystal structure of the Fe-5.0 wt.%Si SMCs and to investigate whether variations in additive composition induced any phase transformations. For reference, the Fe-Si powder phase was analyzed using an X’Pert PRO MPD diffractometer (PANalytical B.V., Almelo, The Netherlands), as reported in a previous study [26], while the bulk toroidal specimens with different additive compositions were examined using a SmartLab X-ray diffractometer (Rigaku Corporation, Tokyo, Japan). XRD patterns were recorded on a PANalytical X’Pert PRO diffractometer using Cu K α radiation ( λ = 1.5406   ), with continuous θ -2 θ scanning from 10 ° to 90 ° (2 θ ), a step size of 0.025 ° , and a scan rate of 2 ° /min. By comparing the diffraction patterns of the powders and bulk compacts, potential structural changes during warm compaction and subsequent annealing could be assessed.
The phase composition of the Fe-5.0 wt.%Si SMCs after compaction and annealing was examined by XRD for three representative series: (i) variation in H3PO4 content, (ii) variation in PI content, and (iii) variation in lubricant type and content. The corresponding XRD patterns for these three series are presented in Figure 2. In all cases, the diffraction patterns revealed no detectable secondary phases, and only the characteristic peaks of the α-Fe(Si) based on PDF #06-0696 for α-Fe solid solution were observed [38].
The absence of phase transformation despite changes in coating, binder, and lubricant contents can be rationalized based on the applied processing route. After phosphate and polyimide coating, the powders were mixed with MoS2 (0.75–1.25 wt.%) or graphite (0.3–0.5 wt.%) for 15 min, and compacted via a two-step warm pressing process (100 °C and 550 °C under 800 MPa). The resulting green compacts (OD 20.3 mm, ID 12.7 mm, h 5 mm) were subsequently annealed at 700 °C for 30 min in a nitrogen atmosphere. Under these conditions, both the compaction (550 °C) and annealing (700 °C) temperatures are well below the threshold for Si diffusion or compound formation in the Fe-Si system. According to Ohnuma et al. [39], the solubility of Si in α-Fe is stable up to ~13 wt.%, and within the present composition range, no silicides or oxides are expected to precipitate.
The thermal behavior of the additives further supports this phase stability. The phosphate layer derived from H3PO4 undergoes gradual dehydration and decomposition upon heating, but stabilizes as an amorphous or glassy phosphate film at 700 °C in N2, without forming crystalline Fe-P or Fe-O compounds. Previous studies have reported that iron phosphate coatings can remain structurally stable up to ~900 °C [40], although their electrical insulation efficiency deteriorates beyond ~700 °C due to thinning, cracking, or amorphization [41]. Likewise, polyimide binders soften and partially decompose above 400–500 °C, and evolve into thin amorphous carbonaceous residues at 700 °C under inert conditions [42]. These transformations occur locally at the particle surface and produce only nanometer-scale amorphous layers, which are below the detection limit of XRD, thus having no impact on the bulk Fe-Si matrix.
Therefore, the variations in H3PO4, PI, and lubricant contents mainly influence the microstructural features (density, pore distribution, and insulation continuity) and the resulting magnetic or electrical properties, rather than inducing detectable crystalline phase transformations. The structural stability of Fe-5.0 wt.%Si powders under the present warm compaction and annealing route thus provides a reliable baseline for evaluating the functional role of coating and lubricant combinations in SMC cores.

3.2. Microstructural Analysis of the Compacted Samples

To evaluate the microstructure of the specimens fabricated by the proposed processing route, high-resolution characterization techniques were employed. For this purpose, a representative sample with the composition H3PO4 0.25 wt.% + PI 0.25 wt.% + graphite 0.3 wt.%, which exhibited superior performance among the tested conditions, was selected for detailed observation.
The surface morphology of the compacted and annealed specimen was examined using scanning electron microscopy (SEM; JEOL Ltd., Tokyo, Japan). To investigate the bonding features between powder particles within the compact, the sample was sectioned and the cross-sectional surfaces were observed. SEM observations were conducted at an accelerating voltage of 15.0 kV, a working distance of 15.2 mm, and a magnification of ×500. The results, presented in Figure 3, reveal the particle-to-particle contacts, pore distribution, and overall densification behavior of the Fe-5.0 wt.%Si SMCs.
Figure 3 shows representative SEM micrographs of the Fe-5.0 wt.%Si SMCs after warm compaction and annealing. The particle boundaries were clearly distinguished, and a continuous insulating layer was observed along most interfaces. This indicates that the coating and compaction processes provided effective interparticle bonding, while such interfacial continuity is favorable for maintaining electrical insulation and structural integrity.
Residual pores were also observed, mainly located at particle boundaries and triple junctions. The presence of these pores is typical of powder metallurgy compacts and reflects the limited plastic deformation during warm pressing, particularly in the presence of insulating coatings. However, the pores were isolated and did not form interconnected networks, suggesting that their overall influence on the magnetic performance is limited.
In addition, to investigate the chemical distribution at the interfaces in more detail, selected interfacial regions were prepared into thin lamellae using a focused ion beam (FIB, Helios 5 UX, Thermo Fisher Scientific, Brno, Czech Republic). The prepared lamellae were analyzed by TEM (JEM-ARM200F, JEOL Ltd., Tokyo, Japan) operated at an accelerating voltage of 200 kV in STEM mode, with imaging conducted at a magnification of approximately 200 k × , through which the interfacial morphology and the chemical composition of the insulating layers in the Fe-5.0 wt.%Si samples were examined by EDS. This TEM–EDS analysis complements the SEM observations of interfacial continuity and pore distribution, providing more precise evidence of the actual morphology and elemental distribution of the insulating layers.
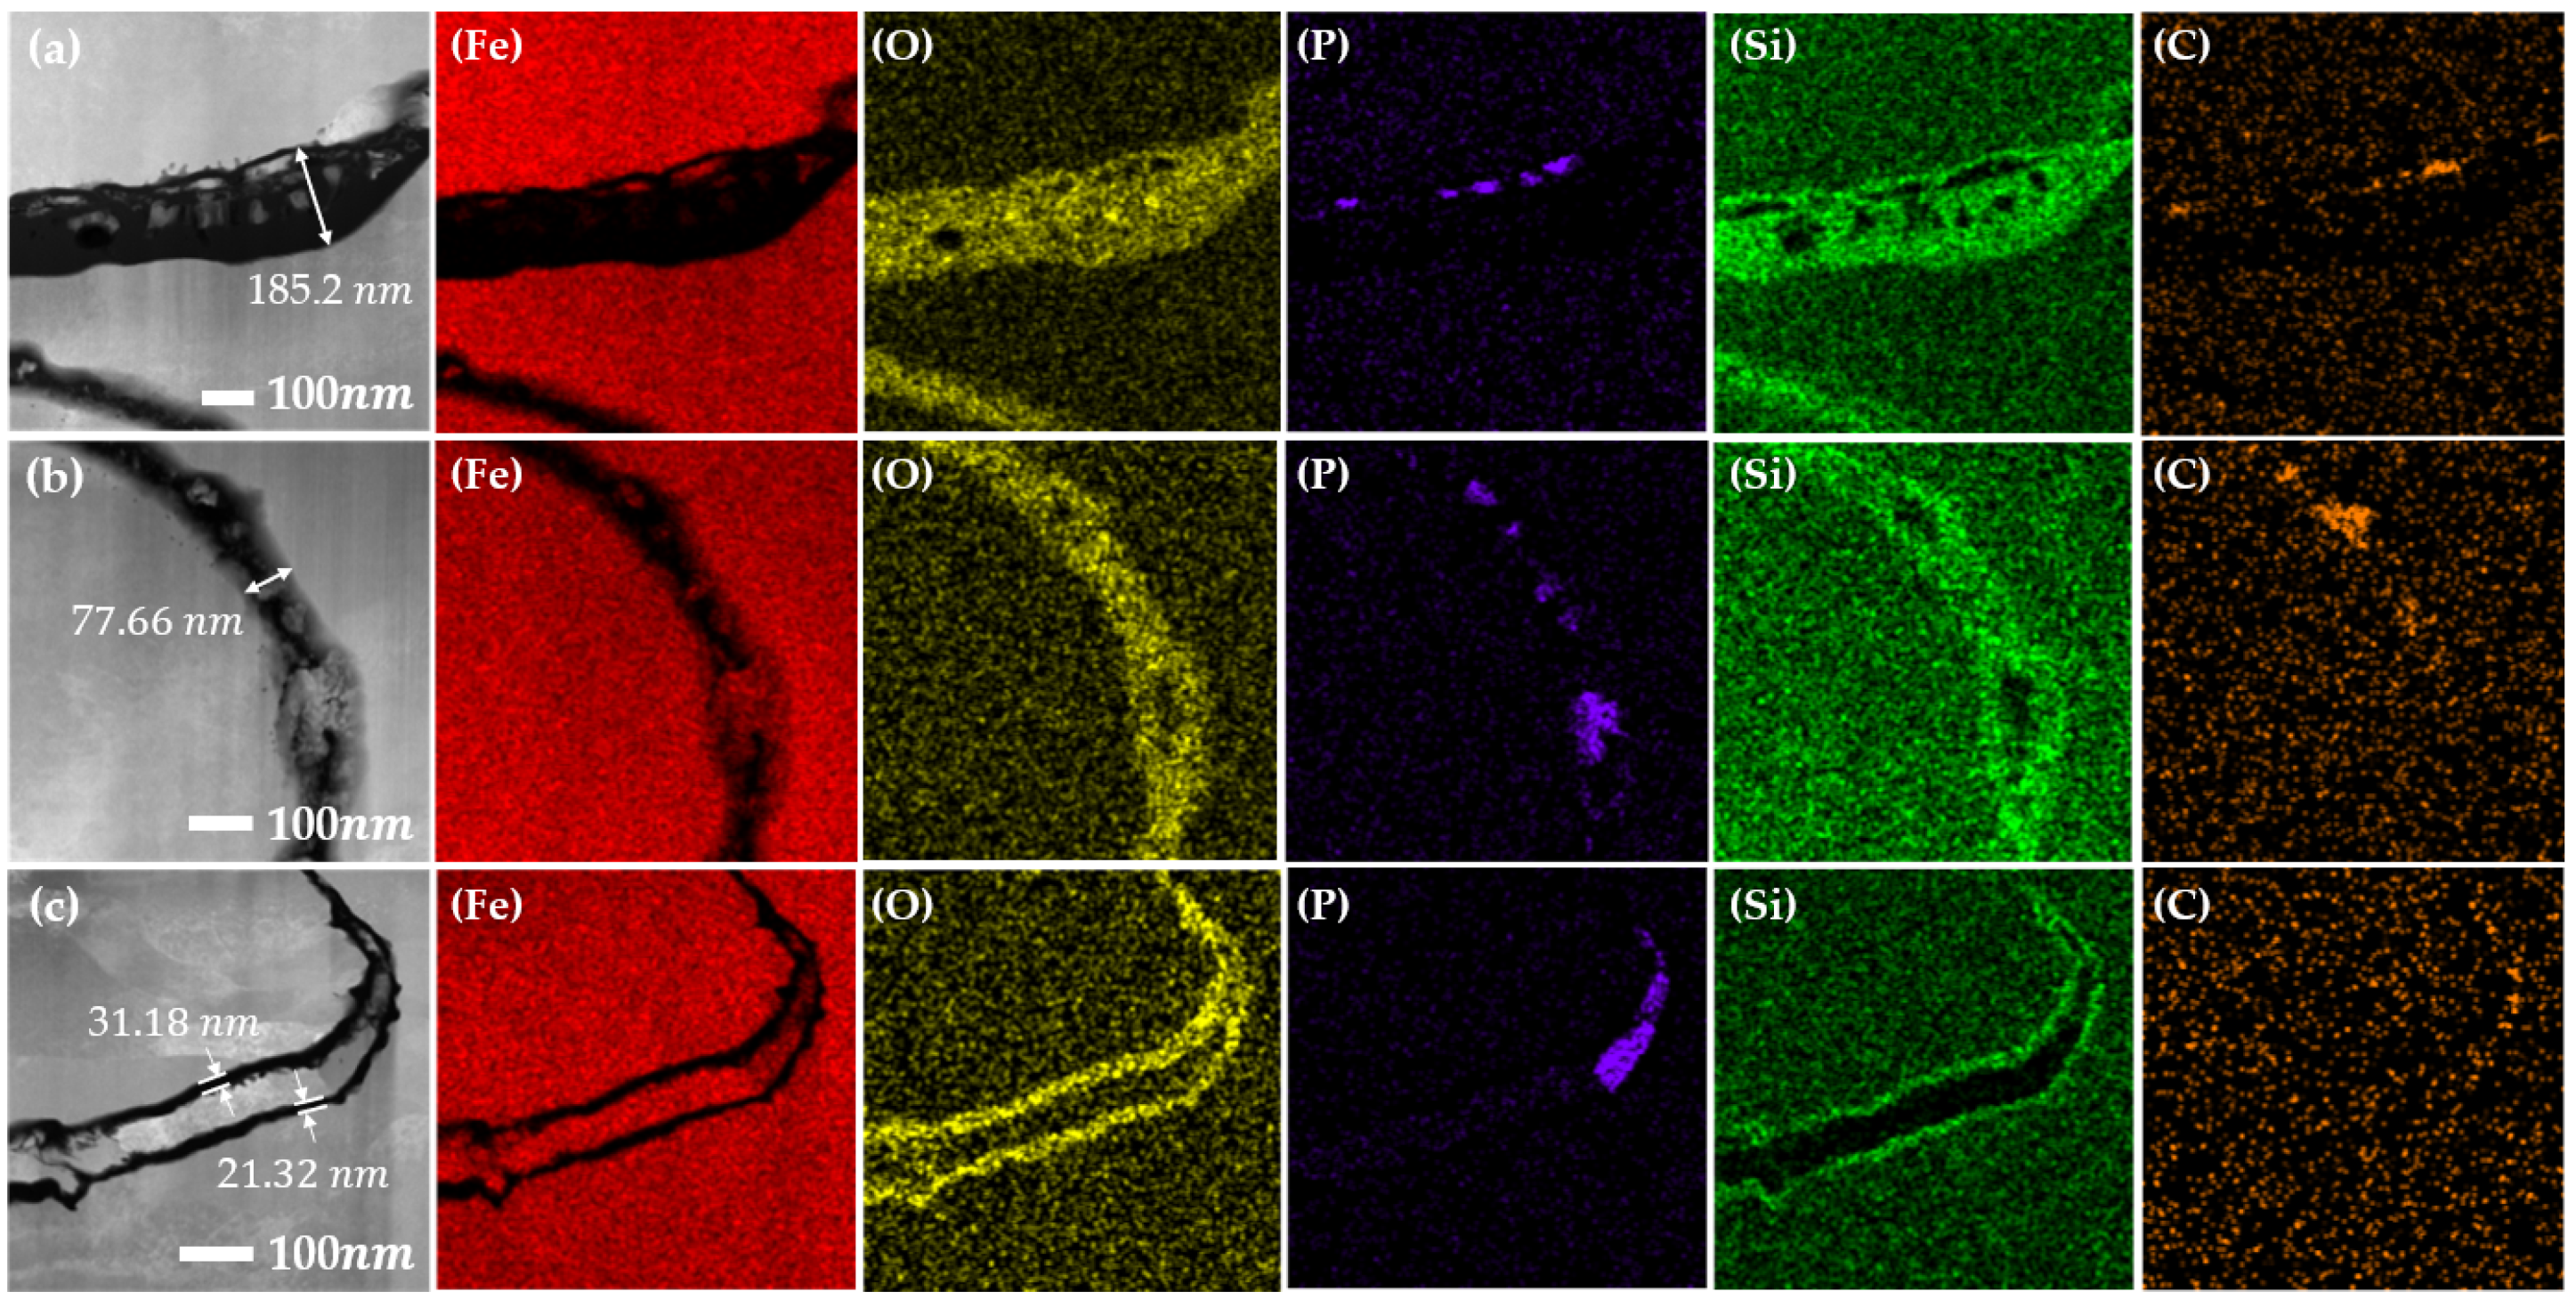
Figure 4 presents TEM micrographs of the Fe-5.0 wt.%Si SMCs together with EDS elemental maps for Fe, O, P, Si, and C. The analysis shows that the interparticle boundaries consisted mainly of a Si-O-based amorphous layer, continuously formed between adjacent Fe particles. Within this interfacial layer, signals of phosphorus (P) and carbon (C) were also identified, indicating that these species were incorporated into the boundary structure alongside Si and O.
A closer examination of three representative regions (Figure 5a–c) further detailed the interfacial features. In region (a), the layer thickness reached ~185.2 nm, with Si and O as the dominant elements, while P and C were also distributed across the boundary. In region (b), the interface was thinner (~77.7 nm) and still primarily composed of Si-O, but P and C were again detected as part of the layer, sometimes appearing in localized regions. In region (c), a distinct morphology was observed where an Fe particle was embedded between the interfacial layers; nonetheless, the boundary still displayed a clear Si-O distribution, with P and C present particularly near the triple junctions of particles.
Overall, the TEM/EDS analysis demonstrates that the insulating layers in the Fe-5.0 wt.%Si SMCs contain a Si-O-based amorphous matrix with the additional presence of P and C, which were incorporated into the interfacial structure under the studied composition (H3PO4 0.25 wt.%, PI 0.25 wt.%). These findings highlight the composite nature of the boundary layers, in which Si-O provides the main framework, while phosphorus- and carbon-containing species are also integrated depending on the additive content.

3.3. Effect of Additive Content on Density of Fe-5.0 wt.%Si SMCs

Figure 6 shows the changes in specimen density according to variations in H3PO4 and PI content when 0.3 wt.% graphite was added as a lubricant.
As seen in Figure 6a, the average density continuously decreased as the H3PO4 content increased. For example, under the condition of 0.25 wt.% PI, increasing the H3PO4 content from 0.25 wt.% to 1.25 wt.% caused the density to drop from 7.496 g/cm3 to 7.354 g/cm3, a decrease of about 0.14 g/cm3 (≈1.9%). A similar trend was observed at 0.75 wt.% PI, where the density decreased from 7.339 g/cm3 to 7.274 g/cm3, approximately 0.065 g/cm3 (≈0.9%). According to previous studies, the thickness of the phosphate film formed on the powder surface increases as the amount of added phosphate increases [43]. Therefore, this density reduction aligns with the result that the actual metal-to-metal contact area between particles decreases as the phosphate coating layer thickens. In other words, while increasing H3PO4 positively affects insulation performance, it negatively impacts forming density, as quantitatively confirmed here [40].
Figure 6b also illustrates the density changes with varying PI content while keeping the H3PO4 content constant. Across all H3PO4 conditions, an increase in PI content consistently led to a decrease in density [36]. For instance, at 0.25 wt.% H3PO4, increasing PI from 0.25 wt.% to 0.75 wt.% reduced the density from 7.496 g/cm3 to 7.339 g/cm3, a drop of about 0.16 g/cm3 (≈2.1%). Similarly, at 0.75 wt.% H3PO4, the density dropped from 7.418 g/cm3 to 7.278 g/cm3, a decrease of roughly 0.14 g/cm3 (≈1.9%). This is interpreted as a small amount of PI initially filling fine gaps to promote higher density, but beyond a certain level, the increased thickness of the insulating layer blocks metal contact and increases residual porosity [40].
The type and content of lubricants also had a clear impact on the density of the specimens. In the case of MoS2, as the content increased from 0.75 wt.% to 1.25 wt.%, the density tended to decrease under all conditions. Under the conditions of H3PO4 0.25 wt.% + PI 0.25 wt.% in Figure 7a, the density decreased by approximately 0.4%, from 7.401 g/cm3 to 7.372 g/cm3. In the case of H3PO4 0.75 wt.% + PI 0.75 wt.% in Figure 7b, the density decreased from 7.221 g/cm3 to 7.205 g/cm3. Graphite showed a similar trend, with density decreasing on average by 0.03 to 0.07 g/cm3 as the content increased from 0.3 wt.% to 0.5 wt.%. Notably, in most combinations, graphite at 0.3 wt.% exhibited the highest density (e.g., 7.496 g/cm3 under H3PO4 0.25 wt.%, PI 0.25 wt.% conditions), which is approximately 0.095 g/cm3 (≈1.3%) higher than the density of MoS2 at 0.75 wt.%. On the other hand, in combinations with relatively high contents of H3PO4 and PI, the density differences according to the type and amount of lubricant were reduced. Under the conditions of H3PO4 1.25 wt.% + PI 0.75 wt.% shown in Figure 7c, the difference between graphite 0.3 wt.% (7.274 g/cm3) and MoS2 0.75 wt.% (7.273 g/cm3) was practically negligible. These results suggest that while lubricants provide positive effects by reducing mold friction during forming and aiding powder rearrangement, excessive addition can block direct metal-to-metal contact and occupy volume with non-magnetic phases, thereby hindering density. Therefore, although lubricants are essential for forming stability and tool life, the optimal combination for density optimization is judged to be approximately 0.75 wt.% for MoS2 and 0.3 wt.% for graphite.
Figure 8 presents a 3D graph illustrating the interaction effects of H3PO4, PI, and lubricant content changes on specimen density. As shown in the graph, overall density variations were more strongly influenced by the contents of H3PO4 and PI than by the lubricant. Density sharply decreased as both H3PO4 and PI contents increased simultaneously, indicating that the reduction in metal contact area due to increased insulating layer thickness directly leads to decreased formability. In contrast, increasing lubricant content caused a slight decrease in density across all ranges, but the magnitude of this effect was relatively small. Especially under conditions where H3PO4 and PI were added at high concentrations, differences in lubricant type or content had minimal impact on density.
Additionally, graphite consistently exhibited higher density than MoS2 under all conditions. This trend persisted even when H3PO4 and PI contents were increased, and although the difference between graphite and MoS2 narrowed when both insulators were added at high concentrations, graphite still tended to outperform MoS2.
Therefore, as shown in Figure 8, for optimal density, it is important to first establish a low-content combination of H3PO4 and PI, and to use lubricant at approximately 0.3 wt.% graphite for the most effective results. Ultimately, the dominant factors affecting density are the insulating additives (H3PO4, PI), with lubricants playing a supplementary role. Under the same conditions, it is clearly demonstrated that graphite provides superior density characteristics compared to MoS2.

3.4. Trend of Changes in Magnetic Properties According to Additive Content

3.4.1. Permeability Trend of Fe-5.0 wt.%Si SMCs

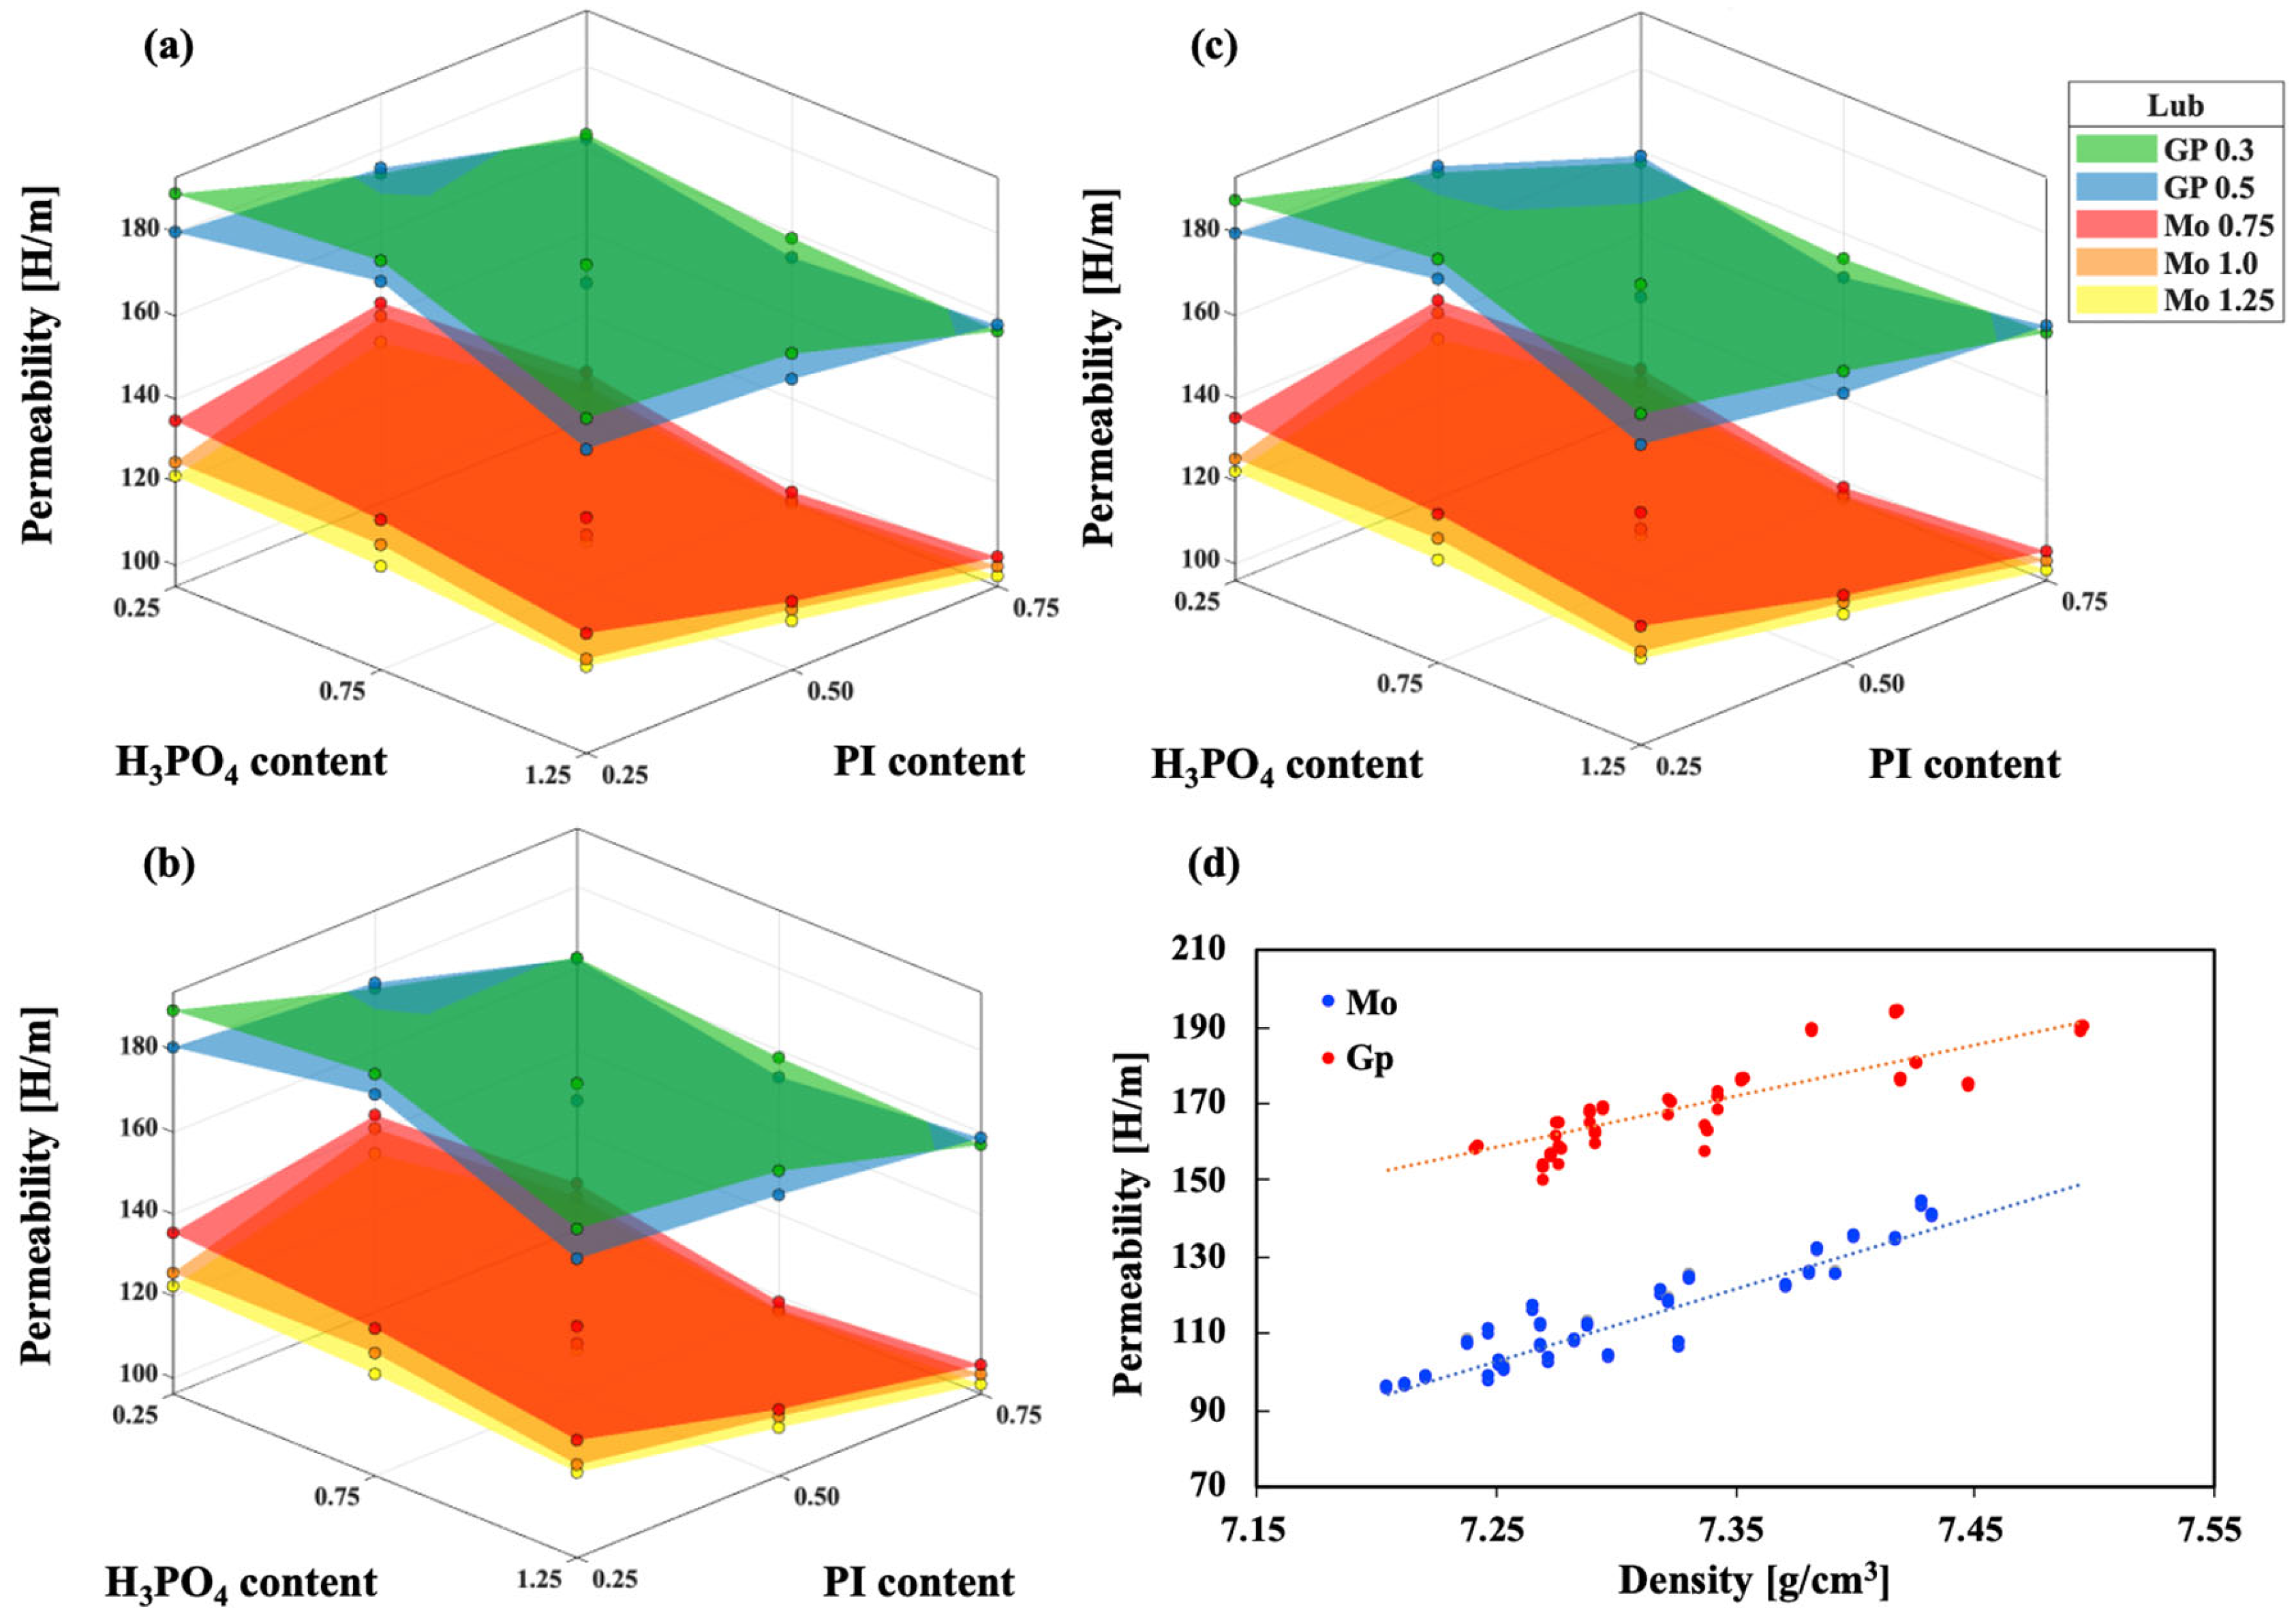
Figure 9 shows the changes in initial permeability according to the combinations of H3PO4, PI, and lubricants at different frequencies. Overall, the initial permeability tended to continuously decrease as the contents of H3PO4 and PI increased. For example, under the condition of 0.3 wt.% graphite, the sample with H3PO4 0.25 wt.% + PI 0.25 wt.% exhibited the highest permeability value of 189.4 at 1 kHz, whereas under the H3PO4 1.25 wt.% + PI 0.75 wt.% condition, it decreased by about 17% to 156.3. This reduction is not simply due to a decrease in density; rather, as the thickness of the insulating layer increases, the direct magnetic path between metal particles is blocked, and magnetic domain wall movement is suppressed, leading to a decline in initial permeability. These results align with previous studies [25] that indicate while insulating layers are beneficial for suppressing eddy current losses, they adversely affect permeability.
Regarding lubricants, both MoS2 and graphite showed a slight decrease in permeability as their content increased, which is attributed to the increase in non-magnetic phases that disrupt continuous magnetic flux paths between metals. However, when comparing the two lubricants, graphite exhibited higher permeability than MoS2 across all ranges. For instance, under the H3PO4 0.75 wt.% + PI 0.25 wt.% condition, the sample with 0.75 wt.% MoS2 remained around 131.0, whereas the sample with 0.3 wt.% graphite under the same condition recorded a value of 193.4, approximately 47% higher. This is interpreted as graphite, when added in small amounts, inducing particle rearrangement and contact stabilization, complementing magnetic flux paths between metals, while MoS2, due to its layered structure, is effective for friction reduction but has limited effect on securing magnetic paths. However, even graphite showed about a 5% average decrease in permeability when its content increased from 0.3 wt.% to 0.5 wt.%, likely because excessive addition increases the volume of non-magnetic phases, which instead blocks metal contacts.
Additionally, as frequency increased (from 1 kHz to 10 kHz), permeability showed a gradual decreasing trend under all conditions, but graphite-containing samples maintained higher permeability and more stable frequency dependence compared to MoS2 across the entire range. This trend is clearly visible in the 3D graphs in Figure 10a-c (comparing 1 kHz, 5 kHz, and 10 kHz), where the graphite condition sustains high permeability levels despite increasing frequency, whereas the MoS2 condition remains relatively flat at lower values.
Furthermore, Figure 10d shows a density–permeability scatter plot confirming the correlation between these two properties. A clear positive correlation is observed, with higher density corresponding to higher permeability. Samples with 0.3 wt.% graphite are generally distributed in the “high density–high permeability” region. In contrast, MoS2-containing samples show lower permeability even at the same density level, clearly highlighting the difference in magnetic path formation capability depending on the type of lubricant.
Therefore, the results in Figure 9 and Figure 10 suggest that to secure high permeability, a low-content combination of H3PO4 and PI is preferable, and the optimal lubricant condition is around 0.3 wt.% graphite. In other words, increasing the thickness of the insulating layer is beneficial for loss suppression but detrimental to permeability, and since lubricants are inherently non-magnetic, excessive addition is disadvantageous. However, graphite can improve density and permeability only within a limited content range.

3.4.2. Q-Value Trend of Fe-5.0 wt.%Si SMCs

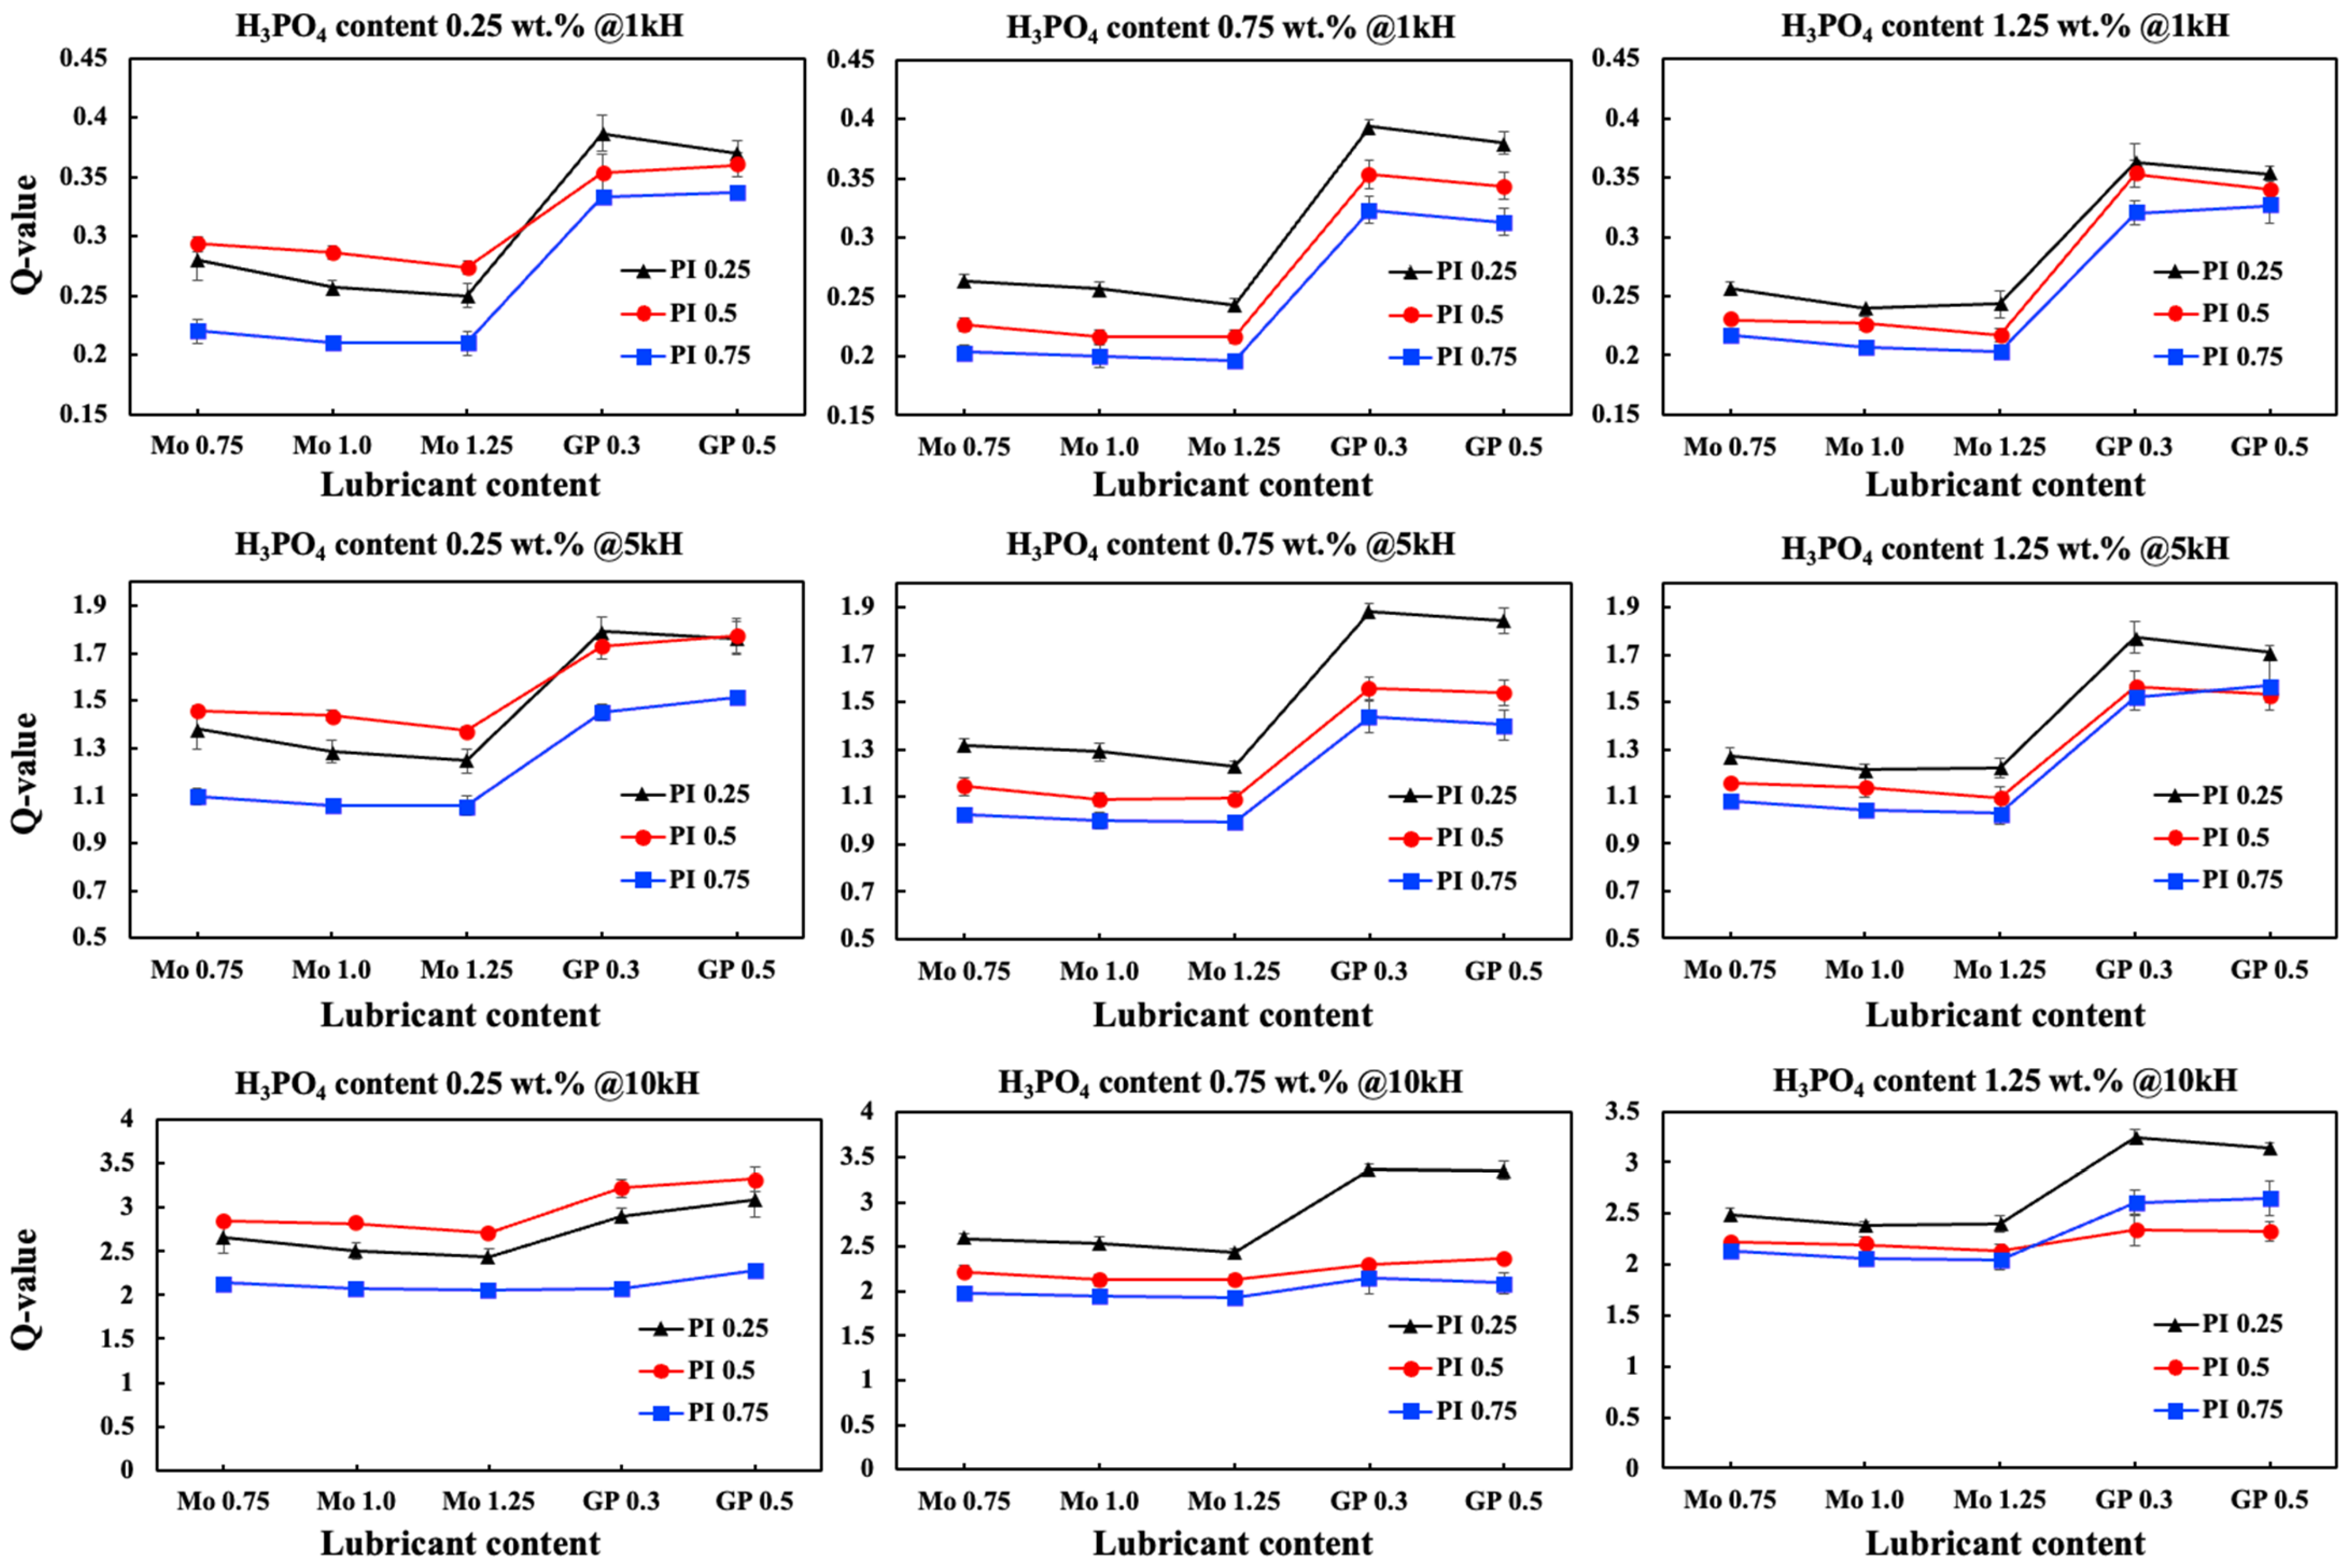
Figure 11 presents the variations in Q-value with respect to H3PO4, PI, and lubricant contents at different frequencies. In general, the Q-value was the lowest at a low frequency (1 kHz), but increased markedly at 5 kHz and 10 kHz. In the H3PO4 0.25 wt.% + PI 0.25 wt.% + graphite 0.3 wt.% condition, the Q-value increased from 0.39 at 1 kHz to 2.91 at 10 kHz. This trend can be attributed to the fact that, as frequency increases, the suppression of eddy current losses becomes more effective and the loss tangent (tan δ ) decreases accordingly.
The effect of H3PO4 and PI contents on the Q-value exhibited an opposite trend compared with permeability. At 1 kHz and 5 kHz, an increase in H3PO4 and PI did not necessarily lead to a higher Q-value, and in some cases, the values stagnated or slightly decreased. For instance, under the graphite 0.3 wt.% condition, the Q-value of the H3PO4 0.25 wt.% + PI 0.25 wt.% sample was 0.39 at 1 kHz, but decreased to 0.33 when the PI content was increased to 0.75 wt.%. This indicates that, at a low frequency where hysteresis loss is dominant, the reduction in permeability caused by a thicker insulating layer had a stronger influence. In contrast, at 10 kHz, the insulating effect became more pronounced, leading to a relatively stable or slightly increasing Q-value even under high-H3PO4 and -PI conditions. Under the same graphite 0.3 wt.% condition, the Q-value of the H3PO4 0.25 wt.% + PI 0.25 wt.% sample was 2.91, while the H3PO4 1.25 wt.% + PI 0.75 wt.% sample maintained a value of 2.61. This suggests that although thicker insulating layers are unfavorable for permeability, the enhancement in electrical resistivity effectively suppressed eddy current losses, resulting in stable Q-values at a high frequency.
When comparing the relative influences of H3PO4 and PI, the increase in PI content had a more significant effect on reducing Q-value. For instance, under the graphite 0.3 wt.% condition, the Q-value of the H3PO4 0.25 wt.% + PI 0.25 wt.% sample at 10 kHz was 2.91, but decreased to 2.08 when PI was increased to 0.75 wt.%. In contrast, when H3PO4 was increased from 0.25 wt.% to 1.25 wt.% under the same condition, the Q-value only decreased from 2.91 to 2.61. This indicates that, while H3PO4 contributes to suppressing eddy current losses through thicker insulating layers and causes only limited reduction in the Q-value, PI reduces the effective permeability more directly by increasing the volume fraction of the non-magnetic polymer, leading to a stronger decrease in the Q-value.
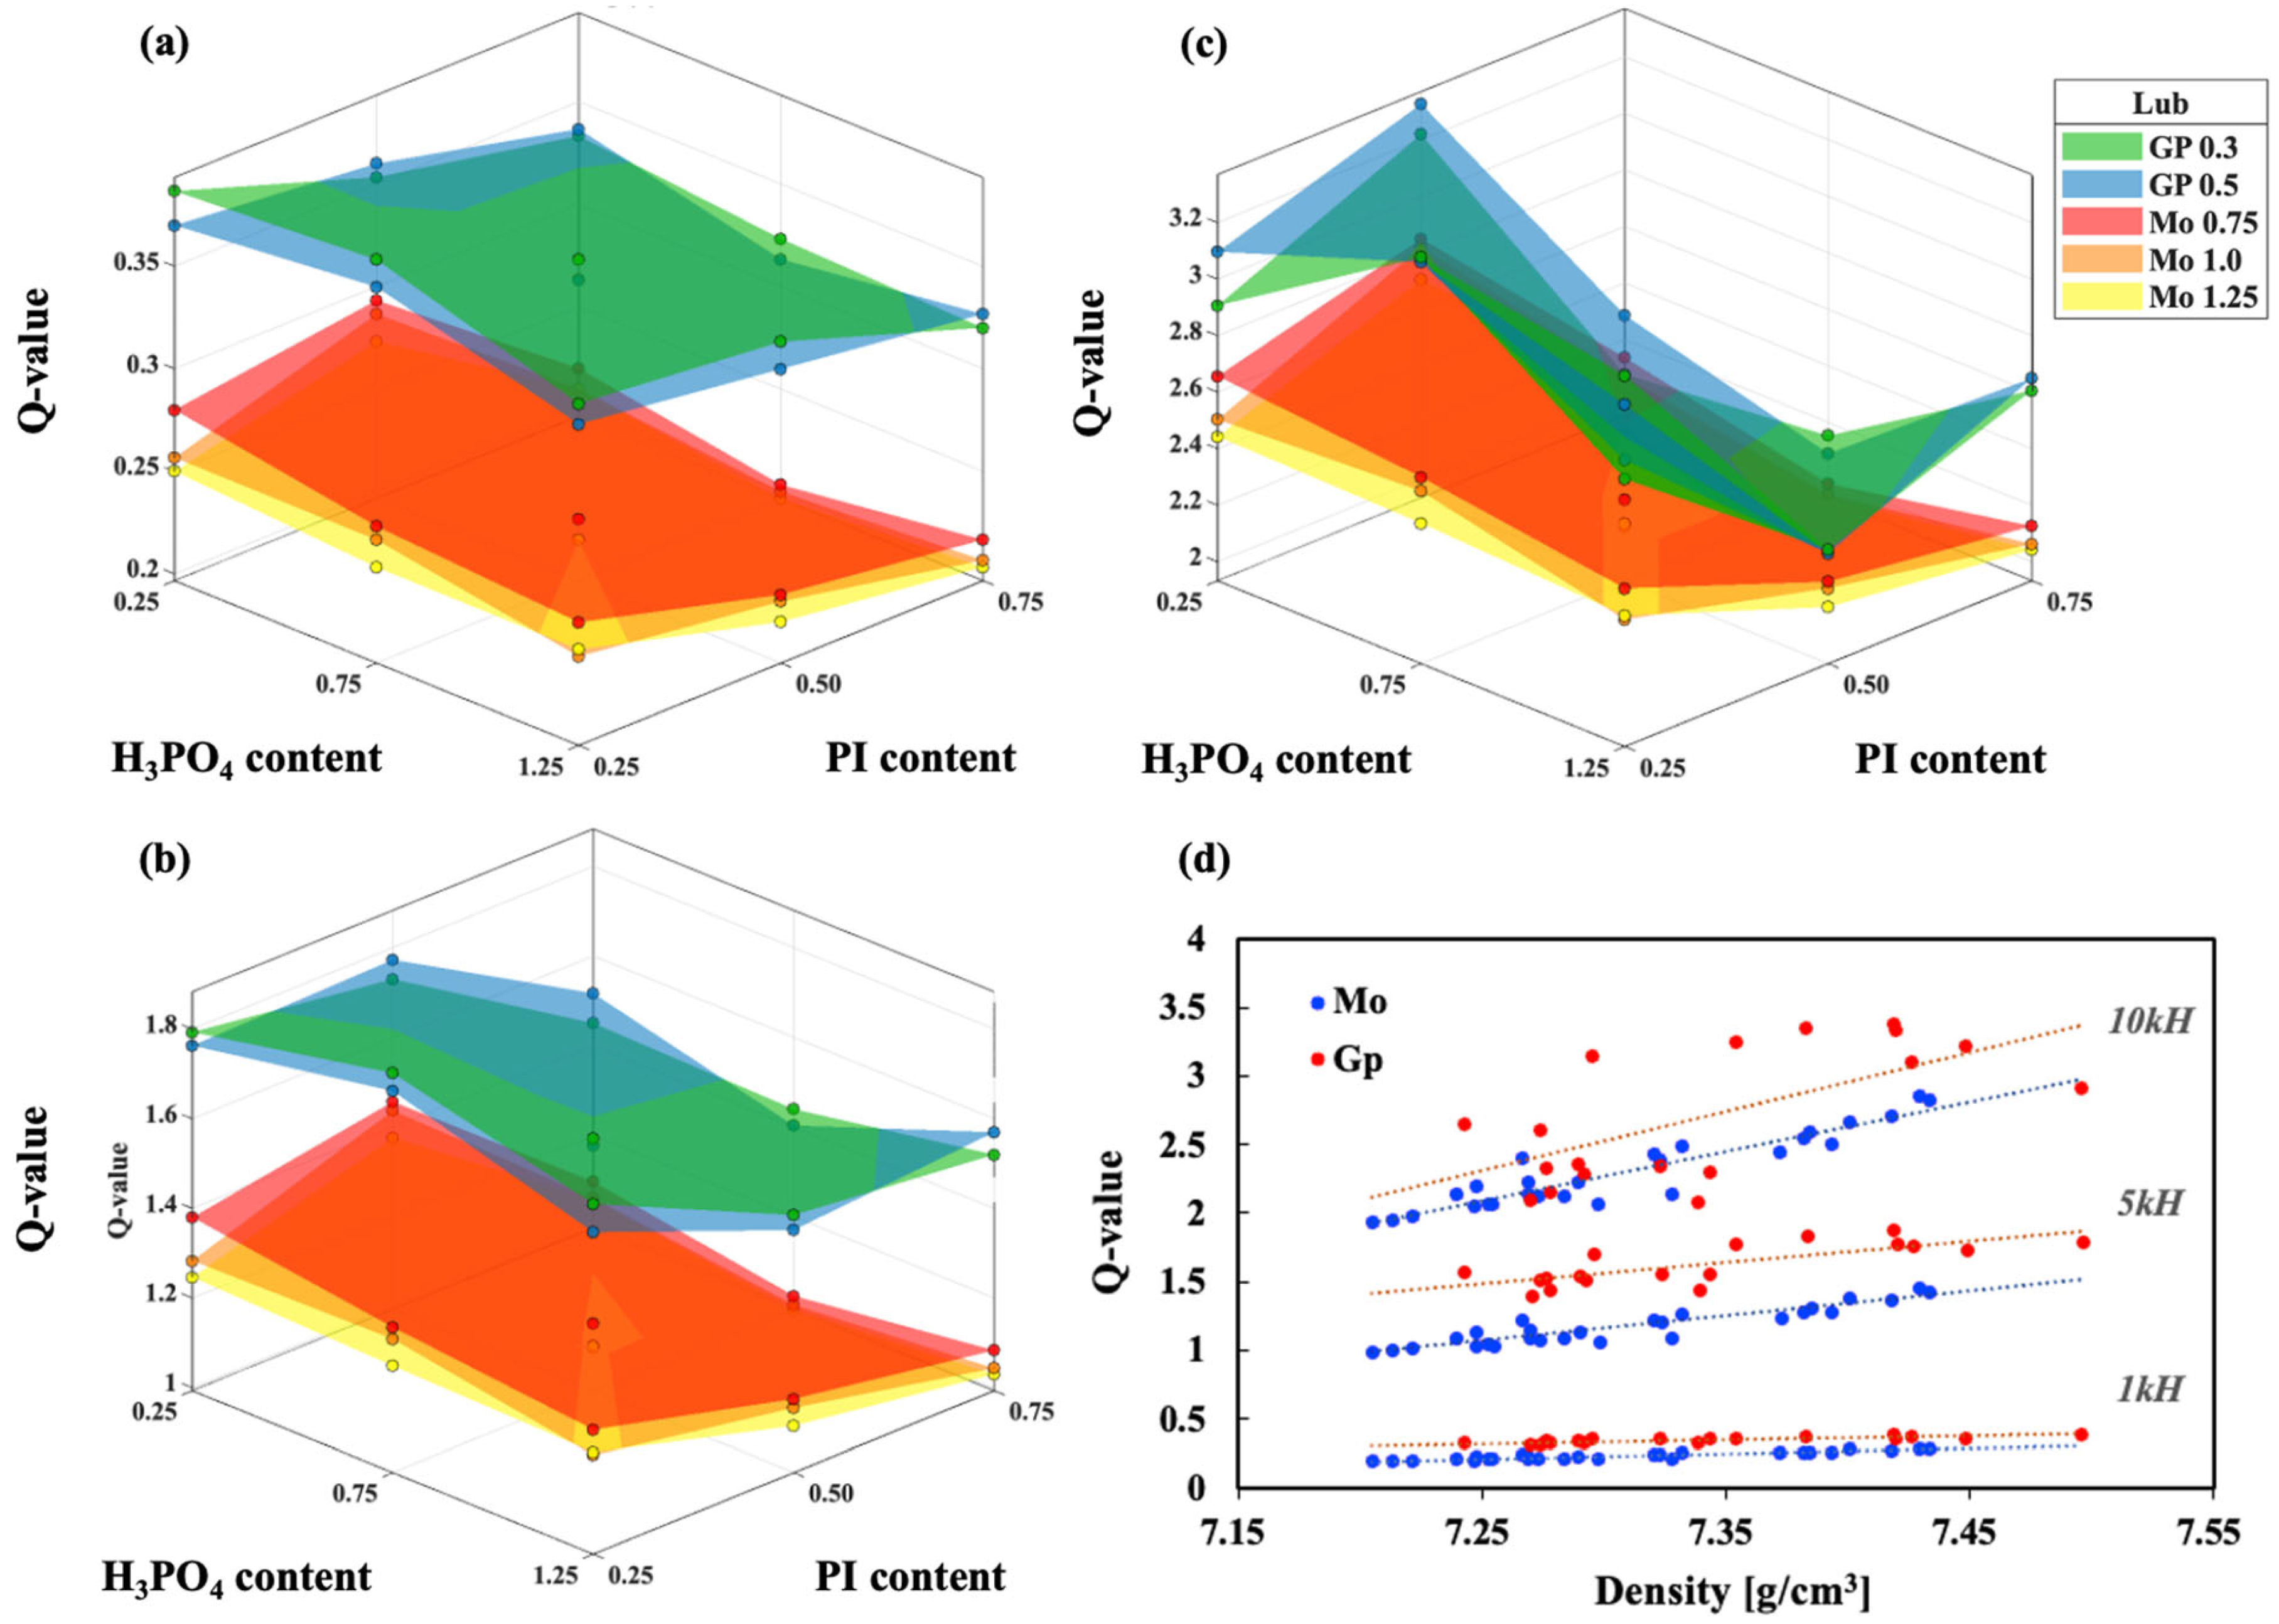
The effect of lubricants is illustrated more clearly in Figure 12. Both MoS2 and graphite showed slight decreases in the Q-value with increasing content, but the graphite-containing samples consistently exhibited higher Q-values than the MoS2-containing samples across all conditions. For example, under the H3PO4 0.75 wt.% + PI 0.25 wt.% condition, the Q-value of the MoS2 0.75 wt.% sample was 3.37 (10 kHz), while the graphite 0.3 wt.% sample recorded a similar level at 10 kHz but consistently higher values at 1 kHz and 5 kHz. This suggests that graphite, at small additions, promotes particle rearrangement and densification, thereby enhancing not only permeability but also insulation. However, when the graphite content increased from 0.3 wt.% to 0.5 wt.%, the Q-value slightly decreased, which can be explained by the formation of conductive paths that deteriorated insulation performance. In Figure 12a–c, this trend is clearly observed, where graphite-containing conditions (green and blue) show higher Q-values than MoS2-containing conditions (red, orange, and yellow), and the difference becomes more pronounced at higher frequencies (10 kHz) than at lower frequencies (1 kHz).
The correlation between density and Q-value is presented in Figure 12d. As density increased, Q-values also increased overall, and the graphite-containing samples consistently recorded higher Q-values than the MoS2-containing samples at the same density. This demonstrates that graphite not only contributes to densification but also ensures insulation and the continuity of magnetic paths at the same density level.
It should be noted that the Q-value, defined as Q = ω L / R or Q = 1 / tan δ , is a relative index. Therefore, the frequency dependence rather than the absolute value is of greater significance. In this study, the distinct increase in Q-value with frequency indicates that the insulating layer effectively suppressed eddy current losses in the high-frequency region, serving as a useful criterion for evaluating the insulation performance of additive combinations.
Accordingly, the results of Figure 11 and Figure 12 demonstrate that, unlike permeability, the key factor in ensuring a high Q-value is the establishment of effective insulation. In other words, while permeability is directly proportional to density, the Q-value is governed by insulation and loss suppression. Thus, securing an appropriate level of H3PO4 and PI contents and maintaining the lubricant level at graphite 0.3 wt.% is the most effective combination.

4. Conclusions

The present study systematically investigated the effects of H3PO4, polyimide, and lubricants (MoS2, graphite) on the phase stability, microstructure, and magnetic performance of Fe-5.0 wt.%Si soft magnetic composites. XRD confirmed that all specimens maintained a stable α-Fe(Si) phase, with no detectable secondary phases under the applied compaction (≤550 °C) and annealing (700 °C) conditions. SEM and TEM–EDS analyses revealed continuous interfacial insulating layers primarily composed of Si-O, with phosphorus and carbon also incorporated in localized regions, supporting both insulation and structural integrity.
Magnetic and physical properties were strongly governed by the type and amount of additives incorporated into the Fe-5.0 wt.%Si SMCs. Increasing H3PO4 and PI contents resulted in a progressive decrease in both density and permeability: for example, the density decreased from 7.50 g/cm3 at H3PO4 0.25 wt.% + PI 0.25 wt.% to 7.27 g/cm3 at H3PO4 1.25 wt.% + PI 0.75 wt.%, while the permeability at 1 kHz decreased from 189.4 to 156.3 (−17%). These trends can be attributed to the formation of thicker insulating layers that reduced effective metallic contact, limited plastic deformation during compaction, and interrupted continuous magnetic pathways, thereby suppressing domain wall motion. In contrast, the quality factor (Q-value) exhibited an opposite trend. Although low frequency values were less sensitive to additive content, Q-values increased significantly with frequency. For instance, under H3PO4 0.25 wt.% + PI 0.25 wt.% + graphite 0.3 wt.% conditions, the Q-value rose from 0.39 at 1 kHz to 2.91 at 10 kHz, indicating effective suppression of eddy current losses by resistive interparticle films.
Lubricant type and level exerted a secondary but consistent effect. MoS2 led to lower density (7.21–7.43 g/cm3) and permeability (95–143 at 1 kHz) across all conditions, reflecting its limited role in particle rearrangement and magnetic connectivity. In contrast, graphite additions enhanced packing and interparticle bonding, yielding superior density (up to 7.50 g/cm3), higher permeability (up to 193 at 1 kHz), and consistently higher Q-values. Among the tested conditions, 0.3 wt.% graphite provided the most favorable balance, combining high permeability in the low-frequency regime with stable Q-value retention at higher frequencies.
Overall, the results demonstrate that the performance of Fe-5.0 wt.%Si is governed not by bulk phase changes but by the trade-off between densification and insulation at particle interfaces. The optimal combination was identified as low MoS2 and PI contents with 0.3 wt.% graphite, providing a practical guideline for tailoring additive formulations toward high-frequency, high-efficiency motor applications.

Supplementary Materials

The following supporting information can be downloaded at: https://www.mdpi.com/article/10.3390/met15111247/s1, Table S1: measurement result of density, permeability, and Q-value at 1, 5, and 10 kHz.

Author Contributions

Conceptualization, S.L.; methodology, S.K. and S.L.; validation, S.K. and S.L.; formal analysis, S.L.; investigation, S.K.; software S.K.; data analysis, S.K. and S.L.; data curation, S.K.; writing—original draft preparation, S.K.; writing—review and editing, S.L.; supervision, S.L.; project administration, S.L. All authors have read and agreed to the published version of the manuscript.

Funding

This research received no external funding.

Institutional Review Board Statement

Not applicable.

Informed Consent Statement

Not applicable.

Data Availability Statement

The original contributions presented in this study are included in the article/Supplementary Materials; further inquiries can be directed to the corresponding author.

Conflicts of Interest

The authors declare no conflicts of interest.

References

  1. IEA. Global EV Outlook 2025; IEA: Paris, France, 2025; Available online: https://www.iea.org/reports/global-ev-outlook-2025 (accessed on 23 September 2025).
  2. De Palma, A.; Lindsey, R.; Riou, Y. Meeting the European Union’s zero-CO2-emissions target for cars in France. Transp. Res. Part A Policy Pract. 2025, 199, 104531. [Google Scholar] [CrossRef]
  3. Birel, T.; Breeman, G.; van Buitenen, A.; Vijver, M. Defueling the impasse: EU political discourse on e-fuels. Energy Policy 2024, 187, 114022. [Google Scholar] [CrossRef]
  4. Zeyen, E.; Kalweit, S.; Victoria, M.; Brown, T. Shifting burdens: How delayed decarbonisation of road transport affects other sectoral emission reductions. Environ. Res. Lett. 2025, 20, 044044. [Google Scholar] [CrossRef]
  5. Guo, Y.; Ba, X.; Liu, L.; Lu, H.; Lei, G.; Yin, W.; Zhu, J. A review of electric motors with soft magnetic composite cores for electric drives. Energies 2023, 16, 2053. [Google Scholar] [CrossRef]
  6. Guo, Y.; Liu, L.; Ba, X.; Lu, H.; Lei, G.; Yin, W.; Zhu, J. Designing high-power-density electric motors for electric vehicles with advanced magnetic materials. World Electr. Veh. J. 2023, 14, 114. [Google Scholar] [CrossRef]
  7. He, J.; Yuan, H.; Nie, M.; Guo, H.; Yu, H.; Liu, Z.; Sun, R. Soft magnetic materials for power inductors: State of art and future development. Mater. Today Electron. 2023, 6, 100066. [Google Scholar] [CrossRef]
  8. Ferraris, L.; Franchini, F.; Pošković, E.; Grande, M.A.; Bidulský, R. Effect of the temperature on the magnetic and energetic properties of soft magnetic composite materials. Energies 2021, 14, 4400. [Google Scholar] [CrossRef]
  9. Kumar, M.; Kant, R.; Chand, S.; Prakash, U.; Sehgal, S.; Saxena, K.K.; Davim, J.P.; Prakash, C. High-temperature corrosion performance of FeAl-based alloys containing carbon in molten salt. Metals 2021, 11, 2040. [Google Scholar] [CrossRef]
  10. Airiskallio, E.; Nurmi, E.; Heinonen, M.H.; Väyrynen, I.J.; Kokko, K.; Ropo, M.; Punkkinen, M.P.J.; Pitkänen, H.; Alatalo, M.; Kollár, J.; et al. High temperature oxidation of Fe-Al and Fe-Cr-Al alloys: The role of Cr as a chemically active element. Corros. Sci. 2010, 52, 3394–3404. [Google Scholar] [CrossRef]
  11. Li, J.; Qin, C.; Ge, J.; Hu, X.; Zeng, L.; Pei, R. Magnetic behavior of high permeability materials over wide temperature range. AIP Adv. 2025, 15, 035223. [Google Scholar] [CrossRef]
  12. Park, J.-H.; Kim, H.-R.; Lee, J.-W.; Jeong, J.-W. Improved soft magnetic properties in FeNi@MgO composites by sol-gel-based surface coating and high-temperature heat treatment. Metals 2023, 13, 1383. [Google Scholar] [CrossRef]
  13. Liu, J.; Dong, Y.; Jia, X.; Chi, Q.; He, A.; Li, J.; Man, Q.; Shen, B. Effect of FeNi powder on the magnetic properties of FeSiBNbCu nanocrystalline soft magnetic powder cores. J. Mater. Sci. Mater. Electron. 2025, 36, 1699. [Google Scholar] [CrossRef]
  14. Zhou, B.; Yang, Y.; Qin, Y.; Yang, G.; Wu, M. Fabrication of equiatomic FeCo alloy parts with high magnetic properties by fields activated sintering. Manuf. Rev. 2022, 9, 7. [Google Scholar] [CrossRef]
  15. Lee, H.; Park, J.; Lee, H.; Choi-Yim, H. Correlation between soft magnetic properties and microstructure according to heat treatment in FeCo-2V electrical steel. J. Compos. Sci. 2025, 9, 61. [Google Scholar] [CrossRef]
  16. Zhang, L.; Yang, B.; Cao, Y.; Yu, R.H. Preparation and magnetic properties of novel hybrid magnetic powder cores. Mater. Res. Innov. 2014, 18 (Suppl. S4), S4-610–S4-614. [Google Scholar] [CrossRef]
  17. Peng, Y. Effects of Nano-SiO2 on microstructure and magnetic properties of FeSi soft magnetic composites. J. Mater. Sci. Mater. Electron. 2024, 35, 1652. [Google Scholar] [CrossRef]
  18. Lauda, M.; Füzer, J.; Füzerová, J.; Kollár, P.; Strečková, M.; Fáberová, M. Magnetic properties of soft magnetic FeSi composite powder cores. Acta Phys. Pol. A 2014, 126, 144–145. [Google Scholar] [CrossRef]
  19. Backes, C.; Kahlert, M.; Vollmer, M.; Smaga, M.; Niendorf, T.; Beck, T. Microstructure and magnetic domain structure of additively manufactured Fe-Si soft magnetic alloys with 3 and 9 wt.% Si. J. Mater. Res. Technol. 2024, 29, 1691–1702. [Google Scholar] [CrossRef]
  20. Wu, L.; Xia, X.; Yin, W.; Tang, X.; Ju, J.; Du, Y.; Chen, R.; Xu, Z.; Zhang, Y.; Che, S.; et al. Effect of ferromagnetic Fe96.5Si3.5 dopant on microstructure and magnetic properties of hot-deformed Nd-Fe-B magnets. J. Magn. Magn. Mater. 2023, 569, 170433. [Google Scholar] [CrossRef]
  21. Shi, G.; Zang, J.; Chen, R.; Wang, X.; Wang, L.; Wang, M.; Cheng, Y. Differences in the magnetic properties of Finemet/FeSi soft magnetic composites prepared with epoxy resin/nano-oxide composite coating layers. Mater. Today Commun. 2024, 40, 110177. [Google Scholar] [CrossRef]
  22. Zhu, X.; Liu, W.; Ju, J.; Xu, P.; Li, M.; Zhang, X.; Wang, J.; Zou, Z.; Su, H. Hot-compacted Fe-Si soft magnetic composite with low loss at low frequency. J. Mater. Sci. Mater. Electron. 2023, 34, 1523. [Google Scholar] [CrossRef]
  23. Li, K.; Cheng, D.; Yu, H.; Liu, Z. Process optimization and magnetic properties of soft magnetic composite cores based on phosphated and mixed resin coated Fe powders. J. Magn. Magn. Mater. 2020, 501, 166455. [Google Scholar] [CrossRef]
  24. Sun, H.; Zhang, L.; Chen, Y.; Chen, F.; Qu, X.; Xie, C.; Zhang, L. Magnetic properties of iron-based soft magnetic composites prepared by utilizing polyimide insulating layer. J. Magn. Magn. Mater. 2019, 486, 165287. [Google Scholar] [CrossRef]
  25. Chen, Y.; Zhang, L.; Sun, H.; Chen, F.; Zhang, P.; Qu, X.; Fan, E. Enhanced magnetic properties of iron-based soft magnetic composites with phosphate-polyimide insulating layer. J. Alloys Compd. 2020, 813, 152205. [Google Scholar] [CrossRef]
  26. Kang, S.; Lee, S. Optimizing the manufacturing process control of Si-based soft magnetic composites. Materials 2025, 18, 2321. [Google Scholar] [CrossRef]
  27. Lu, D.; Wang, L.; Dong, W.; Chen, C.; Li, Z.; Rehman, S.U.; Zou, H. MoS2 composite FeSiCr soft magnetic alloy materials and their wave-absorbing properties. J. Alloys Compd. 2024, 1010, 177835. [Google Scholar] [CrossRef]
  28. Liu, C.; Yin, Y.; Tong, B.; Zhang, G. Tribological properties of MoS2 powder-lubricated interface. Ind. Lubr. Tribol. 2021, 73, 839–845. [Google Scholar] [CrossRef]
  29. Li, N.; Feng, S.; Kan, X.; Liu, X.; Zhang, C.; Zhu, Y.; Chi, S.; Sun, W. The preparation and magnetic properties of FeSiCr/MoS2 soft magnetic composites. Phys. Scr. 2024, 99, 0659d1. [Google Scholar] [CrossRef]
  30. Kumar, R.; Hussainova, I.; Rahmani, R.; Antonov, M. Solid lubrication at high-temperatures-A review. Materials 2022, 15, 1695. [Google Scholar] [CrossRef]
  31. Hedayati, H.; Mofidi, A.; Al-Fadhli, A.; Aramesh, M. Solid lubricants used in extreme conditions experienced in machining: A comprehensive review of recent developments and applications. Lubricants 2024, 12, 69. [Google Scholar] [CrossRef]
  32. Lapierre-Boire, L.-P.; Blais, C.; Pelletier, S.; Chagnon, F. Improvement of flow of an iron-copper-graphite powder mix through additions of nanoparticles. Powder Technol. 2016, 299, 156–167. [Google Scholar] [CrossRef]
  33. Kang, S.; Lee, S. Formability and electromagnetic performance comparison of Fe-P-based SMC and Fe-5.0 wt.%Si powders. Materials 2025, 18, 4405. [Google Scholar] [CrossRef] [PubMed]
  34. Ulusoy, U. A Review of Particle Shape Effects on Material Properties for Various Engineering Applications: From Macro to Nanoscale. Minerals 2023, 13, 91. [Google Scholar] [CrossRef]
  35. Luo, P.; Yu, H.; Wang, C.; Yuan, H.; Liu, Z.; Wang, Y.; Yang, L.; Wu, W. Properties Optimization of Amorphous Soft Magnetic Composites Based on the Powders with Double Layer Inorganic Coating by Phosphating and Sodium Silicate Treatment. Metals 2023, 13, 560. [Google Scholar] [CrossRef]
  36. Long, H.; Wu, X.; Lu, Y.; Zhang, H.; Hao, J. Effect of Polyimide-Phosphating Double Coating and Annealing on the Magnetic Properties of Fe-Si-Cr SMCs. Materials 2022, 15, 3350. [Google Scholar] [CrossRef]
  37. KS D 0033; Method for Determination of Density of Metal Powder Sintered Materials. Korean Standards Association: Seoul, Republic of Korea, 2021.
  38. Polcarová, M.; Kadečková, S.; Bradler, J.; Godwod, K.; Ba̧k-misiuk, J. Lattice Parameters of Fe-Si Alloy Single Crystals. Phys. Status Solidi A 1988, 106, 17–23. [Google Scholar] [CrossRef]
  39. Ohnuma, I.; Abe, S.; Shimenouchi, S.; Omori, T.; Kainuma, R.; Ishida, K. Experimental and thermodynamic studies of the Fe-Si binary system. ISIJ Int. 2012, 52, 540–548. [Google Scholar] [CrossRef]
  40. Muñoz, Á.S.; Burgos, N.; Zhukova, V.; Talaat, A.; Martín, J.M.; González, J.; Osinalde, M. Magnetic properties and power losses of inorganic, organic and hybrid-based soft magnetic composites. Ceram. Int. 2024, 50, 55099–55112. [Google Scholar] [CrossRef]
  41. Pan, Y.; Peng, J.; Qian, L.; Xiang, Z.; Lu, W. Effects of compaction and heat treatment on the soft magnetic properties of iron-based soft magnetic composites. Mater. Res. Express 2020, 7, 016115. [Google Scholar] [CrossRef]
  42. Wang, J.; Jiang, A.; Li, Y.; Song, D.; Li, Y.; Cheng, L. Thermal Decomposition Behavior of Polyimide Containing Flame Retardant SiO2 and Mg(OH)2. Polymers 2022, 14, 2791. [Google Scholar] [CrossRef]
  43. Hsiang, H.-I.; Fan, L.-F.; Hung, J.-J. Phosphoric acid addition effect on the microstructure and magnetic properties of iron-based soft magnetic composites. J. Magn. Magn. Mater. 2018, 447, 1–8. [Google Scholar] [CrossRef]
Figure 1. Specimen preparation process of H3PO4-PI-Fe-Si toroidal core: (a) H3PO4 coating, (b) PI coating, and (c) lubricant mixing/pressing.
Metals 15 01247 g001
Figure 2. XRD patterns according to additive content.
Metals 15 01247 g002
Figure 3. Cross-sectional morphology of Fe-5.0 wt.%Si specimen after compaction and heat treatment. (a) specimen 1, (b) specimen 2.
Metals 15 01247 g003
Figure 4. TEM-EDS image results of Fe-5.0 wt.%Si specimen.
Metals 15 01247 g004
Figure 5. Detailed region TEM–EDS image results within interface. (a) section (a), (b) section (b), and (c) section (c).
Metals 15 01247 g005
Figure 6. Density results according to H3PO4-PI–graphite 0.3 wt.% composition: according to (a) H3PO4 content (b) PI content.
Metals 15 01247 g006
Figure 7. Density results according to H3PO4-PI-lubricant composition: H3PO4 content (a) 0.25 wt.%, (b) 0.75 wt.%, (c) 1.25 wt.%.
Metals 15 01247 g007
Figure 8. Three-axis plot of density as a function of H3PO4, PI binder content, and lubricant composition.
Metals 15 01247 g008
Figure 9. Permeability results according to H3PO4-PI–lubricant composition.
Metals 15 01247 g009
Figure 10. Three-axis plot of magnetic permeability as a function of H3PO4, PI binder content, and lubricant composition. (a) 1 kHz result, (b) 5 kHz result, (c) 10 kHz result, (d) Density scatter plot.
Metals 15 01247 g010
Figure 11. Q-value results according to H3PO4-PI–lubricant composition.
Metals 15 01247 g011
Figure 12. Three-axis plot of Q-value result as a function of H3PO4, PI binder content, and lubricant composition. (a) 1 kHz result, (b) 5 kHz result, (c) 10 kHz result, (d) Density scatter plot.
Metals 15 01247 g012
Table 1. Fe-5.0 wt.%Si raw powder’s chemical composition and average particle size.
ElementFeSiOAverage Particle Size
wt.%94.855.020.1379.136 μm
Table 2. Design of experiment control factors and levels.
Description
[wt.%]
Level
12345
H3PO40.250.751.25
Polyimide0.250.50.75
LubricantMoS2 0.75MoS2 1.0MoS2 1.25Graphite 0.3Graphite 0.5
Disclaimer/Publisher’s Note: The statements, opinions and data contained in all publications are solely those of the individual author(s) and contributor(s) and not of MDPI and/or the editor(s). MDPI and/or the editor(s) disclaim responsibility for any injury to people or property resulting from any ideas, methods, instructions or products referred to in the content.