Article

A Contribution to the Analysis of the Effects of Pulsed Current in GTAW Welding of 1-mm-Thick AISI 304 Sheets

by
Jair Carlos Dutra
1,
Kaue Correa Riffel
1,*,
Regis Henrique Gonçalves e Silva
1 and
Antonio Jose Ramirez
2
1
Mechanical Engineering Department, Federal University of Santa Catarina, Florianopolis 88040-200, Brazil
2
Materials Science and Welding Department, The Ohio State University, Columbus, OH 43221, USA
*
Author to whom correspondence should be addressed.
Metals 2023, 13(8), 1387; https://doi.org/10.3390/met13081387
Submission received: 22 May 2023 / Revised: 17 July 2023 / Accepted: 28 July 2023 / Published: 1 August 2023
(This article belongs to the Special Issue Welding and Additive Manufacturing of Metallic Materials)

Abstract

:
GTAW welding with pulsed current has been misinterpreted in some of the classic literature and scientific articles. General conclusions are presented, stating that its use provides greater penetration compared to the use of constant current and that the simple pulsation of the current promotes beneficial metallurgical effects. Therefore, this manuscript presents a critical analysis of this topic and adopts the terminology of thermal pulsation for the situation where the weld undergoes sensitive effects, regarding grain orientation during solidification. For comparison purposes, an index called the form factor (ratio between the root width and the face width of the weld bead) is adopted. It is shown that the penetration of a welding with pulsed current can be worse than constant current depending on the formulation of the adopted procedure. Moreover, metallurgical effects on solidification, such as grain orientation breakage, only occur when there is adequate concatenation between the pulsation frequency and the welding speed. Finally, a thermal simulation of the process showed that the pulsation frequency limits the welding speed so that there is an overlap of the molten pool in each current pulse, and continuity of the bead is obtained at the root. For frequencies of 1 Hz and 2.5 Hz, the limit welding speed was 3.3 mm/s and 4.1 mm/s, respectively.

1. Introduction

The use of the pulsed current in GTAW welding has been treated with insufficient scientific and technological bases, to such an extent that the reader deduces from the literature that the adoption of pulsed current is generically the best solution in all cases. Such a conjecture comes mainly from the classic literature such as the Welding Handbook [1] in which a summary of its contents states:
“In pulsed DC welding, the pulse current level is typically set at 2 to 10 times the background current level. This combines the driving, forceful arc characteristic of high current with the low-heat input of low current. The pulse current achieves good fusion and penetration, while the background current maintains the arc and allows the weld area to cool.
There are several advantages of pulsed current. For a given average current level, greater penetration can be obtained than with steady current, which is useful on metals sensitive to heat input and minimizes distortion. Because there is insufficient time for significant heat flow during the short duration of a pulse, metals of dissimilar thicknesses usually respond equally, and equal penetration can be achieved. For a similar reason, very thin metals can be joined with pulsed DC. In addition, one set of welding variables can be used on a joint in all positions, such as a circumferential weld in a horizontal pipe. Pulsed DC is also useful for bridging gaps in open root joints.
Although mostly used for machine and automatic GTAW, pulsing offers advantages for manual welding. In experienced welders find that they can improve their proficiency by counting the pulses (from ½ to 2 pulses per second) and using them to time the movement of the torch and the cold wire. Experienced welders are able to weld thinner materials, dissimilar alloys, and thickness with less difficulty”.
The points mentioned by the Welding Handbook [1] do not contemplate the metallurgical aspects that the other literature also deals with. Kou and Li [2], for example, cite the fragmentation effect of dendrites as a mechanism for grain refinement that can be visualized in welding with pulsed current. The authors attribute this phenomenon to the alternation of the thermal gradient at the solid–liquid interface, promoting new grains to appear with different orientations, resulting in a more refined structure. Grain refinements with pulsed GTAW can also be verified for additive manufacturing [3].
However, the analyses found in many of the works in the literature do not consider that the changes in the properties resulting from the welds were not directly an effect of the pulsing, but a consequence of the fact that pulsing influenced other variables, such as welding energy, for example. Killing [4] presents a temperature-pulsing characteristic (thermal pulsation) concluding that the optimization of the metallurgical effects and operational (control/molten pool stability) depend on the concatenation between pulsation frequency, pulse current, and welding speed. Therefore, the isolated analysis of the pulsed current benefits is not an easy task and needs very well-established criteria in order to avoid attributing the cause of a certain property to a factor not directly linked to the manipulated variables [5]. Another example of this synergistic effect that a change in the characteristics of the GTAW welding technique can produce on the weld bead and its properties is also shown by Riffel et al. [6] and Silva et al. [7].
A number of papers can be cited that contain this problem of analyzing the parameters in an isolated way. In the work of Wang Hou et al. [8] there is a study of the duty cycle effect (pulse time/total period) on the mechanical properties of overlap welds of Invar alloy (Ni and Fe-based alloy). In these experiments, the authors set the pulse current, the base current, the frequency at 10 Hz and the welding speed at 5 mm/s. Then, the authors stipulated “duty cycles” at 30, 40, 50 and 60%, drawing conclusions about the weld geometries, the macro/microstructures and the resulting mechanical properties. Two major issues are identified in this work: the use of a too-high frequency, because the thermodynamics required to obtain certain transformations must obey its own dynamic. When the frequency is too high, everything proceeds as if there were no variation (constant) [9,10]. A clear example is the frequency of electrical energy itself, which at 50 or 60 Hz produces no difference in human perception when it comes to illumination. The second issue is that the change in the “duty cycle” imposes a drastic variation in arc power and, if the welding speed is maintained, a drastic variation in welding energy. Therefore, the conclusions are compromised and it cannot be said that the results are due to the pulsed current or due to the variations in welding power and energy [11]. Trabizi et al. [12] tried to compare the pulsed versus the constant current, but the current amplitude (difference between pulse and background) was 20 A, which cannot provide a great difference in the author’s analysis. Some papers even compare different electrical parameters once analyzing pulsed versus constant current, such as the average current, for example, which leads to hasty conclusions [13,14,15,16].
Another example of analysis inconsistency is the paper of Reddy et al. [17] on welding the aluminum alloy (Al-1.9Li-1.8Cu-0.9Mg-0.10Zr), designated as 1441 alloy (widely used in the aeronautic industry in some countries). In this case, the authors use a thermodynamically compatible frequency (2 Hz), but in order to maintain the energy, different welding speeds are applied, comparing the use of constant current versus the use of pulsed current. This implies an inadequate comparison due to the fact that, in maintaining the frequency, the thermodynamics of the procedure is completely different. A more appropriate comparison criterion would be to proportionally adjust the frequency to the welding speed.
Similarly, Kumar et al. [18] and Yousefieh et al. [19] provide extensive statistical analysis to study the subject, using a wide range of bibliographic references, but they follow the same trend as the analyses of other authors. Moreover, as these authors work with aluminum alloys, it is very likely that they worked with alternating current, but they do not provide information about the waveform, which raises many questions about how the authors interpreted the meaning of pulse and base current, as well as their respective times. In the case of alternating current, it is possible that influences from the vibration of the molten pool, which is an inherent characteristic of this type of current, may affect the continuity of solidification microstructure formation [20,21]. However, the problem remains in the analyses of these authors that comparisons are made at different energies. Also, and with a higher level of relevance, the studies do not consider the issue of the power variation dynamics with welding speed, i.e., how thermodynamics develops. The promising use of the pulsed GTAW and its thermal pulsation effect was shown by Silva et al. [22] in the welding of Ni-based alloys for risers welding, in which a low iron dilution was reached in the welding bead using a frequency of 1.7 Hz.
Given the aforementioned issues, this paper aims to provide a contribution to the study and interpretation of the application of pulsed current in GTAW welding. The scientific hypothesis is that the synergy between the pulsation frequency and the welding speed governs the effect on the grain orientation disruption during the solidification of the weld pool. If this relationship is not respected, the use of pulsed current may not differentiate itself from a constant current or even compromise the quality of the welded joint. To support that, experimental results are presented, seeking to demonstrate the fundamentals of the pulsation action on the aspects of weld geometry and its influence on macro- and microstructures. In addition, a numerical approach is presented through finite element method (FEM) simulation to support the empirical results, making a correlation between welding speed and pulsation frequency, to maintain the continuity of the bead.

2. The Rectangular Pulsed Current and the Correlation between Pulse Frequency and Welding Speed

The operating basis of a pulsed current, as shown in Figure 1, is the production of weld spots that must intersect to continue the bead. The spots are the same size as the molten pool during the pulse period. Therefore, the pulsation frequency must maintain a close correlation with the welding speed and the dimensions of the spot produced from the electrical variables of the procedure.
From the dimensions of the spot produced as a result of the electrical variables, the analysis of the dependence on welding speed and frequency/period can be deduced based on the schematic in Figure 2, assuming circular weld spots with a diameter “L” and an overlap “S” that ensures continuity of the weld bead. As an indicative value, the overlap length can be half the diameter of the molten pool (S = 50%).
Mathematically, the length of the weld bead (C1), consisting of only two spots, can be represented by Equation (1). For a third molten pool, the length (C2) can then be described by Equation (2), which allows establishing that, for n periods, the general expression for the length (C3) of the bead will be given by Equation (3).
C1 = L + (LS)
C2 = L + (LS) + (LS) = L + 2·(LS)
C3 = L + (n − 1)·(LS)
Given the length of the bead and the time elapsed for its welding, it is possible to calculate the welding speed (Ws), which can be expressed by Equation (4):
W s = C 3 n t
where C is the length of the weld bead and n is the number of periods T, corresponding to each weld point. Combining Equation (4) with Equation (3), we obtain Equations (5) and (6).
W s = n L n 1 S n t = n L n S + S n t = L t S t S n t = 1 t L S + S n
W s = 1 t L S 1 1 n
As n grows without bound, the term ( 1 1 n ) tends to 1, and the welding speed equation can be simplified to Equation (7).
W s = L S T

3. Experimental Procedure

The material used for testing had a purely didactic character, consisting of AISI 304 stainless steel plates with a thickness of 1.0 mm, 100 mm in width and 100 mm in length. This material is not highly influenced by its microstructure characteristics in relation to its mechanical properties. Nevertheless, this material shows good sensitivity to thermal cycles from pulsed current, producing differentiated crystalline structures. The selected joint was a butt joint without any gap between the edges, and the plates were fixed in such a way as to avoid significant variations in the arc length. Pure argon was used for both shielding and purging gas. The welding was autogenous in the flat position, with full penetration and the torch in the vertical position. A 2.4 mm EWTh-2 electrode with a 30-degree bevel angle was used. The distance between the electrode and the workpiece for all tests was 1 mm. The ratio between the “Root Width—RW” (width of the weld at the top of the joint) and the “Face Width—FW” (width of the weld at the root) was used to characterize the geometric differences of the various welding situations. The average current used to compare constant current with pulsed current was 30 A, which, for full penetration, required a welding speed of 2.5 mm/s (15 cm/min). The frequency of the pulsed wave was 1 Hz with an initial duty cycle of 50%, resulting in a pulse time (tp) and background time (tb) of 0.5 s in the first tests. The pulse and base currents were 50 A and 10 A, respectively. Then, a frequency of 2.5 Hz was tested while maintaining the same duty cycle of 50%, reducing tp and tb to 0.2 s. In this test, the speed and frequency were correlated using Equation (7), increasing the welding speed to 3.0 mm/s (18 cm/min). The welding power source was an IMC model Digiplus A7 600A [23] and the process was automatically carried out using a cartesian robot SPS model Tartílope V4 [24].

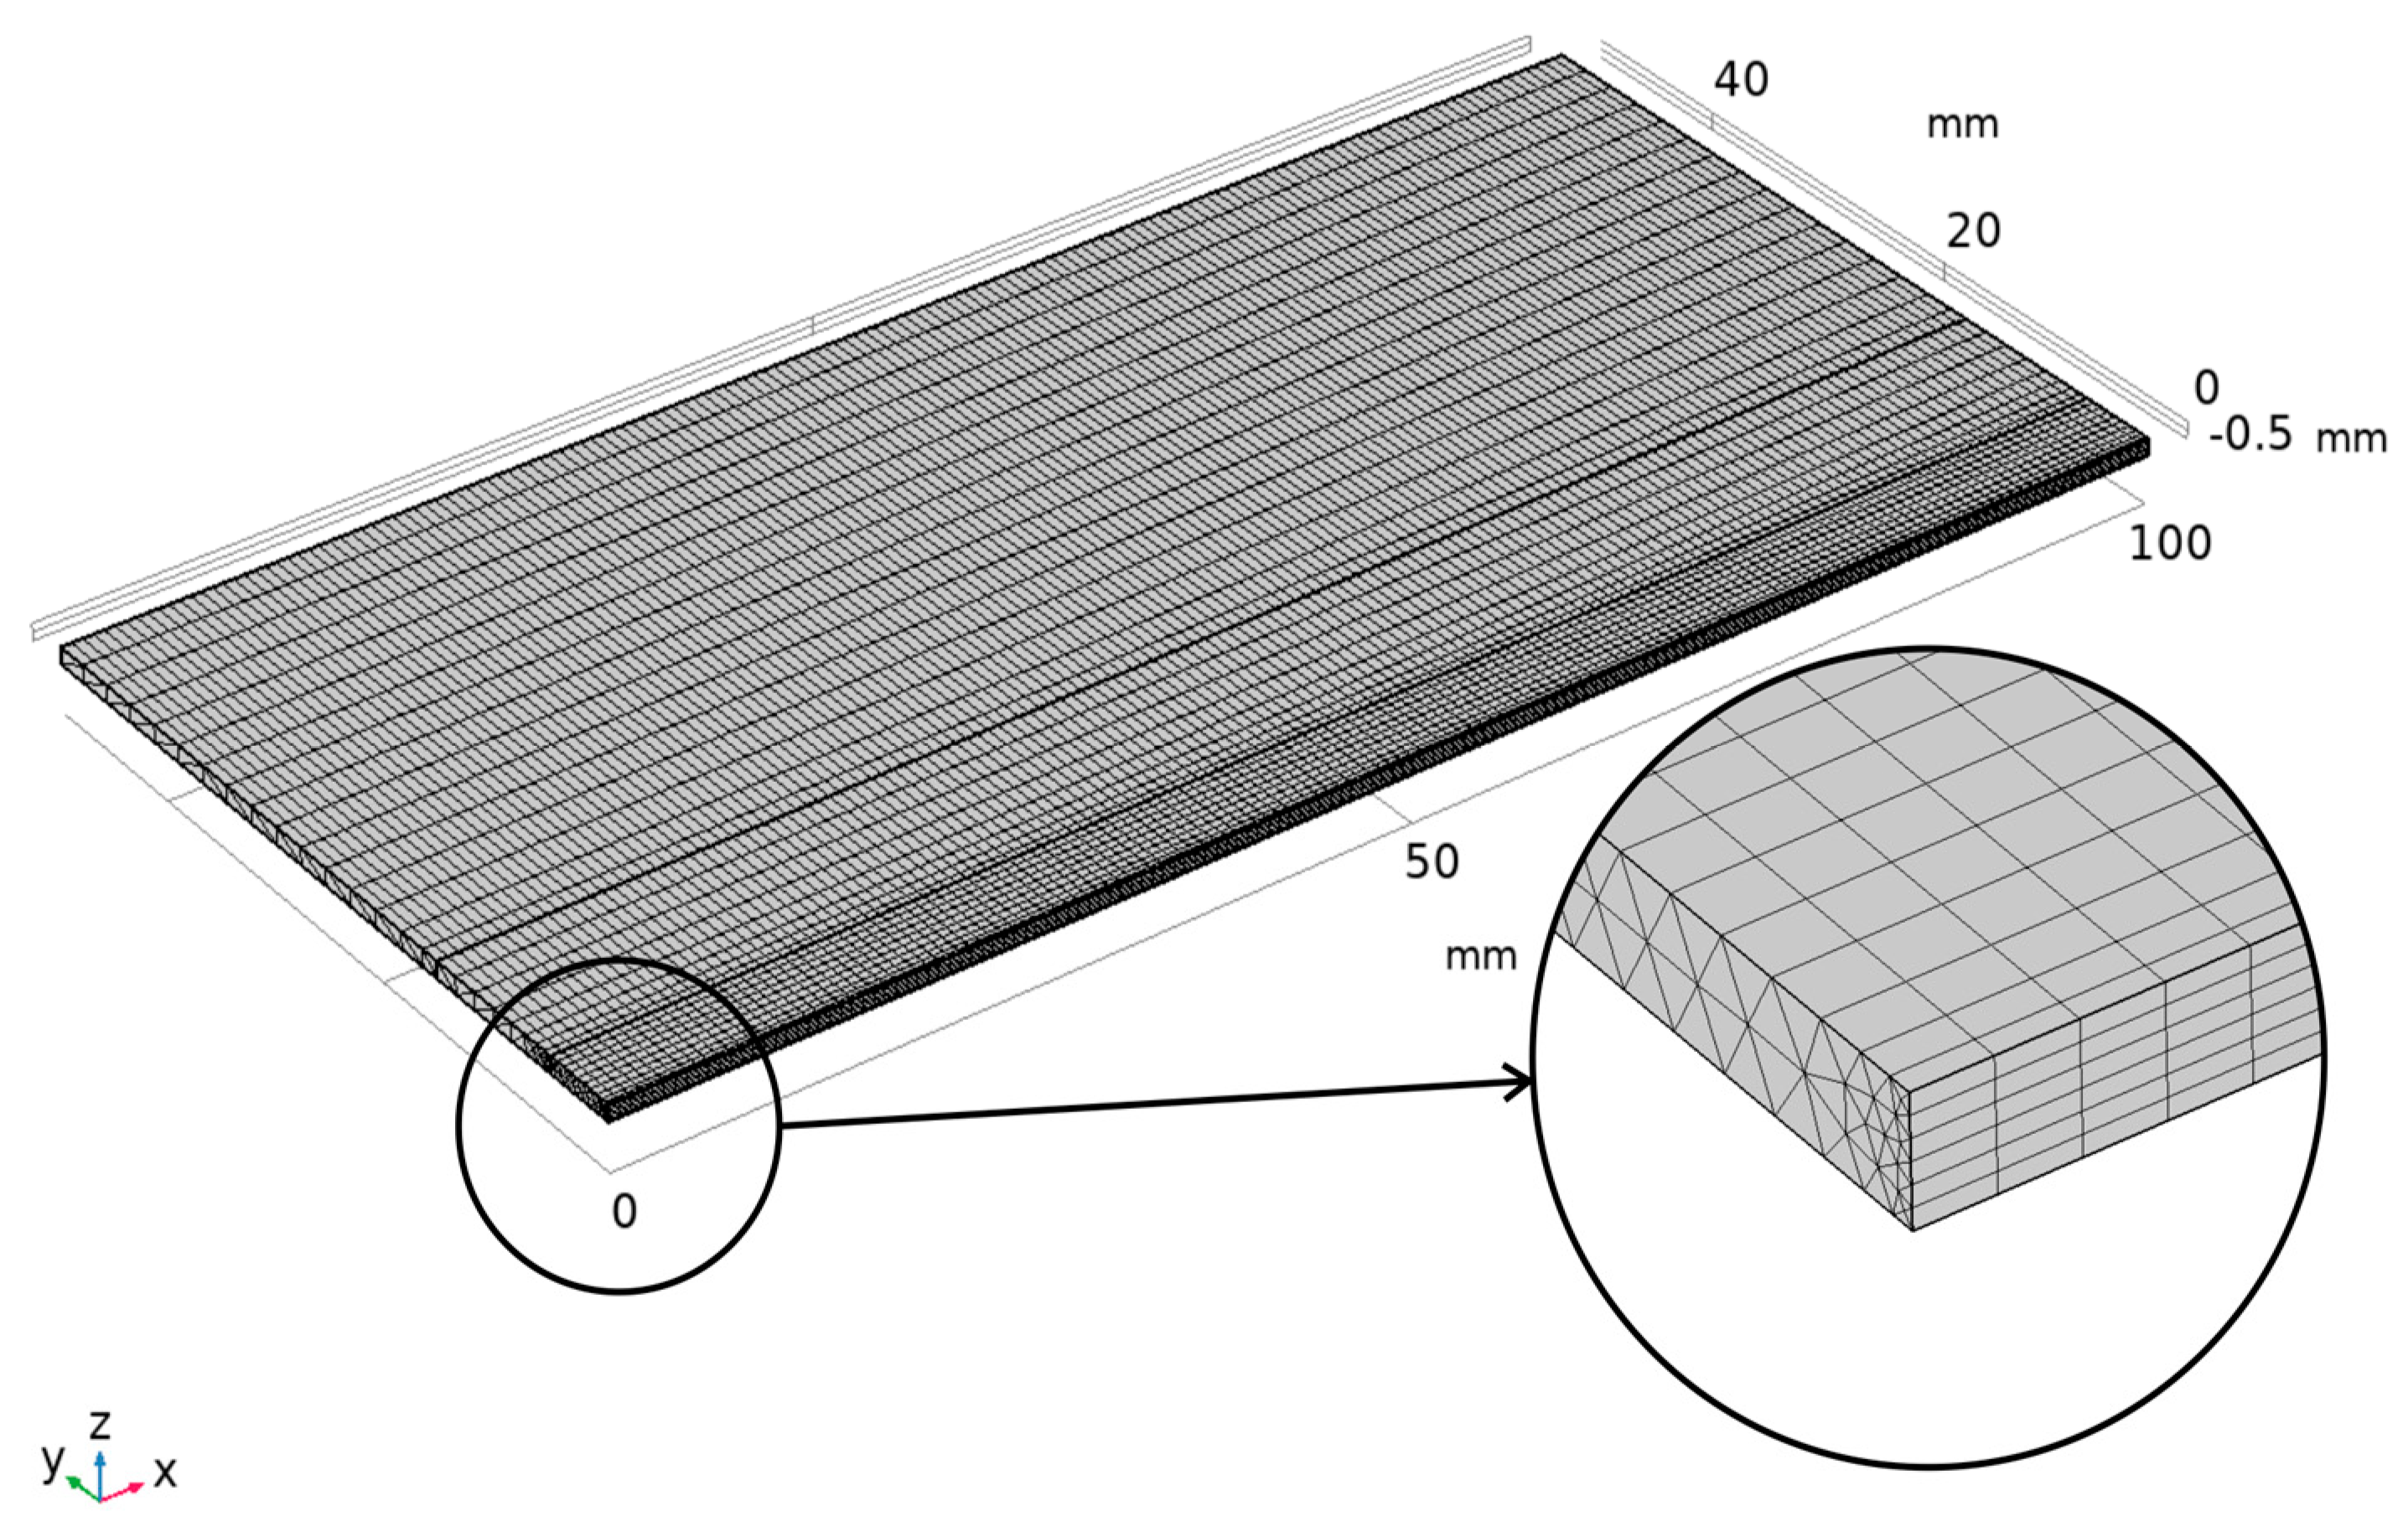
Methodology of the Thermal Simulation and Equation Step

Part of this work was developed based on numerical modeling using the finite element method (FEM) in order to show the correlation between welding speed and pulse frequency of the thermal source representing the electric arc. The software used was COMSOL Multiphysics version 6.1. For the calculations, a computer with an AMD Ryzen 7 3800X processor with 8 cores and 16 threads, operating at a clock frequency of 3.9 GHz, a 64 GB DDR4 RAM at 2666 MHz, and a 1 TB Adata SSD storage with a read speed of 520 MB/s and write speed of 450 MB/s was used.
The model performs a thermal analysis in which the general equation for heat transfer (Equation (8)) is solved in Cartesian coordinates in its differential form.
x k ( T ) T x + y k ( T ) T y + z k ( T ) T z + Q ˙ T , t = ρ ( T ) C p ( T ) T t
where k is the thermal conductivity, T is the temperature, Q ˙ is the externally generated heat flux rate, ρ is the density and Cp is the specific heat. The physical properties used in the simulation for the stainless steel 304 were considered nonlinear and are presented in Table 1.
The power density distribution described by the double-ellipsoid model proposed by Goldak et al. [25] was used for the transient simulation of GTAW welding and heat source. This volumetric heat flow is represented by Equations (9) and (10), and is divided into front (qf) and rear (qr) quadrants which, when summed, result in the total heat.
q f x , y , z , t = 6 3 f f Q a b c f π π e x p 3 x 2 a 2 e x p 3 y 2 b 2 e x p 3 [ z + W s τ t ] 2 c f 2
q r x , y , z , t = 6 3 f r Q a b c r π π e x p 3 x 2 a 2 e x p 3 y 2 b 2 e x p 3 [ z + W s τ t ] 2 c r 2
where ff + fr = 2, Ws is the welding speed, τ is a delay factor used to define the initial position of the source (in this work τ = 0) and Q is the input power transferred to the workpiece and calculated by the product of three factors: welding current (I), voltage (U) and thermal efficiency (ɳ) (Q = ɳIU). The process efficiency used was 80%, which was defined based on the work of Fuerschbach and Knorovsky [26]. The geometric parameters a (1.4 mm) and b (1.0 mm) represent half-width and penetration, while cf (1.0 mm) and cr (1.4 mm) are the lengths of the front and rear quadrants, respectively. The geometric parameters were defined based on measurements of welds and macrographs.
Figure 3 exemplifies the setting of the parameters on the software for one of the simulated conditions, in which is highlighted the variables for pulse and background current (in the image example Ip = 50 A, Ib = 10 A) and the geometric variables a, b and c (for the other simulated conditions of this paper, with different pulse and frequency values, it is just a matter of changing the parameter on the table with a red rectangle in Figure 3). The pulse frequency is a consequence of the times tp and tb which are input variables in the program. Thus, the resulting waveform applied to the welding power source on the software will then be the one presented in Figure 4, composed of a pulse and a background period. In the image, also shown is the waveform formulation set on the software.
To discretize the workpiece model, a tetrahedral mesh configuration was used with a refinement of the elements near the region where the welding heat source is applied. The simulation also considered symmetry as a boundary condition. Therefore, only half of the plate was modeled, as shown in Figure 5. The number of elements was 18,150 with an average quality (skewness) of 0.7. The computational calculation time for each condition presented in this work was approximately 50 min.
Heat transfer by convection and radiation to the environment was considered on the plate surfaces. Convection was considered by means of the heat-transfer coefficient (h) applying the correlations for heated flat surfaces from above (Equation (11)) and for vertical surfaces on the side walls (Equation (12)), both presented by Incropera et al. [27].
h = k L 0.54 R a L 1 / 4   s e   10 4 R a L 10 7 k L 0.15 R a L 1 / 3   s e   10 7 R a L 10 11
h = k a i r L 0.68 + 0.67 R a L 1 / 4 1 + 0.492 k μ C p _ a i r 9 / 16 4 / 9   s e   R a L 10 9 k a i r L 0.825 + 0.387 R a L 1 / 6 1 + 0.492 k μ C p _ a i r 9 / 16 8 / 27 2   s e   R a L > 10 9
where L is the characteristic length of the heat-exchanging face of the workpiece by convection, kair is the thermal conductivity of air, RaL is the Rayleigh number defined by Equation (13), and it takes into account the properties of the environment where the workpiece is located; in this case, atmospheric air. Thus, μair is the dynamic viscosity of air, Cp_air is the specific heat of air, αp is the thermal expansion coefficient of air, ρair is the density of air and g is the gravity. The values of these parameters were considered constant for an ambient temperature of 20 °C and are presented in Table 2.
R a L = g α p ρ a i r 2 C p _ a i r ( T T e x t ) L 3 k a i r μ
The heat flux by radiation (qrad) was considered using Equation (14),
q r a d = ε σ T a m b 4 T 4
where ε is the emissivity of the plate, σ is the Stefan–Boltzmann constant and Tamb is the ambient temperature.
First, it was aimed to represent the conditions empirically tested with the model. This was a validation step of the simulation results concerning the temperature distribution and the size of the molten zone. Then, the simulation was applied to verify the continuity of the molten zone for the pulse frequencies of 1.0 Hz and 2.5 Hz and welding speeds ranging from 1.6 mm/s (10 cm/min) to 5.8 mm/s (35 cm/min), seeking to obtain the maximum value of Ws that produces continuity of the molten zone.

4. Results and Discussion

Figure 6 and Figure 7 show the welds obtained with constant current and pulsed current, respectively. Analyzing the geometric aspect, the weld obtained with constant current had an average face width (FW) of 2.7 mm and root width (RW) of 1.5 mm, resulting in a shape factor of 0.56. The weld obtained with pulsed current presented regions with a circular shape, as theoretically represented in Figure 2. The diameters of these circles had average values, seen from the face side (FS), of approximately 3.6 mm and, seen from the root side (RS), of approximately 2.8 mm, resulting in a shape factor of approximately 0.78. This demonstrates a strong proportional increase for the root produced with pulsed current (2.8 mm compared to 1.5 mm in constant current). This fact corroborates the statement in the Welding Handbook [1] about the better performance of pulsed current compared to constant current. However, as will be seen later, this is a particular situation.
These melted regions, whose interlocking depends on the welding speed, would tend to have a more circular shape if the welding speed was also pulsed. In a situation with pulsed welding speed, the torch would stop during the pulse time and move only when the current was in the base. As in the present case, the torch did not stop during the pulse phase, and the welding points tend to assume an elliptical shape and this becomes more pronounced as the welding speed increases, as can be seen in the examples that follow. In any case, there must be a synergy between the welding speed and the pulse frequency in order to maintain the continuity of the weld bead.
In this situation, where the pulsed current had a significantly reduced frequency, it is possible to clearly observe a difference in solidification microstructure between the weld with constant current and the one with pulsed, as shown in Figure 8 and Figure 9. In Figure 8, where the arc power remains constant throughout welding, three continuous solidification zones appeared: two formed by the growth of columnar grains from the edges of the molten pool towards the center, and a third evolving through the center of the weld bead and giving rise to elongated grains that have the same welding direction.
A completely different solidification structure appeared in the pulsed current welding. Due to the alternation in arc power, the fusion occurred in discrete volumes, producing a discrete microstructure as shown in Figure 9. The fusion in each phase of the pulsed current initiates a grain growth from the edges of the molten pool towards the center of the weld point, transitioning from columnar to equiaxed growth at the center of the point (Figure 9).
This caused a break in the microstructure along the weld bead, resulting in grains with different growth directions and eliminating the appearance of a preferred orientation in the welding direction. Comparing these results, it is possible to infer that the mechanical properties resulting from pulsed current welding will be superior to those of constant DC welding due to the greater isotropy of the structure. These effects were also verified by Abu-Aesh et al. [28] and Masumoto et al. [29], who claimed an increase in solidification crack resistance using pulsed current, as well as an increase in joint mechanical strength.
Since productivity is always desirable, increasing the welding speed is one option to achieve it. However, in the presented procedure, the overlapping of the melted regions is already tight, as the fusion lines that delimit the root of the bead in Figure 7 are overlapping by a small margin. To increase the welding speed, it is necessary to have a proportional increase in frequency, as analytically deduced by Equation (7). Thus, the welding speed was increased to 3.0 mm/s (18 cm/min) and the frequency was incremented to 2.5 Hz, maintaining the duty cycle of 50%. Figure 10 shows the weld result with the cited parameters, which, although it has a good surface appearance on both sides, the cooling conditions resulting from the applied thermal cycle did not produce the same solidification effect previously observed in Figure 9. In the micrographs of Figure 11, it is possible to observe the effect generated by the imposition of successive energy pulses in the regions near the edges of the molten pool, without, however, interrupting the continuous growth of the grains indicated by the yellow arrows. As in the weld with constant current, it is possible to observe that, in the central region of the weld, there is again the presence of columnar grains aligned with the welding direction.
Thus, it is verified that the desired effect of thermal pulsation in GTAW welding is not always achieved. The successful achievement of a microstructure with a grain growth break can only be obtained if the welding procedure variables result in a thermal cycle in the workpiece that effectively allows for cooling of the pool during the base current phase [30,31]. If there is no compatibility between the process variables and cooling conditions, the microstructure resulting from pulsed current may not be distinct from that obtained in constant current.
Regarding the geometric shape given by the RW/FW ratio, which, in this case, resulted in 0.64, it is noted that there was a worse condition compared to the pulsed current weld in Figure 5, although different welding speeds were used. Since there was no effect on the solidification structure with the procedure using a frequency of 2.5 Hz, it is possible to consider a case in which the pulse time has a higher current intensity, acting in a shorter time (lower duty cycle).
For the previous cases, the duty cycle was always 50%, since the pulse and background times were equal. For comparison, Figure 12 shows a weld with the same average current of 30 A and frequency of 2.5 Hz, but now with tp = 0.1 s, Ip = 90 A, tb = 0.3 s and Ib = 10 A. In this condition, the result was a weld with a face width (FW) of 3.3 mm compared to 2.8 mm of its equivalent with a 50% duty cycle (Figure 10). However, the root width (RW) became worse compared to the case in Figure 10, being approximately 1.7 mm. Therefore, this weld with a 25% duty cycle produced an RW/FW ratio of 0.51, which is less efficient than the 0.64 LR/LF ratio obtained with a 50% duty cycle. This result indicates that the application of pulsed current is tending to worsen the geometric shape of the weld penetration, in contrast to the trend observed in the procedures of Figure 4 with constant current and Figure 5 with pulsed current.
The microstructure of the center and periphery of the welding bead in Figure 12 is presented in Figure 13. The aligned grains in the central region pointed by the arrows are still visible, although they occupy a smaller area than the weld in Figure 9. In the periphery region, there is only a slight break in the grain orientation.
To achieve a higher welding speed, the average current intensity was increased to 45 A, while maintaining the duty cycle of 25% (tp = 0.1 s and tb = 0.3 s) of the weld shown in Figure 12, but with Ip = 150 A and Ib = 10 A. The achievable welding speed without discontinuities was 5.8 mm/s (35 cm/min), according to Figure 14. With a face width (FW) of 4.6 mm and a root width (RW) of 1.7 mm, the RW/FW form factor was 0.37. This value corroborates what was previously mentioned; that as higher productivity is demanded, the use of pulsed current becomes unfavorable. This demonstrates that pulsing the current does not always have the property of achieving greater penetration with a reduction in face width, but it can increase fusion efficiency.
With this procedure, the microstructure shown in Figure 15 no longer exhibited aligned grains in the center of the weld bead, as previously shown in the morphology of the micrograph in Figure 11.
Based on this first study, if the current pulsation frequency exceeds a certain value, there will be no thermal effect on the weld bead (expansion and reduction of the molten pool), and everything will behave as if it were a single-level current. It is concerning that, in the GTAW (TIG) process, there are two broad ranges of possibilities for using pulsed current: one is the lower frequency demonstrated in this manuscript; and that increasing the frequency is futile because the results become contrary to what the majority of the literature claims (there is no influence in the solidification and grain refinement), and this confusion is caused by the inadequacy of the established assumptions. In many papers cited in the introduction section of this paper, the authors compare results obtained with different energies, attributing the changes to the variables of the pulsed waveform [8,12,13,14]. The second frequency range of practical relevance in the GTAW process occurs when the frequency reaches values close to 5 kHz. This already represents another effect related to arc constriction, resulting in increased stiffness and consequent improvement in penetration depth.

Analysis of the Correlation between Pulse Frequency and Welding Speed through Thermal Simulation

As presented, there must be an appropriate relationship between the pulsation frequency and welding speed for a convenient overlap between the molten pools produced by successive current pulses. For this purpose, numerical simulation as presented in Section 3 is used here. Initially, Figure 16 presents a validation of the numerical simulation based on the experimental results presented in Figure 7 and Figure 10. The dashed lines in Figure 16 represent the contour of the fusion zone obtained experimentally for the face and root of the welds. Its comparison with the simulated fusion zone indicates an excellent approximation between the numerical and experimental results, validating the model. Both the face and root of the welds had the same behavior, as shown in the same image.
Simulating both frequencies, 1.0 Hz and 2.5 Hz, for various welding speeds, it is observed that there is a reduction in the overlap of the molten zone for each current pulse as the heat source speed increases. An analysis of the weld face for 1 Hz and 2.5 Hz in Figure 17 shows that overlap is guaranteed up to 4.1 mm/s (25 cm/min) welding speed. However, an analysis of the weld root in Figure 18 shows that discontinuities arise already at 3.3 mm/s (20 cm/min) in the molten zone for 1 Hz, while for 2.5 Hz the weld discontinuity appears at 4.1 mm/s (25 cm/min). In addition to the effects on the solidification microstructure shown earlier, the pulse frequency influences the maximum welding speed that can be used to guarantee continuity.
This correlation between pulse frequency and welding speed to obtain a defect-free bead must consider the root of the weld, due to the smaller molten area obtained on the back of the plate, which provides less overlap. Another point observed in Figure 16 is the narrowing of the root with the increase in welding speed and, therefore, a decrease in the form factor (RW/FW) for the same frequency. The thermal effect shown in the model highlights the need for a matching between welding speed and pulse frequency, which must also be in agreement with the microstructural effect and the overlap of current pulses so that, in solidification, there is a breaking of the dendritic structure, making the grains more equiaxed instead of columnar in the center of the bead.
From the simulation point of view, the use of constant values for the geometric variables in pulse and background periods a, b, cf and cr (values of 1 mm, 1.4 mm, 1 mm and 1.4 mm) for the double-ellipsoidal produced reasonable results comparing the simulation and the real molten zone. This result comes from the fact that the molten pool, in the pulse period, overlaps the one created in the background period because most of the molten zone is formed by the greater heat input provided in the pulse. Thus, a change in the double-ellipsoidal’s geometric variables would be significant for cases in which great melting is verified during the background period. A paper focused only on the creation of a model for this pulsed GTAW could deeply approach this point, for example.
Moreover, the implementation of different values for a, b, cf and cr can easily be carried out by changing the variable on the developed program (table with red rectangle in Figure 3). The simulation was implemented in this paper to enrich its content by correlating the experimental aspects with modeling, which is very rare to be verified in the literature. The authors are also uploading a video animation as Supplementary material of the post-processing step for the pulsed GTAW model with 1 Hz, in which the thermal pulsation effect (expansion and reduction of the molten zone) can be verified in the simulation.

5. Conclusions

This manuscript presented a didactic analysis of the factors that should be observed regarding the use of GTAW welding with pulsed current and the following conclusions can be stated:
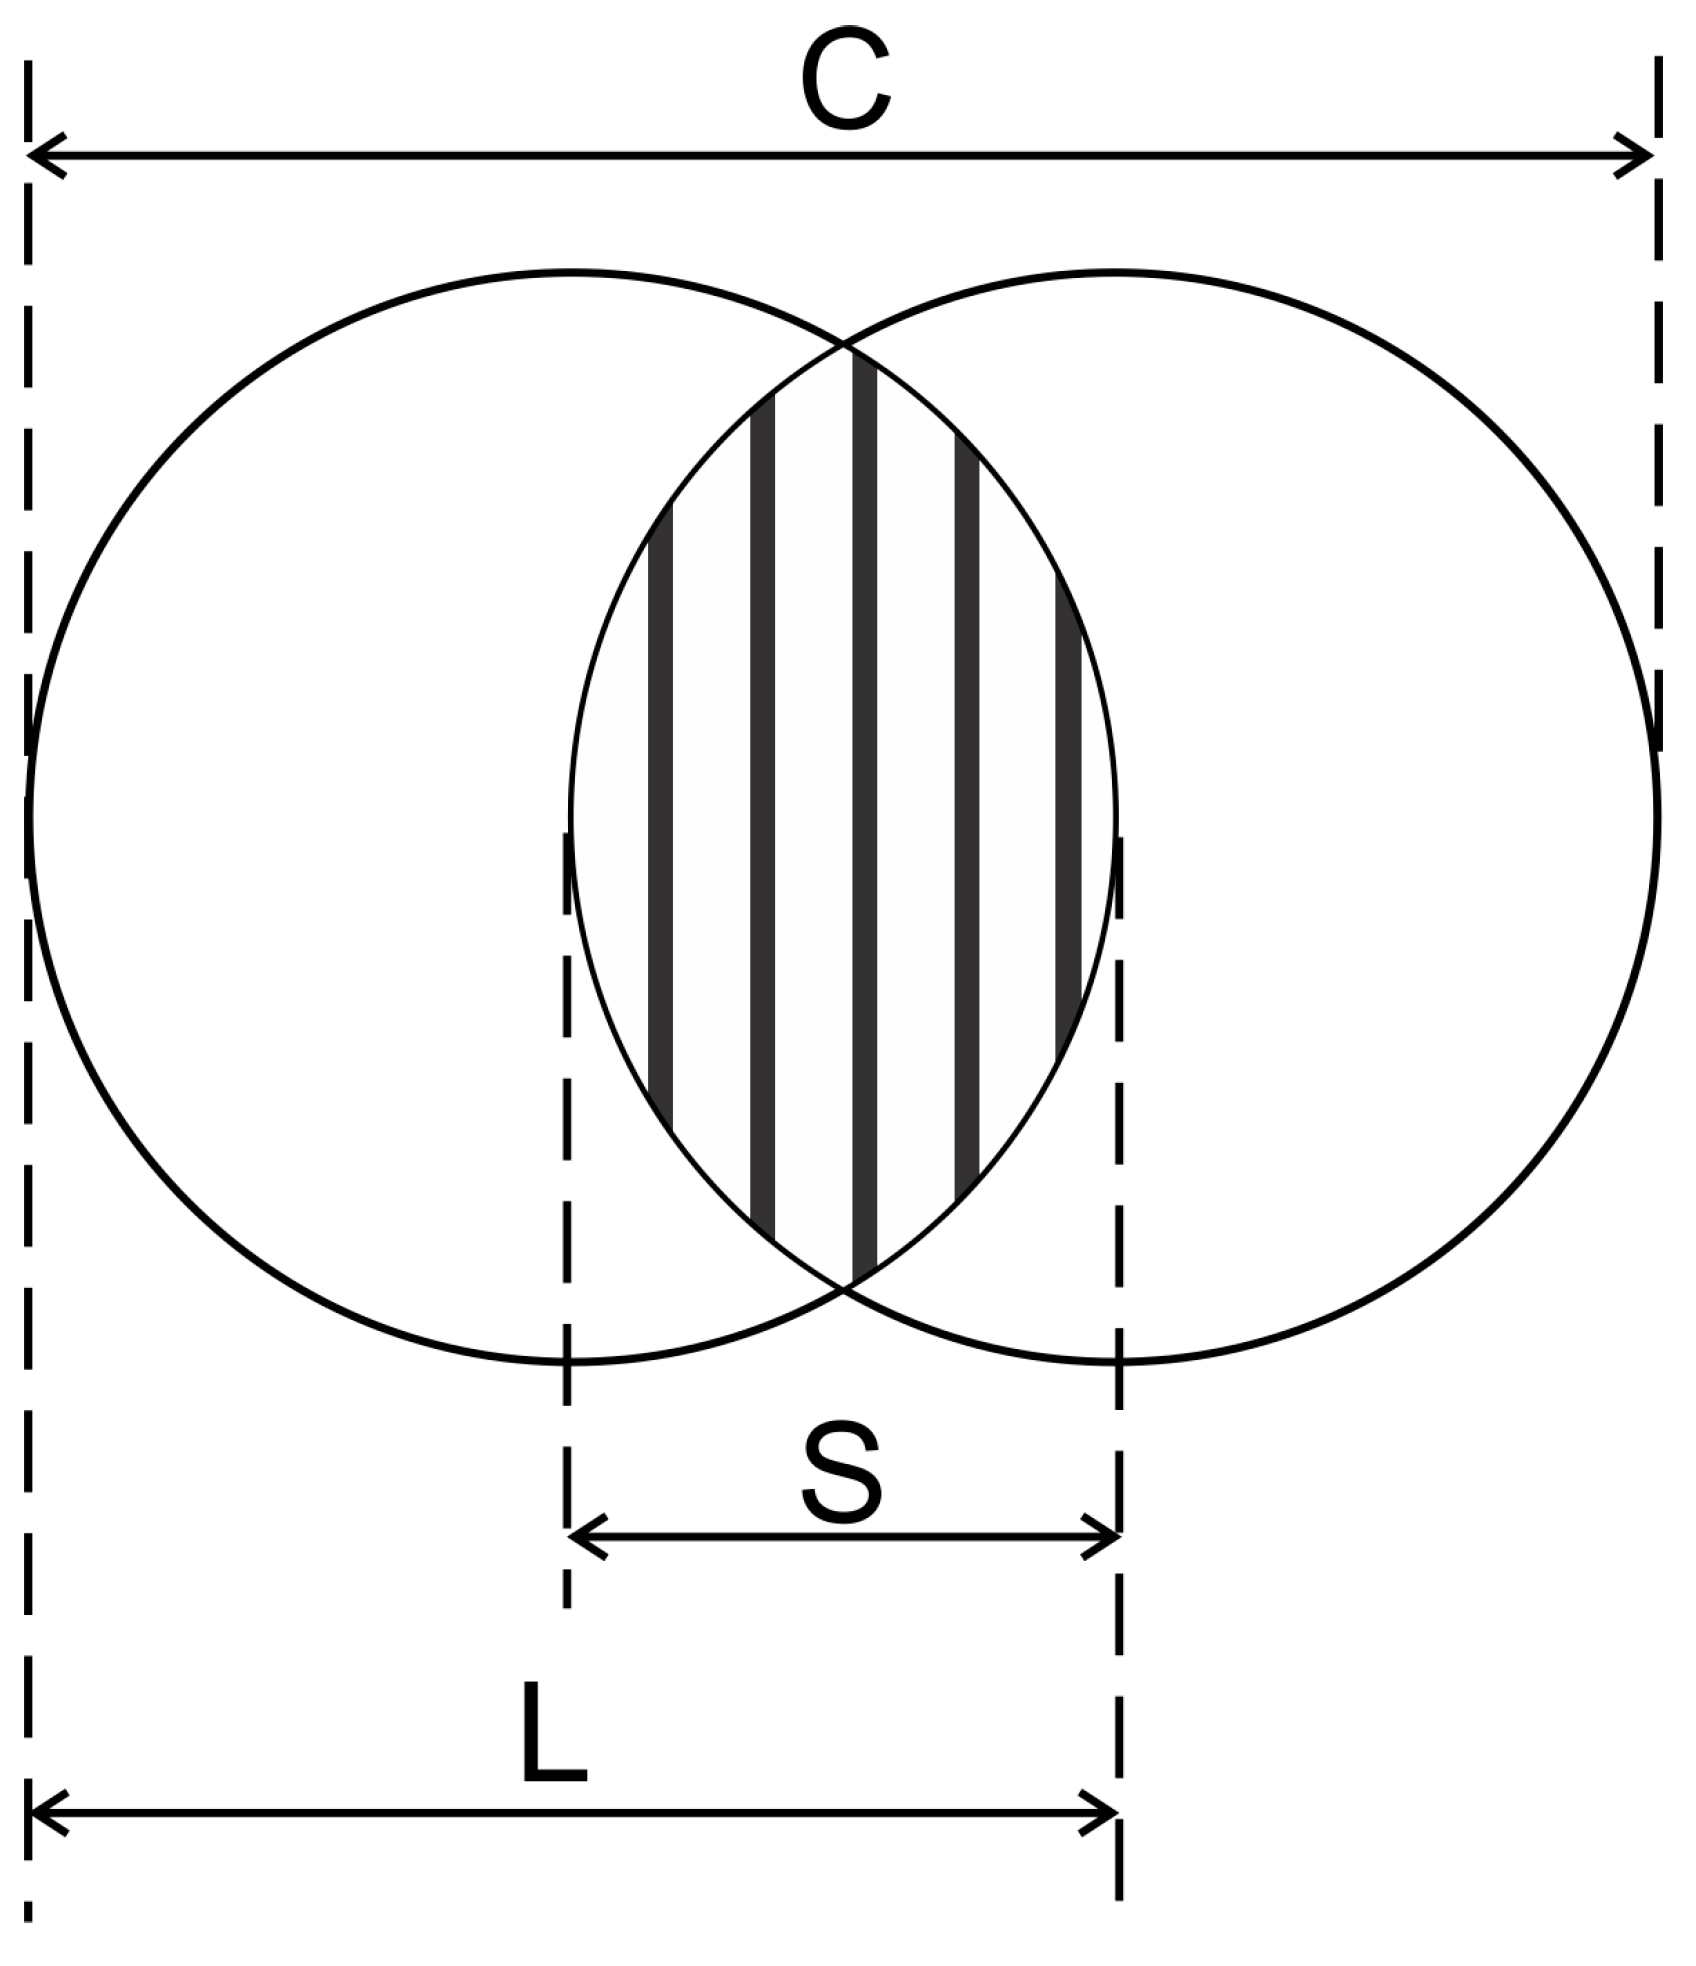
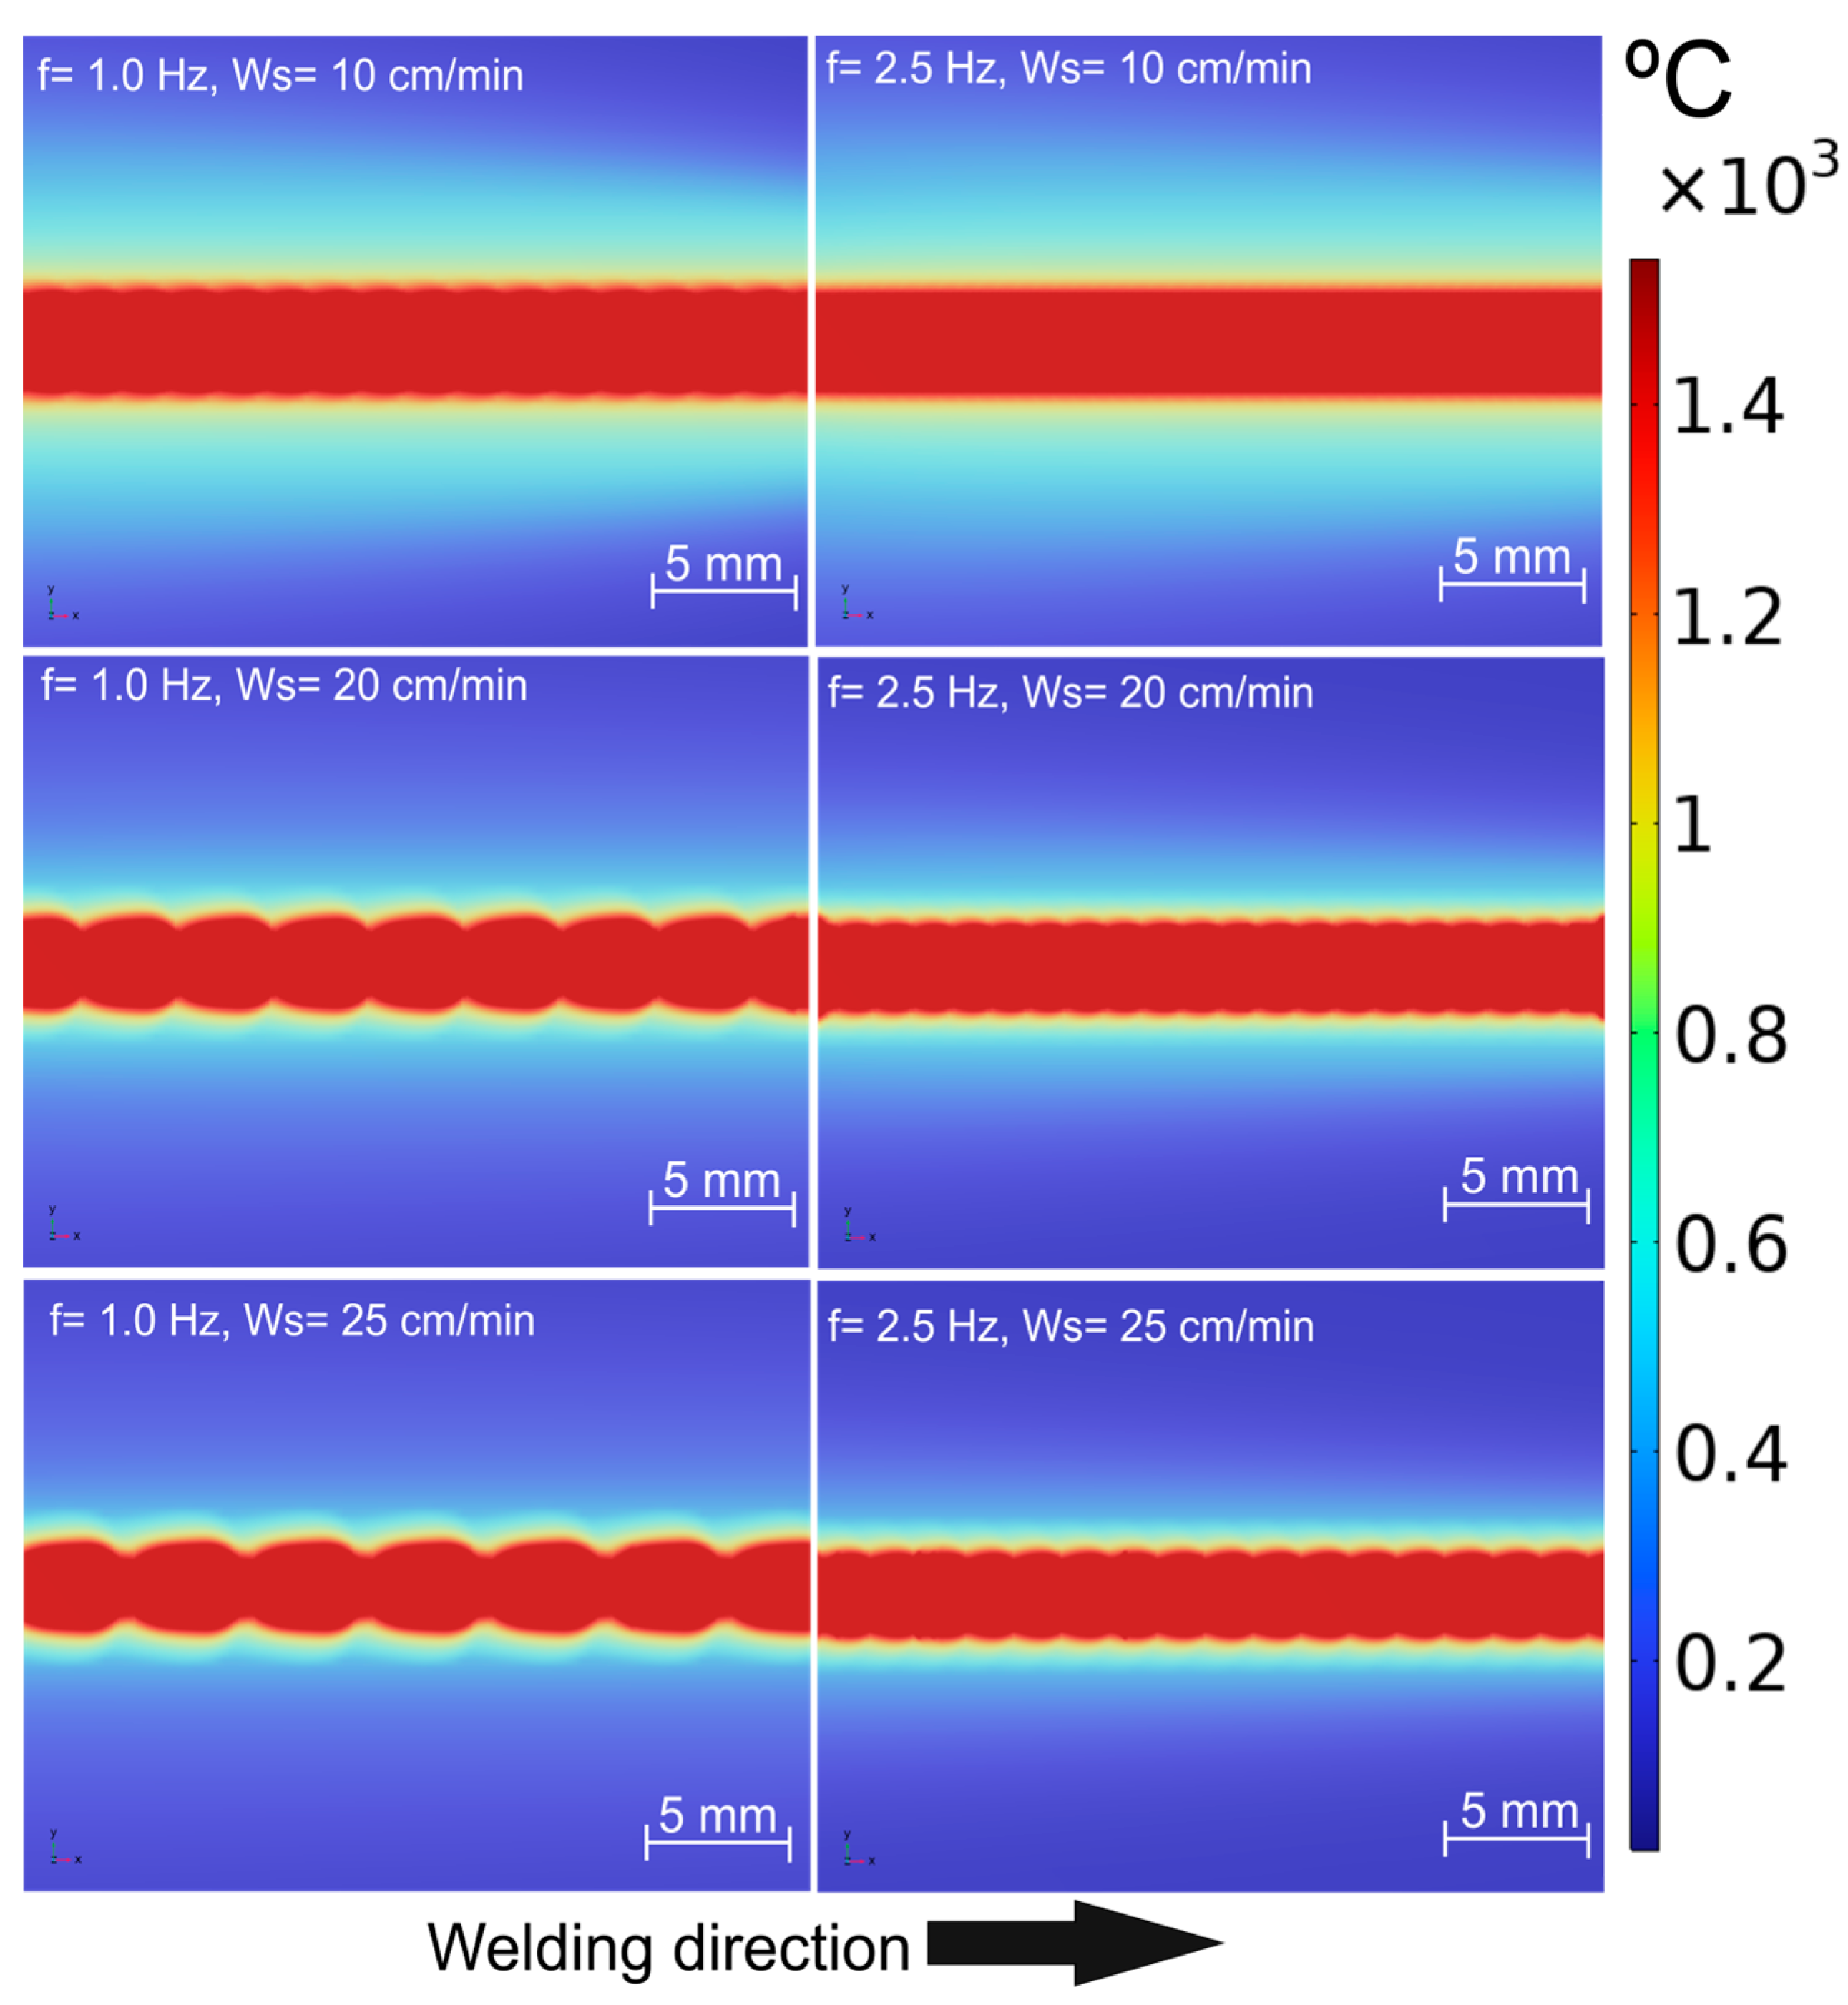
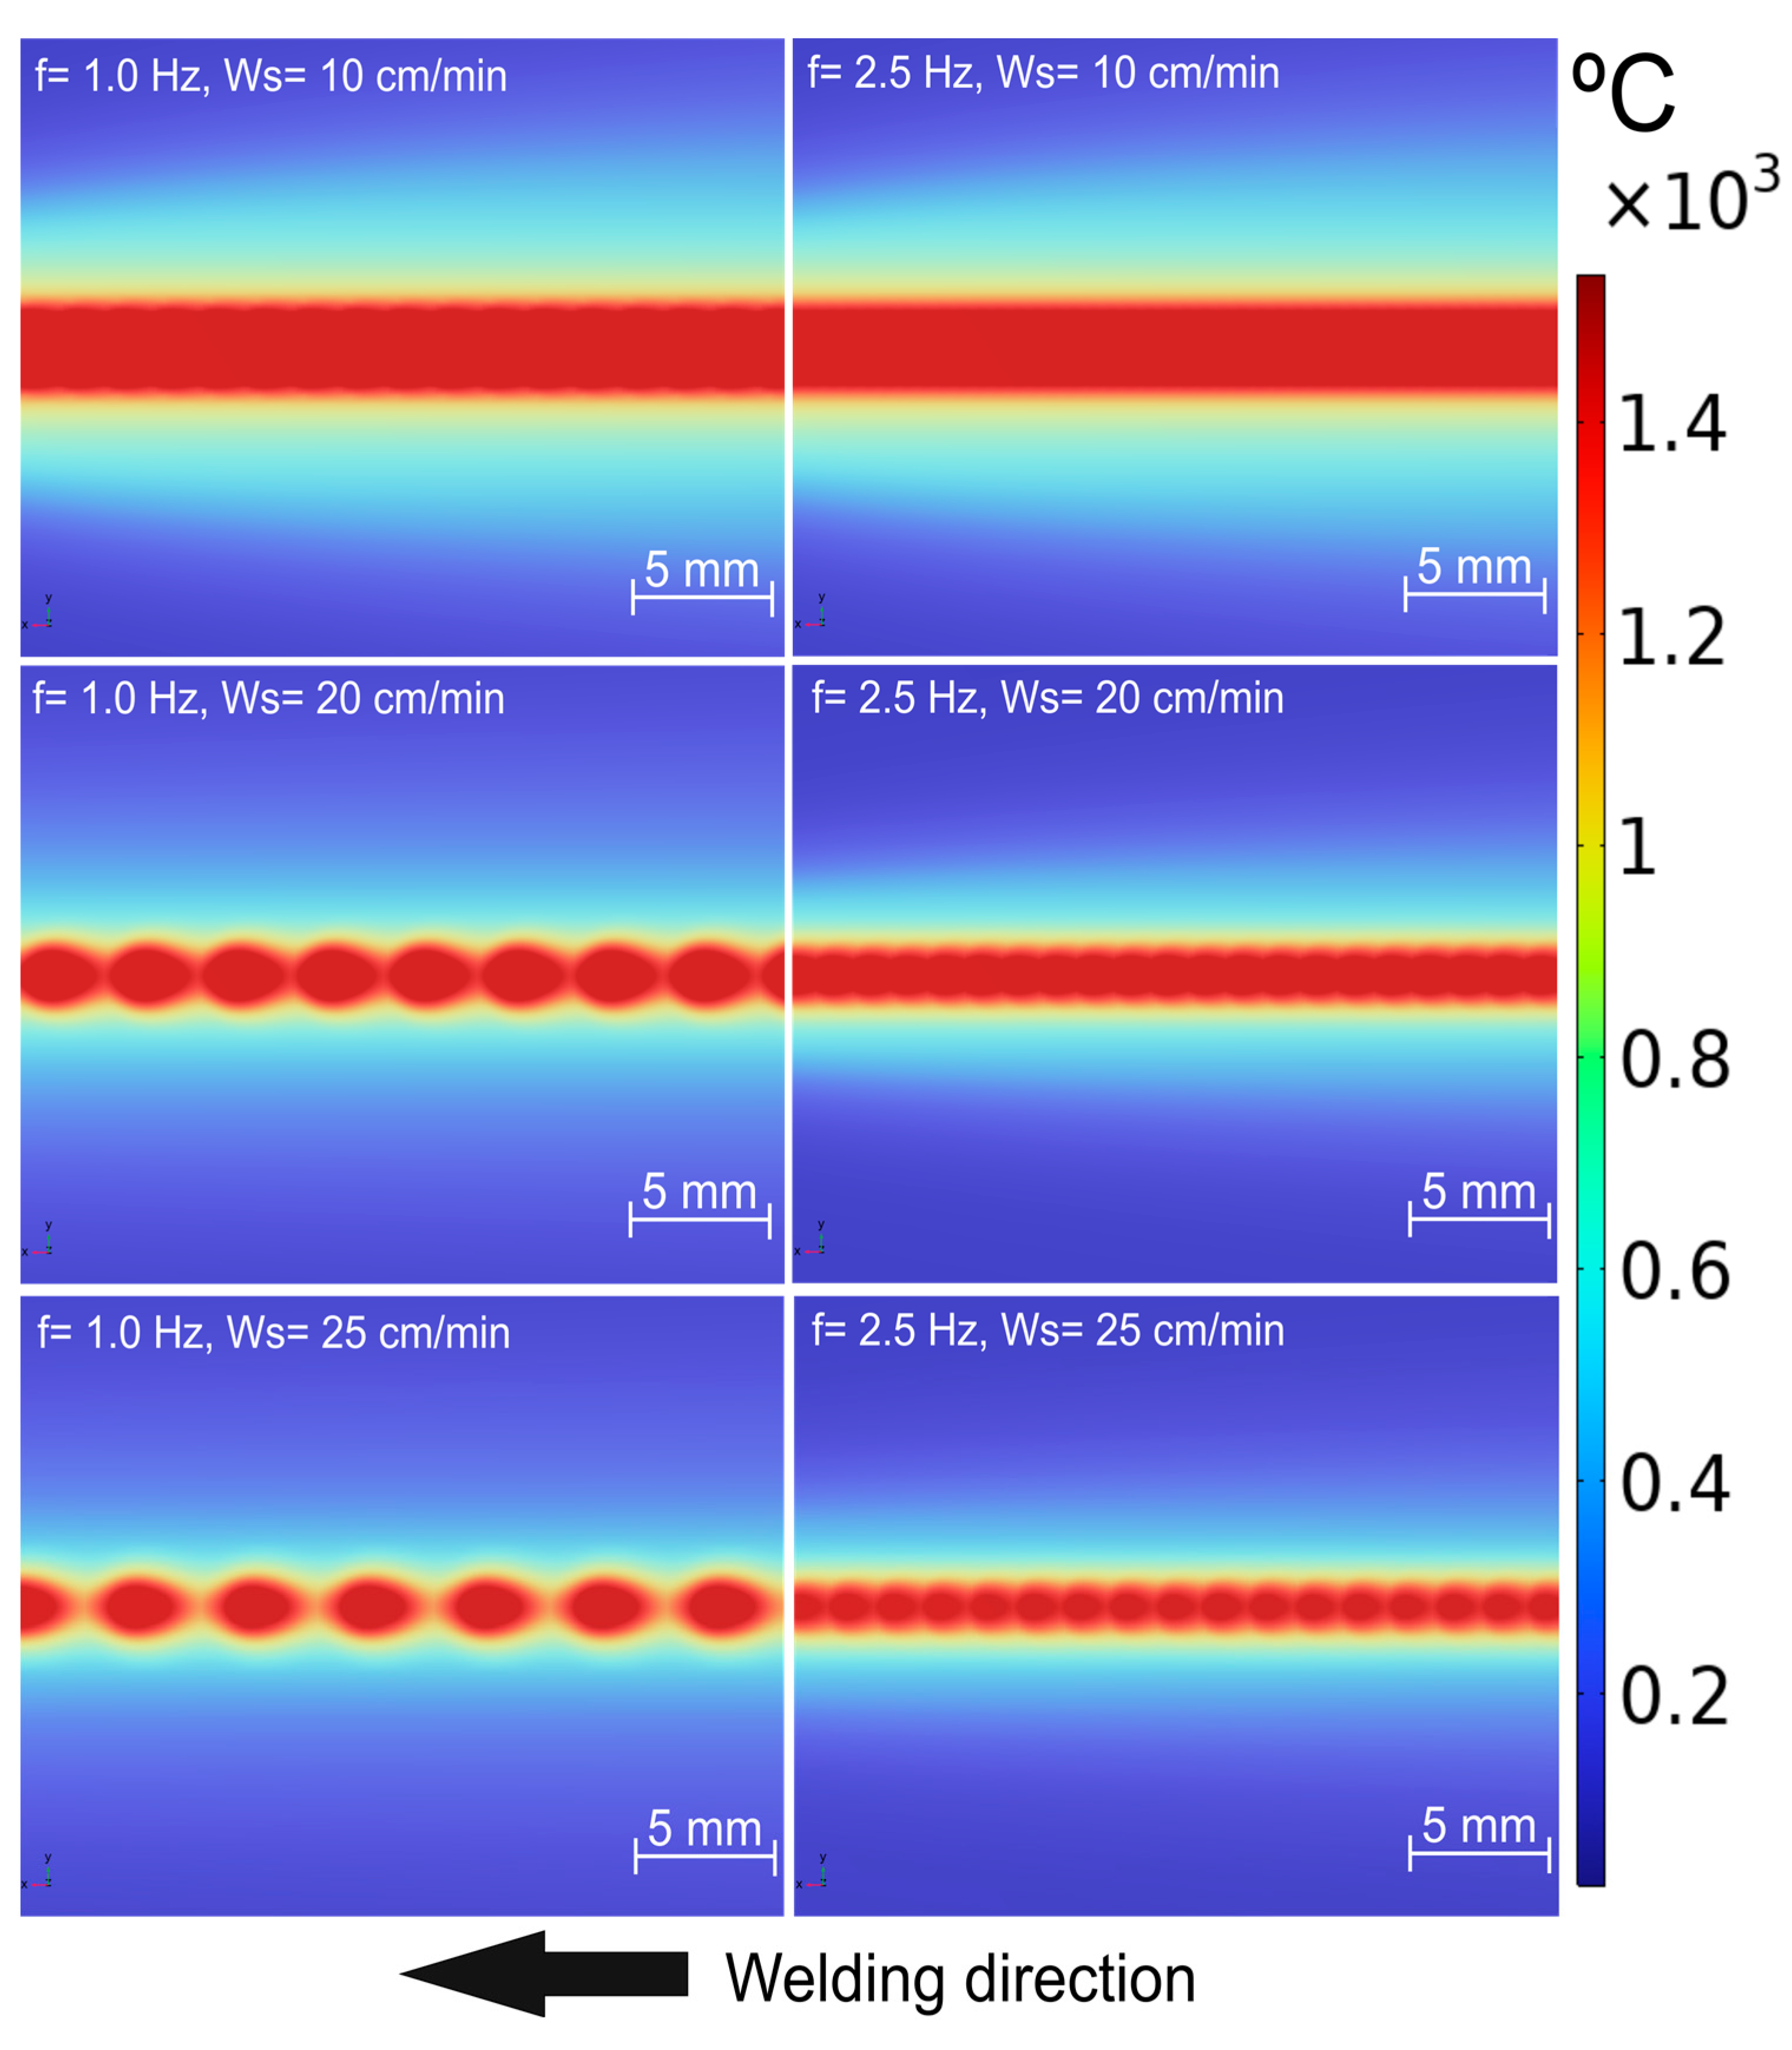
  • It is shown that there should be a close correlation between the period of the pulsed wave with the welding speed for a real thermal pulsation and a determined overlap between the molten zone obtained in each current pulse.
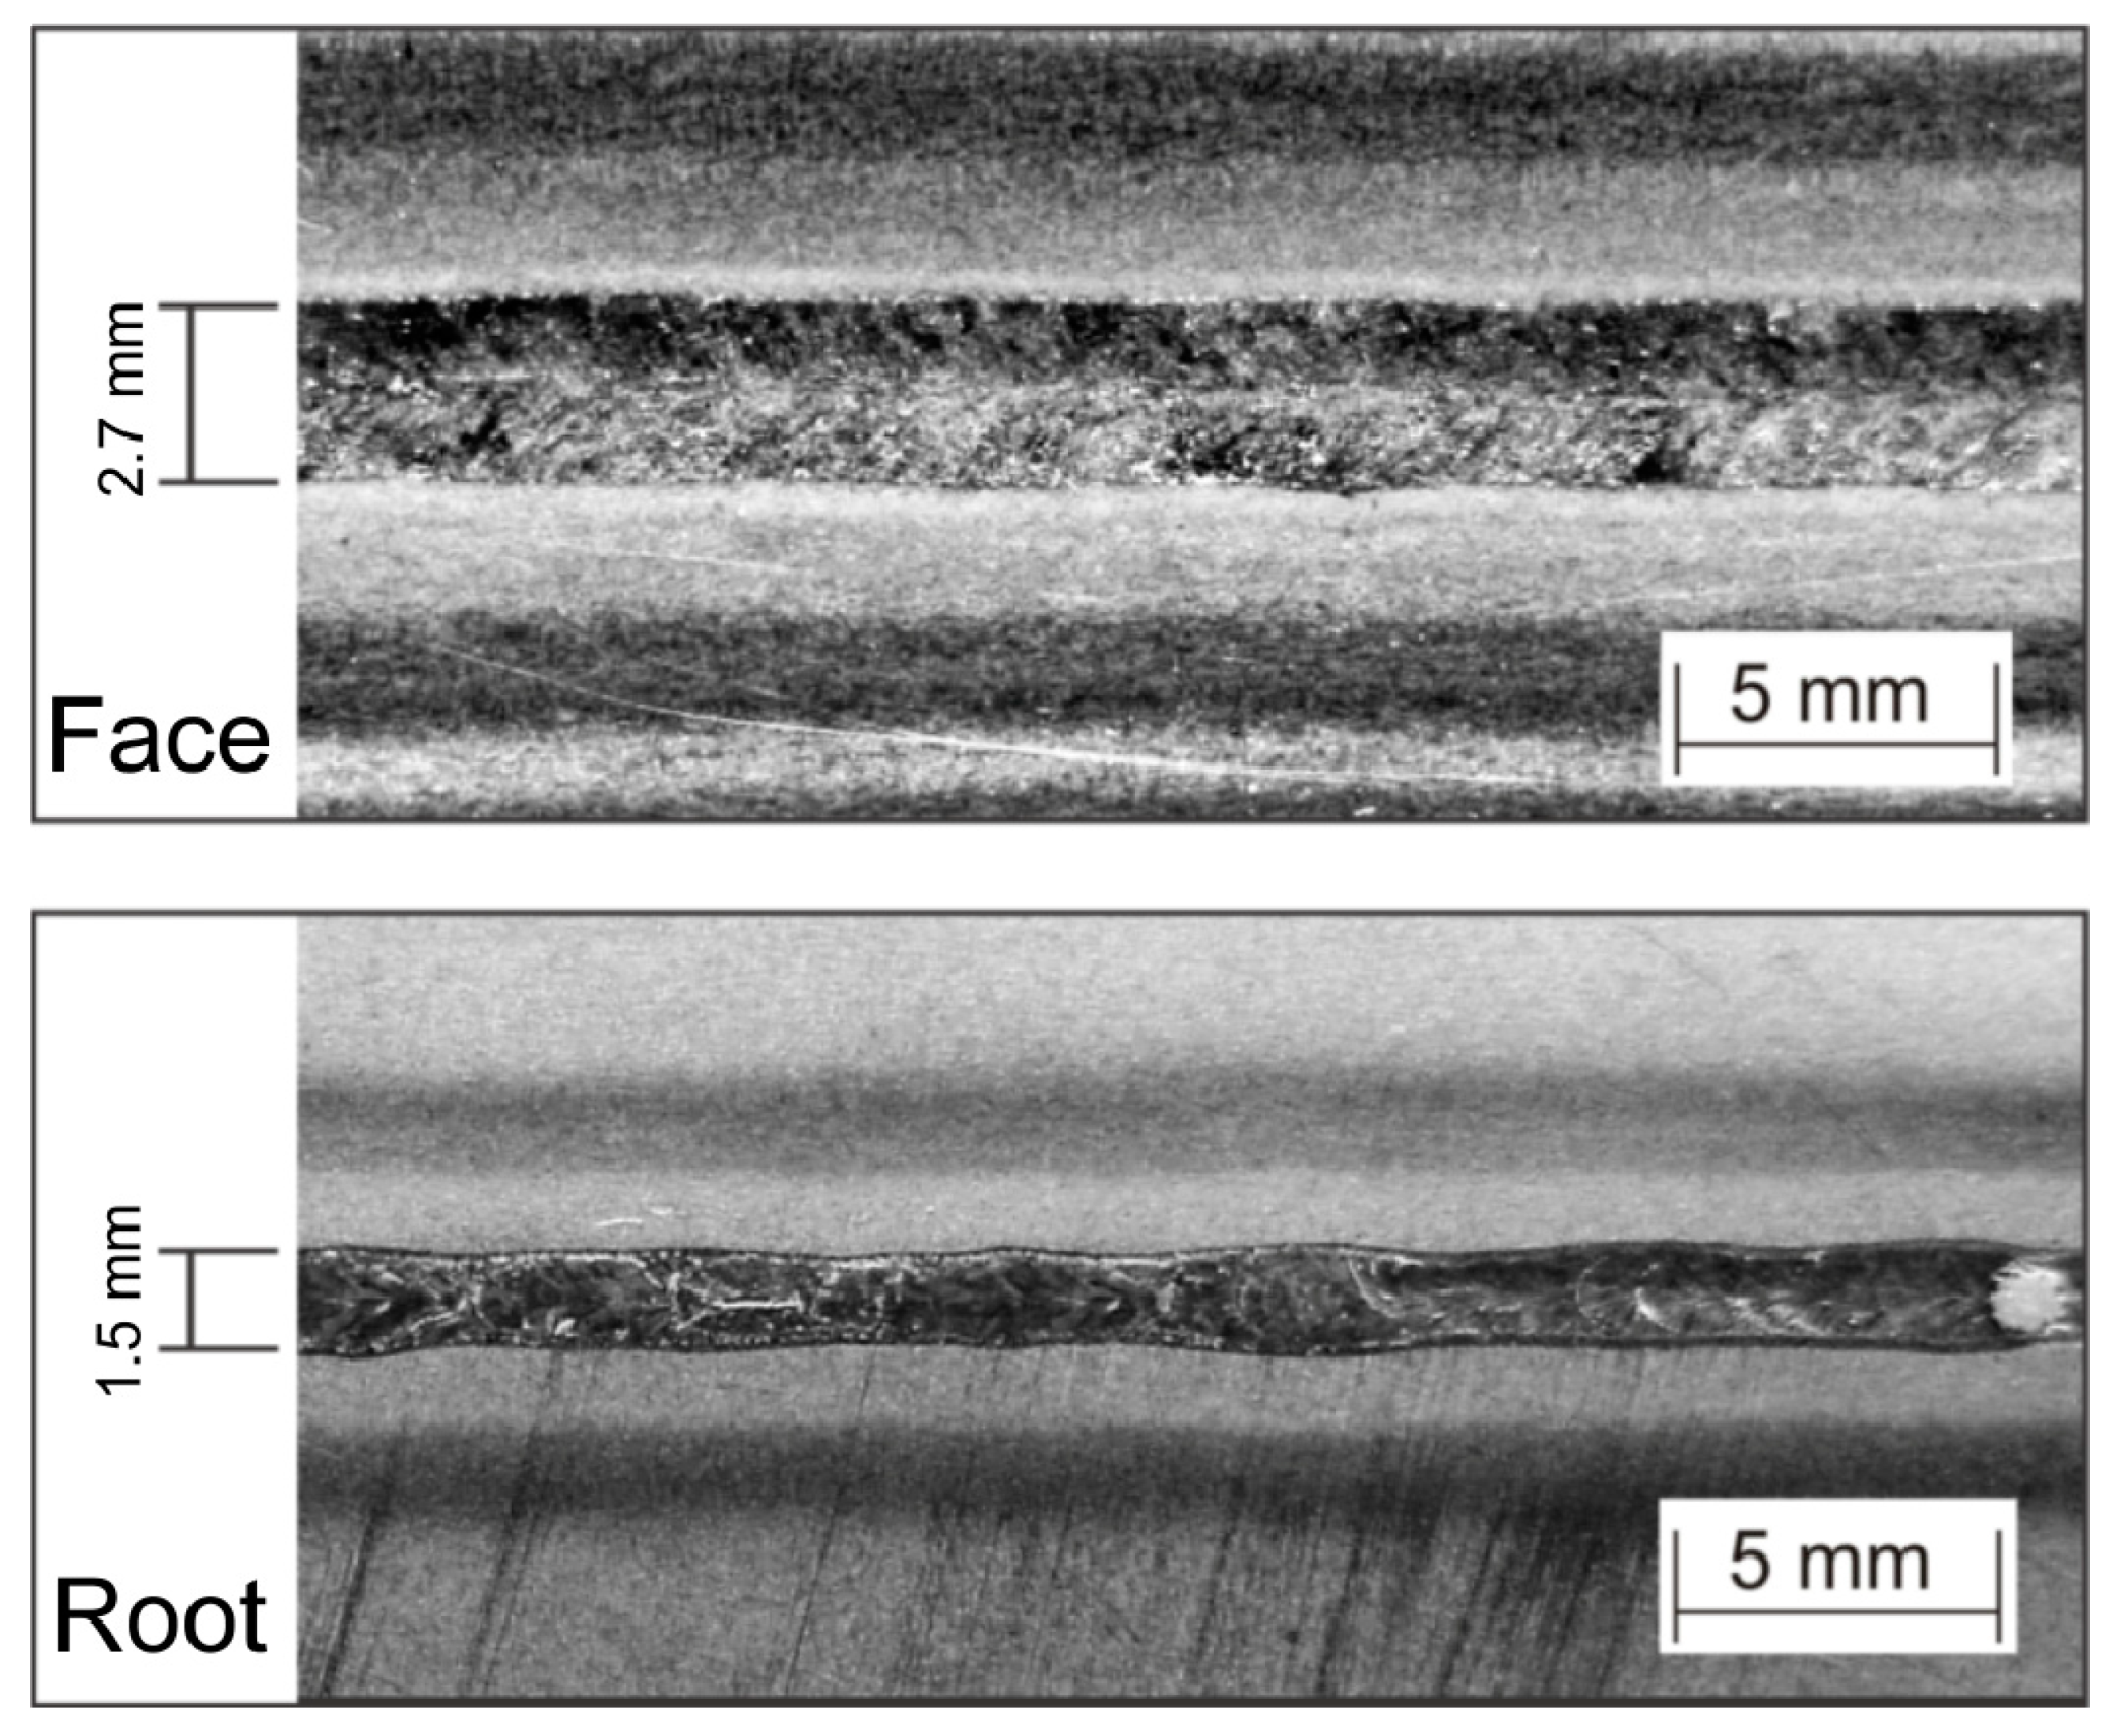
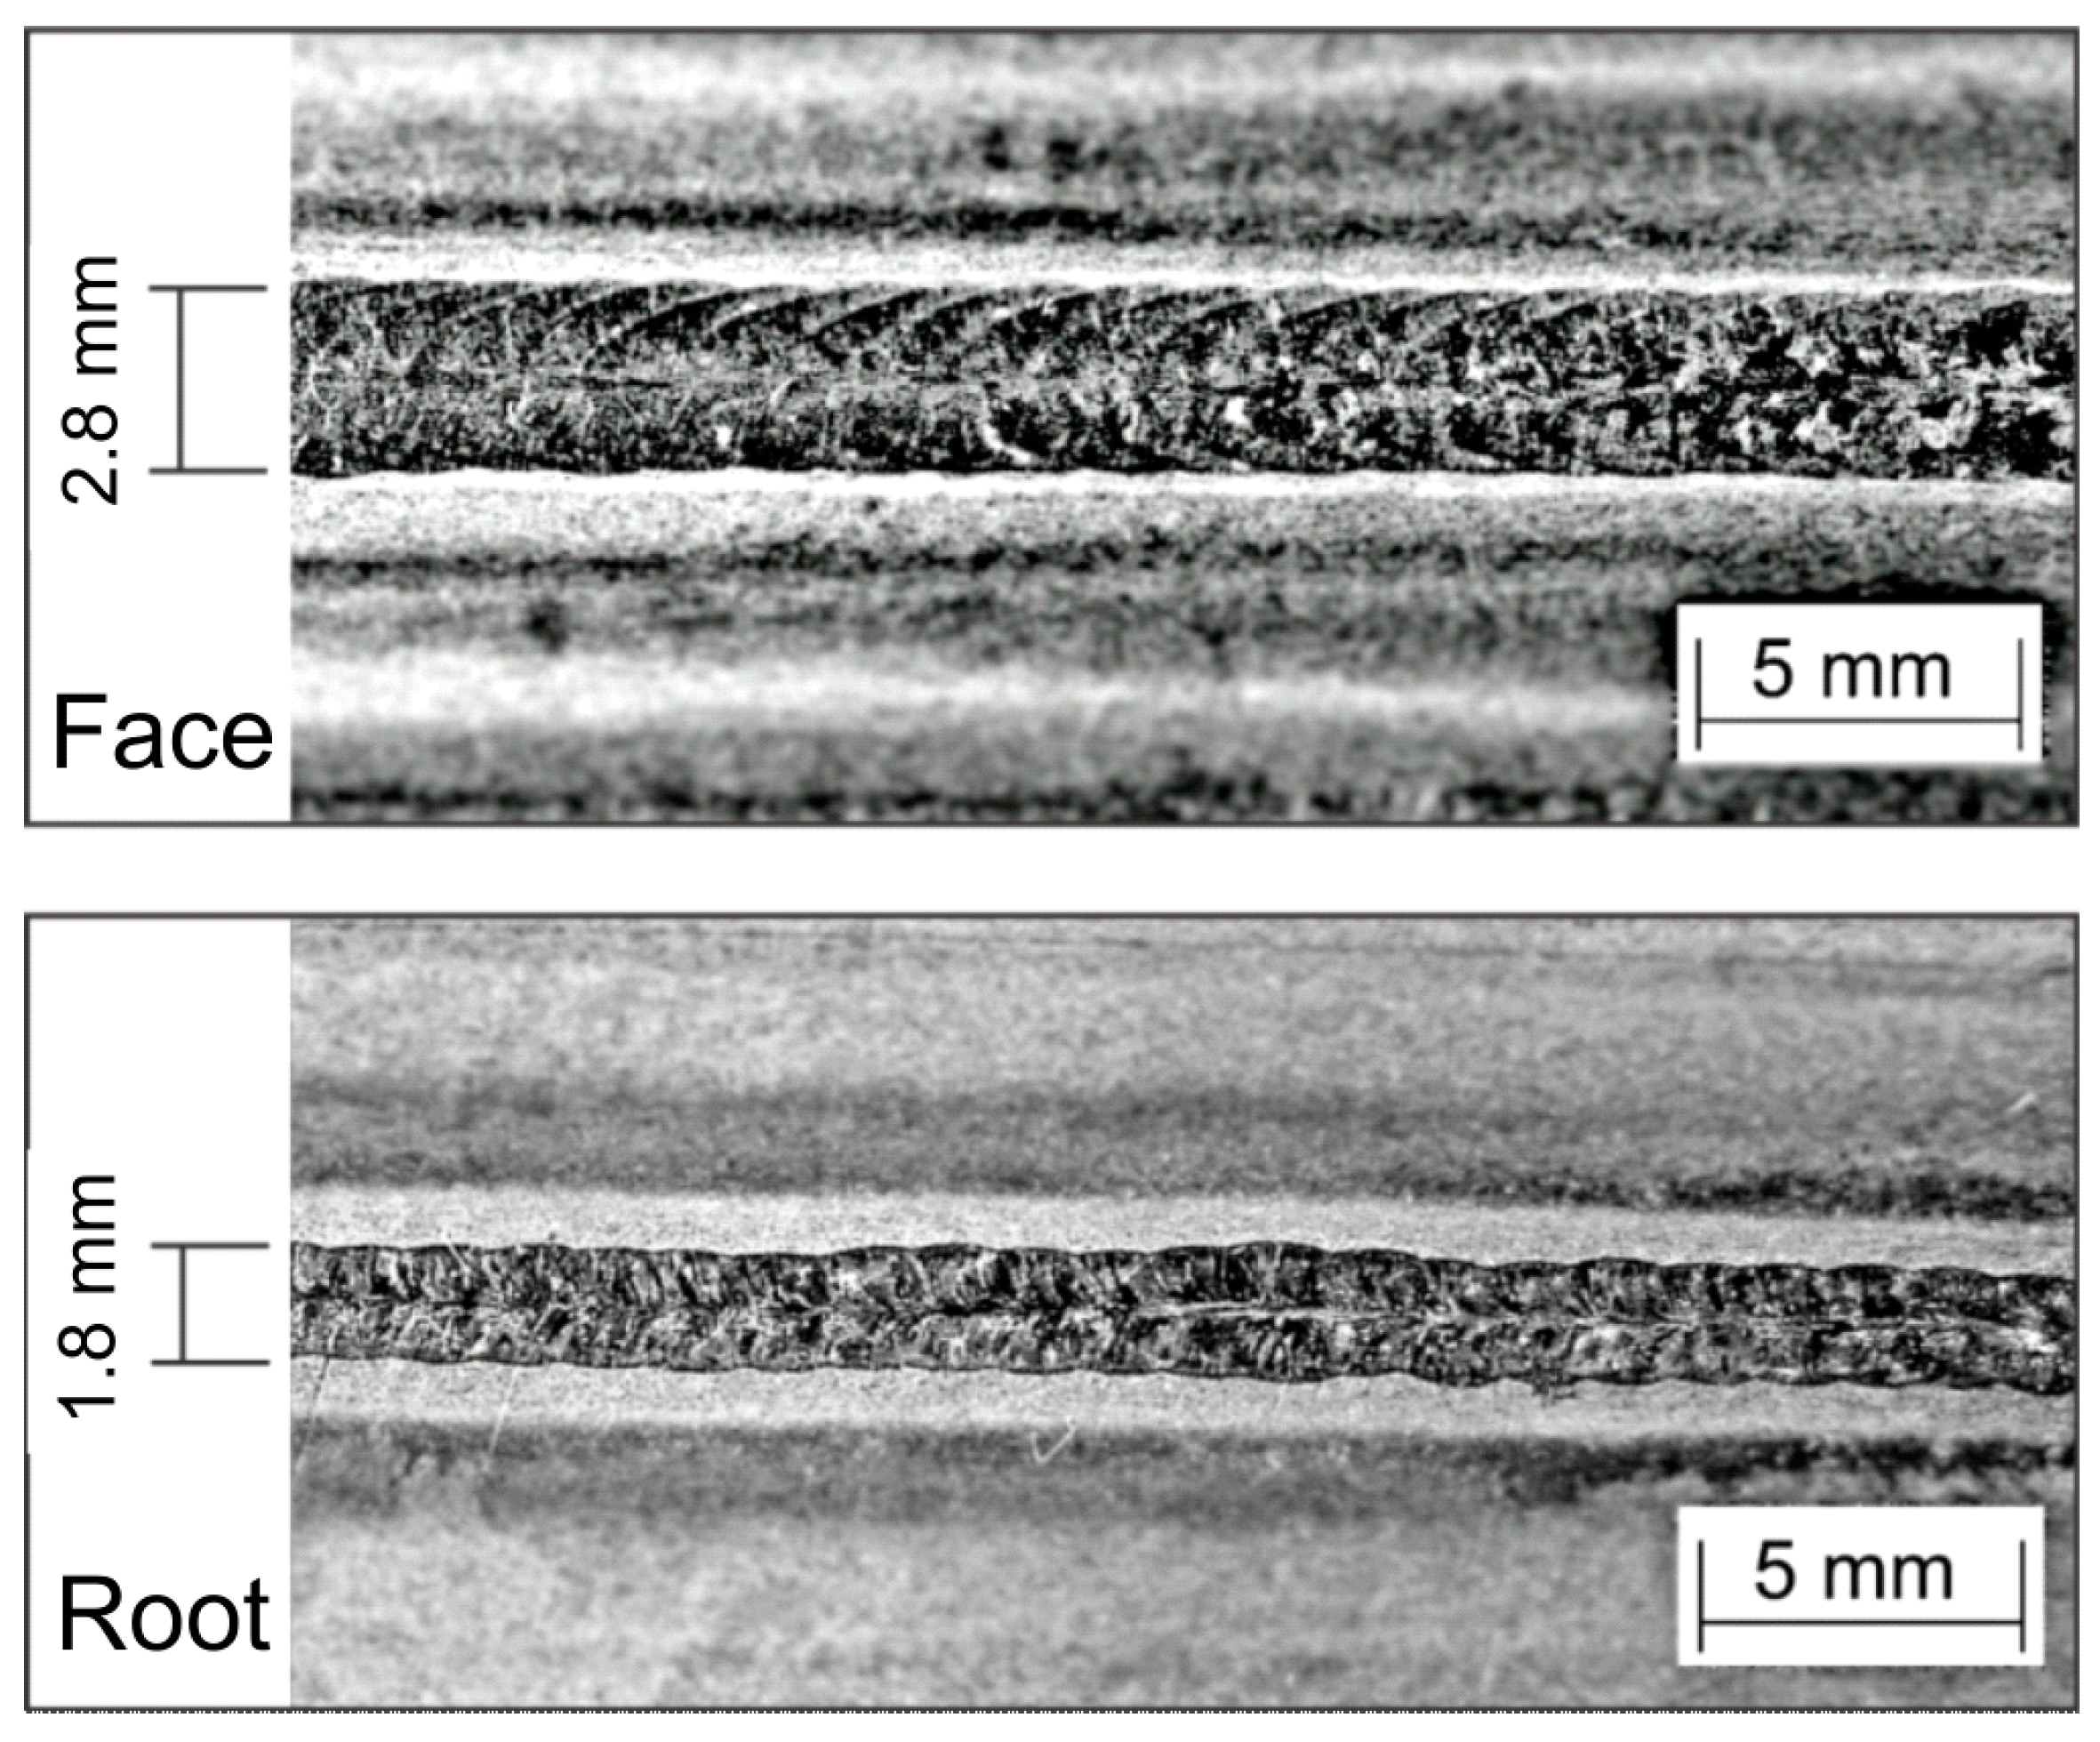
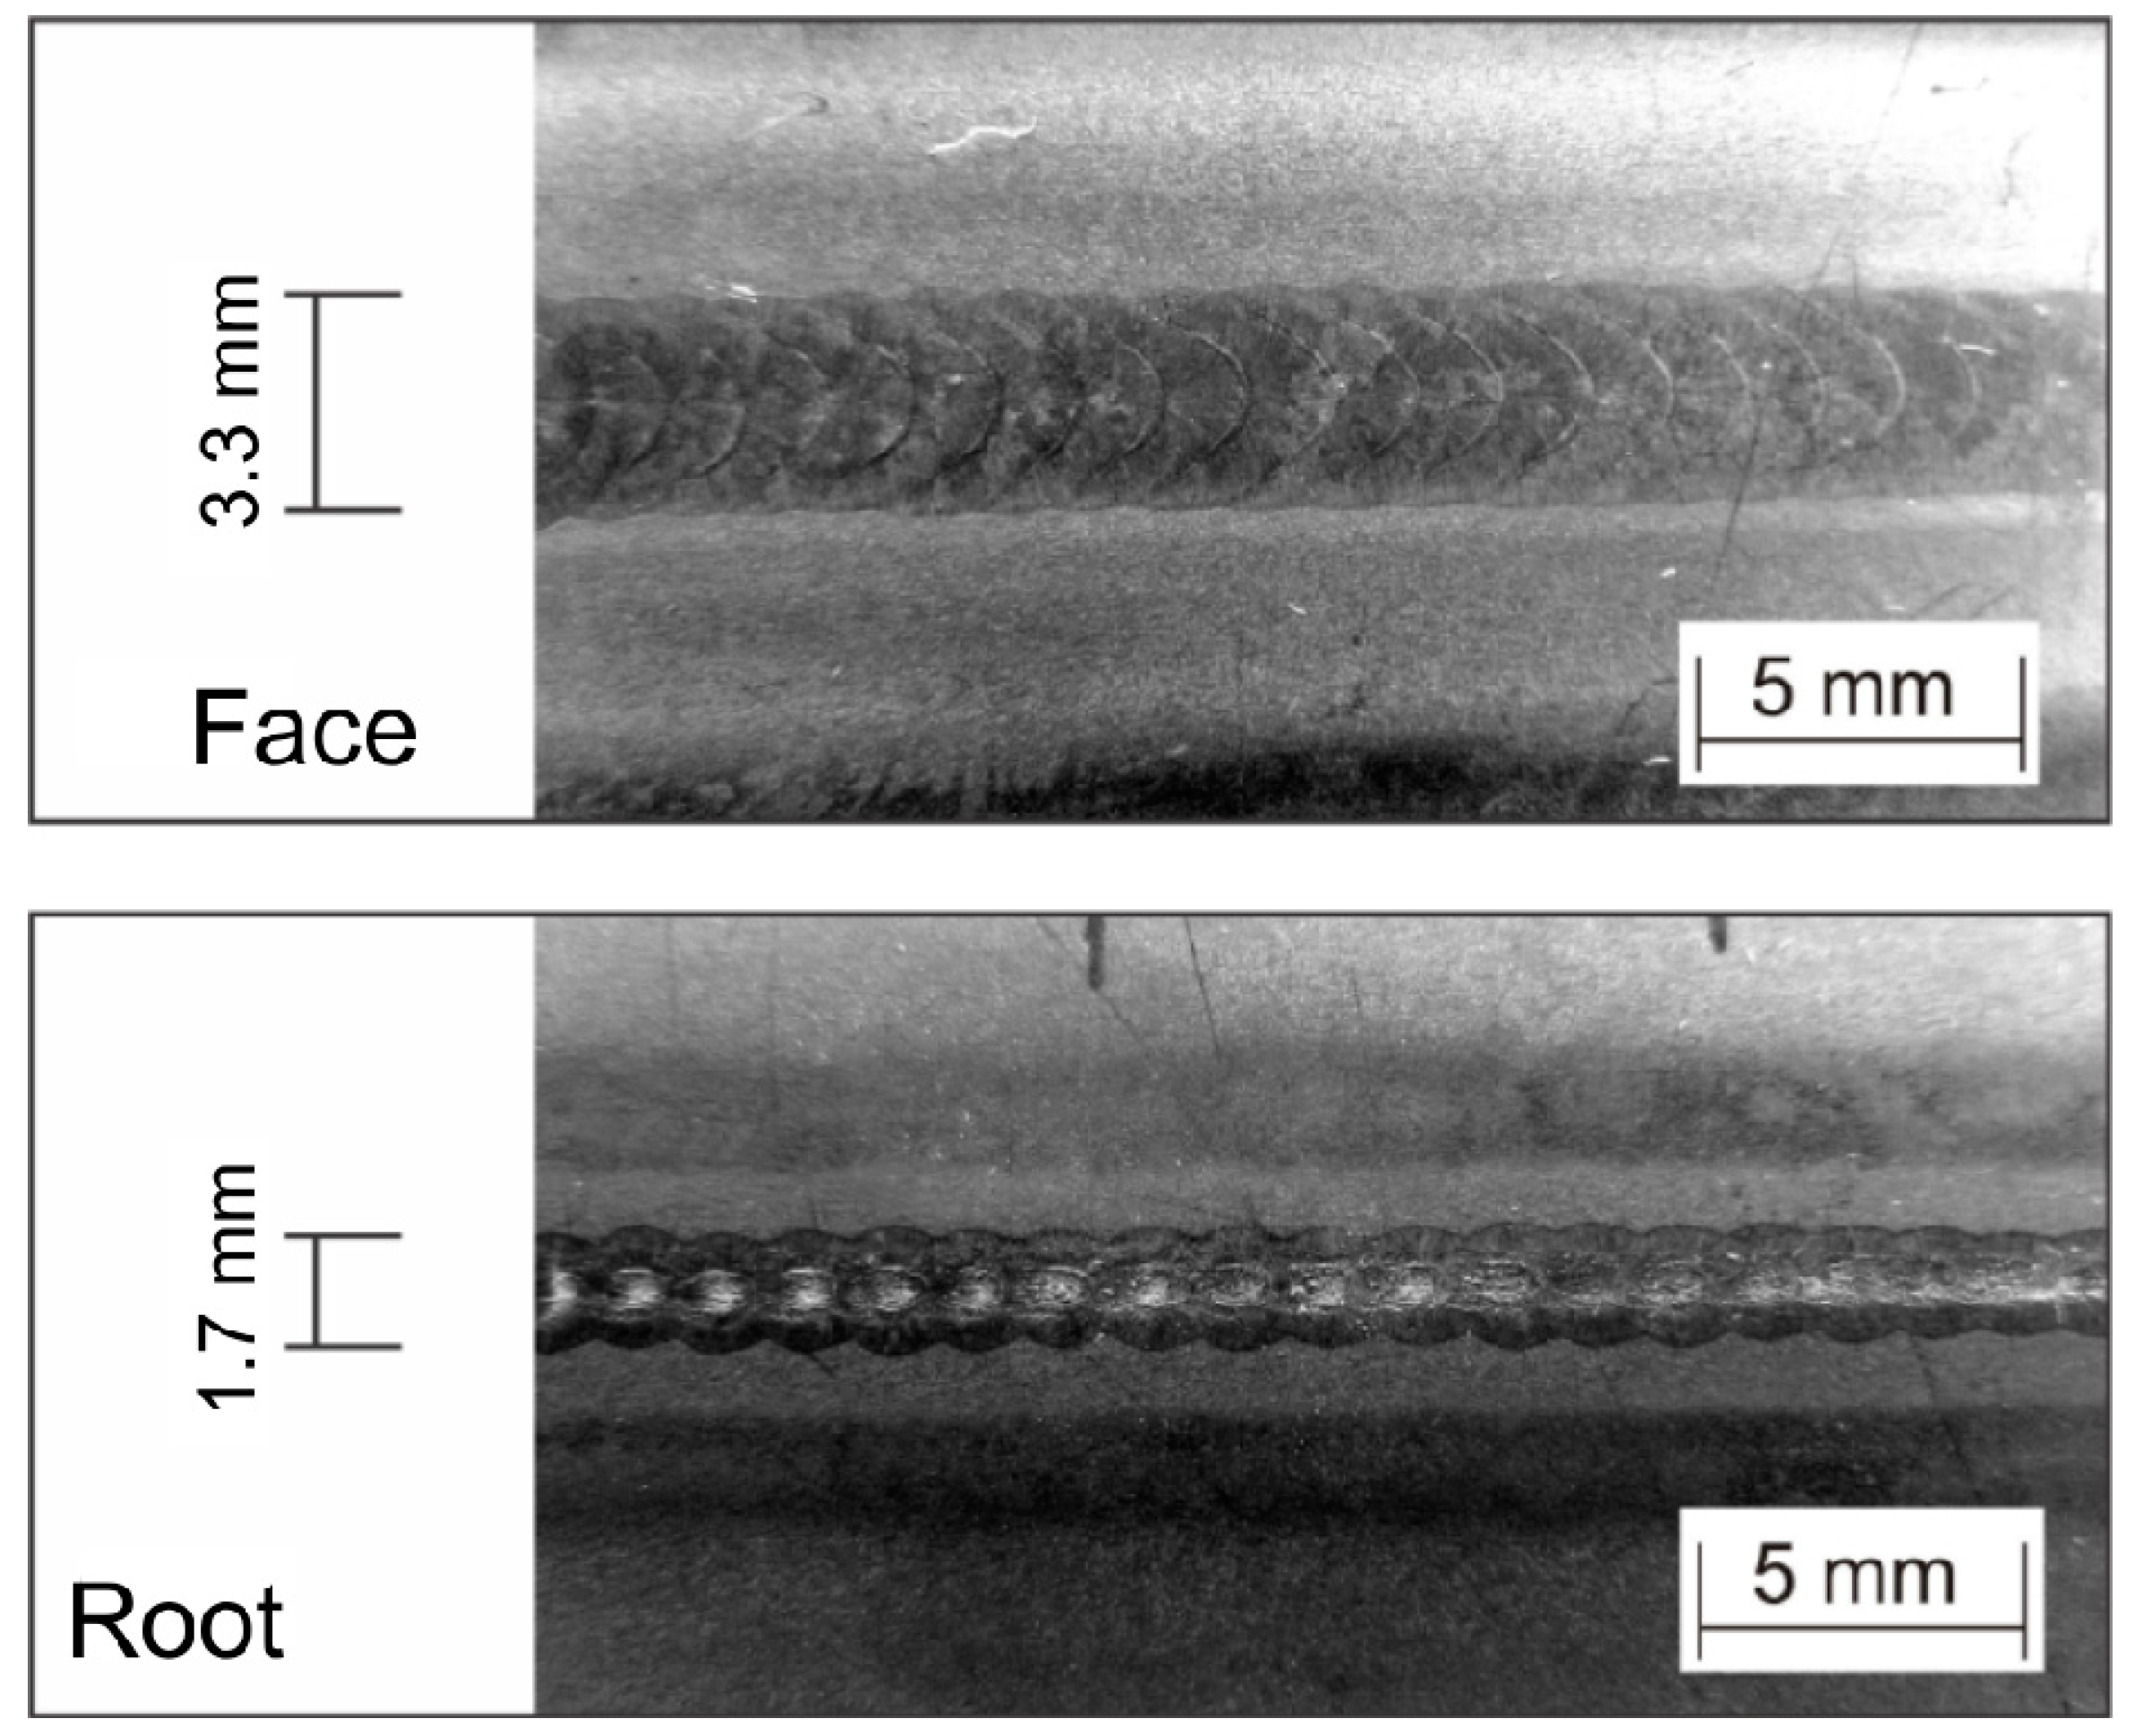
  • It was demonstrated experimentally and by numerical simulation that the overlap of the molten pool in each current pulse is different when comparing the face and root of the weld bead.
  • In a sheet with a thickness of 1.0 mm, this difference is clearly observed, which suggests that this is a growing effect as the thickness of the piece increases. This characteristic correlates with the fact that as the pulsation frequency increases, the form factor decreases (FW increases and RW decreases). This contradicts what is commonly spread in the literature; that pulsed current, in a generic way, improves the weld profile and produces deeper penetration. Further studies are planned to be carried out addressing thicker plates and high-strength carbons steels, in order to verify the effect of the low frequency pulsation on the mechanical resistance of the materials.
  • The experiments also demonstrated that the effect of generating an equiaxed solidification microstructure only occurs effectively for low pulsation frequencies and, consequently, low welding speeds.
  • Through thermal modeling, it was possible to didactically verify the behavior of the molten zone and the overlap in each current pulse for different frequencies and welding speeds. A pulsation frequency of 1 Hz allows a maximum welding speed of 3.3 mm/s (20 cm/min), while a frequency of 2.5 Hz allows a maximum value of 4.1 mm/s (25 cm/min), generating a lack of overlap of the molten zone in the root of the weld from these values.

Supplementary Materials

The following supporting information can be downloaded at: https://www.mdpi.com/article/10.3390/met13081387/s1.

Author Contributions

Conceptualization, J.C.D., K.C.R. and R.H.G.e.S.; methodology, J.C.D. and K.C.R.; software, K.C.R.; validation, J.C.D., K.C.R. and A.J.R.; investigation, J.C.D., K.C.R. and R.H.G.e.S.; resources, J.C.D. and K.C.R.; writing—original draft preparation, J.C.D., K.C.R., R.H.G.e.S. and A.J.R.; writing—review and editing, J.C.D., K.C.R., R.H.G.e.S. and A.J.R.; supervision, R.H.G.e.S. and A.J.R.; project administration, K.C.R.; funding acquisition, R.H.G.e.S. All authors have read and agreed to the published version of the manuscript.

Funding

This research was funded by National Council for Scientific and Technological Development (CNPq), grant number 41820/2019-5 and 201125/2019-6. The research was also founded by the Federal University of Santa Catarina and Petrobras, grant number 2017/00380-9.

Institutional Review Board Statement

Not applicable.

Informed Consent Statement

Not applicable.

Data Availability Statement

Not applicable.

Acknowledgments

The author would like to acknowledge LABSOLDA’s technical group and by its support in this research.

Conflicts of Interest

The authors declare that they do not have financial interest or personal relationship that could have appeared to influence the work reported in this paper. Thus, the authors declare that there is no conflict of interest. The funders had no role in the design of the study; in the collection, analyses, or interpretation of data; in the writing of the manuscript; or in the decision to publish the results.

References

  1. Welding Handbook—Welding Processes, Part 1, 9th ed.; American Welding Society: Miami, FL, USA, 2004; Volume 2.
  2. Kou, S.; Le, Y. Nucleation Mechanism and Grain Refining of Weld Metal. Weld. J. 1986, 65, 305–320. Available online: https://app.aws.org/wj/supplement/WJ_1986_12_s305.pdf (accessed on 20 April 2023).
  3. Kumar, B.M.D.; Manikandan, M. Effect of continuous and pulsed current techniques on wire-arc additive manufacturing of a nick-el-based superalloy. Mater. Lett. 2023, 338, 134080. [Google Scholar] [CrossRef]
  4. Killing, U. Empfehlungen zur Schweißparameterauswahl: Vollmechanisiertes WIG-Impulorbitalschweißen Der Praktiker. In Der Praktiker—DasMagazin für Schweißtechnik und Mehr; DVS: Düsseldorf, Germany, 2019. [Google Scholar]
  5. Dutra, J.C. Ciência e Tecnologia da Soldagem a Arco Voltaico dos Fundamentos às Modernas Técnicas. Alfa Centauri. 2023. Available online: https://labsolda.ufsc.br/noticias/1033-lancamento-do-livro-ciencia-e-tecnologia-da-soldagem-a-arco-voltaico-dos-fundamentos-as-modernas-tecnicas (accessed on 5 June 2023).
  6. Riffel, K.C.; Silva, R.H.G.; Haupt, W.; Silva, L.E.; Dalpiaz, G. Effect of dynamic wire in the GTAW process: Microstructure and corrosion resistance. J. Mat. Proc. Tech. 2020, 285, 116578. [Google Scholar] [CrossRef]
  7. Riffel, K.C.; Silva, R.H.G.; Pompermeyer, M.O.; Dalpiaz, G. Effect of dynamic wire in the GTAW process. J. Mat. Proc. Tech. 2019, 269, 91–101. [Google Scholar] [CrossRef]
  8. Wang, H.; Hu, S.; Shen, J.; Li, D.; Lu, J. Effect of duty cycle on microstructure and mechanical properties of pulsed GTAW lap joint of Invar. J. Mat. Proc. Tech. 2017, 243, 481–488. [Google Scholar] [CrossRef]
  9. Cunha, T.V.; Bohórquez, C.E.N. Effects of current pulsation at ultra-high frequency on physical aspects of the arc and its implications in the weld bead morphology in the GTAW process. Weld World 2021, 65, 251–261. [Google Scholar] [CrossRef]
  10. Santos, F.J.; Dutra, G.B.; Cunha, T.V. Microstructural and mechanical evaluation of a dissimilar joining between SAE 1020 and AISI 304 steel obtained via ultra-high-frequency-pulsed GTAW. J. Braz. Soc. Mec. Sci. Eng. 2019, 41, 26. [Google Scholar] [CrossRef]
  11. Widyianto, A.; Baskoro, A.S.; Kiswanto, G. Effect of Pulse Currents on Weld Geometry and Angular Distortion in Pulsed GTAW of 304 Stainless Steel Butt Joint. J. Automot. Mech. Eng. 2020, 17, 7687–7694. [Google Scholar] [CrossRef] [Green Version]
  12. Tabrizi, T.R.; Sabzi, M.; Anijdan, S.H.M.; Eivani, A.R.; Park, N.; Jafarian, H.R. Comparing the effect of continuous and pulsed current in the GTAW process of AISI 316L stainless steel welded joint: Microstructural evolution, phase equilibrium, mechanical properties and fracture mode. J. Mat. Res. Tech. 2021, 15, 199–212. [Google Scholar] [CrossRef]
  13. Arivarasua, M.; Kasinatha, D.R.; Natarajana, A. Effect of Continuous and Pulsed Current on the Metallurgical and Mechanical Properties of Gas Tungsten Arc Welded AISI 4340 Aeronautical and AISI 304 L Austenitic Stainless Steel Dissimilar Joints. Mat. Res. 2015, 18, 59–77. [Google Scholar] [CrossRef] [Green Version]
  14. Sivakumar, N.; Sanjay Gandhi, B.; Senthil Kumar, K.; Arulmurugan, B. Effect of constant current and pulsed current gas tungsten arc welding process on microstructure and mechanical properties of superalloy 59 joints. Mater. Res. Express 2022, 9, 046525. [Google Scholar] [CrossRef]
  15. Balasubramanian, V.; Ravisankar, V.; Reddy, G.M. Effect of pulsed current welding on mechanical properties of high strength aluminum alloy. Int. J. Adv. Manuf. Technol. 2008, 36, 254–262. [Google Scholar] [CrossRef]
  16. Yang, M.; Qi, B.; Cong, B.; Liu, F.; Yang, Z. Effect of pulse frequency on microstructure and properties of Ti-6Al-4V by ultrahigh-frequency pulse gas tungsten arc welding. Int. J. Manuf. Technol. 2013, 68, 19–31. [Google Scholar] [CrossRef]
  17. Reddy, G.M.; Gokhale, A.A.; Rao, K.P. Effect of the ratio of peak and background current durations on the fusion zone microstructure of pulsed current gas tungsten arc welded Al-Li alloy. J. Mat. Sci. Let. 2002, 21, 1623–1625. [Google Scholar] [CrossRef]
  18. Kumar Senthil, T.; Balasubramanian, V.; Sanavillah, M.Y. Influences of pulsed current tungsten inert gas welding parameters on the tensile properties of AA 6061 aluminum alloy. Mat. Des. 2007, 28, 2080–2092. [Google Scholar] [CrossRef]
  19. Yousefieh, M.; Shamanian, M.; Saatchi, A. Optimization of the pulsed current gas tungsten arc welding (PCGTAW) parameters for corrosion resistance of super duplex stainless steel (UNS S32760) welds using the Taguchi method. J. Alloy. Comp. 2011, 509, 782–788. [Google Scholar] [CrossRef]
  20. Du, J.; Zhao, G.; Wei, Z. Effects of Welding Speed and Pulse Frequency on Surface Depression in Variable Polarity Gas Tungsten Arc Welding of Aluminum Alloy. Metals 2019, 9, 114. [Google Scholar] [CrossRef] [Green Version]
  21. Egerland, S.; Zimmer, J.; Brunmaier, R.; Nussbaumer, R.; Posch, G.; Rutzinger, B. Advanced Gas Tungsten Arc Weld Surfacing Current Status and Application. Soldag. Inspeção 2015, 20, 300–314. [Google Scholar] [CrossRef] [Green Version]
  22. Silva, R.H.G.; Riffel, K.C.; Carvalho, L.P.; Kejelin, N.Z. Double-Sided welding as an alternative for joining internally clad pipes. J. Pipeline Sys. Eng. Prac. 2020, 11, 04020012. [Google Scholar] [CrossRef]
  23. IMC Welding. Multiprocess Welding Power Source Digiplus A7. Available online: https://www.imc-soldagem.com.br/pt-br/equipamentos/fontes-de-soldagem/multiprocesso/linha-digiplus-a7 (accessed on 5 May 2023).
  24. SPS (Welding and Processes Solutions). Tartílope V4. Available online: https://www.sps-soldagem.com.br/tartilope_v4.php (accessed on 5 May 2023).
  25. Goldak, J.; Chakravarti, A.; Bibby, M. A New Finite Element Model for Welding Heat Sources. Metal. Trans. B 1984, 15B, 299–305. Available online: https://link.springer.com/content/pdf/10.1007/BF02667333.pdf?pdf=button (accessed on 11 April 2023). [CrossRef]
  26. Fuerschbach, P.W.; Knorovsky, G.A. A Study of Melting Efficiency in Plasma Arc and Gas Tungsten Arc Welding. Weld. J. 1991, 11, 287–298. Available online: https://app.aws.org/wj/supplement/WJ_1991_11_s287.pdf (accessed on 11 April 2023).
  27. Incropera, F.P.; Dewitt, D.P.; Bergman, T.L.; Lavine, A.S. Fundamentals of Heat and Mass Transfer, 8th ed.; John Wiley: Hoboken, NJ, USA, 2017; ISBN 978-1-119-38291-1. [Google Scholar]
  28. Abu-Aesh, M.; Taha, M.; El-Sabbagh, A.S.; Dorn, L. Hot-cracking susceptibility of fully austenitic stainless steel using pulsed-current gas tungsten arc-welding process. Eng. Rep. 2021, 3, e12308. [Google Scholar] [CrossRef]
  29. Masumoto, I.; Shinoda, T.; Ueno, Y. Effect of Pulse Welding Current on Solidification Cracking in Austenitic Stainless Steel Weld Metal. Quart. J. Jap. Weld. Soc. 1989, 7, 245–249. Available online: https://www.jstage.jst.go.jp/article/qjjws1983/7/2/7_2_245/_pdf/-char/en (accessed on 5 May 2023). [CrossRef] [Green Version]
  30. Souza, D.; Vilhalba, L.B.; Passos, T.A.; Moura, E.A.M.; Costa, H.L.; Osorio, A.G. Corrosion Resistance of Thermal-pulsed Inconel 625 MIG/MAG Weld Overlays. Surf. Topogr. Metrol. Prop. 2021, 9, 025036. [Google Scholar] [CrossRef]
  31. Gu, Y.; Lu, N.; Xu, Y.; Shi, Y.; Zhang, G.; Sun, Q. Microstructure Characteristics of Q345R-Steel Welded Joints and their Corrosion Behavior in a Hydrofluoric Acid Environment. J. Nuc. Mat. 2023, 574, 154214. [Google Scholar] [CrossRef]
Figure 1. Schematic of the pulsed current waveform used in the experiments.
Metals 13 01387 g001
Figure 2. Representation of two molten pools with a diameter L and an overlap length “S” of 50%.
Metals 13 01387 g002
Figure 3. Setting of the geometric variables and power input of the finite element model on the software window.
Metals 13 01387 g003
Figure 4. Rectangular pulsed waveform programmed on the software in order to consider the thermal pulsation of the double-ellipsoidal power source.
Metals 13 01387 g004
Figure 5. Finite element model of the welded plate using tetrahedral elements and symmetry boundary condition.
Metals 13 01387 g005
Figure 6. Face (upper) and root (lower) of a weld made with constant direct current (average value of 30 A) and welding speed of 2.5 mm/s (15 cm/min).
Metals 13 01387 g006
Figure 7. Face (upper) and root (lower) view of a pulsed current weld (Ip = 50 A, Ib = 10 A, tp = tb = 0.5 s, f = 1 Hz) obtained with an average current of 30 A and a welding speed of 2.5 mm/s (15 cm/min).
Metals 13 01387 g007
Figure 8. Micrograph of the weld bead produced with constant current (a) = 30×, (b,c) = 50×.
Metals 13 01387 g008
Figure 9. Micrograph of the weld bead produced with pulsed current (Ip = 50 A, Ib = 10 A, tp = tb = 0.5 s, f = 1 Hz) (Magnification (a) = 30×, (b,c) = 50×).
Metals 13 01387 g009
Figure 10. Face (upper) and root (lower) face of a pulsed current weld (Ip = 50 A, Ib = 10 A, tp = tb = 0.2 s, f = 2.5 Hz); average current of 30 A and welding speed of 3.0 mm/s (18 cm/min).
Metals 13 01387 g010
Figure 11. Micrograph of the weld in Figure 10: (a) Periphery (b) Center (Magnification: 50×).
Metals 13 01387 g011
Figure 12. Welding carried out with a duty cycle of 25% (Ip = 90 A, tp = 0.1 s, Ib = 10 A, tb = 0.3 s) and welding speed of 3.0 mm/s (18 cm/min).
Metals 13 01387 g012
Figure 13. Micrograph of the weld in Figure 12, pulsed current at 2.5 Hz and duty cycle of 25%; 3.0 mm/s (18 cm/min); (a) Center (b) Periphery (Magnification: 50×).
Metals 13 01387 g013
Figure 14. Face (upper) and root (lower) of a pulsed current weld (Ip = 150 A, Ib = 10 A, tp = 0.1 s, tb = 0.2 s, f = 2.5 Hz); average current of 30 A and welding speed of 5.8 mm/s (35 cm/min).
Metals 13 01387 g014
Figure 15. Micrographs of the weld presented in Figure 14; Im = 45 A, Ip 150 A, Ib = 10 A, tp = 0.1 s, tb = 0.3 s, welding speed of 5.8 mm/s (35 cm/min) (a) Periphery (b) Center (Magnification: 50×).
Metals 13 01387 g015
Figure 16. Comparison between simulation results and experimental ones for frequencies of 1.0 Hz and 2.5 Hz, with a speed of 2.5 mm/s (15 cm/min).
Metals 13 01387 g016
Figure 17. Simulated temperature distribution on the face of the weld bead for 1 Hz and 2.5 Hz, with welding speeds of 1.6 mm/s (10 cm/min), 3.3 mm/s (20 cm/min), and 4.1 mm/s (25 cm/min).
Metals 13 01387 g017
Figure 18. Simulated temperature distribution in the root of the weld bead for 1 Hz and 2.5 Hz, with welding speeds of 1.6 mm/s (10 cm/min), 3.3 mm/s (20 cm/min), and 4.1 mm/s (25 cm/min).
Metals 13 01387 g018
Table 1. Physical properties considered for austenitic stainless steel AISI 304.
Temperature (°C)2010030040060080010001500
Thermal conductivity (W/m·K)14.415.115.917.520.823.425.735.2
Specific heat (J/kg·K)430.9472.9490.9503.5552.4594.5613.2870.4
Density (kg/m3)80107931789278407755766776097579
Table 2. Physical properties considered in the correlations for calculating the convection heat-transfer coefficient.
Thermal conductivity (kair) (W/m·K)0.025
Specific heat (Cp_air) (J/kg·K)1006
Density (ρair) (kg/m3)1.23
Dynamic viscosity (μair) (Pa·s)1.83 × 10⁻⁵
Thermal expansion coefficient (αp) (1/K)3.43 × 10−3
Gravidade (m/s2)9.8
Disclaimer/Publisher’s Note: The statements, opinions and data contained in all publications are solely those of the individual author(s) and contributor(s) and not of MDPI and/or the editor(s). MDPI and/or the editor(s) disclaim responsibility for any injury to people or property resulting from any ideas, methods, instructions or products referred to in the content.

