
Effect of Laser Welding Parameters with Different Fillers on Solidification Cracking and Mechanical Properties of AA7075
 ,
,
Abstract
:1. Introduction
2. Materials and Experimental Procedure
2.1. Materials and Filler Metals
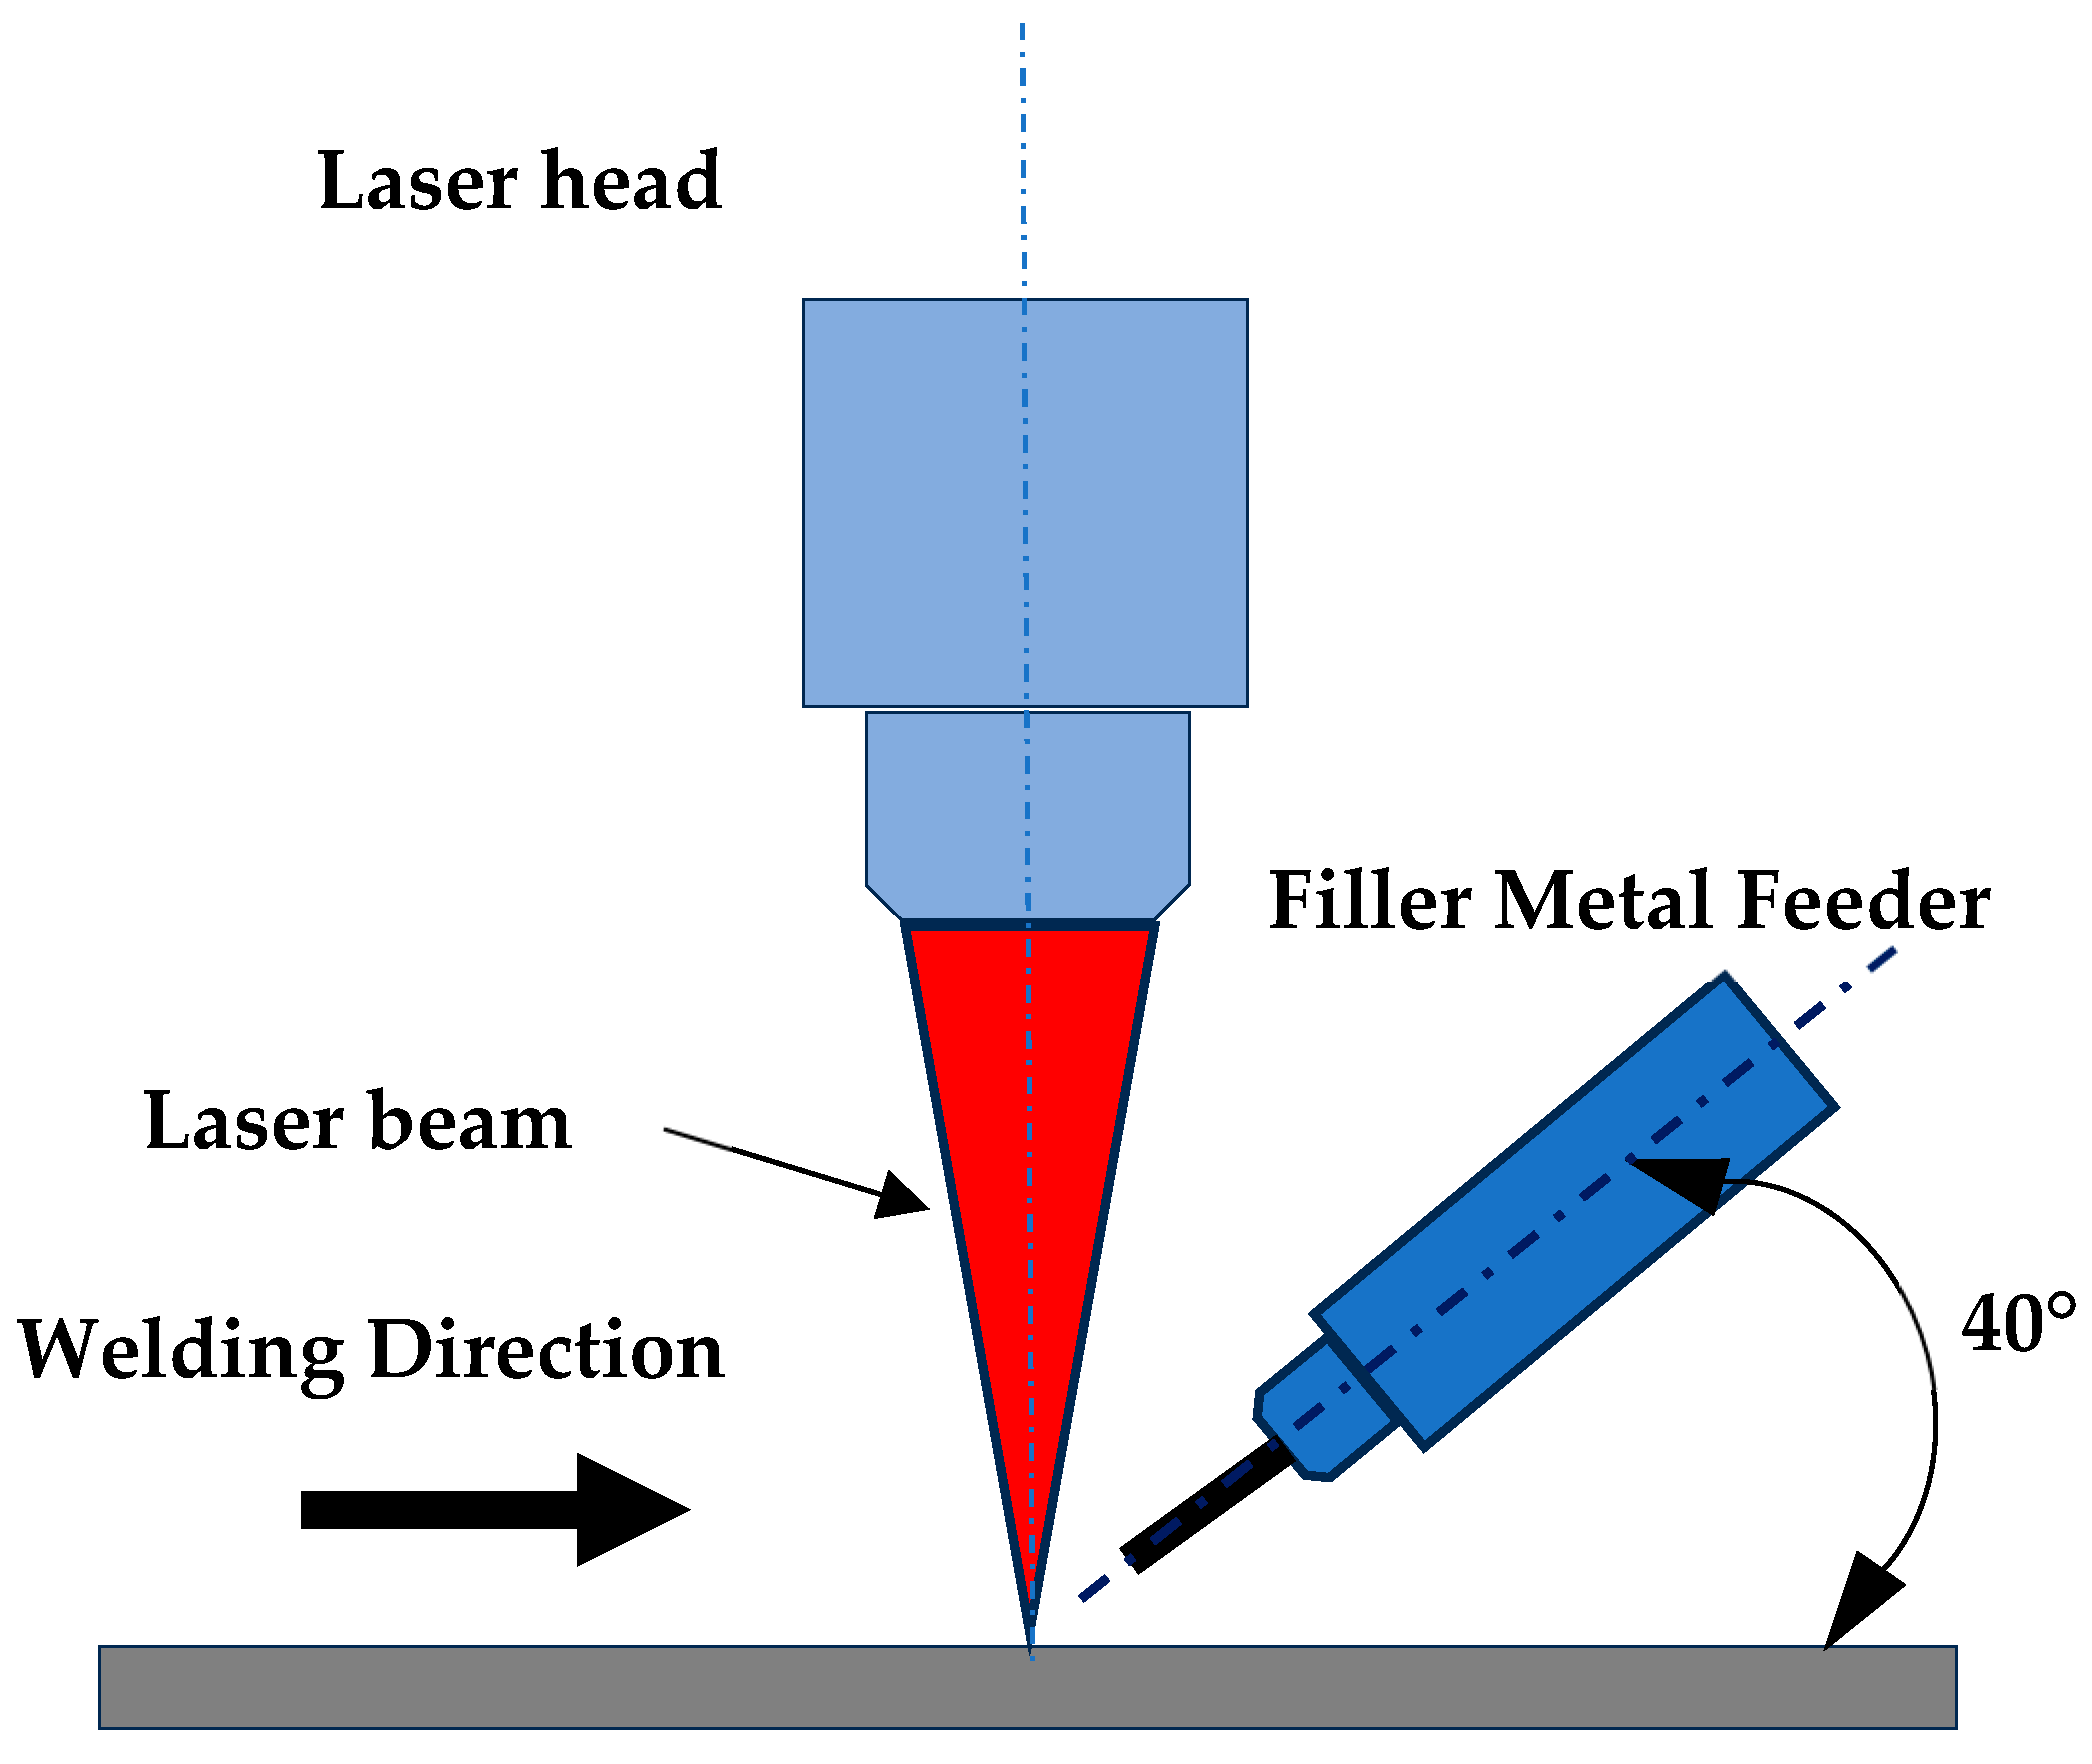
2.2. Welding Procedure and Parameters
2.3. X-Ray Detection of Cracks and Defects
2.4. Preparing Samples for Microstructure Analysis
2.5. The Micro-Flat Tensile Test with DIC
3. Results and Discussion
3.1. Effect of Filler Wires on Crack Reduction
3.2. Influence of the Welding Speed on Hot Cracking
3.3. Mechanical Properties Testing
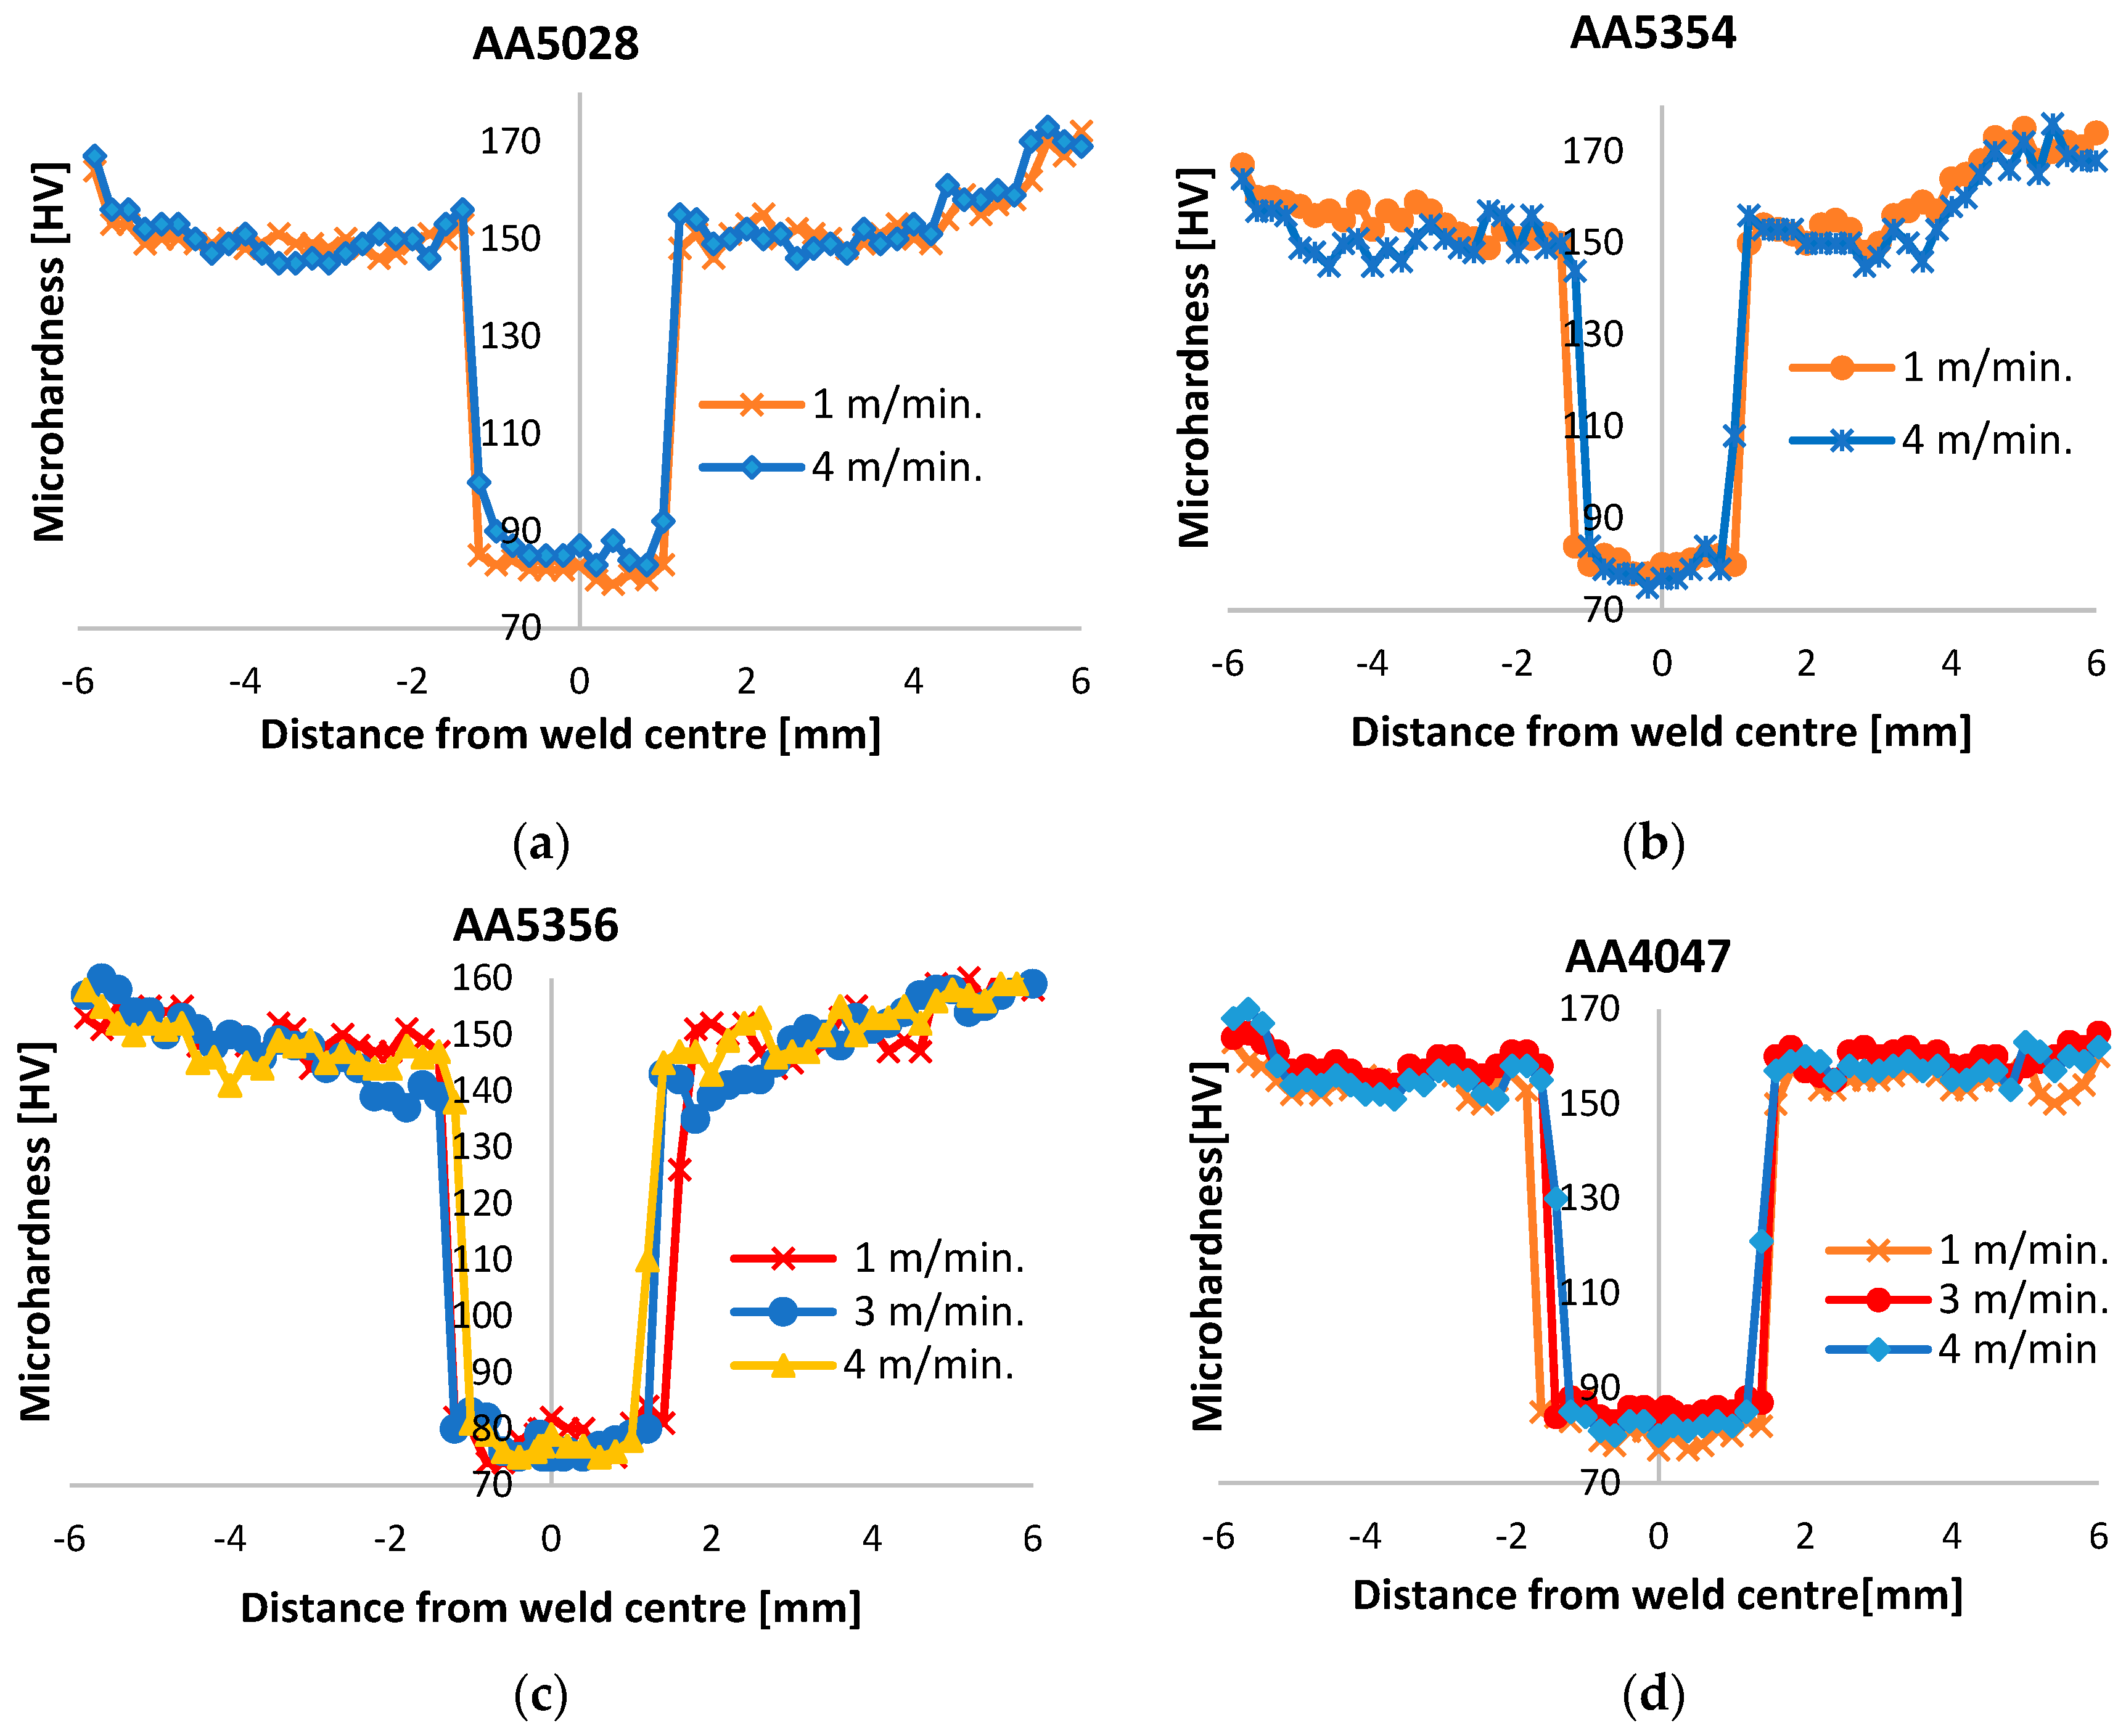
3.3.1. Microhardness
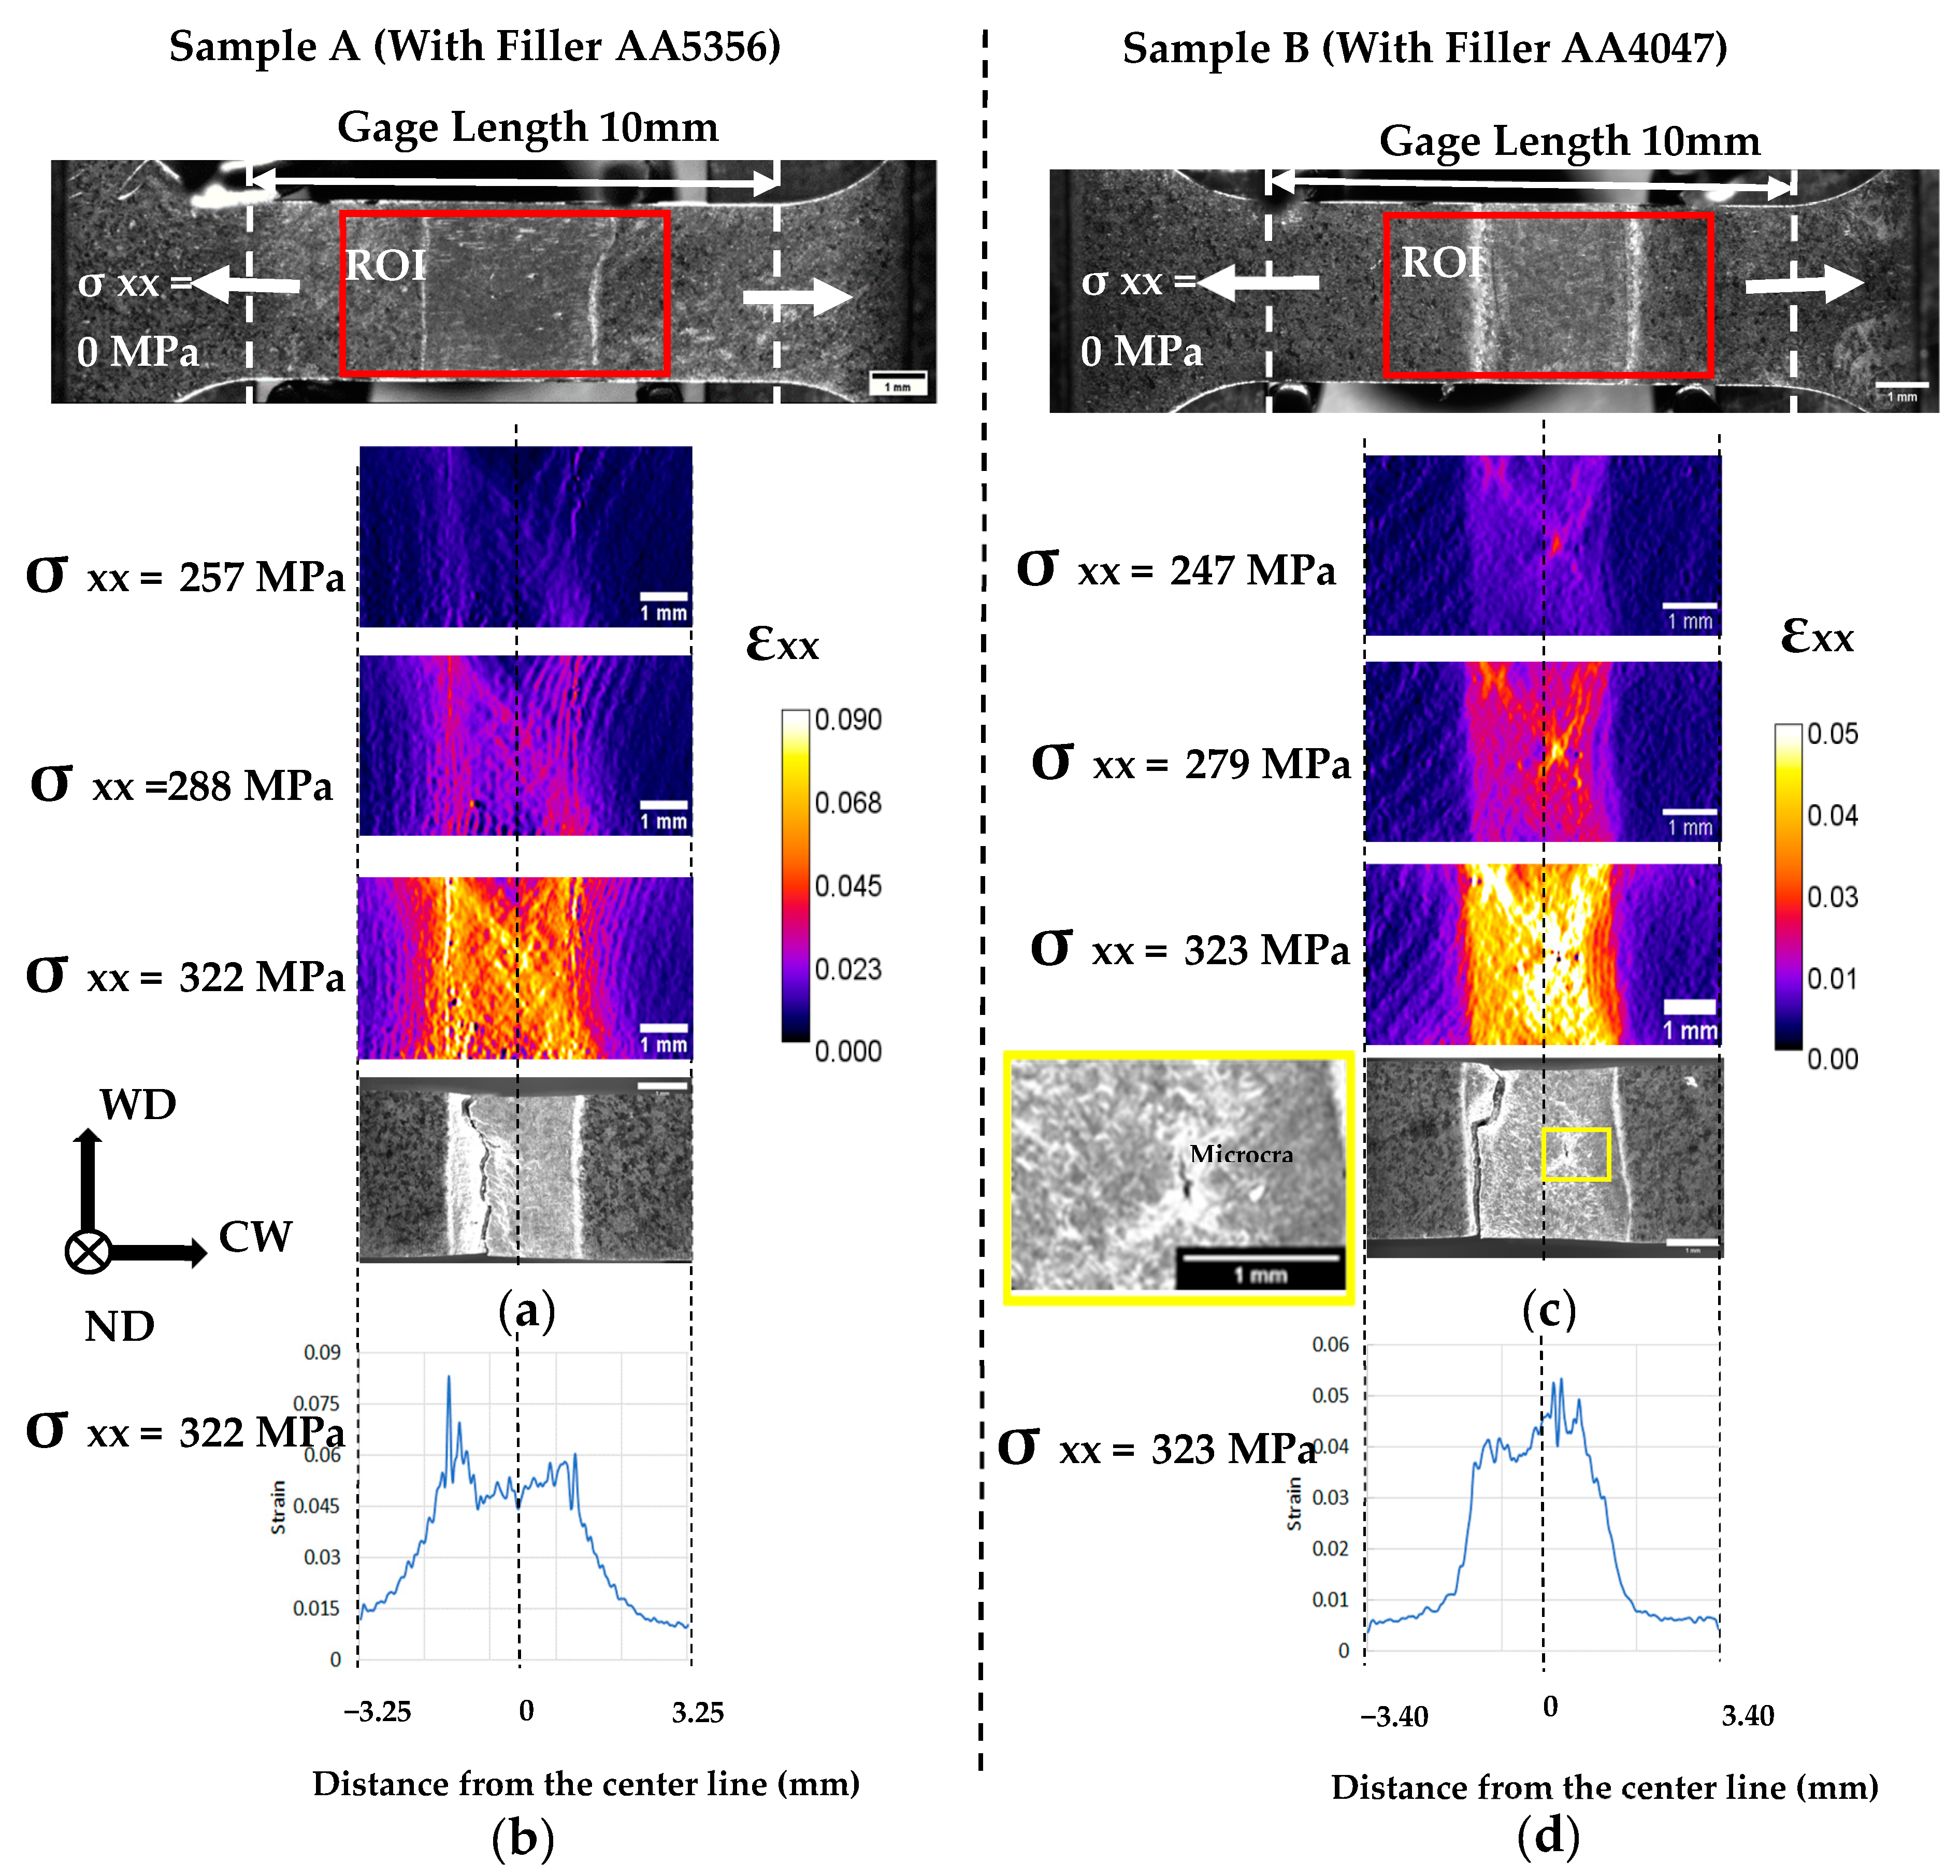
3.3.2. Micro-Tensile Flat with DIC
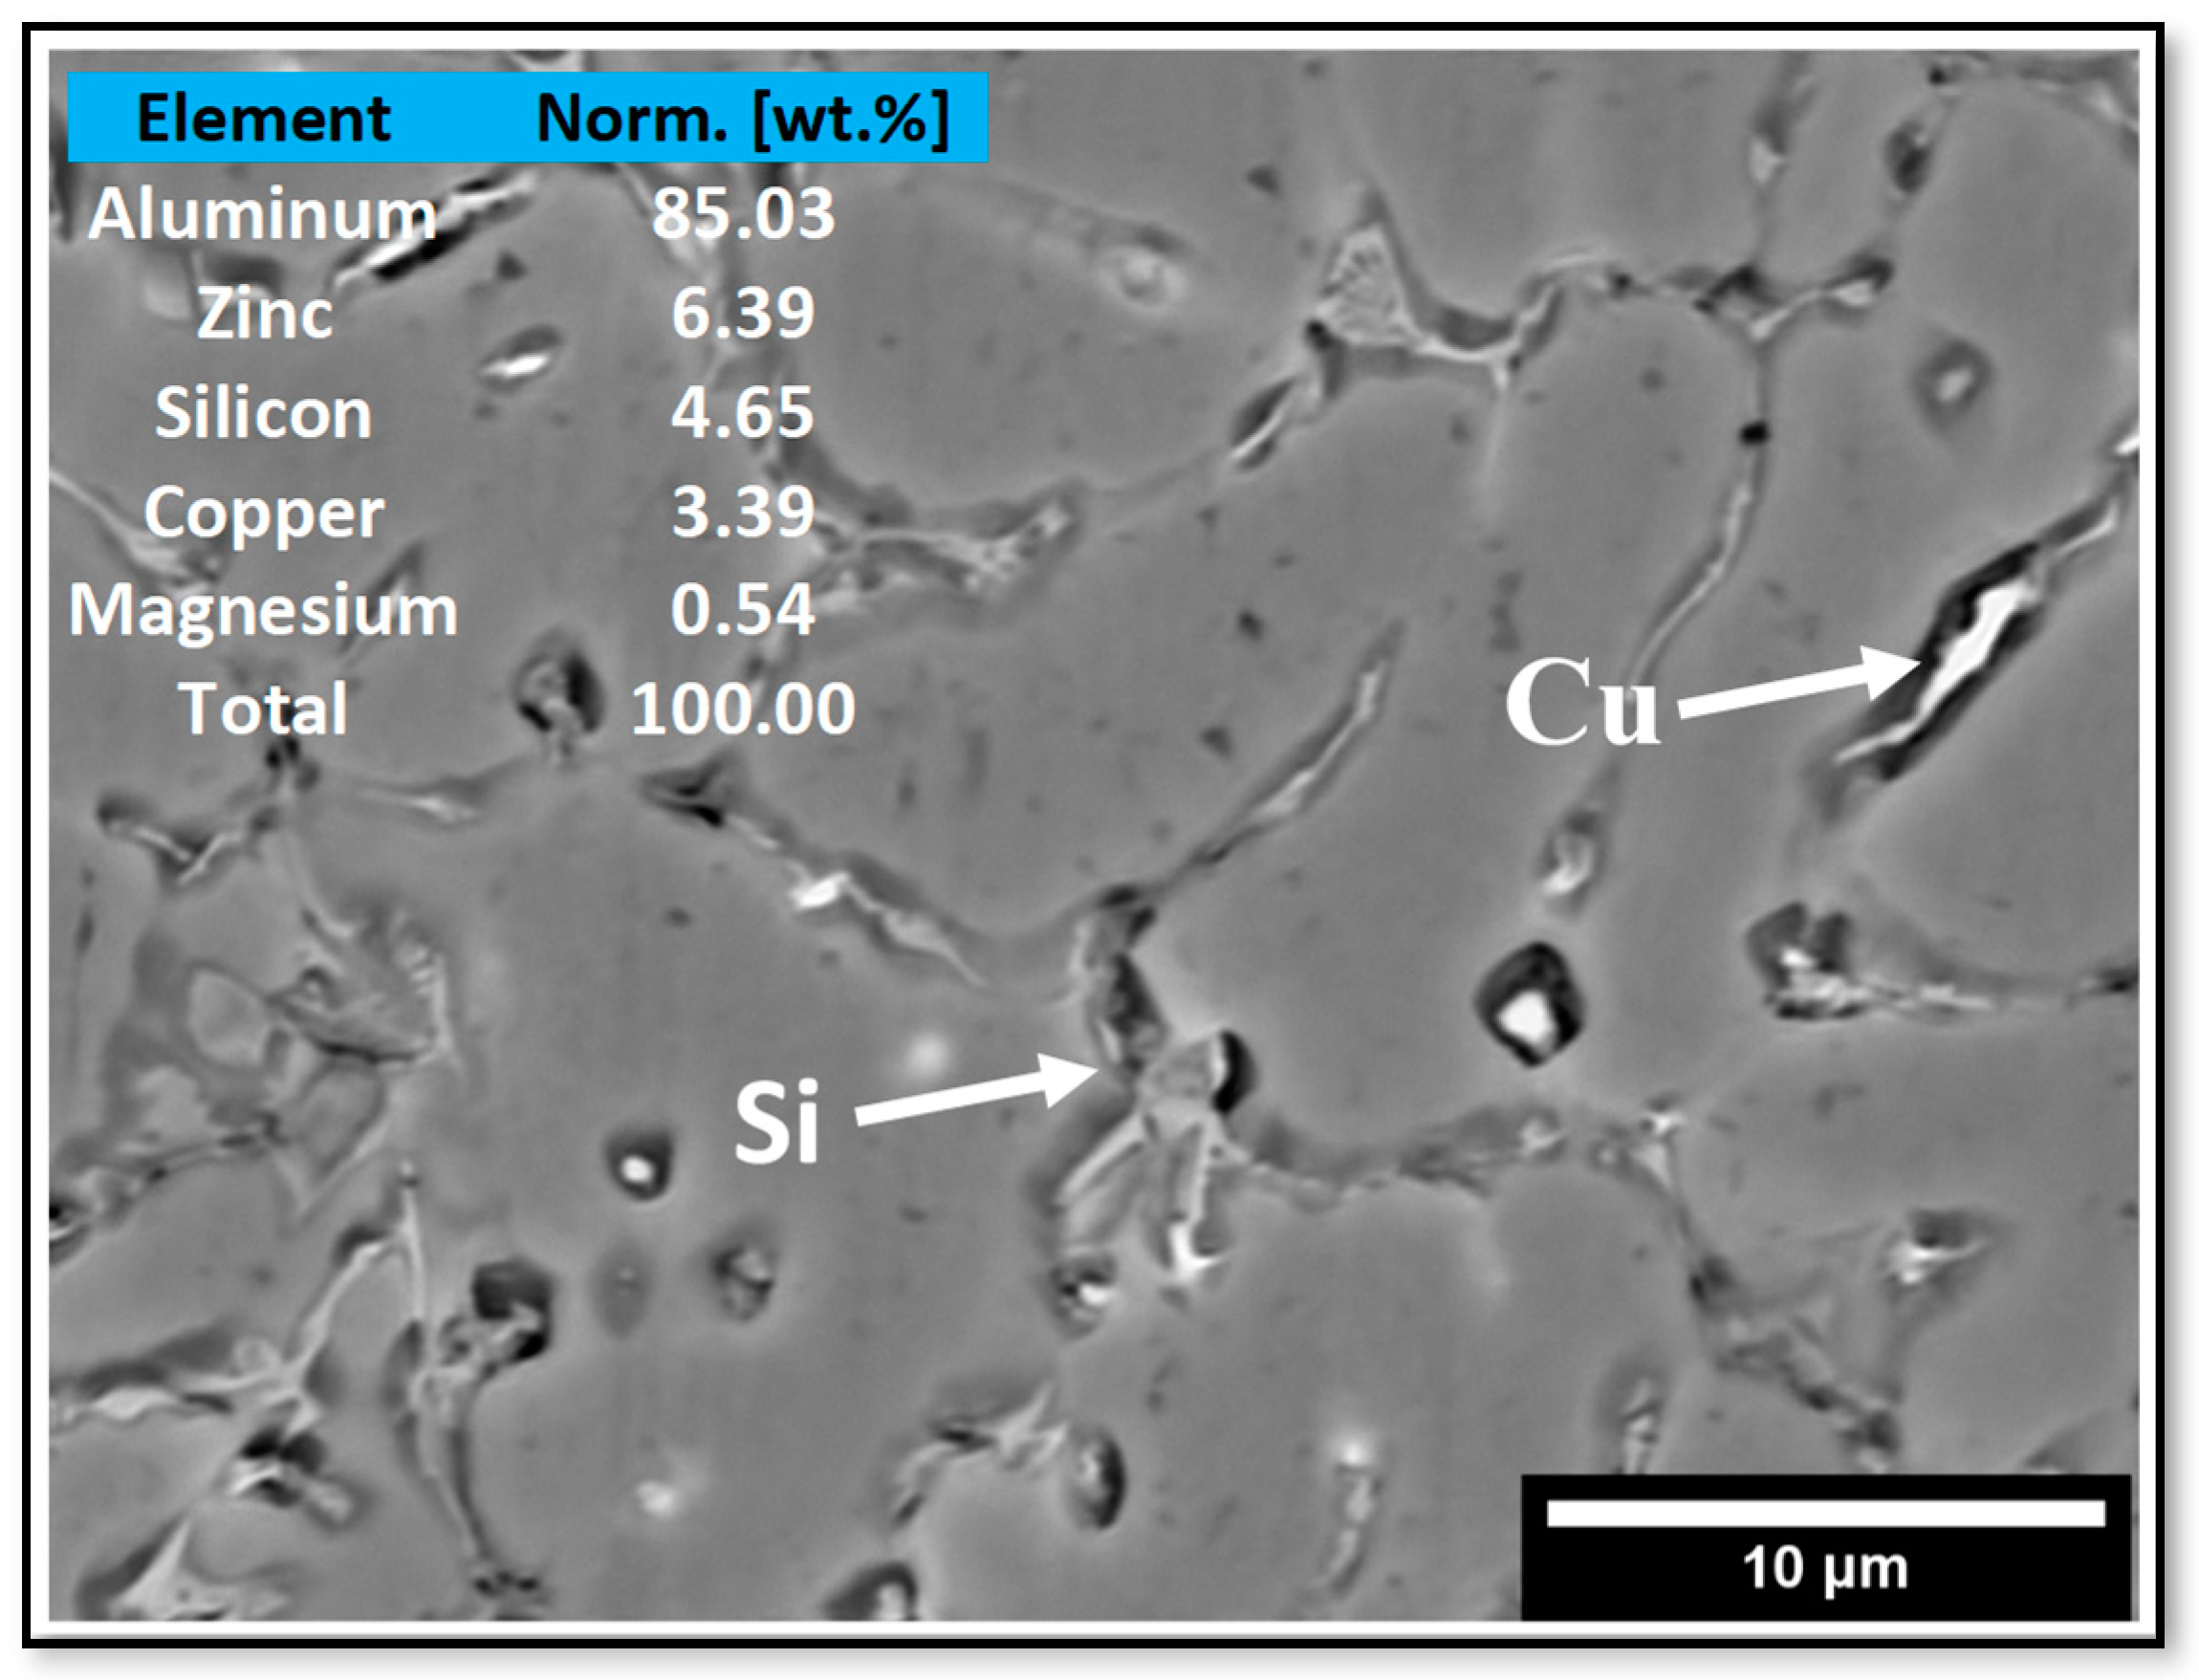
3.4. Evaluation of Microstructures
4. Conclusions
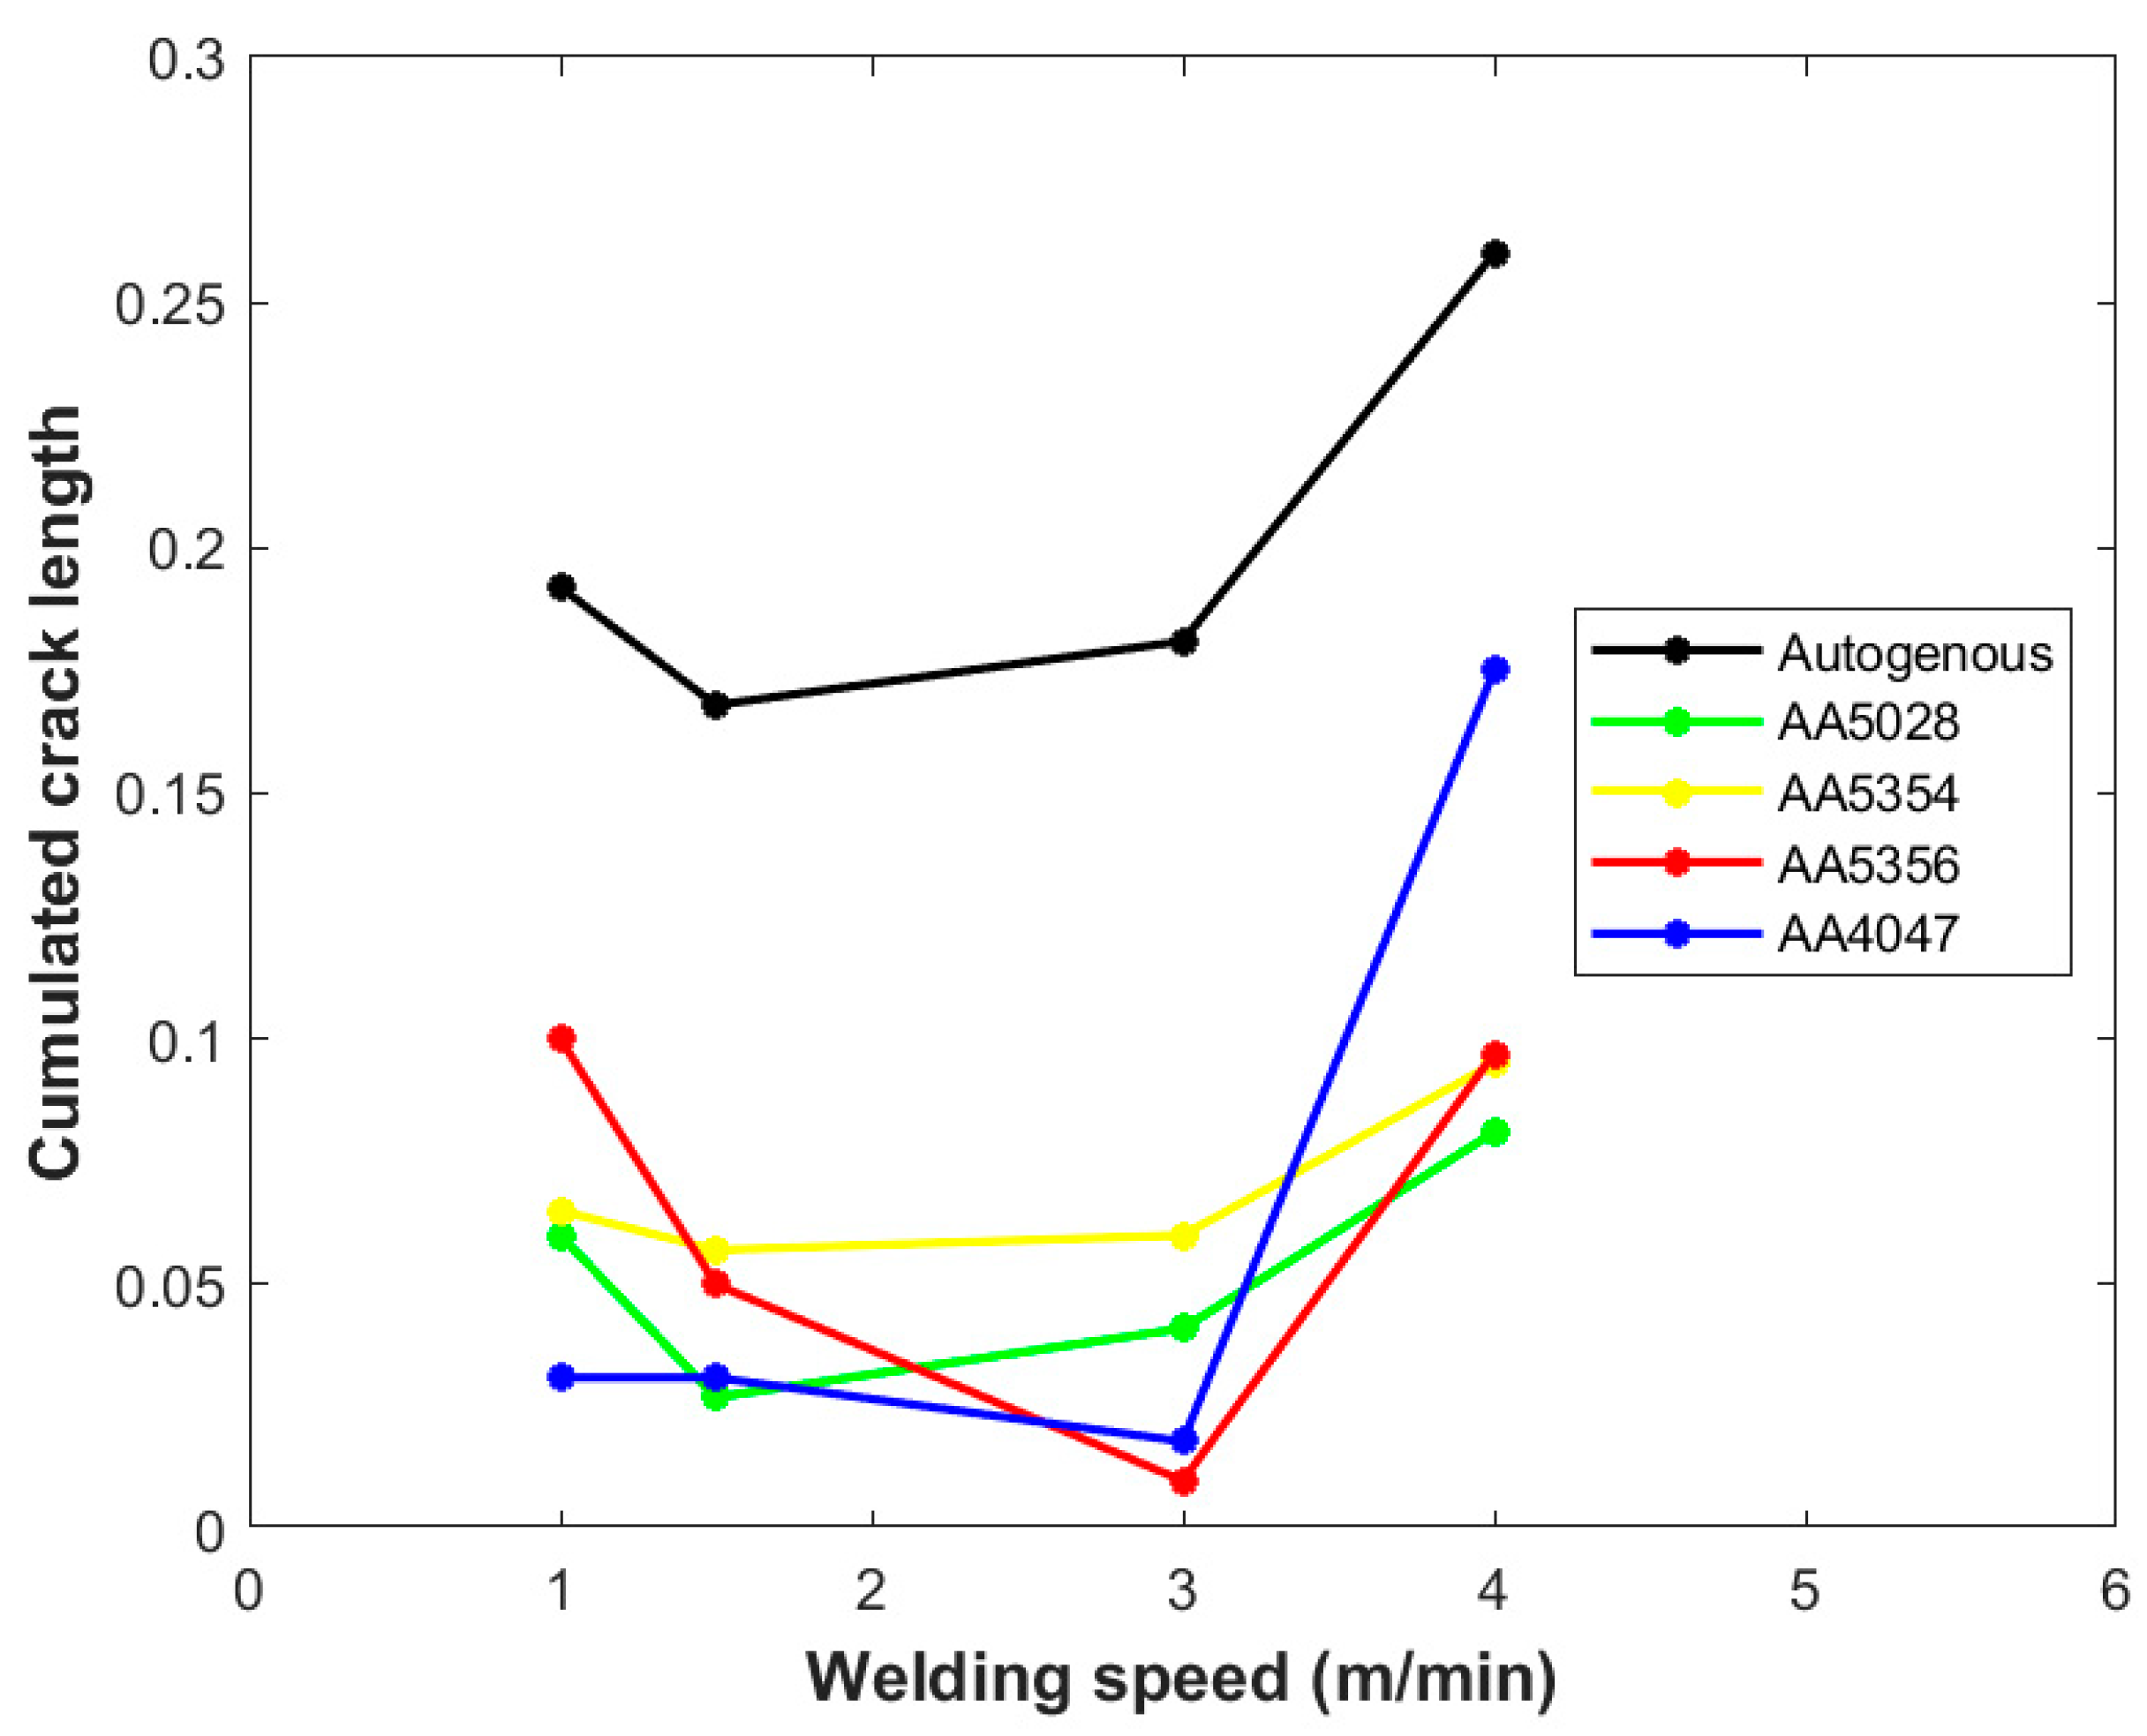
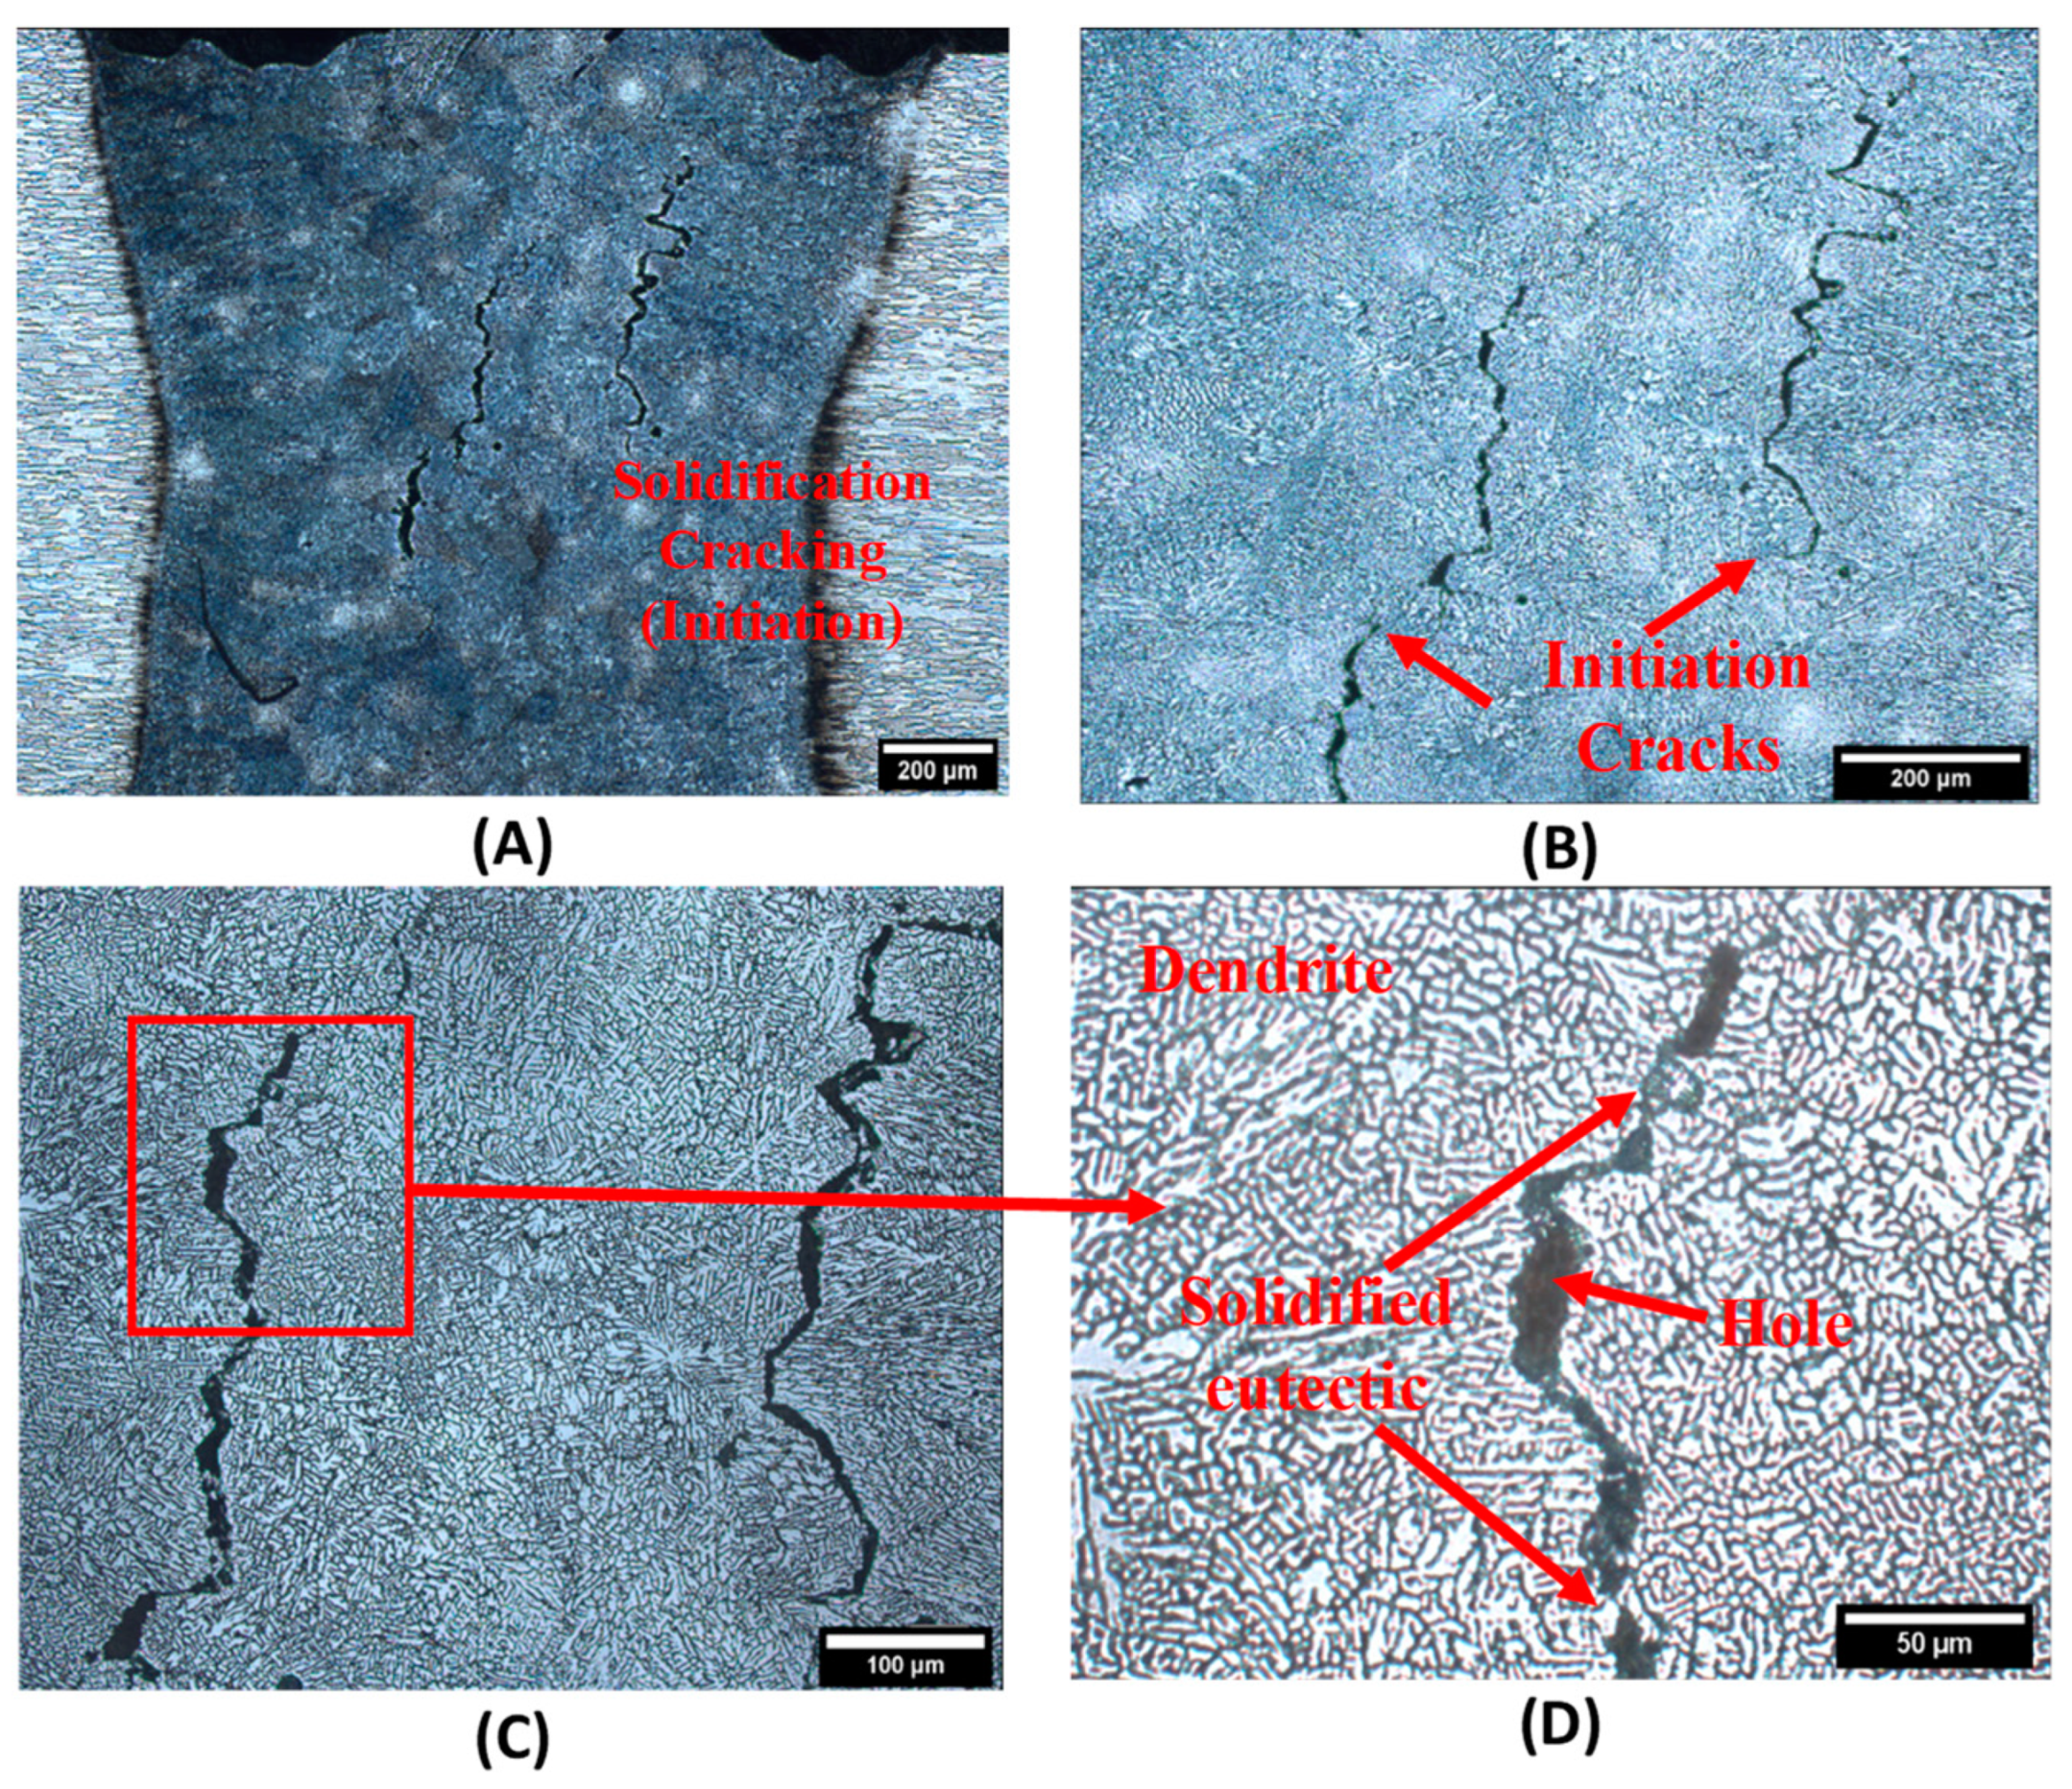
- Crack formation sensitivity is highest in autogenous welds, reduces when using AA5028, AA5354, and AA4047 fillers, and reaches a minimum with AA5356 filler metal.
- The solidification crack formation tendency varies with magnesium (Mg) content, decreasing when the Mg content reaches or exceeds 5.0%. This is especially evident in the AA5356 filler, characterized by its elevated magnesium content (5.5% by weight), distinguishing it from other fillers.
- Although there are variations in the fillers that were used, they all demonstrate a consistent relationship between the CCL and the welding speed. As the welding speed increases up to 3 m/min, the CCL consistently decreases, indicating that this speed represents the optimal condition for achieving the lowest CCL across all fillers.
- Other fillers show the lowest CCL at a 3 m/min welding speed; the lowest CCL is seen with AA5356 and the highest with AA5354, between 0.01 and 0.06, respectively. In contrast, the CCL reaches its highest level of about 0.26 with autogenous laser welds at a 4 m/min welding speed. Changing the welding speed from 1 m/min to 4 m/min reduced the width of the FZ by 9%.
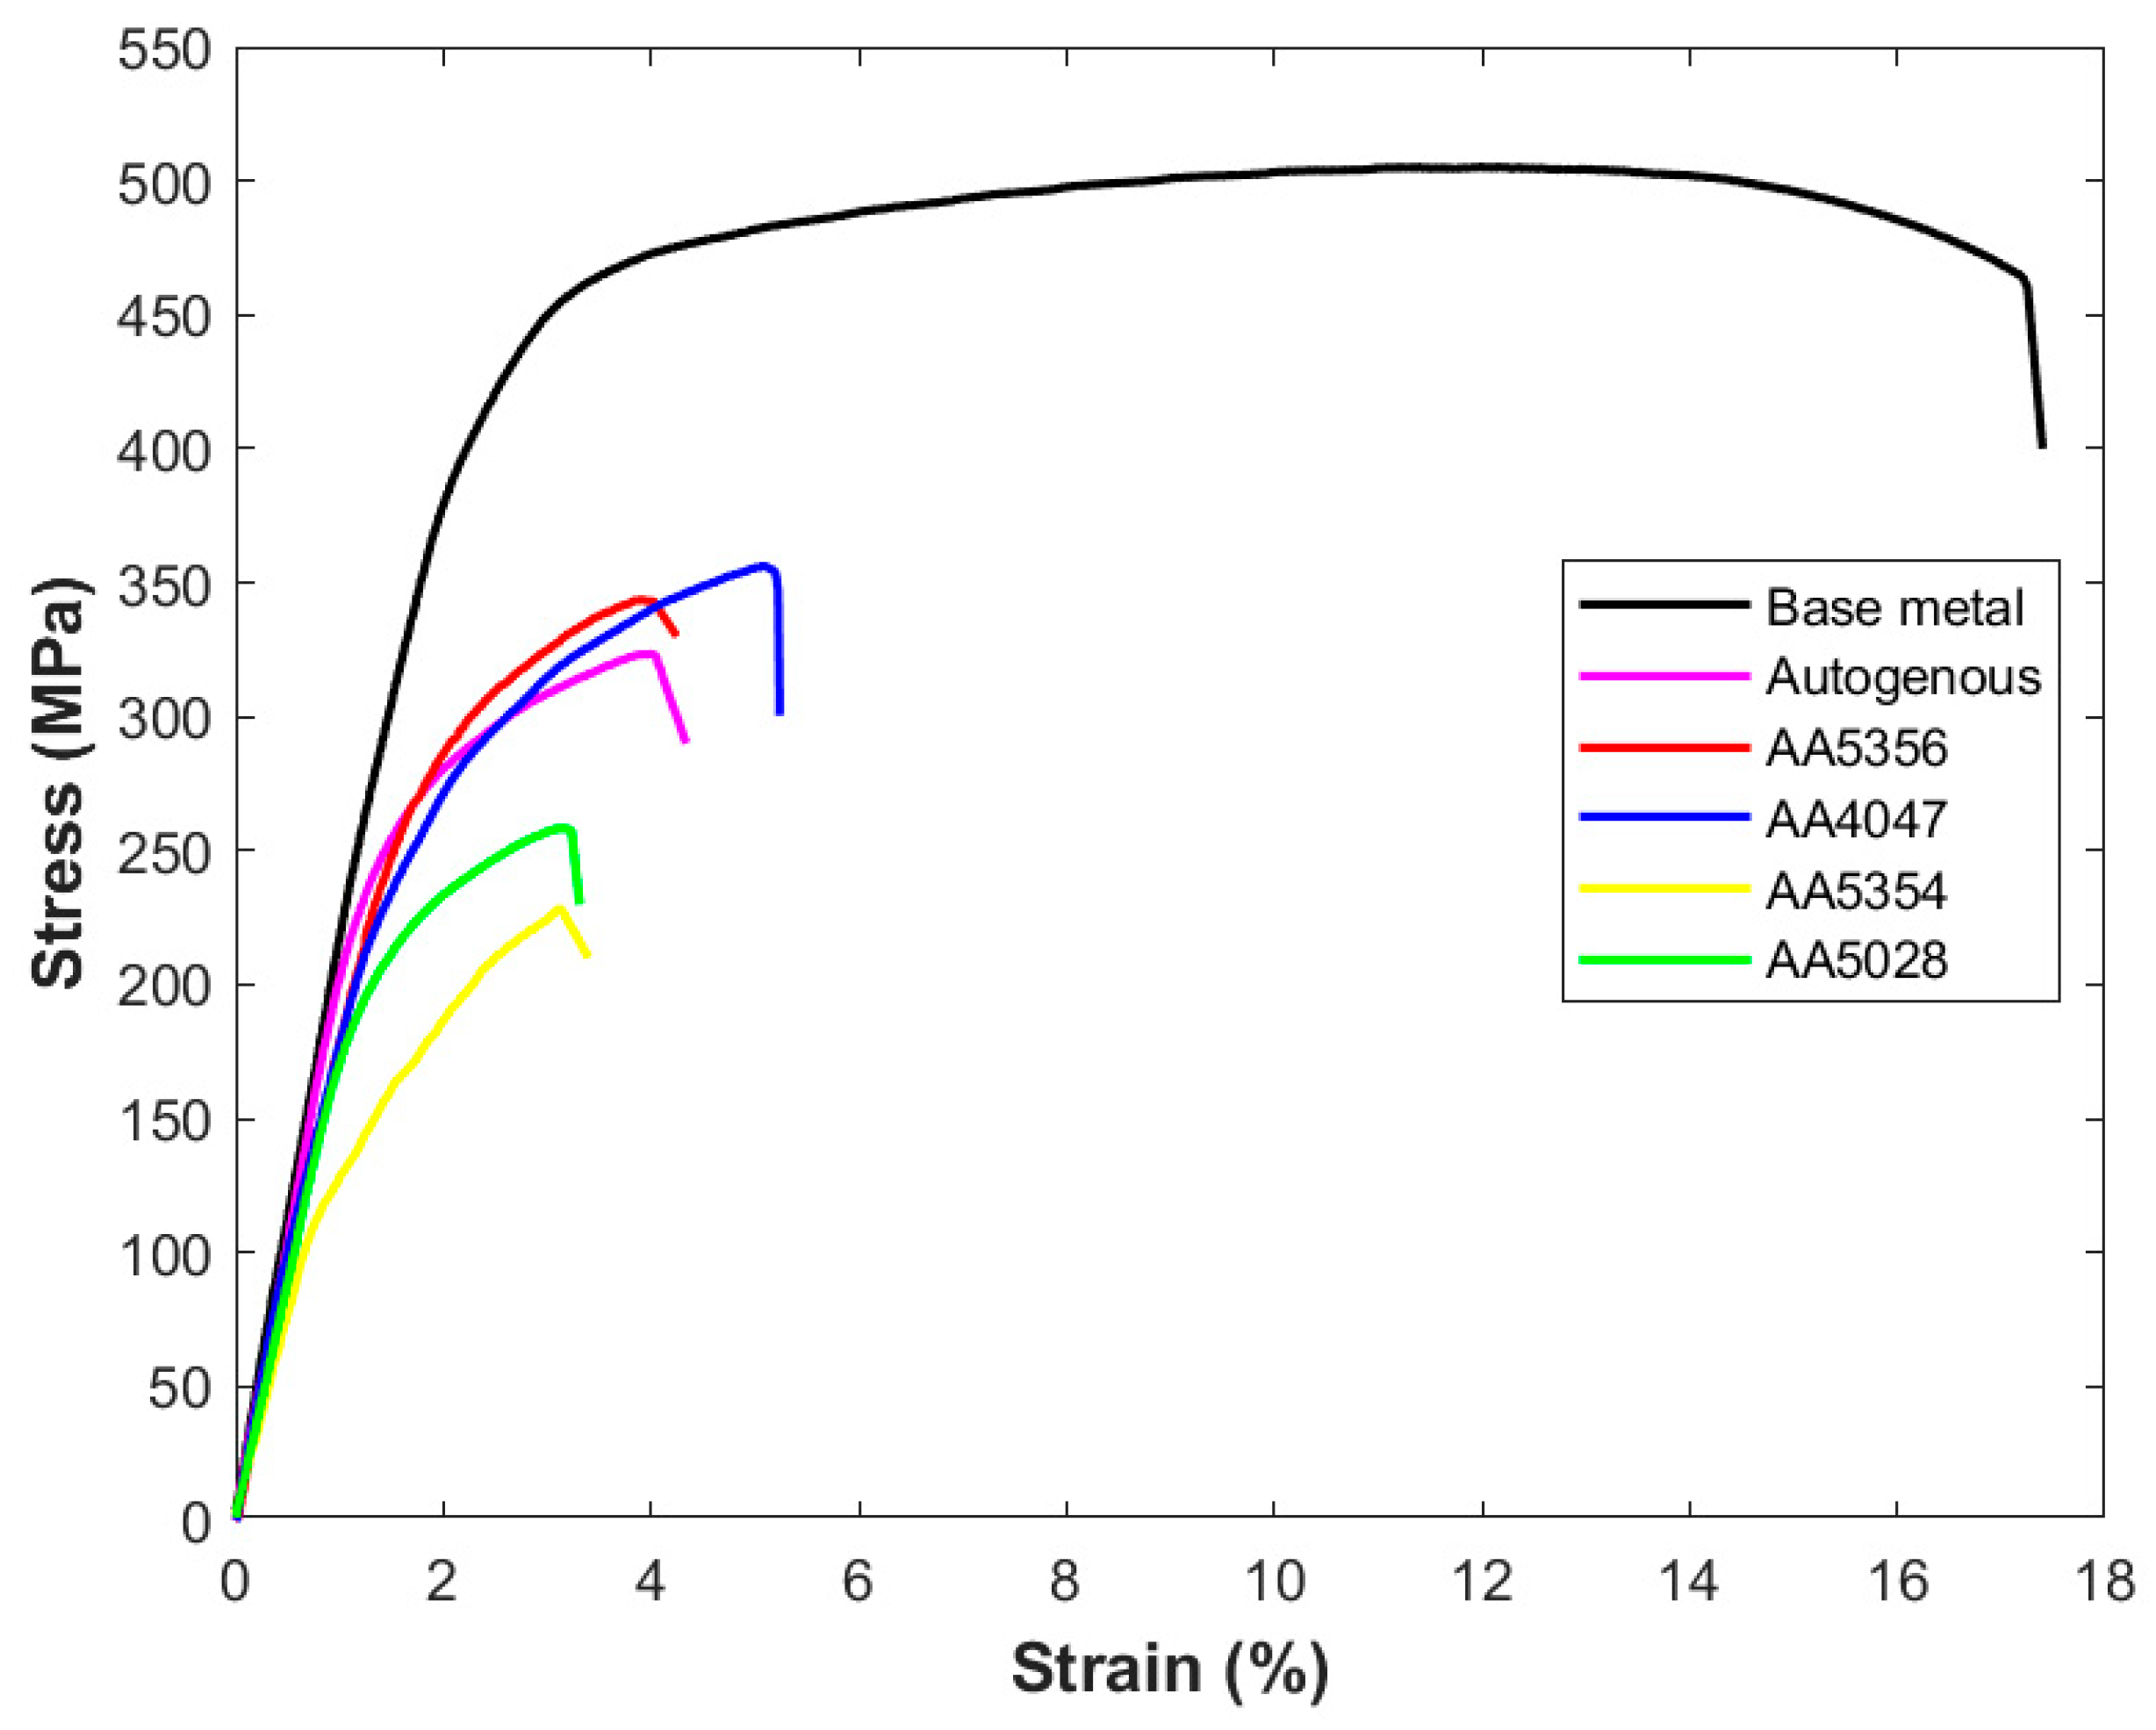
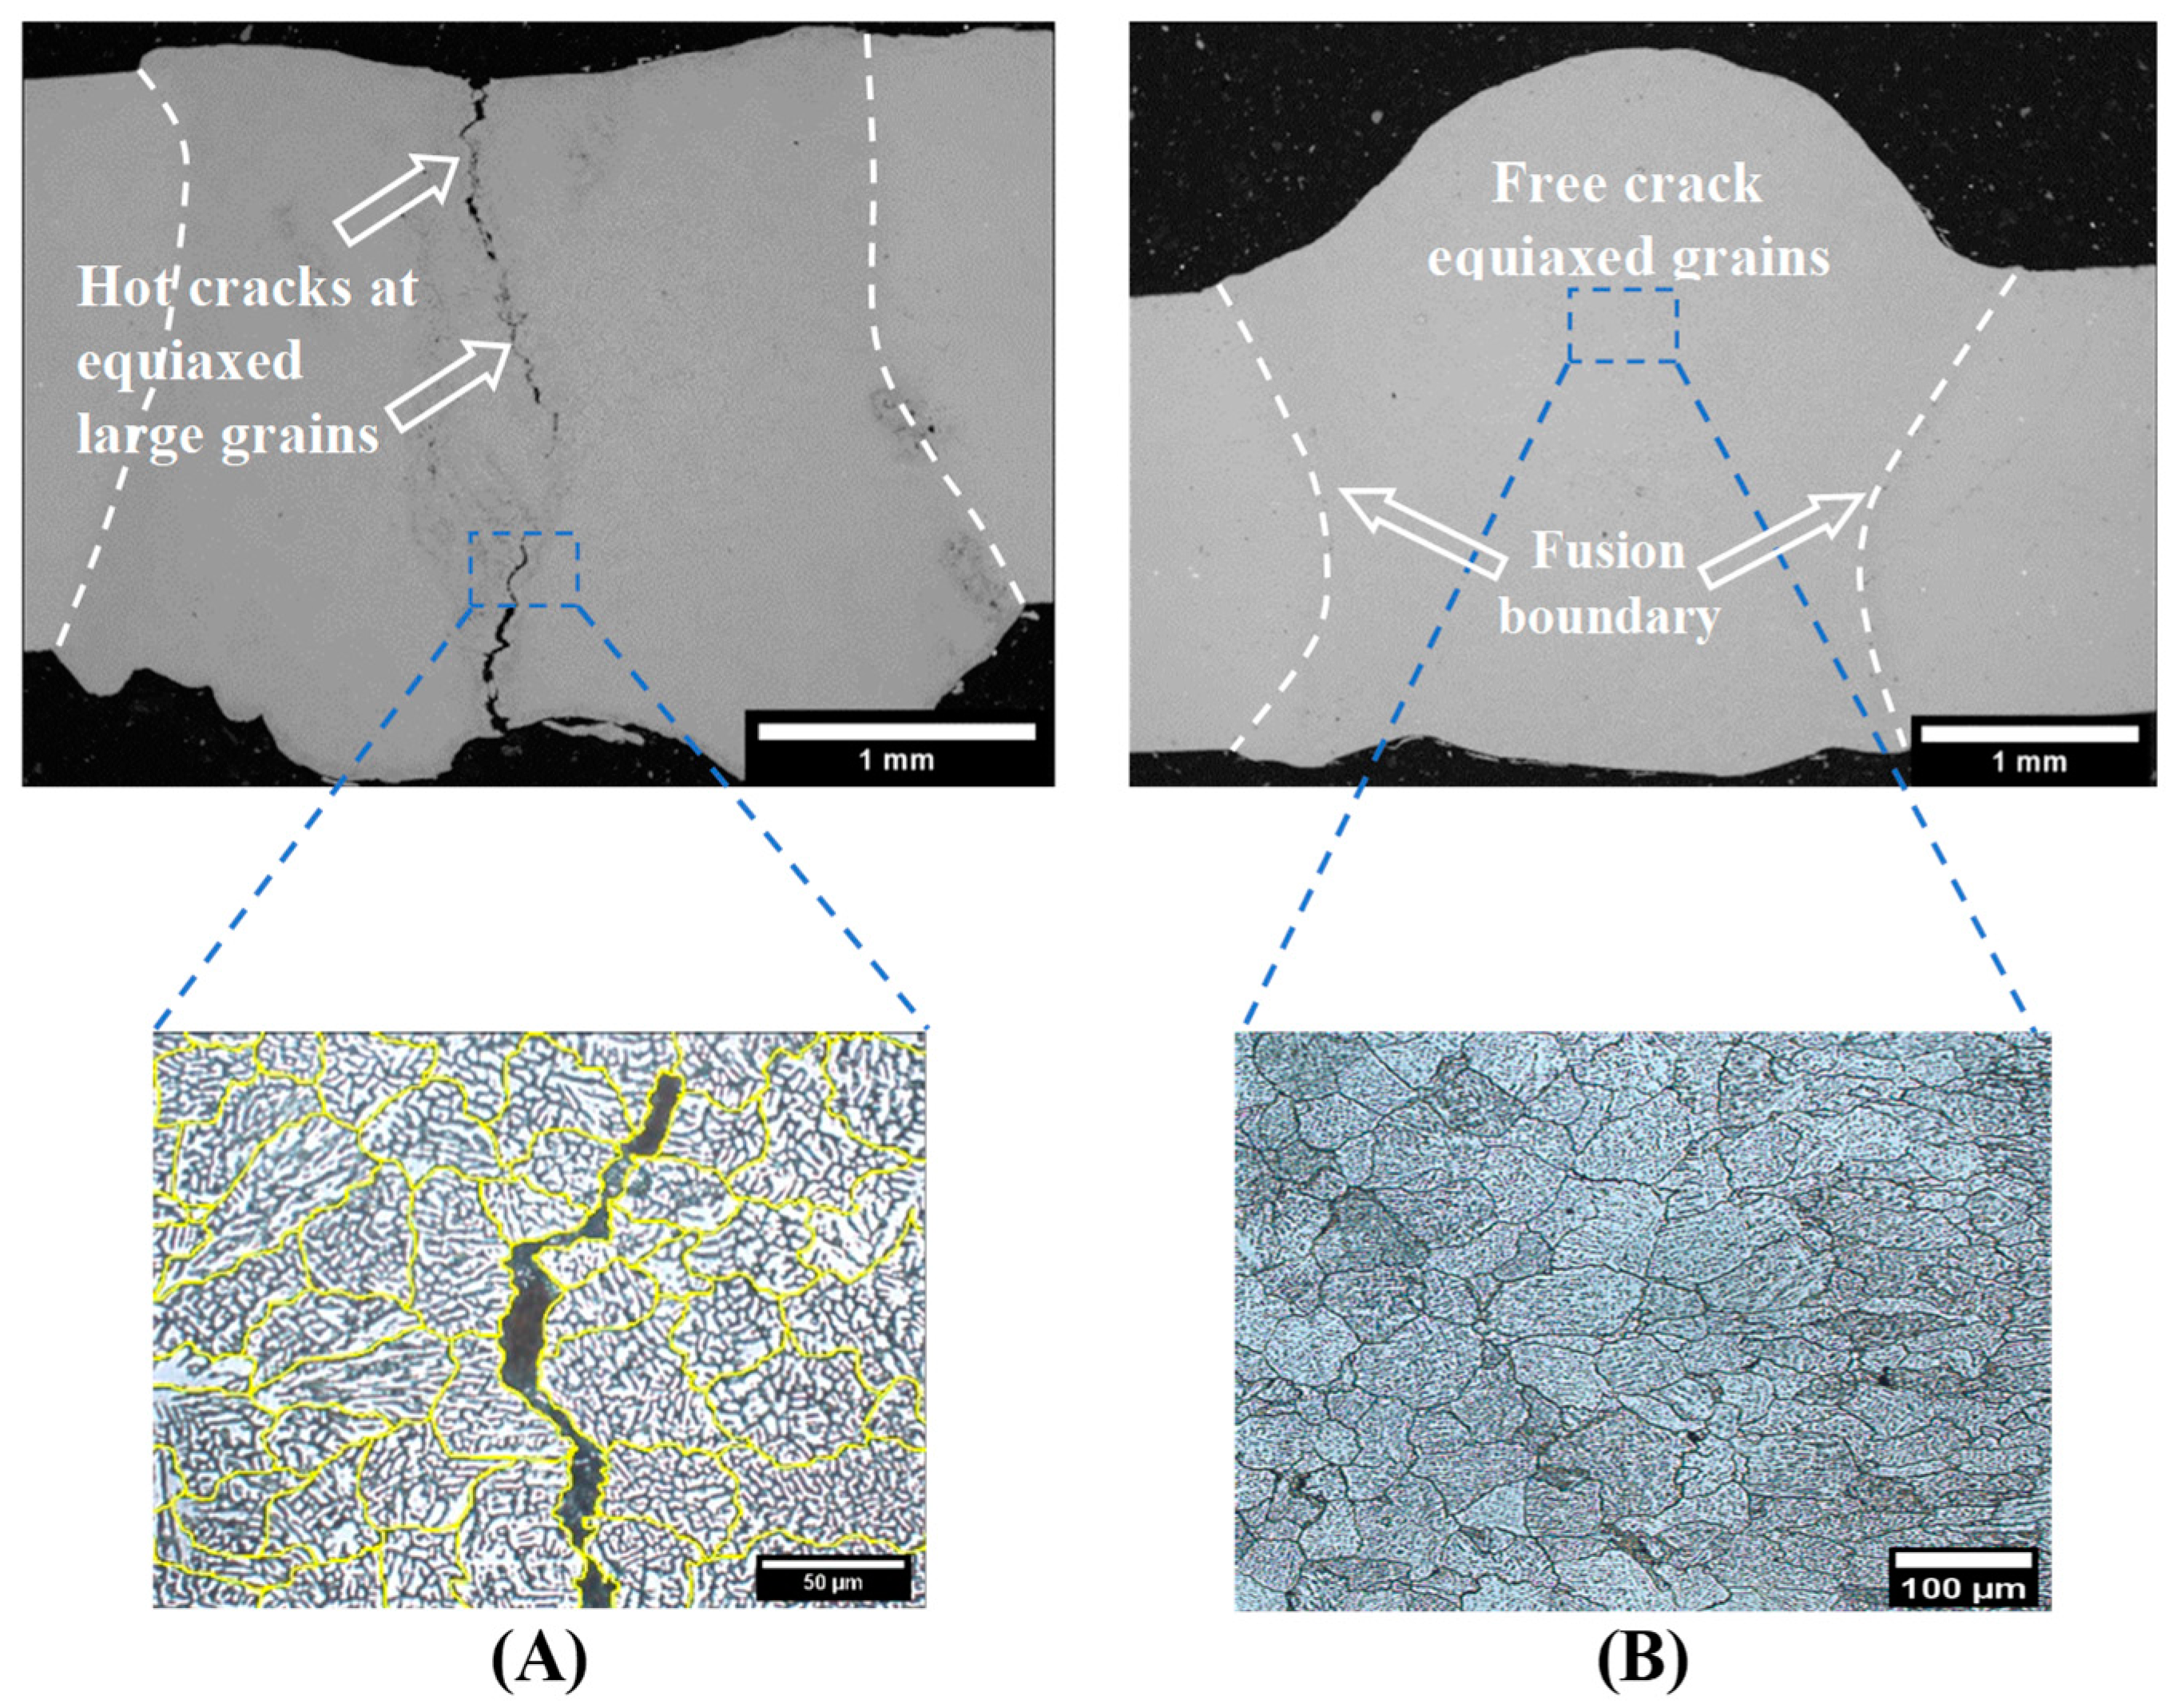
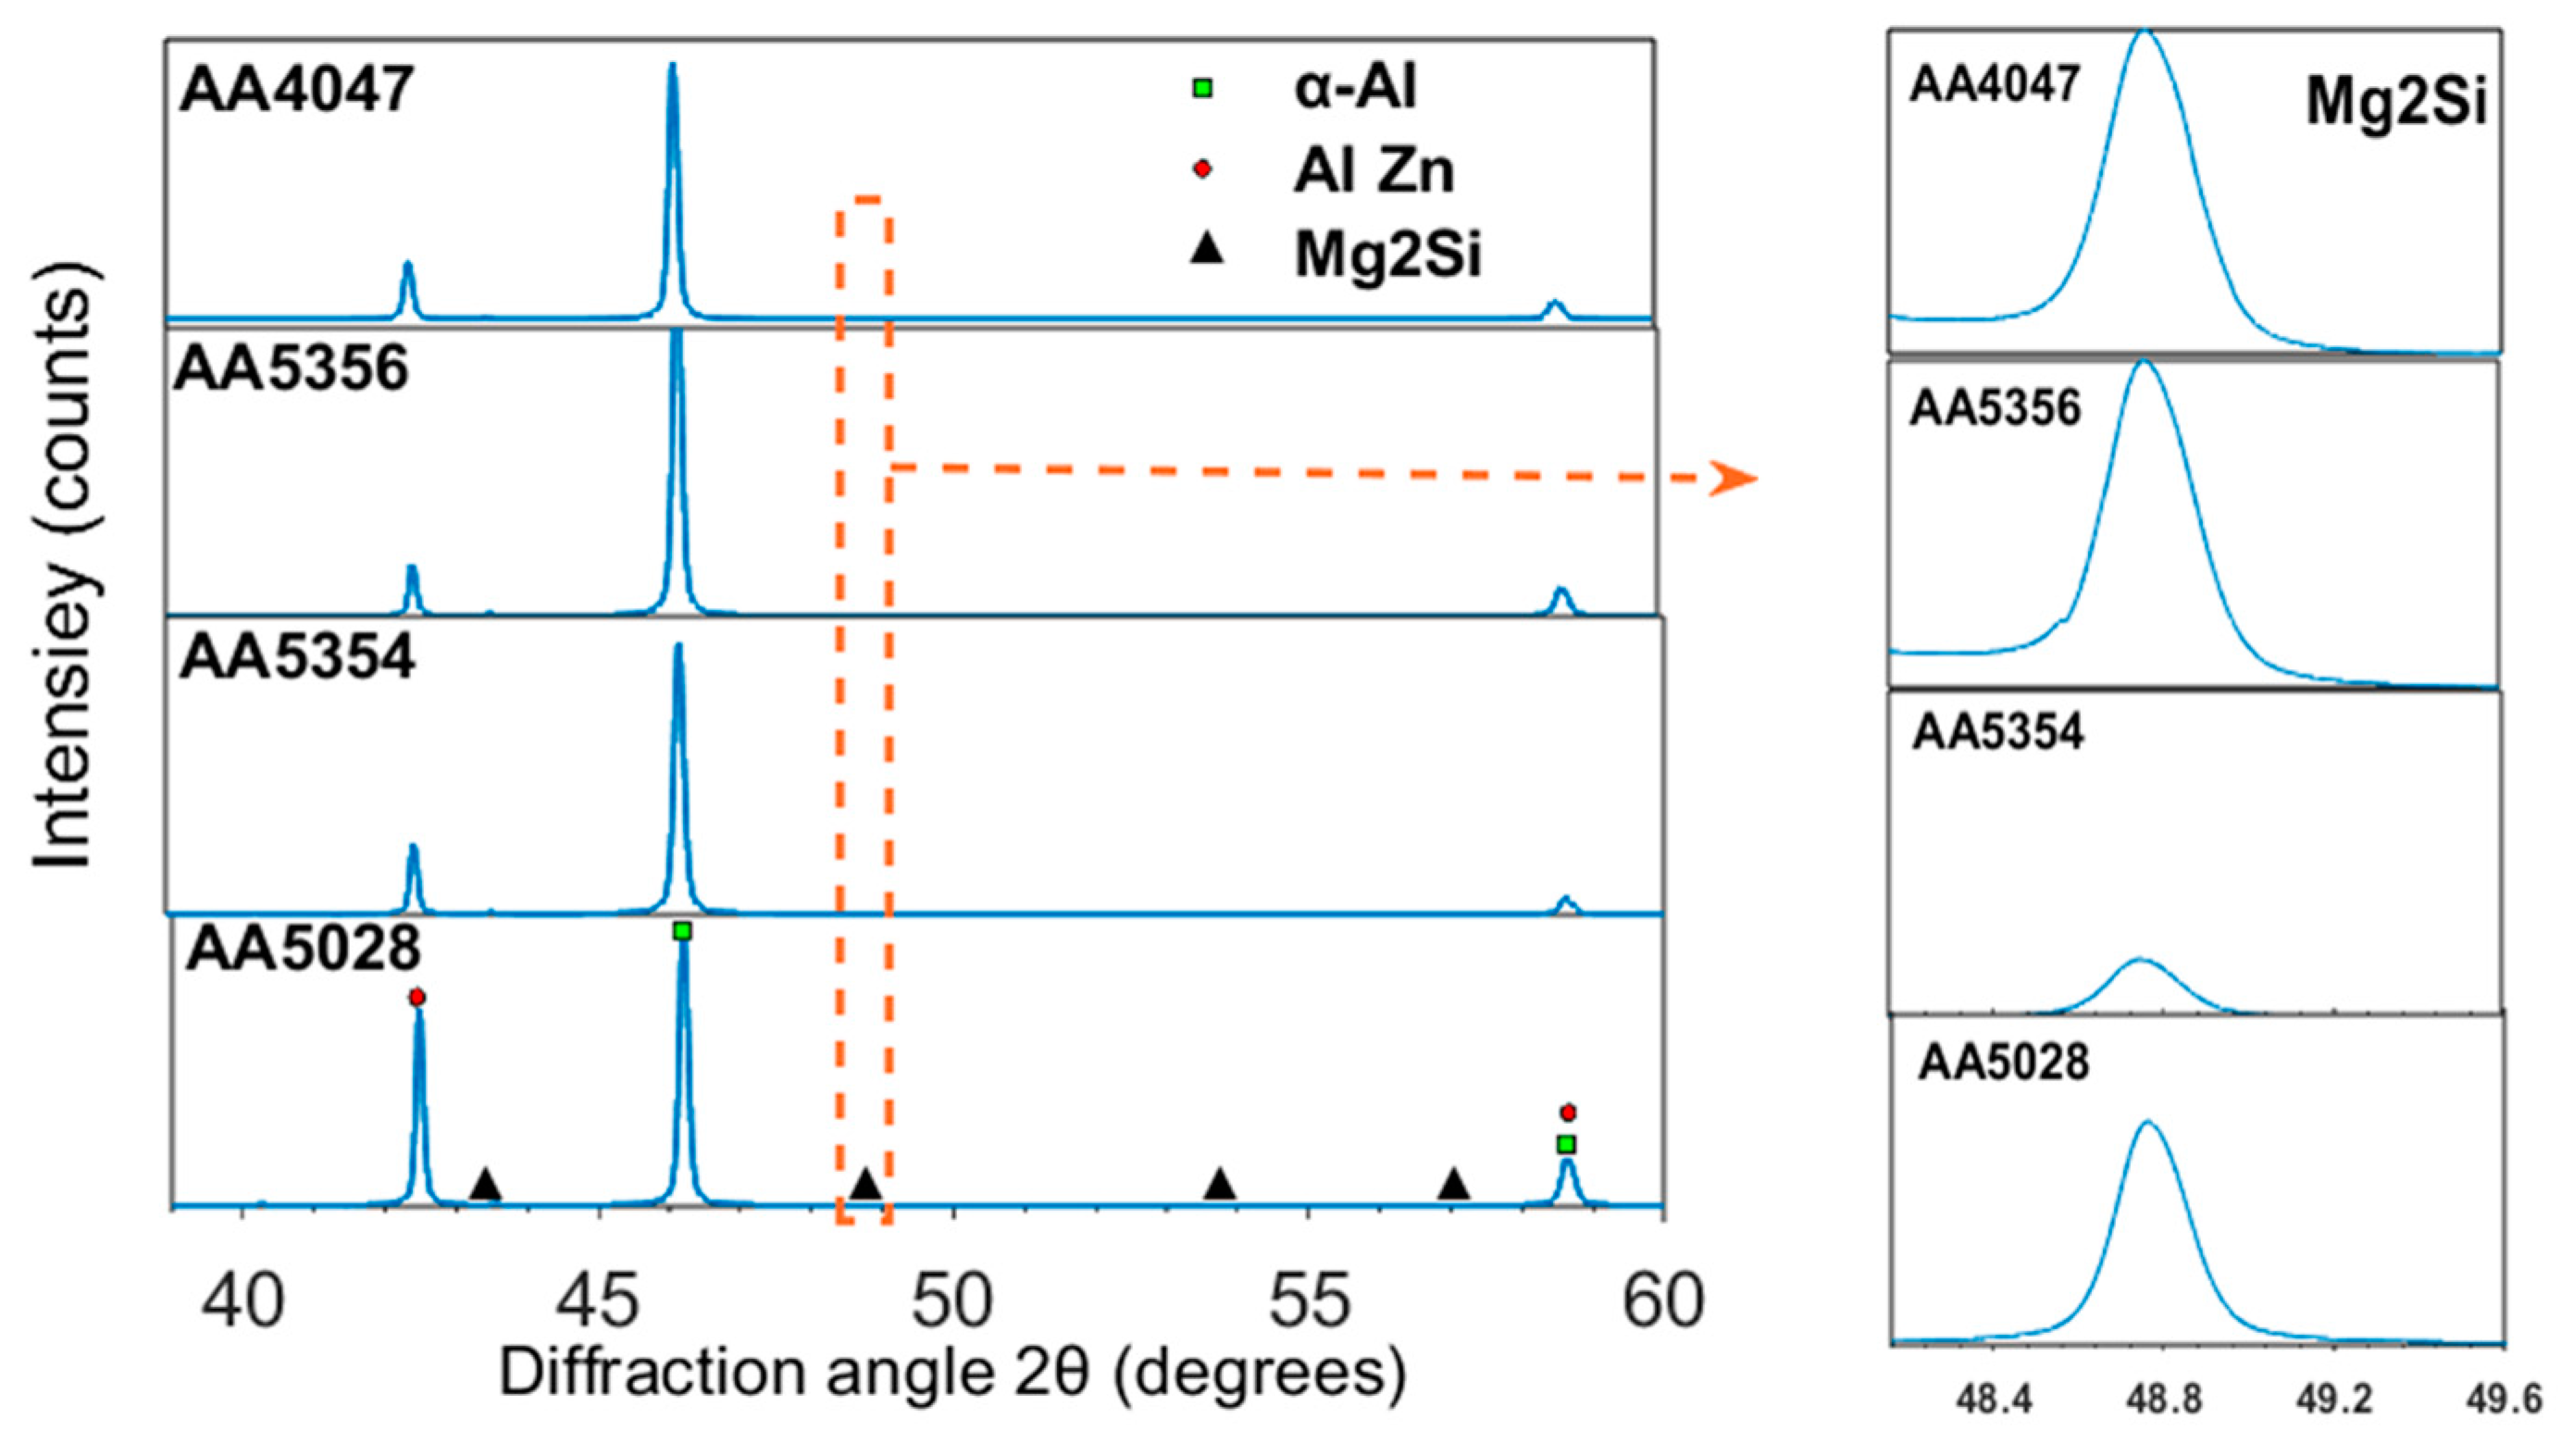
- All the samples experienced fracture within the plastic region, which ultimately occurred in the fusion zone (FZ). AA4047 and AA5365 demonstrated superior mechanical properties compared to the autogenous, AA5028, and AA5354 fillers. Throughout the DIC test, micro-cracks emerged in the FZ, which are likely attributable to the abundance of brittle (Mg2Si) particles in this region.
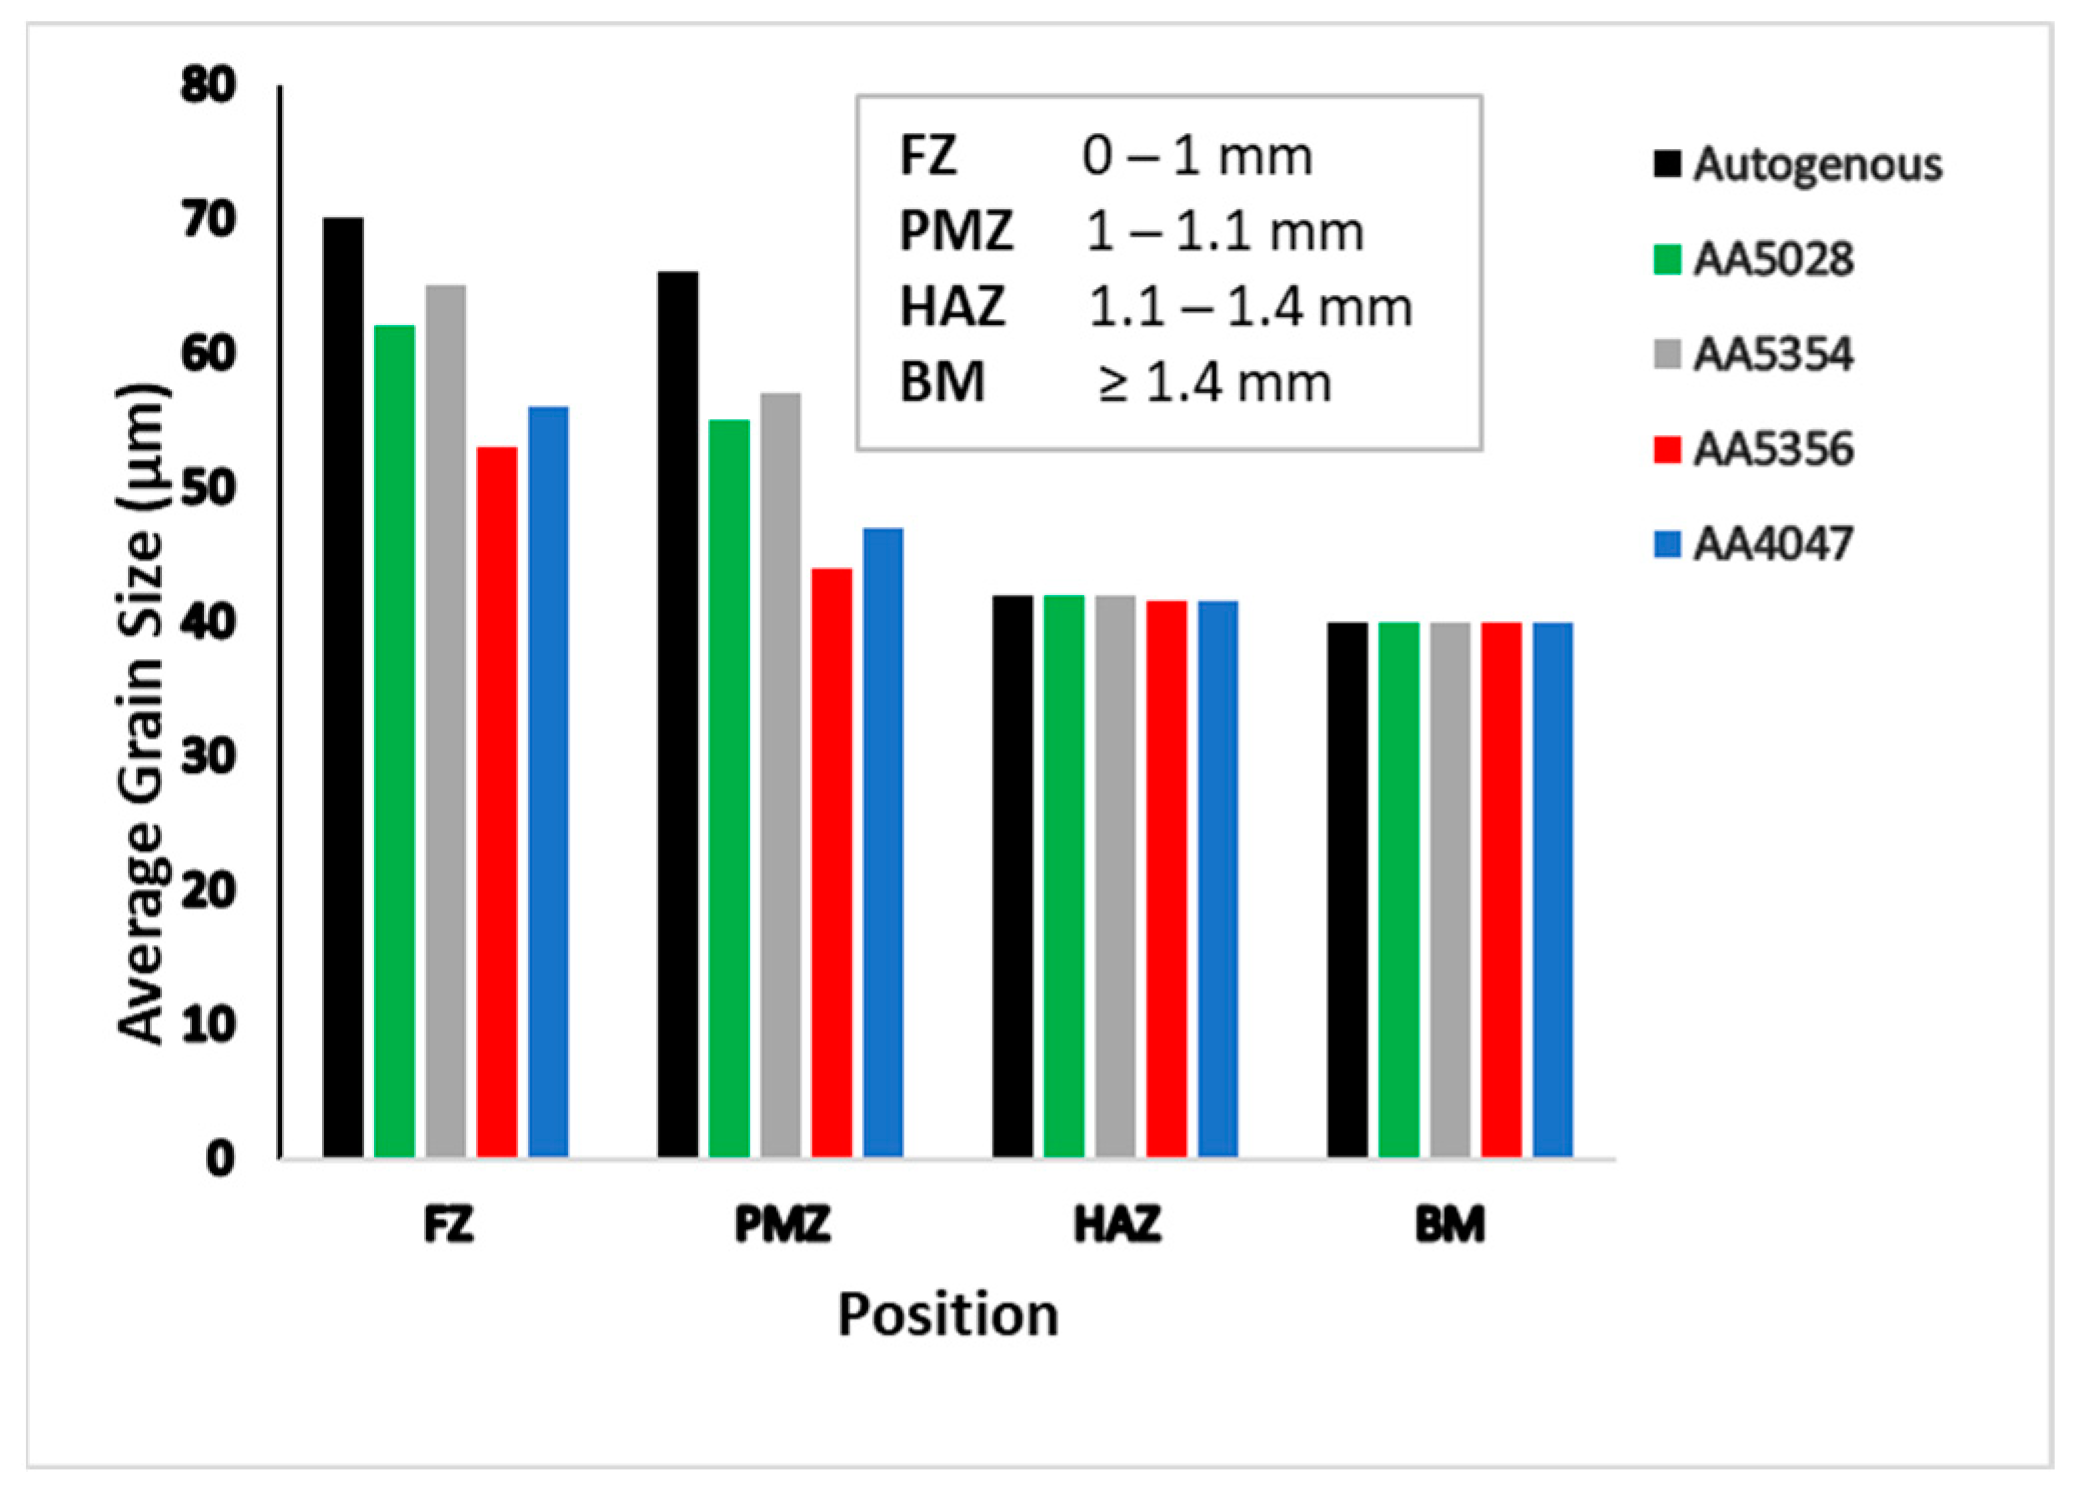
- The FZ for different fillers reveals equiaxed large grains compared to the base metal, which has an elongated grain and an average size of 40 µm. The FZ of the autogenous welded sample shows an average grain size of 70 µm, while the FZ welded with AA5354, AA5028, AA4047, and AA5356 fillers reveals average grain sizes of 65 µm, 62 µm, 56 µm, and 53 µm, respectively. These changes in grain size caused by the different fillers are not significant enough to affect crack susceptibility or enhance the mechanical properties.
- This study is part of the research on the weldability of AA7075 using fusion welding, particularly laser welding. Further work needs to be carried out to understand the cracking phenomena in the laser welding of AA7075 in more depth. The possibility of laser welding alloy AA7075 would be a huge advantage for many industries due to the very high welding speeds and versatility of laser welding technology in comparison to friction stir welding technology.
Author Contributions
Funding
Data Availability Statement
Conflicts of Interest
References
- Mathers, G. The Welding of Aluminium and Its Alloys; Woodhead Publishing: Shaxton, UK, 2002. [Google Scholar]
- You, D.; Gao, X.; Katayama, S. Review of laser welding monitoring. Sci. Technol. Weld. Join. 2014, 19, 181–201. [Google Scholar] [CrossRef]
- Oladimeji, O.O.; Taban, E. Trend and innovations in laser beam welding of wrought aluminum alloys. Weld. World 2016, 60, 415–457. [Google Scholar] [CrossRef]
- Hekmatjou, H.; Naffakh-Moosavy, H. Hot cracking in pulsed Nd: YAG laser welding of AA5456. Opt. Laser Technol. 2018, 103, 22–32. [Google Scholar] [CrossRef]
- Tomus, D.; Rometsch, P.A.; Heilmaier, M.; Wu, X. Effect of minor alloying elements on crack-formation characteristics of Hastelloy-X manufactured by selective laser melting. Addit. Manuf. 2017, 16, 65–72. [Google Scholar] [CrossRef]
- Miyagi, M.; Wang, H.; Yoshida, R.; Kawahito, Y.; Kawakami, H.; Shoubu, T. Effect of alloy element on weld pool dynamics in laser welding of aluminum alloys. Sci. Rep. 2018, 8, 12944. [Google Scholar] [CrossRef]
- Zykova, A.; Martyushev, N.; Skeeba, V.; Zadkov, D.; Kuzkin, A. Influence of W addition on microstructure and mechanical properties of Al-12% Si alloys. Materials 2019, 12, 981. [Google Scholar] [CrossRef]
- Lin, R.; Wang, H.-P.; Lu, F.; Solomon, J.; Carlson, B.E. Numerical study of keyhole dynamics and keyhole-induced porosity formation in remote laser welding of Al alloys. Int. J. Heat Mass Transf. 2017, 108, 244–256. [Google Scholar] [CrossRef]
- Stopyra, W.; Gruber, K.; Smolina, I.; Kurzynowski, T.; Kuźnicka, B. Laser powder bed fusion of AA7075 alloy: Influence of process parameters on porosity and hot cracking. Addit. Manuf. 2020, 35, 101270. [Google Scholar] [CrossRef]
- Lin, R.; Liu, B.; Zhang, J.; Zhang, S. Microstructure evolution and properties of 7075 aluminum alloy recycled from scrap aircraft aluminum alloys. J. Mater. Res. Technol. 2022, 19, 354–367. [Google Scholar] [CrossRef]
- Li, Q.; Xia, T.; Lan, Y.; Zhao, W.; Fan, L.; Li, P. Effect of rare earth cerium addition on the microstructure and tensile properties of hypereutectic Al–20% Si alloy. J. Alloys Compd. 2013, 562, 25–32. [Google Scholar] [CrossRef]
- Cao, X.; Wallace, W.; Poon, C.; Immarigeon, J.-P. Research and progress in laser welding of wrought aluminum alloys. I. Laser welding processes. Mater. Manuf. Processes 2003, 18, 23–49. [Google Scholar] [CrossRef]
- El-Batahgy, A.-M.; Klimova-Korsmik, O.; Akhmetov, A.; Turichin, G. High-Power Fiber Laser Welding of High-Strength AA7075-T6 Aluminum Alloy Welds for Mechanical Properties Research. Materials 2021, 14, 7498. [Google Scholar] [CrossRef] [PubMed]
- Han, C.; Jiang, P.; Geng, S.; Gao, S.; Mi, G.; Wang, C. Multiphase-field simulation of grain coalescence behavior and its effects on solidification cracking susceptibility during welding of Al-Cu alloys. Mater. Des. 2021, 211, 110146. [Google Scholar] [CrossRef]
- Zhao, P.-Z.; Liu, J.; Chi, Z.-D. Effect of Si content on laser welding performance of Al-Mn-Mg alloy. Trans. Nonferrous Met. Soc. China 2014, 24, 2208–2213. [Google Scholar] [CrossRef]
- Balasubramanian, K.; Kesavan, D.; Balusamy, V. Studies on the effect of vibration on hot cracking and grain size in AA 7075 aluminum alloy welding. Int. J. Eng. Sci. Technol. 2011, 3. [Google Scholar]
- Senkara, J.; Zhang, H. Cracking in spot welding aluminum alloy AA5754. Weld. J. N. Y. 2000, 79, 194-s. [Google Scholar]
- Norouzian, M.; Elahi, M.A.; Plapper, P. A review: Suppression of the solidification cracks in the laser welding process by controlling the grain structure and chemical compositions. J. Adv. Join. Process. 2023, 7, 100139. [Google Scholar] [CrossRef]
- Abdollahi, A.; Nganbe, M.; Kabir, A.S. On the elimination of solidification cracks in fusion welding of Al7075 by TiC-nanoparticle enhanced filler metal. J. Manuf. Process. 2022, 81, 828–836. [Google Scholar] [CrossRef]
- Deng, A.; Chen, H.; Zhang, Y.; Liu, Y.; Yang, X.; Zhang, Z.; Zhang, B.; He, D. Prediction of the influence of welding metal composition on solidification cracking of laser welded aluminum alloy. Mater. Today Commun. 2023, 35, 105556. [Google Scholar] [CrossRef]
- Huang, C.; Kou, S. Liquation Cracking in Full-Penetration AI-Mg-Si Welds. Weld. J. 2004, 84, s111–s122. [Google Scholar]
- Zhang, P.; Jia, Z.; Yu, Z.; Shi, H.; Li, S.; Wu, D.; Yan, H.; Ye, X.; Chen, J.; Wang, F.; et al. A review on the effect of laser pulse shaping on the microstructure and hot cracking behavior in the welding of alloys. Opt. Laser Technol. 2021, 140, 107094. [Google Scholar] [CrossRef]
- Kang, M.; Cheon, J.; Kam, D.H.; Kim, C. The hot cracking susceptibility subjected the laser beam oscillation welding on 6XXX aluminum alloy with a partial penetration joint. J. Laser Appl. 2021, 33, 012032. [Google Scholar] [CrossRef]
- Schaefer, M.; Kessler, S.; Scheible, P.; Speker, N.; Harrer, T. Hot cracking during laser welding of steel: Influence of the welding parameters and prevention of cracks. In Proceedings of the High-Power Laser Materials Processing: Applications, Diagnostics, and Systems VI, San Francisco, CA, USA, 22 February 2017; International Society for Optics and Photonics: Bellingham, DC, USA, 2017. [Google Scholar]
- Cicală, E.; Duffet, G.; Andrzejewski, H.; Grevey, D.; Ignat, S. Hot cracking in Al–Mg–Si alloy laser welding–operating parameters and their effects. Mater. Sci. Eng. A 2005, 395, 1–9. [Google Scholar] [CrossRef]
- Salloomi, K.N.; Hussein, F.I.; Al-Sumaidae, S.N. Temperature and stress evaluation during three different phases of friction stir welding of AA 7075-T651 alloy. Model. Simul. Eng. 2020, 2020, 3197813. [Google Scholar] [CrossRef]
- Vorel, M.; Hinsch, S.; Konopka, M.; Scheerer, M. AlMgSc alloy 5028 status of maturation. In Proceedings of the 7th European Conference for Aeronautics and Space Sciences (Eucass), Milan, Italy, 3–6 July 2017. [Google Scholar]
- Squillace, A.; Prisco, U. Influence of filler material on micro-and macro-mechanical behaviour of laser-beam-welded T-joint for aerospace applications. Proc. Inst. Mech. Eng. Part L J. Mater. Des. Appl. 2009, 223, 103–115. [Google Scholar] [CrossRef]
- Kah, P.; Hiltunen, E.; Martikainen, J. Investigation of Hot Cracking in the Welding of Aluminium Alloys (6005 & 6082). In Proceedings of the 63rd Annual Assembly & International Conference of the International Institute of Welding, Istanbul, Turkey, 11–17 July 2010. [Google Scholar]
- Pan, B.; Qian, K.; Xie, H.; Asundi, A. Two-dimensional digital image correlation for in-plane displacement and strain measurement: A review. Meas. Sci. Technol. 2009, 20, 062001. [Google Scholar] [CrossRef]
- Vanderesse, N.; Lagacé, M.; Bridier, F.; Bocher, P. An open source software for the measurement of deformation fields by means of digital image correlation. Microsc. Microanal. 2013, 19, 820–821. [Google Scholar] [CrossRef]
- Soysal, T.; Kou, S. Effect of filler metals on solidification cracking susceptibility of Al alloys 2024 and 6061. J. Mater. Process. Technol. 2019, 266, 421–428. [Google Scholar] [CrossRef]
- Cao, G.; Kou, S. Predicting and reducing liquation-cracking susceptibility based on temperature vs. fraction solid. Weld. J. N. Y. 2006, 85, 9. [Google Scholar]
- Pickin, C.; Williams, S.W.; Prangnell, P.B.; Robson, J.; Lunt, M. Control of weld composition when welding high strength aluminium alloy using the tandem process. Sci. Technol. Weld. Join. 2009, 14, 734–739. [Google Scholar] [CrossRef]
- Kou, S. Solidification and liquation cracking issues in welding. JOM J. Miner. Met. Mater. Soc. 2003, 55, 37–42. [Google Scholar] [CrossRef]
- Giorjao, R.; Sutton, B.; Ramirez, A. New composition based technique for solidification cracking resistance evaluation. Metall. Mater. Trans. A 2021, 52, 2512–2521. [Google Scholar] [CrossRef]
- Perka, A.K.; John, M.; Kuruveri, U.B.; Menezes, P.L. Advanced high-strength steels for automotive applications: Arc and laser welding process, properties, and challenges. Metals 2022, 12, 1051. [Google Scholar] [CrossRef]
- Martin, J.H.; Yahata, B.D.; Hundley, J.M.; Mayer, J.A.; Schaedler, T.A.; Pollock, T.M. 3D printing of high-strength aluminium alloys. Nature 2017, 549, 365–369. [Google Scholar] [CrossRef]
- Coniglio, N.; Cross, C.E.; Michael, T.; Lammers, M. Defining a critical weld dilution to avoid solidification cracking in aluminum. Weld. J. 2008, 87, 237s–247s. [Google Scholar]
- Mirakhorli, F.; Nadeau, F.; Guillemette, G. Single pass laser cold-wire welding of thick section AA6061-T6 aluminum alloy. J. Laser Appl. 2018, 30, 032421. [Google Scholar] [CrossRef]
- Bhansali, K.; Keche, A.; Gogte, C.; Chopra, S. Effect of grain size on Hall-Petch relationship during rolling process of reinforcement bar. Mater. Today Proc. 2020, 26, 3173–3178. [Google Scholar] [CrossRef]
- Podor, R.; Le Goff, X.; Lautru, J.; Brau, H.; Massonnet, M.; Clavier, N. SEraMic: A semi-automatic method for the segmentation of grain boundaries. J. Eur. Ceram. Soc. 2021, 41, 5349–5358. [Google Scholar] [CrossRef]
- Kotadia, H.; Gibbons, G.; Das, A.; Howes, P. A review of Laser Powder Bed Fusion Additive Manufacturing of aluminium alloys: Microstructure and properties. Addit. Manuf. 2021, 46, 102155. [Google Scholar] [CrossRef]


| Al | Zn | Mg | Cu | Mn | Cr | Si | Fe | Ti |
|---|---|---|---|---|---|---|---|---|
| Bal. | 5.63 | 2.23 | 1.31 | 0.02 | 0.22 | 0.08 | 0.18 | 0.03 |
| Material | Al | Zn | Mg | Cu | Mn | Cr | Si | Fe | Ti |
|---|---|---|---|---|---|---|---|---|---|
| AA5028 [27] | Bal. | 0.05–0.50 | 3.2–4.8 | 0.0–0.2 | 0.30–1.0 | 0.05–0.15 | - | 0.0–0.4 | 0.05–0.15 |
| AA5354 * | Bal. | - | 2.4–3.0 | - | 0.5–1.0 | 0.05–0.2 | - | ≤0.4 | - |
| AA5356 [28] | Bal. | 0.1 | 5.5 | 0.1 | 0.2 | 0.2 | 0.25 | 0.4 | 0.2 |
| AA4047 [28] | Bal. | 0.2 | 0.1 | 0.3 | 0.15 | - | 13 | 0.8 | - |
| Filler Metal | Welding Speed (m/min.) | Power (kW) | Wire Speed (m/min.) | Shield Gas | Filler Wire Angle |
|---|---|---|---|---|---|
| AA5028 | 1/1.5/3/4 | 3/3.65/6 | 1.5/2/4 | Ar/He | 40° |
| AA5354 | 1/1.5/3/4 | 3/3.65/6 | 1/1.5/2.5/4 | Ar/He | 40° |
| AA5356 | 1/1.5/3/4 | 3/3.65/8 | 1/2/3/4 | Ar/He | 40° |
| AA4047 | 1/1.5/3/4 | 3/3.65/8 | 1/1.5/2.5/6 | Ar/He | 40° |
| Filler Metal | Autogenous | AA5028 | AA5354 | AA5356 |
|---|---|---|---|---|
| X-ray Photos | 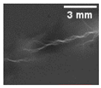 |  | 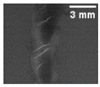 |  |
| Material | Al | Zn | Cu | Mg | Si | Other Elements |
|---|---|---|---|---|---|---|
| Autogenous | 89.26 | 4.10 | 1.57 | 1.62 | 0.4 | 3.05 |
| AA5028 | 90.96 | 4.04 | 1.11 | 1.39 | 0.01 | 2.49 |
| AA5354 | 91.43 | 3.41 | 1.68 | 0.97 | 0.05 | 2.46 |
| AA5356 | 90.99 | 3.62 | 1.8 | 1.70 | 0.01 | 1.88 |
| AA4047 | 90.03 | 4.8 | 1.32 | 0.72 | 0.1 | 3.30 |
Disclaimer/Publisher’s Note: The statements, opinions and data contained in all publications are solely those of the individual author(s) and contributor(s) and not of MDPI and/or the editor(s). MDPI and/or the editor(s) disclaim responsibility for any injury to people or property resulting from any ideas, methods, instructions or products referred to in the content. |
© 2023 by the authors. Licensee MDPI, Basel, Switzerland. This article is an open access article distributed under the terms and conditions of the Creative Commons Attribution (CC BY) license (https://creativecommons.org/licenses/by/4.0/).
Share and Cite
Alkhabbat, M.; Nadeau, F.; Mirakhorli, F.; Dao, T.-M.; Pham, X.-T. Effect of Laser Welding Parameters with Different Fillers on Solidification Cracking and Mechanical Properties of AA7075. Metals 2023, 13, 1704. https://doi.org/10.3390/met13101704
Alkhabbat M, Nadeau F, Mirakhorli F, Dao T-M, Pham X-T. Effect of Laser Welding Parameters with Different Fillers on Solidification Cracking and Mechanical Properties of AA7075. Metals. 2023; 13(10):1704. https://doi.org/10.3390/met13101704
Chicago/Turabian StyleAlkhabbat, Mohammed, François Nadeau, Fatemeh Mirakhorli, Thien-My Dao, and Xuan-Tan Pham. 2023. "Effect of Laser Welding Parameters with Different Fillers on Solidification Cracking and Mechanical Properties of AA7075" Metals 13, no. 10: 1704. https://doi.org/10.3390/met13101704
APA StyleAlkhabbat, M., Nadeau, F., Mirakhorli, F., Dao, T.-M., & Pham, X.-T. (2023). Effect of Laser Welding Parameters with Different Fillers on Solidification Cracking and Mechanical Properties of AA7075. Metals, 13(10), 1704. https://doi.org/10.3390/met13101704