Article

A Comparative Investigation of Conventional and Hammering-Assisted Incremental Sheet Forming Processes for AA1050 H14 Sheets

1
deLOGIC Lab, PDPM Indian Institute of Information Technology, Design and Manufacturing, Jabalpur 482005, India
2
Light Alloys Research Institute, Central South University, Changsha 410083, China
3
Laboratory of Mechanics of Gradient Nanomaterials Named after A.P. Zhilyaeva, Nosov Magnitogorsk State Technical University, 38, Lenin Prospect, 455000 Magnitogorsk, Russia
*
Author to whom correspondence should be addressed.
Metals 2021, 11(11), 1862; https://doi.org/10.3390/met11111862
Submission received: 22 September 2021 / Revised: 12 November 2021 / Accepted: 17 November 2021 / Published: 19 November 2021
(This article belongs to the Special Issue Physical Metallurgy of Light Alloys and Composite Materials)

Abstract

:
Incremental Sheet Forming (ISF) is emerging as one of the popular dieless forming processes for the small-sized batch production of sheet metal components. However, the parts formed by the ISF process suffer from poor surface finish, geometric inaccuracy, and non-uniform thinning, which leads to poor part characteristics. Hammering, on the other hand, plays an important role in relieving residual stresses, and thus enhances the material properties through a change in grain structure. A few studies based on shot peening, one of the types of hammering operation, revealed that shot peening can produce nanostructure surfaces with different characteristics. This paper introduces a novel process, named the Incremental Sheet Hammering (ISH) process, i.e., integration of incremental sheet forming (ISF) process and hammering to improve the efficacy of the ISF process. Controlled hammering in the ISF process causes an alternating motion at the tool-sheet interface in the local deformation zone. This motion leads to enhanced material flow and subsequent improvement in the surface finish. Typical toolpath strategies are incorporated to impart the tool movement. The mechanics of the process is further explored through explicit-dynamic numerical models and experimental investigations on 1 mm thick AA1050 sheets. The varying wall angle truncated cone (VWATC) and constant wall angle truncated cone (CWATC) test geometries are identified to compare the ISF and ISH processes. The results indicate that the formability is improved in terms of wall angle, forming depth and forming limits. Further, ISF and ISH processes are compared based on the numerical and experimental results. The indicative statistical analysis is performed which shows that the ISH process would lead to an overall 10.99% improvement in the quality of the parts primarily in the surface finish and forming forces.

1. Introduction

The incremental sheet forming (ISF) process is a flexible dieless manufacturing process [1]. The ISF process starts with the three-dimensional (3D) computer-aided design (CAD) model of the geometry of the component to be formed. The desired CAD model can be generated with any modelling software (e.g., SOLIDWORKS, CATIA, Siemens NX, PTC Creo, etc.). The required toolpath to incrementally form the desired geometry is evolved on the basis of the sliced 3D model. A forming tool is given the controlled motion along the generated toolpath and deforms the sheet into the desired shape [2]. The sheet is clamped at its outer periphery. Stresses are generated on the sheet due to the continuous motion of the forming tool, which leads to local plastic deformation on the sheet [3,4]. As the process does not require dies to manufacture the components, thus, it can be used in forming customized products at a lower cost in comparison to the conventional process. With an increase in the demand for customized products, the ISF process is drastically gaining popularity [5]. The ISF process finds its applications mainly in the automobile, aerospace, and medical implant industries. In the automobile industry, the headlight reflector, heat or vibration shield, solar oven, and silencer of the trucks are manufactured using the ISF process. Apart from this, the ISF process also finds its application in the medical implant industry, where it mainly helps to form facial and cranial implants. Even though the ISF process has numerous advantages over the conventional forming process, it has some limitations while forming materials with poor forming characteristics such as geometric inaccuracy, non-uniform thinning, poor surface finish, higher processing time than conventional forming processes, and difficulties in forming geometries with 90° (or more than 90°) wall angles. Formability of the material is the degree of deformation during the forming operation without any unwanted flaws like tearing, buckling, necking, or any other defect [6]. The different forms of the ISF process are studied to overcome the flaws that arise during the ISF process.
The ISF process is broadly classified according to the number of contact points during the forming process, i.e., single point incremental forming (SPIF) process and two-point incremental forming (TPIF) process. In the SPIF process, there is only one forming tool, which is controllable, whereas in the TPIF process, there is an additional supporting tool with the master tool to control the flow of the deforming material [7,8]. The TPIF process is further extended with the help of a partial die which limits the neck formation during the process [9]. Researchers had worked on heat-assisted incremental forming techniques to improve formability and geometrical accuracy [10]. Further, an ultrasonic-assisted incremental forming setup had been devised to investigate the formability and the forming forces arising due to ultrasonic energy infused during the process [11]. Vihtonen et al. [12] compared the robot-assisted incremental forming by pressing (RAIFP) and robot-assisted incremental forming by hammering (RAIFH) based on the strain measurement and found that the formability of the material can be enhanced with the help of hammering. Luo et al. [13,14] designed and developed a new sheet metal forming system based on incremental punching. They have developed a mechanics model, which helps to predict the final shape of the component using the minimum energy principle. One-step FEM is developed to predict the stress and strain distribution of the component using inverse finite element modelling. Further, they have proposed that the incremental sheet metal punching (ISMP) is effective for the rapid prototyping of sheet metal components, whereas it is effective in developing free form sheet geometries without bottom support. Further, Wang et al. [15] performed incremental sheet punching based on the sinusoidal toolpath and the results indicated that the wavelength and amplitude of the sinusoidal toolpath affect the material formability, surface quality, and fatigue life. The dimensional accuracy was investigated in the incremental sheet metal hammering process and the results revealed that the springback and surface roughness can be minimized by increasing the punch diameter [16]. Though limited research articles are available on the effect of hammering in the incremental sheet forming, the scope of the work is not limited, as shot peening, one of the types of hammering process, had revealed that the material characteristics can be improved with the help of the controlled impact on the material surface [17].
The present study aims to integrate the hammering operation with the incremental sheet forming process to enhance the material properties of the sheet during the forming. The process uses a working principle similar to the ISF process, i.e., the sheet is clamped at its ends and is deformed into desired geometry with the help of forming tool. The forming tool is provided with a hammering induced toolpath. As the process is applied for the sheet materials, thus, it is also called the incremental sheet hammering (ISH) process. Figure 1 shows the schematics of the ISH process. The present work comprises experimental and numerical investigations of the ISF and ISH processes on the AA1050 sheet and a comparative conclusion has been drawn based on the analysis.

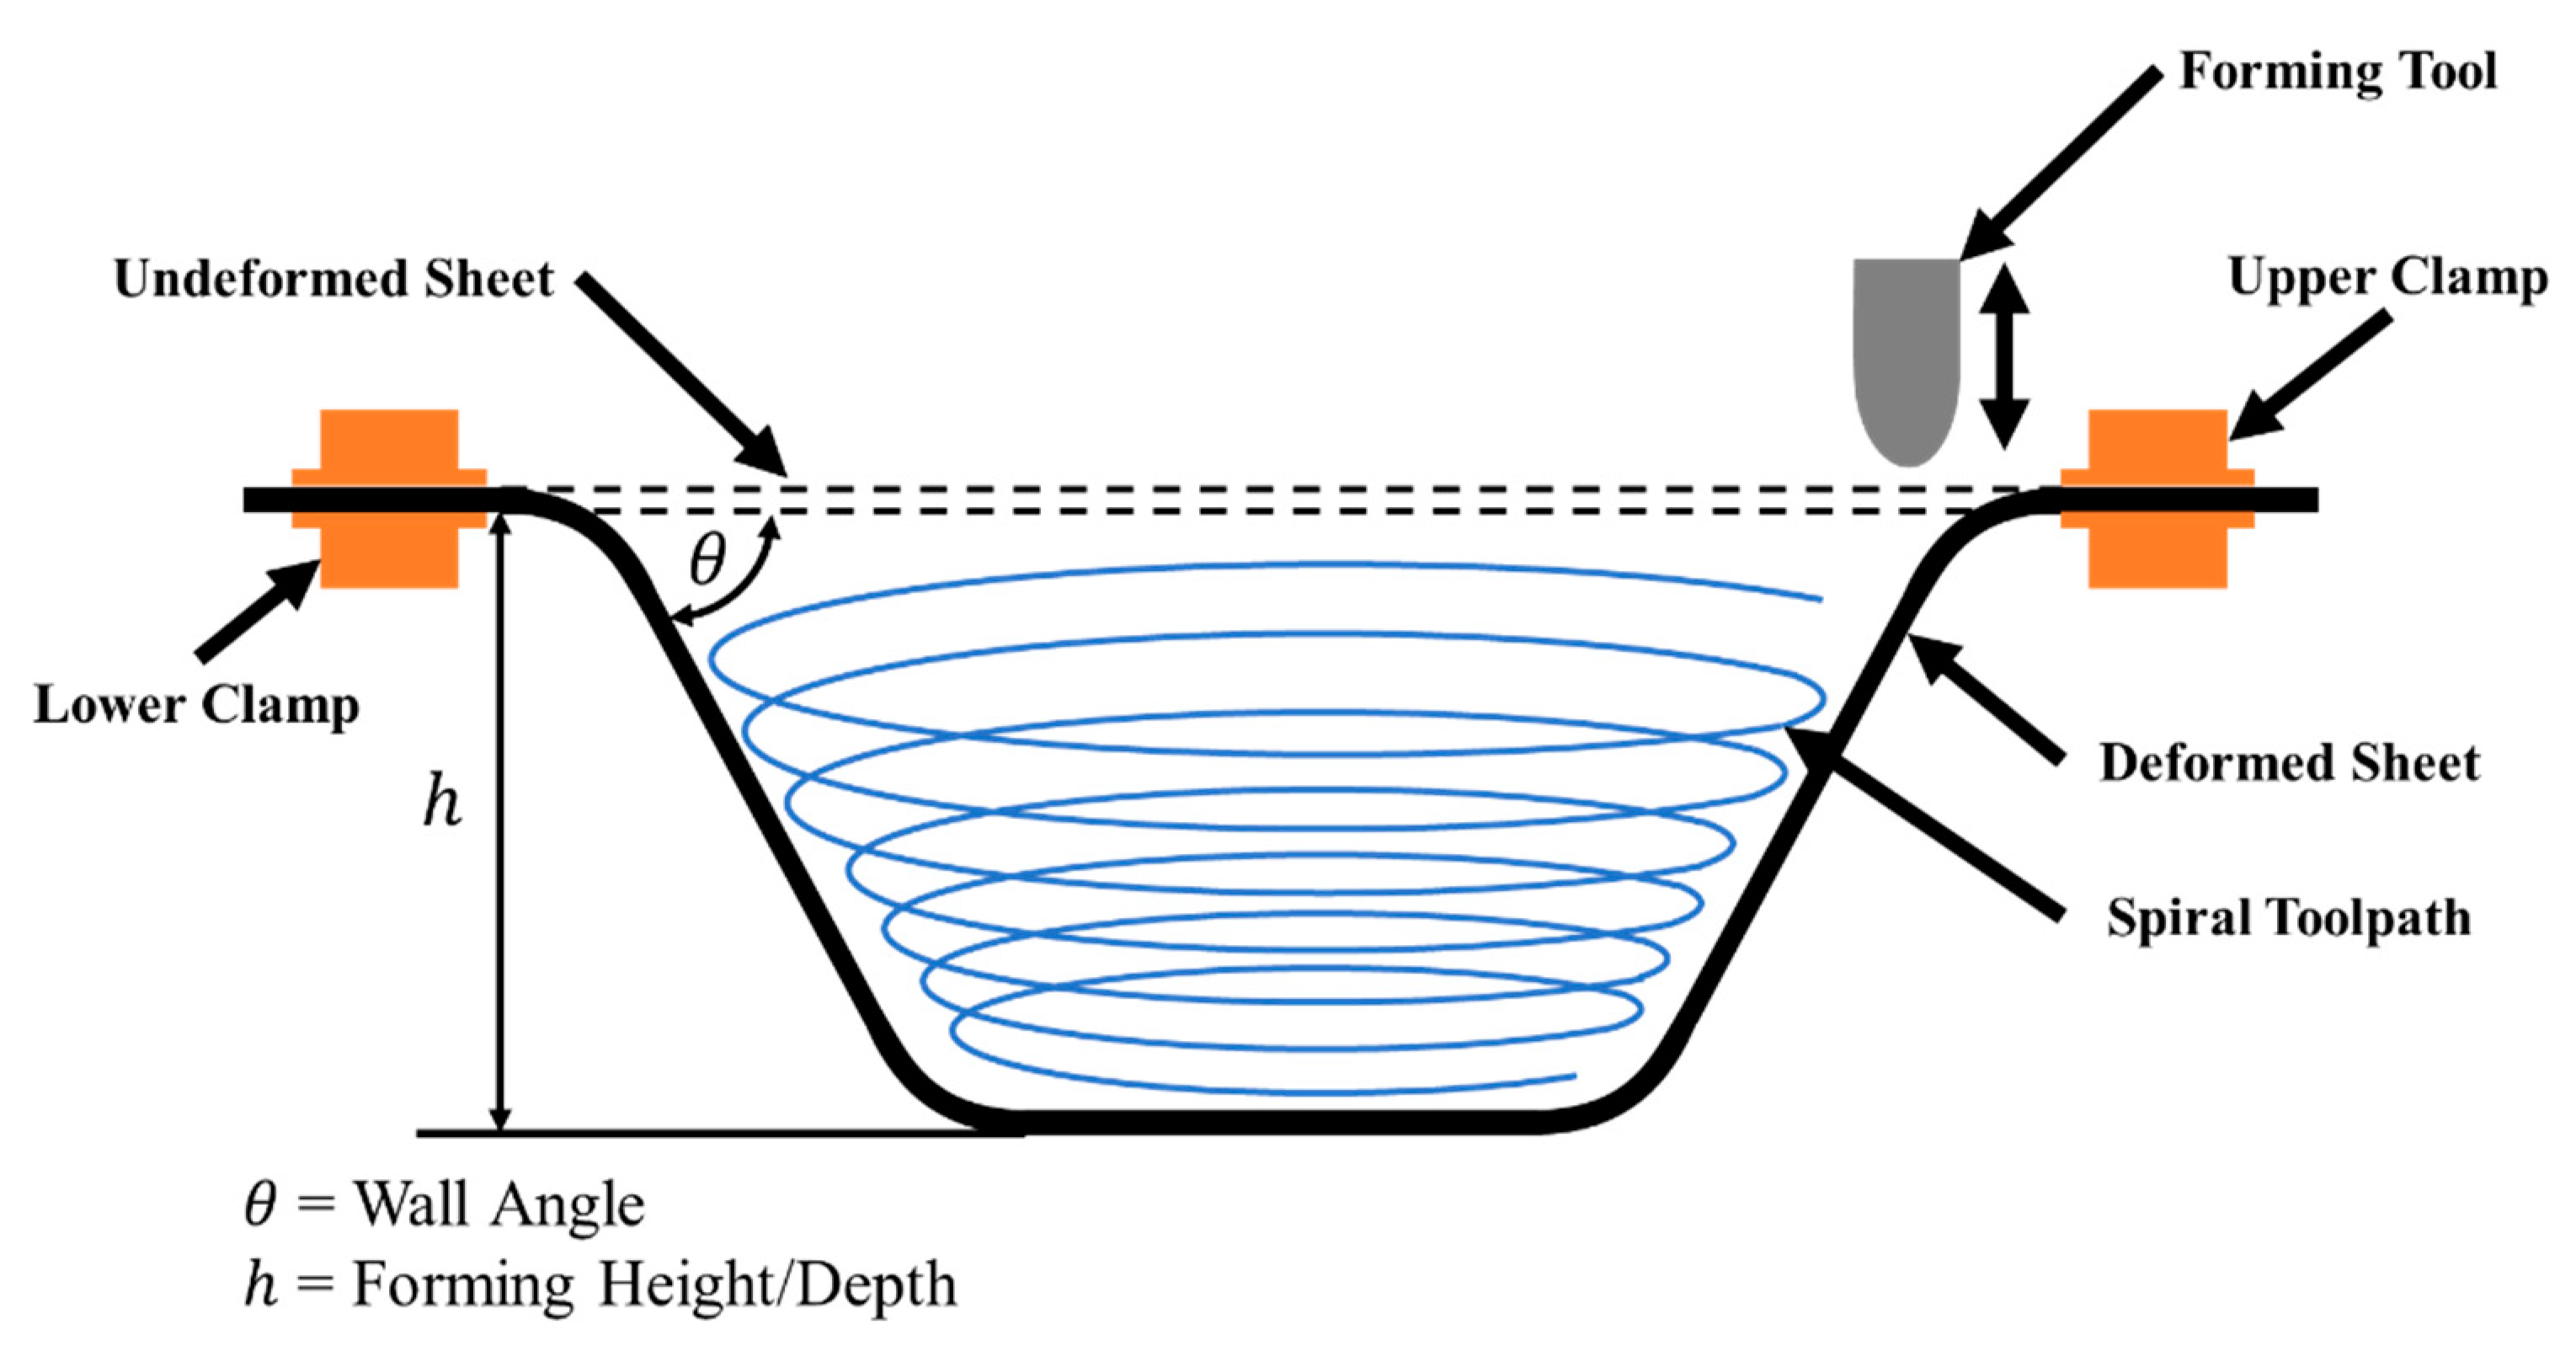
2. Deformation Methods and Methodology

2.1. Deformation Behaviour
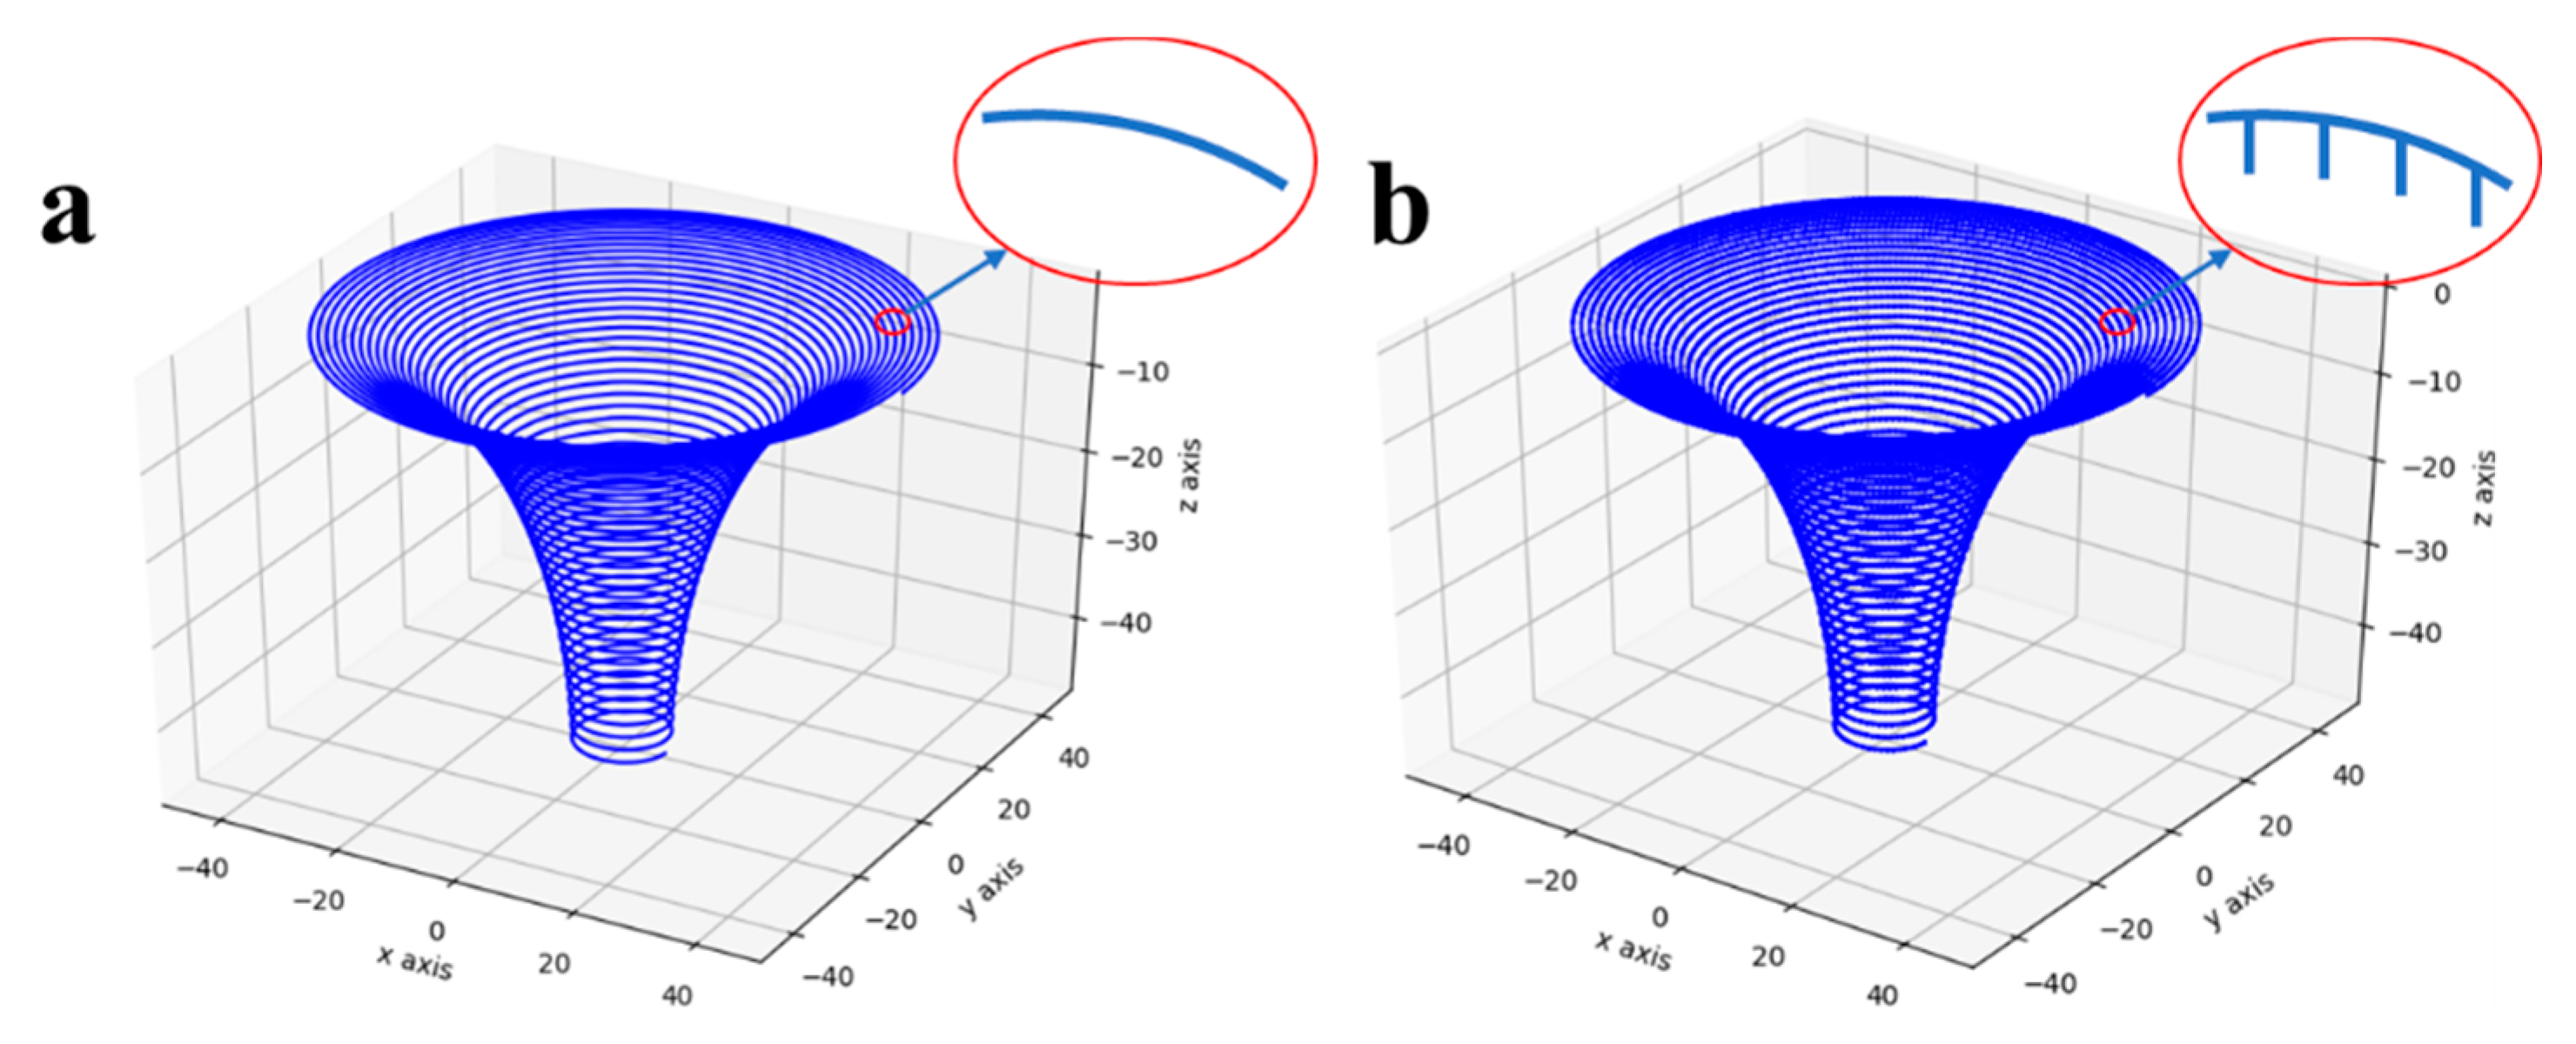
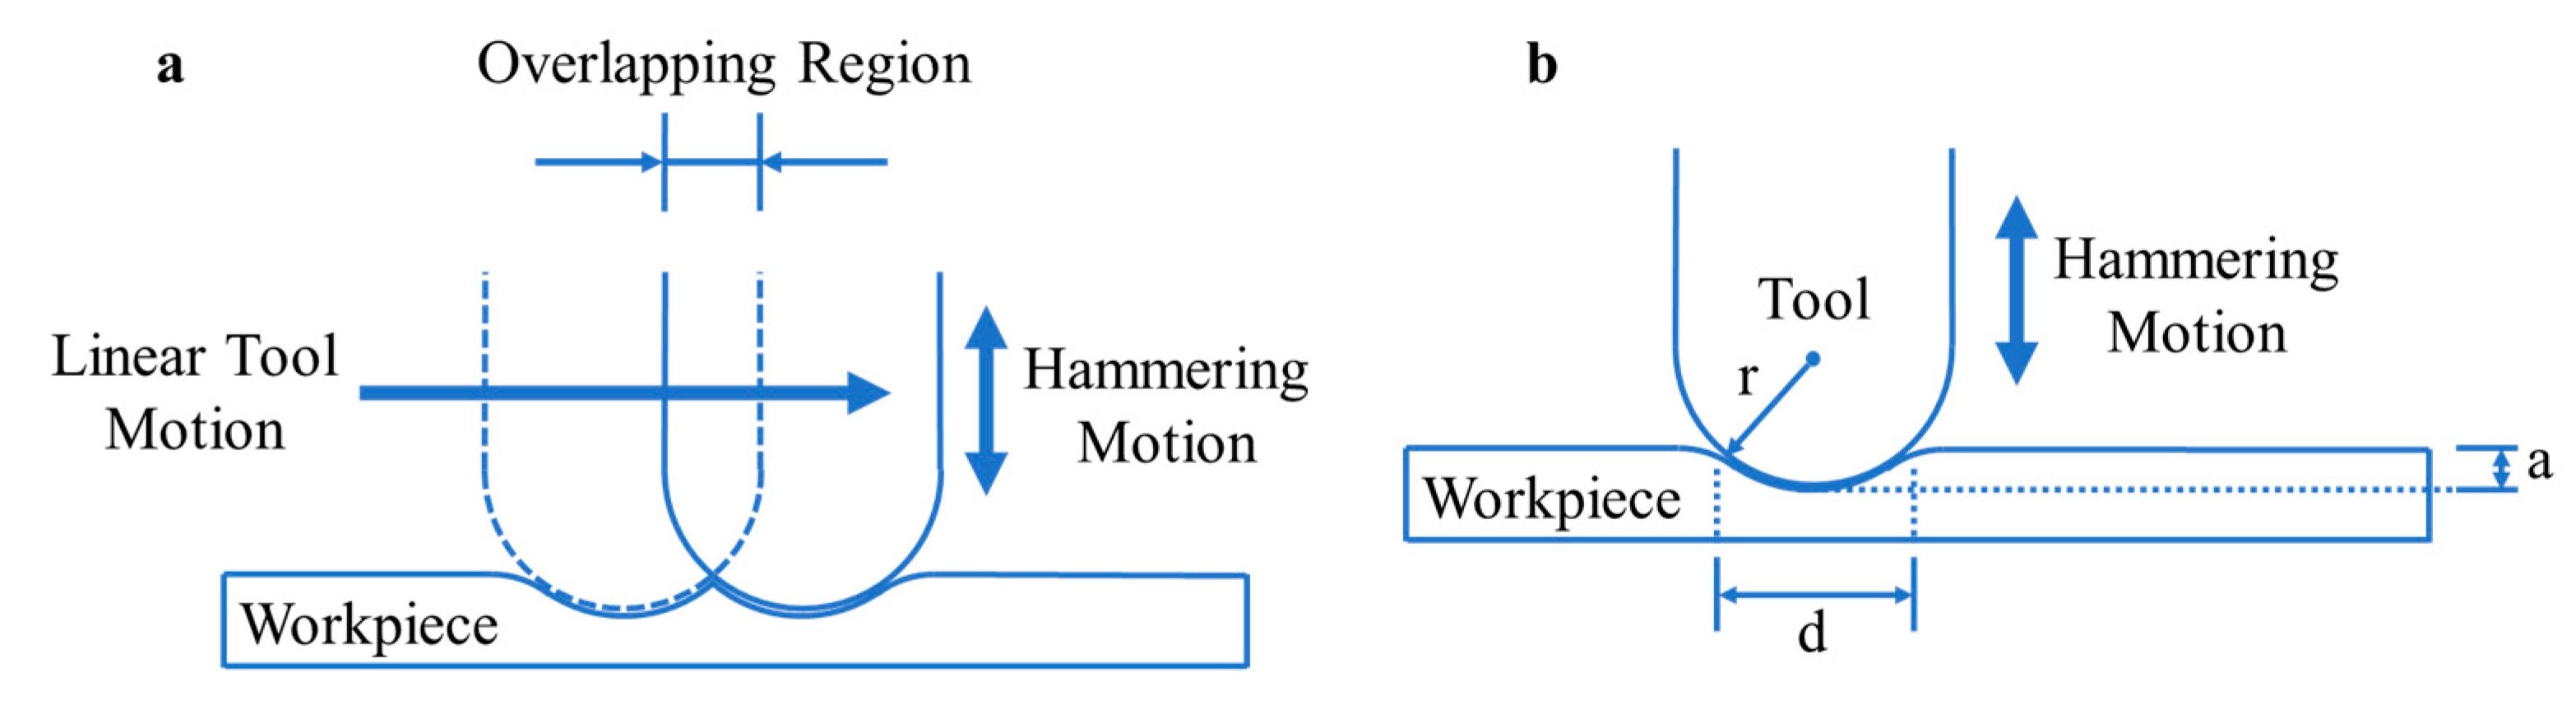
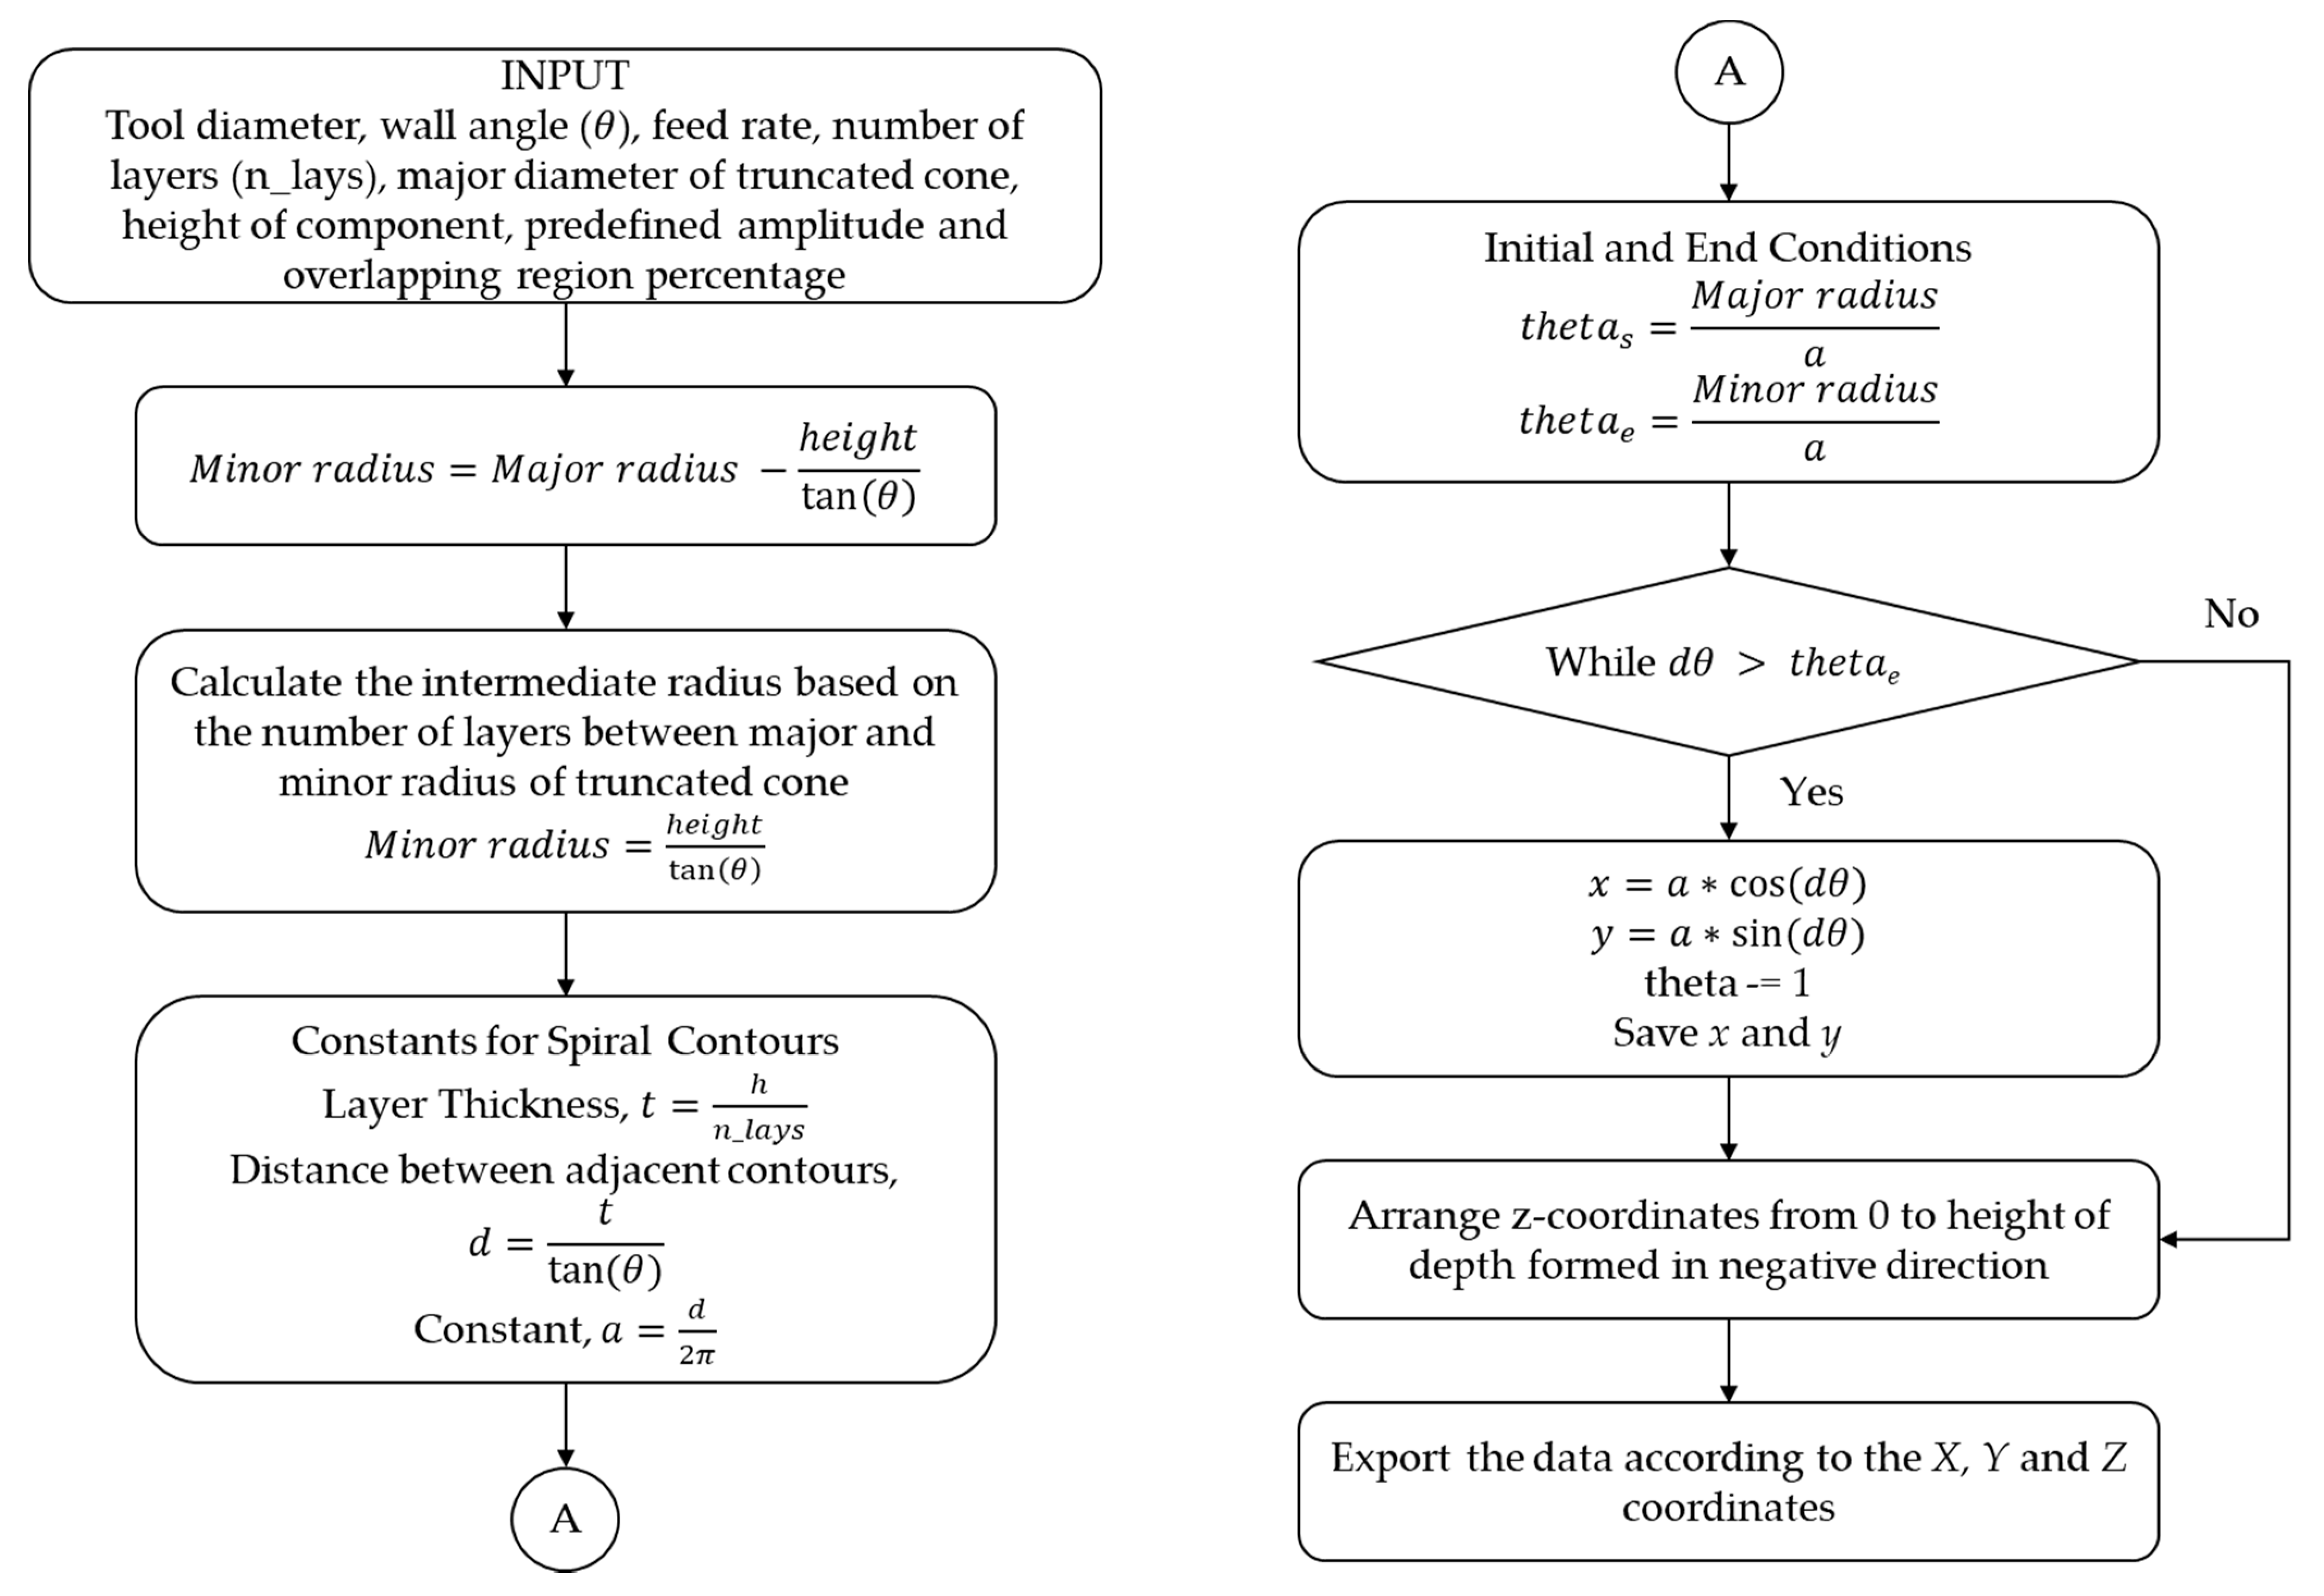
To understand the deformation behavior of the hammering integrated with the ISF process, the deformation of the workpiece needs to be studied based on the linear tool movement due to the hammering operation. Figure 2 shows the schematics of deformation of the workpiece with respect to the hammering induced linear tool movement. The tool moves from one position to another position in certain steps. Initially, the tool aligns itself to the first hammering position where it deforms the workpiece with predefined amplitude. In the next step, the tool retracts to its original position and then moves to the next hammering position and similarly deforms the workpiece.
When the tool deforms two successive hammering positions, it forms an overlapping region, as shown in Figure 3a. The overlapping region affects the surface quality of the formed component, i.e., if the overlapping region is bigger, the surface quality of the deformed product is poor. Further, the overlapping region dimension adversely affects the production time. Thus, the overlapping region should be chosen such that the surface quality of the product is maintained, and the production time is minimized [18].
Figure 3b shows the basic hammering mechanics in which a hemispherical tool with radius (r, mm) impacts the workpiece with predetermined amplitude (a, mm). ‘d’ is the maximum length of the deformed area of the workpiece (mm), which further helps in deducing the frequency of the impact (f, Hz), when the tool moves with certain feed rate (V, mm/s). The frequency of the impact is calculated using Equations (1) and (2).
f = V d
d = 2 2 r a a 2
Equations (1) and (2) help to investigate the frequency of the impact during the spiral movement of the tool deforming the workpiece as shown in Figure 3b. Further, the indentation marks and the overlapping region can be controlled with the help of controlling the input process parameters such as predetermined amplitude and feed rate of the tool.

2.2. Methodology

The formability was studied for both the ISF and ISH processes with the aluminum alloy (AA1050) in terms of the wall angle, forming depth, and forming limits of the formed geometries. Hussain et al. [19] had proposed that the number of experiments would increase to study the formability of the component. Thus, to minimize the number of experiments to determine the formability of a material, it was advised to form a varying wall angle truncated cone (VWATC). The VWATC was used as the initial test geometry, with wall angle, varying from 0 degrees on the top to 90° at the bottom of the cone, as shown in Figure 4. In the incremental forming process, the tool motion was controlled with the help of numerical control (NC) codes of the desired component. Generally, the NC codes were obtained by generating a spiral toolpath of the required geometry in CAD/CAM software [16]. The toolpath for the VWATC was prepared with the help of an in-house developed generalized python code (kindly refer to Appendix A), which is independent of any commercial CAD/CAM software. The input of the generalized python code for VWATC was the major and minor diameters of the geometry, the height of the VWATC, number of layers or step depth and number of points in one spiral contour. Figure 5 shows the toolpath trajectory for the ISF and ISH processes. The enlarged section in Figure 5 shows the tool motion during both processes.
During forming of the VWATC, the sheet thickness decreases continuously with increasing wall angle, which ultimately leads to rupture of the component at the point of minimum thickness. The angle at which the VWATC fractures was considered as the maximum achievable wall angle for the sheet material. The present work initiated with the forming of VWATC using the toolpath strategies for ISF and ISH processes as shown in Figure 5. Further, the wall angle achieved through both processes was investigated through experimentation. The VWATC was formed till the point of fracture to determine the forming height achieved through both processes. The formed height of the VWATC was used to determine the wall angle achieved for the respective components formed through ISF and ISH processes. The tangent at the point of fracture revealed the wall angle achieved in the components formed through ISF and ISH processes. To ensure correctness in the results, three sets of VWATC components were formed through ISF and ISH processes individually. Further, the mean values of the wall angle achieved through ISF and ISH processes were compared to find the minimum value of the achieved wall angle. The minimum wall angle observed after comparison was taken as an input wall angle for the constant wall angle truncated cone (CWATC) geometry. The minimum wall angle found through comparison was 78° and it was considered as the wall angle for CWATC. The schematic of the CWATC is shown with the help of Figure 6. To form the CWATC through ISF and ISH processes, the toolpaths were developed using the similar generalized python code which was discussed earlier. The results obtained in terms of sheet thickness, depth achieved, surface roughness, wall angle, and forming limits were compared for the two processes.

3. Numerical Simulation and Experimental Work

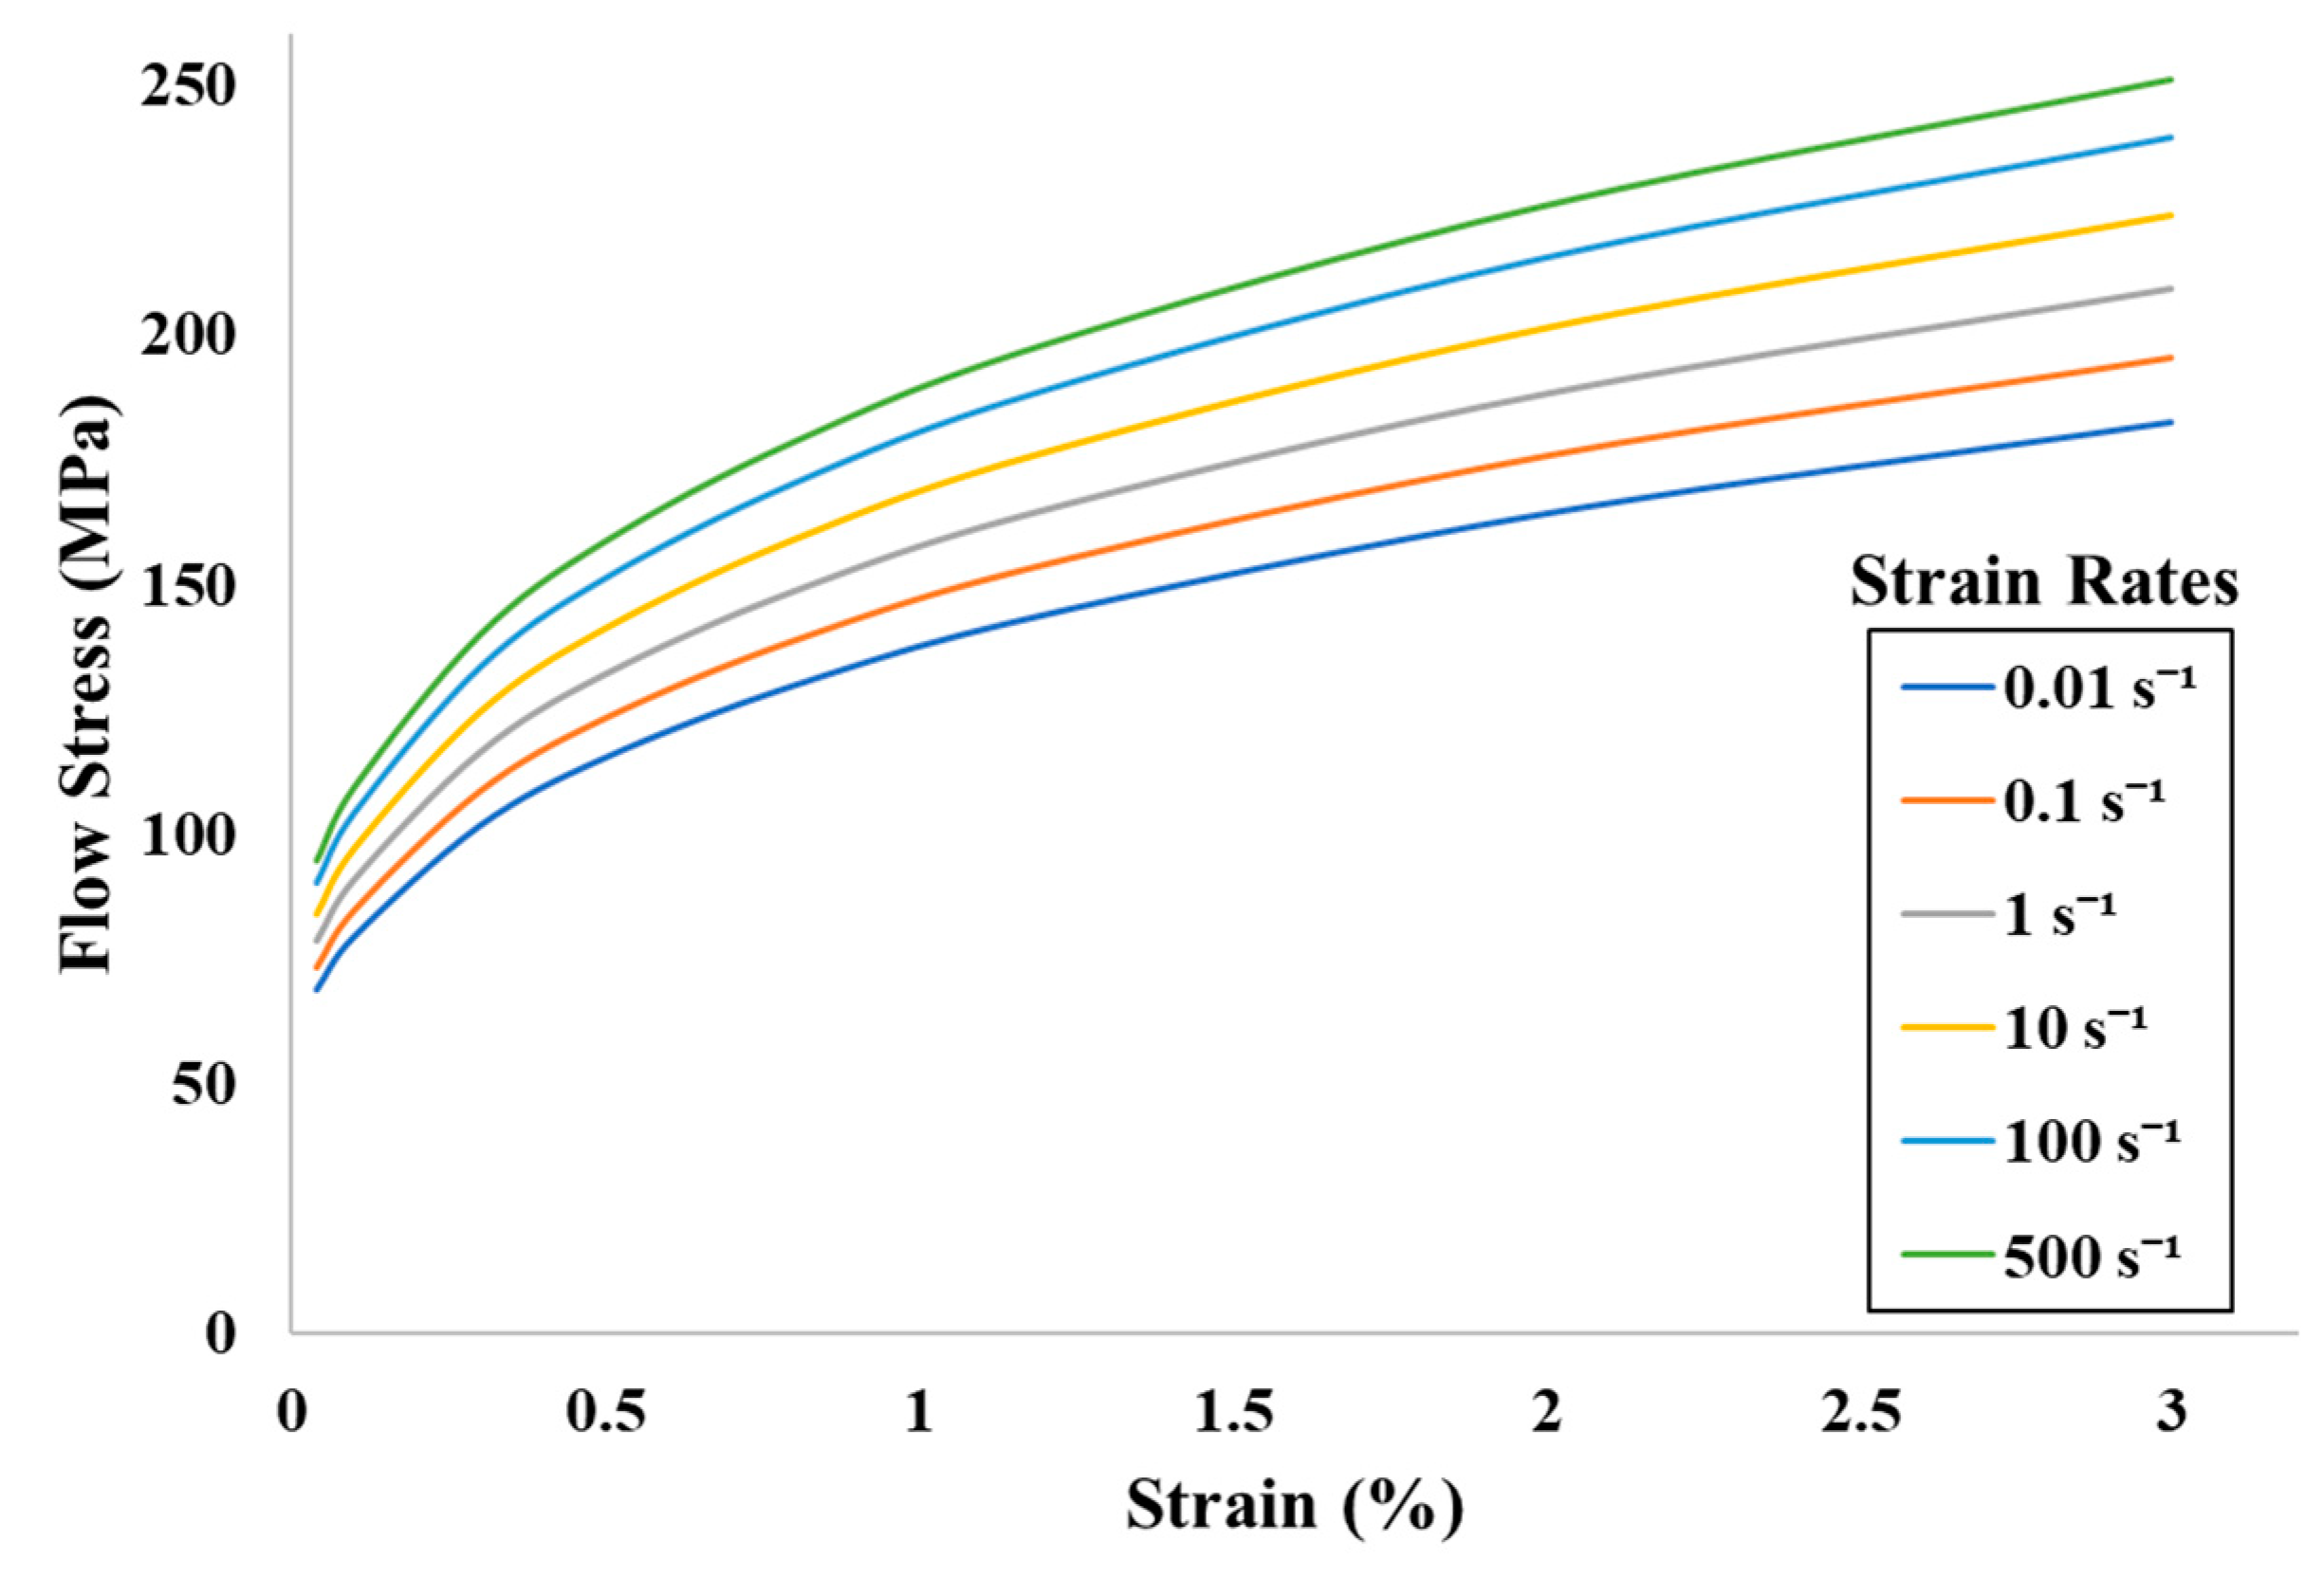
3.1. Material Properties

The ISF process is more widely adopted in the automobile and aerospace industries where lightweight materials are preferred. Aluminum and its alloys have gained tremendous popularity in recent decades in aerospace and automobile applications. Keeping these factors in mind, a commercial aluminum alloy AA1050 was used for the current research purpose. A sheet of 1 mm thickness was used during the experimentation. The tensile test was performed on the mechanical testing equipment GLEEBLE 350 (GLEEBLE—A VPG Brand, Poestenkill, NY, United States) to obtain the mechanical properties and elastoplastic response of AA1050 at room temperature. Table 1 depicts the material properties of aluminum alloy AA1050 at room temperature, which is responsible for the material behaviour. Figure 7 shows the flow stress-strain curves for different strain rates at room temperature obtained through mechanical testing.

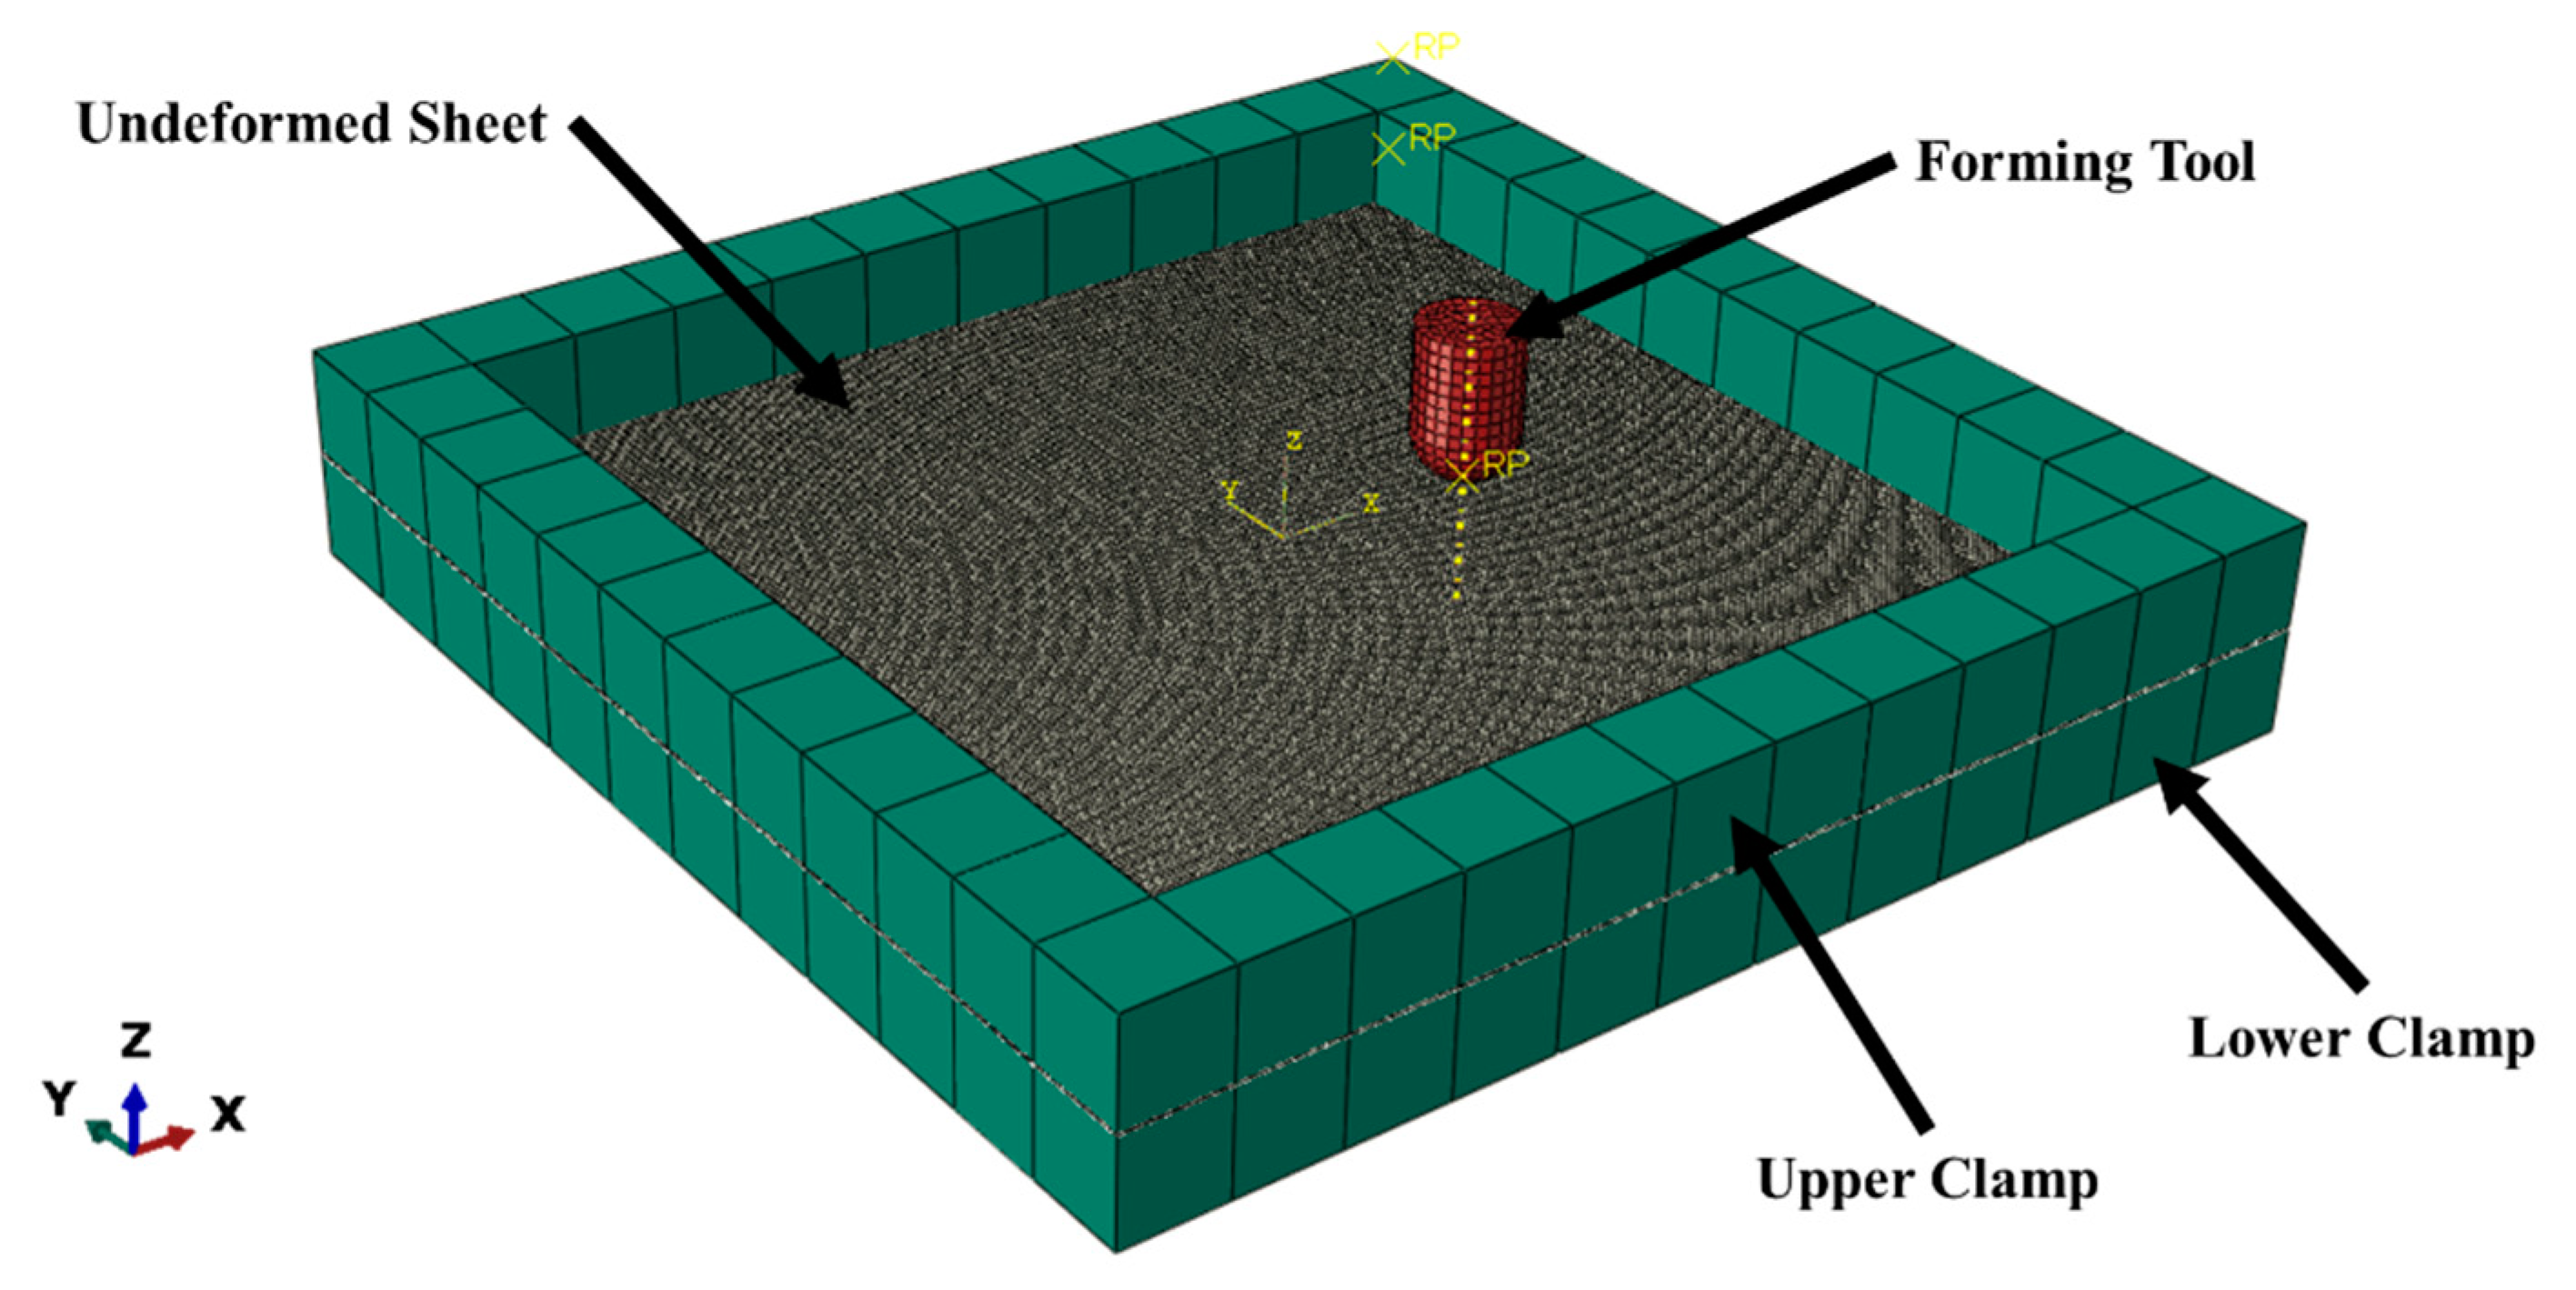
3.2. Numerical Simulation

The numerical simulations of both the processes were carried out in the ABAQUS/CAE (SIMULIA™ by Dassault Systèmes®, Vélizy-Villacoublay, France) version 2017 platform with a built-in explicit solver. The explicit approach was selected because it is computationally more efficient. Figure 8 shows the meshed model used during the numerical simulation. The workpiece material, i.e., sheet blank with a thickness of 1 mm, was modelled. The ratio of the material thickness (h) to the length of the workpiece (L) was less than 0.3 which allows usage of shell elements instead of solid elements [20]. Therefore, the sheet was meshed using the four-node square shell element S4R, having a mesh size of 1 mm. Chung et al. [21] had reported that the shell elements are not able to properly predict the plastic deformation in the thickness direction. Li et al. [22] had suggested that the use of shell elements lead to an inaccurate evaluation of transverse shear strain when the bending effect is important. In the present work, the numerical simulation results are used only to access qualitative differences between the two processes, thus, the numerical simulation was carried out with explicit solver and shell elements due to their computational efficiency. To satisfy the experimental conditions, the sheet was fixed at its outer boundary with the help of upper and lower clamps. The upper and lower clamps were meshed as discrete rigid elements as these fixtures were assumed to be non-deformable. The hemispherical tool of diameter 10 mm was modelled and meshed with the help of discrete rigid shell elements, which moves according to the toolpath strategies developed for both processes. The size of the sheet blank was 110 mm × 110 mm. The simulation of the incremental forming process has various nonlinearities due to the nature of the process. Furthermore, the incremental forming process is 3D in nature without any symmetry plane. Typically, a significant number of elements must be employed, and the tool must follow a longer trajectory, which makes the finite element analysis difficult and time-consuming. A high-velocity artificial tool was found to be suitable for the simulation of the incremental forming process [23]. Thus, the artificially increased feed rate was taken as 2000 mm/s to reduce the computational time maintaining quasi-static conditions. The computation time depends on many factors like element size, analysis procedure, i.e., explicit or implicit and the machine specifications. The total step time for forming a CWATC was 4.0041 s with the ISF process, while it took 4.7169 s in the case of the ISH process. The hammering operation was incorporated in the toolpath strategy of the ISH process; thus, the computation time and production time was higher in the case of the ISH process than the ISF process. Further, the time for forming a component in the ISH process depends on the overlapping region and the amount of predefined amplitude. In the present work, the overlapping region in the case of the ISH process was 25%, i.e., 1/4th of the trailing deformed area overlapped with the leading area. The increasing amplitude of hammering results in the poor surface quality of the component and it eventually leads to early rupture of the component [15]. Therefore, the amplitude of hammering was considered as 0.05 mm. The contact condition and the type of interaction of the deforming tool with the sheet during processing has a great influence on the redistribution of the material of the surface layer [24,25]. The interaction between tool and sheet was described using master and slave algorithm with the coefficient of friction taken as 0.05 [26]. The results obtained through the numerical simulation are further compared with experimental results and are discussed later in the results section.

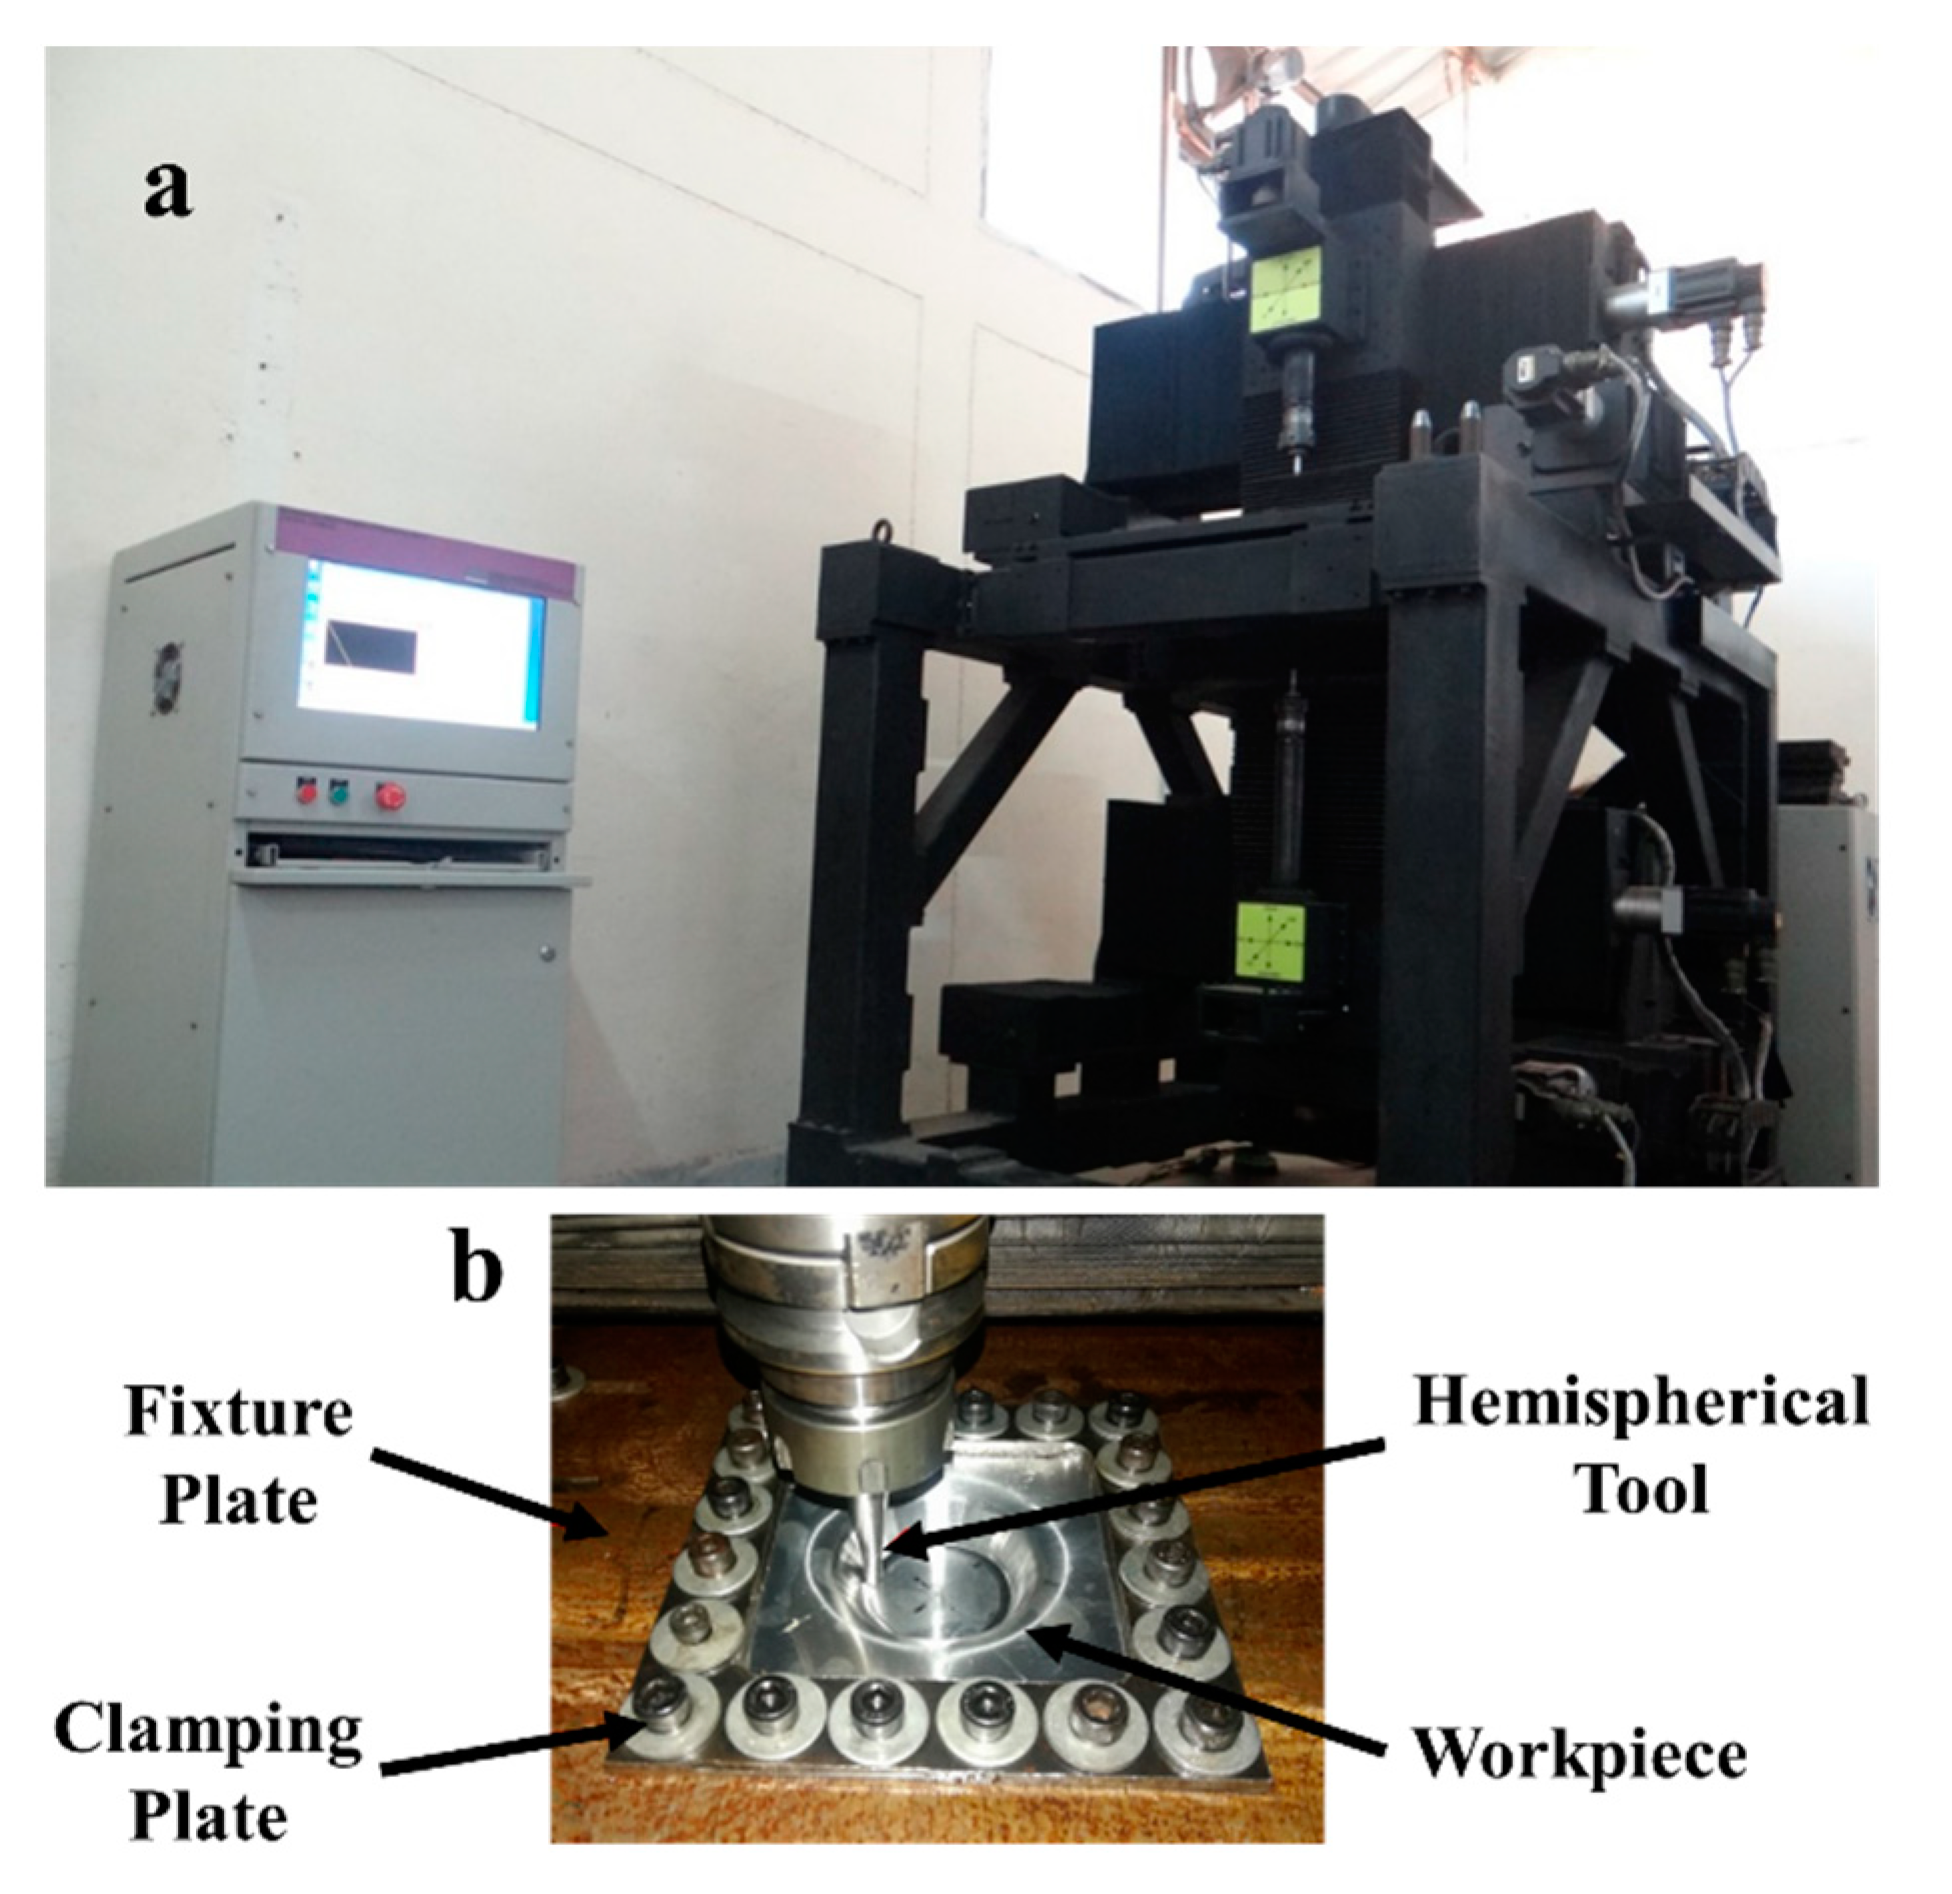
3.3. Experimental Setup

The experimental work was mainly carried out to validate the simulation results. Figure 9 shows the experimental setup of the incremental sheet forming process. It mainly consists of a CNC forming rig, sheet, forming tool, clamping plate, and fixture plate. Sheet blank was clamped on the fixture plate with the help of a clamping plate through threaded bolts. During the experimentation, a stainless-steel hemispherical tool of 10 mm diameter was used for all the experiments. The tool can move in the X, Y, and Z directions with the help of numerical control at a predetermined feed rate, i.e., 800 mm/min.

4. Results and Discussions

This section discusses the comparative results of both the processes in terms of formability, thickness distribution, geometrical accuracy, and surface roughness.

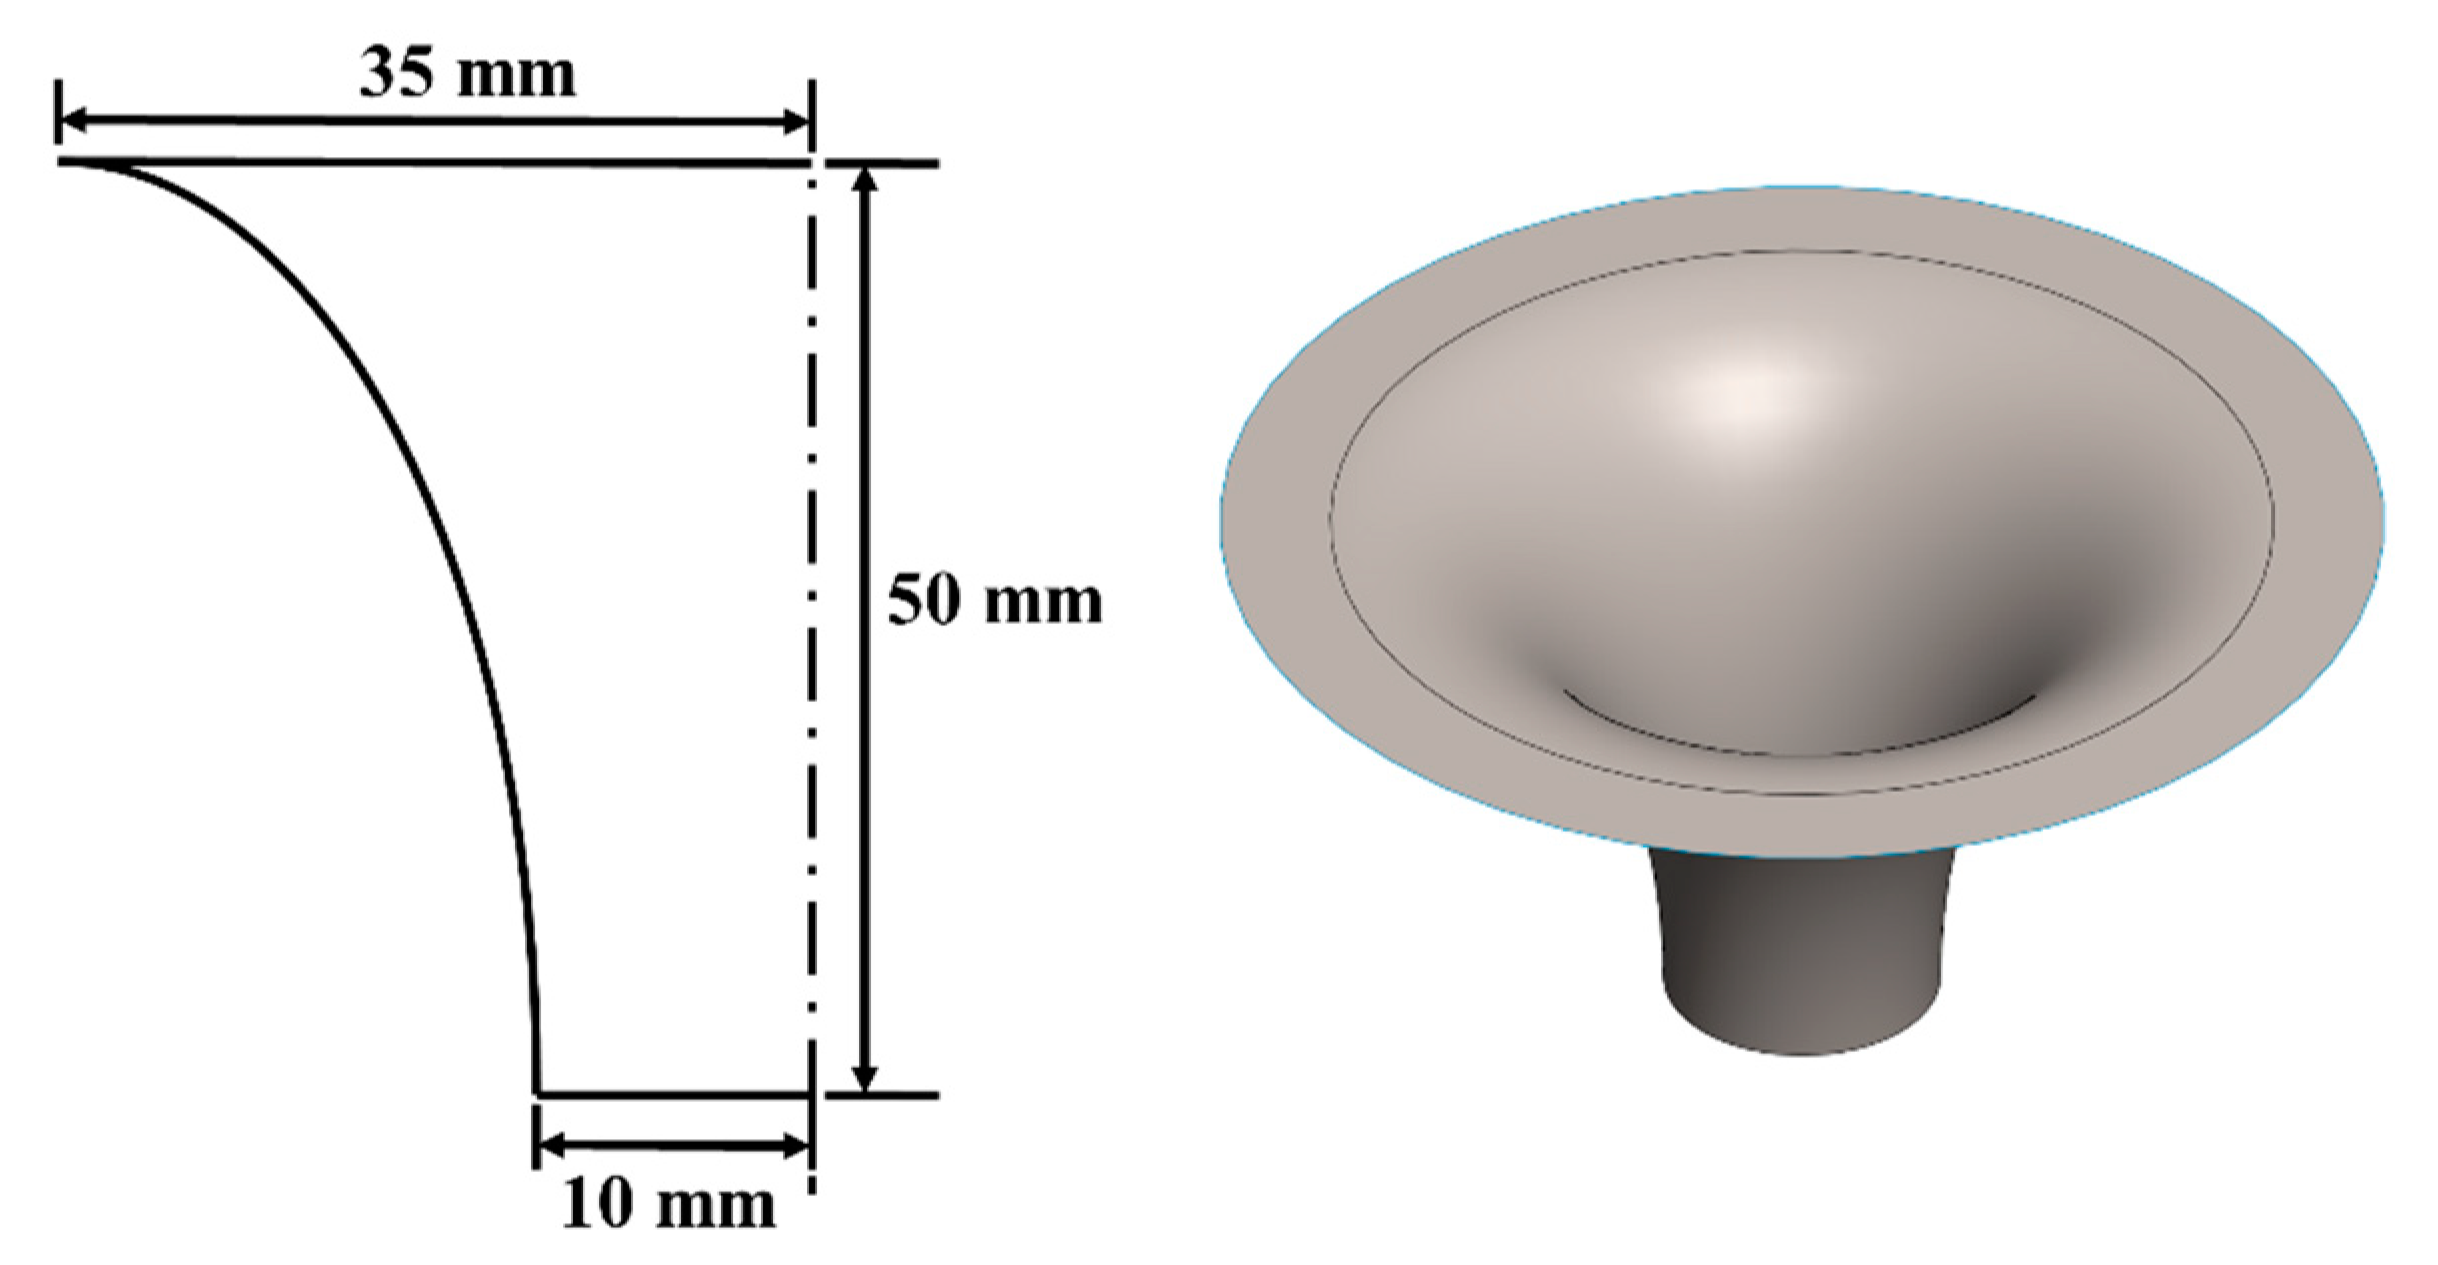
4.1. Results Based on VWATC Test Geometry

The experiments performed to form the VWATC provides the maximum wall angle for both processes. Further, it compares the formability of both the processes in terms of maximum forming depth while forming the VWATC. The maximum forming depth of the fracture depth reveals the maximum wall angle that can be achieved for respective processes. Figure 10 shows the VWATC formed through ISF and ISH processes. Table 2 presents the maximum forming depth and maximum wall angle observed through VWATC during experimentation for both processes. The maximum forming depths observed for the ISF and ISH processes were 30.71 mm and 32.31 mm, respectively. The wall angles at these depths were observed to be 78.19° and 79.29°, respectively, for the ISF and ISH processes. The experimentation carried out to form the VWATC through both processes reveals that the higher forming depth was achieved with the ISH process compared to the ISF process. This leads to a higher wall angle achieved in the case of the ISH process. Thus, it authenticates that higher formability can be achieved for the ISH process.

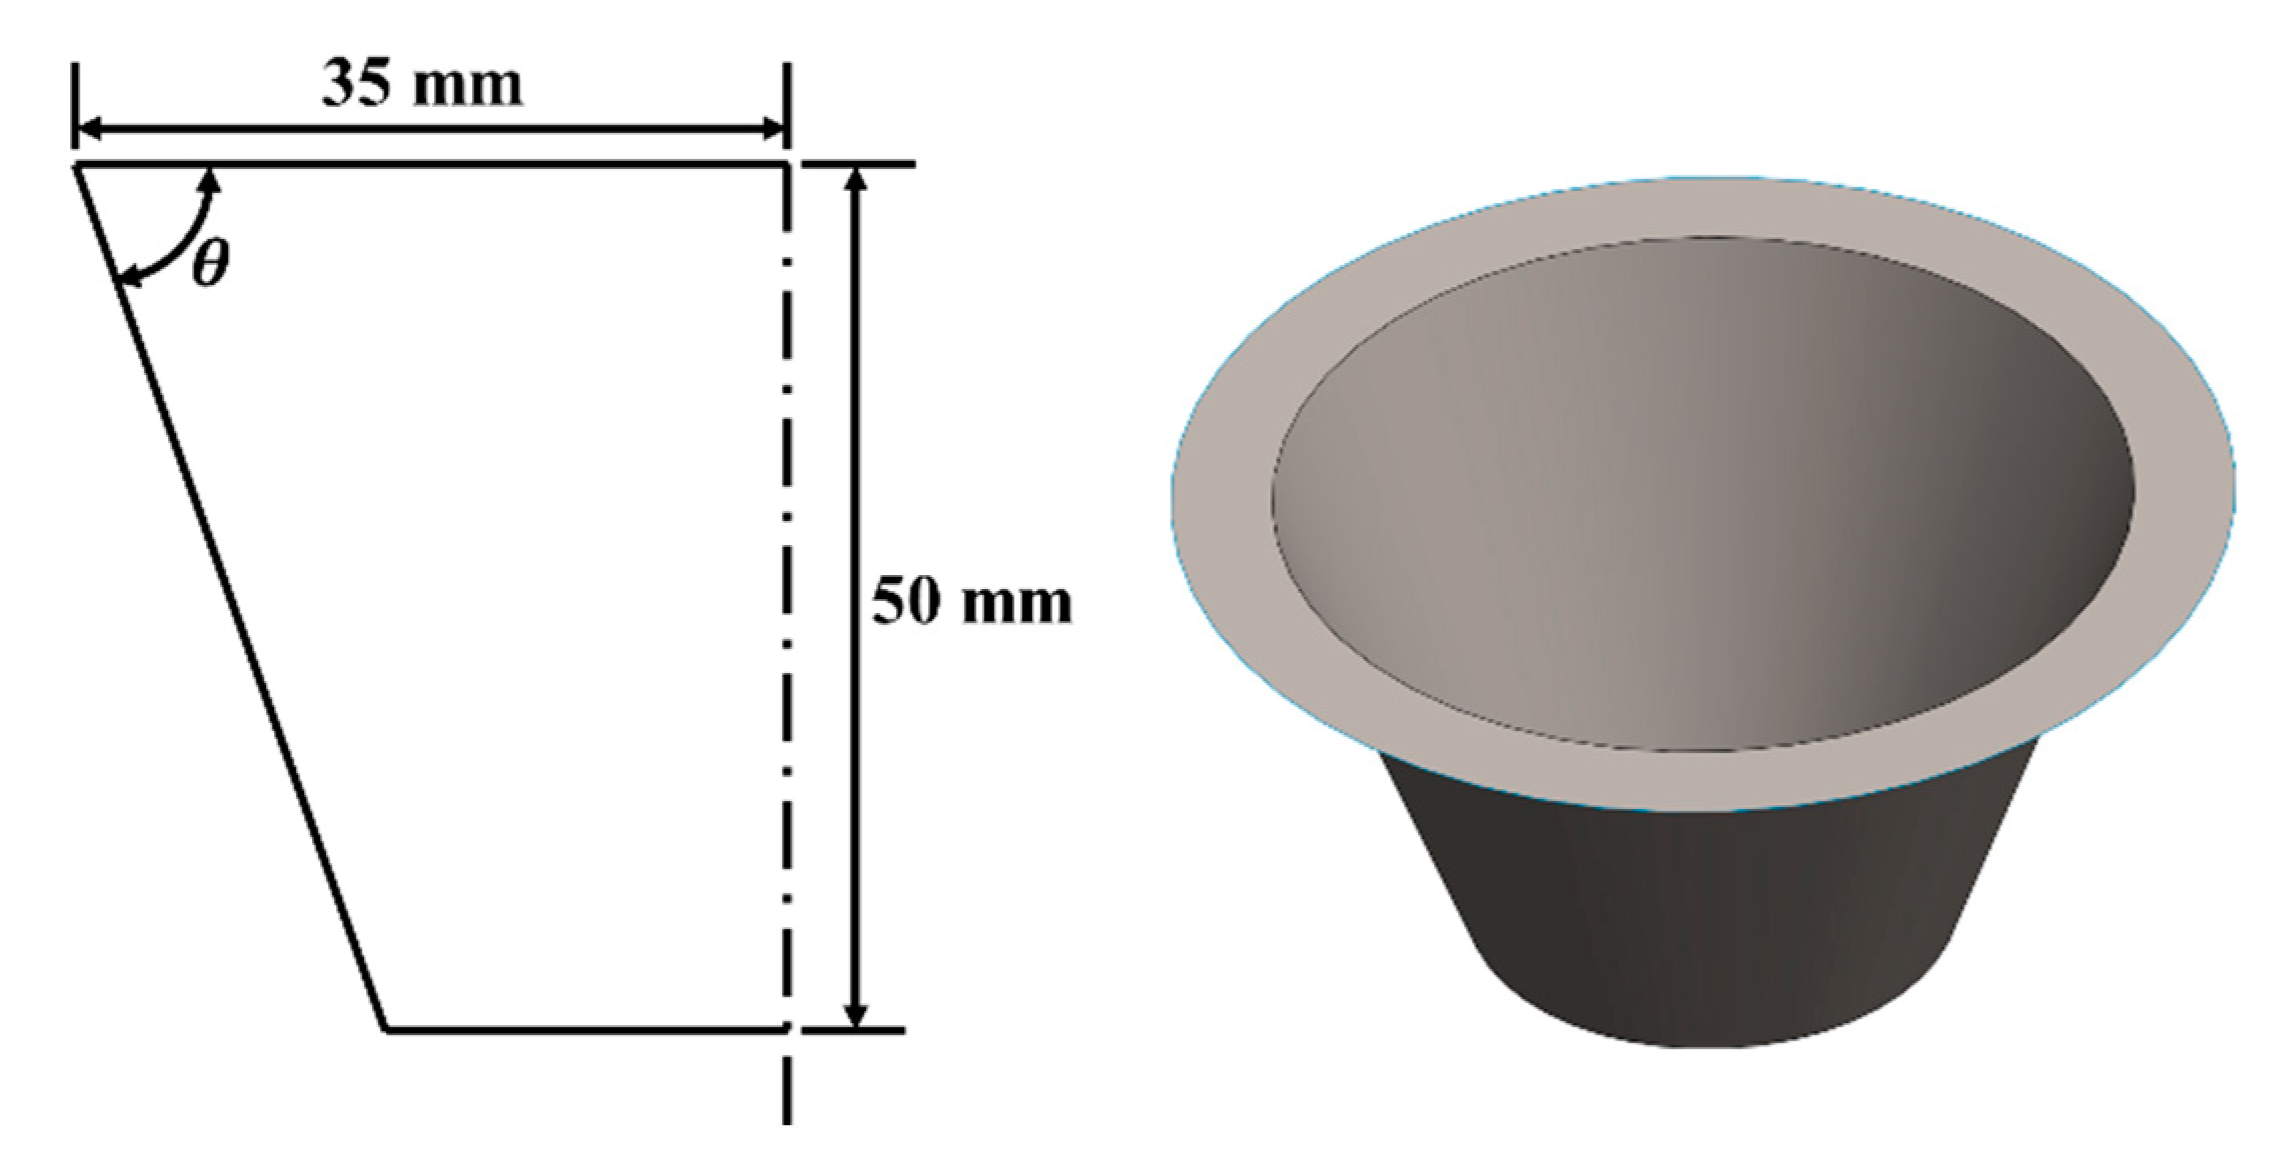
4.2. Results Based on the CWATC Test Geometry

The maximum wall angle achieved through experimentation of VWATC was 78.19° for the ISF process. Therefore, 78° CWATC were fabricated through both the processes to further validate that the higher formability associated with the ISH process. The forming time was 16.5 min for components formed through ISF process and it was 18.7 min for components formed through ISH process. Figure 11 shows the CWATC formed through ISF and ISH processes. The maximum forming depth achieved for both the processes is presented in Table 3.

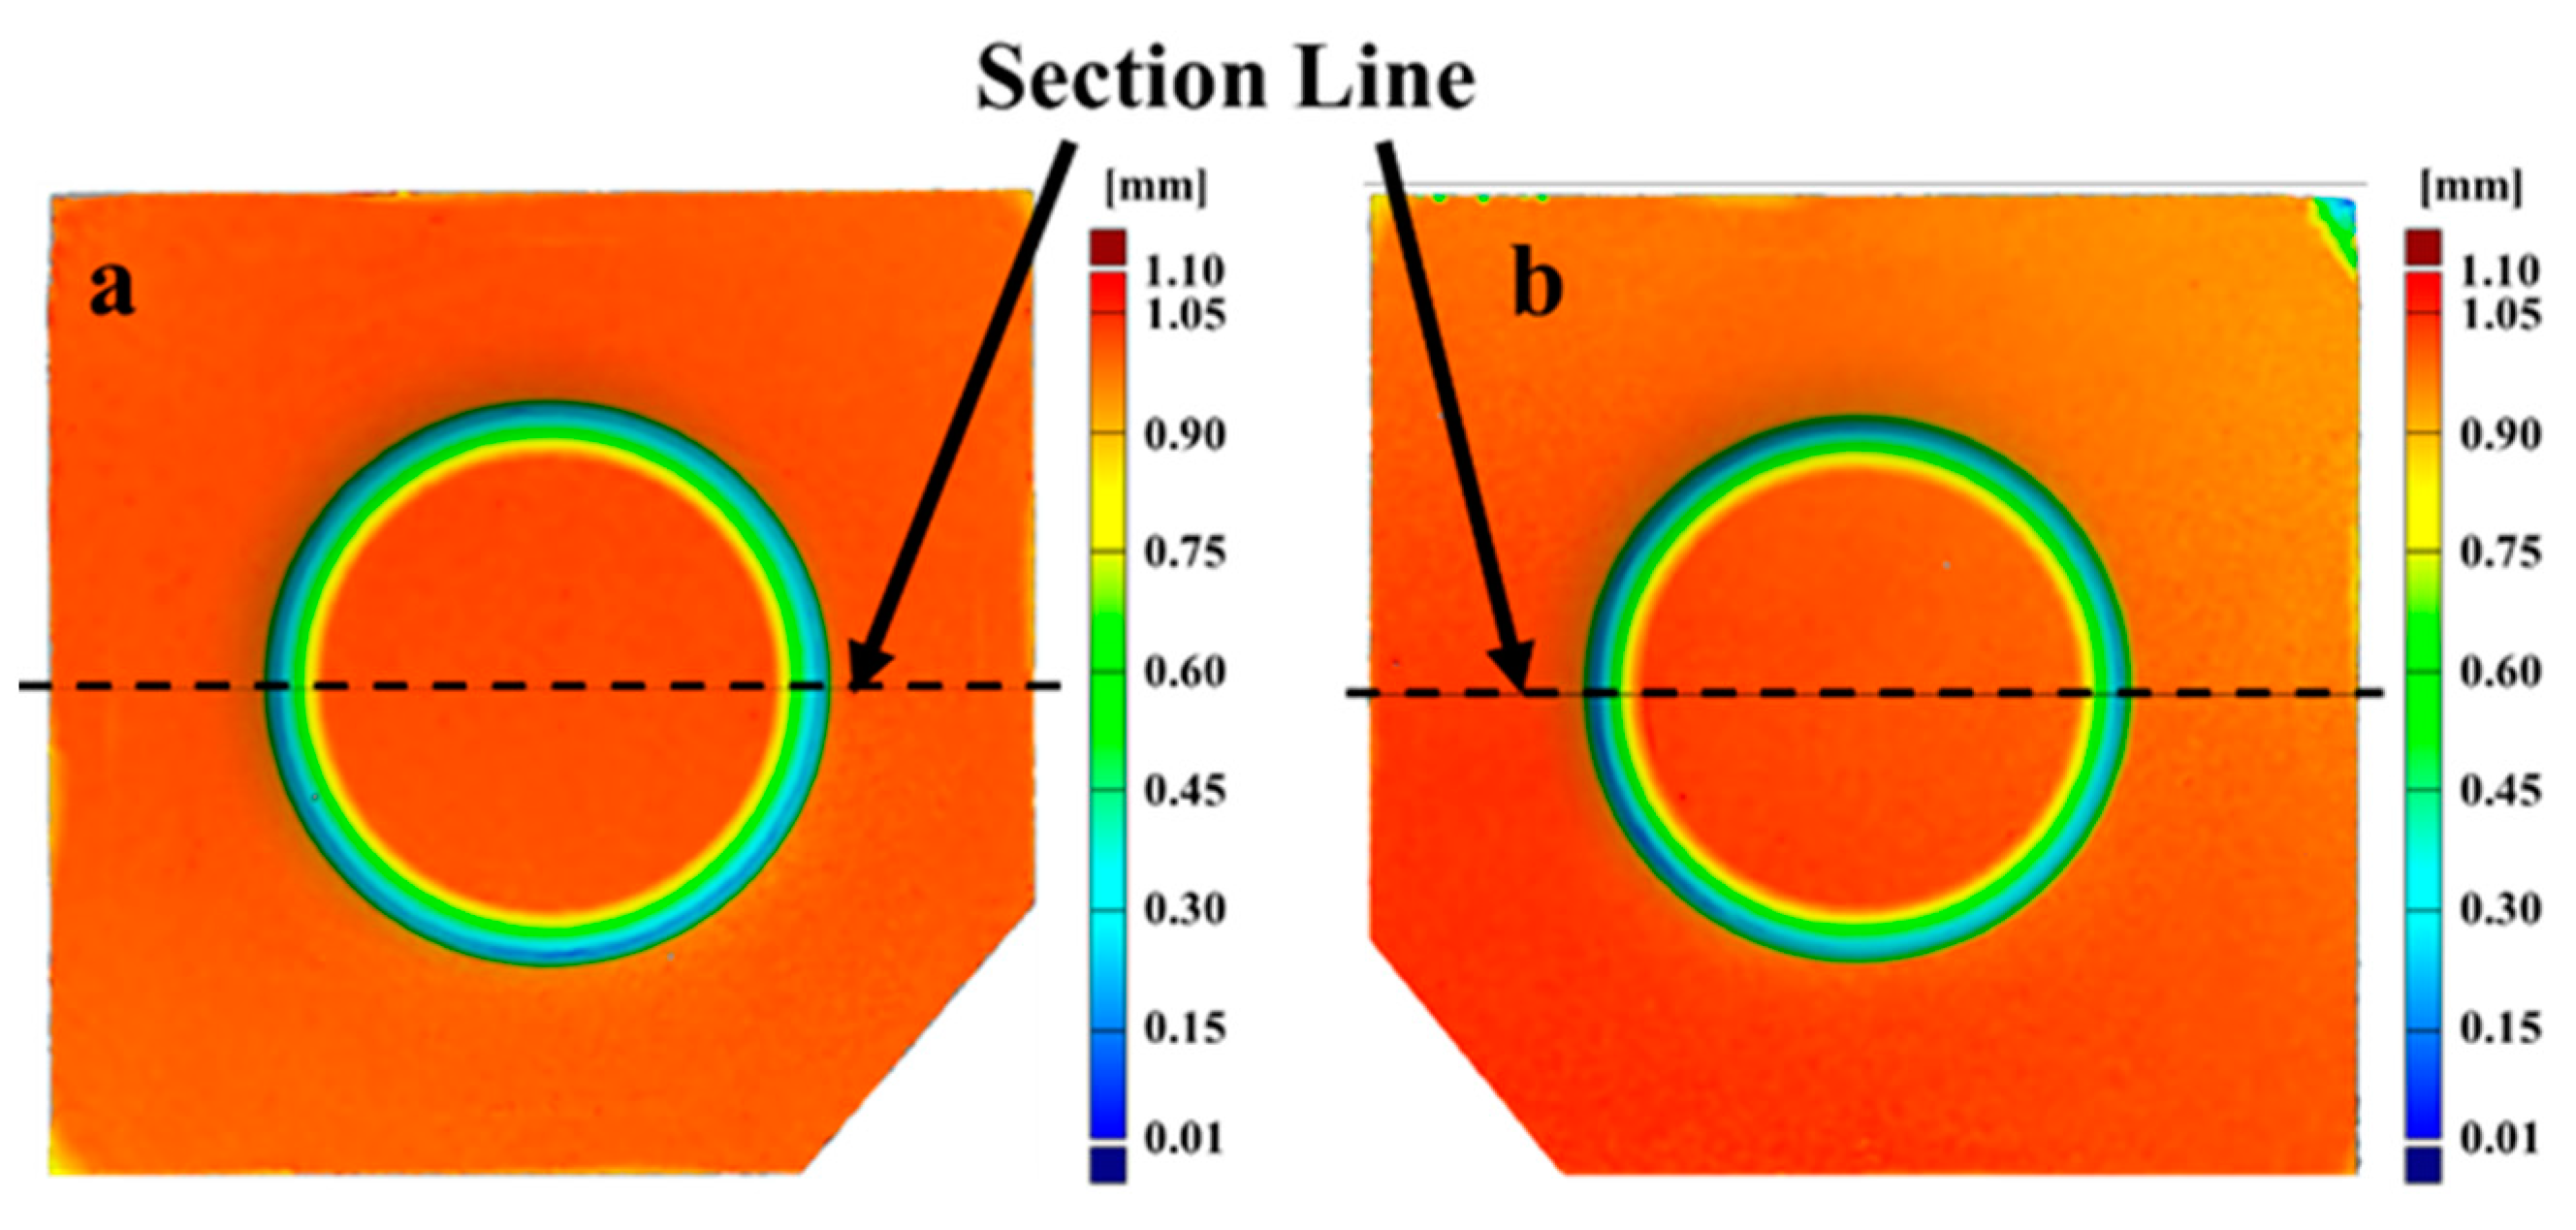
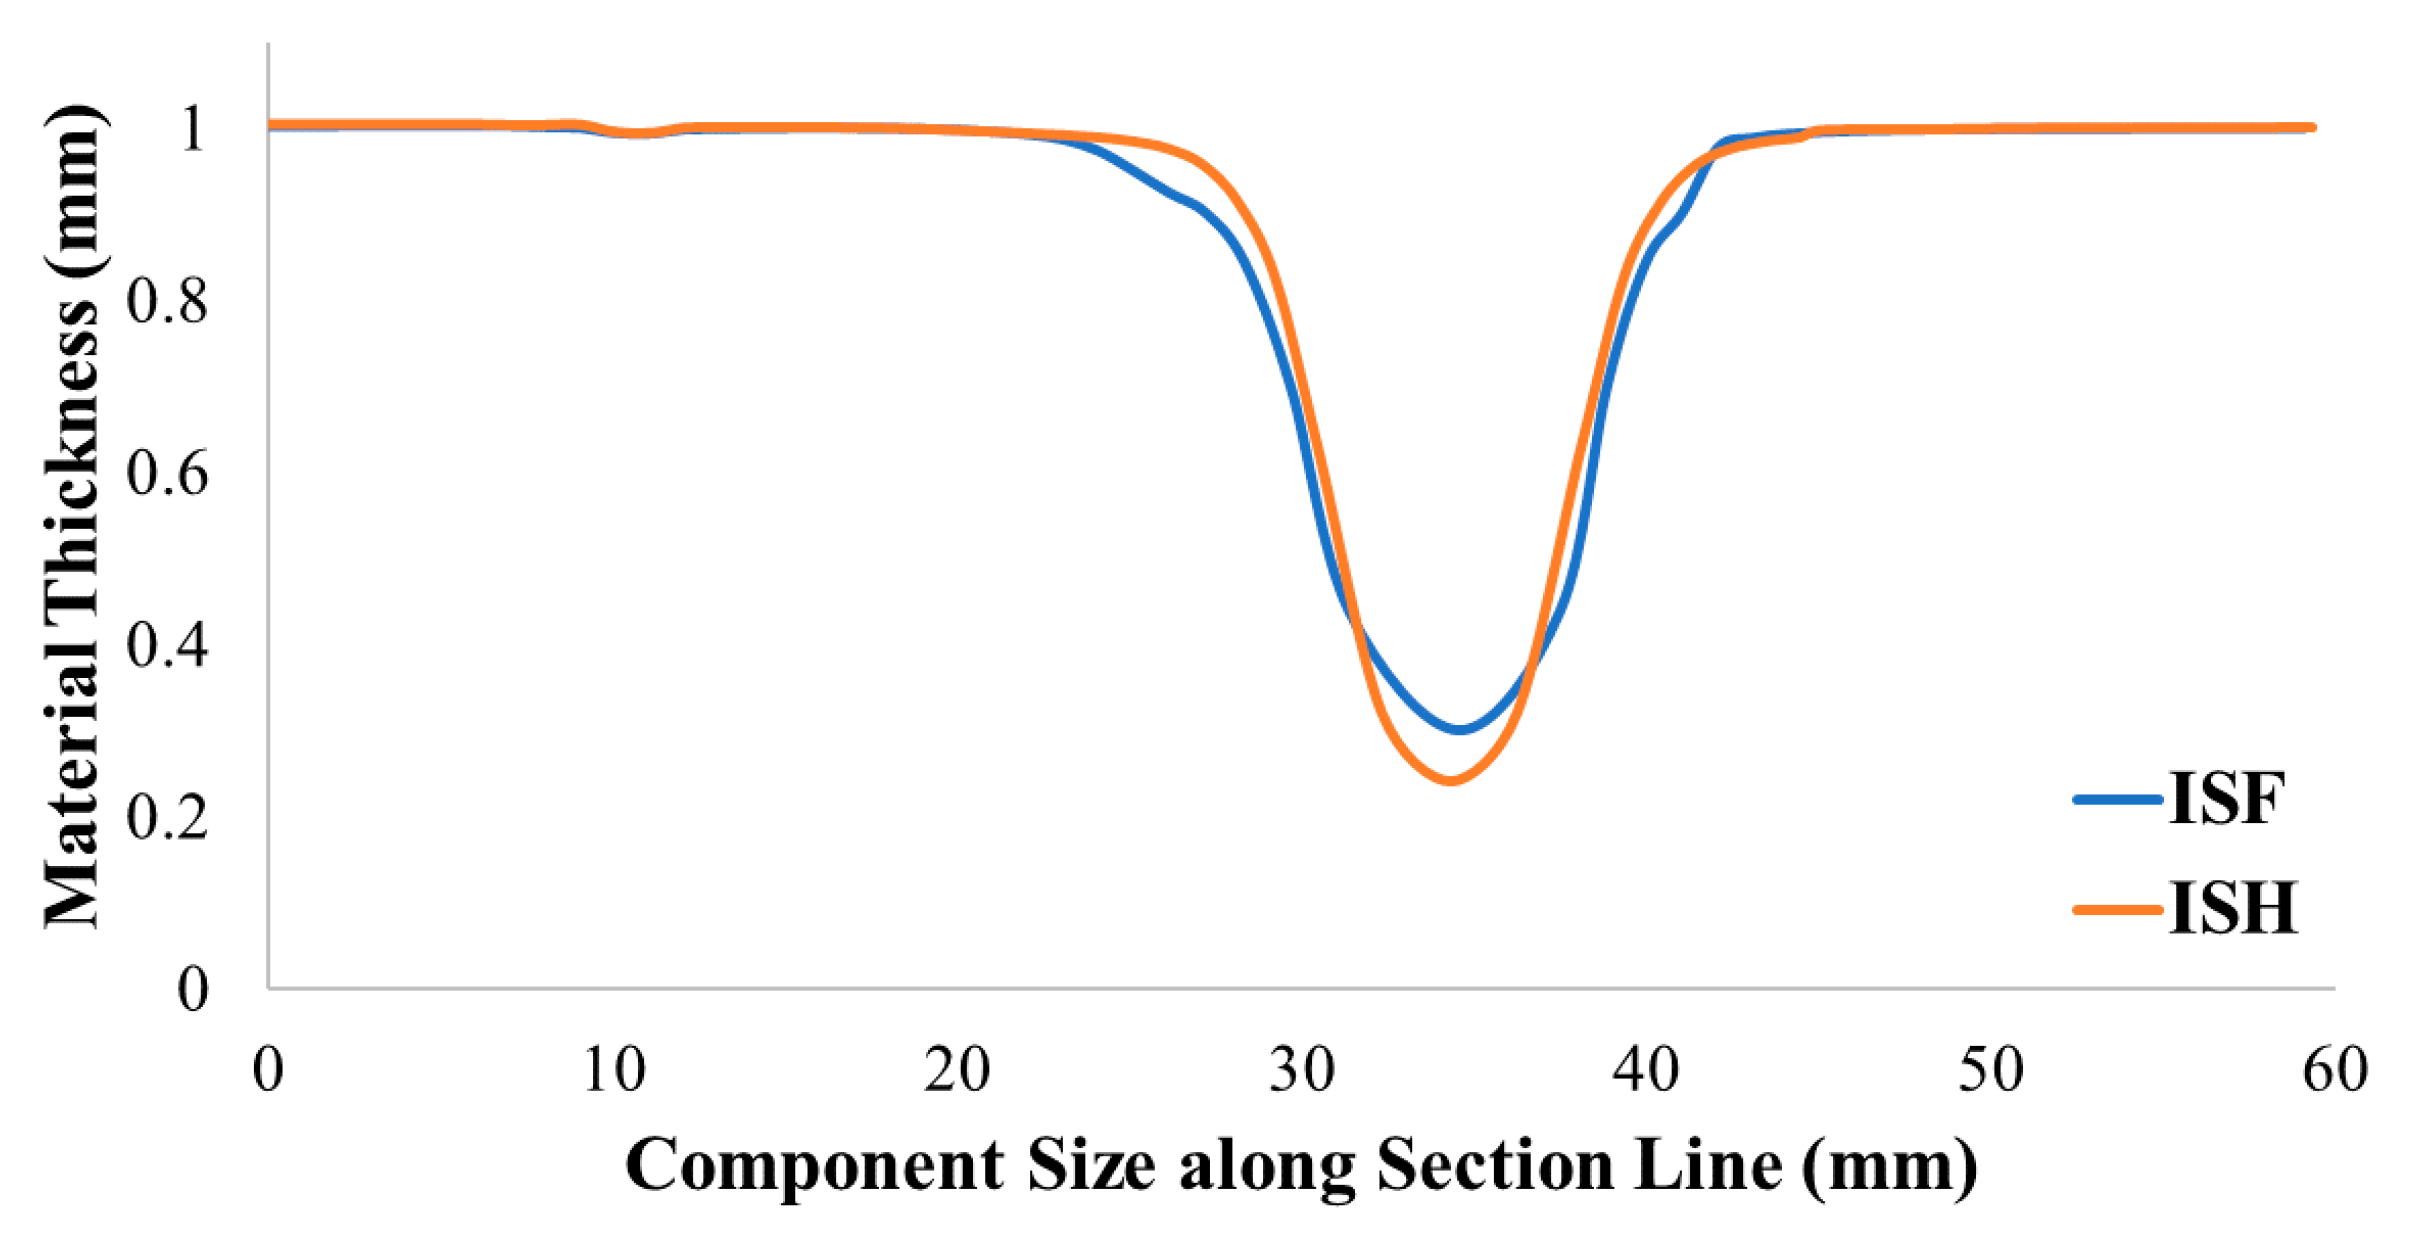
4.2.1. Geometrical Parameters

The experimentally formed components were scanned with the help of the ATOS Core 200 (GOM – a ZEISS company, Brunswick, Germany) scanner for the evaluation of geometrical accuracy, thickness distribution, and forming limits. The scanned components were evaluated on the GOM Inspect platform to study the geometric aspects of the component. Figure 12a,b shows the material thickness distribution in the component formed with ISF and ISH processes, respectively, whereas the scanned parts were sliced along the section lines to investigate the material thickness distribution. Figure 13 shows the material thickness distribution on any one side of the sliced section, where the thickness was varying at a similar position for both the formed components. Figure 13 shows that the slope of the thickness distribution is more in the case of components formed through the ISH process as compared to the ISF process. This indicates that the material availability during forming of the component was low in the ISF process as compared to the ISH process. Thus, a more uniform material distribution was observed in the component formed through the ISH process. The minimum value of sheet thickness was achieved in the case of components formed through the ISH process which leads to the delayed fracture of the material as compared to the components formed through the ISF process. It should be noted that the deformation in ISF is a combination of stretching, bending, and shearing [27]. The friction between the tool and the sheet is a major factor that causes the through-the-thickness-shear deformation in the ISF process [28], whereas in the ISH process, the friction between the tool and sheet is minimal because of the intermittent tool-sheet contact. Thus, it could be concluded that the hammering dominates the deformation in bending and stretching of the sheet. The numerical simulation was performed till the fracture depth for both the processes to compare the material thickness distribution for CWATC. Figure 14 shows the material thickness distribution obtained through the numerical simulation. The numerical simulation predicted the thickness distribution with the minimum thickness to be 0.2668 mm and 0.2672 mm for the ISF and ISH processes, respectively.
Table 3 shows the wall angle and depth achieved for the components formed through the ISF and ISH processes. The result obtained for the wall angle achieved was more favorable for the components formed through the ISF process than the ISH process, which indicates that the springback is more in the case of the ISH process than the ISF process. The forming depth obtained supports the formability remarks made in the case of VWATC. The effect of springback is the subject of further research for the ISH process.

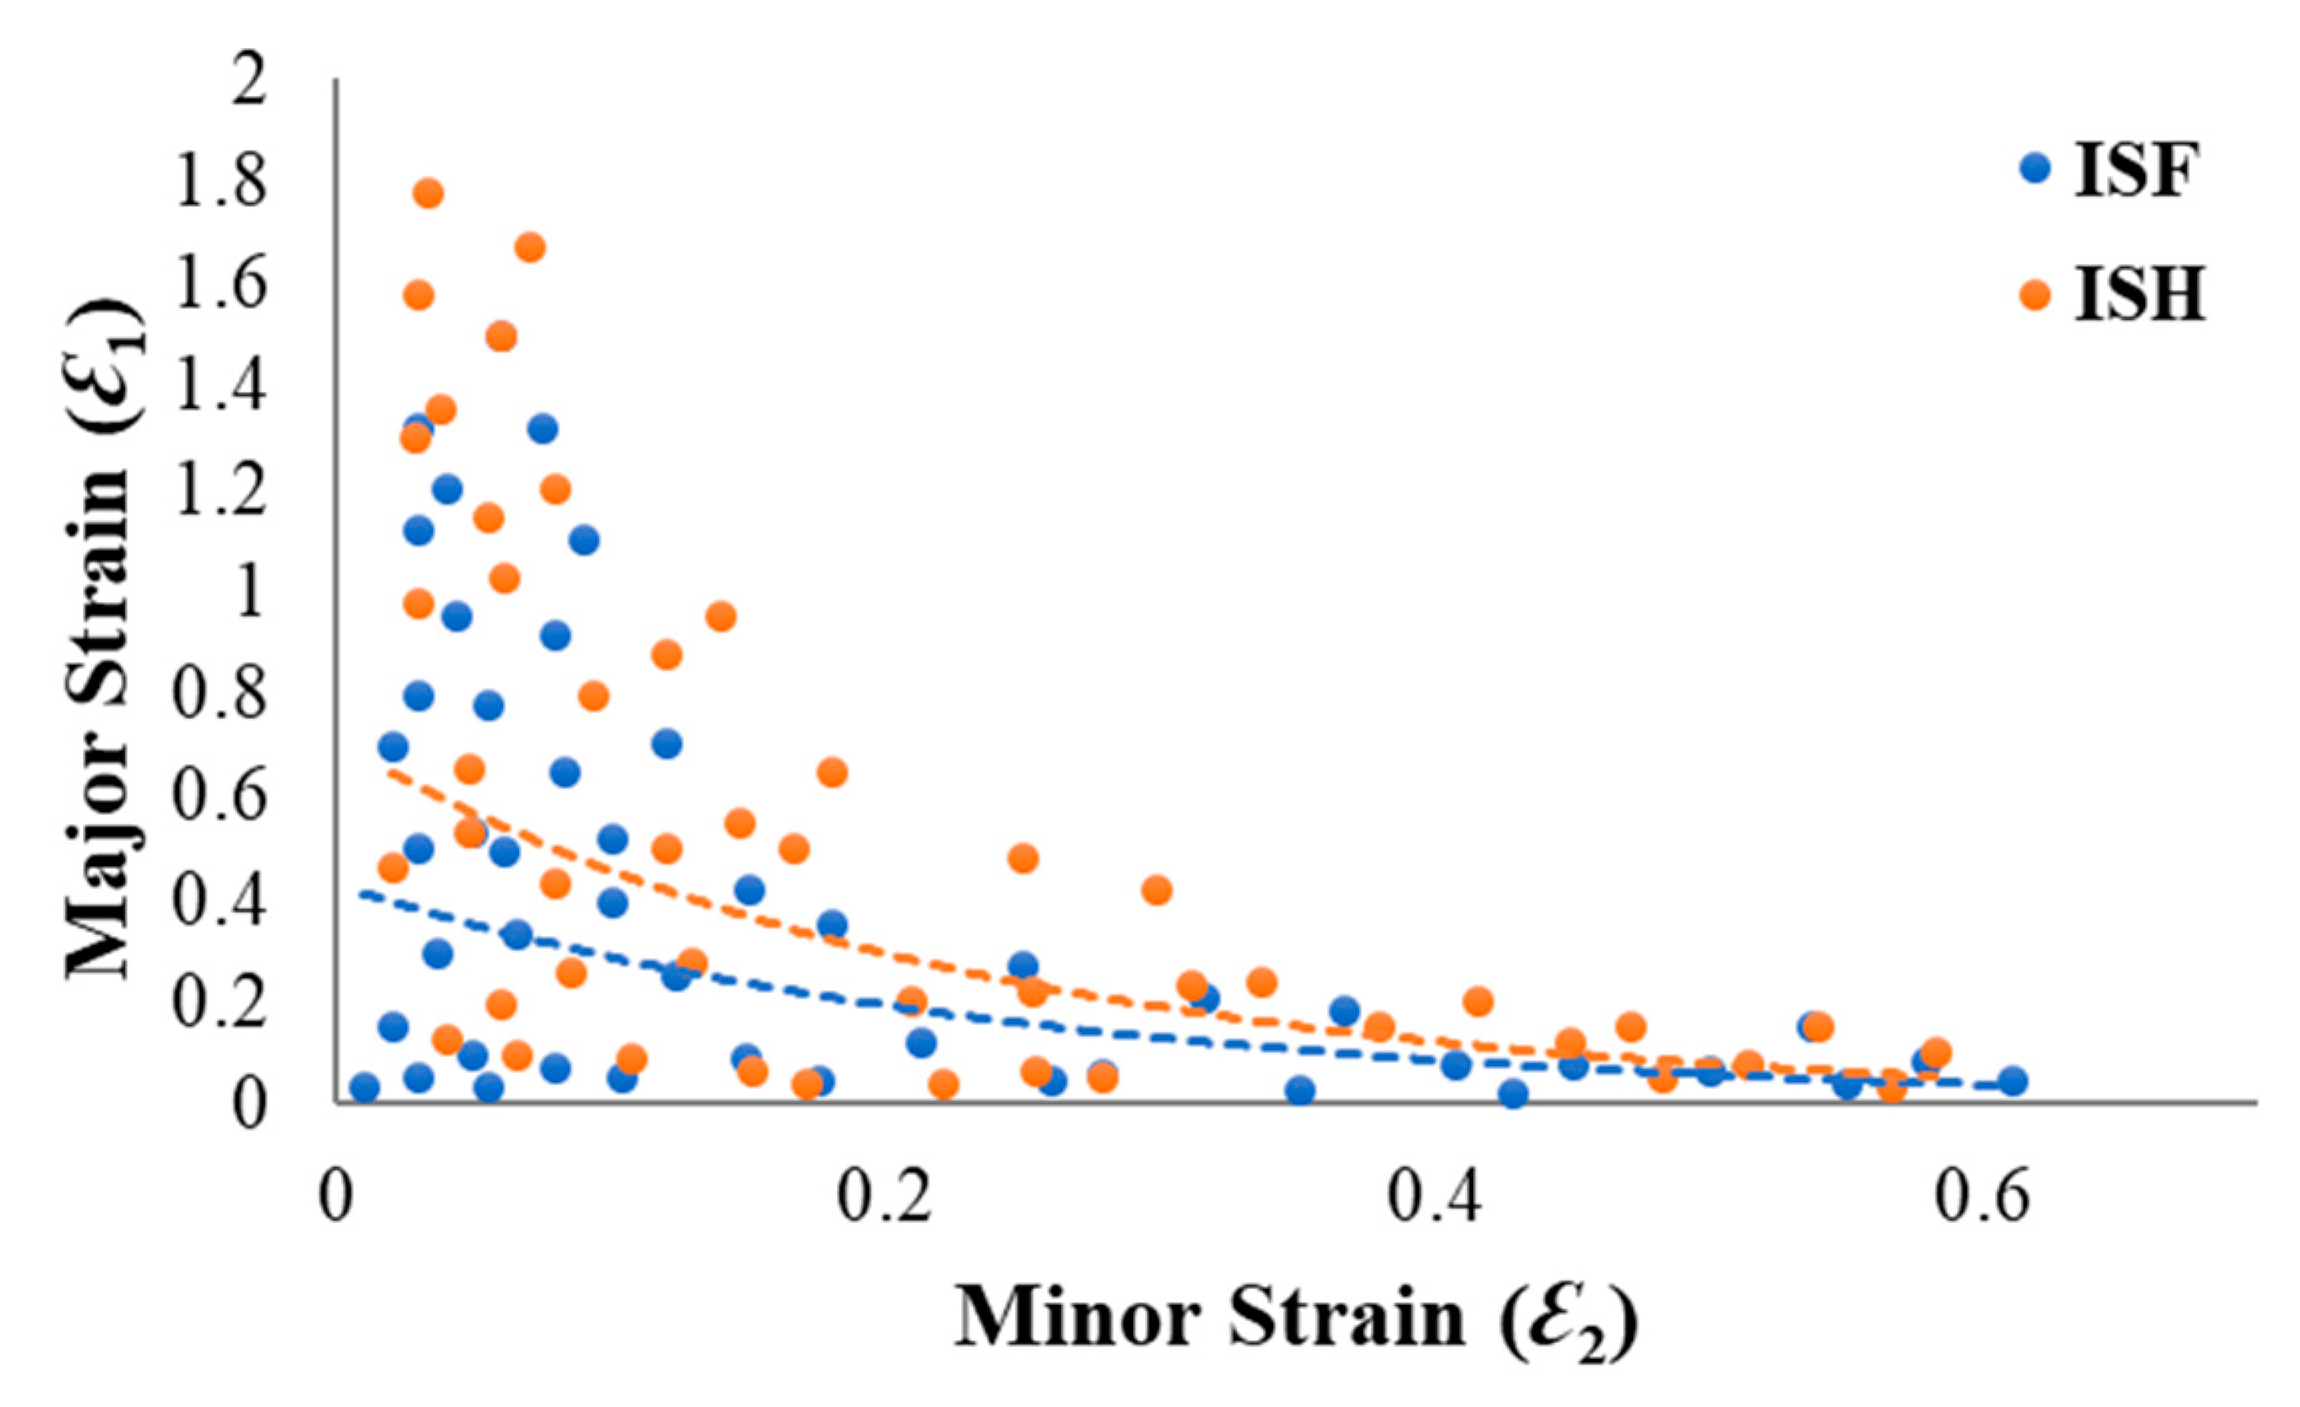
4.2.2. Forming Limit Diagram

To evaluate the formability of ISF and ISH processes the forming limits were also evaluated through surface strains developed in the formed components. To measure the strains in the experimentally formed components, circular grids having the size of 1 mm diameter and center-to-center distance of 2 mm, were electrochemically marked on the surface of the sheet blank before experimentation. The experimentally formed components were scanned using an ATOS Core 200 scanner. ARGUS (GOM—a ZEISS company, Brunswick, Germany) digital image correlation (DIC) software was used to measure the surface strains. The distorted circles after forming help to calculate the major (maximum) and minor (minimum) surface strains using the following equations:
ε m a j o r = l n ( d m a j o r d o )
ε m i n o r = l n ( d m i n o r   d o )
In the above equations, ε m a j o r and ε m i n o r are the major and minor strains, while d m a j o r and d m i n o r are the major and minor diameters of the ellipse formed. d o is the diameter of the circle etched on the sheet before forming. Figure 15 shows the comparison of the forming limit diagrams (FLD) for both processes. The higher values of the strain were observed in the components formed through the ISH process compared to the ISF process. The maximum value of the major strain observed through ISF and ISH processes are 1.54 and 1.78 respectively. This indicates that the higher formability associated with the ISH process compared to the ISF process. Further, as visible from FLD that the strain data are lying in the first quadrant of the FLD indicating the plane strain condition. This implies that the conical objects are subjected to the plane strain condition during forming. The same observations are also reported in the literature [29,30].

4.2.3. Surface Roughness

The surface roughness of the formed components was evaluated using the Mitutoyo Surftest SJ-500 (Mitutoyo, Neuss, Germany). The resolution of the device was 0.0001 μm with a measurement accuracy of ±10%. The repeatability of the equipment was <6%. The lateral surface of the formed components was identified as the testing surface. Each test specimen was measured three times to assure the correctness of the results. Figure 16 and Table 4 presents the average roughness values (Ra) and maximum average roughness (Ramax) values obtained for components formed through ISF and ISH processes. It was observed that the average roughness value for components formed through the ISF process was 0.2860 μm, while it was lower, i.e., 0.2401 μm, for the ISH process. The maximum average roughness value was also lower for the ISH process, i.e., 0.2903 μm, as compared to the ISF process, i.e., 0.4492 μm. The range of mean roughness depth (Rz) for components formed through the ISF process is 0.8676–1.3316 μm, whereas it is 1.0839–1.4974 μm for the ISH process. In the ISH process, the tool applies compressive force through the hammering motion, which leaves the punched marks over the formed sheet surface. Thus, the range of mean roughness depth (Rz) is higher in the ISH process as compared to the ISF process.
In the ISF process, the deformation behavior is a combination of bending, stretching, and shearing, where the tool stretches the sheet along the predefined forming path. The stretching behavior along the forming path in ISF leads to large scale waviness resulting in large surface strains. Further, it resulted in roughness over the formed area; whereas, in the case of the ISH process, the intermittent hammering restricts stretching over the sheet and generates compressive strain on the punched area. This curtails the stretch marks on the formed area of the sheet. Thus, it can be concluded that the surface quality produced by the ISH process was better than that with the ISF process.

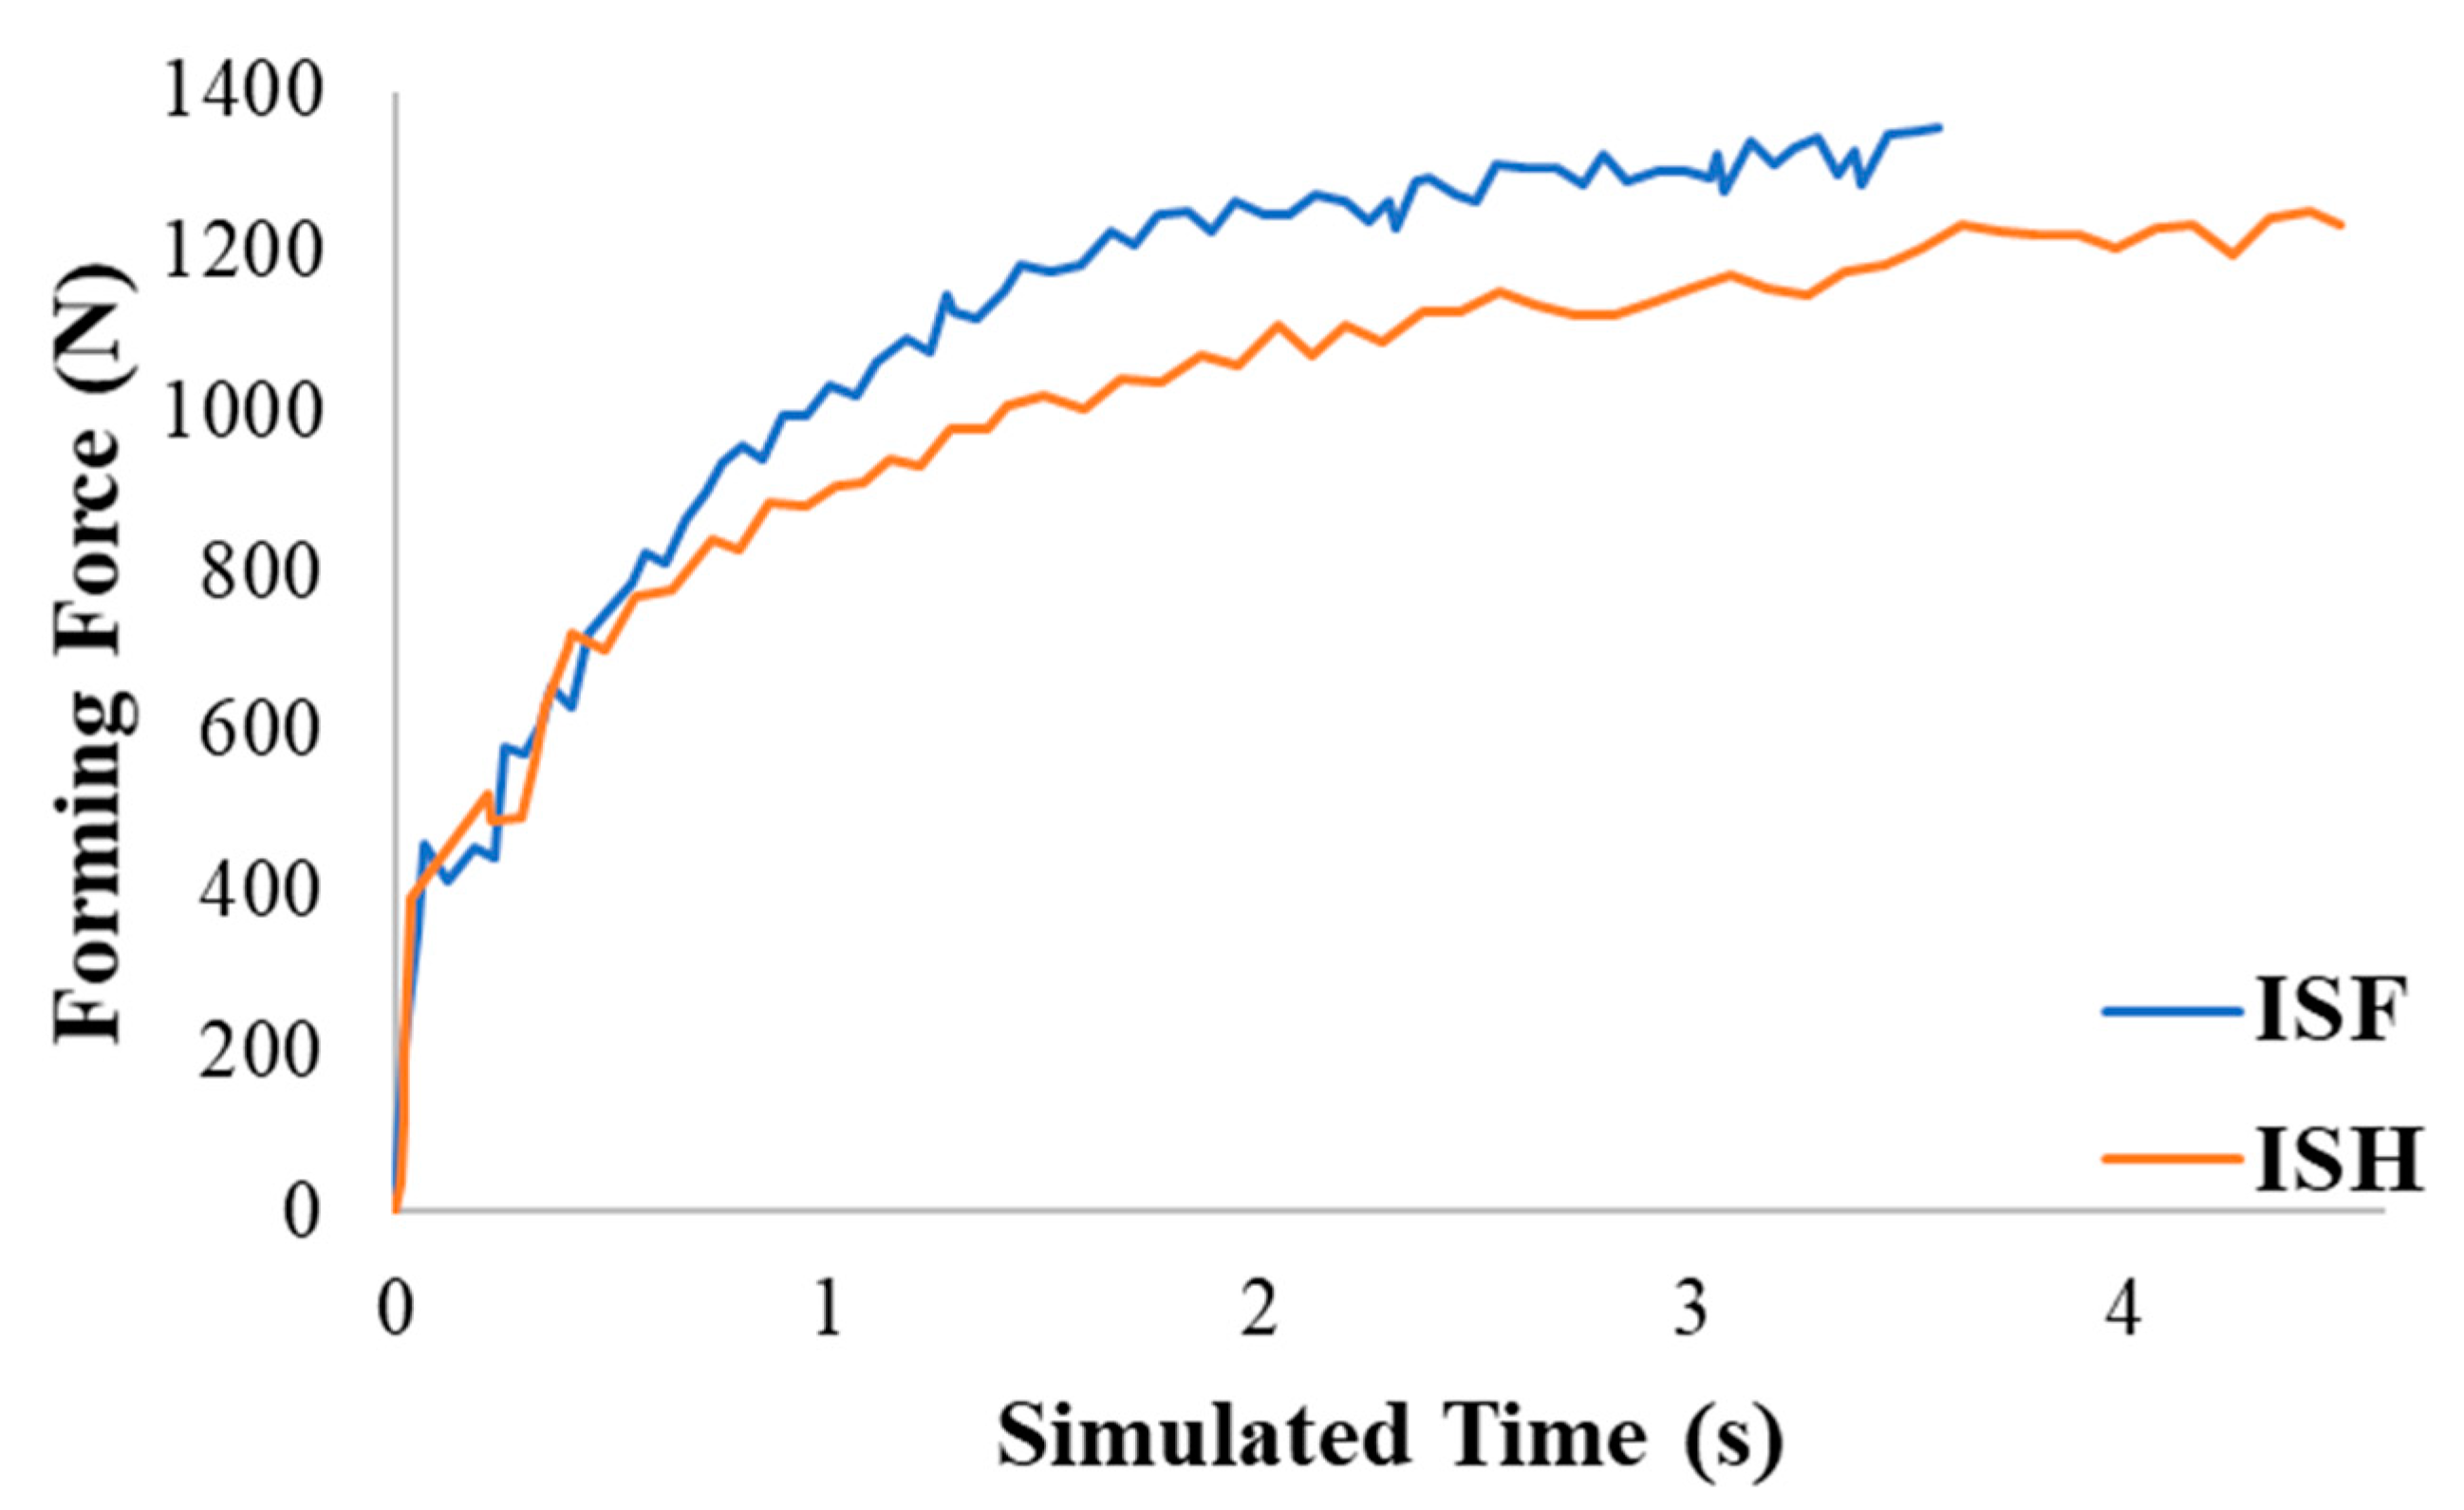
4.2.4. Forming Forces

The forming force is an important parameter in the forming processes. The forming forces were studied under the same process parameters during simulations. The maximum forming forces in the horizontal direction (X and Y direction) and vertical direction (Z direction) observed during the simulation of ISF and ISF processes are presented in Table 5. The forming forces along Z-direction are 1350 N and 1225 N in ISF and ISH processes respectively. As the forming force in the Z direction is most significant during the incremental forming processes, therefore, the forming force in the Z direction for both the process have been plotted. Figure 17 shows the comparative forming forces in the Z direction observed during the simulation of ISF and ISH processes. As visible from the figure the trend of forming forces for ISH and ISF processes was increasing throughout the process; although, in the case of the ISH process, the force gets reduced after a certain forming depth compared to the ISF process. In the ISF process, the tool was in continuous contact with the sheet throughout the process. It results in a larger forming force as the deformation of the sheet must overcome the constraint impact of the entire sheet on the deformation area. In the ISH process, initially, the tool aligns itself to the first hammering position where it deforms the workpiece with predefined amplitude. In the next step, the tool retracts to its original position and then moves to the next hammering position and similarly deforms the workpiece. The same phenomenon was explained in Section 2.1 and shown with the help of Figure 2. In addition, when the tool deforms the sheet in two successive hammering positions, it forms an overlapping region, as mentioned earlier and shown in Figure 3a. In the present work, the overlapping region in the case of the ISH process was 25%, i.e., 1/4th of the trailing deformed area overlapped with the leading area. Further, the hammering amplitude considered in the present work is very small, i.e., 0.05 mm, which does not allow the tool to leave contact with the sheet. Due to the overlapping region, lower hammering amplitude, and spiral toolpath used in the present investigation, the force value does not fluctuate greatly; as the tool and sheet have intermittent contact, which leads to shorter deformation time, and it further leads to a reduction in forming forces. Thus, it signifies that the integration of hammering with the ISF process leads to the reduction of the forming forces compared to the ISF process.

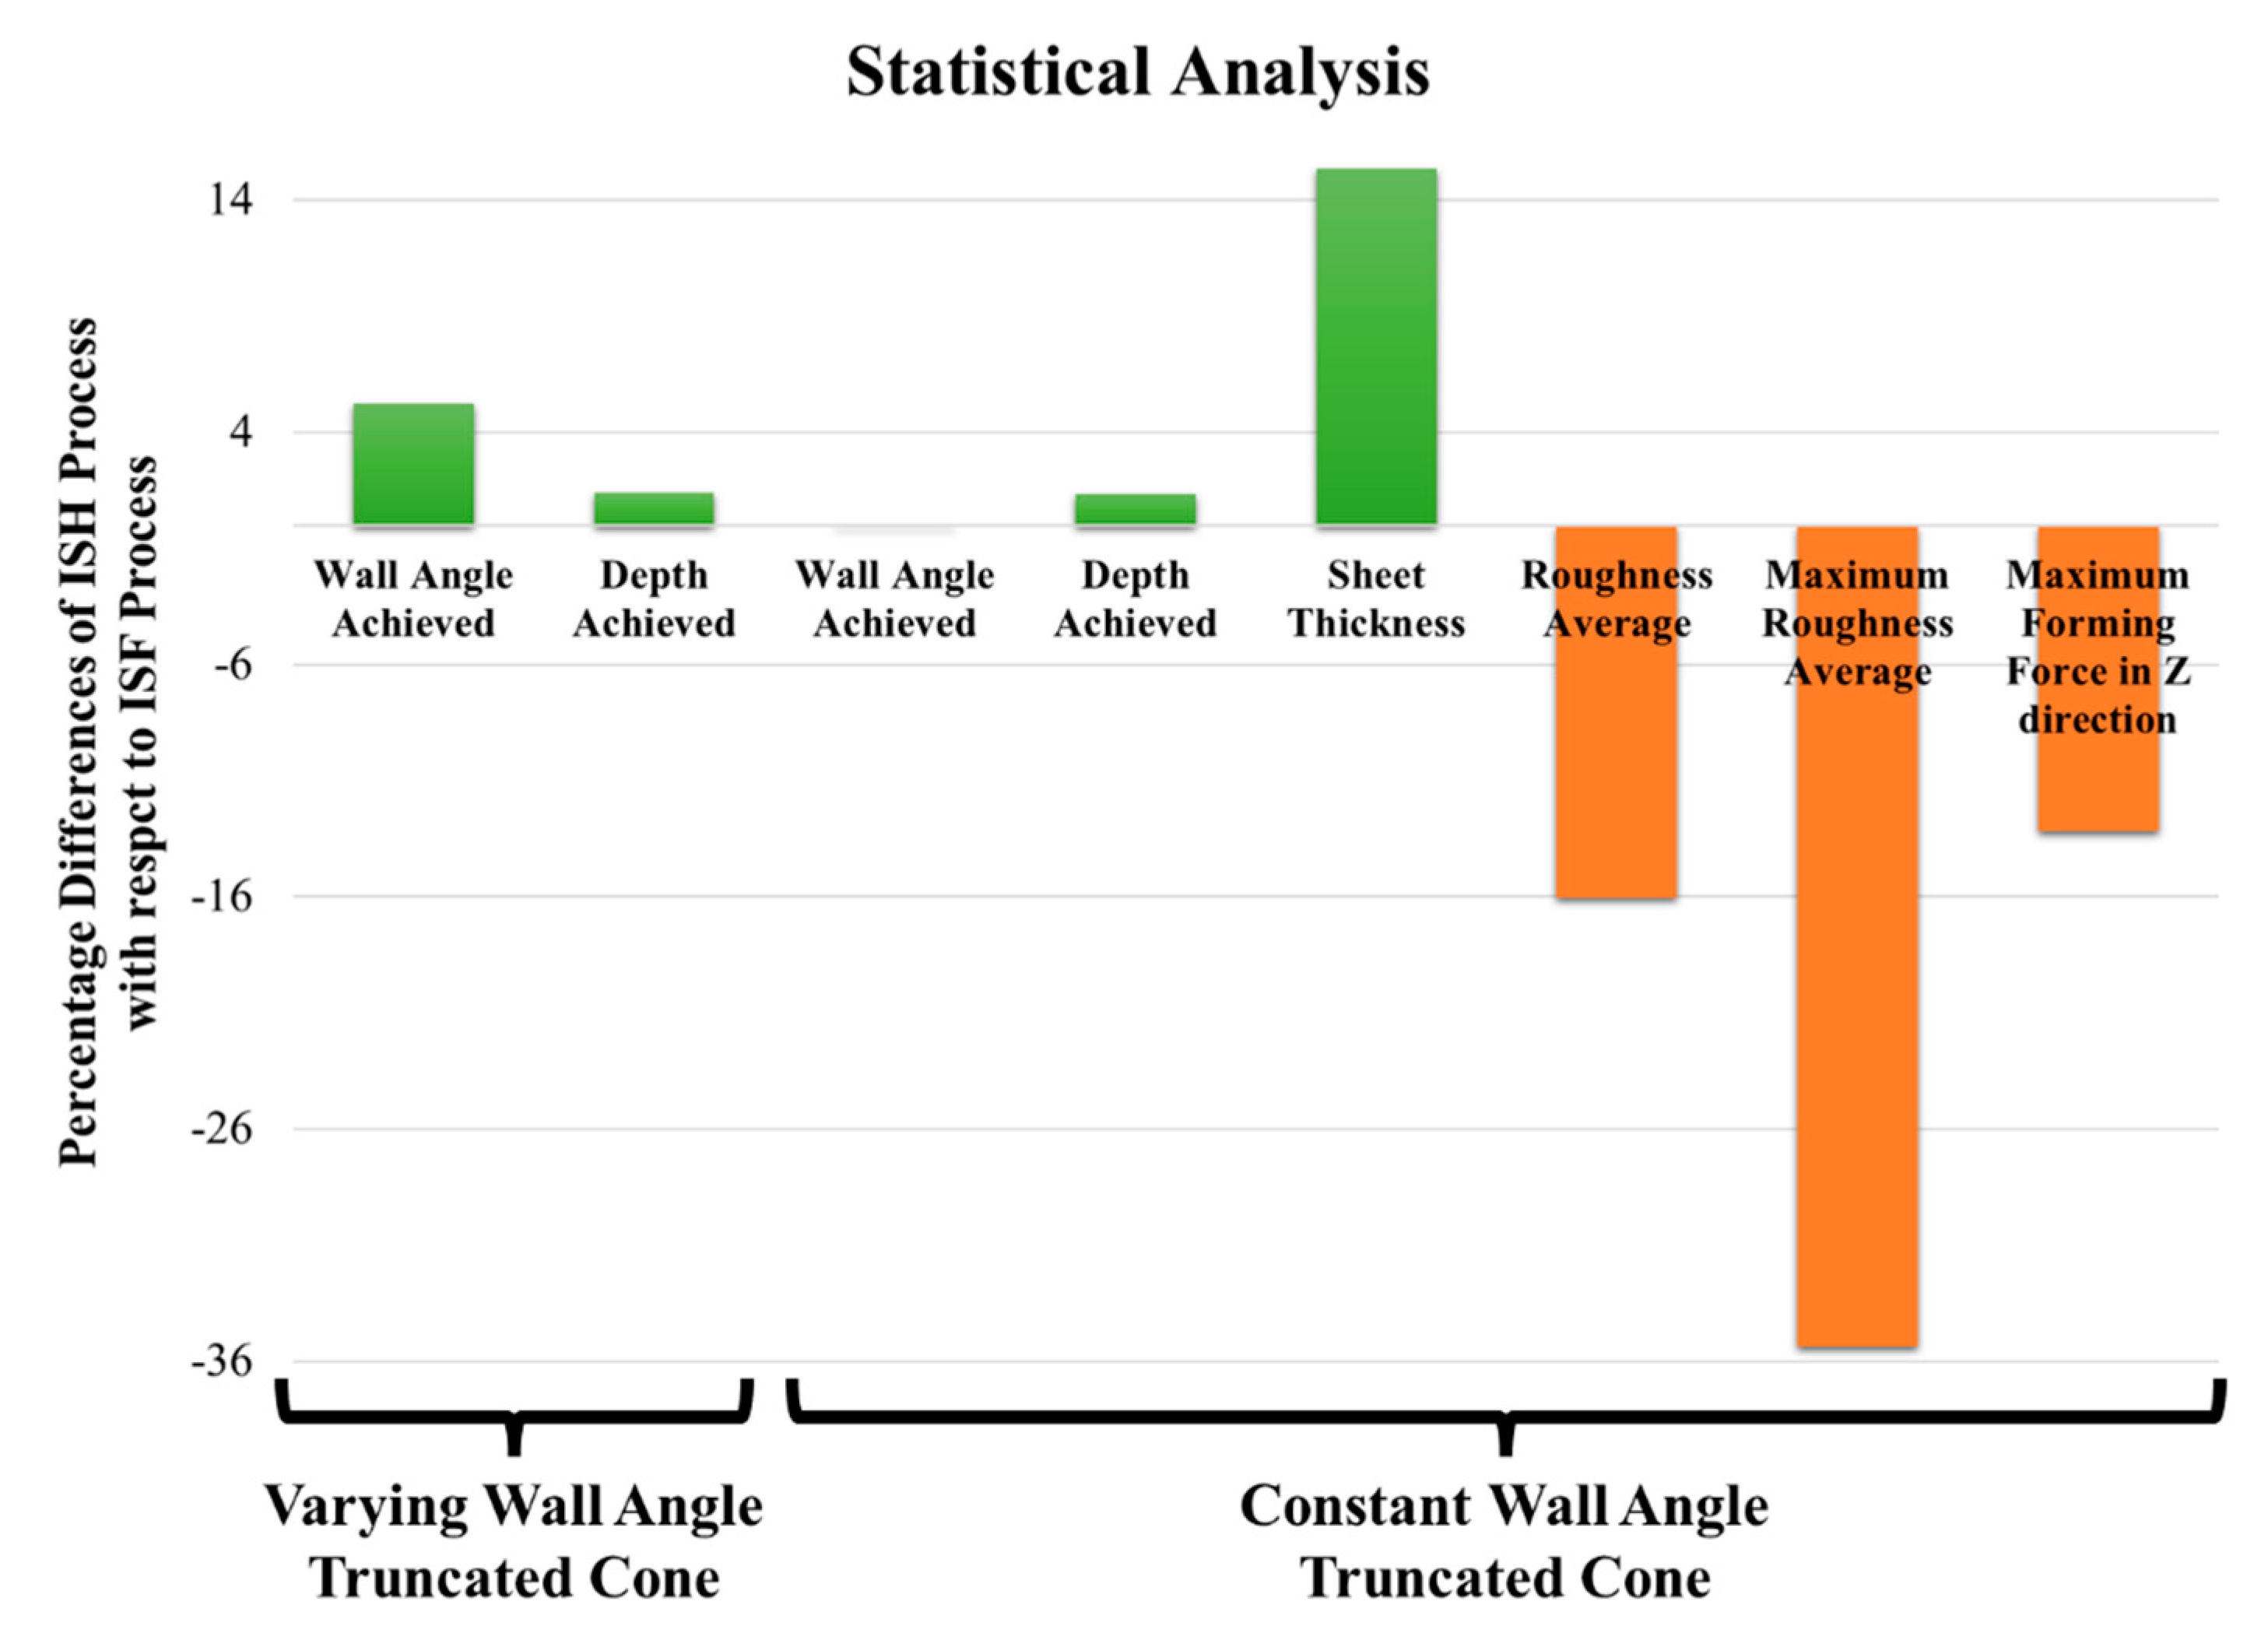
4.3. Statistical Analysis

An indicative statistical analysis is performed to understand the experimental results obtained for both the processes. Figure 18 shows the percentage change in the values obtained with the ISH process in comparison to that with the ISF process. The statistical analysis helps in understanding the comparison of the ISF and ISH processes.
The statistical analysis shows the differences mainly in terms of wall angle, forming depth, and surface quality of the components observed for the ISF and ISH processes. The forming depth and wall angle while forming the VWATC through the ISH process were found to be 1.5% and 5.2% higher, respectively, compared to the ISF process. These initial results are the foundations for the CWATC components for further study. When the CWATCs of the same wall angle were experimentally formed through both the processes, only 0.1% difference is observed in the ISH process compared to the ISF process, whereas the achieved depth is observed to be higher by 1.32% in the components formed through the ISH process. The major differences are observed in the parameters such as sheet thickness, surface quality and forming forces. The thickness distribution was compared for both the processes at a forming depth of 11.59 mm because this is the maximum depth achieved during the ISF process. It was found that the minimum sheet thickness was 15.37% higher for the ISH process compared to the ISF process. The surface quality was observed to be better through visual inspection of the components formed through the ISH process. The average roughness and maximum average roughness were found to be 16% and 35.37% higher, respectively, in the case of components formed through the ISF process compared to the ISH process. The maximum values of forming forces in the Z direction were found to be 13.16% lower for the ISH process. Further, it was observed that the ISH process would lead to an overall 10.99% improvement in the quality of the parts, where the majority of the improvement is contributed by surface finish and forming forces.

5. Conclusions

This work presents the integration of the hammering operation with the incremental sheet forming process. The differences in terms of formability are investigated with the help of a VWATC test geometry. Further, the comparative experimental results of the CWATC investigate the geometrical aspects of both processes. It is observed that the introduction of the hammering effect during the ISF process imparts significant improvements, such as increased fracture depth, better surface roughness, and uniform thickness distribution, in the formed components. The concluding remarks based on the statistical analysis can be summarized as:
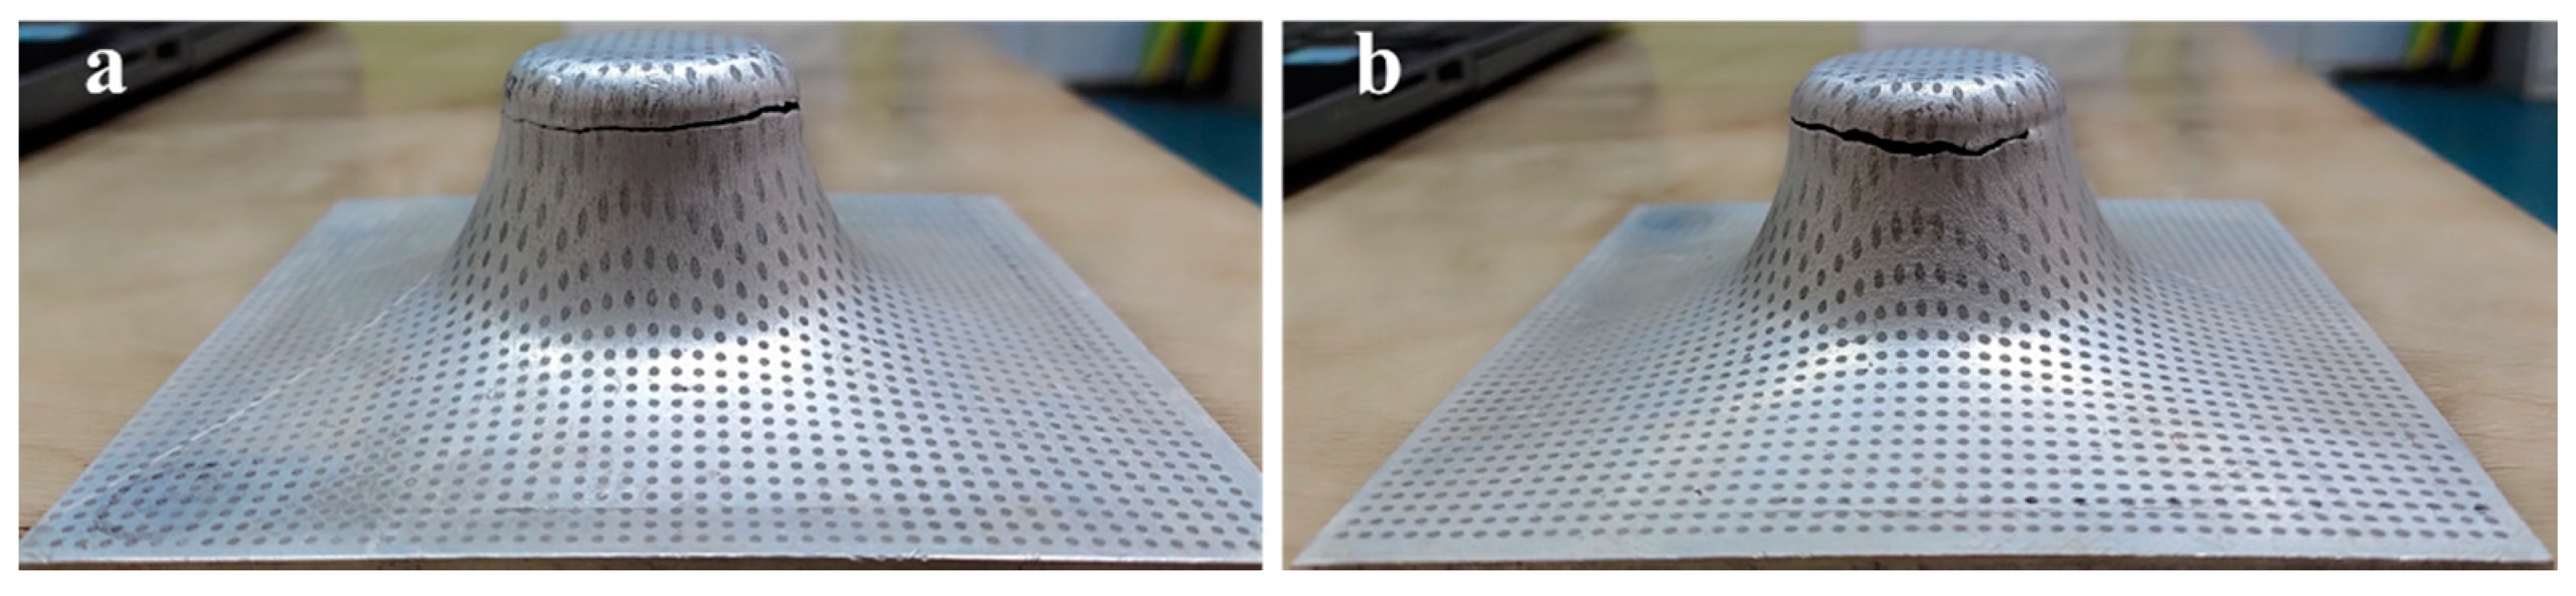
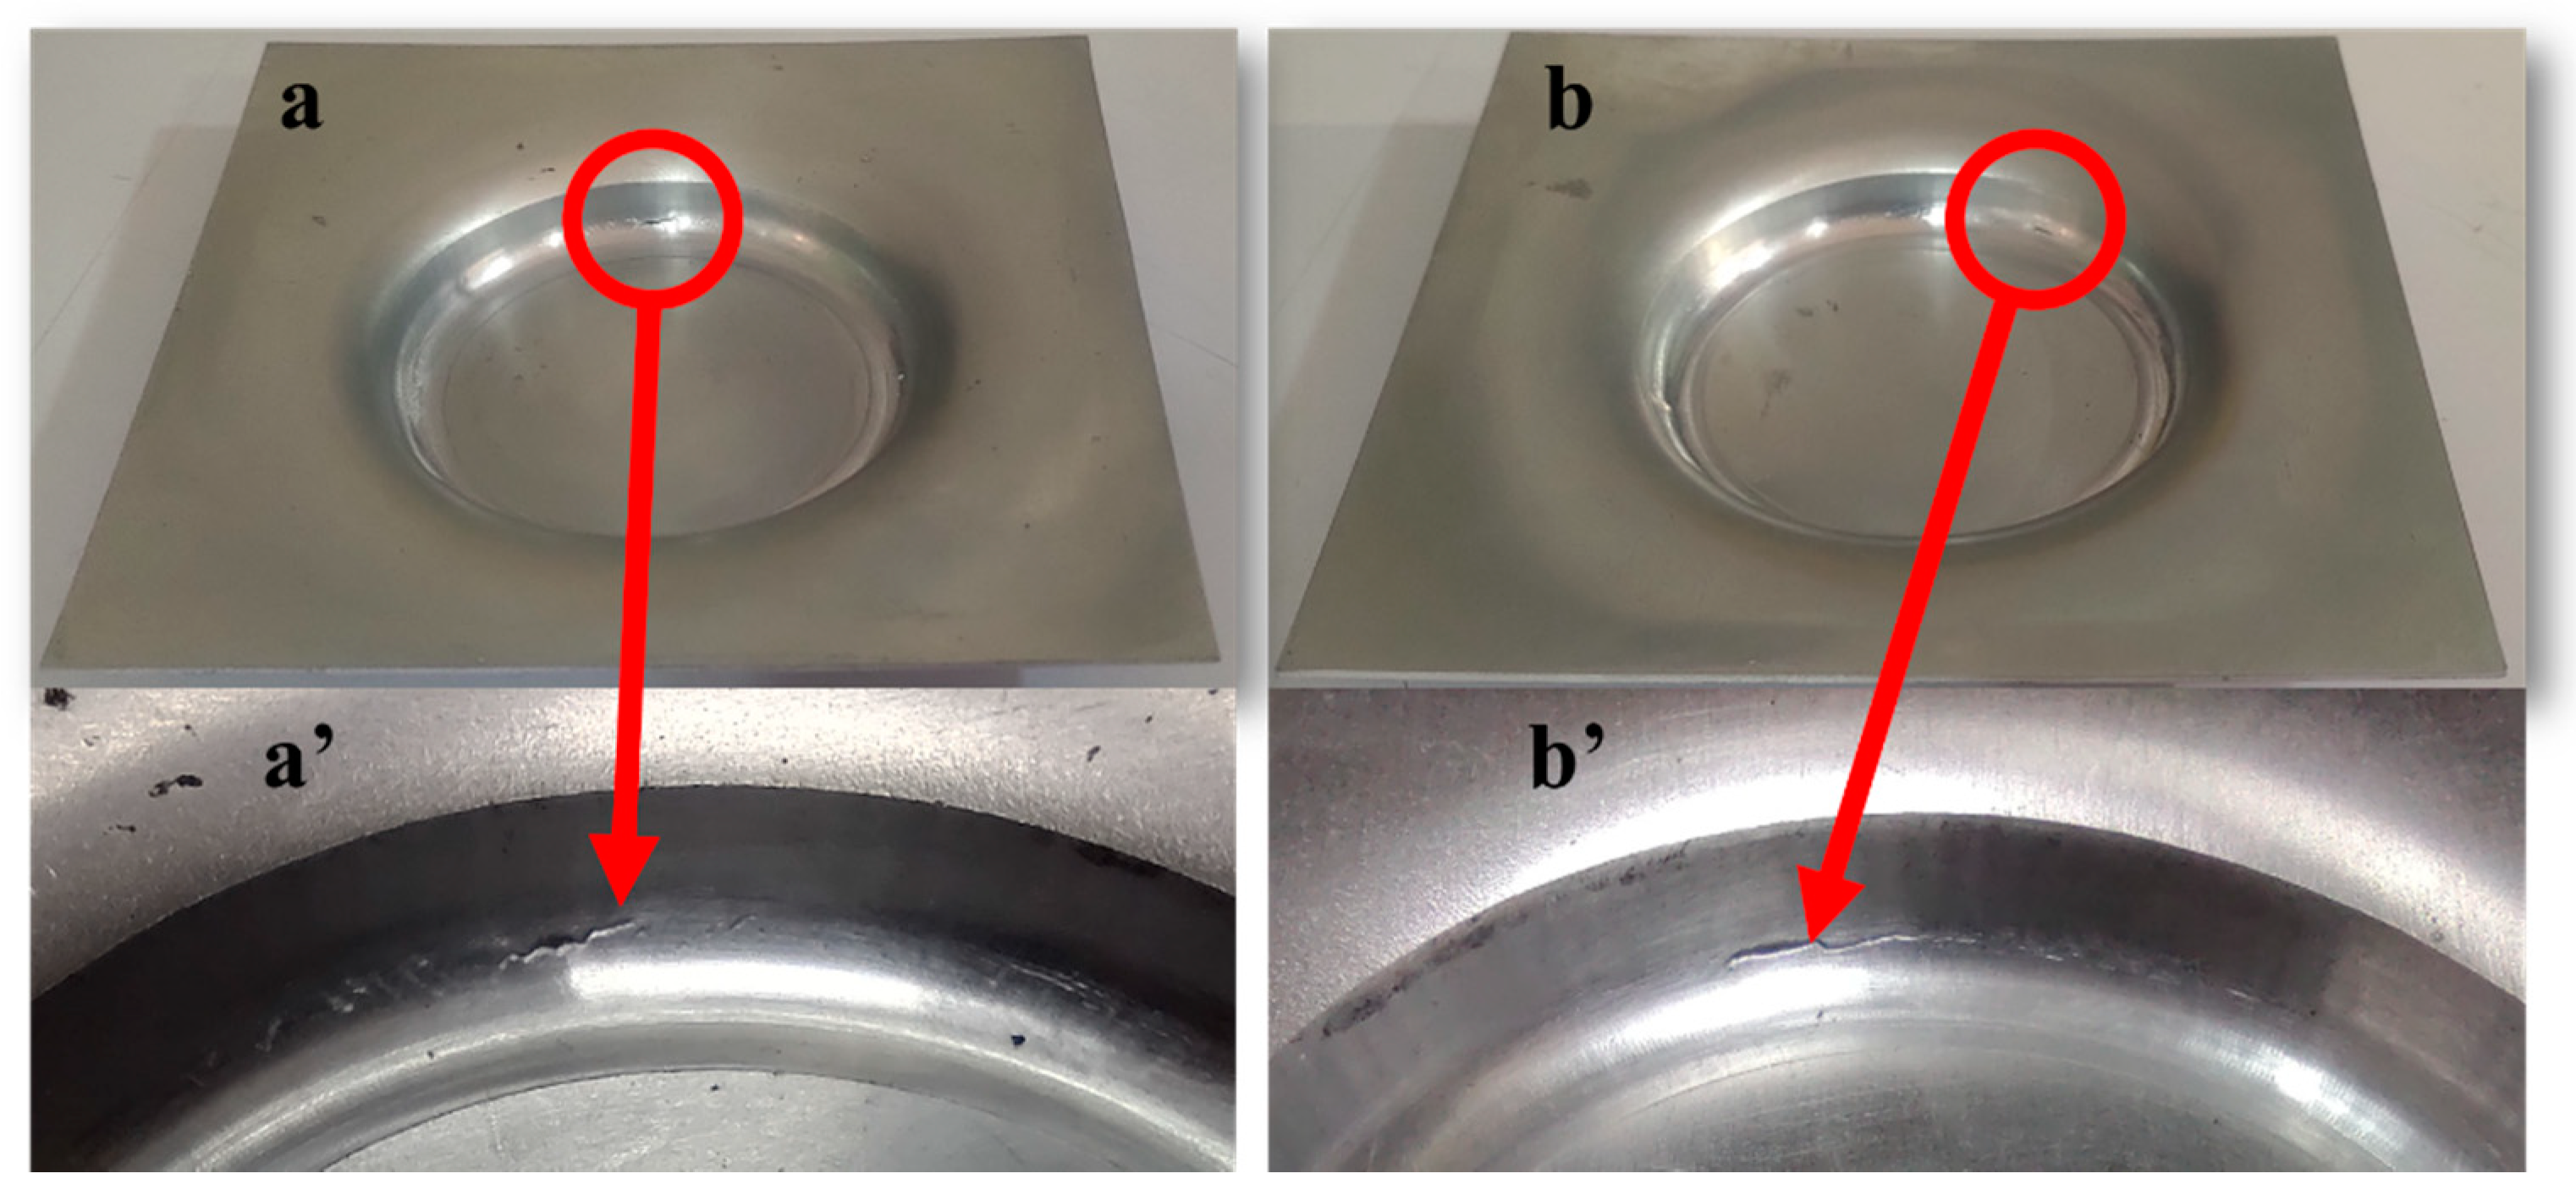
  • The ISH process is an attempt to combine the effect of shot peening with the incremental sheet forming process. It would possibly result in the prevention of microcrack propagation because of the application of compressive forces which can delay the fracture initiation. The obtained results showcase that the fracture depth and wall angle achieved are more in the case of the ISH process compared to that in the ISF process.
  • The comparison of both the processes through the strain values shows the higher formability associated with the ISH process compared to the ISF process. Further, it was also noticed that the conical objects are subjected to the plane strain condition.
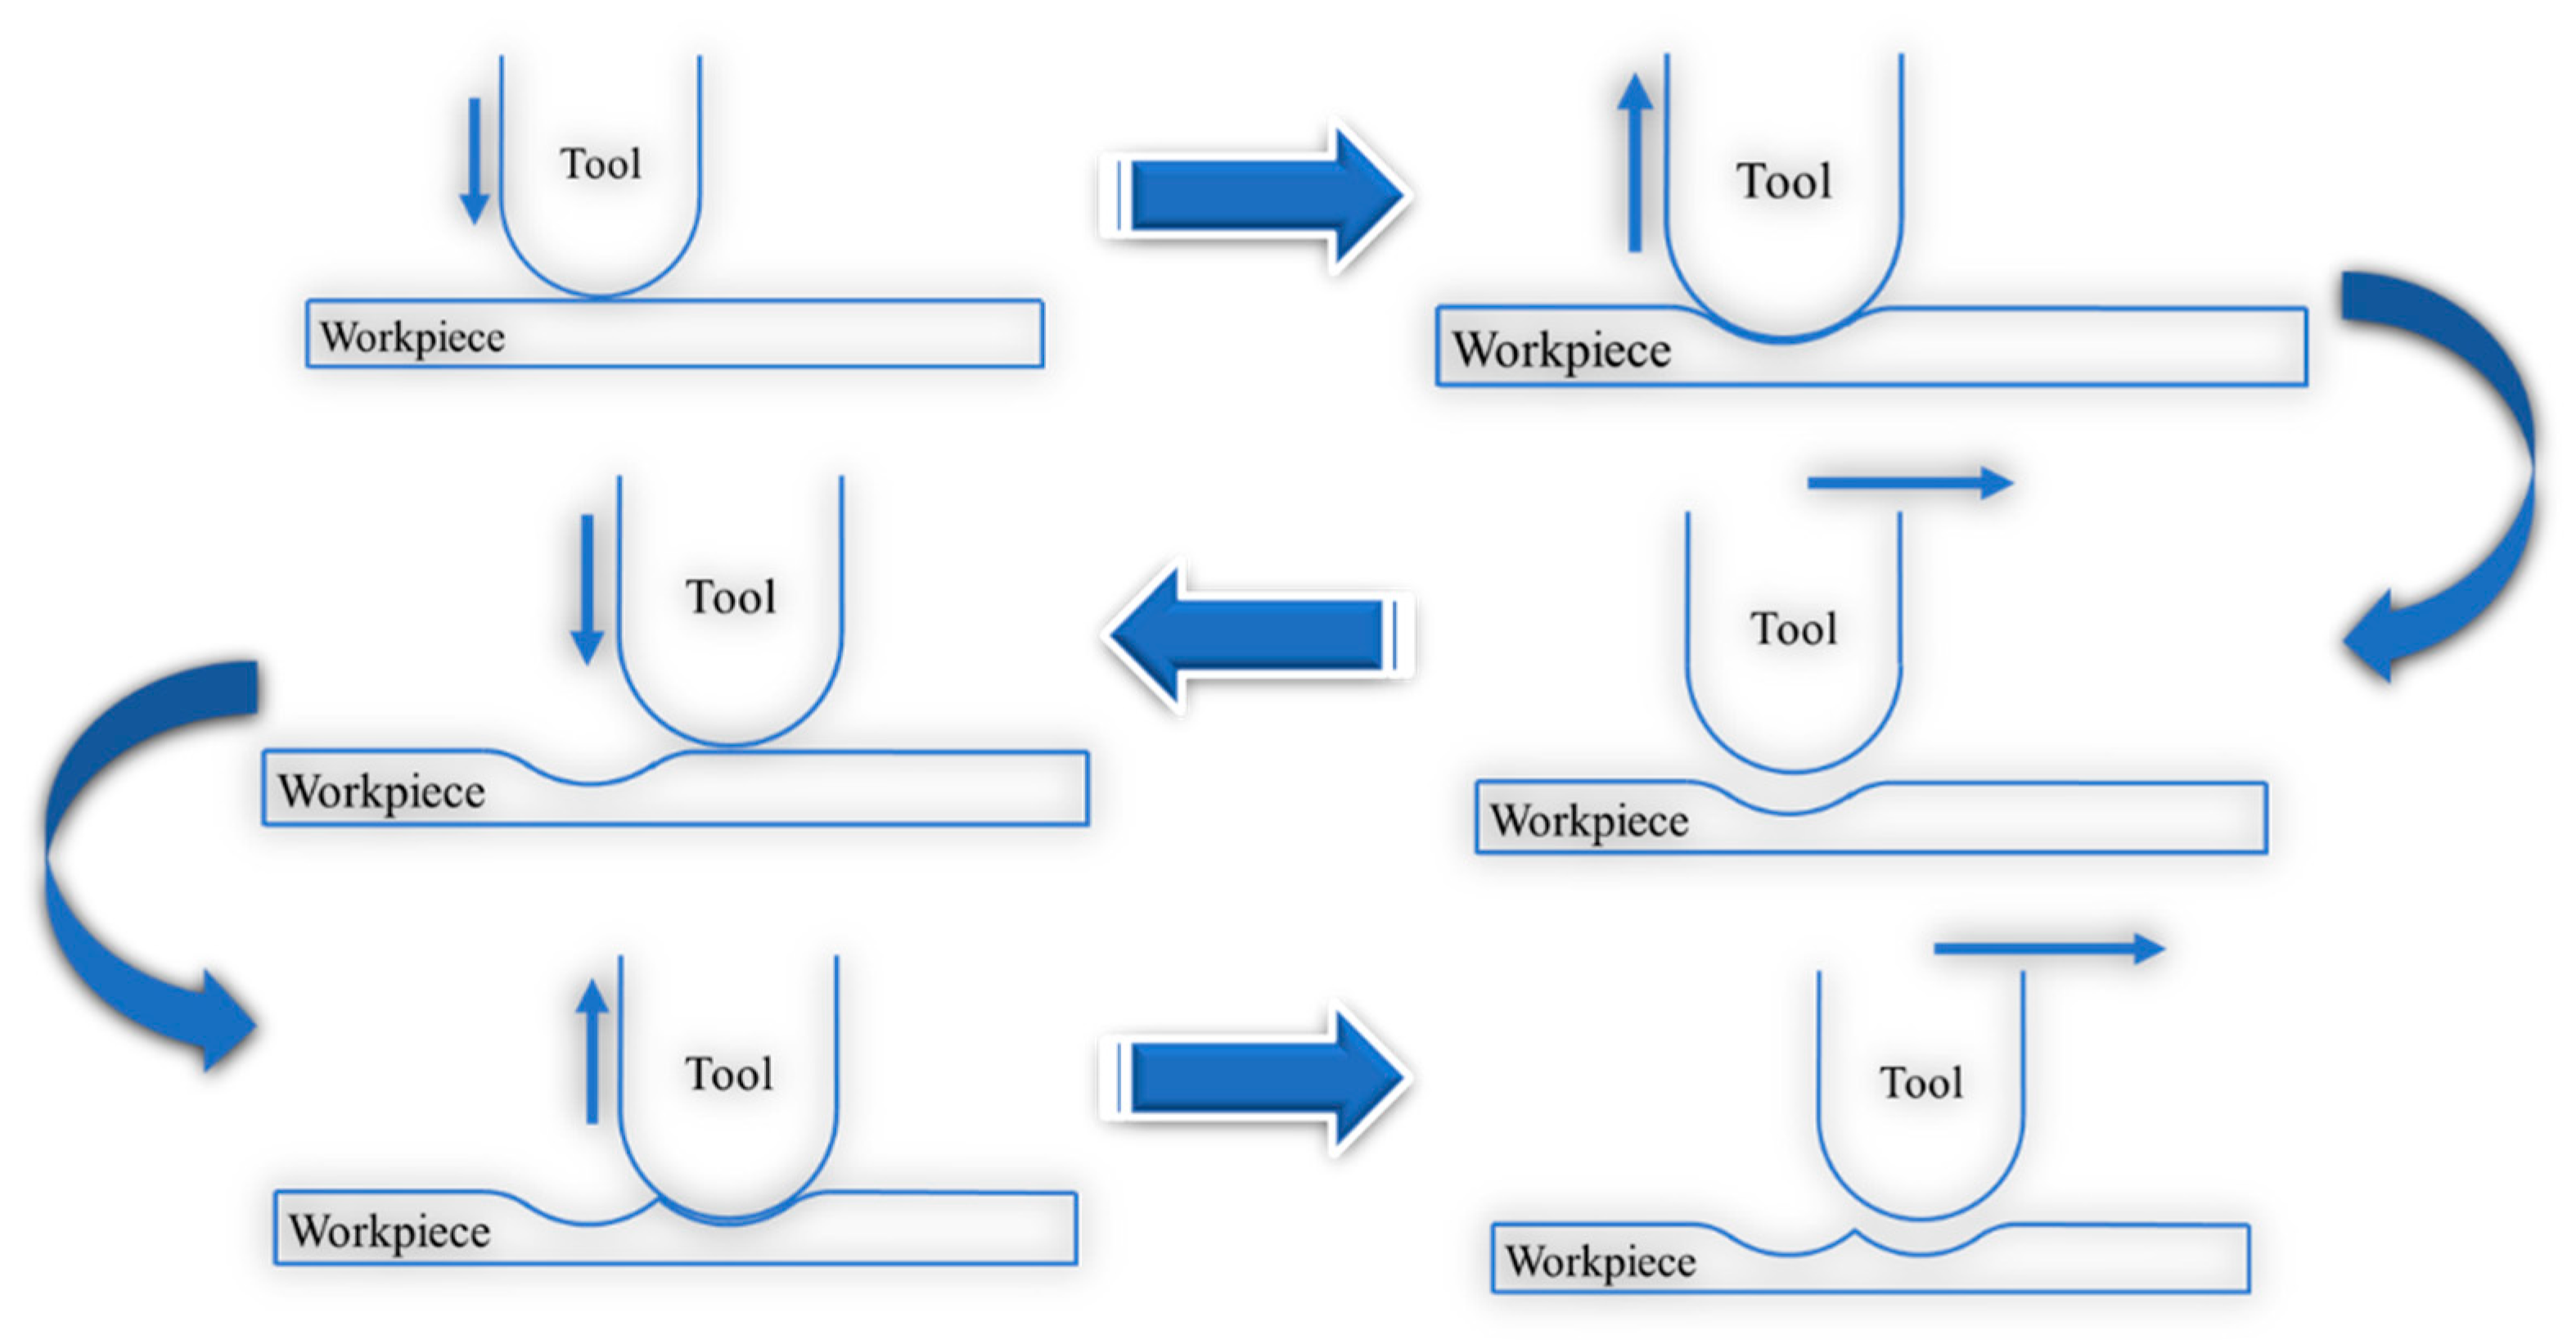
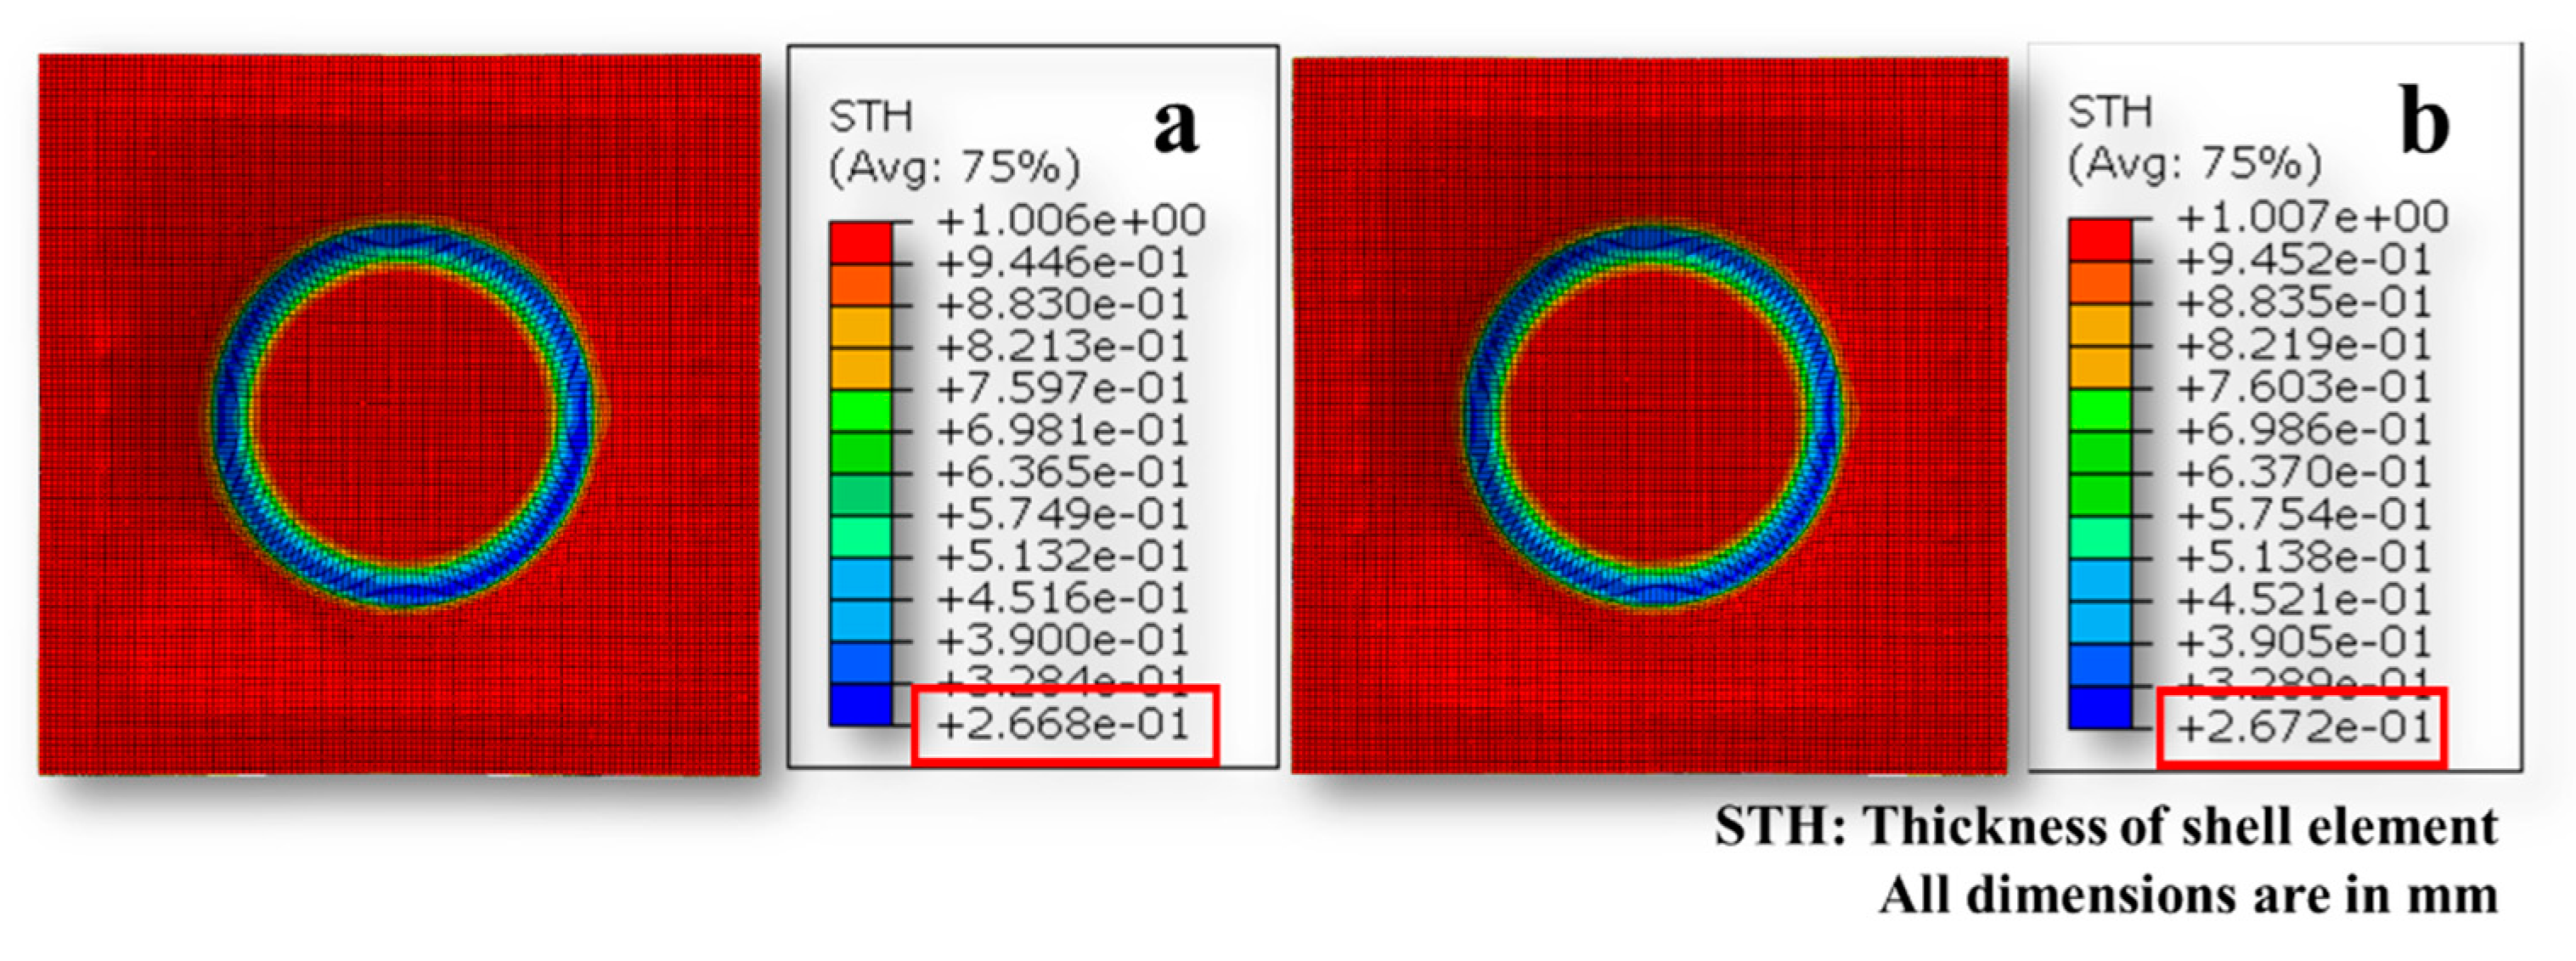
  • In ISF, the deformation mode of a material is a combination of bending, stretching, and shearing. Material deformation in ISH is dominated by direct bending and stretching which limits the reduction in workpiece thickness drastically. As a result of this, the ISH process exhibits a more uniform material thickness distribution as compared to the ISF process.
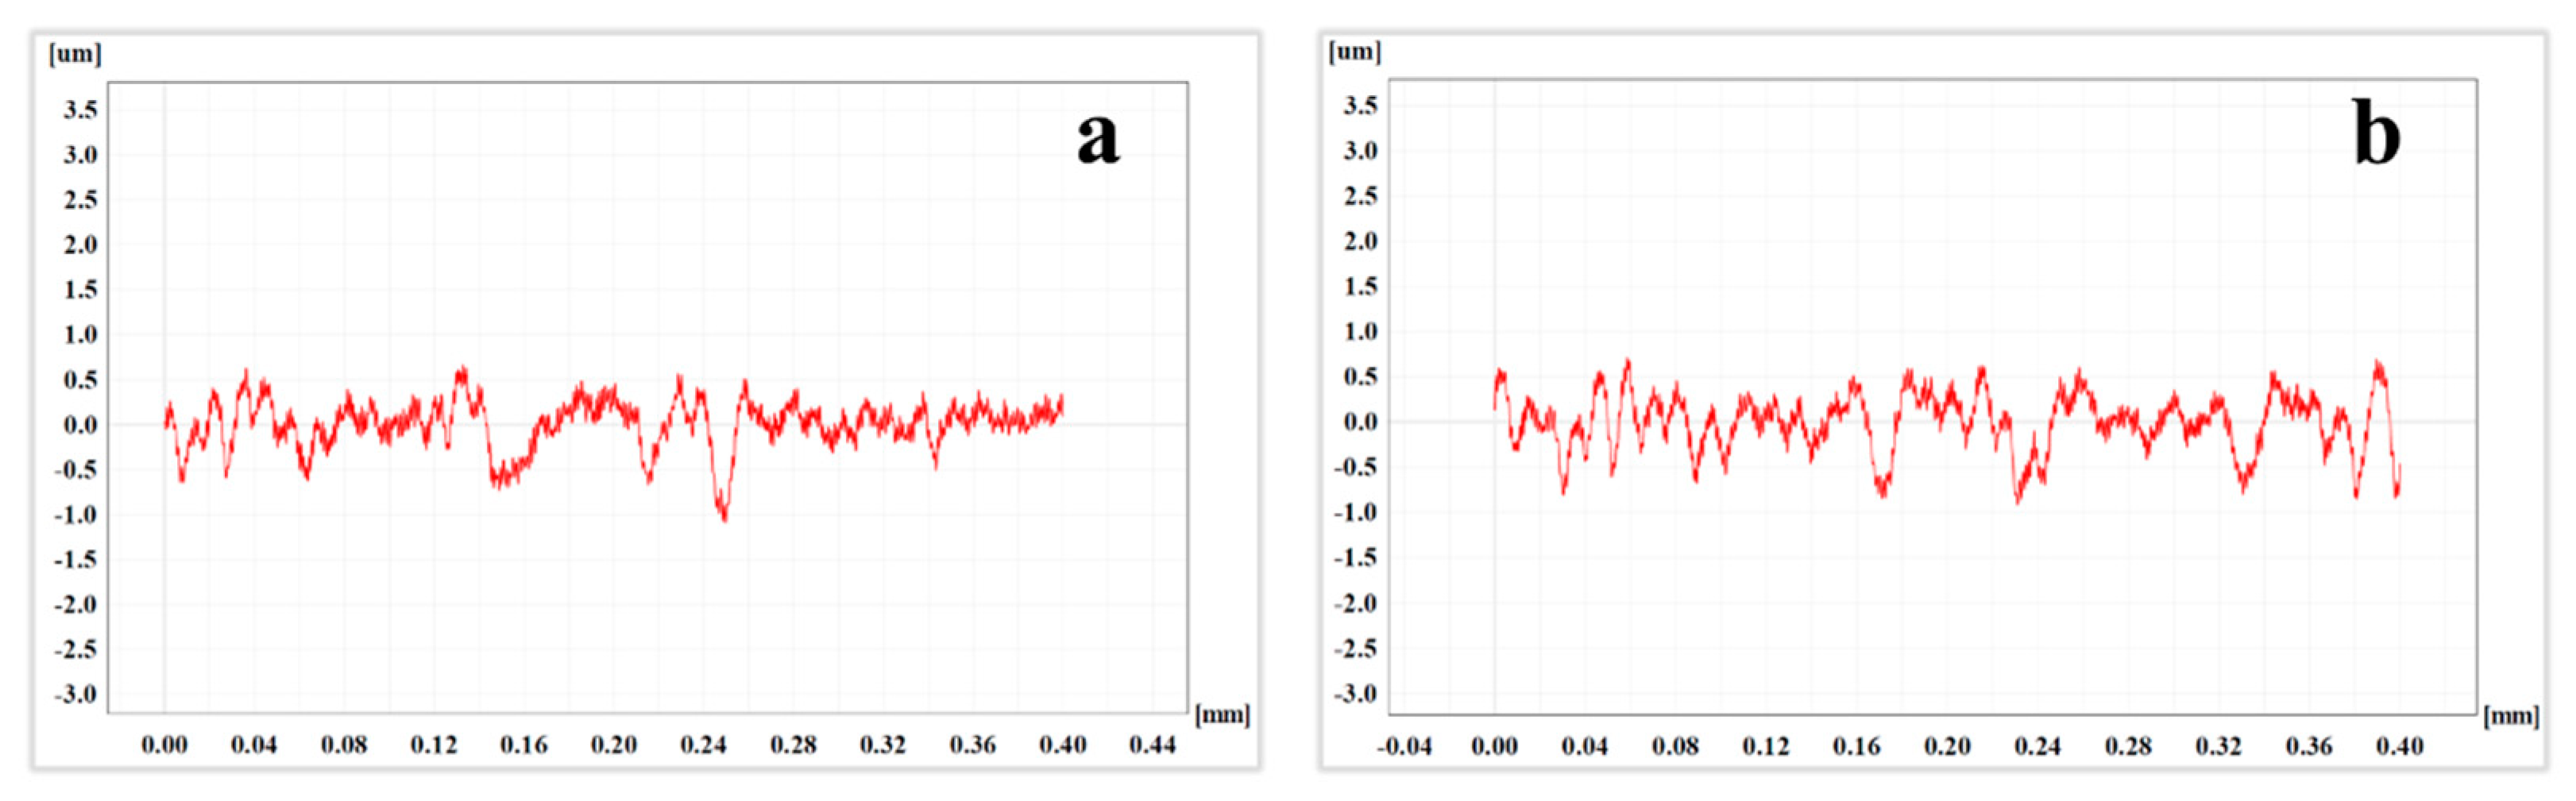
  • The component formed through the ISH process reports better surface quality than the components formed through the ISF process.
  • The reduced forming forces were attained while incorporating the hammering in the incremental sheet forming process.
The results in terms of wall angle achieved and fracture depth show the percentage differences of less than 5%, but the variation in sheet thickness and surface roughness shows promising results with more than 5% differences. The indicative statistical analysis shows that the ISH process would lead to an overall 10.99% improvement in the quality of the parts, primarily in the surface finish and forming forces. Further, the experiments are performed with one set of hammering parameters; thus, the proper choice and optimization of process parameters is a subject of further extensive investigation.

Author Contributions

H.Y.S., A.K.D. and P.K. conducted the numerical modelling, performed experiments, and wrote the first draft of the manuscript; P.T., A.P. and H.Y. provided the concept; D.P. and A.P. provided the testing data for numerical simulation; P.T. edited the draft of the manuscript and designed the overall simulation and the experimentation. All authors have read and agreed to the published version of the manuscript.

Funding

The study was carried out within the framework of the implementation of the Resolution of the Government of the Russian Federation of 9 April 2010, No. 220 (Contract No. 075-15-2019-869 from 12 May 2019) and by a grant of the Russian Science Foundation (project No. 20-69-46042 of 20 May 2020).

Institutional Review Board Statement

Not applicable.

Informed Consent Statement

Not applicable.

Data Availability Statement

The data sets used or analyzed during the current study are available with the corresponding author upon reasonable request.

Acknowledgments

This research is supported by the Department of Science and Technology (DST), India (Project No.: INT/RUS/RFBR/P-349) and Russian Foundation for Basic Research (RFBR), Russia. The authors wish to acknowledge the funding agency of both countries.

Conflicts of Interest

The authors declare no conflict of interest.

Appendix A

Figure A1. Flowchart of the generalized python code for CWATC.
Metals 11 01862 g0a1

References

  1. Amino, M.; Mizoguchi, M.; Terauchi, Y.; Maki, T. Current status of “Dieless” Amino’s incremental forming. Procedia Eng. 2014, 81, 54–62. [Google Scholar] [CrossRef] [Green Version]
  2. Park, J.J.; Kim, Y.H. Fundamental studies on the incremental sheet metal forming technique. J. Mater. Process. Technol. 2003, 140, 447–453. [Google Scholar] [CrossRef]
  3. Shrivastava, P.; Tandon, P. Microstructure and texture based analysis of forming behavior and deformation mechanism of AA1050 sheet during Single Point Incremental Forming. J. Mater. Process. Technol. 2019, 266, 292–310. [Google Scholar] [CrossRef]
  4. Jeswiet, J.; Micari, F.; Hirt, G.; Bramley, A.; Duflou, J.; Allwood, J. Asymmetric single point incremental forming of sheet metal. CIRP Ann. 2005, 54, 88–114. [Google Scholar] [CrossRef]
  5. Gupta, P.; Jeswiet, J. Manufacture of an aerospace component by single point incremental forming. Procedia Manuf. 2019, 29, 112–119. [Google Scholar] [CrossRef]
  6. Kang, D.M.; Manabe, K.I. Improvement on the Formability of Magnesium Alloy Sheet by Heating and Cooling Method. J. Korea Soc. Power Syst. Eng. 2005, 9, 66–70. [Google Scholar]
  7. Martins, P.A.F.; Bay, N.; Skjoedt, M.; Silva, M.B. Theory of single point incremental forming. CIRP Ann. 2008, 57, 247–252. [Google Scholar] [CrossRef]
  8. Meier, H.; Smukala, V.; Dewald, O.; Zhang, J. Two point incremental forming with two moving forming tools. Key Eng. Mater. 2007, 344, 599–605. [Google Scholar] [CrossRef]
  9. Silva, M.B.; Martins, P.A.F. Two-point incremental forming with partial die: Theory and experimentation. J. Mater. Eng. Perform. 2013, 22, 1018–1027. [Google Scholar] [CrossRef]
  10. Liu, Z. Heat-assisted incremental sheet forming: A state-of-the-art review. Int. J. Adv. Manuf. Technol. 2018, 98, 2987–3003. [Google Scholar] [CrossRef]
  11. Amini, S.; Gollo, A.H.; Paktinat, H. An investigation of conventional and ultrasonic-assisted incremental forming of annealed AA1050 sheet. Int. J. Adv. Manuf. Technol. 2017, 90, 1569–1578. [Google Scholar] [CrossRef]
  12. Vihtonen, L.; Puzik, A.; Katajarinne, T. Comparing two robot assisted incremental forming methods: Incremental forming by pressing and incremental hammering. Int. J. Mater. Form. 2008, 1, 1207–1210. [Google Scholar] [CrossRef]
  13. Luo, Y.; He, K.; Du, R. A new sheet metal forming system based on the incremental Punching, part 1: Modeling and simulation. Int. J. Adv. Manuf. Technol. 2010, 51, 481–491. [Google Scholar] [CrossRef]
  14. Luo, Y.; He, K.; Du, R. A new sheet metal forming system based on incremental punching, part 2: Machine building and experiment results. Int. J. Adv. Manuf. Technol. 2010, 51, 493–506. [Google Scholar] [CrossRef]
  15. Wang, J.; Wang, X.; Wang, Y.; Wang, M. Effects of Forming Parameters on Fatigue Life in Incremental Sheet Punching. Materials 2021, 14, 2308. [Google Scholar] [CrossRef] [PubMed]
  16. Asgari, A.; Sedighi, M.; Riahi, M. Investigation of dimensional accuracy in incremental sheet metal hammering process: A parametric study. Mech. Ind. 2015, 16, 308. [Google Scholar] [CrossRef]
  17. Bagheri, S.; Guagliano, M. Review of shot peening processes to obtain nanocrystalline surfaces in metal alloys. Surf. Eng. 2009, 25, 3–14. [Google Scholar] [CrossRef]
  18. Schubnell, J.; Eichheimer, C.; Ernould, C.; Maciolek, A.; Rebelo-Kornmeier, J.; Farajian, M. The influence of coverage for high frequency mechanical impact treatment of different steel grades. J. Mater. Process. Technol. 2020, 277, 116437. [Google Scholar] [CrossRef]
  19. Hussain, G.; Gao, L. A novel method to test the thinning limits of sheet metals in negative incremental forming. Int. J. Mach. Tools Manuf. 2007, 47, 419–435. [Google Scholar] [CrossRef]
  20. Akin, J.E. Finite Element Analysis Concepts: Via SolidWorks; World Scienfic: Hackensack, NJ, USA, 2010. [Google Scholar]
  21. Chung, W.; Kim, B.; Lee, S.; Ryu, H.; Joun, M. Finite element simulation of plate or sheet metal forming processes using tetrahedral MINI-elements. J. Mech. Sci. Technol. 2014, 28, 237–243. [Google Scholar] [CrossRef]
  22. Li, K.P.; Carden, W.P.; Wagoner, R.H. Simulation of springback. Int. J. Mech. Sci. 2002, 44, 103–122. [Google Scholar] [CrossRef]
  23. Han, F.; Mo, J.H. Numerical simulation and experimental investigation of incremental sheet forming process. J. Cent. South Univ. Technol. 2008, 15, 581–587. [Google Scholar] [CrossRef]
  24. Zaydes, S.A. New surface plastic deformation techniques in the manufacture of machine parts. Vestnik Magnitogorskogo Gosudarstvennogo Tekhnicheskogo Universiteta im. G.I. Nosova [Vestnik of Nosov Magnitogorsk State Technical University] 2018, 16, 129–139. [Google Scholar] [CrossRef]
  25. Belevskiy, L.S.; Belevskaya, I.V.; Efimova, Y.Y. Study of the process of surface cold working with punching blocks. Vestnik Magnitogorskogo Gosudarstvennogo Tekhnicheskogo Universiteta im. G.I. Nosova [Vestnik of Nosov Magnitogorsk State Technical University] 2016, 14, 63–68. [Google Scholar] [CrossRef]
  26. Mohammadi, A.; Vanhove, H.; Van Bael, A.; Duflou, J.R. Towards accuracy improvement in single point incremental forming of shallow parts formed under laser assisted conditions. Int. J. Mater. Form. 2016, 9, 339–351. [Google Scholar] [CrossRef]
  27. Jackson, K.; Allwood, J. The mechanics of incremental sheet forming. J. Mater. Process. Technol. 2009, 209, 1158–1174. [Google Scholar] [CrossRef] [Green Version]
  28. Lu, B.; Fang, Y.; Xu, D.K.; Chen, J.; Ou, H.; Moser, N.H.; Cao, J. Mechanism investigation of friction-related effects in single point incremental forming using a developed oblique roller-ball tool. Int. J. Mach. Tools Manuf. 2014, 85, 14–29. [Google Scholar] [CrossRef]
  29. Kumar, P.; Tandon, P. Process capabilities of commercially pure titanium grade 2 formed through warm incremental sheet forming. Proc. Inst. Mech. Eng. Part B J. Eng. Manuf. 2021, in press. [Google Scholar] [CrossRef]
  30. Said, L.B.; Mars, J.; Wali, M.; Dammak, F. Numerical prediction of the ductile damage in single point incremental forming process. Int. J. Mech. Sci. 2017, 131, 546–558. [Google Scholar] [CrossRef]
Figure 1. Schematics of incremental sheet hammering (ISH) process.
Metals 11 01862 g001
Figure 2. Schematics of deformation of the workpiece based on linear tool movement with hammering.
Metals 11 01862 g002
Figure 3. (a) Schematics of the overlapping region caused due to linear tool movement with hammering (b) Schematics of the basic hammering mechanics.
Metals 11 01862 g003
Figure 4. Varying wall angle truncated cone (VWATC) test geometry.
Metals 11 01862 g004
Figure 5. Toolpath for the VWATC for (a) ISF process and (b) ISH process.
Metals 11 01862 g005
Figure 6. Constant wall angle truncated cone (CWATC) test geometry.
Metals 11 01862 g006
Figure 7. Flow stress-strain curves at different strain rates of aluminum alloy AA1050.
Metals 11 01862 g007
Figure 8. Numerical model used during simulation of ISF and ISH processes.
Metals 11 01862 g008
Figure 9. Experimental setup consisting of (a) dieless manufacturing center (b) forming setup.
Metals 11 01862 g009
Figure 10. (a) VWATC formed through ISF process and (b) VWATC formed through ISH process.
Metals 11 01862 g010
Figure 11. (a) CWATC formed through ISF process, (a’) Scaled fracture section in CWATC formed through ISF process (b) CWATC formed through ISH process, (b’) Scaled fracture section in CWATC formed through ISH process.
Metals 11 01862 g011
Figure 12. 3D scanned CWATC components formed with (a) ISF process, (b) ISH process.
Metals 11 01862 g012
Figure 13. Material thickness distribution along the sliced section in the formed CWATC component.
Metals 11 01862 g013
Figure 14. Material thickness distribution obtained through numerical simulation for the (a) ISF process, (b) ISH process.
Metals 11 01862 g014
Figure 15. Comparison of strain values for the components formed through ISF and ISH processes.
Metals 11 01862 g015
Figure 16. Surface roughness profiles of components formed through (a) ISF process, (b) ISH process.
Metals 11 01862 g016
Figure 17. Forming forces in Z direction during ISF and ISH processes.
Metals 11 01862 g017
Figure 18. Experimental statistical analysis of the ISH process with respect to the ISF process.
Metals 11 01862 g018
Table 1. Material properties of aluminum alloy AA1050.
S. No.PropertyValue
1Young’s modulus71,000 MPa
2Poisson’s ratio0.33
3Density2700 kg/m3
Table 2. Observations from VWATC test geometry.
ProcessDepth AchievedWall Angle Achieved
ISF30.71 mm78.19°
ISH32.31 mm79.29°
Table 3. Wall angle and depth achieved in ISF and ISH processes for 78° wall angle.
ProcessDepth AchievedWall Angle Achieved
ISF13.62 mm73.62°
ISH13.80 mm73.59°
Table 4. Surface roughness in the components formed with ISF and ISH processes.
ProcessAverage Roughness (Ra, μm)Maximum Average Roughness (Ramax, μm)Mean Roughness Depth (Rz, μm)
ISF0.28600.44920.867–1.3316
ISH0.24010.29031.0839–1.4974
Table 5. Forming forces in the components formed with ISF and ISH processes.
ProcessISFISH
Forces in X-direction1031 N861 N
Forces in Y-direction913 N803 N
Forces in Z-direction1350 N1225 N
Publisher’s Note: MDPI stays neutral with regard to jurisdictional claims in published maps and institutional affiliations.

