
Contextual Variation in External and Internal Workloads across the Competitive Season of a Collegiate Women’s Soccer Team

 ,
,  , ,
, ,
Abstract
:1. Introduction
2. Materials and Methods
2.1. Participants
2.2. Wearable Sensors
2.3. Data Collection
2.4. Measures and Variables
2.4.1. Objective Workload Variables
- Absolute Summated Distance [m]—Summated distances encompass the combined number of meters traveled by the team or a positional group for a given session (full game or half). It accounts for contributions made by all utilized players of the session as a measure of group external workload.
- Absolute Average Distance [m]—Average distances represent the mean number of total meters traveled during a session (full game or half) across the team or positional group. It represents the average contributions per player.
- Meters per Minute (M/min) [m/min]—A relative measure of external workload; the number of meters traveled by a player during the session (full game or half) normalized by their active game duration. A relative measure of distances traversed that can be compared between players contributing only a few minutes and those playing the full game.
- Absolute Summated Player Loads [au]—Summated player load encompass the combined number of arbitrary units recorded in the team or a positional group for a given session (full game or half). It accounts for contributions made by all utilized players of the session as a measure of group external workload.
- Absolute Average Player Loads [au]—Average player loads represent the mean number of total arbitrary units recorded during a session (full game or half) across the team or positional group. It represents the average contributions per player.
- Player Load per Minute (PL/min) [au]—A relative measure of external workload; the number of arbitrary units recorded by a player during the session (full game or half) normalized by their active game duration. A relative measure of player load that can be compared between players contributing only a few minutes and those playing the full game.
- Player Load per Meter (PL/M) [au/m]—A relative measure of external workload; the number of arbitrary units recorded by a player during the session (full game or half) normalized by their total distance traveled. A relative measure of player load that can be compared between players contributing smaller vs. greater efforts, which is representative of the magnitude and frequency of velocity changes standardized to a relative distance.
2.4.2. Contextual Variables
2.5. Statistical Analysis
3. Results
3.1. Team Analysis
3.1.1. Absolute Workload
3.1.2. Relative Workload
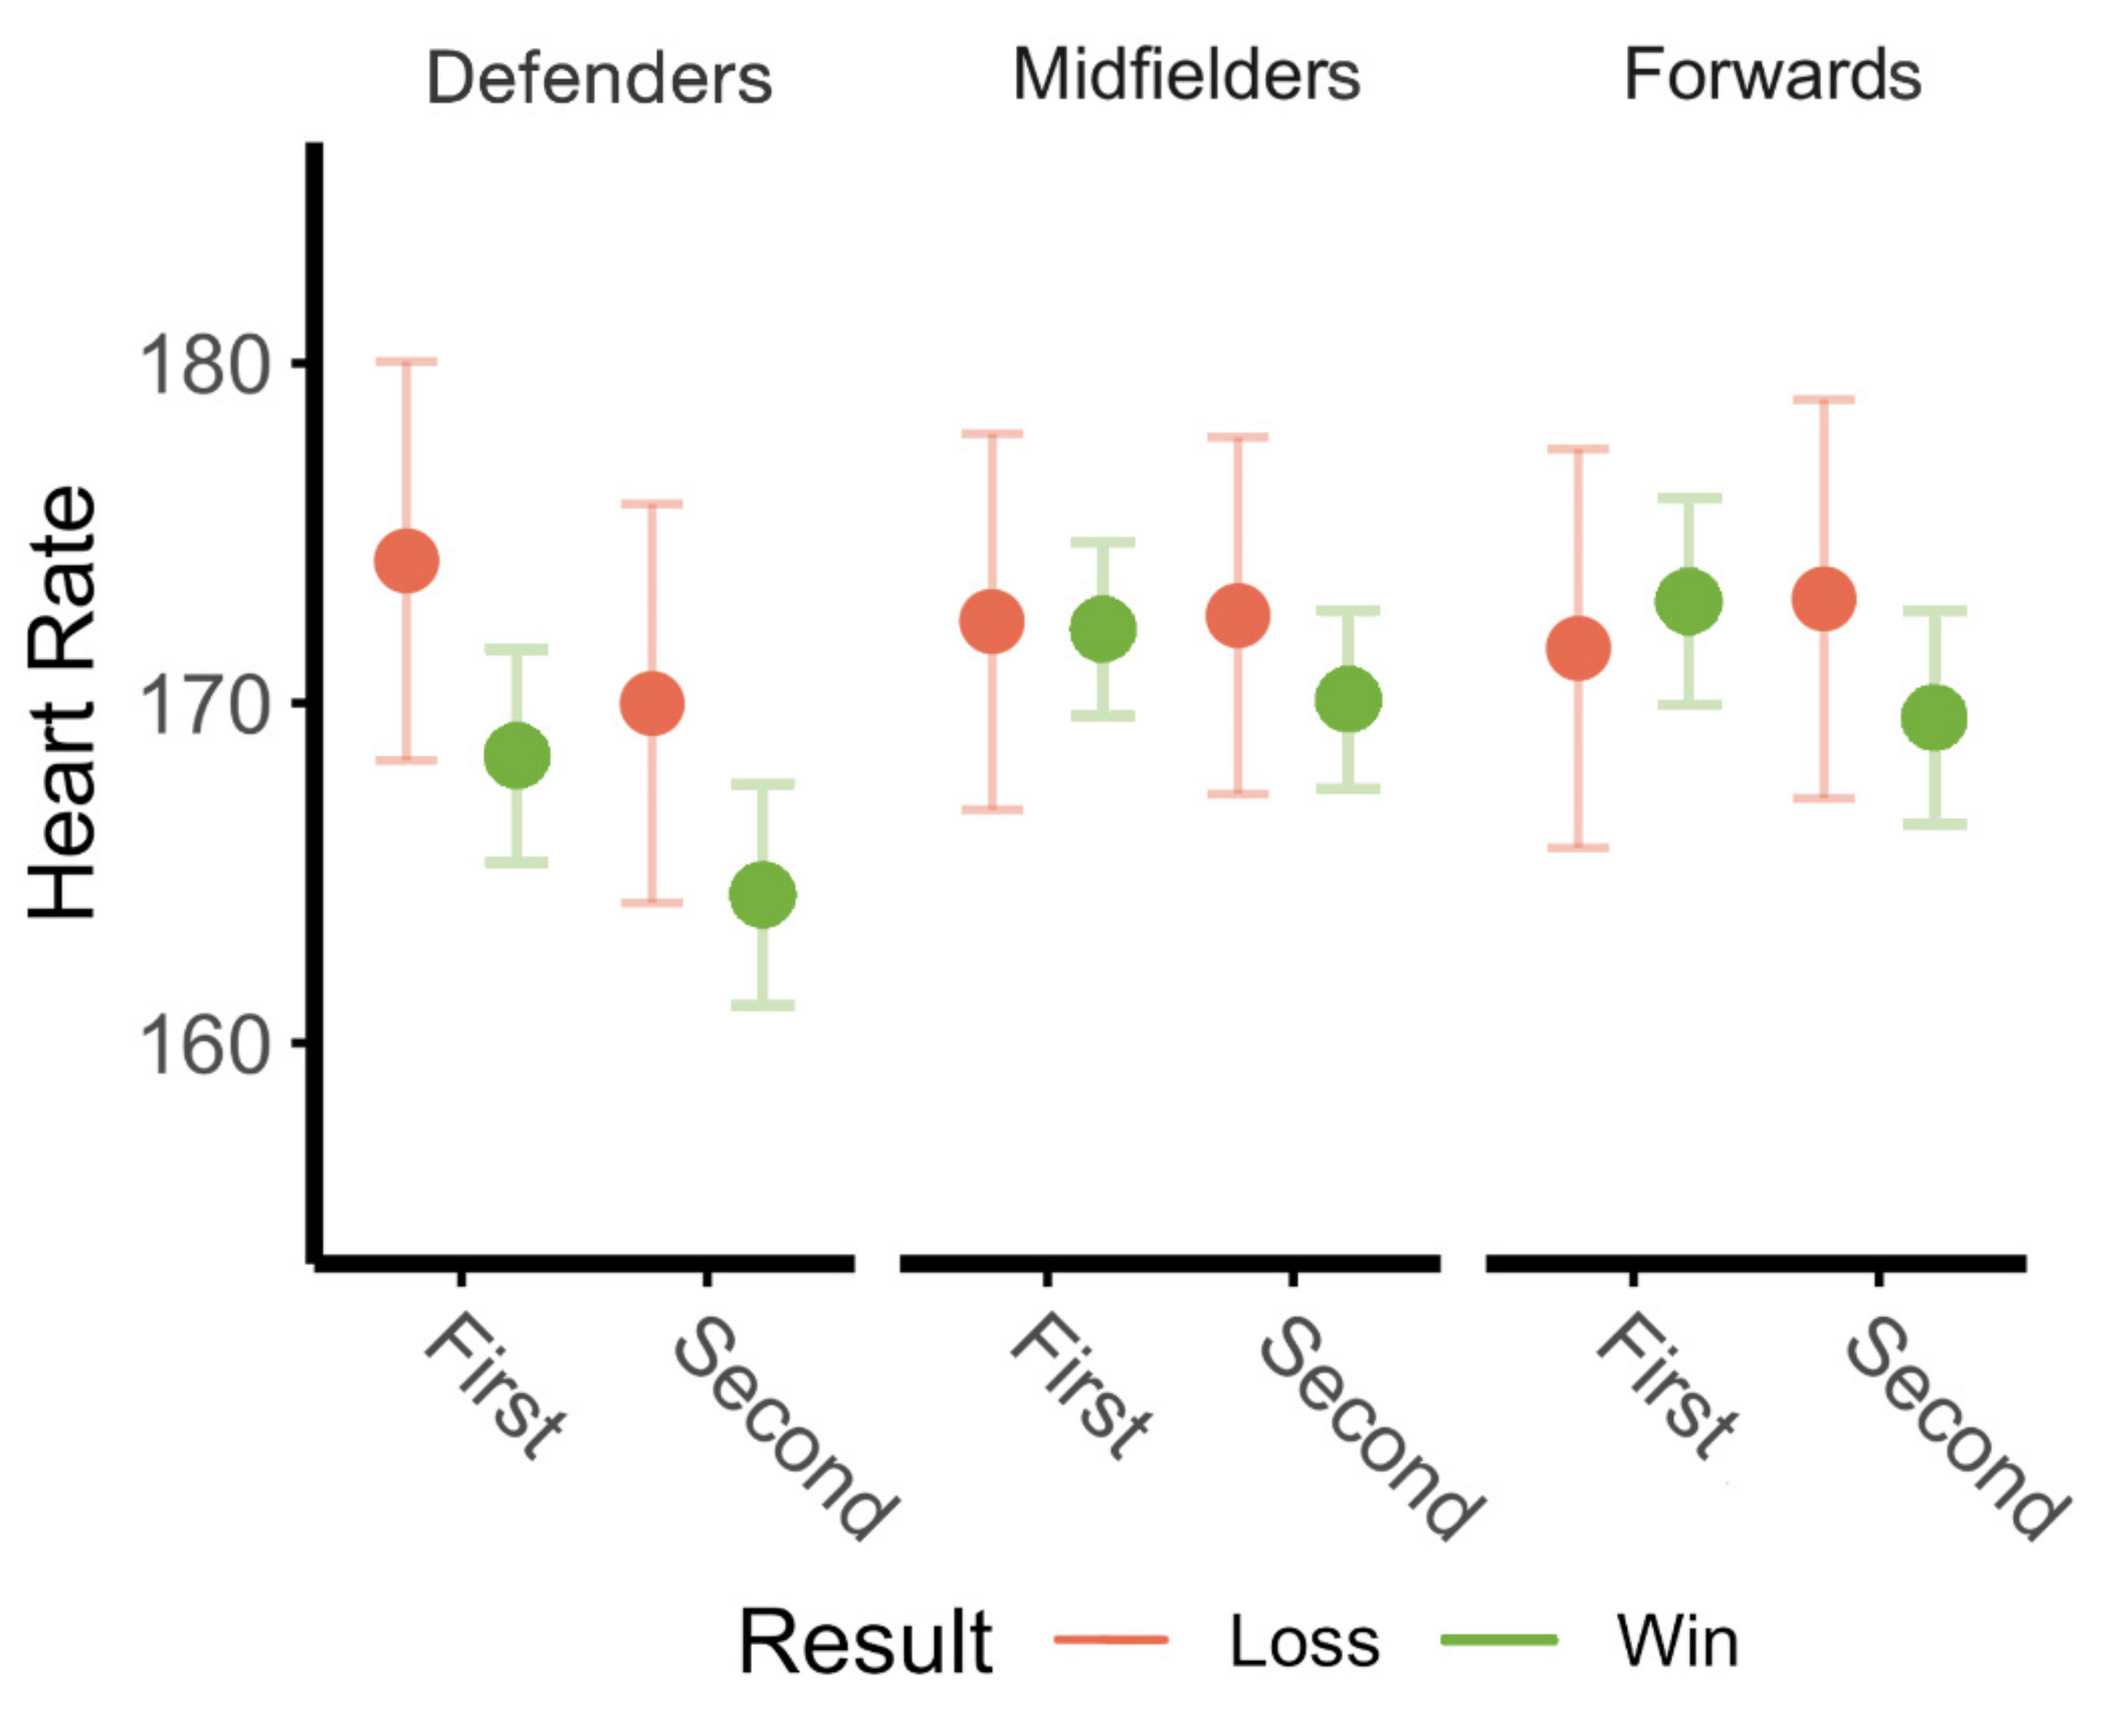
3.1.3. Internal Workload
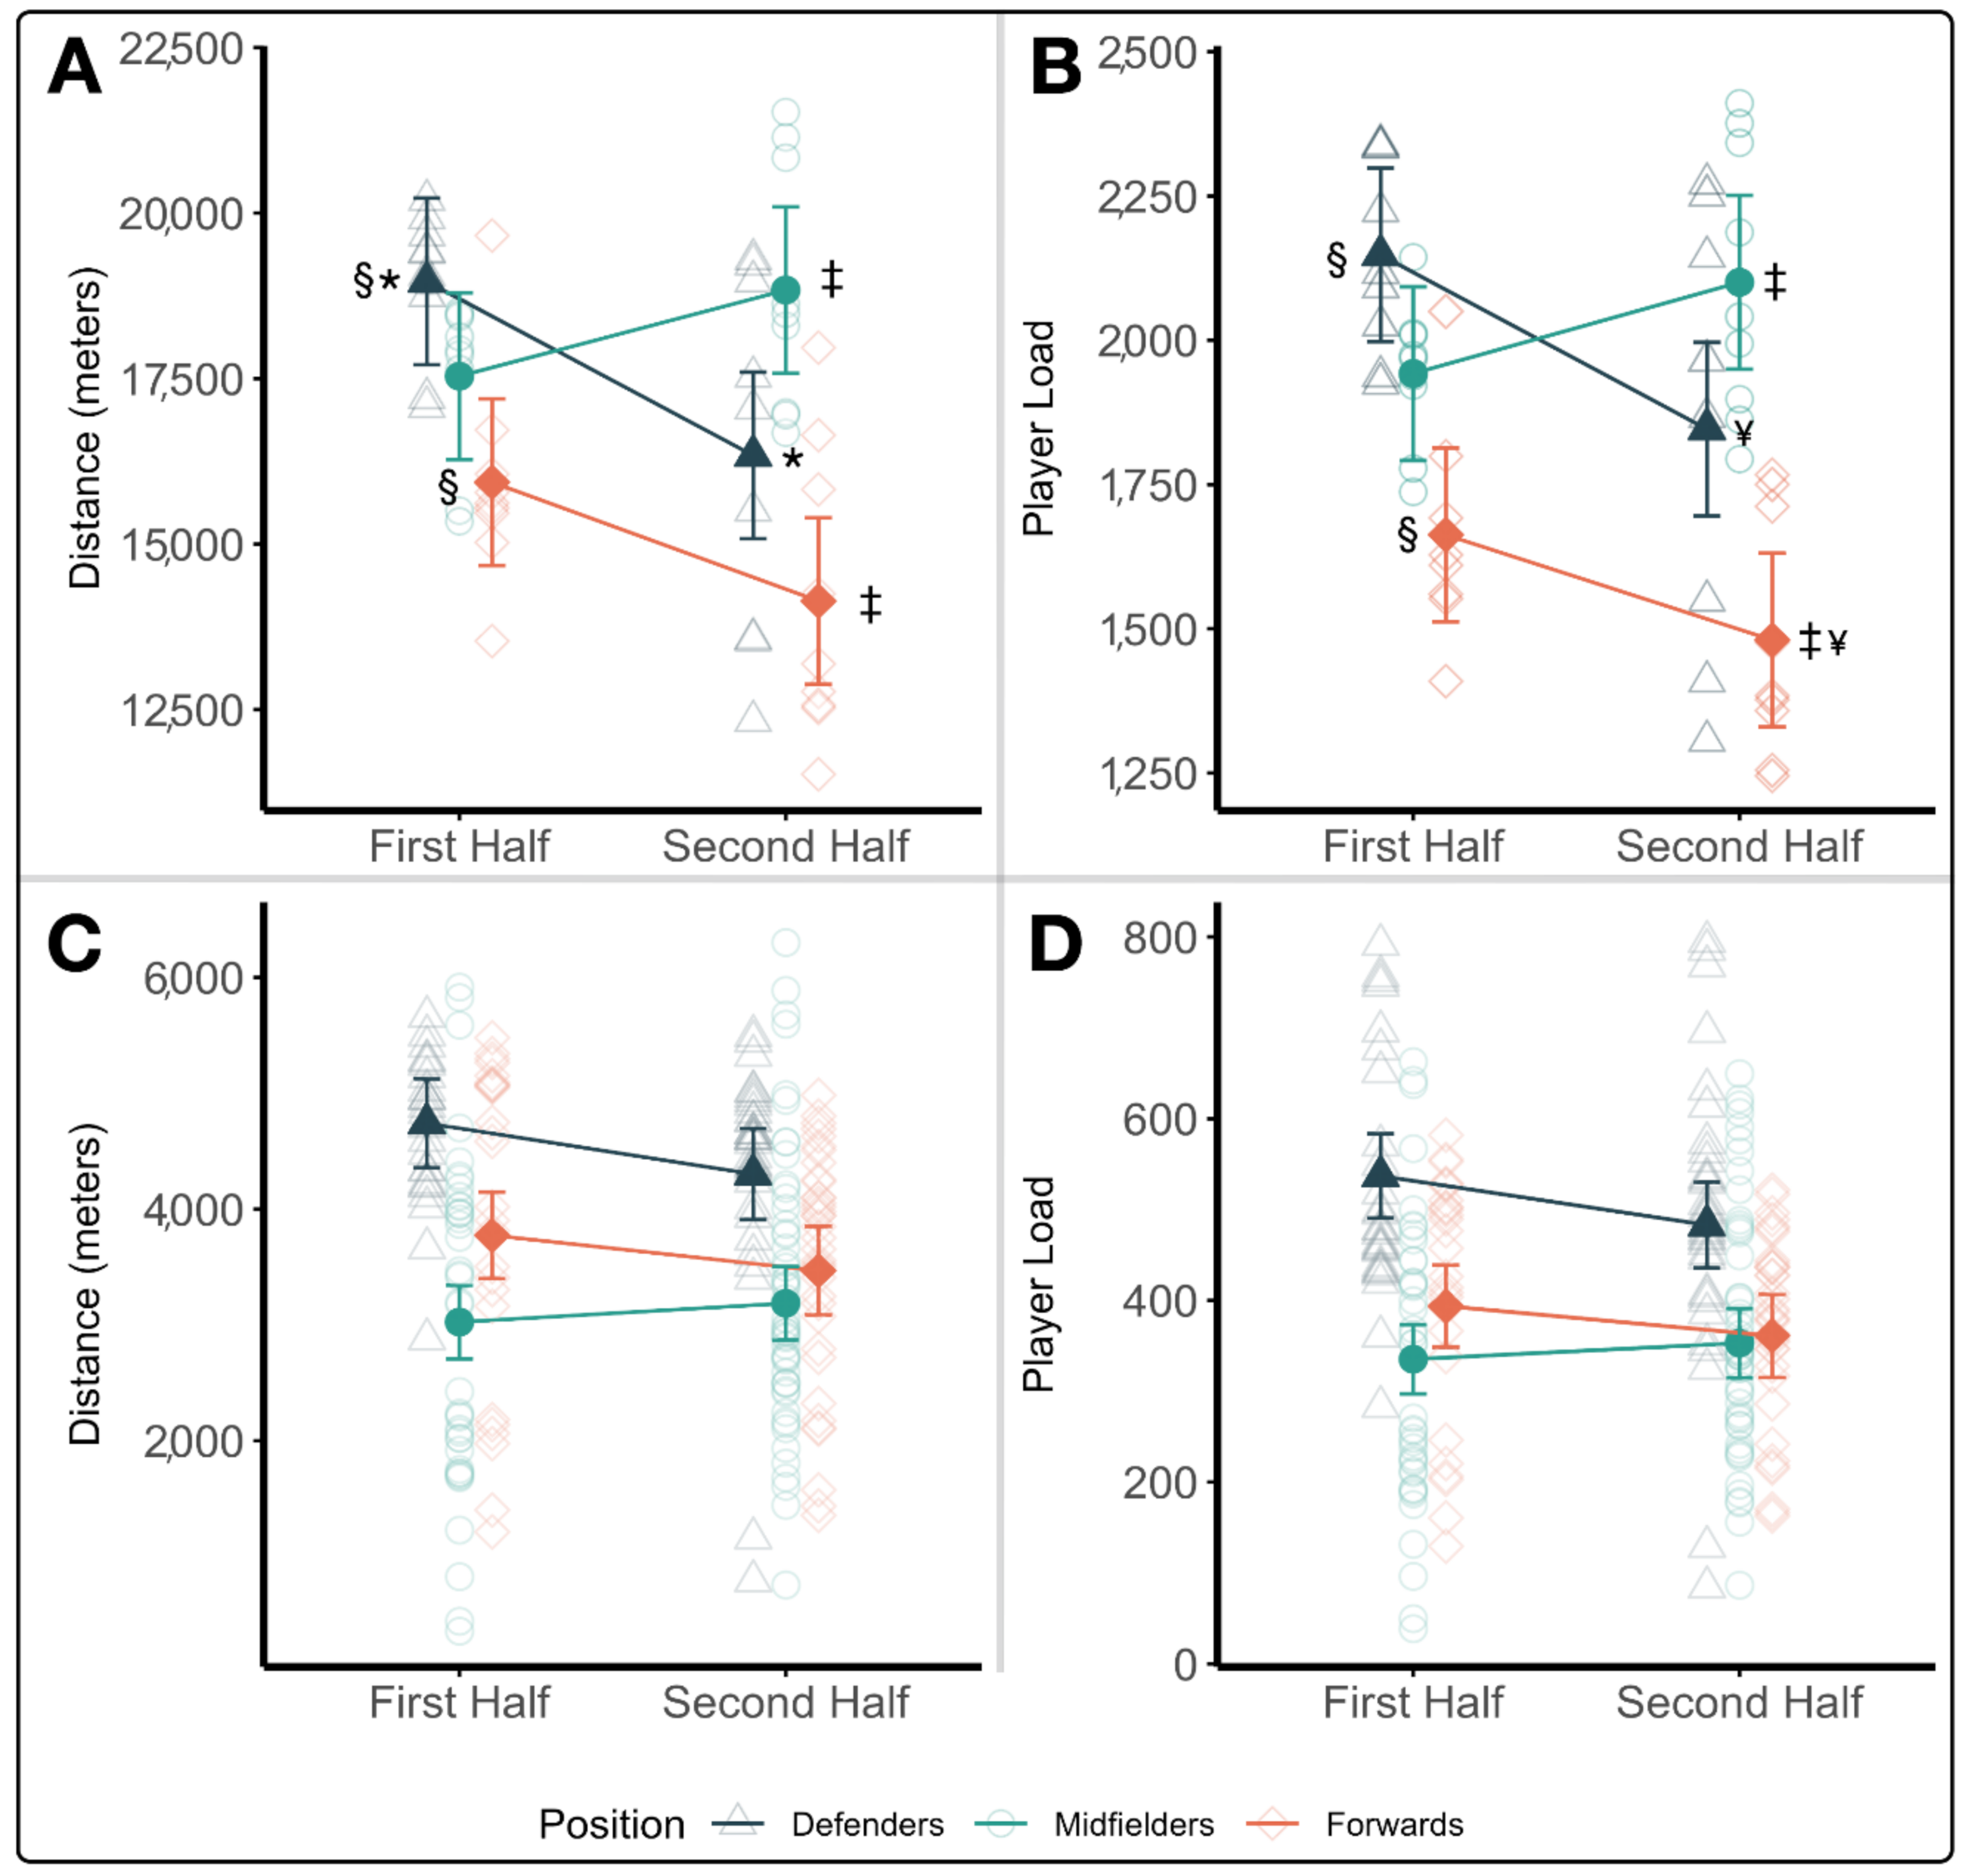
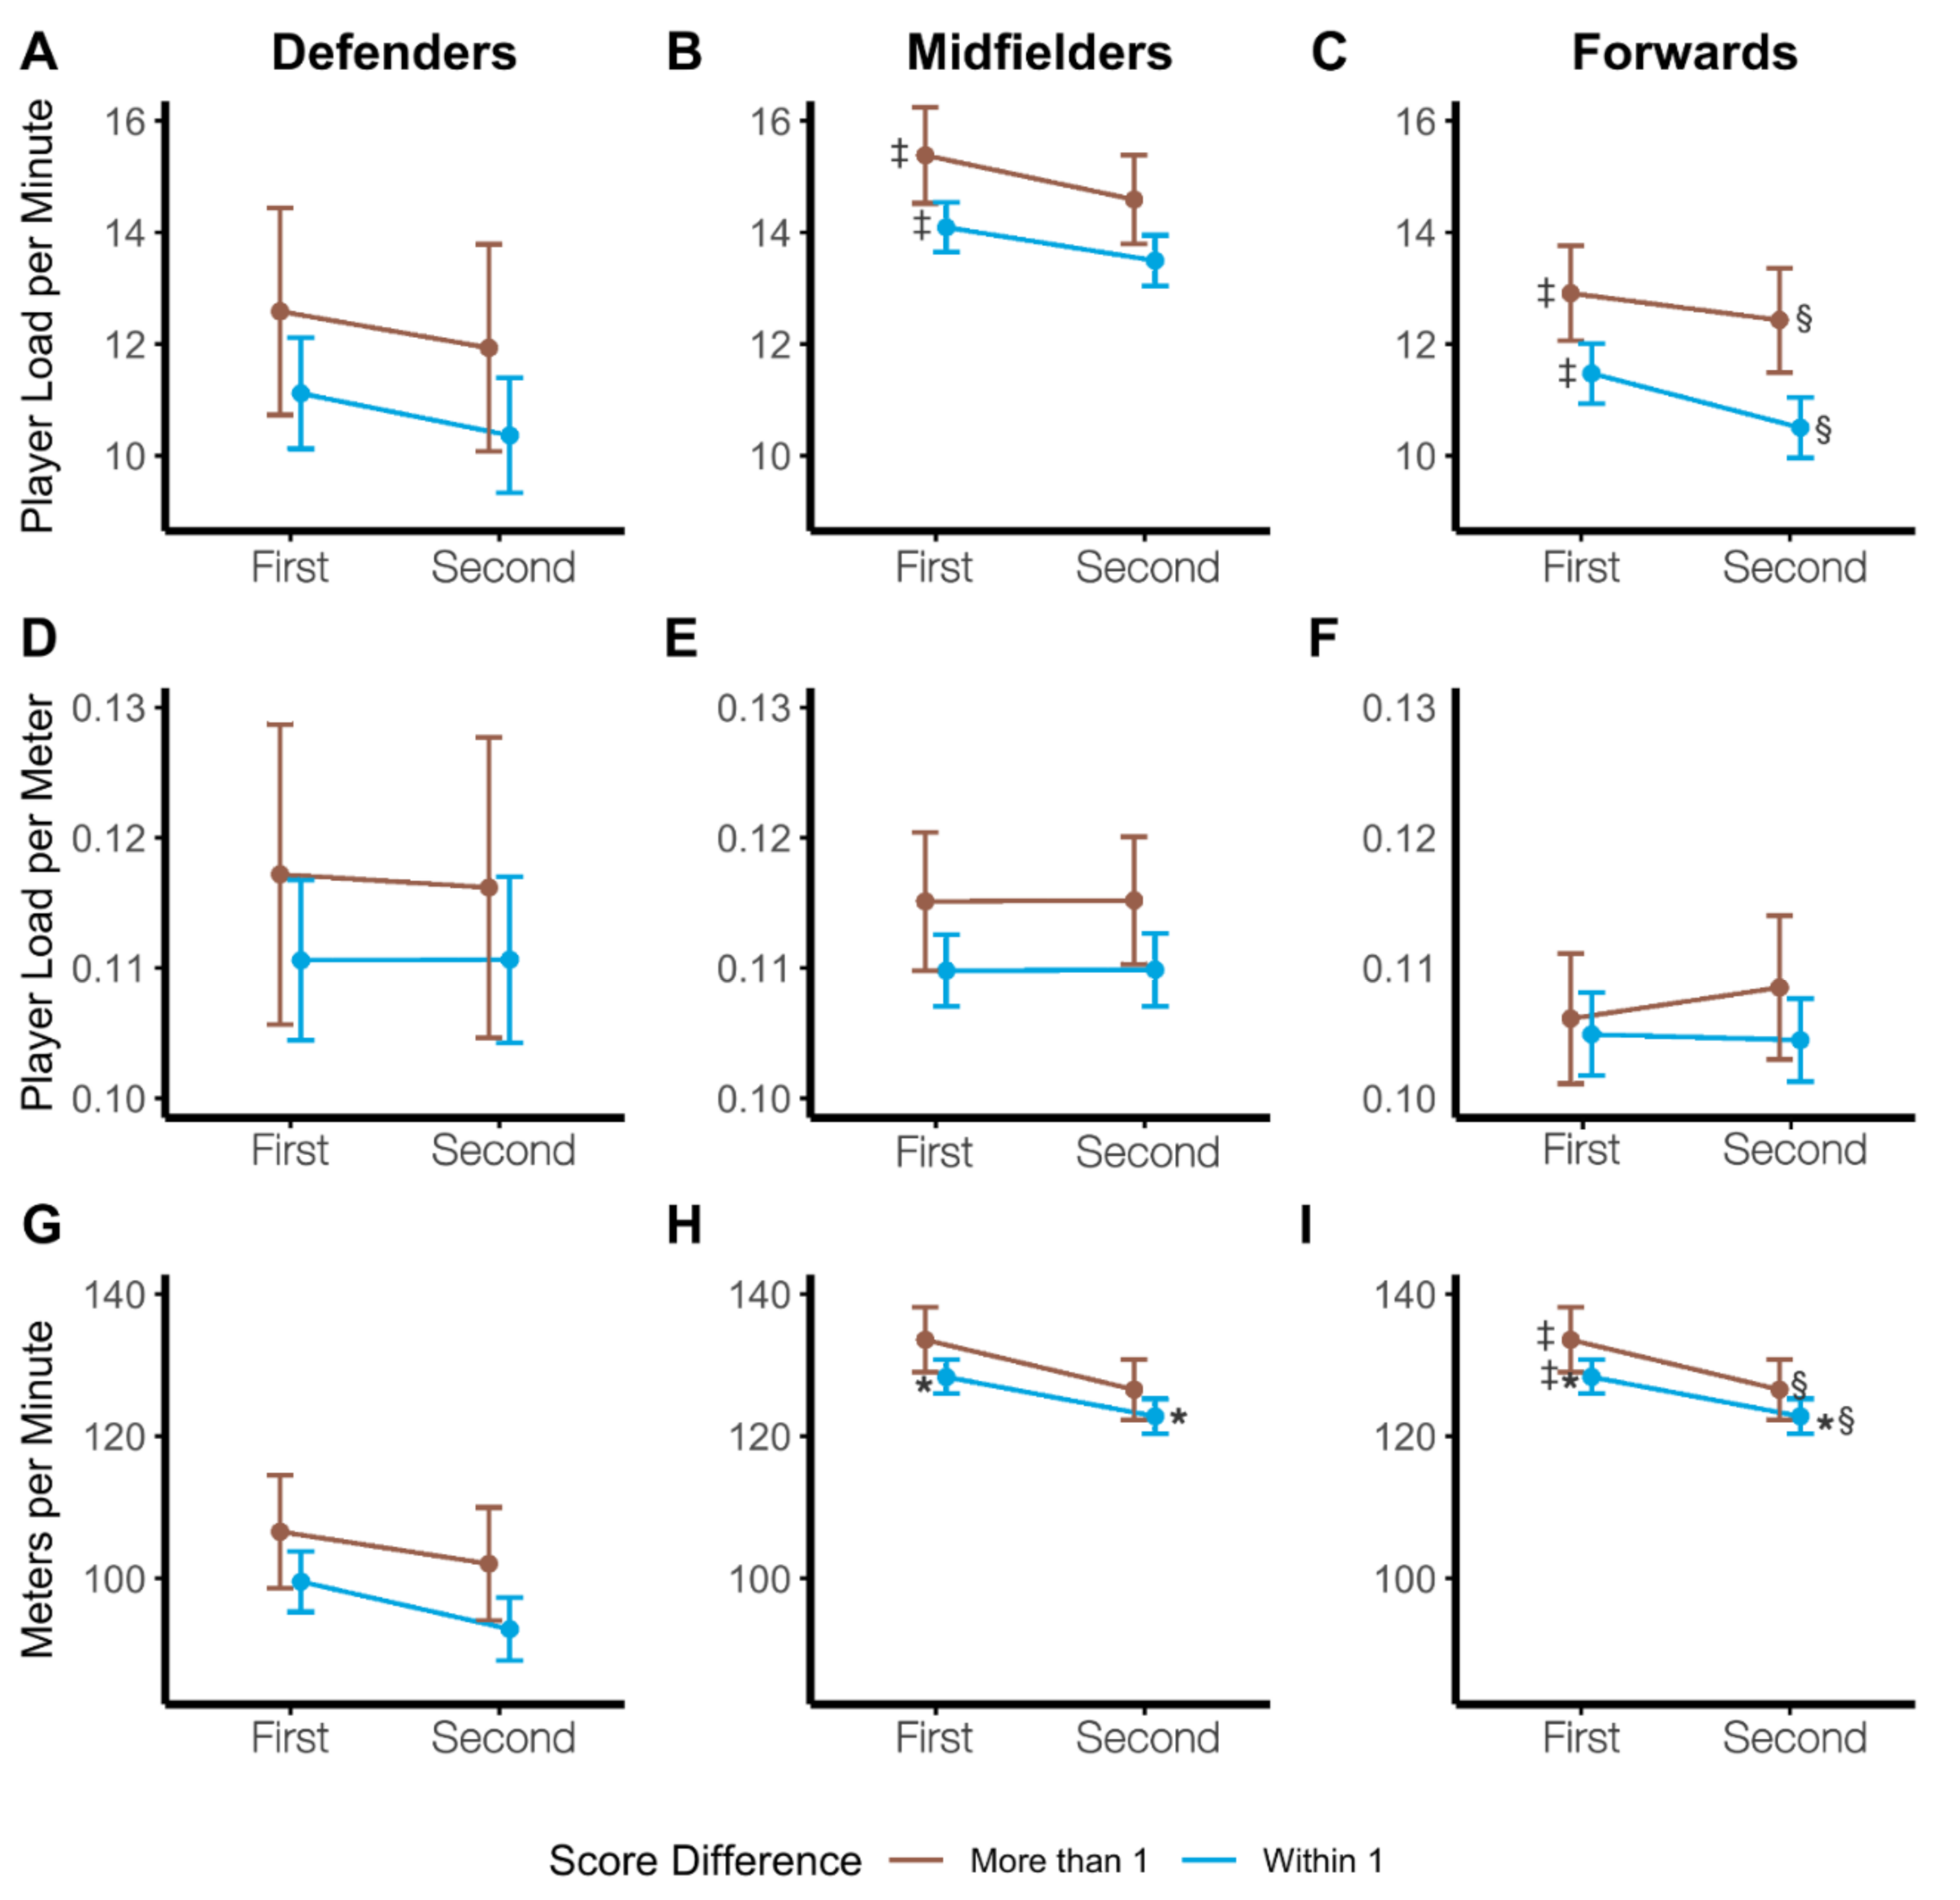
3.2. Positional Analysis
3.2.1. Absolute Workload
3.2.2. Relative Workload
3.2.3. Internal Workload
4. Discussion
4.1. Game Result
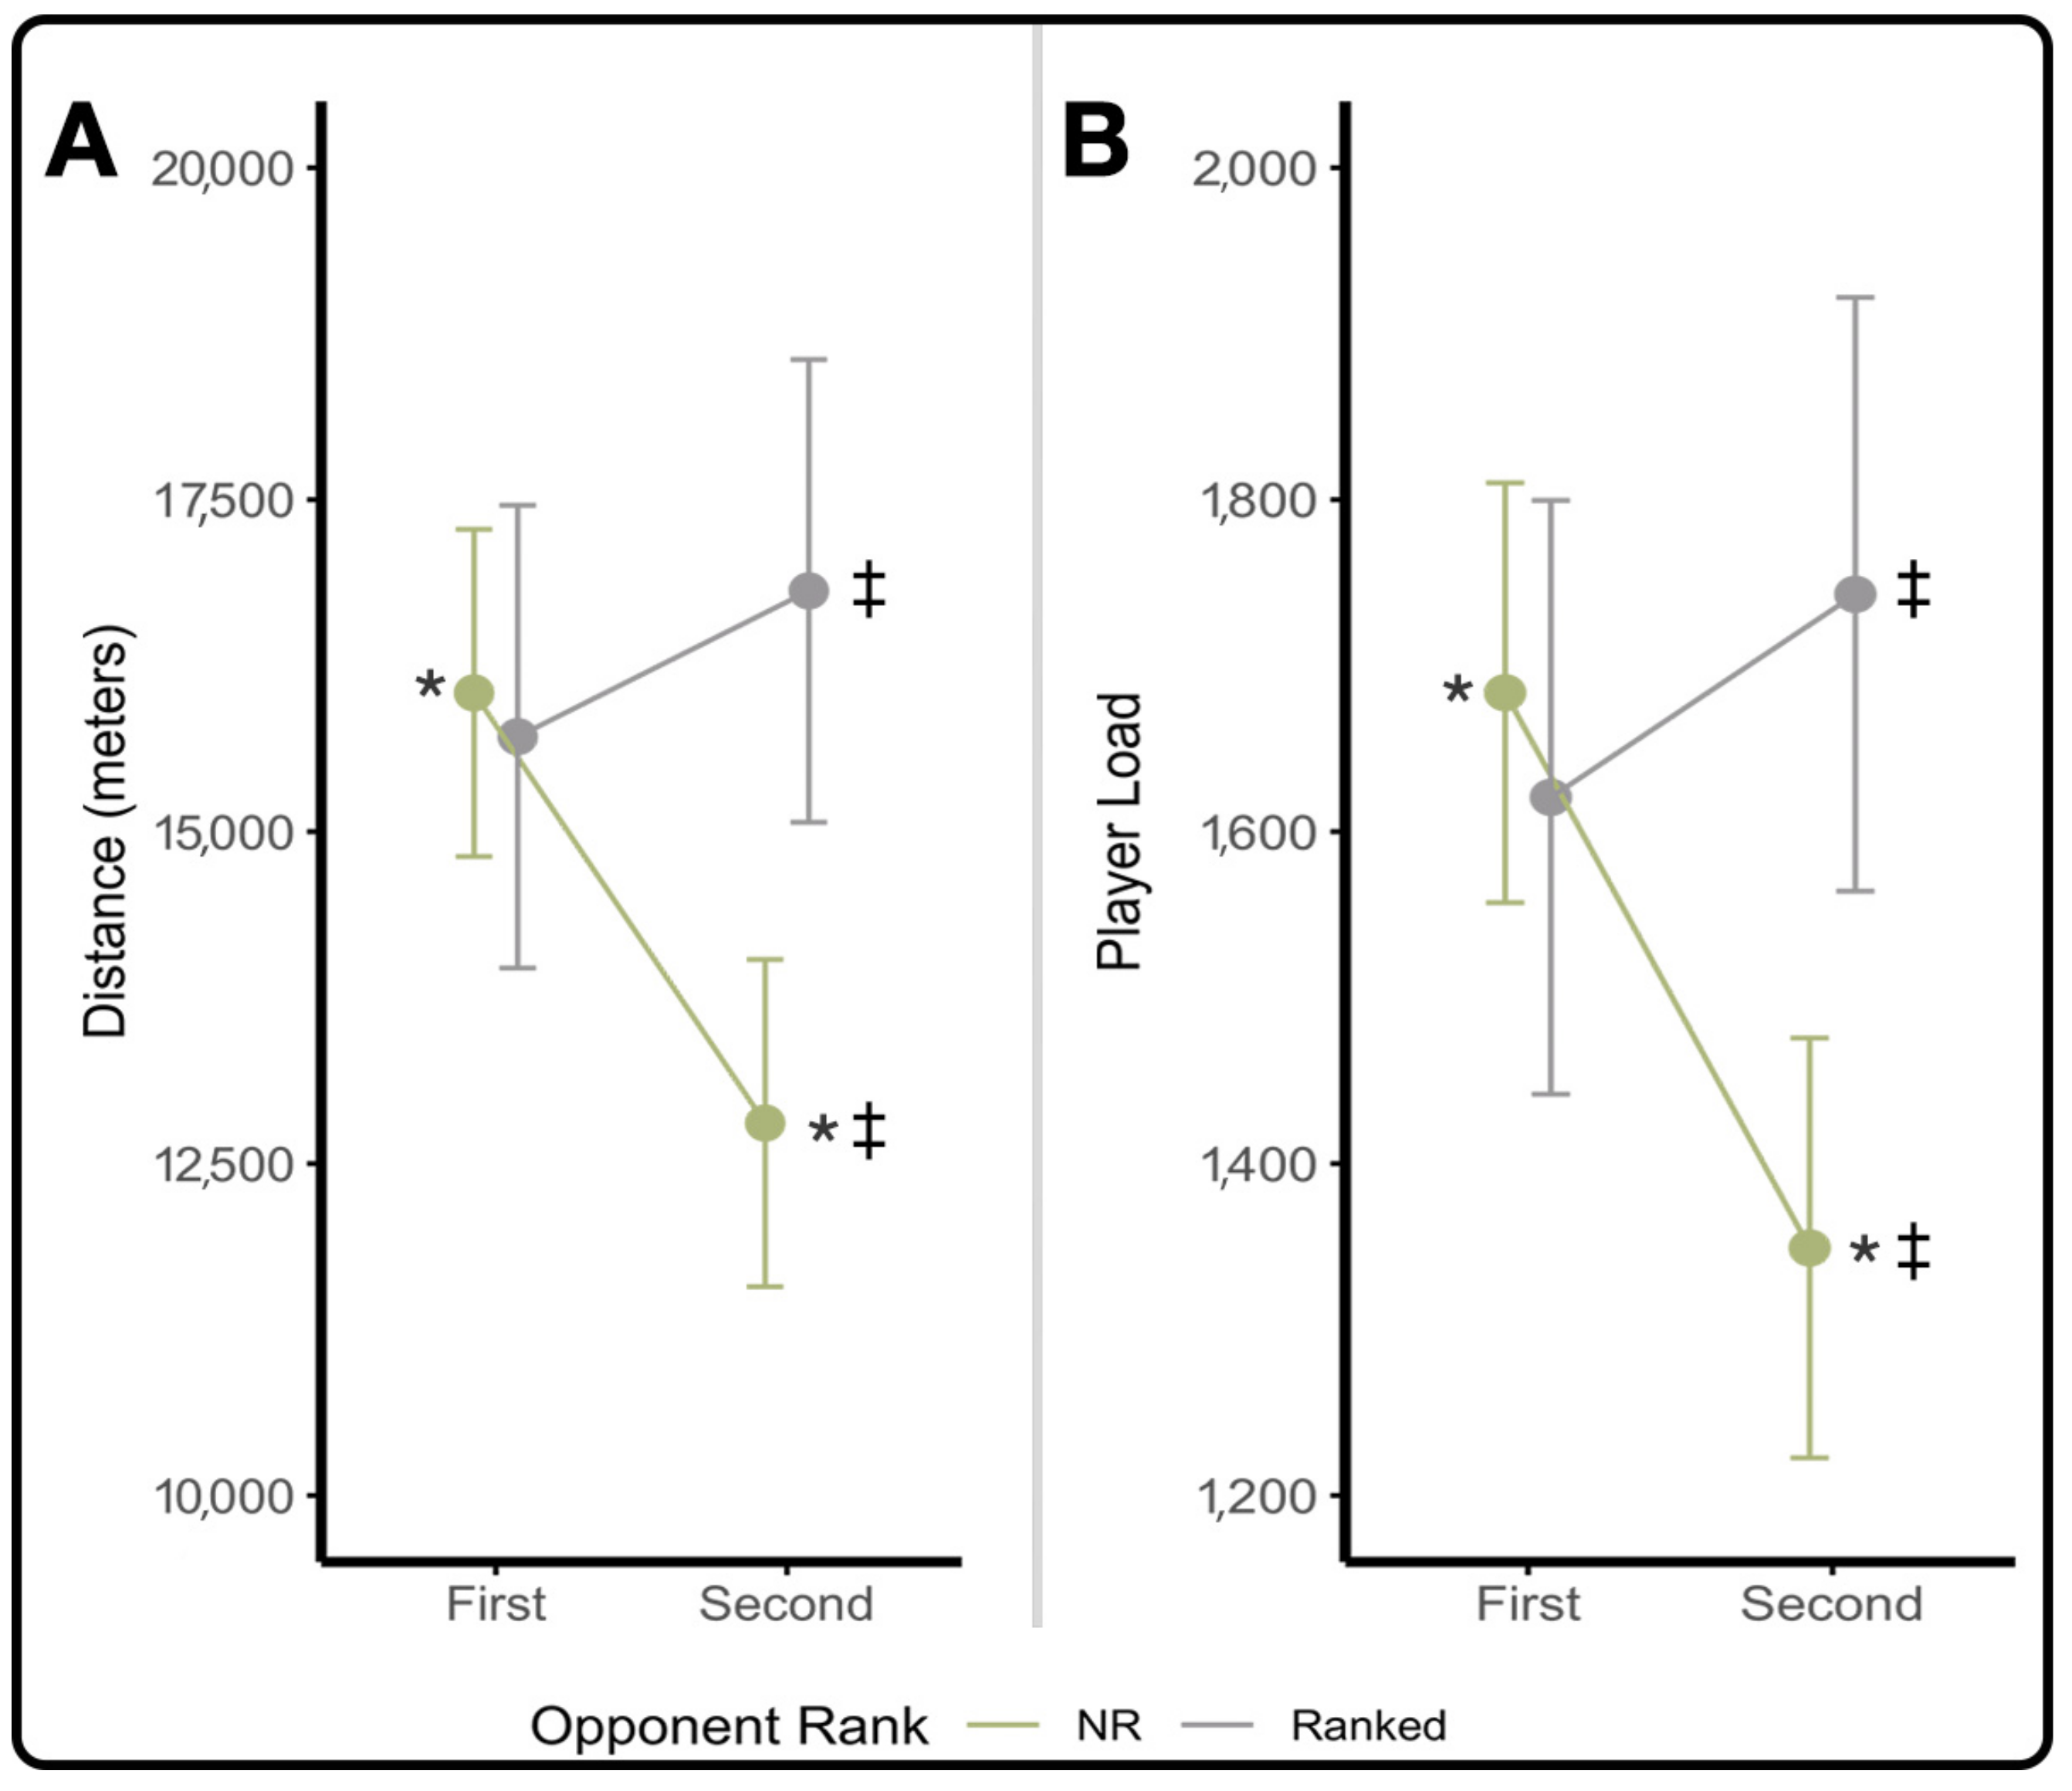
4.2. Opponent Rank
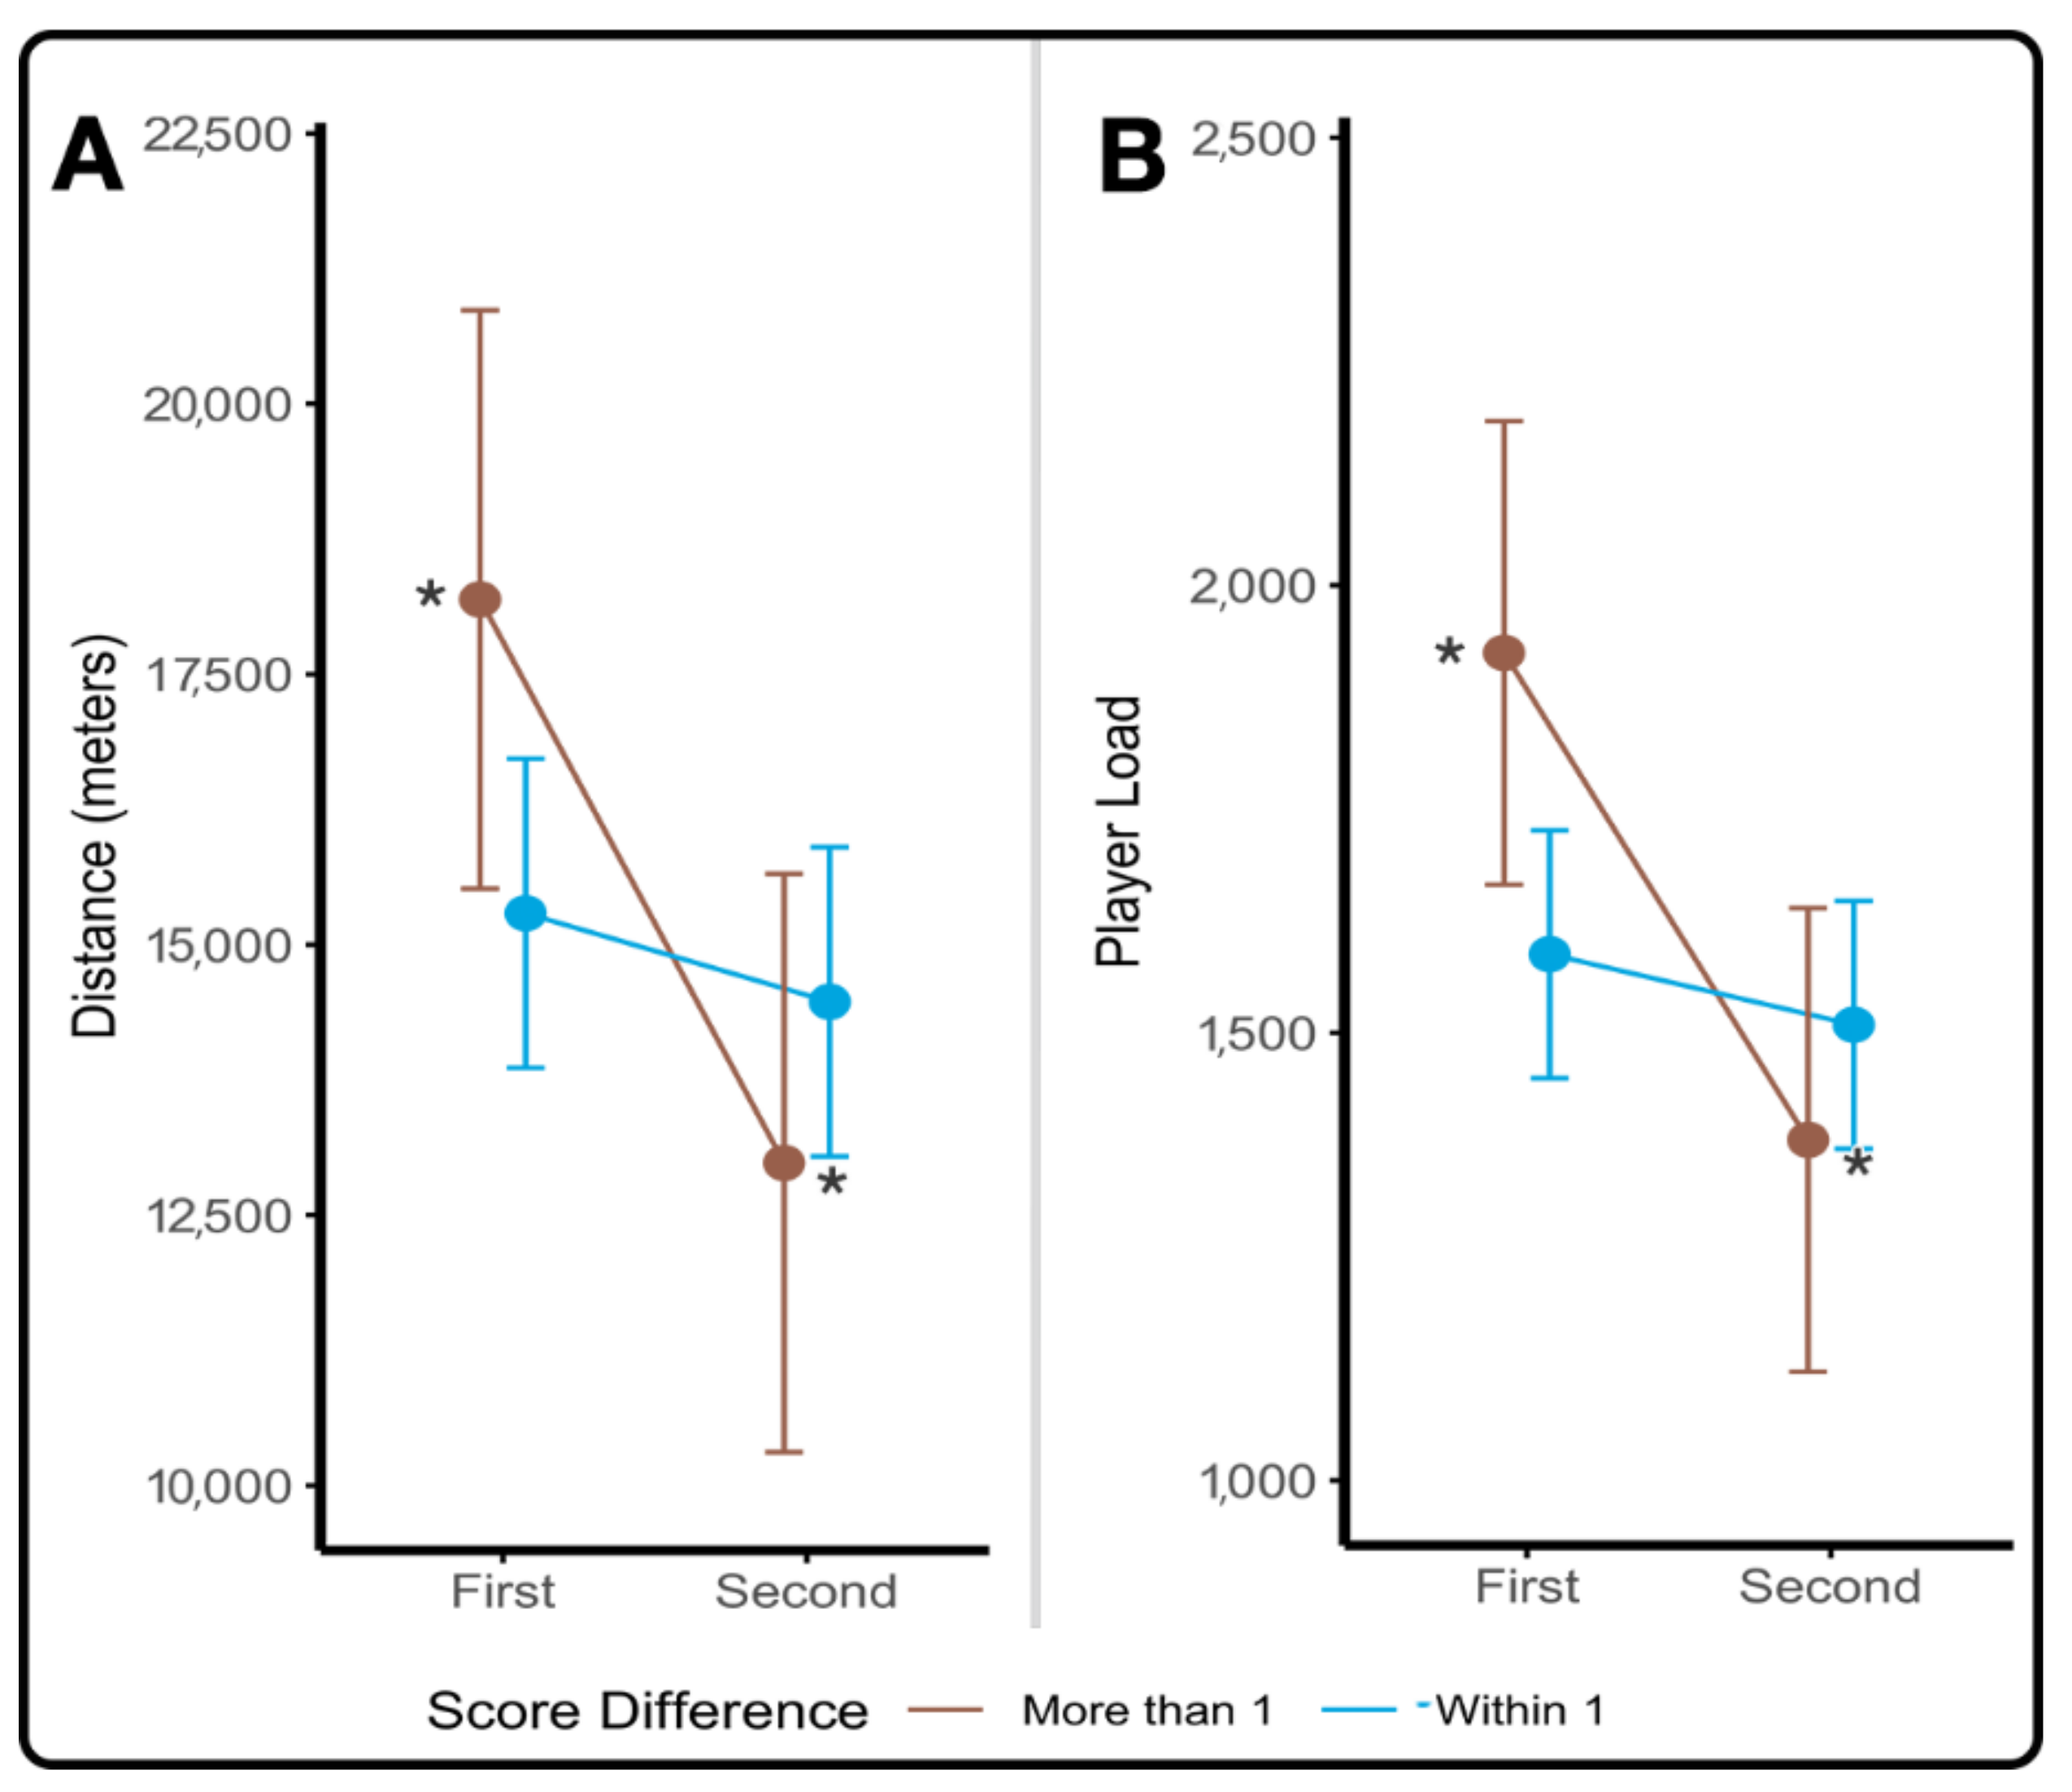
4.3. Final Score
4.4. Implications
4.5. Limitations and Future Research
5. Conclusions
Author Contributions
Funding
Institutional Review Board Statement
Informed Consent Statement
Data Availability Statement
Conflicts of Interest
References
- Borg, G.; Hassmén, P.; Lagerström, M. Perceived exertion related to heart rate and blood lactate during arm and leg exercise. Eur. J. Appl. Physiol. Occup. Physiol. 1987, 56, 679–685. [Google Scholar] [CrossRef]
- Borg, G. Psychophysical basis of perceived exertion. Med. Sci. Sport Exerc. 1982, 14, 377–381. [Google Scholar] [CrossRef]
- Banister, E.W.; Green, H.; McDougall, J.; Wenger, H. Modeling elite athletic performance. In Physiological Testing of Elite Athletes; Human Kinetics: Champaign, IL, USA, 1991; pp. 403–424. [Google Scholar]
- Edwards, S. High performance training and racing. In The Heart Rate Monitor Book; Edwards, S., Ed.; Feet Fleet Press: Sacramento, CA, USA, 1993; pp. 113–123. [Google Scholar]
- Foster, C. Monitoring training in athletes with reference to overtraining syndrome. Med. Sci. Sport Exerc. 1998, 30, 1164–1168. [Google Scholar] [CrossRef] [PubMed]
- De Dios-Álvarez, V.; Suárez-Iglesias, D.; Bouzas-Rico, S.; Alkain, P.; González-Conde, A.; Ayán-Pérez, C. Relationships between RPE-derived internal training load parameters and GPS-based external training load variables in elite young soccer players. Res. Sports Med. 2021. [Google Scholar] [CrossRef]
- Impellizzeri, F.M.; Rampinini, E.; Coutts, A.J.; Sassi, A.; Marcora, S.M. Use of RPE-based training load in Soccer. Med. Sci. Sport Exerc. 2004, 36, 1042–1047. [Google Scholar] [CrossRef]
- Malone, J.J.; Barrett, S.; Barnes, C.; Twist, C.; Drust, B. To infinity and beyond: The use of GPS devices within the football codes. Sci. Med. Footb. 2020, 4, 82–84. [Google Scholar] [CrossRef]
- Junior, M.N.S.d.O.; Veneroso, C.E.; Ramos, G.P.; Johnson, K.E.; Guilkey, J.P.; Sena, A.F.d.C.; Cabido, C.E.T.; Cholewa, J.M. Distance and intensity profiles in division i women’s soccer matches across a competitive Season. Sports 2021, 9, 63. [Google Scholar] [CrossRef] [PubMed]
- Sausaman, R.W.; Sams, M.L.; Mizuguchi, S.; DeWeese, B.H.; Stone, M.H. The physical demands of NCAA division I women’s college soccer. J. Funct. Morphol. Kinesiol. 2019, 4, 73. [Google Scholar] [CrossRef] [Green Version]
- Krustrup, P.; Mohr, M.; Ellingsgaard, H.; Bangsbo, J. Physical demands during an elite female soccer game: Importance of training status. Med. Sci. Sports Exerc. 2005, 37, 1242–1248. [Google Scholar] [CrossRef] [PubMed]
- Andersson, H.Å.; Randers, M.B.; Heiner-Møller, A.; Krustrup, P.; Mohr, M. Elite female soccer players perform more high-intensity running when playing in international games compared with domestic league games. J. Strength Cond. Res. 2010, 24, 912–919. [Google Scholar] [CrossRef]
- Vescovi, J.D. Sprint profile of professional female soccer players during competitive matches: Female Athletes in Motion (FAiM) study. J. Sports Sci. 2012, 30, 1259–1265. [Google Scholar] [CrossRef]
- Hewitt, A.; Norton, K.; Lyons, K. Movement profiles of elite women soccer players during international matches and the effect of opposition’s team ranking. J. Sports Sci. 2014, 32, 1874–1880. [Google Scholar] [CrossRef]
- Bradley, P.S.; Dellal, A.; Mohr, M.; Castellano, J.; Wilkie, A. Gender differences in match performance characteristics of soccer players competing in the UEFA Champions League. Hum. Mov. Sci. 2014, 33, 159–171. [Google Scholar] [CrossRef] [PubMed]
- Bradley, P.S.; Vescovi, J.D. Velocity thresholds for women’s soccer matches: Sex specificity dictates high-speed-running and sprinting thresholds—Female Athletes in Motion (FAiM). Int. J. Sports Physiol. Perform. 2015, 10, 112–116. [Google Scholar] [CrossRef] [PubMed]
- Datson, N.; Drust, B.; Weston, M.; Jarman, I.H.; Lisboa, P.J.; Gregson, W. Match physical performance of elite female soccer players during international competition. J. Strength Cond. Res. 2017, 31, 2379–2387. [Google Scholar] [CrossRef]
- Mara, J.K.; Thompson, K.G.; Pumpa, K.L.; Morgan, S. Quantifying the high-speed running and sprinting profiles of elite female soccer players during competitive matches using an optical player tracking system. J. Strength Cond. Res. 2017, 31, 1500–1508. [Google Scholar] [CrossRef]
- Vescovi, J.D.; Favero, T.G. Motion Characteristics of women’s college soccer matches: Female Athletes in Motion (FAiM) Study. Int. J. Sports Med. 2014, 9, 405–414. [Google Scholar] [CrossRef] [PubMed]
- Gentles, J.A.; Coniglio, C.L.; Besemer, M.M.; Morgan, J.M.; Mahnken, M.T. The demands of a women’s college soccer season. Sports 2018, 6, 16. [Google Scholar] [CrossRef] [Green Version]
- Wells, A.J.; Hoffman, J.R.; Beyer, K.S.; Hoffman, M.W.; Jajtner, A.R.; Fukuda, D.H.; Stout, J.R. Regular-and postseason comparisons of playing time and measures of running performance in NCAA Division I women soccer players. Appl. Physiol. Nutr. Metab. 2015, 40, 907–917. [Google Scholar] [CrossRef] [Green Version]
- Bozzini, B.N.; McFadden, B.A.; Walker, A.J.; Arent, S.M. Varying demands and quality of play between in-conference and out-of-conference games in division i collegiate women’s soccer. J. Strength Cond. Res. 2020, 34, 3364–3368. [Google Scholar] [CrossRef]
- Curtis, R.M.; Huggins, R.A.; Looney, D.P.; West, C.A.; Fortunati, A.; Fontaine, G.J.; Casa, D.J. Match demands of national collegiate athletic association division in men’s soccer. J. Strength Cond. Res. 2018, 32, 2907–2917. [Google Scholar] [CrossRef] [PubMed]
- Curtis, R.M.; Huggins, R.A.; Benjamin, C.L.; Sekiguchi, Y.; Pullara, J.M.; West, C.A.; Casa, D.J. Seasonal accumulated workloads in collegiate men’s soccer: A comparison of starters and reserves. J. Strength Cond. Res. 2019, 35, 3184–3189. [Google Scholar] [CrossRef]
- Tomasiello, L.S.J. Training Load Management and Injury Prevention in Collegiate Men’s Soccer. Master’s Thesis, Missouri State University, Springfield, MO, USA, 2019. [Google Scholar]
- Cardinale, M.; Varley, M.C. Wearable training-monitoring technology: Applications, challenges, and opportunities. Int. J. Sports Physiol. Perform. 2017, 12, 55–62. [Google Scholar] [CrossRef] [Green Version]
- Sands, W.; McNeal, J.R. Predicting athlete preparation and performance: A theoretical perspective. J. Sport Behav. 2000, 23, 289–310. [Google Scholar]
- Ayuso-Moreno, R.; Fuentes-García, J.P.; Collado-Mateo, D.; Villafaina, S. Heart rate variability and pre-competitive anxiety according to the demanding level of the match in female soccer athletes. Physiol. Behav. 2020, 222, 112926. [Google Scholar] [CrossRef]
- Weaving, D.; Marshall, P.; Earle, K.; Nevill, A.; Abt, G. Combining internal- and external-training-load measures in professional rugby league. Int. J. Sports Physiol. Perform. 2014, 9, 905–912. [Google Scholar] [CrossRef] [PubMed]
- Reche-Soto, P.; Cardona-Nieto, D.; Diaz-Suarez, A.; Bastida-Castillo, A.; Gomez-Carmona, C.; Garcia-Rubio, J.; Pino-Ortega, J. Player load and metabolic power dynamics as load quantifiers in soccer. J. Hum. Kinet. 2019, 69, 259–269. [Google Scholar] [CrossRef] [PubMed] [Green Version]
- Castellano, J.; Blanco-Villaseñor, A.; Alvarez, D. Contextual variables and time-motion analysis in soccer. Int. J. Sports Med. 2011, 32, 415–421. [Google Scholar] [CrossRef] [Green Version]
- Oliva-Lozano, J.M.; Rojas-Valverde, D.; Gómez-Carmona, C.D.; Fortes, V.; Pino-Ortega, J. Worst case scenario match analysis and contextual variables in professional soccer players: A longitudinal study. Biol. Sport 2020, 37, 429–436. [Google Scholar] [CrossRef] [PubMed]
- Lago, C.; Casais, L.; Dominguez, E.; Sampaio, J. The effects of situational variables on distance covered at various speeds in elite soccer. Eur. J. Sport Sci. 2010, 10, 103–109. [Google Scholar] [CrossRef]
- Trewin, J.; Meylan, C.; Varley, M.C.; Cronin, J.; Ling, D. Effect of match factors on the running performance of elite female soccer players. J. Strength Cond. Res. 2018, 32, 2002–2009. [Google Scholar] [CrossRef] [PubMed]
- Johnston, R.J.; Watsford, M.L.; Kelly, S.J.; Pine, M.J.; Spurrs, R.W. The validity and reliability of 10 Hz and 15 Hz GPS units for assessing athlete movement demands. J. Strength Cond. Res. 2014, 28, 1649–1655. [Google Scholar] [CrossRef] [PubMed]
- Castellano, J.; Casamichana, D.; Calleja-González, J.; San Román, J.; Ostojic, S.M. Reliability and Accuracy of 10 Hz GPS Devices for Short-Distance Exercise. J. Sport Sci. Med. 2011, 10, 233–234. [Google Scholar]
- Scott, M.T.U.; Scott, T.J.; Kelly, V.G. The validity and reliability of global positioning systems in team sport. J. Strength Cond. Res. 2016, 30, 1470–1490. [Google Scholar] [CrossRef]
- Bredt, S.d.G.T.; Chagas, M.H.; Peixoto, G.H.; Menzel, H.J.; Pereira de Andrade, A.G. Understanding player load: Meanings and limitations. J. Hum. Kinet. 2020, 71, 5–9. [Google Scholar] [CrossRef] [Green Version]
- Casamichana, D.; Castellano, J.; Calleja-Gonzalez, J.; San Román, J.; Castagna, C. Relationship Between Indicators of Training Load in Soccer Players. J. Strength Cond. Res. 2013, 27, 369–374. [Google Scholar] [CrossRef] [PubMed]
- McCormack, W.P.; Hoffman, J.R.; Pruna, G.J.; Scanlon, T.C.; Bohner, J.D.; Townsend, J.R.; Jajtner, A.R.; Stout, J.R.; Fragala, M.S.; Fukuda, D.H. Reduced high-intensity-running rate in college women’s soccer when games are separated by 42 hours. Int. J. Sports Physiol. Perform. 2015, 10, 436–439. [Google Scholar] [CrossRef]
- Nevill, A.M.; Holder, R.L. Home advantage in sport: An overview of studies on the advantage of playing at home. Sports Med. 1999, 28, 221–236. [Google Scholar] [CrossRef] [PubMed]
- Benz, L.S.; Lopez, M.J. Estimating the change in soccer’s home advantage during the Covid-19 pandemic using bivariate Poisson regression. AStA Adv. Stat. Anal. 2021, 1–19. [Google Scholar] [CrossRef]
- Rampinini, E.; Impellizzeri, F.M.; Castagna, C.; Coutts, A.J.; Wisløff, U. Technical performance during soccer matches of the Italian Serie A league: Effect of fatigue and competitive level. J. Sci. Med. Sport 2009, 12, 227–233. [Google Scholar] [CrossRef]
- Barros, R.M.L.; Misuta, M.S.; Menezes, R.P.; Figueroa, P.J.; Moura, F.A.; Cunha, S.A.; Anido, R.; Leite, N.J. Analysis of the distances covered by first division brazilian soccer players obtained with an automatic tracking method. J. Sports Sci. Med. 2007, 6, 233–242. [Google Scholar]
- Dalen, T.; Jørgen, I.; Gertjan, E.; Havard, H.G.; Ulrik, W. Player load, acceleration, and deceleration during forty-five competitive matches of elite soccer. J. Strength Cond. Res. 2016, 30, 351–359. [Google Scholar] [CrossRef] [PubMed]
- Choice, E. A Retrospective Analysis of the Physical Demands of a Women’s NCAA Division II Soccer Season with Measures of External Load (GPS and Accelerometry) and Internal Load (Session Rating of Perceived Exertion); ProQuest; Concordia University: Chicago, IL, USA, 2021. [Google Scholar]
- Molinos Domene, A. Evaluation of movement and physiological demands of full-back and center-back soccer players using global positioning systems. J. Hum. Sport Exerc. 2013, 8, 1015–1028. [Google Scholar] [CrossRef] [Green Version]
- Cummins, C.; Orr, R.; O’Connor, H.; West, C. Global Positioning Systems (GPS) and microtechnology sensors in team sports: A systematic review. Sports Med. 2013, 43, 1025–1042. [Google Scholar] [CrossRef] [PubMed]
- Turner, A. The science and practice of periodization: A brief review. Strength Cond. J. 2011, 33, 34–46. [Google Scholar] [CrossRef] [Green Version]
- Chiu, L.Z.F.; Barnes, J.L. The Fitness-Fatigue Model Revisited: Implications for Planning Short- and Long-Term Training. Strength Cond. J. 2003, 25, 42–51. [Google Scholar] [CrossRef]
- DeWeese, B.H.; Hornsby, W.G.; Stone, M.; Stone, M.H. The training process: Planning for strength–power training in track and field. Part 1: Theoretical aspects. J. Sport Health Sci. 2015, 4, 308–317. [Google Scholar] [CrossRef] [Green Version]
- Fry, A.C.; Kraemer, W.J.; van Borselen, F.; Lynch, J.M.; Marsit, J.L.; Roy, E.P.; Triplett, N.T.; Knuttgen, H.G. Performance decrements with high-intensity resistance exercise overtraining. Med. Sci. Sports Exerc. 1994, 26, 1165–1173. [Google Scholar] [CrossRef]
- Cunanan, A.J.; DeWeese, B.H.; Wagle, J.P.; Carroll, K.M.; Sausaman, R.; Hornsby, W.G.; Haff, G.G.; Triplett, N.T.; Pierce, K.C.; Stone, M.H. The general adaptation syndrome: A foundation for the concept of periodization. Sports Med. 2018, 48, 787–797. [Google Scholar] [CrossRef]
- McCarrick, D.; Bilalic, M.; Neave, N.; Wolfson, S. Home advantage during the COVID-19 pandemic: Analyses of European football leagues. Psychol. Sport Exerc. 2021, 56, 102013. [Google Scholar] [CrossRef]
- Correia-Oliveira, C.R.; Andrade-Souza, V.A. Home advantage in soccer after the break due to COVID-19 pandemic: Does crowd support matter? Int. J. Sport Exerc. Psychol. 2021, 1–12. [Google Scholar] [CrossRef]
- Mohr, M.; Nassis, G.P.; Brito, J.; Randers, M.B.; Castagna, C.; Parnell, D.; Krustrup, P. Return to elite football after the COVID-19 lockdown. Manag. Sport Leis. 2020, 1–9. [Google Scholar] [CrossRef]
- Alexander, R.P. Physical and Technical Demands of Women’s Collegiate Soccer. Ph.D. Thesis, East Tennessee State University, Johnson City, TN, USA, 2014. [Google Scholar]


| Schedule | Opponent Rank | Game Location | Final | Result | Point Spread | Players in 1st Half | Players in 2nd Half | Players Total |
|---|---|---|---|---|---|---|---|---|
| Game 1 | NR | Away | Reg | Win | 2 | 16 | 15 | 17 |
| Game 2 | NR | Home | Reg | Win | 3 | 14 | 15 | 15 |
| Game 3 | 6 | Away | 2OT | Loss | −1 | 13 | 13 | 13 |
| Game 4 | NR | Home | Reg | Win | 1 | 14 | 14 | 14 |
| Game 5 | NR | Away | Reg | Win | 1 | 14 | 13 | 14 |
| Game 6 | NR | Home | Reg | Win | 1 | 14 | 14 | 15 |
| Game 7 | NR | Away | Reg | Win | 1 | 14 | 13 | 14 |
| Game 8 | 11 | Home | Reg | Win | 1 | 15 | 12 | 15 |
| Game 9 | 3 | Away | Reg | Loss | −1 | 12 | 13 | 13 |
| Context | Distance | Player Load | |||
|---|---|---|---|---|---|
| Fixed Effect | Average | Summated | Average | Summated | |
| Home vs. Away | ME of Game Location | F(1,117.8) = 0.01, p = 0.9273 | F(1,14) = 0.57, p = 0.4622 | F(1,121.7) = 0.11, p = 0.7452 | F(1,14) = 0.04, p = 0.8517 |
| ME of Half | F(1,111.5) = 2.19, p = 0.1421 | F(1,14) = 4.93, p = 0.0434 | F(1,114.2) = 2.54, p = 0.1135 | F(1,14) = 2.41, p = 0.1431 | |
| Game Location*Half | F(1,111.5) = 0.02, p = 0.8857 | F(1,14) = 0.34, p = 0.5674 | F(1,114.2) = 0.02, p = 0.8957 | F(1,14) = 0.18, p = 0.6765 | |
| Ranked vs. Unranked Opponents | ME of Opponent Rank | F(1,117.7) = 3.54, p = 0.0622 | F(1,14) = 0.49, p = 0.4978 | F(1,121.8) = 1.98, p = 0.1616 | F(1,14) = 0.01, p = 0.9199 |
| ME of Half | F(1,111.4) = 0.72, p = 0.3980 | F(1,14) = 3.00, p = 0.1053 | F(1,114.2) = 0.82, p = 0.3660 | F(1,14) = 1.31, p = 0.2721 | |
| Opponent Rank*Half | F(1,111.4) = 1.91, p = 0.1696 | F(1,14) = 1.20, p = 0.2921 | F(1,114.2) = 2.41, p = 0.1232 | F(1,14) = 0.92, p = 0.3551 | |
| Wins vs. Losses | ME of Game Result | F(1,116) = 4.75, p = 0.0313 | F(1,14) = 1.12, p = 0.3082 | F(1,120.3) = 4.68, p = 0.0326 | F(1,14) = 1.15, p = 0.3009 |
| ME of Half | F(1,109.7) = 0.63, p = 0.4279 | F(1,14) = 0.83, p = 0.3773 | F(1,112.8) = 0.58, p = 0.4466 | F(1,14) = 0.27, p = 0.6124 | |
| Game Result*Half | F(1,109.7) = 0.54, p = 0.4638 | F(1,14) = 4.22, p = 0.0590 | F(1,112.8) = 0.93, p = 0.3374 | F(1,14) = 2.54, p = 0.1331 | |
| Score Differential | ME of Score Differential | F(1,118.8) = 1.13, p = 0.2893 | F(1,14) = 1.81, p = 0.2002 | F(1,122.5) = 0.15, p = 0.6952 | F(1,14) = 4.69, p = 0.0481 |
| ME of Half | F(1,112.5) = 3.52, p = 0.0632 | F(1,14) = 4.98, p = 0.0424 | F(1,115.1) = 4.10, p = 0.0452 | F(1,14) = 3.06, p = 0.1022 | |
| Score Differential*Half | F(1,112.5) = 1.40, p = 0.2401 | F(1,14) = 0.40, p = 0.5360 | F(1,115.1) = 1.57, p = 0.2122 | F(1,14) = 0.28, p = 0.5036 | |
| Context | Condition | Player Load per Minute | Player Load per Meter | Meterage per Minute |
|---|---|---|---|---|
| All Games | 12.447 ± 2.38 | 0.1096 ± 0.012 | 113.15 ± 15.85 | |
| Game Location | Home | 12.497 ± 2.51 | 0.1088 ± 0.012 | 114.43 ± 17.11 |
| Away | 12.406 ± 2.28 | 0.1103 ± 0.011 | 112.10 ± 14.72 | |
| Opponent Rank | Ranked | 12.106 ± 2.32 | 0.1088 ± 0.012 | 110.83 ± 14.61 |
| Unranked | 12.603 ± 2.40 | 0.1100 ± 0.011 | 114.21 ± 16.33 | |
| Result | Wins | 12.489 ± 2.44 | 0.1093 ± 0.011 | 113.83 ± 16.56 |
| Losses | 12.285 ± 2.17 | 0.1109 ± 0.013 | 110.50 ± 12.54 | |
| Score Differential | Within 1 | 12.117 ± 2.35 | 0.1086 ± 0.012 | 111.24 ± 16.07 |
| Greater than 1 | 13.480 ± 2.22 | 0.1129 ± 0.011 | 119.11 ± 13.63 |
| Context | Fixed Effect | Player Load per Minute | Player Load per Meter | Meterage per Minute |
|---|---|---|---|---|
| Home vs. Away | ME of Game Location | F(1,127.4) = 0.00, p = 0.9931 | F(1,128.3) = 0.73, p = 0.3950 | F(1,126.2) = 0.42, p = 0.5169 |
| ME of Half | F(1,116.8) = 52.92, p < 0.0001 | F(1,116.9) = 0.69, p = 0.4090 | F(1,116.3) = 66.67, p < 0.0001 | |
| Game Location*Half | F(1,116.8) = 2.07, p = 0.1530 | F(1,116.9) = 0.29, p = 0.5920 | F(1,116.3) = 2.40, p = 0.1244 | |
| Ranked vs. Unranked Opponents | ME of Opponent Rank | F(1,127.4) = 1.02, p = 0.3147 | F(1,128.3) = 0.26, p = 0.6105 | F(1,126.2) = 1.08, p = 0.3004 |
| ME of Half | F(1,116.8) = 41.33, p < 0.0001 | F(1,116.9) = 0.25, p = 0.6153 | F(1,116.3) = 53.68, p < 0.0001 | |
| Opponent Rank*Half | F(1,116.8) = 0.19, p = 0.6661 | F(1,116.9) = 0.35, p = 0.5580 | F(1,116.3) = 0.02, p = 0.8760 | |
| Wins vs. Losses | ME of Game Result | F(1,126.9) = 0.07, p = 0.7872 | F(1,128) = 0.60, p = 0.4404 | F(1,125.7) = 0.87, p = 0.3528 |
| ME of Half | F(1,116.2) = 16.53, p < 0.0001 | F(1,116.6) = 0.02, p = 0.8810 | F(1,115.5) = 22.47, p < 0.0001 | |
| Game Result*Half | F(1,116.2) = 12.32, p = 0.0006 | F(1,116.6) = 1.90, p = 0.1713 | F(1,115.5) = 13.22, p = 0.0004 | |
| Score Differential | ME of Score Differential | F(1,127.6) = 8.67, p = 0.0038 | F(1,128.4) = 3.14, p = 0.0786 | F(1,126.7) = 7.13, p = 0.0086 |
| ME of Half | F(1,117.2) = 32.59, p < 0.0001 | F(1,117) = 0.02, p = 0.8805 | F(1,117) = 42.69, p < 0.0001 | |
| Score Differential*Half | F(1,117.2) = 0.44, p = 0.5094 | F(1,117) = 0.97, p = 0.3272 | F(1,117) = 0.24, p = 0.6227 |
| Context | Fixed Effect | Average Heart Rate |
|---|---|---|
| Home vs. Away | ME of Game Location | F(1,126) = 0.07, p = 0.7855 |
| ME of Half | F(1,116.1) = 20.13, p < 0.0001 | |
| Game Location*Half | F(1,116.1) = 0.85, p = 0.3580 | |
| Ranked vs. Unranked Opponents | ME of Opponent Rank | F(1,125.9) = 0.36, p = 0.5521 |
| ME of Half | F(1,116.1) = 15.10, p = 0.0002 | |
| Opponent Rank*Half | F(1,116.1) = 0.37, p = 0.5443 | |
| Wins vs. Losses | ME of Game Result | F(1,124.6) = 1.81, p = 0.1808 |
| ME of Half | F(1,114.7) = 7.58, p = 0.0069 | |
| Game Result*Half | F(1,114.7) = 2.50, p = 0.1167 | |
| Score Differential | ME of Score Differential | F(1,126.4) = 0.03, p = 0.8664 |
| ME of Half | F(1,116.6) = 17.38, p < 0.0001 | |
| Score Differential*Half | F(1,116.6) = 0.57, p = 0.4502 |
| Workload | Game Half | Defenders | Midfielders | Forwards |
|---|---|---|---|---|
| Total Distance (m) | First | 18,967 ± 1121 | 17,537 ± 1234 | 15,935 ± 1643 |
| Second | 16,339 ± 2695 | 18,837 ± 1892 | 14,141 ± 2193 | |
| Total Player Load (au) | First | 2148 ± 168 | 1942 ± 123 | 1663 ± 180 |
| Second | 1846 ± 357 | 2101 ± 236 | 1480 ± 209 |
| Position | Player Load/Minute | Player Load/Meter | Meters/Minute |
|---|---|---|---|
| Defenders | 10.95 ± 2.6 b | 0.112 ± 0.016 c | 97.25 ± 11.4 b,c |
| Midfielders | 14.06 ± 1.4 a,c | 0.111 ± 0.009 c | 126.42 ± 7.1 a,c |
| Forwards | 11.45 ± 1.4 b | 0.105 ± 0.008 a,b | 108.60 ± 8.6 a,b |
| Context | Fixed Effect | Player Load/Minute | Player Load/Meter | Meters/Minute |
|---|---|---|---|---|
| Home vs. Away | ME of Game Location | F(1,124) = 0.00, p = 0.9557 | F(1,124) = 0.66, p = 0.4170 | F(1,124) = 0.78, p = 0.3804 |
| ME of Position | F(2,124) = 37.94, p < 0.0001 | F(2,124) = 3.81, p = 0.0248 | F(2,124) = 124.11, p < 0.0001 | |
| Game Location*Position | F(2,124) = 0.07, p = 0.9372 | F(2,124) = 0.03, p = 0.9725 | F(2,124) = 0.54, p = 0.5859 | |
| Ranked vs. Unranked Opponents | ME of Opponent Rank | F(1,124) = 1.95, p = 0.1653 | F(1,124) = 0.42, p = 0.5208 | F(1,124) = 3.60, p = 0.0602 |
| ME of Position | F(2,124) = 33.92, p < 0.0001 | F(2,124) = 3.49, p = 0.0335 | F(2,124) = 107.65, p < 0.0001 | |
| Opponent Rank*Position | F(2,124) = 0.17, p = 0.8481 | F(2,124) = 0.16, p = 0.8563 | F(2,124) = 0.62, p = 0.5403 | |
| Wins vs. Losses | ME of Game Result | F(1,124) = 0.06, p = 0.8117 | F(1,124) = 0.68, p = 0.4125 | F(1,124) = 2.21, p = 0.1394 |
| ME of Position | F(2,124) = 21.94, p < 0.0001 | F(2,124) = 2.55, p = 0.0824 | F(2,124) = 73.07, p < 0.0001 | |
| Game Result*Position | F(2,124) = 0.10, p = 0.9013 | F(2,124) = 0.01, p = 0.9941 | F(2,124) = 0.27, p = 0.7669 | |
| Score Differential | ME of Score Differential | F(1,124) = 16.65, p < 0.0001 | F(1,124) = 4.06, p = 0.0461 | F(1,124) = 27.87, p < 0.0001 |
| ME of Position | F(2,124) = 28.44, p < 0.0001 | F(2,124) = 4.38, p = 0.0145 | F(2,124) = 96.19, p < 0.0001 | |
| Score Differential*Position | F(2,124) = 0.35, p = 0.7041 | F(2,124) = 0.29, p = 0.7473 | F(2,124) = 3.27, p = 0.0414 |
Publisher’s Note: MDPI stays neutral with regard to jurisdictional claims in published maps and institutional affiliations. |
© 2021 by the authors. Licensee MDPI, Basel, Switzerland. This article is an open access article distributed under the terms and conditions of the Creative Commons Attribution (CC BY) license (https://creativecommons.org/licenses/by/4.0/).
Share and Cite
Rentz, L.E.; Hornsby, W.G.; Gawel, W.J.; Rawls, B.G.; Ramadan, J.; Galster, S.M. Contextual Variation in External and Internal Workloads across the Competitive Season of a Collegiate Women’s Soccer Team. Sports 2021, 9, 165. https://doi.org/10.3390/sports9120165
Rentz LE, Hornsby WG, Gawel WJ, Rawls BG, Ramadan J, Galster SM. Contextual Variation in External and Internal Workloads across the Competitive Season of a Collegiate Women’s Soccer Team. Sports. 2021; 9(12):165. https://doi.org/10.3390/sports9120165
Chicago/Turabian StyleRentz, Lauren E., William Guy Hornsby, Wesley J. Gawel, Bobby G. Rawls, Jad Ramadan, and Scott M. Galster. 2021. "Contextual Variation in External and Internal Workloads across the Competitive Season of a Collegiate Women’s Soccer Team" Sports 9, no. 12: 165. https://doi.org/10.3390/sports9120165